faunal responses to oxygen gradients on the pakistan margin a
TRANSCRIPT

ARTICLE IN PRESS
Deep-Sea Research II 56 (2009) 488–502
Contents lists available at ScienceDirect
Deep-Sea Research II
0967-06
doi:10.1
� Corr
E-m1 D2 Cu
1250 Be
journal homepage: www.elsevier.com/locate/dsr2
Faunal responses to oxygen gradients on the Pakistan margin:A comparison of foraminiferans, macrofauna and megafauna
A.J. Gooday a,�, L.A. Levin b, A. Aranda da Silva a, B.J. Bett a, G.L. Cowie c, D. Dissard f,g,J.D. Gage d,1, D.J. Hughes d, R. Jeffreys e, P.A. Lamont d, K.E. Larkin a, S.J. Murty a, S. Schumacher f,g,C. Whitcraft b,2, C. Woulds c
a National Oceanography Centre, Southampton, Waterfront Campus, European Way, Southampton SO14 3ZH, UKb Integrative Oceanography Division, Scripps Institution of Oceanography, La Jolla, CA 92093-0218, USAc School of GeoSciences, The University of Edinburgh, Edinburgh EH9 3JW, Scotland, UKd The Scottish Association for Marine Science, Dunstaffnage Marine Laboratory, Oban PA37 1QA, Scotland, UKe Department of Earth and Ocean Sciences, University of Liverpool, Liverpool L69 3GP, UKf Alfred Wegener Institute, Am Handelshafen 12, D-27570 Bremerhaven, Germanyg Laboratory of Recent and Fossil Bio-Indicators, Angers University, 49045 Angers Cedex 01, France
a r t i c l e i n f o
Article history:
Accepted 28 May 2008The Pakistan Margin is characterised by a strong mid-water oxygen minimum zone (OMZ) that
intercepts the seabed at bathyal depths (150–1300 m). We investigated whether faunal abundance and
Available online 5 November 2008Keywords:
Hypoxia
Oxygen minimum zone
Benthos
Arabian Sea
Biodiversity
Deep sea
45/$ - see front matter & 2008 Published by
016/j.dsr2.2008.10.003
esponding author. Tel.: +44 23 8059 6353; fax
ail address: [email protected] (A.J. Gooday
eceased.
rrent address: California State University Lon
llflower Blvd., Long Beach, CA 90840-3702, U
a b s t r a c t
diversity trends were similar among protists (foraminiferans and gromiids), metazoan macrofauna and
megafauna along a transect (140–1850 m water depth) across the OMZ during the 2003 intermonsoon
(March–May) and late/post-monsoon (August–October) seasons. All groups exhibited some drop in
abundance in the OMZ core (250–500 m water depth; O2: 0.10–0.13 mL L�1¼ 4.46–5.80mM) but to
differing degrees. Densities of foraminiferans 463mm were slightly depressed at 300 m, peaked at
738 m, and were much lower at deeper stations. Foraminiferans 4300mm were the overwhelmingly
dominant macrofaunal organisms in the OMZ core. Macrofaunal metazoans reached maximum
densities at 140 m depth, with additional peaks at 850, 940 and 1850 m where foraminiferans were less
abundant. The polychaete Linopherus sp. was responsible for a macrofaunal biomass peak at 950 m.
Apart from large swimming animals (fish and natant decapods), metazoan megafauna were absent
between 300 and 900 m (O2 o0.14–0.15 mL L�1¼ 6.25–6.69mM) but were represented by a huge,
ophiuroid-dominated abundance peak at 1000 m (O2 �0.15–0.18 mL L�1¼ 6.69–8.03mM). Gromiid
protists were confined largely to depths below 1150 m (O2 40.2 mL L�1¼ 8.92mM). The progressively
deeper abundance peaks for foraminiferans (463mm), Linopherus sp. and ophiuroids probably
represent lower OMZ boundary edge effects and suggest a link between body size and tolerance of
hypoxia. Macro- and megafaunal organisms collected between 800 and 1100 m were dominated by a
succession of different taxa, indicating that the lower part of the OMZ is also a region of rapid faunal
change. Species diversity was depressed in all groups in the OMZ core, but this was much more
pronounced for macrofauna and megafauna than for foraminiferans. Oxygen levels strongly influenced
the taxonomic composition of all faunal groups. Calcareous foraminiferans dominated the seasonally
and permanently hypoxic sites (136–300 m); agglutinated foraminiferans were relatively more
abundant at deeper stations where oxygen concentrations were 40.13 mL L�1( ¼ 5.80mM). Polychaetes
were the main macrofaunal taxon within the OMZ; calcareous macrofauna and megafauna (molluscs
and echinoderms) were rare or absent where oxygen levels were lowest. The rarity of larger animals
between 300 and 700 m on the Pakistan Margin, compared with the abundant macrofauna in the OMZ
core off Oman, is the most notable contrast between the two sides of the Arabian Sea. This difference
probably reflects the slightly higher oxygen levels and better food quality on the western side.
& 2008 Published by Elsevier Ltd.
Elsevier Ltd.
: +44 23 8059 6247.
).
g Beach, Biological Sciences,
SA.
1. Introduction
The structure and composition of marine benthic communitiesare influenced by many environmental factors, includingtemperature, salinity, bottom flow and sediment properties.

ARTICLE IN PRESS
Table 1Approximate positions for the main study sites on the Pakistan Margin.
Site (m) Lat. (%oN) Long. (
%oE)
140 23116.700 66142.600
300 23112.500 66134.000
940 22155.000 66136.500
1200 23100.000 66124.400
1850 22152.400 661000 .00
Fig. 1. Location of the main study sites on the Pakistan Margin.
A.J. Gooday et al. / Deep-Sea Research II 56 (2009) 488–502 489
The amount of available oxygen and the supply of food to theseafloor are particularly important in the deep sea where otherparameters are usually relatively stable (Rowe, 1983; Gage andTyler, 1991; Levin and Gage, 1998). In deeper water, oxygenminimum zones (OMZs) influence a greater area of seafloor thanany other kind of oxygen-deficient environment. These persistent,mid-water features create strong bottom-water oxygen gradientswhere they impinge on the seafloor along the western rim of thePacific Ocean, in the SE Atlantic, and in the Arabian Sea and Bay ofBengal (Helly and Levin, 2004). Several recent investigations havedescribed changes in the structure and composition of benthicfaunas across OMZs (reviewed by Levin, 2003). Two earlier OMZstudies, on a seamount in the eastern Pacific Ocean (Levin et al.,1991a,b) and on the Peru Margin (Levin et al., 2002), comparedpatterns among faunal groups. They found that abundances ofsmaller organisms (bacteria, metazoan and protozoan meiofauna)were relatively unaffected by very low-oxygen concentrations, butthat the abundances of larger taxa (macrofauna and megafauna)were depressed. In all groups, distinct changes in taxonomiccomposition were associated with the OMZ.
In the present paper, we compare trends between differentfaunal groups across the OMZ on the Pakistan Margin of theArabian Sea based on two pairs of cruises, one during theintermonsoon period (March–May) and the other during the late-to post-monsoon period (August–October) of 2003. These fourcruises formed the centrepiece of a project funded by the UKNational Environment Research Council, entitled ‘Benthic pro-cesses in the Arabian Sea: mechanistic relationships betweenbenthos, sediment biogeochemistry and organic matter cycling’.Other papers in this volume and elsewhere provide detailedinformation on particular faunal size classes and taxa, includingforaminiferans (Larkin and Gooday, 2009), large gromiid protists(Aranda da Silva and Gooday, 2009), macrofauna (Hughes et al.,2009; Levin et al., 2009) and megafauna (Murty et al., 2009),across the Pakistan Margin. Here, we address the followingquestions about patterns in relation to gradients in depth andbottom-water oxygen concentrations in this part of the ArabianSea. (1) Do metazoans and protists exhibit the same patterns inabundance across the OMZ? (2) Do all groups exhibit the samepatterns in diversity? (3) Do calcified and non-calcified taxaexhibit similar patterns? (4) Are OMZ edge effects evident in anygroups? (5) Is the turnover rate of species with depth similar ordifferent among taxa? We also ask whether faunal trends andcomposition are similar or different between the Pakistan andOman margins of the Arabian Sea and between the Arabian Seaand OMZs in other regions of the world. Our emphasis on protists(foraminiferans and gromiids) reflects the considerable body ofdata acquired during the Pakistan Margin cruises on theseorganisms, which are often ignored in studies of deep-sea benthicbiology.
2. Study area
The study was conducted in an area centred on 231 000N, 661,250E, just to the NW of the Indus Canyon, during two pairs of back-to-back cruises aboard the R.R.S. Charles Darwin. The first pair,CD145 and 146 (Bett, 2003a; Cowie, 2003a), coincided with theintermonsoon period (March–May 2003) and the second pair,CD150 and 151 (Bett, 2003b; Cowie, 2003b), with the end of thesummer (SW) monsoon (August–October 2003; late/post-mon-soon). Most of the work was concentrated at five main sites,located at approximately 140, 300, 950, 1200, 1850 m waterdepths, forming a transect across the OMZ (Table 1; Fig. 1).Additional sites were sampled at a variety of depths between
these main stations, and particularly across the lower boundary ofthe OMZ (Levin et al., 2009).
Environmental data for the main stations and some additionalsites during different seasons are summarised in Table 2. At 140-mdepth, the bottom-water oxygen values changed dramaticallybetween the two sampling periods, from fully oxic during theintermonsoon to severely dysoxic during the late/post-monsoonseason. This change reflected an upward shift in the upperboundary of the OMZ from �180 to �80 m over a period of about5 months (Bett, 2003b; Brand and Griffiths, 2009), presumablydriven by monsoonal winds. Based on the depth and the 2003oxygen profiles, we recognise the following components of thePakistan Margin OMZ in 2003:
(1)
Seasonally hypoxic zone, 130–250 m; O2 at 140 m ¼ 0.11(intermonsoon), 2.05 mL L�1 (late/post-monsoon). Intervalwithin which oxygen concentrations fluctuate in response toupward and downward shifts in the upper OMZ boundary. Thelower limit is defined by the appearance of laminatedsediments. Whether this seasonal fluctuation occurs everyyear is unknown.(2)
OMZ core, 250–750 m; O2 ¼ 0.10–0.12 mL L�1 (intermonsoon),0.12–0.14 mL L�1 (late/post-monsoon). Interval where oxygenconcentrations are lowest. Characterised by uninterruptedsediment laminations and the absence of obvious burrows.For convenience, we refer to the ‘upper’ (250–500 m) and‘lower’ parts (500–750 m) of the OMZ core, but this division isarbitrary and not based on any biological or biogeochemicalcriteria.(3)
Lower OMZ transition zone, 750–1000 m; O2 ¼ 0.12–0.15 mLL�1 (intermonsoon), 0.13–0.17 mL L�1 (late/post-monsoon).Interval spanning the progressive change from laminated tofully bioturbated sediments. Characterised by rapid faunalchanges with depth.
ARTICLE IN PRESS
Table 2Environmental data (mean values) for Pakistan Margin sites.
Parameter 140 140 300 300 700 850 940 940 1000 1000 1100 1200 1200 1850 1850
Inter L/P Inter L/P L/P L/P Inter L/P Inter L/P L/P Inter L/P Inter L/P
T (1C)a 22.5 18.2 15.5 14.8 11.2 10.1 9.0 9.3 ND ND 8.0 7.2 7.3 3.5 3.7
Salinityb 36.4 36.0 36.0 35.8 ND ND 35.5 35.4 ND ND ND 35.2 35.4 34.8 34.8
O2 (mL L�1)c 2.05 0.11 0.10 0.11 0.13 0.14 0.13 0.15 0.15 0.17 0.23 0.33 0.32 1.78 1.65
O2 (mM)c 91.47 4.91 4.46 4.91 5.80 6.25 5.80 6.69 6.69 7.59 10.26 14.73 14.28 79.43 73.63
Depth of O2 penetration (mm)b 3.0 ND �0 �0 ND ND 44.0 44.0 ND ND ND 45 2.5 16 12
% Corg (0–2 cm)d,e 1.46 1.43 2.36 2.56 2.64 3.14 3.53 3.60 2.69 3.14 3.14 3.42 4.12 1.12 1.00
% TN (0–2 cm)e 0.183 0.181 0.268 0.328 0.31 0.36 0.42 0.44 0.33 0.38 0.39 0.42 0.50 0.16 0.16
C/N (0–2 cm)e 9.15 8.94 9.97 11.78 9.36 9.38 9.70 9.70 9.45 9.53 9.38 9.63 9.70 8.44 7.65
OM quality (DI)f ND �0.99 ND �0.40 ND ND ND 0.48 ND ND ND �0.49 ND ND �1.17
Sulphate reduction (mM m�2 d�1)g 0.23 0.23 0.04 ND ND �0 ND ND ND �0 0.03 ND ND ND ND
Denitrification (nitrate flux mmol m�2 d�1)h 0.54–1.56 1.56 0.60 2.71 ND ND ND ND ND ND ND ND 0.10 1.89 �0.23i
Total pigments mg (g dry sediment)a 7.7 6.2 29.0 40.4 ND ND 35.5 28.1 ND ND ND 8.9 31.1 0.80 1.20
Phaeopigment/chlorophyll aa 8.0 7.0 33.0 48.8 37.4 43.2 26.5 29.3 ND ND 9.9 8.6 30.4 0.81 1.47
Macrofaunal biomass (g(wet) m�2)j 6.79 4.26 v. low v. low ND ND 66.5 25.0 ND ND ND 0.36 5.27 9.28 1.57
Sediment properties:k
% Clay 34.28 35.75 ND ND 34.88 ND ND ND 35.61 35.81
% Silt 65.6 64.25 ND ND 65.11 ND ND ND 64.39 64.39
% Sand 0.06 0.00 ND ND 0.01 ND ND ND 0.00 0.01
% CaCO3e 20.5 21.5 14.1 ND ND 20.7 20.4 ND ND ND 22.6 25 21.2 23.2
Data for some additional sites are given by Levin et al. (2009). ND ¼ no data.a Woulds et al. (2007), Woulds and Cowie (2009).b Breuer et al. (2009).c Levin et al. (2009) and CTD records.d Levin et al. (2009).e Cowie and Levin (2009).f Vandewiele pers commun. (in Woulds and Cowie, 2009).g Law et al. (2009).h Schwartz et al. (2009).i This negative nitrate flux (indicating no denitrification) is contradicted by N2 production suggesting that denitrification is occurring (Schwartz et al., 2009).j Hughes et al. (2009).k G. Law (pers. commun.).
A.J. Gooday et al. / Deep-Sea Research II 56 (2009) 488–502490
(4)
Lower OMZ boundary, 1000–1300 m. The lowest part of theOMZ characterised by fully bioturbated and oxidised sedi-ments and extending to the depth at which oxygen levelsreach 0.5 mL L�1.A notable feature of the Pakistan Margin OMZ is virtual absenceof sulphate reduction (Law et al., 2009).
3. Materials and methods
3.1. Sampling and analysis methods
3.1.1. Foraminiferans and macrofauna
Foraminiferans were sampled using a Barnett-type multicorer(Barnett et al., 1984) equipped with core tubes of 57 mm internaldiameter (25.5 cm2 cross-sectional area) and a megacorer fittedwith tubes of 96 mm diameter (72.4 cm2 surface area). At the140 and 300 m sites (Table 1), four replicate megacores from eachseason (cruises CD 146 and 151) were processed as follows (Larkinand Gooday, 2009). The upper 1 cm was sliced into two layers,each 0.5 cm thick, below which the core was cut into 1-cm-thicklayers to a depth of 5 cm. These sediment slices were fixed in 10%formalin buffered with borax. Single unreplicated multicores fromthe main sites and some additional sites, collected during theintermonsoon season (CD 145, 146), were processed and fixed inthe same way for a micropalaeontological study of benthicforaminiferans (Schumacher et al., 2007).
In the laboratory, fixed sediment slices from the four replicatefaunal megacores were washed through a 300-mm screen andstained overnight on the sieve in rose Bengal (Larkin and Gooday,2009). All stained benthic foraminiferans, both hard- and soft-shelled, were sorted in water in order to study seasonal changes in
larger foraminiferans (4300mm). The micropalaeontologicalsamples were treated as follows (Schumacher et al., 2007). Eachsediment slice was wet sieved over 63, 150 and 300-mm screensand the residues stained for 1 week in ethanol with Rose Bengal.The residues were then washed again, and stained hard-shelledforaminiferans picked in water from three size fractions (63–150,150–300 and 4300mm), down to 10 cm depth.
Additional megacore sediments were sorted unstained andunfixed on the ship to obtain foraminiferans for biochemical andisotopic studies. They were sieved on a 300-mm screen, theresidues placed in a Petrie dish on ice and foraminiferans andmetazoans picked as soon as possible after collection. Thesesamples provided semi-quantitative information on larger for-aminiferans.
Macrofauna were sampled at the main sites (140, 300, 940,1200 and 1850 m water depths) during all cruises using amegacorer (see above, Hughes et al., 2009). Additional sites acrossthe lower transition zone were sampled in the same way duringcruises CD 146 and 151 (Levin et al., 2009). At least one core perdeployment was sliced into the following layers: 0–0.5, 0.5–1.0,1–2, 2–3, 3–5, 5–10 and 10–20 cm. Other cores were cut into twolayers, 0–10 and 10–20 cm. Each slice was kept in 10% bufferedformalin for 2–3 days before being washed through a 300-mmscreen using filtered seawater. The sieved residues were stored in10% formalin and then sorted in the laboratory under a dissectingmicroscope. All taxa were identified to the lowest taxonomic levelpossible.
Foraminiferal biomass was calculated using the linear regres-sion formulae developed by Altenbach (1985) and later used byKurbjeweit et al. (2000) to estimate biomass in deep ArabianSea foraminiferans. Since test size was not measured directly, butestimated from sieve sizes used to retain the foraminiferans, theresulting biomass values must be regarded as very approximate.
ARTICLE IN PRESS
A.J. Gooday et al. / Deep-Sea Research II 56 (2009) 488–502 491
Wet weight biomass of macrofaunal specimens was measured ona Sartorius top-pan electronic balance after careful blotting onabsorbent paper to remove surface liquid (Hughes et al., 2009).
3.1.2. Megafauna
Megafauna, defined as large animals visible in bottom photo-graphs or caught in trawl samples, included the benthopelagicmegafauna (swimming animals, mainly fish and decapods) andthe invertebrate megabenthos (large benthic animals) (Murtyet al., 2009). Large polychaetes and protists (foraminiferans andgromiids) were excluded from the invertebrate megabenthossensu strictu. Megafauna were collected using an Agassiz trawlwith a frame 3 m wide and 0.5 m high and a cod-end mesh size of500mm. Animals and gromiids were sorted on board ship intomain taxonomic groups and preserved in 10% buffered formalin.
Seabed photographic surveys were conducted during the latemonsoon season (CD 150) using a wide-angle seabed photographysystem (WASP) (Murty et al., 2009). This consisted of a tubularsteel frame, 3 m in length, on which was mounted a downward-facing camera, continuous video camera, two video lamps, a flashunit and altimeter, operated via an acoustic telemetry system.WASP was towed at �0.5 knots and kept between 2 and 4 m fromthe seabed by reference to the altimeter. Photographs and videowere only recorded within a preset range of 1–10 m from theseabed. WASP was deployed for either 30 or 60 min, and stillphotographs were recorded every 10 s on 35-mm Kodak Vision250D colour negative film. The photographs were viewed on a CarlZeiss Jena DLZ Dokumator film reader and the type and numberof visible megafaunal organisms recorded in all photographssuitable for analysis. Organisms were identified to the lowestpossible taxonomic level by comparison with specimens collectedby the Agassiz trawl. The area of the sea floor visible in eachphotograph was calculated from the angle of the camera withrespect to the seabed and its altitude above the seabed. Totalnumbers were standardised to a surface area of 1 ha.
3.1.3. Metazoan meiofauna
Metazoan meiofauna were not analysed systematically. DuringCD151, Ludox floatation followed by centrifugation was used toconcentrate meiofaunal organisms at the 300-m site, but theresidue yielded remarkably few individuals, almost all of themnematodes. Nematodes and occasional ostracods of macrofaunalsize were recorded in the 4300-mm fractions of core samplesfrom the 140 and 300-m sites (Larkin and Gooday, 2009).
3.1.4. Environmental parameters
We include a selection of the physical and biochemicalparameters measured during the Pakistan Margin project(Table 2). Bottom-water oxygen concentrations were taken fromCTD profiles obtained during CD145 and CD150 (Bett, 2003a, b;Levin et al., 2009). Detailed information about other methods canbe found in the papers cited in footnotes to Table 2.
3.1.5. Diversity
We used a small set of diversity measures that are in commonuse in either the marine biological literature or the foraminiferalliterature.
E(S100) ¼ expected number of species in a rarefied sample of100 individuals (Hurlbert, 1971).H0 ¼ Shannon–Wiener diversity index (loge) (Shannon andWeaver, 1963).a ¼ Fisher alpha index (Fisher et al., 1943).R1D ¼ rank 1 dominance (% abundance of the top-rankedspecies).
4. Results
This section synthesises the results of a number of studies,either published in the present volume or elsewhere, combinedwith unpublished data on foraminiferans and on trawl samples.All faunal groups were analysed at the five main sites (140, 300,940, 1200 and 1850 m), but data for some taxa were also obtainedfrom additional stations located at or around 133, 250, 274, 300,400, 512, 600, 700, 738, 850, 900, 1000 and 1100 m water depth.
4.1. General trends among main faunal groups
4.1.1. Abundance
The main faunal groups exhibited different patterns ofabundance in relation to the OMZ (Fig. 2). Foraminiferans werepresent across the entire transect. The density of smaller(463mm) hard-shelled species in unreplicated multicores peaked(1020 indiv.10 cm�2) at 738 m in the lower transition zone, wassomewhat depressed (257–371 indiv.10 cm�2) at 150–512 m inthe OMZ core, higher at 136 and 598 m (485 and 428 indiv.10cm�2), with lowest values (43–200 indiv.10 cm�2) below 800 mdepth (Schumacher et al., 2007). Larger foraminiferans(4300mm), including soft-shelled species, were the dominantmacrofaunal organisms at 140 m and particularly at 300 m whereoxygen values were lowest and metazoan macrofauna rare (Larkinand Gooday, 2009). Their abundances in replicate megacorersamples increased during the post-monsoonal season. Gromiidswere confined to regions below the lower transition zone (Goodayand Bowser, 2005; Aranda da Silva and Gooday, 2009). They firstappeared in megacores at 1000 m and were common in trawlsamples from 1174 to 1177 and 1620 to 1852 m (Fig. 3).
Considering only the five main sites, mean metazoan macro-faunal densities in the intermonsoon and post-monsoon periodswere highest at 140 m (respectively, 15,909 and 10,945 indiv. m�2),followed by 940 m (5218 and 3691 indiv. m�2) and 1850 m (4582and 4581 indiv. m�2) (Fig. 2). They were very scarce (127 and223 indiv. m�2) in cores from 300 m and present in low numbers(955 and 509 indiv. m�2) at 1200 m (Hughes et al., 2009).Sampling for macrofauna at 50-m depth intervals across thelower OMZ boundary revealed very few animals at 700 and 750 m,higher densities at 800 m, at least during the post-monsoonseason, and highest densities at 850 and 950 m. Progressivelylower numbers of macrofauna were found at deeper sites (1000,1050 and 1100 m) across this transition zone (Levin et al., 2009).
Twenty-seven Agassiz trawl samples taken during the fourcruises provided information on megafauna and larger macro-fauna. Invertebrates were present at 134–138 m in the seasonallyhypoxic zone during the intermonsoon season but were absent intwo trawls taken in the OMZ core (299–341 m) and one trawl from758 to 777 m. They reappeared at 878–890 m and were present inall deeper catches. Detailed analyses of megafaunal animals inWASP photographs obtained during CD150 revealed a similarpattern (Fig. 2). Invertebrate megabenthos were rare (187 indiv.ha�1
¼ 0.019 indiv. m2) at 140 m and absent between 300 and900 m, where the only strictly benthic organisms visible werebacterial mats at 300, 400, 500 and 600 m depth. However, themost striking feature of this survey was the enormous megafaunaldensity, almost 280,000 indiv. ha�1 ( ¼ 28 indiv. m�2), at 1000 m.Densities were much lower at 1100 and 1200 m (5206 and6983 indiv. ha�1
¼ 0.52 and 0.70 indiv. m�1, respectively) and low-er still at 1850 m (167 indiv. ha�1
¼ 0.017 indiv. m�1). Fish andnatant decapods (benthopelagic megafauna) were the only liveorganisms captured in trawl samples at 299–341 and 758–777 m.Undifferentiated natant decapods were abundant in photographsfrom 1100 m (Murty et al., 2009).

ARTICLE IN PRESS
Fig. 2. Bathymetric distribution and abundance of different faunal groups across the Pakistan Margin OMZ. Invertebrate megabenthos and benthopelagic megafauna (fish,
natant decapods and octopods) based on WASP photographs (Murty et al., 2009). Metazoan macrofauna based on megacore samples (Hughes et al., 2009; Levin et al.,
2009). Hard-shelled foraminiferans based on multicorer samples (Schumacher et al., 2007); the superimposed darker trapezoid indicates the abundance of macrofaunal
foraminiferans in megacorer samples at 140 and 300 m (Larkin and Gooday, 2009). Filled circles indicate numbers that are too small to represent accurately. Crosses
indicate absence. For the invertebrate megafauna, ‘B’ indicates the occurrence of patches of filamentous bacteria. For nekton, the short vertical lines indicate occurrences in
trawl samples. Oxygen profiles for the intermonsoon (CD145) and late monsoon (CD 150) seasons are shown on the left-hand side.
Fig. 3. Distribution of arborescent foraminiferan Pelosina, sausage-shaped, monothalamous foraminiferans and gromiids in WASP photographs (Pelosina), megacores
(Pelosina and gromiids), multicores (monothalamous foraminiferans) and trawl samples (gromiids) across the Pakistan Margin OMZ. Records for the intermonsoon (CD146)
and monsoon (CD151) seasons are indicated separately. The abundance of gromiids (1, 2 or many) is indicated for the trawl samples. The vertical black bar with the white
horizontal lines shows the depth interval across which the sediments are laminated; the laminations progressively disappear between 800 and 940 m (narrower part
of bar).
A.J. Gooday et al. / Deep-Sea Research II 56 (2009) 488–502492
ARTICLE IN PRESS
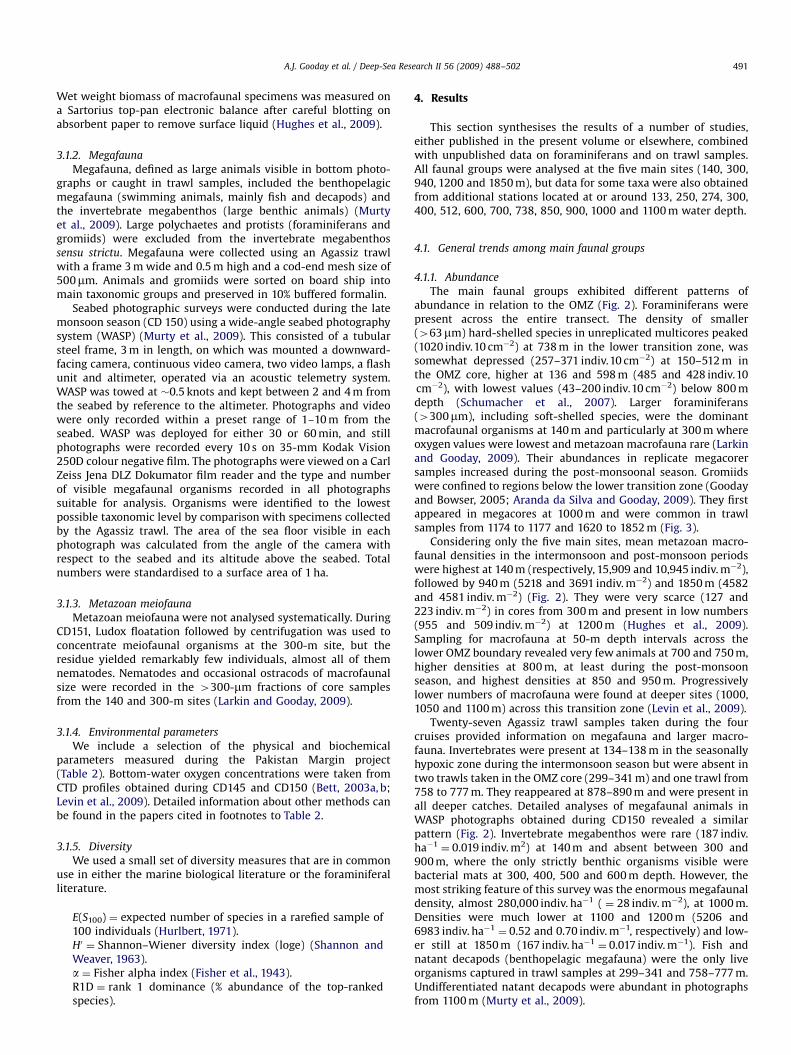
Fig. 4. Biomass of small, hard-shelled foraminiferans (463mm fraction) at different depths across the Pakistan Margin OMZ. The data are derived from samples collected
during the intermonsoon (CD145, 146) and monsoon (CD 151) seasons.
A.J. Gooday et al. / Deep-Sea Research II 56 (2009) 488–502 493
To summarise, foraminiferal densities (463mm fraction) wereonly slightly depressed within the OMZ core (300–500 m) andexhibited a peak around the upper limit of the lower transitionzone (700–800 m) at depths where the macrofauna and inverte-brate megabenthos were largely absent. Very few macrofaunawere present between 300 and 750 m but densities were maximalat 850–950 m within the lower transition zone. Except for thebenthopelagic megafauna, large animals were also excluded fromthe OMZ core. They peaked in abundance at a slightly greaterdepth (1000 m) than the macrofauna. In all groups, densitiesdeclined sharply at 1200 m and below.
4.1.2. Biomass
Foraminiferal and macrofaunal biomass exhibited differenttrends with depth. Rough estimates of the biomass of hard-shelledforaminiferans in the 4150-mm fraction, derived from samplescollected during different cruises, were highest at 250 and 274 m(CD151) and also high at 134 m (CD151), 133 m (CD146) and 306 m(CD145) (Fig. 4) (Schumacher, unpublished). Values were lowerbelow 300 m and tended to decrease with increasing water depth.Wet weight macrofaunal biomass at the main stations reached adistinct maximum at 940 m, particularly during the intermonsoonseason. The larger size of macrofaunal animals at this site,compared with those at 140 m, was partly responsible for thispeak (Hughes et al., 2009; Levin et al., 2009).
4.1.3. Diversity
Foraminiferal species richness (463-mm fraction) was highestwithin the seasonally hypoxic zone and at 738 m, with additionalpeaks at 1201 and 1870 m, and lower in the OMZ core and lowertransition zone (Schumacher et al., 2007) (Table 3). When speciesrichness was normalised to 100 individuals (E(S100)), the peak at738 m disappeared; values were highest at 140–150 and940–1850 m and depressed in the OMZ core. Species diversitymeasured by the Fisher a index, which emphasises speciesrichness, showed a similar pattern; highest at the two shallowest(136–150 m) and the four deepest (944–1870 m) sites, anddepressed between 306 and 844 m, except at 738 m.The Shannon–Wiener index (H0), which takes into account thedistribution of specimens amongst species (i.e. evenness),was also highest at the four deepest stations and the 136-m sitebut lower between 150 and 844 m. Unlike the Fisher index, H0 was
lowest at 738 m. Rank 1 dominance fluctuated across the transect;it was maximal at 738 m, coinciding with the highest densities,followed by 150 and 844 m depth. The depression of diversity inthe OMZ core (300–598 m) was most evident in the 63–150mmfraction (Schumacher et al., 2007). For foraminiferans in the4300-mm fraction, rarefied species richness (E(S100)) and diver-sity (Fisher a and Shannon–Wiener indices) were generally higher,and dominance lower, in replicate samples from the 140-m sitecompared to the 300-m site (Larkin and Gooday, 2009).
Polychaete species richness peaked at 140 and 1850 m, waslower at 940 m and lowest at 1200 m where densities were alsodepressed (Table 3) (Hughes et al., 2009). Values of E(S100),the Fisher a and Shannon–Wiener indices were also highest at theshallowest and deepest sites. However, in all cases, these indiceswere substantially larger at 1850 m than at 140 m, reflecting themuch lower polychaete densities at this deep site. Dominance wasrelatively high (typically 20–30%) at 140, 940 and 1200 m depthand considerably lower at 1850 m (8.1–8.5%). The number ofidentified polychaetes was too low to calculate diversity para-meters at 300 m. It is notable, however, that 4 species wererepresented amongst the 9 individuals picked from core samplesat this site. Across the lower transition zone, macrofaunaldiversity and species richness were low between 750 and 850 m,increased steeply between 850 and 900 m to reach a peak at1000 m before declining at 1050 and 1100 m depth (Levin et al.,2009). Dominance showed the opposite trend, with the amphi-nomid polychaete Linopherus sp. comprising nearly 100% ofmacrofaunal animals at the 800-m site.
Among the invertebrate megabenthos (excluding polychaetesand protists) in WASP photographs, only natant decapods(undifferentiated species) were visible at 300 m depth in theOMZ core (Murty et al., 2009). Elsewhere, species numbers weremaximal at 1100 and 1200 m. E(S100) and Shannon–Wiener valueswere highest at 1100 m, whereas the Fisher a index peaked at140 m (Table 3). The two diversity indices were lowest, anddominance highest, at the 1000-m site where 99% of animals inthe photographs were ophiuroids. Dominance was lowest at 140and 1850 m.
To summarise, trends in diversity across the OMZ variedbetween faunal groups. Foraminiferal diversity (463-mm fraction)was somewhat depressed in the OMZ core and lower transitionzone (300–940 m) and highest at the shallowest and deepeststations. Macrofaunal diversity increased steeply across the lower

ARTICLE IN PRESS
Table 3Summary of diversity indices for main faunal groups.
Depth (m) Hard-shelled foraminifera (463mm) Polychaetes Megafauna in WASP photographs
N S E(S100) H0 a R1D N S E(S100) H0 a R1D N S E(S100) H0 a R1D
140 123 37 19.0 2.38 7.2 32.7 458 54 29.9 3.08 15.9 21.0 285 8 2.20 0.68 4.07 52.6
299 46 29.3 3.06 15.2 19.1
150 714 34 16.1 2.03 7.3 41.5 * * * * * * * * * *
300 895 24 12.2 1.94 4.5 31.8 4 2 – – – – 183 1 – – – –
5 3 – – – –
400 * * * * * * * * * * * * 0 0 0 0 0 0
512 630 20 13.1 2.15 3.9 29.5 * * * * * * * * * * * *
598 1108 17 12.9 2.10 2.8 28.2 * * * * * * * * * * * *
700 * * * * * * * * * * * * 0 0 0 0 0 0
738 2097 38 11.8 1.70 6.1 51.1 * * * * * * * * * * * *
844 523 17 11.5 1.86 3.4 40.0 * * * * * * * * * * * *
900 * * * * * * * * * * * * 0 0 0 0 0 0
940 169 24 18.8 2.36 7.6 27.8 189 14 11.2 2.94 3.49 28.6 * * * * * *
67 15 15.0 2.17 6.00 31.3
1000 65 20 20.0 2.39 9.9 35.4 * * * * * * 280,654 10 1.66 0.05 0.69 99.2
1100 * * * * * * * * * * * * 8998 13 8.44 1.58 2.31 74.2
1200 140 28 25.5 2.90 10.5 17.9 11 6 6 1.67 5.40 27.3 7041 13 5.50 0.58 1.47 86.5
29 11 11 2.20 6.46 20.7
1850 157 32 25.4 2.62 12.2 29.9 69 46 46 3.69 60.3 8.53 208 7 1.33 0.33 1.89 63.9
82 48 48 3.62 48.5 6.62
For the polychaetes, the data are given for the intermonsoon (upper figure) and post-monsoon seasons. The foraminiferal data are based on unreplicated cores from the
intermonsoon season (CD145/146). The megafaunal data are based on WASP photographs obtained during the late monsoon (CD150). N ¼ number of individuals;
S ¼ number of species; E(S100) ¼ species numbers normalised to 100 individuals by rarefaction; H0 ¼ Shannon–Wiener diversity index (loge); a ¼ Fisher alpha index;
R1D ¼ rank 1 dominance (% abundance of the top-ranked species); * ¼ no data; dashes mean that numbers were too low to calculate diversity indices.
A.J. Gooday et al. / Deep-Sea Research II 56 (2009) 488–502494
transition zone from low values at 750–850 to a strong peak at1000 m depth. Polychaete and megabenthic diversity was eitherminimal or zero in the OMZ core (250–750 m), reflecting thescarcity of larger animals in this region, and peaked at 1850 m forpolychaetes and 1100 m for megafauna.
4.2. Patterns of zonation within main faunal groups
4.2.1. Community trends across the OMZ profile
Obvious trends in the taxonomic composition of differentfaunal groups were evident across the OMZ.
4.2.1.1. Foraminiferans. Calcareous individuals constituted 80% ormore of the smaller, hard-shelled foraminiferans (463mm frac-tion) at 136–306 m depth compared with o50% at deeper stations(512–1870 m) where agglutinated species were relatively moreimportant (Schumacher et al., 2007). Buliminids and rotaliidspredominated among the calcareous component. Biserial andtriserial morphotypes typically made up more than 80% or 90% oflive calcareous individuals down to 738 m depth and remainedrelatively abundant at the 844-m site. At deeper stations, thesemorphotypes constituted a variable but usually smaller propor-tion of the much-reduced calcareous foraminiferal standing stock.At the species level, there was a switch at �500 m depth withinthe OMZ core from dominance by apparently endemic species,notably Uvigerina ex gr. semiornata and Bolivina aff. dilatata, tomore cosmopolitan taxa such as Chilostomella spp., Globobulimina
spp., Praeglobobulimina spp. and Uvigerina peregrina (Schumacheret al., 2007).
Calcareous individuals represented 76–85% of stained forami-niferans 4300mm at 140 m and 57–68% at 300 m depth (Larkinand Gooday, 2009). There was no major change in assemblagecomposition between the two seasons at the 140-m site, despitethe sharp reduction in oxygen concentrations from 2.0 mL L�1
(intermonsoon) to 0.1 mL L�1 (post-monsoon). The top-rankedspecies, Uvigerina ex gr. semiornata, was the same in both cases.However, there was a notable increase in carbon processing bythese foraminiferans after the monsoon (Woulds et al., 2007).
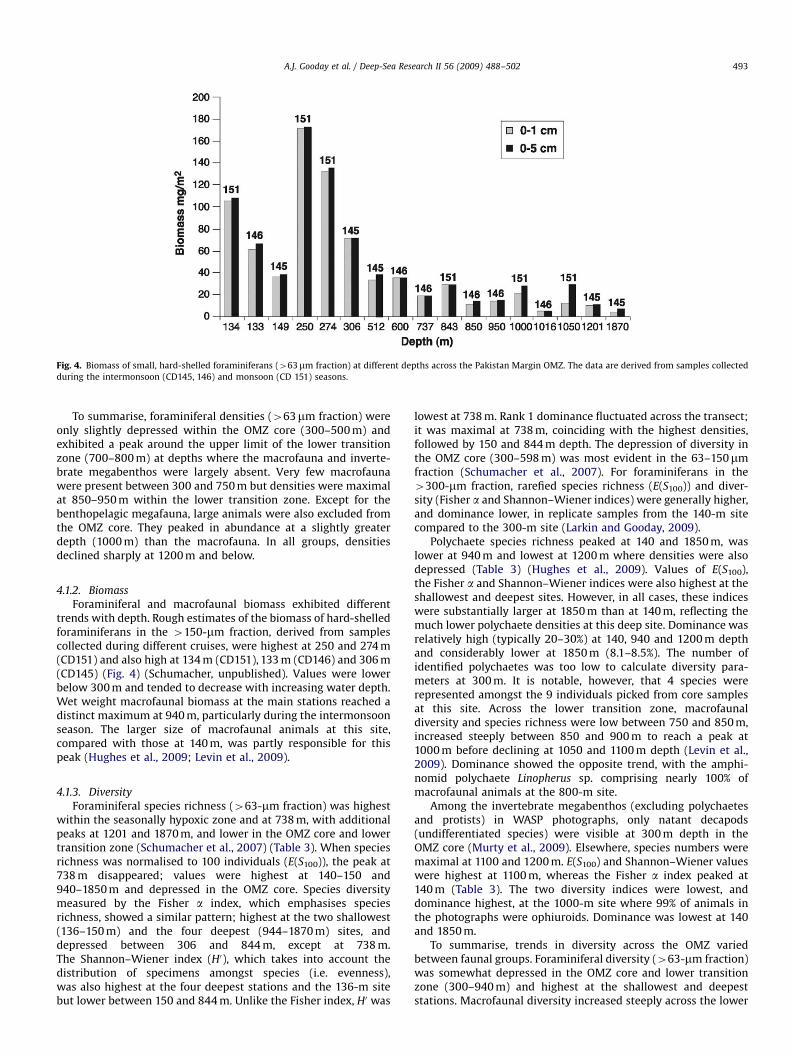
Additional data on the relative abundance of different foraminif-eral groups were acquired during shipboard sorting of 300-mmresidues (Fig. 5). Although unstained, most foraminiferanswere probably live based on the presence of visible cytoplasm.These data are not precise, but they do reflect the approximateproportions of different foraminiferal groups at the main stations,except at 1850 m where numbers were low. Calcareous taxa(buliminids and rotaliids) predominated at 140 and 300 m whileagglutinated taxa (mainly Reophax and Hormosina) predominatedat 950, 1200 and 1850 m depth. Species of Komokiacea, a deep-seataxon currently included in the Foraminifera, were an importantfaunal element at the deepest stations. Although never common,soft-shelled monothalamous foraminiferans (allogromiids andsaccamminids) were distributed across the entire transect in the4300mm fraction. The saccamminids included sausage-shapedspecies with two terminal apertures which spanned most of theOMZ (250–1100 m) (Figs. 3 and 6C–D). A tree-like Pelosina speciesoccurred over a similar depth range. It was common in megacoresfrom around 230 and 1000 m, generally uncommon in the OMZcore, but visible in WASP photographs at 400 and 700 m (Figs. 3and 6A–B). Gromiids were most common below 1150 m whereoxygen levels exceeded 0.20 mL L�1 (Aranda da Silva and Gooday,2009), although a single species occurred around 1000 m (Goodayand Bowser, 2005).
4.2.1.2. Metazoan macrofauna. Different taxa exhibited differentpatterns of abundance across the OMZ. The absolute abundance ofpolychaetes, the dominant group, mirrored that of the macrofaunaas a whole. Overall, polychaetes represented 450% of metazoanmacrofaunal density and most of the biomass. They accounted for76–87% of macrofaunal animals at 140 m, 60–79% at 940 m,42–65% at 1200 m and 52�55% at 1850 m depth (Hughes et al.,2009). The majority (62–83%) of the very sparse macrofauna at300 m were polychaetes. The amphinomid polychaete Linopherus
sp. represented 485% of macrofaunal individuals between 750and 850 m (Levin et al., 2009). Molluscs were always less abun-dant than polychaetes. They constituted a lower percentage(0–10%) of the macrofauna at 140 and 300 m, compared to 14–26%
ARTICLE IN PRESS
Fig. 5. Relative proportions of different foraminiferal groups at the main study sites, based on shipboard sorting of unstained 4300mm residues. The total numbers of
specimens examined are indicated at the tops of the columns. MAF ¼ multichambered agglutinated foraminiferans.
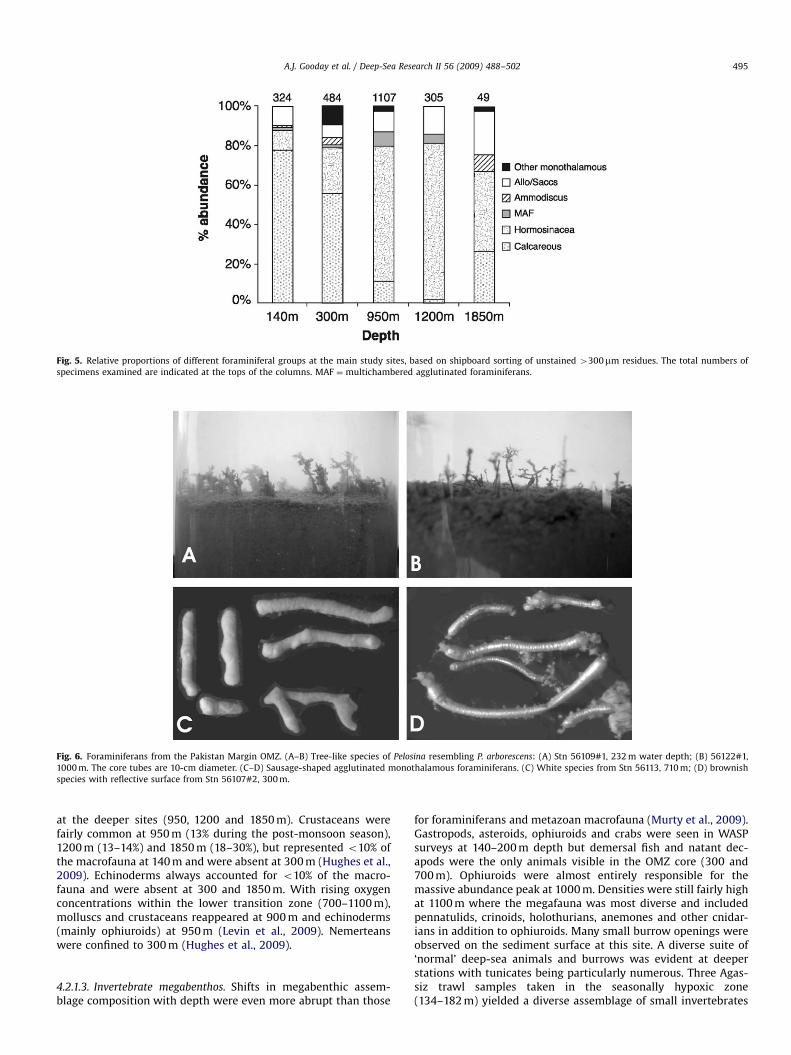
Fig. 6. Foraminiferans from the Pakistan Margin OMZ. (A–B) Tree-like species of Pelosina resembling P. arborescens: (A) Stn 56109#1, 232 m water depth; (B) 56122#1,
1000 m. The core tubes are 10-cm diameter. (C–D) Sausage-shaped agglutinated monothalamous foraminiferans. (C) White species from Stn 56113, 710 m; (D) brownish
species with reflective surface from Stn 56107#2, 300 m.
A.J. Gooday et al. / Deep-Sea Research II 56 (2009) 488–502 495
at the deeper sites (950, 1200 and 1850 m). Crustaceans werefairly common at 950 m (13% during the post-monsoon season),1200 m (13–14%) and 1850 m (18–30%), but represented o10% ofthe macrofauna at 140 m and were absent at 300 m (Hughes et al.,2009). Echinoderms always accounted for o10% of the macro-fauna and were absent at 300 and 1850 m. With rising oxygenconcentrations within the lower transition zone (700–1100 m),molluscs and crustaceans reappeared at 900 m and echinoderms(mainly ophiuroids) at 950 m (Levin et al., 2009). Nemerteanswere confined to 300 m (Hughes et al., 2009).
4.2.1.3. Invertebrate megabenthos. Shifts in megabenthic assem-blage composition with depth were even more abrupt than those
for foraminiferans and metazoan macrofauna (Murty et al., 2009).Gastropods, asteroids, ophiuroids and crabs were seen in WASPsurveys at 140–200 m depth but demersal fish and natant dec-apods were the only animals visible in the OMZ core (300 and700 m). Ophiuroids were almost entirely responsible for themassive abundance peak at 1000 m. Densities were still fairly highat 1100 m where the megafauna was most diverse and includedpennatulids, crinoids, holothurians, anemones and other cnidar-ians in addition to ophiuroids. Many small burrow openings wereobserved on the sediment surface at this site. A diverse suite of‘normal’ deep-sea animals and burrows was evident at deeperstations with tunicates being particularly numerous. Three Agas-siz trawl samples taken in the seasonally hypoxic zone(134–182 m) yielded a diverse assemblage of small invertebrates

ARTICLE IN PRESS
A.J. Gooday et al. / Deep-Sea Research II 56 (2009) 488–502496
that were not visible in photographs. These included molluscs,crustaceans, a few echinoderms, anemones, polychaetes, and at161–182 m, a large number of fish. Three hauls from the core ofthe OMZ (299–341 m) and from 758–777 m obtained only fish andnatant decapods, consistent with the absence of invertebratemegabenthos in WASP images from this region. Seven trawlsamples taken across the lower transition zone (800–1100 m)revealed a succession of different taxa, discussed below. Trawlcatches from 41200 m were generally small but diverse withanemones, echinoderms, crustaceans, molluscs and sipunculanworms often much in evidence.
4.2.2. Depth ranges across the OMZ
The metazoan macrofauna underwent rapid, species-levelchanges with depth across the lower transition zone (Levinet al., 2009). Trawl catches also suggested a strong faunal zonationin this region. Burrowing edwardsiid anemones and polychaetes(Linopherus sp. and Prionospio sp.) were abundant at 878–890 m;ophiuroids and Linopherus sp. were abundant at 889–955 m;edwarsiid anemones, and small holothurians (Psolus sp.) wereabundant, with subordinate numbers of other invertebrates(including pennatulids, tunicates and asteroids), at 961–1075 m.Many of the species identified by Murty (2005) from trawlsamples across the lower transition zone and OMZ boundary(950–1200 m), had limited depth distributions, typically �200 mor less. Species living below the OMZ, however, tended to havewider bathymetric ranges; for example, the polychaete Hyalinoe-
cia sp. (1264–1832 m) and the echinoid Phormosoma placenta
(1264–1705 m). The WASP photographs generally confirmed thatmany megabenthic animals had restricted bathymetric ranges inthe lower part of the OMZ. Notably, ophiuroids were confined tothe 1000 m site, where they were extraordinarily abundant, andthe 1100 m site, where they were common. The widest-rangingmegafaunal species within the OMZ was a synodontid fish(Saurida tumbil), present at the 300 and 700-m sites (Murtyet al., 2009).
Foraminiferans appear to have wider depth ranges than themetazoans (Schumacher et al., 2007). Uvigerina ex gr. semiornata
and Bolivina aff. B. dilatata were the main species in the seasonallyhypoxic zone (136 and 150 m) and within the OMZ core (306 m)and both persisted down to 500 m depth. Other examples offoraminiferal species with wide bathymetric ranges includedBulimina exilis (300 and 1200 m), Uvigerina peregrina (500 and1050 m), Ammodiscus tenuis (300 and 1000 m) and Pelosina sp.(140–1100 m).
4.2.3. Trends in lifestyles
Changes in lifestyles and trophic biology occurred in relation tothe OMZ. Natural lipid analyses and tracer studies indicated thatthe abundant calcareous foraminiferans at 140 and 300 m fed onfresh algal material when it was available, whereas someagglutinated foraminiferans (including species of Reophax andAmmodiscus) had a larger bacterial component to their diet(Larkin, 2006; Woulds et al., 2007). Since agglutinated species,particularly hormosinaceans, become relatively more abundantwith depth, we infer that a predominantly algal diet (‘herbivory’)was more prevalent at shallower sites while deposit feeding wasmore important at deeper sites. The komokiaceans that werecommon at 1850 m probably feed on sediment and associatedbacteria and organic matter (Gooday et al., 2009). The large tree-like foraminiferan Pelosina sp. (Fig. 6C–D), which was a conspic-uous feature of some megacores collected between 140 and1100 m (Fig. 3), is a suspension feeder.
Among the polychaetes, surface feeders constituted the mostabundant trophic group at all depths, with carnivores/omnivores
and subsurface deposit feeders generally less common (Hugheset al., 2009). Suspension feeders were usually either rare (1–2%) orabsent, except the 1850-m site (�9%). Across the lower transitionzone there was a shift from detritus feeding at 700–900 m, mainlyby Linopherus sp., which constructs a permanent burrow, tosurface deposit feeding by mobile burrowers and tube builders at950–1100 m (Levin et al., 2009). Suspension-feeding bivalves(pectinids and thyasirids) were common between 900 and 950 m.
The megafauna at 140, 300 and 700 m depth were eithermobile predators/scavengers (fish and crustaceans at all sites) ordeposit feeders (echinoderms and molluscs, at 140 m only) (Murtyet al., 2009). The megabenthic peak at 1000 m consisted almostentirely of mobile deposit feeders (ophiuroids). Large, sessilesuspension-feeding animals, including pennatulids and othercnidarians, first appeared at 1100 m where they representedabout two thirds of the visible megabenthos, the remaindercomprising predator/scavengers and deposit feeders. The mega-benthos at 1850 m was a similar mix of sessile suspension feeders(33%), mobile deposit feeders (11%) and predator/scavengers(56%). However, at 1200 m, where the tunicate Asajirus indicus
was very abundant, 94% of the megafauna were sessile suspensionfeeders.
5. Discussion
5.1. Comparison of benthic faunas on the Pakistan and Oman
margins
Oxygen profiles across the Oman and Pakistan margins showeda similar rapid decline within the upper 200 m and a gradualincrease between 950 and 1300 m depth. However, oxygenconcentrations in the OMZ core were lower (�0.10 mL L�1) offPakistan than on the Oman Margin (�0.13 mL L�1) (Levin et al.,2000). Similarly, oxygen values in the deeper part of the OMZwere 0.32–0.33 mL L�1 off Pakistan (1250 m) compared to 0.52 mLL�1 off Oman (1200 m) (Table 5). Sediments were bioturbatedacross the Oman OMZ (Smith et al., 2000) but laminated in thePakistan OMZ core (Hughes et al., 2009; Levin et al., 2009),reflecting the greater degree of hypoxia on the eastern side of theArabian Sea. The sediments also contained a relatively highproportion of sand on the Oman Margin compared with theabsence of sand on the Pakistan Margin (Table 2). The OmanMargin experiences more intense upwelling than the PakistanMargin, and hence higher productivity and flux rates to theseafloor (e.g., Banse and McClain, 1986; Nair et al., 1989; Burkillet al., 1993). Although the percentage of organic carbon in thesediment at 1200 m on the Oman Margin is rather lower than atcomparable depths off Pakistan, pigment concentrations are muchhigher (Table 5), suggesting a greater input of fresh organic matteror reduced utilisation in the water column.
Benthic faunas off Oman were studied in 1994 along a transectof the OMZ south of Masirah Island (Discovery Cruise 211; Gageet al., 2000) and further north between Muscat and the headlandof Ra’s al Hadd (Charles Darwin Cruise; Jacobs, 2003). Table 4compares the results of these studies with those from the PakistanMargin. The main points are as follows:
(1)
On both margins, foraminiferans were abundant in the OMZcore where the dominant species 4300mm was Uvigerina ex.gr. semiornata. Other macrofaunal species common to bothmargins included Bolivina aff. dilatata, Bulimina exilis andCancris auriculata. However, the sausage-shaped monothala-mous species which were a minor but distinctive componentof the Pakistan assemblages, were apparently absent on theOman Margin.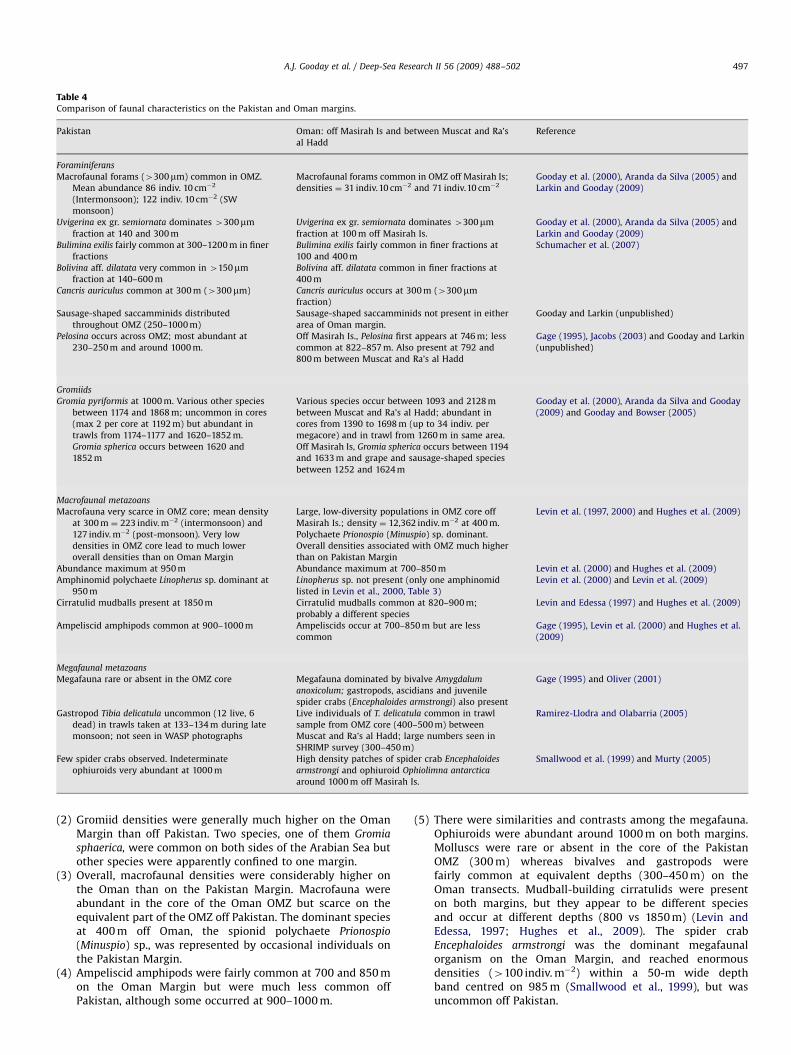
ARTICLE IN PRESS
Table 4Comparison of faunal characteristics on the Pakistan and Oman margins.
Pakistan Oman: off Masirah Is and between Muscat and Ra’s
al Hadd
Reference
Foraminiferans
Macrofaunal forams (4300mm) common in OMZ.
Mean abundance 86 indiv. 10 cm�2
(Intermonsoon); 122 indiv. 10 cm�2 (SW
monsoon)
Macrofaunal forams common in OMZ off Masirah Is;
densities ¼ 31 indiv.10 cm�2 and 71 indiv.10 cm�2
Gooday et al. (2000), Aranda da Silva (2005) and
Larkin and Gooday (2009)
Uvigerina ex gr. semiornata dominates 4300mm
fraction at 140 and 300 m
Uvigerina ex gr. semiornata dominates 4300mm
fraction at 100 m off Masirah Is.
Gooday et al. (2000), Aranda da Silva (2005) and
Larkin and Gooday (2009)
Bulimina exilis fairly common at 300–1200 m in finer
fractions
Bulimina exilis fairly common in finer fractions at
100 and 400 m
Schumacher et al. (2007)
Bolivina aff. dilatata very common in 4150mm
fraction at 140–600 m
Bolivina aff. dilatata common in finer fractions at
400 m
Cancris auriculus common at 300 m (4300mm) Cancris auriculus occurs at 300 m (4300mm
fraction)
Sausage-shaped saccamminids distributed
throughout OMZ (250–1000 m)
Sausage-shaped saccamminids not present in either
area of Oman margin.
Gooday and Larkin (unpublished)
Pelosina occurs across OMZ; most abundant at
230–250 m and around 1000 m.
Off Masirah Is., Pelosina first appears at 746 m; less
common at 822–857 m. Also present at 792 and
800 m between Muscat and Ra’s al Hadd
Gage (1995), Jacobs (2003) and Gooday and Larkin
(unpublished)
Gromiids
Gromia pyriformis at 1000 m. Various other species
between 1174 and 1868 m; uncommon in cores
(max 2 per core at 1192 m) but abundant in
trawls from 1174–1177 and 1620–1852 m.
Gromia spherica occurs between 1620 and
1852 m
Various species occur between 1093 and 2128 m
between Muscat and Ra’s al Hadd; abundant in
cores from 1390 to 1698 m (up to 34 indiv. per
megacore) and in trawl from 1260 m in same area.
Off Masirah Is, Gromia spherica occurs between 1194
and 1633 m and grape and sausage-shaped species
between 1252 and 1624 m
Gooday et al. (2000), Aranda da Silva and Gooday
(2009) and Gooday and Bowser (2005)
Macrofaunal metazoans
Macrofauna very scarce in OMZ core; mean density
at 300 m ¼ 223 indiv. m�2 (intermonsoon) and
127 indiv. m�2 (post-monsoon). Very low
densities in OMZ core lead to much lower
overall densities than on Oman Margin
Large, low-diversity populations in OMZ core off
Masirah Is.; density ¼ 12,362 indiv. m�2 at 400 m.
Polychaete Prionospio (Minuspio) sp. dominant.
Overall densities associated with OMZ much higher
than on Pakistan Margin
Levin et al. (1997, 2000) and Hughes et al. (2009)
Abundance maximum at 950 m Abundance maximum at 700–850 m Levin et al. (2000) and Hughes et al. (2009)
Amphinomid polychaete Linopherus sp. dominant at
950 m
Linopherus sp. not present (only one amphinomid
listed in Levin et al., 2000, Table 3)
Levin et al. (2000) and Levin et al. (2009)
Cirratulid mudballs present at 1850 m Cirratulid mudballs common at 820–900 m;
probably a different species
Levin and Edessa (1997) and Hughes et al. (2009)
Ampeliscid amphipods common at 900–1000 m Ampeliscids occur at 700–850 m but are less
common
Gage (1995), Levin et al. (2000) and Hughes et al.
(2009)
Megafaunal metazoans
Megafauna rare or absent in the OMZ core Megafauna dominated by bivalve Amygdalum
anoxicolum; gastropods, ascidians and juvenile
spider crabs (Encephaloides armstrongi) also present
Gage (1995) and Oliver (2001)
Gastropod Tibia delicatula uncommon (12 live, 6
dead) in trawls taken at 133–134 m during late
monsoon; not seen in WASP photographs
Live individuals of T. delicatula common in trawl
sample from OMZ core (400–500 m) between
Muscat and Ra’s al Hadd; large numbers seen in
SHRIMP survey (300–450 m)
Ramirez-Llodra and Olabarria (2005)
Few spider crabs observed. Indeterminate
ophiuroids very abundant at 1000 m
High density patches of spider crab Encephaloides
armstrongi and ophiuroid Ophiolimna antarctica
around 1000 m off Masirah Is.
Smallwood et al. (1999) and Murty (2005)
A.J. Gooday et al. / Deep-Sea Research II 56 (2009) 488–502 497
(2)
Gromiid densities were generally much higher on the OmanMargin than off Pakistan. Two species, one of them Gromiasphaerica, were common on both sides of the Arabian Sea butother species were apparently confined to one margin.
(3)
Overall, macrofaunal densities were considerably higher onthe Oman than on the Pakistan Margin. Macrofauna wereabundant in the core of the Oman OMZ but scarce on theequivalent part of the OMZ off Pakistan. The dominant speciesat 400 m off Oman, the spionid polychaete Prionospio(Minuspio) sp., was represented by occasional individuals onthe Pakistan Margin.
(4)
Ampeliscid amphipods were fairly common at 700 and 850 mon the Oman Margin but were much less common offPakistan, although some occurred at 900–1000 m.(5)
There were similarities and contrasts among the megafauna.Ophiuroids were abundant around 1000 m on both margins.Molluscs were rare or absent in the core of the PakistanOMZ (300 m) whereas bivalves and gastropods werefairly common at equivalent depths (300–450 m) on theOman transects. Mudball-building cirratulids were presenton both margins, but they appear to be different speciesand occur at different depths (800 vs 1850 m) (Levin andEdessa, 1997; Hughes et al., 2009). The spider crabEncephaloides armstrongi was the dominant megafaunalorganism on the Oman Margin, and reached enormousdensities (4100 indiv. m�2) within a 50-m wide depthband centred on 985 m (Smallwood et al., 1999), but wasuncommon off Pakistan.
ARTICLE IN PRESS
Table 5Environmental characteristics in the OMZ core on the Oman and Pakistan margins of the Arabian Sea. Inter ¼ intermonsoon; L/P ¼ late/post-monsoon.
Omana Pakistan Omana Pakistan
400 m 300 m 1250 m 1200 m
Inter L/P Inter L/P
Temperature (1C)a 13.3 15.5 14.8 6.7 7.2 7.3
Oxygen (ml/l)b 0.13 0.10 0.11 0.52 0.33 0.32
% Corgc 4.9970.44 2.370.1 2.570.1 2.6770.07 3.27 3.27
Pigments (mg/g dry sediment)a 770 29.076.2 40.4717.8 68726 8.6
% CaCO3c 55.1 14.5 14.1 66.1 20.7 20.4
% Sand (0–1 cm)d 22.3 0 0 56.8 0 0
Macrofaunal biomass (wet wt g m2)e 14.275.8 0.0270,02 0.0170,02 �3.6 0.3670.81 5.2778.13
Macrofaunal density (indiv. m�2)e 12,362 1597122 4867817 2485 10187422 9877433
Sediment laminations Absent Present Present Absent Absent
a Levin et al. (2000); sediment laminations from Smith et al. (2000).b CTD records.c Cowie and Levin (2009).d G. Law, pers. commun.e Hughes et al. (2009).
A.J. Gooday et al. / Deep-Sea Research II 56 (2009) 488–502498
(6)
Lower boundary edge effects were evident on both margins.Macrofaunal abundance maxima comprising mainly poly-chaetes were located at different depths (700–850 m on theOman Margin, 850–950 m on the Pakistan Margin) but similaroxygen levels (0.16–0.17 mL L�1). Off Oman, spionid, amphar-etid, paraonid and cirratulid polychaetes were common in thiszone. Off Pakistan, a single species of the amphinomidpolychaete genus Linopherus dominated at 850 m with otherpolychaete taxa (acrocirrids, ampharetids and cossurids)important at 950 m.Differences in oxygen and food availability probably explainwhy metazoan macrofauna were considerably more abundant inthe Oman OMZ core (400 m) than on the Pakistan (300 m) margin.Environmental parameters at these two sites are summarised inTable 5. Compared to values off Pakistan, the bottom-wateroxygen concentrations and the percentage of organic carbon wereboth slightly higher in the upper part of the Oman OMZ (400 m)while the pigment concentrations were much higher. It ispresumably the slightly higher oxygen availability, combinedwith food-rich sediments, that allows the development of anabundant macrofauna at this site (Levin et al., 1997). However, theextremely low diversity of this assemblage, which consists largely(90%) of two polychaete species, suggests that very few macro-faunal species can tolerate bottom-water oxygen concentrationsof 0.13 mL L�1. Support for this suggestion comes from whole-community 13C-tracing experiments on the Pakistan Margin,which identify a threshold oxygen concentration between 0.11and 0.13 mL L�1. Above this threshold, metazoan macrofaunafunctioned efficiently and took up the algal food source, whilebelow it they were out-performed by the foraminiferans (Wouldset al., 2007). On the Pakistan Margin, the low-oxygen concentra-tions, possibly in combination with lower OM inputs, serve toeliminate most macrofaunal animals. Comparison of these twomargins generally supports the hypothesis that in hypoxicenvironments, oxygen depletion exerts a strong influence onspecies richness while food availability influences the abundanceand dominance of particular species (Levin and Gage, 1998; Levinet al., 2009).
Other differences between faunas on the two sides of theArabian Sea, particularly the presence or absence of certaintaxa, are more difficult to explain. Similar contrasts in thetaxonomic composition of macrofauna have been observedbetween the Peru (111S) and Chilean (361S) margins; oligochaetesare abundant in the former but absent in the latter (Levin et al.,
2002; Gallardo et al., 2004). In addition to environmentalfactors, these differences may reflect undersampling, seasonalfluctuations in population sizes or biogeographic patterns.OMZs are believed to promote speciation by creating barriersto gene flow between populations and by favouring traitsthat increase tolerance to hypoxia (Rogers, 2000). Such processescould lead to the development of species with restricteddistributions.
5.2. Comparison with other deep-water hypoxic systems
Levin (2003) reviews the characteristics of benthic faunasinhabiting OMZs. At the community level, typical featuresinclude: (1) generally high densities of foraminifera and metazo-ans; (2) a dominance of smaller organisms (foraminiferal andmetazoan meiofauna) where oxygen concentrations are lowest;(3) faunal aggregations above and below the OMZ core (edgeeffects); (4) depressed species richness and diversity combinedwith high dominance among most faunal groups; (5) a dominanceof certain groups, notably rotaliids and buliminids among theforaminiferans, nematodes among the meiofauna and annelidsamong the macrofauna, where hypoxia is severe (o�0.15 mL L�1).The faunal patterns observed off Pakistan were generallyconsistent with these trends. Foraminiferans were dominant inthe OMZ core. The macrofauna and invertebrate megabenthoswere very scarce or absent with peak abundances located in thelower transition zone.
Sanders (1969), working off Walvis Bay in the SE Atlantic, wasthe first to examine community-level trends in faunas impactedby OMZs. However, these features are most extensively developedin the eastern Pacific (Helly and Levin, 2004), where severalstudies have compared trends between different faunal groups inrelation to bottom-water oxygen gradients. Therefore, we focusour comparison on data from this area, particularly the studies ofWishner et al. (1990, 1995) and Levin et al. (1991a,b) across thesummit and flanks of the Volcano 7 seamount which penetratesthe OMZ to the west of Mexico (see also Levin, 2002), and of Levinet al. (2002) across the OMZ off Peru during the 1997–1998 ElNino.
5.2.1. Protists (foraminiferans and gromiids)
Field and experimental evidence suggests that foraminiferansand metazoan meiofauna generally tolerate hypoxia better thanlarger metazoans (Josefson and Widbom, 1988; Moodley et al.,
ARTICLE IN PRESS
A.J. Gooday et al. / Deep-Sea Research II 56 (2009) 488–502 499
1997). Foraminiferans were the overwhelmingly dominant eu-karyotic group among those analysed in the core of the PakistanMargin OMZ. As in other oxygen-deficient environments(reviewed by Sen Gupta and Machain-Castillo, 1993; Bernhardand Sen Gupta, 1999), assemblages in the core were largelycalcareous, with species belonging to the Buliminida predominat-ing. However, agglutinated species were also fairly common at300 m (Fig. 5; Larkin and Gooday, 2009) and elongate mono-thalamous foraminiferans occurred between 250 and 1000 m(Fig. 6C–D). Species of Reophax and some other multilocularagglutinated genera (Bernhard and Sen Gupta, 1999), as well asmonothalamous forms (e.g., Bernhard et al., 2006), are knownfrom other hypoxic settings. Numerous agglutinated foraminifer-ans are reported to encrust phosphatic hardgrounds within theOMZ at �11 1S on the Peru Margin (Resig and Glenn, 1997). Theseassemblages exhibited much higher dominance (82–96%) thanthose at 300 m on the Pakistan Margin (40–58% during inter-monsoon; 49–73% during the SW monsoon) (Larkin and Gooday,2009).
Levin et al. (2002) reported a high density of sediment-dwelling foraminiferans in the OMZ core on the Peru Margin(�121 300S). At their severely hypoxic Stn A (305 m water depth;O2 ¼ 0.02 mL L�1), foraminiferans (4150mm fraction, 0–1 cmlayer) were 28–36 times more abundant than at three deeperstations where oxygen levels were higher (0.26, 0.84 and 1.78 mLL�1 at 563, 831 and 1210 m depth, respectively). The proportion ofcalcareous foraminiferans was also very high (91%) at 305 m,decreasing to 89%, 63% and 11% at 563, 831 and 1210 m,respectively. On the Pakistan Margin, there was a similar decreasein the proportion of calcareous taxa with increasing oxygen levelsin the 4150mm (Schumacher et al., 2007) and 4300mm fractions(Fig. 5). However, foraminiferal densities (4150-mm fraction) at300 m off Pakistan were o3% of the very high standing crops at asimilar depth in the core of the Peru OMZ.
Nienstedt and Arnold (1988) described foraminiferans (0–2 cm,463mm, unstained) from three seamounts, including Volcano 7,on the East Pacific Rise. The lowest Shannon–Wiener diversityvalues were from sandy sediments collected between 788 and1058 m depth. Dominance was 450% at 788 m on the summit ofVolcano 7, similar to values (40–73%) in the upper part of the OMZcore off Pakistan. The East Pacific Rise OMZ community domi-nants, however, were members of the family Cassidulinidae(Ehrenbergina and Cassidulina) rather than the species of Bolivina
and Uvigerina prevalent on the Pakistan Margin.Arborescent Pelosina species, often referred to Pelosina arbor-
escens, are fairly widespread in oxygen-deficient settings. Theirtree-like tests, which project well above the sediment surface andhave pseudopodia deployed from the ends of the branches,probably facilitate oxygen uptake as well as the collection ofsuspended food. On the Pakistan Margin, Pelosina spans a depthrange from 130 to 1100 m and oxygen concentrations from 0.10 to0.23 mL L�1. Similar species occur where oxygen levels arebetween 0.2 and 0.5 mL L�1 off Oman and Peru (Gooday et al.,2000) and in the San Diego Trough (Thistle, 1979) and SantaCatalina Basin (0.4 mL L�1) (Levin et al., 1991c) on the CaliforniaBorderland. P. arborescens is reported from ‘anoxic bottoms’ off theSwedish west coast and can tolerate anoxic conditions for 10 daysin the laboratory (Cedhagen, 1993). The presence of these largeprotists is contrary to the reduced test size of many foraminiferansin OMZ settings (Bernhard and Sen Gupta, 1999).
The frequent occurrence of gromiids in well-oxygenated,shallow-water habitats (Arnold, 1972; Bowser et al., 1996) isconsistent with their main occurrence below the Pakistan MarginOMZ. Gromiids appear to prefer areas where hypoxia is not toosevere but food availability is relatively high. Their sack-like testscontain voluminous masses of stercomata, suggesting that they
are deposit feeders ingesting sediment and associated detritusand bacteria (Aranda da Silva, 2005).
5.2.2. Macrofauna
Macrofauna typically exhibit low species richness, highdominance and a predominance of polychaetes in OMZ settings(Levin, 2003; Gallardo et al., 2004). Although densities are oftendepressed where oxygen levels are lowest (Levin, 2003), thePakistan Margin appears unique in having a very low macrofaunaldensity within the OMZ core (Hughes et al., 2009). At our 300-msite, the sparse macrofauna comprised polychaetes and nemer-teans. A polychaete-dominated macrofauna was well developedon the Chilean shelf, where oxygen dropped to levels (�0.1 mLL�1) comparable to those on the Pakistan Margin (Gallardo et al.,2004). Further north off Peru, metazoan macrofauna were mostabundant at even lower oxygen concentrations (0.02 mL L�1;Station A). Here, the dominant species (85%) was Olavius
crassitunicatus, a small gutless oligochaete with subcuticularsymbiotic bacteria (Giere and Krieger, 2001; Levin et al., 2003).On Volcano 7, average macrofaunal densities on the lower summit(770–850 m; O2 ¼ 0.13 mL L�1) were �4 times higher than onthe upper summit (0.09 mL L�1), flank (0.81 mL L�1) and base(2.55 mL L�1) of the seamount (Levin et al., 1991a,b). More than70% of the macrofauna on the lower summit were polychaetesand 21% were represented by a burrowing anemone. Theoxygen values on the lower summit of Volcano 7 were similar tothose at the 400-m site on the Oman Margin where polychaeteswere also common, although diversity was much lower (Levinet al., 1997, 2000). At similar oxygen levels on the Pakistan Margin(940 m), macrofaunal densities were again fairly high andpolychaetes comprised 80% of the fauna (Hughes et al., 2009).The upper summit foraminiferal sands of Volcano 7 yielded asparse macrofauna dominated (almost 50%) by a species ofaplacophoran mollusc. This assemblage had no equivalent onthe Pakistan Margin.
The rarity of macrofauna in the Pakistan Margin OMZ above700 m suggests that oxygen levels were below a critical threshold(Woulds et al., 2007, 2009; Levin et al., 2009). On the Peru Margin(Levin et al., 2002) and Volcano 7 (Levin et al., 1991a),oligochaetes and aplacophorans replace polychaetes at oxygenlevels o0.10 mL L�1. These taxa were rare in our study area, whereoxygen values never dip below this level. Oligochaetes andaplacophorans are both known to harbour symbiotic chemauto-trophic bacteria (Giere and Krieger, 2001; Katz et al., 2006) and sothe fact that sulphidic conditions were not developed on thePakistan Margin (Law et al., 2009) may explain their absence. Thecoarser, sandier sediment on Volcano 7, and correspondingdifferences in sediment chemistry, are other possible factorsresponsible for faunal differences between the two areas.
5.2.3. Megafauna
The absence of megafauna, other than demersal fish and natantdecapods, in the core of the Pakistan OMZ is consistent with thepatterns generally observed within oxygen-deficient environ-ments. For example, Mullins et al. (1985) reported that largerorganisms, including crustaceans, molluscs and echinoderms,were absent or rare within the OMZ off central California. Thereare some parallels between megafaunal patterns off Pakistan andthose seen on Volcano 7. In both cases, fish occurred whereoxygen concentrations were lowest (Wishner et al., 1990; Levinet al., 1991a; Levin, 2002). Fish often enter OMZs, probably inorder to feed or to avoid predators (Levin, 2003), and so theirpresence in the OMZ core off Pakistan is not surprising. However,scavenging amphipods, another group known to exhibit ‘eat andrun’ behaviour, seem to be absent (Murty et al., 2009).

ARTICLE IN PRESS
A.J. Gooday et al. / Deep-Sea Research II 56 (2009) 488–502500
The Volcano 7 megafauna exhibited highest abundances on thelower summit (780–1000 m); huge numbers of animals wereobserved during submersible dives at 800–810 m (Wishner et al.,1990; Levin, 2002). The distribution of organisms was stronglypatterned by depth with narrow bands of galatheid crabs, natantdecapods, ophiuroids and anemones succeeding each otherbetween 750 and 800 m (Wishner et al., 1995; Levin, 2002). Onthe Pakistan Margin, trawl samples indicate that the megafaunachanged rapidly with depth across the lower transition zone of theOMZ. However, the rate of change was not as extreme as that seenon the steep slopes of Volcano 7 and some groups, for examplegalatheid decapods, were much less common. The rock outcropsthat provided attachment substrates for solitary coelenterates andsponges on the summit of Volcano 7 were not available for sessileorganisms in our study area.
5.3. Foraminiferan–metazoan interactions
Although foraminiferans are an important component of themeio- and macrofauna in deep-sea and hypoxic settings, theirinteractions with metazoans are rarely examined (Gooday et al.,2001 and references therein). Unlike the metazoan macrofauna,foraminiferans occur across the OMZ on both Arabian Seamargins. Phleger and Soutar (1973) and Bernhard (1992) sug-gested release from macrofaunal predation pressure as one factorpromoting the development of large foraminiferal populations inOMZs. In the Arabian Sea, however, foraminiferal densities werehigh in the upper OMZ core, irrespective of whether themacrofauna were abundant (400 m off Oman) or scarce (300 moff Pakistan). Thus, the presence of macrofauna does not seem tolimit foraminiferal populations in these regions, possibly becausethere is enough food to sustain both faunal components. However,Woulds et al. (2007, 2009) observed a change from domination ofcarbon processing by metazoan macrofauna to domination by theforaminiferal macrofauna at 140 m on the Pakistan Marginbetween the inter- and post-monsoon seasons, corresponding toa 10-fold decline in bottom-water oxygen concentrations. Thisshift suggests the possibility of metazoan–protozoan competitionfor food mediated by oxygen levels.
Only a few metazoans, notably scaphopods and certainisopods, are known to be specialist predators on foraminiferans(Lipps, 1983; Svavarsson et al., 1993; Gudmundsson et al., 2000,2003). Occasional scaphopods, which were usually dead, occurredat 140, 1405–1530 and 1850 m depth; isopods were common onlyat 1850 m (Murty, 2005; Hughes et al., 2009). Thus activemacrofaunal predation on foraminiferans is unlikely to be wide-spread in our study area.
5.4. Edge effects
Mullins et al. (1985) coined the term edge effects for narrowzones with elevated benthic metazoan and foraminiferal abun-dances at the upper (500 m) and lower (1000 m) boundaries of thecentral Californian OMZ. Similar density peaks have been reportedfrom other OMZs (Levin, 2003), including the lower summit ofVolcano 7 (Wishner et al., 1990; Levin et al., 1991a,b). Denseconcentrations of two polychaete species occur at the borderbetween the oxygenated and anoxic/sulphidic parts of the BlackSea (Zaika et al., 1999). These narrow, densely populated bandsreflect an abundant food supply combined with a release fromoxygen limitation (Levin, 2003) and appear to be associated withenhanced biological and biogeochemical activity (Wishner et al.,1995). Woulds et al. (2007) documented enhanced rates of carbonprocessing at the upper and lower transition zones of the PakistanMargin. These benthic edge effects have parallels in the water
column, where zooplankton aggregate and microbial activity iselevated in narrow zones (Wishner et al., 1995, 2000).
Other papers in this volume note the existence of edge effectsamong macrofauna (Levin et al., 2009) and megafauna (Murtyet al., 2009) off Pakistan. A notable feature of these patterns is thatabundance peaks are located at progressively greater depths withincreasing organism size (Fig. 2); �750 m for foraminiferans,850–950 m for macrofauna, and �1000 m for megafauna (ophiur-oids) (Fig. 2). Previous studies have reported that abundancepeaks coincide with lower oxygen concentrations for macrofaunathan for megafauna (Thompson et al., 1985; Wishner et al., 1995;Levin, 2002). Such patterns are consistent with the generallygreater tolerance to hypoxia of foraminiferans than metazoanmacrofauna, which in turn are more tolerant than megafauna(Josefson and Widbom, 1988; Moodley et al., 1997; Levin, 2003).
The rapid changes in megafaunal community compositionacross the lower transition zone, noted above, are probablyanother expression of an edge effect. Some macrofaunal speciesalso had narrow ranges on the Pakistan and Oman margins, forexample, the polychaete Linopherus sp. between 750 and 950 m(Levin et al., 2009), the thyasirid Leptaxinus indusarium between800 and 1000 m (Oliver and Levin, 2006), and the gromiid Gromia
pyriformis around 1000 m depth (Gooday and Bowser, 2005).Interestingly, burrowing anemones were common within anarrow zone on the lower summit of Volcano 7 (Levin et al.,1991a) and in one of the trawl samples taken in the lower part ofthe Pakistan Margin OMZ (878–890 m). Many foraminiferalspecies, however, had much broader bathymetric ranges acrossthe OMZ on the Pakistan Margin. For example, Bulimina exilis
occurs between 500 and 1200 m, Uvigerina peregrina between 500and 1050 m, and Ammodiscus tenuis between 300 and 1000 m(Schumacher et al., 2007).
6. Concluding remarks
To a greater or lesser extent, all groups exhibited depressedspecies diversity within the OMZ core (250–750 m). Abundancetrends across the OMZ, however, differed among faunal groups andthere were also differences in the turnover rate of species withdepth. Macrofaunal and megafaunal animals showed a rapidchange in species composition across the lower part of the OMZwhereas some foraminiferans had fairly broad depth ranges. Basedon these observations, we propose the following zonation schemeto characterise cross-margin biological trends off Pakistan.
(1)
Seasonally hypoxic region (140–250 m; O2 fluctuating from 0.11to 2.05 mL L�1). The fauna comprised diverse, predominantlycalcareous foraminiferans, metazoan macrofauna and mega-fauna. The activity levels of foraminiferans and metazoanmacrofauna switched seasonally.(2)
OMZ core (250–750 m; O2 ¼ 0.10–0.14 mL L�1). Fauna domi-nated by foraminiferans, with macrofaunal metazoans presentbut rare. Calcareous foraminiferans, some of which may beendemic, abundant in the upper part (250–500 m); aggluti-nated foraminiferans become relatively more important in thelower part (500–750 m).(3)
OMZ transition zone (750–1000 m; O2 ¼ 0.12–0.17 mL L�1).Each faunal group showing successively deeper abundancemaxima as a function of size, and with diversity graduallyincreasing. Sediments shift from fully laminated to fullybioturbated. Macrofauna change from being extremely rareat the base of the zone to forming an abundant, low-diversityassemblage followed by a high diversity assemblage. Between�800 and 1100 m, the megafauna undergo similar transitions,with narrow bands of high abundance.
ARTICLE IN PRESS
A.J. Gooday et al. / Deep-Sea Research II 56 (2009) 488–502 501
(4)
OMZ boundary (1000–1300 m; O2 ¼ 0.15–0.50 mL L�1). Sedi-ments fully oxidised and bioturbated. Macrofaunal abundanceand diversity decline from peaks at 950 and 1000 m,respectively.(5)
Beneath the OMZ (1300–1850 m; O2 40.50 mL L�1). Aggluti-nated species dominate protozoan assemblage, gromids fairlycommon, and all metazoan groups exhibit enhanced diversitybut reduced abundances relative to the lower part of the OMZ.Important differences exist between this zonation and thepattern seen on the Oman Margin, notably that metazoanmacrofauna were abundant in the core of the Oman, keymetazoan species were different and the depth of abundancemaxima for each group differed. Many features of the PakistanOMZ resemble those observed across OMZs in other part of theworld, despite important taxonomic differences. However, theextreme rarity off Pakistan of macrofauna between 300 and700 m, and of megafauna between 300 and 900 m, may be acharacteristic of very thick, intense OMZs. We predict that similarpatterns may occur off Mexico and in the Bay of Bengal where1000 m thick OMZs impinge on the continental margin.
Acknowledgements
We thank the Crew and Officers of the R.R.S. Charles Darwin fortheir tireless efforts to facilitate science during CD145,146,150,151. Our thanks also go to Brian Bett, Eric Breuer, OliPeppe, Matt Schwartz and other members of the scientific teamfor their help during these cruises. We are grateful to Mrs. KateDavis, who prepared Figs. 1–4 and to two anonymous reviewersand George Wolff, who made valuable comments on the manu-script. This work was supported by UK Natural EnvironmentResearch Council Grant NER/A/S/2000/01383 (AJG, BJB, GLC, JDG,RJ, KEL, CW) and US National Science Foundation Grant INT02-27511 (to LAL).
References
Altenbach, A.V., 1985. Die Biomasse der benthischen Foraminiferen. Auswertungenvon ‘Meteor’—Expeditionen im Ostlichen Nord\atlantik. Dissertation zurErlangung des Doktorgrades der Mathematisch-NaturwissenschaftlichenFakultat der Christian-Albrechts-Universitat zu Kiel, 167pp.
Aranda da Silva, A., 2005. Benthic Protozoa community attributes in relation toenvironmental gradients in the Arabian Sea. Ph.D Thesis, University ofSouthampton, unpublished.
Aranda da Silva, A.A.S., Gooday, A.J., 2009. Large organic-walled Protista (Gromia)in the Arabian Sea: density, diversity, distribution and ecology. Deep-SeaResearch II, this issue [doi:10.1016/j.dsr2.2008.12.027].
Arnold, Z.M., 1972. Observations on the biology of the protozoan Gromia oviformisDujardin. University of California Publications in Zoology 100, 1–168.
Banse, K., McClain, C.R., 1986. Winter blooms of phytoplankton in the Arabian Seaas observed by the Coastal Zone Color Scanner. Marine Ecology—ProgressSeries 34, 201–211.
Barnett, P.R.O., Watson, J., Connelly, D., 1984. A multiple corer for taking virtuallyundisturbed samples from shelf, bathyal and abyssal sediments. OceanologicaActa 7, 399–408.
Bernhard, J.M., 1992. Benthic foraminiferal distribution and biomass related topore-water oxygen content: central California continental slope and rise.Deep-Sea Research I 39, 585–605.
Bernhard, J.M., Sen Gupta, B.K., 1999. Foraminifera in oxygen-depleted environ-ments. In: Sen Gupta, B.K. (Ed.), Modern Foraminifera. Kluwer AcademicPublishers, Dordrecht, Boston, London, pp. 201–206.
Bernhard, J.M., Habura, A., Bowser, S.S., 2006. An endobiont-bearing allogromiidfrom the Santa Barbara Basin: implications for early diversification offoraminifera. Journal of Geophysical Research 111 (G03002), 1–10.
Bett, B.J., 2003a. RRS Charles Darwin Cruise 145: 12 Mar–09 Apr 2003. Benthicecology and biogeochemistry of the Pakistan Margin. Southampton Oceano-graphy Centre Cruise Report no. 50, 159pp.
Bett, B.J., 2003b. RRS Charles Darwin Cruise 150: 22 Aug–15 Sep 2003. Benthicecology and biogeochemistry of the Pakistan Margin. Southampton Oceano-graphy Centre Cruise Report no. 51, 144pp.
Bowser, S.S., Marko, M., Bernhard, J.M., 1996. Occurrence of Gromia oviformis inMcMurdo Sound. Antarctic Journal of the United States 31, 122–124.
Brand, T.D., Griffiths, C., 2009. Seasonality in the hydrography and biogeochemistryacross the Pakistan margin of the NW Arabian Sea. Deep-Sea Research II 56,283–295.
Breuer, E., Law, G., Woulds, C., Cowie, G.L., Peppe, O., Schwartz, M., Shimmield, G.,McKinlay, S., 2009. Sedimentary oxygen consumption and microdistribution atsites across the Arabian Sea Oxygen Minimum Zone (Pakistan Margin). Deep-Sea Research II 56, 296–304.
Burkill, P.H., Mantoura, R.F.C., Owens, N.J.P., 1993. Biogeochemical cycling in thenorthwestern Indian Ocean: a brief overview. Deep-Sea Research II 40,643–649.
Cedhagen, T., 1993. Taxonomy and biology of Pelosina arborescens with comparativenotes on Astrorhiza limicola (Foraminifera). Ophelia 37, 143–162.
Cowie, G., 2003a. RRS Charles Darwin Cruise 146: 12 April–30 May 2003. Benthicecology and biogeochemistry of the Pakistan Margin. University of Edinburgh,Cruise report, pp. 1–124
Cowie, G., 2003b. RRS Charles Darwin Cruise 151: 15 September–20 October 2003.Benthic ecology and biogeochemistry of the Pakistan Margin. University ofEdinburgh, Cruise Report, pp. 1–123
Cowie, G.L., Levin, L.A., 2009. Benthic biological and biogeochemical patterns andprocesses across an oxygen minimum zone (Pakistan Margin, NE Arabian Sea).Deep-Sea Research II 56, 261–270.
Fisher, R.A., Corbert, A.S., Williams, C.B., 1943. The relationship between thenumber of species and the number of individuals in a random sample of ananimal population. Journal of Animal Ecology 12, 42–58.
Gage, J.D., 1995. Benthic community and fluxes in relation to the oxygen minimumzone in the Arabian Sea, Cruise Report: R.R.S. Discovery 211/94 9thOctober–11th November 1994. Scottish Association for Marine Science,Dunstaffnage Marine Laboratory, Oban, Scotland, 71pp.
Gage, J.D., Tyler, P.A., 1991. Deep-Sea Biology: A Natural History of Organisms at theDeep-Sea Floor. Cambridge University Press, Cambridge, New York, PortChester, Melbourne, Sydney, 504 pp.
Gage, J.D., Levin, L.A., Wolff, G.A., 2000. Benthic processes in the deep Arabian Sea:introduction and overview. Deep-Sea Research II 47, 1–7.
Gallardo, V.A., Palma, M., Carrasco, F.D., Gutierres, D., Levin, L.A., Canete, J.I., 2004.Macrobenthic zonation caused by the oxygen minimum zone on the shelf andslope off central Chile. Deep-Sea Research II 51, 2475–2490.
Giere, O., Krieger, J., 2001. A triple bacterial endosymbiosis in a gutless oligochaete(Annelida): ultrastructural and immunocytochemical evidence. InvertebrateBiology 120, 41–49.
Gooday, A.J., Bowser, S.S., 2005. The second species of Gromia (Protista) from thedeep sea: its natural history and association with the Pakistan Margin oxygenminimum zone. Protist 156, 113–126.
Gooday, A.J., Bernhard, J.M., Levin, L.A., Suhr, L.A., 2000. Foraminifera in the ArabianSea oxygen minimum zone and other oxygen deficient settings: taxonomiccomposition, diversity, and the relation to metazoan faunas. Deep-SeaResearch II 47, 25–54.
Gooday, A.J., Hughes, J.A., Levin, L.A., 2001. The foraminiferan macrofauna fromthree North Carolina (USA) slope sites with contrasting carbon flux: acomparison with metazoan macrofauna. Deep-Sea Research I 48, 1709–1739.
Gooday, A.J., Nomaki, H., Kitazato, H., 2009. Modern deep-sea benthic foraminifera:a brief review of their biodiversity and trophic diversity. In: Austin, W.E.N.,James, R.H. (Eds.), Biogeochemical Controls on Palaeoceanographic Environ-mental Proxies. Geological Society, London, Special Publications, 303,pp. 97–119.
Gudmundsson, G., von Schmalensee, M., Svavarsson, J., 2000. Are foraminifers(Protozoa) important food for small isopods (Crustacea) in the deep sea? Deep-Sea Research I 47, 2093–2109.
Gudmundsson, G., Engelstad, K., Steiner, G., Svavarsson, J., 2003. Diets of four deep-water scaphopod species (Mollusca) in the North Atlantic and the Nordic seas.Marine Biology 142, 1103–1112.
Helly, J.J., Levin, L.A., 2004. Global distribution of naturally occurring marinehypoxia on continental margins. Deep-Sea Research I 51, 1159–1168.
Hughes, D.J., Levin, L.A., Lamont, P.A., Packer, M., Gage, J.D., 2009. Macrofaunalcommunities and sediment structure across the Pakistan Margin oxygenminimum zone, north-east Arabian Sea. Deep-Sea Research II 56, 434–448.
Hurlbert, S.H., 1971. The non-concept of species diversity: a critique and alternativeparameters. Ecology 52, 577–586.
Jacobs, C.L., 2003. RRS Charles Darwin Cruise 143, 22 Nov–01 Dec 2002.SCHEHEREZADE II: Geological and biological surveys of the Arabian Sea andthe continental slope of Oman. Southampton Oceanography Centre CruiseReport, no 42, 79pp.
Josefson, A.B., Widbom, B., 1988. Differential response of benthic macrofauna andmeiofauna to hypoxia in the Gullmar-Fjord basin. Marine Biology 100, 31–40.
Katz, S., Cavanaugh, C.M., Bright, M., 2006. Symbiosis of epi- and endocuticularbacteria with Helicoradomenia spp. (Mollusca, Aplacophora, Solenogastres)from deep-sea hydrothermal vents. Marine Ecology Progress Series 320, 89–99.
Kurbjeweit, F., Hemleben, C.H., Schmiedl, G., Schiebel, R., Pfannkuche, O.,Wallmann, K., Schafer, P., 2000. Distribution, biomass and diversity of benthicforaminifera in relation to sediment geochemistry in the Arabian Sea. Deep-Sea Research II 47, 2913–2955.
Larkin, K.E., 2006. Community and trophic responses of benthic foraminifera tooxygen gradients and organic enrichment. Ph.D. Thesis, University of South-ampton, unpublished.
Larkin, K.E., Gooday, A.J., 2009. Foraminiferal faunal responses to monsoon-drivenchanges in organc matter and oxygen availability at 140 m and 300 m waterdepth in the NE Arabian Sea. Deep-Sea Research II 56, 403–421.

ARTICLE IN PRESS
A.J. Gooday et al. / Deep-Sea Research II 56 (2009) 488–502502
Law, G.T.W., Shimmield, T.M., Shimmield, G.B., Cowie, G.L., Breuer, E.R., Harvey,S.M., 2009. Manganese, iron and sulphur cycling on the Pakistan Margin. Deep-Sea Research II 56, 305–323.
Levin, L.A., 2002. Deep-ocean life where oxygen is scarce. American Scientist 90,436–444.
Levin, L.A., 2003. Oxygen minimum zone benthos: adaptation and communityresponse to hypoxia. Oceanography and Marine Biology: An Annual Review 41,1–45.
Levin, L.A., Edessa, S., 1997. The ecology of cirratulid mudballs on the OmanMargin, northwestern Arabian Sea. Marine Biology 128, 671–678.
Levin, L.A., Gage, J.D., 1998. Relationships between oxygen, organic matter and thediversity of bathyal macrofauna. Deep-Sea Research II 45, 129–163.
Levin, L.A., Huggett, C.L., Wishner, K.F., 1991a. Control of deep-sea benthiccommunity structure by oxygen and organic matter gradients in the easternPacific Ocean. Journal of Marine Research 49, 763–800.
Levin, L.A., McCann, L.D., Thomas, C.L., 1991b. The ecology of polychaetes on deepseamounts in the eastern Pacific Ocean. Ophelia Supplementary 5, 467–476.
Levin, L.A., Childers, S., Smith, C.R., 1991c. Epibenthic, agglutinating foraminiferansin the Santa Catalina Basin and their response to disturbance. Deep-SeaReserach 38, 465–483.
Levin, L.A., Gage, J.D., Lamont, P., Cammidge, L., Martin, C., Patience, A., Crooks, J.,1997. Infaunal community structure in a low-oxygen organic rich habitat onthe Oman continental slope, NW Arabian Sea. In: Hawkins, L., Hutchinson, S.(Eds.), Responses of Marine Organisms to their Environments. Proceedings ofthe 30th European Marine Biology Symposium. University of Southampton,pp. 223–230.
Levin, L.A., Gage, J.D., Martin, C., Lamont, P.A., 2000. Macrobenthic communitystructure within and beneath the oxygen minimum zone, NW Arabian Sea.Deep-Sea Research II 47, 189–226.
Levin, L.A., Rathburn, A.E., Neira, C., Sellanes, J., Munoz, P., Gallardo, V., Salamanca,M., 2002. Benthic processes on the Peru Margin: a transect across the oxygenminimum zone during the 1997–1998 El Nino. Progress in Oceanography 53,1–27.
Levin, L.A., Rathburn, A.E., Gutierrez, D., Munoz, P., Shankle, A., 2003. Bioturbationby symbiont-bearing annelids in near-anoxic sediments: implications forbiofacies models and paleo-oxygen assessments. Palaeogeography, Palaeocli-matology, Palaeoecology 199, 129–140.
Levin, L.A., Whitcraft, C.R., Mendoza, G.F., Gonzalez, J.P., Cowie, G.L., 2009. Oxygenand organic matter thresholds for benthic faunal activity on the PakistanMargin oxygen minimum zone (700–1100 m). Deep-Sea Research II 56,449–471.
Lipps, J.H., 1983. Biotic interactions in benthic foraminifera. In: Tervesz, M.J.S.,McCall, P.L. (Eds.), Biotic Interactions in Recent and Fossil Benthic Commu-nities. Plenum Press, New York, pp. 331–376.
Moodley, L., Van der Zwaan, G.J., Herman, P.M.J., Kempers, L., Van Breugel, P., 1997.Differential response of benthic meiofauna to anoxia with special reference toForaminifera (Protista: Sarcodina). Marine Ecology Progress Series 158,151–163.
Mullins, H.T., Thompson, J.B., McDougall, K., Vercoutere, T.L., 1985. Oxygen-minimum zone edge effects: evidence from the central California coastalupwelling system. Geology 13, 491–494.
Murty, S.J., 2005. Faunal responses to strong oxygen gradients in the Arabian Sea.M.Sc. Thesis, University of Southampton, unpublished.
Murty, S.J., Bett, B.J., Gooday, A.J., 2009. Megafaunal responses to strong oxygengradients on the Pakistan Margin of the Arabian Sea. Deep-Sea Research II 56,472–487.
Nair, R.R., Ittekkot, V., Manganini, S.J., Ramaswamy, V., Haake, B., Degens, B.N.,Desai, B.N., Honjo, S., 1989. Increased particle flux to the deep ocean related tomonsoons. Nature 338, 749–751.
Nienstedt, J.C., Arnold, A.J., 1988. The distribution of benthic foraminifera onseamounts near the East Pacific Rise. Journal of Foraminiferal Research 18,237–249.
Oliver, P.G., 2001. Functional morphology and description of a new species ofAmygdalum (Mytiloidea) from the oxygen minimum zone of the Arabian Sea.Journal of Molluscan Studies 67, 225–241.
Oliver, P.G., Levin, L., 2006. A new species of the family Thyasiridae (Mollusca:Bivalvia) from the oxygen minimum zone of the Pakistan Margin. Journal of theMarine Biological Association of the United Kingdom 86, 411–416.
Phleger, F.B., Soutar, A., 1973. Production of benthic foraminifera in three eastPacific oxygen minima. Micropaleontology 19, 110–115.
Ramirez-Llodra, E., Olabarria, C., 2005. Aspects of the distribution, populationstructure and reproduction of the gastropod Tibia delicatula (Nevill, 1881)inhabiting the oxygen minimum zone of the Oman and Pakistan Margins.Journal of Sea Research 54, 299–306.
Resig, J.M., Glenn, C.R., 1997. Foraminifera encrusting phosphoritic hardgrounds ofthe Peruvian upwelling zone: taxonomy, geochemistry, and distribution.Journal of Foraminiferal Research 27, 133–150.
Rogers, A.D., 2000. The role of oceanic oxygen minima in generating biodiversity inthe deep sea. Deep-Sea Research II 47, 119–148.
Rowe, G.T., 1983. Biomass and production of deep-sea macrobenthos. In: Rowe, G.T.(Ed.), The Sea, vol. 8. Wiley-Interscience, New York, pp. 97–121.
Sanders, H., 1969. Benthic marine diversity and the stability-time hypothesis.Brookhaven Symposium in Biology 22, 71–81.
Schumacher, S., Jorissen, F.J., Dissard, D., Larkin, K.E., Gooday, A.J., 2007. Live (RoseBengal stained) and dead benthic foraminifera from the oxygen minimum zoneof the Pakistan continental margin (Arabian Sea). Marine Micropaleontology62, 45–73.
Schwartz, M.C., Woulds, C., Cowie, G.L., 2009. Sedimentary denitrification ratesacross the Arabian Sea oxygen minimum zone. Deep-Sea Research II 56,324–332.
Sen Gupta, B.K., Machain-Castillo, M.L., 1993. Benthic foraminifera in oxygen-poorhabitats. Marine Micropaleontology 20, 183–201.
Shannon, C.E., Weaver, W., 1963. The Mathematical Theory of Communication.University of Illinois Press, Urbana, 117pp.
Smallwood, B.J., Wolff, G.A., Bett, B.J., Smith, C.R., Hoover, D., Gage, J.D., Patience, A.,1999. Megafauna can control the quality of organic matter in marinesediments. Naturwissenschaften 86, 320–324.
Smith, C.R., Levin, L.A., Hoover, D.J., McMurty, G., 2000. Variations in bioturbationacross the oxygen minimum zone in the northwest Arabian Sea. Deep-SeaResearch II 47, 227–257.
Svavarsson, J., Gudmundsson, G., Brattegard, T., 1993. Feeding by asellote isopods(Crustacea) on foraminifers (Protozoa) in the deep sea. Deep-Sea Research I 40,1225–1239.
Thistle, D., 1979. Harpacticoid copepods and biogenic structures: implications fordeep-sea diversity maintenance. In: Livingstone, R.L. (Ed.), Ecological Processesin Coastal and Marine Systems. Plenum, New York, pp. 217–231.
Thompson, J.B., Mullins, H.T., Newton, C.R., Vercoutere, T., 1985. Alternativebiofacies model for dysaerobic communities. Lethaia 18, 167–179.
Wishner, K.F., Levin, L.A., Gowing, M., Mullineaux, L., 1990. Involvement of theoxygen minimum zone in benthic zonation on a deep seamount. Nature 346,57–59.
Wishner, K.F., Ashijan, C.J., Gelfman, C., Gowing, M., Kann, L., Levin, L.A.,Mullineaux, L., Saltzman, J., 1995. Pelagic and benthic ecology of the lowerinterface of the Eastern Tropical Pacific oxygen minimum zone. Deep-SeaResearch I 42, 93–115.
Wishner, K.F., Gowing, M.M., Gelfman, C., 2000. Living in suboxia: ecology of anArabian Sea oxygen minimum zone copepod. Limnology and Oceanography 45,1576–1593.
Woulds, C., Cowie, G.L., 2009. Sedimentary pigments on the Pakistan margin:controlling factors and organic matter dynamics. Deep-Sea Research II 56,347–357.
Woulds, C., Cowie, G.L., Levin, L.A., Andersson, J.H., Middelburg, J.J., Vandewiele, S.,Lamont, P.A., Larkin, K.E., Gooday, A.J., Schumacher, S., Whitcraft, C., Jeffreys, R.,Schwartz, M., 2007. Oxygen as a control on sea floor biological communitiesand their role in sedimentary carbon cycling. Limnology and Oceanography 52,1698–1709.
Woulds, C., Andersson, J.H., Cowie, G.L., Middelburg, J.J., Levin, L.A., 2009.The short-term fate of organic carbon in marine sediments: comparing thePakistan margin to other regions. Deep-Sea Research II 56, 393–402.
Zaika, V.C., Sergeeva, N.G., Kiseleva, M.I., 1999. Two polychaete species borderingdeep anoxic waters in the Black Sea. Tavricheskiy Mediko-BiologicheskiyVestnik 99 (1–2), 56–60.