fatigue risk assessment of aircraft maintenance tasks · pdf file ·...
TRANSCRIPT

Fatigue Risk Assessment of Aircraft Maintenance Tasks
Prepared for
Transportation Development Centre
Safety and Security Transport Canada
By
Rhodes & Associates Inc.
HUMAN FACTORS CONSULTANTS
September 2003
TP 14169E


Fatigue Risk Assessment of Aircraft Maintenance Tasks
by
Wayne Rhodes Roger Lounsbury
Kyla Steele Nooreen Ladha
Rhodes & Associates Inc.
HUMAN FACTORS CONSULTANTS
September 2003
TP 14169E

ii
This report reflects the views of the authors and not necessarily those of the Transportation Development Centre or the Aircraft Maintenance and Manufacturing Directorate of Transport Canada.
Project Team Wayne Rhodes, Ph.D., C.P.E.
President, Rhodes & Associates Inc., Toronto, Ontario, Canada
Senior Human Factors Expert and Project Manager
Roger Lounsbury, B.A.Sc. (Mech. Eng.)
President, Suretech Development Limited, Deep River, Ontario, Canada
Senior Reliability Expert
Kyla Steele, B.A.Sc. (Aero. Eng.)
Consultant
Aviation Human Factors Specialist
Nooreen Ladha, M.Sc. (Human Factors)
Consultant
Systems Human Factors Specialist
Un sommaire français se trouve avant le table des matières.

Transport Canada
Transports Canada PUBLICATION DATA FORM
1. Transport Canada Publication No.
TP 14169E 2. Project No.
5273 3. Recipient’s Catalogue No.
4. Title and Subtitle
5. Publication Date
September 2003
6. Performing Organization Document No.
7. Author(s)
W. Rhodes, R. Lounsbury, K. Steele, and N. Ladha 8. Transport Canada File No.
T8200-2-2509
9. Performing Organization Name and Address 10. PWGSC File No.
MTB-2-00590
11. PWGSC or Transport Canada Contract No.
T8200-022509/001/MTB
12. Sponsoring Agency Name and Address 13. Type of Publication and Period Covered
Final
14. Project Officer
H. Posluns
15. Supplementary Notes (Funding programs, titles of related publications, etc.)
Co-sponsored by the Aircraft Maintenance and Manufacturing Branch of Transport Canada’s Civil Aviation Directorate
16. Abstract
17. Key Words
Risk assessment, fatigue, aircraft maintenance 18. Distribution Statement
Limited number of copies available from the Transportation Development Centre
19. Security Classification (of this publication)
Unclassified
20. Security Classification (of this page)
Unclassified
21. Declassification (date)
—
22. No. of Pages
xxiv, 90, apps
23. Price
Shipping/ Handling
CDT/TDC 79-005 Rev. 96 iii
Fatigue Risk Assessment of Aircraft Maintenance Tasks
Rhodes & Associates Inc. 177 Jenny Wrenway Toronto, Ontario M2H 2Z3
Transportation Development Centre (TDC) 800 René Lévesque Blvd. West Suite 600 Montreal, Quebec H3B 1X9
Transport Canada responded to the question raised during Canadian Aviation Regulation Advisory Council(CARAC) meetings as to whether fatigue was an issue in aircraft maintenance operations. A first phaseinvestigated the number and timing of hours worked by aircraft maintenance engineers (AMEs). The presentresearch represents a follow-on phase 2 that investigated the potential risk that fatigue may pose to aircraft maintenance tasks. The phase 2 work consisted of a task analysis, human error analysis and fatigue-risk assessment. The results show that highly cognitive tasks and their associated errors pose the greatest risk, andthat the level of risk posed by tasks performed by personnel who are fatigued is ten times that of the same taskscarried out by well-rested personnel.

Transports Canada
Transport Canada FORMULE DE DONNÉES POUR PUBLICATION
1. No de la publication de Transports Canada
TP 14169E 2. No de l’étude
5273 3. No de catalogue du destinataire
4. Titre et sous-titre
5. Date de la publication
Septembre 2003
6. No de document de l’organisme exécutant
7. Auteur(s)
W. Rhodes, R. Lounsbury, K. Steele et N. Ladha 8. No de dossier - Transports Canada
T8200-2-2509
9. Nom et adresse de l’organisme exécutant 10. No de dossier - TPSGC
MTB-2-00590
11. No de contrat - TPSGC ou Transports Canada
T8200-022509/001/MTB
12. Nom et adresse de l’organisme parrain 13. Genre de publication et période visée
Final
14. Agent de projet
H. Posluns
15. Remarques additionnelles (programmes de financement, titres de publications connexes, etc.)
Coparrainé par la Direction de la maintenance et de la construction des aéronefs de la Direction générale de l’aviation civile de Transports Canada
16. Résumé
17. Mots clés
Évaluation du risque, fatigue, entretien d’aéronefs 18. Diffusion
Le Centre de développement des transports dispose d’un nombre limité d’exemplaires.
19. Classification de sécurité (de cette publication)
Non classifiée
20. Classification de sécurité (de cette page)
Non classifiée
21. Déclassification (date)
—
22. Nombre de pages
xxiv, 90, ann.
23. Prix
Port et manutention
CDT/TDC 79-005 Rev. 96 iv
Fatigue Risk Assessment of Aircraft Maintenance Tasks
Rhodes & Associates Inc. 177 Jenny Wrenway Toronto, Ontario M2H 2Z3
Centre de développement des transports (CDT) 800, boul. René-Lévesque Ouest Bureau 600 Montréal (Québec) H3B 1X9
Transports Canada a répondu à la question qui avait été soulevée lors de réunions du Conseil consultatif sur laréglementation aérienne canadienne (CCRAC), à savoir si la fatigue fait problème dans le secteur de l’entretiendes aéronefs. Une première phase a porté sur le nombre et la répartition des heures de travail des techniciensd’entretien d’aéronefs (TEA). La présente recherche constitue la deuxième phase du projet. Elle porte plus précisément sur le risque de fatigue associé aux tâches d’entretien d’aéronefs. Les chercheurs ont effectué uneanalyse des tâches, une analyse des erreurs humaines et une évaluation du risque associé à la fatigue. Leurs résultats révèlent que ce sont les tâches à forte teneur cognitive, et les erreurs qui y sont associées, quireprésentent le plus grand risque, et que le niveau de risque associé à une tâche exécutée par un employéfatigué est dix fois plus élevé que lorsque la même tâche est exécutée par un employé reposé.

v
Acknowledgements We are very grateful to all of the people who helped with this project. The work required access to aircraft maintenance facilities and personnel, and their valuable time. Individuals in Transport Canada provided critical information and answered many questions posed by the researchers. The review process for this sizable report was lengthy and required perseverance. The reviewers included Transport Canada and Transportation Development Centre staff. Without the dedicated help of these individuals the project would not have been possible:
Transport Canada We thank Dr. Isabelle Marcil, senior ergonomist at the Transportation Development Centre, for her knowledgeable technical help and guidance throughout the project.
We thank Ms. Jacqueline Booth-Bourdeau, Chief, Technical and National Programs Aircraft Maintenance and Manufacturing - AARPF, whose vision has resulted in a greater understanding of the impact of fatigue on Canadian aircraft maintenance personnel and its potential for risk in aviation operations.
Scott Stewart and Mike Bird, senior aircraft maintenance inspectors for the Ontario Region graciously provided practical feedback on scenarios and events that can lead to disastrous outcomes. We thank them for their valuable expert advice.
Aircraft Maintenance Facilities Of course, we are especially indebted to the aircraft maintenance personnel and their supervisors and managers for their patience, time and enthusiasm for the project. They allowed us to observe their activities, provided us vital information and helped our research team gain a deeper understanding of their work in a very short time span. Their interest in safety and the effects of fatigue is commendable and indicates that with proper development and implementation, fatigue management strategies are likely to be successful.
Aircraft Engine Manufacturer One of the authors (Kyla Steele) has a background in aircraft engine design and testing, and arranged to discuss the scenarios with Robert Daukant, an expert in the maintenance aspects of the design and performance of turbo fan engines. We are grateful for the highly relevant and useful material that Mr. Daukant provided to our research team.

vi

vii
Executive Summary
Introduction This research is Phase 2 of a project that examined the hours of work and potential for fatigue occurring in Canadian aircraft maintenance operations. Phase 1 involved a nation-wide survey of Canadian aircraft maintenance engineers (AMEs) and investigated the number and distribution of hours that AMEs worked (TP 13875E). Phase 2 (the present study) was carried out to determine the potential impact that fatigue may have on aircraft maintenance tasks and the resulting potential for safety risk. The study examined the cognitive and physical components of aircraft maintenance tasks, their susceptibility to the effects of fatigue, and the potential relative risk that fatigue poses to system safety.
Methodology The study methodology involved the following approaches:
• Review of literature pertaining to the impact of fatigue on cognitive and physical tasks;
• Review and analysis of aircraft maintenance tasks; • Analysis of potential error modes in aircraft maintenance tasks; and • Assessment of the relative risk of fatigue on aircraft maintenance operations.
Study Group Demographics The task data were collected at the maintenance facilities of a major airline company. The observations and interviews were conducted with the following personnel:
• Nine aircraft maintenance engineers; • Twenty-four aircraft technicians; and • Twelve apprentices.
Study Findings The findings of the research are as follows:
Task Analysis Results
• The following task groupings were identified, based on feedback from Transport Canada’s subject matter experts, observations and the work of Hobbs and Williamson (2002):
o Inspection: inspection of components, airframe, surfaces o Job Planning: planning and preparation for the job o Troubleshooting: troubleshooting problems with components and structures o Disassembly/Reassembly: replacement of structures and components o Repair: repair of components and structures o Calibration: calibration of on-board equipment o Testing: testing of aircraft systems and components

viii
o Documentation: documenting work done and recommendations for follow-up work etc.
o Supervision: supervision of other aircraft maintenance personnel o Training: training of other aircraft maintenance personnel o Lubrication: lubricating components, topping up and replacing fluids o Communications With Other Trades: communications with other aircraft
maintenance personnel, pilots, cabin crew, and management o Cleaning: cleaning components, surfaces o Operating Hoist Equipment: operating hoist equipment o Operating Transport Equipment: operating transport equipment
• Cognitive and physical task components for all task groupings were identified using information from Drury et al. (1990) and observation of aircraft maintenance jobs;
• Cognitive task components are affected by fatigue more than physical ones, the most susceptible being decision making, working memory, attention, information processing, and communications;
• Tasks involving the task groupings planning, documenting, communicating, training, supervision, troubleshooting, testing, and inspection are more severely affected by fatigue than disassembly-reassembly, cleaning, repairing, and machine operation; and
• The task groupings that are most susceptible to fatigue are also the ones that may pose the highest fatigue risk to the air transportation system, based on the percent increase in probability of error due to fatigue.
Relative Fatigue Risk Analysis Results
• Risk ratios for events in which fatigue is present to those where it is not can range from 82: 1 to 2:1 for each scenario, with an average range of ratios from 19:1 to 4:1 for all scenarios combined; and
• Overall ratio of risk to the aircraft maintenance system of those working in a fatigued state compared to those working in a rested state is 10:1.
Conclusions The study shows that certain parts of aircraft maintenance jobs are more susceptible to the effects of fatigue, while others are less affected. The estimated relative risk of fatigue in aircraft maintenance operations may be high enough to warrant consideration of fatigue management strategies and training for all maintenance personnel, schedulers, management and those responsible for parts provisioning. Strategies for reducing fatigue should be found, given the potential outcomes. Other considerations include scheduling certain jobs to coincide better with the time of day and shift effects of the circadian rhythm (e.g. do planning when personnel are fresh, keep numbers of apprentices at a minimum on the night shift, using more experienced personnel during this time of day; and avoid scheduling tricky troubleshooting jobs between 03:00 and 06:00). Although reassembly errors have been shown to constitute the majority of maintenance errors (Hobbs and Williamson, 2002; Reason and Hobbs, 2003), many initiating errors stem from planning, inspection, documenting, communicating, and supervising, which occur at the beginning and during the reassembly process. These initiating errors increase the likelihood of making memory and perceptual-based errors during reassembly.

ix
Strategies to Reduce Fatigue The following fatigue reduction strategies are based on the results of the task analysis and fatigue risk assessment:
• Consider the task groupings involved in a particular job when scheduling work – those with a high expected contribution of complex cognitive activities should be planned for a time when personnel are expected to be more alert and an adequate number of experienced personnel are available;
• Ensure that personnel have the opportunity for adequate rest between shifts and during days off – discourage personnel from using too many rest days to work overtime, and ensure that shift length is rarely over 12 hours;
• Evaluate shift rotation schemes to take maximum advantage of the biological rhythms of maintenance personnel, taking into account previous rest opportunities and the time of day;
• Examine the existing procedures for the shift changeover and identify ways to improve them so that tired personnel ending a shift can remember key points to pass on to the fresh crew. The in-coming crew must also be prepared to ask the right questions to ensure that all critical information is conveyed or recorded;
• Educate personnel (including maintenance personnel, management and support staff such as personnel schedulers, parts and stores clerks etc.) about fatigue management;
• Investigate whether it is more effective to have staff record results, observations and other maintenance documentation as they progress through the maintenance rather than waiting until task completion (when they are more fatigued);
• Consider developing and implementing a confidential error reporting system (CERS); • Consider analysis of the error data related to fatigue as collected over the first one or
two years of operation of the CERS; and • Consider investigating the feasibility of job scheduling and team composition as
effective countermeasures to reduce the impact of fatigue on system safety.

x

xi
Sommaire
Introduction La présente étude constitue la phase 2 d’un projet portant sur les heures de travail et le risque de fatigue dans le secteur canadien de l’entretien des aéronefs. La phase 1 avait consisté en un sondage pancanadien auprès de techniciens d’entretien d’aéronefs (TEA), le but de ce sondage étant de mieux connaître le nombre et la répartition de leurs heures de travail (TP 13875E). La phase 2 (la présente étude) visait à déterminer les effets possibles de la fatigue sur les tâches d’entretien des aéronefs et, le cas échéant, ses répercussions sur la sûreté des opérations aériennes. L’étude a porté sur les composantes cognitives et physiques des tâches d’entretien d’aéronefs, sur leur sensibilité aux effets de la fatigue et sur le risque relatif que représente la fatigue pour la sûreté du système de transport aérien.
Méthodologie Voici les principales étapes de l’étude :
• Recherche documentaire sur les effets de la fatigue sur les activités cognitives et physiques;
• Revue et analyse des tâches d’entretien d’aéronefs; • Analyse des types d’erreurs pouvant être commises lors des travaux d’entretien
d’aéronefs; • Évaluation du risque relatif associé à la fatigue dans le secteur de l’entretien
d’aéronefs.
Données sur le groupe échantillon Les données sur les tâches ont été colligées auprès des ateliers d’entretien d’une grande compagnie aérienne. Les séances d’observation et les entrevues ont été menées avec les groupes suivants d’employés :
• neuf techniciens d’entretien d’aéronefs; • vingt-quatre techniciens/mécaniciens d’aéronefs; • douze apprentis.
Résultats Voici les résultats obtenus :
Analyse des tâches
• À la lumière des commentaires de spécialistes de Transports Canada, des observations effectuées et des travaux de Hobbs and Williamson (2002), il a été décidé de regrouper les tâches comme suit :
o Inspection : inspection des composants, de la cellule et des surfaces d’un aéronef
o Planification : planification du travail et tâches préliminaires

xii
o Diagnostic : diagnostic de défaillances mettant en cause des composants et des structures d’aéronef
o Démontage/remontage : remplacement de composants et de structures d’aéronef
o Réparation : réparation de structures et de composants d’aéronef o Étalonnage : étalonnage de matériel embarqué o Vérification/essai : vérification/essai de systèmes et de composants d’aéronef o Documentation : établissement de documents pour attester le travail effectué
et recommander des mesures de suivi, etc. o Supervision : supervision d’autres employés d’entretien d’aéronefs o Formation : formation d’autres employés d’entretien d’aéronefs o Lubrification : lubrification de composants, remplissage et vidange de
réservoirs o Communication avec d’autres corps de métier : communication avec
d’autres employés d’entretien d’aéronefs, des pilotes, des membres du personnel de cabine et des gestionnaires
o Nettoyage : nettoyage de composants et de surfaces d’aéronefs o Conduite d’appareils de levage : manœuvre/conduite d’appareils de levage o Conduite de matériel de transport : manœuvre/conduite de matériel de
transport • Un inventaire a été fait des tâches cognitives et tâches physiques comprises dans
chaque groupe de tâches, d’après l’information tirée du rapport de Drury et coll. (1990) et celle colligée au cours des séances d’observation.
• Les activités cognitives sont davantage sensibles à la fatigue que les activités physiques; les plus sensibles sont la prise de décision, la mémoire opérationnelle, l’attention, le traitement de l’information et la communication.
• La fatigue a plus de prise sur les tâches de planification, de documentation, de communication, de formation, de supervision, de diagnostic, de vérification/essai et d’inspection que sur les tâches de démontage-remontage, de nettoyage, de réparation et de conduite de machines.
• Les groupes de tâches les plus sensibles à la fatigue sont aussi les groupes susceptibles de représenter le plus grand risque pour le système de transport aérien, compte tenu de l’augmentation en pourcentage de la probabilité d’erreur due à la fatigue qui leur est associée.
Analyse du risque relatif associé à la fatigue
• Les ratios de risque relatif (importance du risque associé à un événement où la fatigue intervient comparativement au même événement où la fatigue n’intervient pas) vont de 82 à 2 pour chacun des scénarios considérés, la plage moyenne se situant entre 19 et 4 pour tous les scénarios combinés.
• Globalement, le ratio de risque relatif que présentent, pour le système d’entretien des aéronefs, des techniciens fatigués comparativement à des techniciens reposés est de 10.

xiii
Conclusions L’étude révèle que certaines des tâches d’entretien d’aéronefs sont plus sensibles aux effets de la fatigue que d’autres. Le risque relatif estimatif associé à la fatigue dans le secteur de l’entretien des aéronefs est assez élevé pour justifier l’instauration de stratégies de gestion de la fatigue et de programmes de formation pour tous les employés d’entretien, les préposés à la confection des horaires, les gestionnaires et les responsables de l’approvisionnement en pièces. Il importe avant tout de définir des stratégies pour atténuer la fatigue, étant donné ses répercussions possibles. D’autres avenues de solution existent aussi, comme programmer certaines tâches aux moments de la journée où le rythme circadien est le plus favorable (p. ex., faire en sorte que les tâches de planification soient effectuées par des employés encore frais et dispos; affecter le minimum d’apprentis aux équipes de nuit, leur préférant des employés d’expérience; et éviter de programmer des tâches complexes de diagnostic pendant la période de 3 h à 6 h). Certaines études ont révélé que les erreurs de remontage constituent la majorité des erreurs d’entretien (Hobbs et Williamson, 2002; Reason et Hobbs, 2003). Mais souvent, l’erreur de départ a eu lieu lors de la planification, de l’inspection, de la documentation, de la communication et de la supervision, toutes des tâches qui sont exécutées au début et pendant le remontage. Des erreurs dans ces tâches accentuent la probabilité d’erreurs de mémoire et de perception au cours du remontage.
Stratégies d’atténuation de la fatigue Les résultats de l’analyse des tâches et de l’évaluation du risque de fatigue ont mené aux stratégies suivantes d’atténuation de la fatigue :
• Au moment de l’ordonnancement du travail, tenir compte des types de tâches associées à un travail particulier – programmer les tâches à forte teneur en activités cognitives complexes aux heures où les employés sont habituellement alertes et où l’équipe compte un nombre suffisant d’employés d’expérience;
• Donner aux employés la chance de bien se reposer entre leurs quarts de travail et pendant leurs jours de congé – les décourager de faire trop d’heures supplémentaires pendant leurs jours de repos, et aménager les quarts de travail de façon qu’ils dépassent rarement 12 heures;
• Choisir un système de quarts de travail qui permette de tirer avantage des biorythmes des employés d’entretien, compte tenu des périodes de repos qui leur sont accordées et de l’heure du jour;
• Examiner les procédures à suivre lors des changements de quart et essayer de les améliorer de façon que les employés fatigués, qui terminent leur période de travail, soient en mesure de se souvenir des renseignements importants à transmettre à l’équipe de relève. L’équipe de relève doit également être en mesure de poser les questions pertinentes, de façon que toutes les données nécessaires soient transmises d’une équipe à l’autre, ou inscrites dans un registre;
• Sensibiliser le personnel (employés d’entretien, gestionnaires et personnel de soutien, comme les préposés à l’affectation des équipes, les commis aux pièces et aux magasins, etc.) à la gestion de la fatigue;
• Déterminer s’il est plus efficace de demander aux employés de consigner les résultats des opérations d’entretien, leurs observations et d’autres données relatives à
xiv
l’entretien au fur et à mesure, ou une fois que le travail est terminé (lorsqu’ils sont plus fatigués);
• Étudier l’opportunité de mettre au point et d’établir un registre confidentiel des erreurs (RCE);
• Envisager la possibilité d’analyser les erreurs reliées à la fatigue inscrites dans le RCE au cours des douze à vingt-quatre premiers mois de la mise en œuvre du registre;
• Envisager la possibilité de mener une recherche sur l’ordonnancement des travaux et la composition des équipes en tant que facteurs d’atténuation des effets de la fatigue sur la sûreté du système de transport aérien.

xv
Glossary of Terms A-Check: A scheduled maintenance process involving the inspection of aircraft systems and components and the replacement of items that fail to meet specifications, or are approaching their operational lifespan. The process is based on a standard list of maintenance activities, with modifications according to the aircraft’s activity log. The process usually takes about eight to 12 hours, depending on the number and types of items replaced. The A-check is carried out regularly, about once per month.
Aircraft Activity Log: A log of aircraft problems that are automatically recorded by the aircraft, or are identified by the crew, during each trip.
Aircraft Maintenance Engineer (AME): A certified aircraft technician responsible for supervising other aircraft technicians, training apprentices, and inspecting and signing off work done, in addition to a share of the maintenance work.
Aircraft Technician (AT): Aircraft maintenance personnel that performs the maintenance tasks but is not qualified to sign off work.
Apprentice: Aircraft technician who must perform maintenance activities under the supervision of an AME.
Attention Task Component: This component of a task involves the need to focus on a process or activity in order to respond appropriately when required.
C-Check: A comprehensive inspection performed when several critical systems of the aircraft are approaching their operational lifetime. The inspection often includes the replacement of many systems/components, and the inspection of areas not normally inspected during the A-check. A C-check can take several days or weeks to complete, depending on the age and flight experience of the aircraft.
Circadian nadir: The lowest point in the human body’s circadian rhythm; characterized by the lowest level of daily body temperature, reduced alertness, highest level of sleepiness, and reduced physical vigour.
Circadian Rhythm: The body has several body functions that operate on a synchronized daily cycle (circadian cycle). These daily or circadian rhythms are also synchronized with other body rhythms that have longer or shorter cycles.
Cognitive Task Component: The cognitive component of a task is accomplished primarily by brain-based activity and is not necessarily open to observation by behavioural action. Cognitive task components include memory, information processing, decision making, attention, visual and auditory perception, communication and psychomotor control.
Communications Task Component: This cognitive component involves the interaction between people through vocal, visual and auditory systems. This can involve verbal information (written and spoken) or demonstration (signing, pointing, body movements, etc.).

xvi
Confidential Error Reporting System (CERS): A system set up by a third party so that maintenance personnel can report errors to without the worry of retribution by the company.
Decision Making Task Component: This cognitive task component involves the process of assessing a situation and subsequently selecting a course of action.
Error Mode: This is a description of the specific potential error that may occur (e.g. aircraft technician forgets to reinstall lock wire; AME forgets to inspect aircraft technician’s work; store’s clerk supplies incorrect part to aircraft technician).
Error Producing Condition (EPC): An existing condition that increases the probability of unreliability or error – i.e. time shortage, fatigue, poor design, lack of training, etc.
Event Tree: A graphic representation of the events that occur during a scenario showing the sequence, errors, and outcomes. Can be conceptual (no probabilities) or quantitative (including probabilities).
Fine Motor Task Component: This part of a task involves actions that are heavily reliant on the smaller muscles of the body such as those in the fingers, hand, wrist and forearm.
HEART: An acronym for Human Error Analysis and Reducing Technique, developed by Jeremy Williams (1988) as a practical method for identifying errors, error producing conditions, and quantifying human unreliability.
Information Processing Task Component: Information processing involves the intermediate handling of information by the brain in support of other cognitive processes. For example, when stimuli are perceived by the visual system, the brain must process (compare, weigh, calculate, estimate, etc.) this information (stimuli) to allow decisions to be made and responses to occur.
Job: The work described on a job card. Usually this includes only one task, but occasionally includes several tasks.
Job card: Every job assigned to aircraft maintenance personnel is described on a form containing information about the tasks to be performed, part numbers, signing authorities, etc.
Large Motor Task Component: This part of a task involves activities requiring the use of the larger muscle groups such as the upper arms, shoulders, torso, waist, legs, and hips.
Long-term Memory Task Component: This cognitive component involves the use of information stored in the brain through training, experience etc., usually occurring in recent (as opposed to immediate) or historical past.
Nacelle covers: Sections of the nacelles that can be lifted or removed to allow access to the engines. The nacelles are fairings that surround the engines to protect equipment, providing aerodynamic characteristics and aiding in directing air to ducts.

xvii
Psychomotor Task Component: A combination of cognitive and physical activities involving body control during the performance of highly coordinated actions. These kinds of actions require a high degree of eye-hand coordination. Many fine motor control actions result from psychomotor control.
Service Check: A systematic inspection carried out every time an aircraft completes a trip. It is performed at the gate while the aircraft is refuelling and preparing for the next trip. It involves inspection of items on a checklist including fluid levels, flight surfaces, tires, etc., and reviewing the aircraft activity log.
Snag: A problem with the aircraft indicated by the aircraft activity log or identified during a scheduled inspection of the aircraft during a check.
Subtask: Logical part of a task or job. For example, the planning stage is a subtask of a particular job (task) such as the replacement of the number two CFM56-5A engine on A320 Airbus 534. This differs from task grouping, which refers to the generic case for all planning subtasks, regardless of a particular job.
Task: The work assigned on a job card, such as: “replace the number two CFM56-5A engine on A320 Airbus 534”. Often referred to as a job.
Task Component: Cognitive or physical parts of a task element, such as memory, information processing, visual perception, fine motor activity, large motor activity, etc. Task components can also be applied to subtasks and task groupings.
Task Element: The logical sub-steps involved in a subtask.
Task Grouping: The generic case for a subtask. For example, all planning subtasks, regardless of the job (task), would be described in generic terms that would allow analysis of generic cases. That is, is we wanted to determine the general risk of planning a job, we would use the value obtained from averaging all of the planning subtasks for a set of jobs.
Working Memory Task Component: This cognitive component involves the use of information stored in the brain in the immediate past (within minutes).

xviii
xix
Contents 1. Introduction......................................................................................................................... 1
1.1 Background ................................................................................................................. 1
1.2 Program Objectives ..................................................................................................... 2
1.3 Program Sub-Objectives.............................................................................................. 3
1.4 Project Objective ......................................................................................................... 3
1.5 Scope ........................................................................................................................... 3
2. Methodology....................................................................................................................... 5
2.1 Literature Review ........................................................................................................ 6
2.2 Data Collection............................................................................................................ 7
2.2.1 Observations ..................................................................................................... 7
2.2.2 Interviews.......................................................................................................... 7
2.2.3 Questionnaires................................................................................................... 8
2.3 Task Analysis .............................................................................................................. 8
2.3.1 Tabulation of Observational and Interview Data.............................................. 9
2.3.2 Identification of Fatigue Susceptibility of Task Components .......................... 9
2.3.3 Contributions of Task Components .................................................................. 9
2.3.4 Subtasks and Task Groupings......................................................................... 10
2.3.5 Fatigue Susceptibility of Task Groupings....................................................... 10
2.4 Human Error Analysis............................................................................................... 12
2.4.1 Scenarios ......................................................................................................... 13
2.4.2 Error Modes Condition Consequences Analysis – EMCCA .......................... 14
2.4.3 Conceptual Event Trees .................................................................................. 14
2.4.4 Human Error Analysis Reducing Technique – HEART................................. 16
2.4.5 Final Error Database ....................................................................................... 17
2.4.6 Error Analysis of Aircraft Maintenance Tasks ............................................... 17
2.5 Relative Risk Assessment ......................................................................................... 17
2.5.1 Quantitative Event Trees................................................................................. 18
2.5.2 Calculation of Probabilities............................................................................. 20
2.5.3 Comparison of Risk for Each Scenario........................................................... 20
2.5.4 Impact of the Relative Fatigue Risk on System Safety.................................. 20
2.5.5 Other Uses for the Data................................................................................... 20

xx
2.5.6 Human Errors and their Application to Event Tree Analysis ......................... 20
3 Demographics ................................................................................................................... 25
4. Findings............................................................................................................................. 27
4.1 Literature Review Results............................................................................................. 27
4.1.1 Fatigue............................................................................................................. 27
4.1.2 Support for the Task Component Approach ................................................... 27
4.1.3 Aircraft Maintenance Task Groupings............................................................ 29
4.1.4 Cognitive and Physical Components of the Task Groupings ......................... 29
4.2 Fatigue Susceptibility of Aircraft Maintenance Task Components .......................... 37
4.3 Summaries for Aircraft Maintenance Task Groupings ............................................. 38
4.4 Fatigue Susceptibility of Task Groupings ................................................................. 43
4.5 Discussion of Fatigue Estimates................................................................................ 44
4.6 Human Error Analysis............................................................................................... 44
4.6.1 Findings from the Human Error Analysis....................................................... 44
4.6.2 Scenarios Used in the Analysis....................................................................... 45
4.6.3 Relationship between the scenarios and the task groupings ........................... 46
4.6.4 Conceptual Event Trees .................................................................................. 48
4.6.5 Error Modes Conditions Consequences Analysis........................................... 49
4.6.6 Relationship Between Error Modes and Fatigue ............................................ 51
4.6.7 HEART Analysis ............................................................................................ 51
4.7 Risk Analysis............................................................................................................. 54
4.7.1 Construction of Event Trees ........................................................................... 54
4.7.2 Quantitative Event Trees................................................................................. 55
4.7.3 Quantification Of Event Trees ........................................................................ 55
4.7.4 Risk Analyses Spreadsheets............................................................................ 59
4.7.5 Risk Benchmarking......................................................................................... 60
4.8 Relative Fatigue Risk Analysis ................................................................................. 61
4.8.1 Overall Contribution of Fatigue to Aircraft Safety Risk ................................ 62
4.8.2 Initiating Error Modes Most Affected by Fatigue .......................................... 63
4.8.3 Relationship Between Task Groupings and Risk............................................ 69
5 Conclusions....................................................................................................................... 71
5.1 Estimates of Fatigue-Susceptibility in Task Groupings ............................................ 72
5.2 Fatigue and Task Group Scheduling ......................................................................... 73

xxi
5.2.1 Communications with Other Airport Personnel ............................................. 73
5.2.2 Supervision ..................................................................................................... 73
5.2.3 Calibration....................................................................................................... 73
5.2.4 Training........................................................................................................... 73
5.2.5 Testing............................................................................................................. 74
5.2.6 Inspection........................................................................................................ 74
5.2.7 Troubleshooting .............................................................................................. 74
5.2.8 Job Planning.................................................................................................... 74
5.2.9 Documenting the Job ...................................................................................... 74
5.2.10 Operating Transport and Hoisting Equipment................................................ 74
5.2.11 Performing Repairs ......................................................................................... 75
5.2.12 Disassembling and Reassembling Equipment ................................................ 75
5.2.13 Cleaning .......................................................................................................... 75
5.3 Nature of the Risk of Fatigue on Aircraft Maintenance Tasks.................................. 75
5.3.1 Role of Task Groupings in Fatigue Risks ....................................................... 75
5.3.2 Contribution of Fatigue Risks to Outcomes.................................................... 76
5.4 Human Factors of Each Error Mode ......................................................................... 76
5.4.1 Errors Related to Memory Lapses .................................................................. 76
5.4.2 Attention Errors .............................................................................................. 77
5.4.3 Decision-Making Errors.................................................................................. 77
5.4.4 Perceptual Errors............................................................................................. 77
5.5 Magnitude of the Relative Risk of Fatigue ............................................................... 78
5.5.1 Where the Relative Risk of Fatigue in Maintenance Operations Poses the Greatest Problem............................................................................................. 78
5.5.2 Overall Relative Risk of Fatigue in Maintenance Operations and Aircraft Safety .............................................................................................................. 79
5.6 Implications of the Risk of Fatigue in Aircraft Maintenance Operations ................. 79
5.6.1 Focus on Working Conditions ........................................................................ 79
5.6.2 Long-term Effects on Personnel ..................................................................... 79
5.7 Fatigue Risk Countermeasures.................................................................................. 79
5.7.1 Fatigue Management Training........................................................................ 80
5.7.2 Re-examination of Scheduling Practices ........................................................ 80
5.7.3 Other Countermeasures................................................................................... 80
xxii
5.8 Validation of Data ..................................................................................................... 81
6. Suggested Strategies to Reduce Fatigue Risk................................................................... 83
7. References......................................................................................................................... 85
Appendix A Task Database
Appendix B Fatigue Calculations
Appendix C Observational Sheet
Appendix D Questionnaires
Appendix E HEART Analysis Method
Appendix F HEART Tables
Appendix G Scenarios
Appendix H Conceptual Event Trees
Appendix I EMCCA Tables
Appendix J HEART Data Tables
Appendix K Quantitative Event Trees
Appendix L Risk Summary Tables
Appendix M Description of the Risk Analysis Spreadsheets
CD Attachment Risk Analysis Spreadsheets

xxiii
List of Figures Figure 1 Relationship between the Job, Subtasks, Subtask Elements,
and Task Components ............................................................................................ 11
Figure 2 Structure for the General Case ............................................................................... 12
Figure 3 The Human Error Analysis Process ....................................................................... 13
Figure 4 Example of a Conceptual Event Tree..................................................................... 15
Figure 5 Relative Risk Assessment Process ......................................................................... 18
Figure 6 Example of a Quantitative Event Tree ................................................................... 19
Figure 7 Step 1 Calculation................................................................................................... 39
Figure 8 Step 2 Calculation................................................................................................... 40
Figure 9 Step 3 Calculation................................................................................................... 40
Figure 10 Step 4 Calculation................................................................................................. 40
Figure 11 Step 5 Calculation................................................................................................. 40
Figure 12 Quantitative Event Tree........................................................................................ 58
Figure 13 Reason’s Error Model and Associated Countermeasures .................................... 81

xxiv
List of Tables Table 1 Demographic Makeup of Personnel Observed ........................................................ 25
Table 2 Demographic Makeup of the Sample for the Questionnaires.................................. 26
Table 3 Demographic Makeup of the Sample for the Interviews......................................... 26
Table 4 Task Groupings........................................................................................................ 30
Table 5 Task Component Susceptibility ............................................................................... 37
Table 6 Percent Contributions and Associated Fatigue Scores for Task Groupings ............ 41
Table 7 Fatigue Index for Task Groupings ........................................................................... 43
Table 8 Storyboards that Apply to Task Groupings ............................................................. 46
Table 9 List of Error Modes Analysed ................................................................................. 49
Table 10 Summary of HEART Frequencies for Each Task Grouping ................................. 52
Table 11 Conceptual Event Trees and Associated Human Errors........................................ 55
Table 12 Comparative Risks for Scenarios with Fatigue Excluded and Included................ 62
Table 13 Top Ten Fatigue Related Initiating Events From Study Scenarios ....................... 64
Table 14 Associated Task Components for Top Ten Error Modes ...................................... 65
Table 15 Task Groupings and Risk....................................................................................... 70
Table 16 Top Eight Identified Errors from ATSB Study ..................................................... 78
1
1. Introduction
Aircraft maintenance personnel provide a necessary and important service to the aviation industry. Aircraft maintenance (AM) personnel ensure that aircraft are safe to fly and in proper working order. Generally speaking, the critical nature of AM tasks is clear and obvious. However, human factors researchers need to know which tasks are most critical, and which are affected by fatigue, in order to understand the role of fatigue in AM operations. One of the best ways to do this is to conduct a task/risk analysis.
Task/risk analysis is a formal method to identify tasks and determine criticality, susceptibility to causes of error (such as fatigue), and the overall risk these errors may pose to system safety. The analysis requires that task data be collected and described (task frequency, personnel involved, equipment required, and conditions and constraints expected) through observation and informal interviews. Following task analysis, an assessment is conducted examining the criticality of the task for successful system function, susceptibility of the task to fatigue, common error types, effects of these errors on system safety, and the level of overall risk.
The most likely prevailing conditions contributing to the fatigue are identified as part of the analysis process. The analysis results can be used to determine which critical AM tasks are most susceptible to fatigue and the level of risk to system safety posed by these resultant error states. The risk assessment portion of this study includes the identification of critical errors, the probability of occurrence, and the impact of fatigue on these probabilities (i.e. to the risk to the aircraft maintenance system).
1.1 Background Phase 1 of the AME Fatigue Project involved the collection of subjective information from AMEs regarding their levels of fatigue, hours of work, and sleep patterns. The Phase 1 work resulted in the following findings:
• On average, AMEs work over 50 hours per week when overtime is included;
• Many AMEs extend 12-hour shifts, or work additional 12-hour shifts on days off; others are working 10-hour shifts for five or more days in a row;
• Many work long periods of time with very few days off for recovery;
• Some work long shifts, back-to-back with less than eight hours between for rest;
• Significant numbers of AMEs work during days off, either as overtime for a single employer, or additional shifts for another employer;
• AMEs who work for rotary and air taxi services work the highest number of hours;
• Airline and rotary AMEs work the most overtime;
• AMEs who work for airlines report the highest levels of fatigue;

2
• AMEs who work for rotary operations reported the most continuous hours of work;
• AMEs who work on demand work more hours than those on shifts or standard day schedules;
• Salaried AMEs work more hours than those paid by the hour;
• AMEs at rotary and charter operations report the longest shifts;
• Between eight and ten percent of AMEs in major airline, air taxi and rotary operations work the longest reported shifts (mean of 21 to 25 hours) more than 3 times per month;
• Fifty percent (half) of the AMEs reported that overtime worked during the night shift had a strong negative effect on their work performance (another 30 percent reported a weak negative effect);
• Between 25 and 38 percent (the highest percentages for all facilities) of the AMEs at the airlines (major, regional, and charter) reported that they had nodded off at the wheel;
• Between 9 and 12 percent of AMEs at the major and regional airlines reported that they had actually fallen asleep at the wheel;
• Planned napping as a strategy to maintain AME alertness is common in rotary field operations, and almost non-existent in most other operations; and
• AMEs at major airlines and general aviation facilities often take unplanned naps.
These findings clearly indicate that fatigue is an important issue, and that our understanding of its potential impact on aviation safety is of equal importance. This understanding demonstrates the need for interventions and countermeasures to fatigue, and provides the basis for positive change to policy for many aviation maintenance operations.
Furthermore, the Phase 1 findings are corroborated by the results of a study conducted by the Australian Transportation Safety Bureau (2001). ATSB found that fatigue contributes to just over 12 percent of maintenance-related occurrence reports collected by ATSB. This is likely a conservative estimate since detailed records of actual sleep and work cycles are not usually included in the production of many of these reports. Also, fatigue is often a co-factor in the inducement of error, and is not usually considered the main or only factor. Hence, in some incident reporting, fatigue may be masked by other factors.
1.2 Program Objectives The program objective is to establish and validate a set of guidelines for fatigue management that may be adapted by the maintenance services of air carriers in Canada. This set of guidelines may be developed into a fatigue management program or may be used to guide the development of a set of regulations, decisions of the Part V CARAC Technical Committee, and if Transport Canada deems the regulatory control that is necessary.

3
1.3 Program Sub-Objectives The sub-objectives of the program are:
• Phase 1 - Collect and analyse information regarding the number and timing of the hours worked by AMEs, the duration and timing of shifts worked, the duration and timing of rest periods, the nature of the working conditions, and to report the findings.
• Phase 2 -
Part A: Conduct a task analysis of fatigue sensitive and fatigue resistant aircraft maintenance activities, looking at task groupings (i.e. with similar characteristics) and report findings.
Part B: Analyse potential error modes and conditions, the impact of fatigue on the level of risk, and the overall risk to the system with and without considering fatigue.
• Phase 3 - Produce a set of recommendations focusing on the best approach for a fatigue management program and associated regulations that may be required.
• Phase 4 - Implement a pilot test of the fatigue management program to validate its effectiveness.
1.4 Project Objective The overall objective of this project (Phase 2) is to identify:
• Fatigue sensitive tasks,
• Tasks that are fatigue resistant, and
• Level of risk that fatigue poses to system safety.
1.5 Scope The Phase 2 study focused only on job tasks that were observed or discussed with aircraft maintenance personnel. This should not be construed as a definitive study of aircraft maintenance tasks. A broad scope is not necessary to address concerns about fatigue in the aircraft maintenance work environment, nor is such a massive study desirable given the sizable costs required for data collection. This study examines a sample of representative jobs and investigates the susceptibility of these task groupings to the effects of fatigue, and the associated risk of critical error occurrence that may lead to disastrous consequences. The sample includes the replacement of major and minor equipment, service checks, avionics and mechanical inspections, calibration of equipment, troubleshooting, and structural inspection (cargo bay).

4

5
2. Methodology
The study was conducted as follows. Details for each of the approaches are given in the following subsections.
LITERATURE REVIEW A literature review was conducted to determine the types of activities performed by aircraft maintenance personnel and the cognitive and physical nature of fatigue in these. The results of the review were used to develop the task groupings, assign percent contributions of cognitive and physical task components to the overall task composition, and develop the fatigue ratings for the task groupings.
DATA COLLECTION Task data were collected to validate the subtask information obtained during the literature review, and to illuminate the nature of the task components involved in aircraft maintenance activities. The observations allowed the researchers to determine the estimated amount of effort required for each task component involved in each subtask. Further information on subtasks, potential error modes and error producing conditions was sought through interviews. Questionnaires were distributed to personnel who were not interviewed to augment the interview data.
TASK ANALYSIS Task Groupings Task groupings were determined from a functional perspective to provide a generic representation of the subtasks and tasks performed in the aircraft maintenance work environment. This allowed the researchers to perform a more generic analysis and to make recommendations on subtasks that can be applied in all aircraft maintenance work environments. Task groupings were identified using information gathered from subject matter experts at Transport Canada, reported data in Hobbs and Williamson (2002), and through observation of actual aircraft maintenance jobs.
Estimates of Contributions by Cognitive and Physical Task Components The tasks performed by aircraft maintenance personnel were broken down into their respective physical and cognitive task components. This was done to facilitate the subsequent analysis of fatigue sensitivity. The components were identified through observation of aircraft maintenance jobs and review of documentation such as Drury et al. (1990) and Hobbs and Williamson (2002). The proportion of their contribution to the task composition is expressed as percent contribution.
Identification of Fatigue Susceptibility Levels for Task Components Each task component was assessed for susceptibility to fatigue according to the literature, and was assigned an estimated level of susceptibility on an interval scale (4 = very susceptible; 3 = susceptible; 2 = somewhat susceptible; and 1 = negligible

6
susceptibility). These estimates provide the basis for calculating fatigue in each of the task groupings.
Identification of Conditions that Heighten Fatigue Effects Conditions that heighten the negative effects of fatigue on task performance were considered for determining worst-case scenarios that are common enough to pose significant risk (i.e. extremely hot and humid weather, extremely cold and windy conditions, tighter than usual time constraints, temporarily reduced staffing, too few experienced personnel available, unfamiliar aircraft, etc.).
Level of Fatigue Susceptibility for Task Groupings The level of fatigue susceptibility for each task grouping was calculated by multiplying the task component susceptibility ratings by the percent contribution of each task component to the functions of the task grouping. Section 4.3 describes the details of these calculations. The level of fatigue susceptibility for the task groupings will be useful as a guide to planning and scheduling tasks, while considering fatigue expected in personnel working in commonly stressful conditions.
ERROR ANALYSIS Critical error modes for scenarios based on tasks analysed were identified through the analysis of the tasks and from information provided by relevant literature. These error modes were assessed for several attributes that would be useful for determining the potential probability of occurrence. The resultant error frequencies were then used as a basis for quantitative event trees.
RELATIVE FATIGUE RISK ANALYSIS The impact of fatigue on error frequencies was examined and comparative data were calculated to determine the ratio of risk posed when fatigue was present to that when it was absent.
2.1 Literature Review A major focus of the review was to identify studies and reviews concerned with the impact of fatigue on cognitive and physical task components relevant to aircraft maintenance activities. Currently, little research has focused on the impact of fatigue on specific maintenance tasks. Given the availability of excellent data on the effects of fatigue on specific types of tasks, we can transpose the impact of fatigue on maintenance tasks with similar physical and cognitive components. Studies that examined the impact of fatigue on cognitive and physical tasks were reviewed and task components most affected by fatigue were identified.
Relevant documents at the following locations were reviewed:
• The extensive library at Rhodes & Associates Inc.;
• FAA Human Factors on Aviation Maintenance and Inspection (HFAMI) Web site;
• Health and Safety Executive, UK.;

7
• The Australian Transport Safety Bureau;
• PsychInfo, Medline, BioIndex, Bibliosleep databases;
• Ryerson University library system;
• TDC ergonomics unit;
• TDC library system; and
• CAA publications Web site.
2.2 Data Collection 2.2.1 Observations Observations were made while each aircraft maintenance individual completed their tasks. The observation grid used to collect basic data is shown in Appendix C. All personnel were given a short description of the objectives of the study and were asked to carry on with their work in the usual manner as much as possible. The data collection was casual and non-intrusive, allowing maintenance personnel to focus on their work. The observer followed maintenance personnel and took notes on maintenance activities, asking for clarification on reasons why certain actions were required, or what the activity’s goals were. Questions were asked at a later time in cases where the observer could not actually see what was being done due to the confining conditions characterizing many aircraft maintenance (AM) tasks. The same was done if the observer felt that the data collection could compromise operation safety. When possible, personnel described what they were doing as they worked. A great deal of insight was obtained when maintenance personnel freely expressed their own observations of their tasks and performance.
The nature of the aircraft maintenance tasks frequently involves teamwork with maintenance personnel from all categories of responsibility. Notes were taken in addition to the information entered into the task data forms. The coverage of maintenance subtasks was expanded so that each researcher followed several people in the team during their work (e.g., C-check – see glossary of terms) and recorded pertinent details about the subtask at hand (such as the inspection of a piece of avionics equipment), plus team-related subtasks where personnel worked together to test the operation of equipment or coordinate their tests (plan the test to include mechanical and electronic components). An example of a team-oriented activity is the testing of the hydraulic, electronic and electrical components during a test of the landing gear.
The task activities of all team members were sampled to avoid duplication in the coverage of subtask types. For example, during an A- or C-check, everyone removed panels as part of their subtask (e.g., inspection of components behind the cover). Other examples included the removal/replacement of redundant equipment; and the testing of similar avionics equipment.
2.2.2 Interviews Semi-structured interviews were conducted around the maintenance activities when personnel were available. Eleven maintenance personnel were interviewed individually. Questions were asked about subtask elements, either missed during observations, or requiring further explanation. Questions about job conditions were also asked. This allowed the

8
individuals to provide information about certain aspects of the job such as awkward postures required, effect of lighting, need for assistance from another person, or the stress of having to meet a set deadline to complete the job.
On occasion, when a group of maintenance personnel were working in the ready room, the researchers took the opportunity to ask questions about maintenance job planning, use of the computer systems and paper-based manuals, scheduling, fatigue on the job, job risks, and what they do to deal with these situations. Maintenance job-related questions resulted in information that could be used for the task analysis. The balance of the questions yielded information that was useful for risk assessment.
2.2.3 Questionnaires Note that questionnaires were distributed to collect complementary information from personnel who could not be observed and interviewed. Hence, the data are not to be analysed separately, nor used for statistical analysis.
Questionnaires were distributed to 22 individuals who agreed to complete one for the researchers. Seven maintenance personnel returned completed questionnaires to the researchers. The demographic makeup of the questionnaire sample is shown in Section 3, below. See Appendix D for a copy of the questionnaire.
2.3 Task Analysis The analysis process involved the following steps:
1. Tabulation of observational and interview data into a database containing the subtasks observed (e.g. plan for replacement of the number 1 CFM56-5A engine on A320 number XXXX) and their associated task elements (steps);
2. Identification of cognitive and physical task components;
3. Estimation of percent contributions for task components for each task element in each subtask;
4. Development of task groupings;
5. Assign subtasks to respective task groupings;
6. Determine the average percent of contribution for each task component for each task grouping;
7. Determine the average percent of contribution for all task components involved in each task grouping;
8. Determine the level of effect fatigue has on each task component, according to task performance data obtained from the scientific literature;
9. Multiply the level of fatigue for each task component by the average contribution of the task component for each task grouping and add the products for each task component to arrive at the fatigue index for each task grouping.

9
2.3.1 Tabulation of Observational and Interview Data The data collected during the observations and interviews was extracted from observational notes, grids, and interview notes, and entered into an Excel table forming the task database (Appendix A). The database consists of sections for each subtask observed (for example, planning the removal and replacement of the engine; disassembling/reassembling the engine; etc.).
Other subtask attributes were examined and reported in the database, including:
• Number of personnel involved;
• Cautions that should be considered with the task element;
• Working conditions that prevailed at the time the task element occurred; and
• Point in work cycle and time of day when the task element occurred.
2.3.2 Identification of Fatigue Susceptibility of Task Components Each task component was assessed for susceptibility to the impact of fatigue based on the literature review. The assessment of fatigue involved assigning a level of fatigue as suggested by the results of studies measuring fatigue effects on particular task components.
The fatigue susceptibility scale is:
4 = very susceptible
3 = susceptible
2 = somewhat susceptible
1 = negligible susceptibility
2.3.3 Contributions of Task Components The elements of each subtask involve cognitive and physical task components. This analysis consisted of reviewing each task component’s involvement in each task element (that is, each line in the database) of the subtasks. Percent contributions of task components were estimated according to observation of aircraft maintenance activities and information existing in the literature.
The contribution of the task component (such as decision making) to specific task elements and subtasks (e.g. initiating the job, testing the replaced equipment) was determined by evaluating the proportion of time and effort spent on each component important to the performance of each task element (e.g. review work cards) and ultimately, for the subtask (e.g. job planning). For example, in an inspection task, maintenance personnel must perform visual searches (visual perception), compare visual information to a set of criteria or standard (process the information), and then make a decision based on this information (decision-making). For instance, for an airframe inspection, the maintenance person must spend much of his/her time (about 75 percent), scanning the surface. Approximately 15 percent of the time is spent processing this visual information and finally, quick decisions about each piece of visual information are made in about 10 percent of the time used and in the end, a summary decision is made.

10
2.3.4 Subtasks and Task Groupings Subtasks were grouped according to functional importance to the aircraft maintenance job. The grouping was based on discussions with aircraft maintenance officials, observations, interviews with maintenance personnel and criteria suggested in the literature. Ultimately, task groupings that made sense within most aircraft operational work environments were used. These task groupings allowed the identification of distinct, recognizable parts of any aircraft maintenance job that could be planned and scheduled. This artificial grouping was developed to create the general case for related subtasks.
The aircraft maintenance subtasks examined in this research, were categorized according to their task grouping in order to conduct the overall summary analysis. Figure 1 illustrates the relationship between job, subtasks, task elements, task components and task groupings.
By grouping similar subtasks involved in a job, a more robust comparative analysis is possible for use in generic application. For example, the job of replacing an engine involves a number of subtasks such as: planning the work, completing the disassembly and reassembly (including opening up and closing), documenting the work as it progresses, inspecting the work, running tests, troubleshooting problems, and calibration. Some of these subtasks are elements of other jobs, such as job planning, inspection, testing, documenting, and troubleshooting during the inspection of cargo bay equipment. Since some jobs may involve a single subtask (e.g. routine inspection of cargo bay equipment), while others may involve several subtasks (replacement of an engine), the use of task groupings allows for task-grouping-specific consideration when scheduling, assigning, and planning for staffing.
Figure 2 shows the relationship for the general case, including the task groupings, their task components and the overall average for the percent contribution of each task component to each task grouping.
2.3.5 Fatigue Susceptibility of Task Groupings Combining the results of the susceptibility of task components and the task grouping fatigue ratings, a list of task groupings and their overall fatigue susceptibility is given in Table 4 in section 4.2.

11
[REPEAT FOR ALL SUBTASK ELEMENTS]
Figure 1 Relationship between the Job, Subtasks, Subtask Elements, and Task Components
DR-1. AME and ATs open nacelle covers
AIRCRAFT MAINTENANCE ACTIVITY
e.g. replace engine
Engine Replacement
Job Planning (JP)
Engine Disassembly/Reassembly
(DR)
Engine Testing (ET)
JP-1. AME obtains job card describing snag.
Job
Subtask
Subtask Elements
JP-2. AME and ATs review items on the job card.
DR-2. AME and ATs disconnect hoses, tubing, fuel lines, air ducts and cables; cut lock wire
Large motor activity 80%
Visual attention 10%
Information Proc. 10%
Fine motor 20%
Pushing/ pulling 50%
Visual perception 10%
Task Components
Attention 10%
Communications 10%
Fine motor activity 50% Psychomotor 20%
Working Memory 5%
Decision making 15%

12
Figure 2 Structure for the General Case
2.4 Human Error Analysis The error analysis was performed as follows:
1. Development of scenarios for event tree analysis (ETA).
2. Identification of potential error modes and error producing conditions (EPCs – i.e., time constraints, insufficient training, fatigue etc.) for each of the tasks analysed – through the Error Modes Condition Criticality Analysis (EMCCA) error analysis technique;
3. Construction of the Human Error Analysis Reducing Technique (HEART) error analysis tables; and
4. Development of the final error database ready for inclusion in the risk analysis.
Figure 3 illustrates the human error analysis process.
General Case
Job Planning Disassembly/Reassembly Testing Task Groupings
Large Motor 9%
Visual attention 21% Information Proc. 15%
Fine Motor 21%
Pushing/ Pulling 3%
Visual Perception 12%
Attention 4%
Communications 4%
Psychomotor 17%
Working Memory 7%
Information Proc. 1%
Decision Making 8%
Working Memory 6%
Decision Making 11%
Communications 28%
Psychomotor 28%
Fine Motor 8%
Auditory Perception 1%
Large Motor 15%
Heavy Lifting 1%
Bending/Stooping 3%
Reaching 3%
Fine Motor 23%
Visual Perception 15%
Attention 20%
Communications 5%
Psychomotor 10%
Working Memory 5%
Information Processing 10%
Decision Making 20%
Auditory Perception 5%
Task Components
Averages

13
Figure 3 The Human Error Analysis Process
2.4.1 Scenarios The scenarios used to create the conceptual and quantitative event trees (i.e. with error frequencies included) were identified during the information-gathering portion of the project. The scenarios were based on the task groupings identified in the task analysis. Scenarios representative of critical aircraft maintenance activities were identified. These scenarios were portrayed as storyboards in order to understand how the events should unfold, and to identify the conditions that might exist at the time. Criticality was based on the potential outcome of initiating events as determined by a conceptual event tree analyses (i.e. no probabilities included). Scenarios chosen for further analysis were those that may lead to a potentially critical incident.
EMCCA Error modes
Error producing conditions
Error Identification Process
HEART Error Frequency
Analysis
Quantitative Error Analysis Process
Compilation of Error Database
Error Database Production
Scenario Development
Construction of conceptual event
trees using scenarios

14
2.4.2 Error Modes Condition Consequences Analysis – EMCCA Appendix I contains the table used to identify error modes and error producing conditions (EPC) for each task grouping. Error modes with potentially disastrous consequences were identified using the literature and researchers’ experiences and were included in both the conceptual event trees and the EMCCA table. All conditions expected to affect the error mode and rate were also entered. The researchers and Transport Canada subject matter experts determined the conditions.
The EMCCA analysis provides a rich source of information for interpreting fatigue’s effects on task performance and its contribution to the opportunity for error. The underlying conditions that may increase the risk of making errors were considered in the analysis. This information is helpful for further improvements to the operation, procedures and policies. Such information could be used in follow-up intervention work to reduce these potential errors and risks to the system.
2.4.3 Conceptual Event Trees An event tree is a depiction of the events that occur during an actual or hypothetical incident. The tree shows a sequence of events and the timing and relationship between separate potential sequences, depending on choices and conditions at the time. This information is crucial to understanding the potential causes and risks posed by each event scenario.
Conceptual event trees were developed based on information produced by task analysis (descriptions of maintenance activities, task groupings, working conditions, and cautions) and from subject matter experts in the airlines. The error modes that led to disastrous consequences, as identified in the EMCCA, were used as the initiating events in the conceptual and quantitative event trees. See Figure 4 for an example of conceptual event trees. The conceptual event tree is used to provide the analysts with the relationship between error modes and outcomes to be considered for the more detailed EMCCA and to provide the structure for quantitative event trees.
Conceptual event trees were constructed by identifying an initiating event. For example, an aircraft technician (AT) installs incorrect part during replacement of thrust reverser door followed by subsequent events such as an AME noticing the use of an incorrect part by the AT. Other examples would be:
• the malfunction of a thrust reverser is revealed during testing;
• the malfunction of a thrust reverser is detected during pre-flight check by flight crew;
• a thrust reverser door does not deploy during takeoff or cruise;
• a thrust reverser door does not jam open on landing; or
• a pilot has sufficient skill to keep plane level on runway with thrust reverser door jammed open.

15
Figure 4 Example of a Conceptual Event Tree
AT installs incorrect part during
replacement of thrust reverser door
AME notices use of incorrect part by AT
Malfunction of thrust reverser is revealed
during test
Malfunction of thrust reverser is detected
during pre-flight check by flight crew
Thrust reverser door does not deploy
during take-off or flight
Thrust reverser door does not jam open on
landing
Pilot has sufficient skillto keep plane level on
runway with thrust reverser jammed open
Consequence
Aircraft returned to maintenance: 0 casualties
Aircraft returned to maintenance: 0 casualties
Aircraft returned to maintenance: 0 casualties
Aircraft lands safely: 0 casualties
Aircraft lands safely: 0 casualties
Pilot crashes plane on landing: 10 fatalities 50 injuries
Crash: 135 fatalities
Incorrect part installed
AME does not notice incorrect part
Passes test with compromised thrust reverser
Flight crew do not detect incorrect thrust reverser
Thrust reverser door opens
Thrust reverser door jams open
Plane leaves runway
INITIATING EVENT ENABLING EVENTS

16
The event tree is designed to allow an analyst to identify all of the actions that are required to maintain a safe process, and errors that may occur if certain actions do not occur, or the wrong action is substituted. This approach identifies the checks and measures available so that they may be included in quantitative calculations. The conceptual event tree does not, however, take into account the EPCs that may affect the actions identified in the event tree. Such influences must be accounted for during HEART analysis, subsequently applying those error frequencies to the quantitative event trees.
The error identification process was based on error modes identified in the literature, discussions with airline subject matter experts and on researchers’ expert judgements. Transport Canada subject matter experts reviewed the content for accuracy and validity.
2.4.4 Human Error Analysis Reducing Technique – HEART See Appendix E for a description of the HEART method and a sample of the HEART table that was used to calculate the task-frequency adjusted error frequency data for all error modes. The HEART method allows the analyst to consider the effects of error producing conditions on the frequency of an error. Instead of an error frequency reflecting ideal conditions (not useful for the real world) the HEART method uses multipliers to increase the frequency of an error where certain conditions are expected to cause the error to be more likely to occur. These multipliers are based on industry data and increase the validity of error frequencies.
The frequencies for tasks involved were determined, in part, according to information obtained from the airlines, Transportation Safety Board of Canada’s 2000 aviation incident summary report, and according to extrapolation from other related industry component data (e.g. aerospace and nuclear for estimated failure rates of parts and components).
Work-related factors might exacerbate the impact of fatigue on the production of errors. Some might have none or marginal impact, while others might have a serious effect on fatigue’s effect on cognitive performance, and consequently, error rates. For example, when engaged in planning subtasks, the impact of fatigue can be made worse if the level of lighting is low, contributing to lower levels of alertness, and increased feelings of fatigue. This may be considered a serious effect, since planning subtasks requires considerable amounts of decision making and information processing, task components that are severely degraded by such increased levels of fatigue.
The result of working under the conditions discussed above is that fatigued personnel try to pace the work initially, but may be more inclined to just get it done and push themselves to the point where errors in judgement become more probable. In this risk analysis, the impact of various factors and their contribution to the fatigue risk was evaluated.
The HEART method allowed the analysts to identify the probability for each error mode. These probabilities were used to create the quantitative event tree.
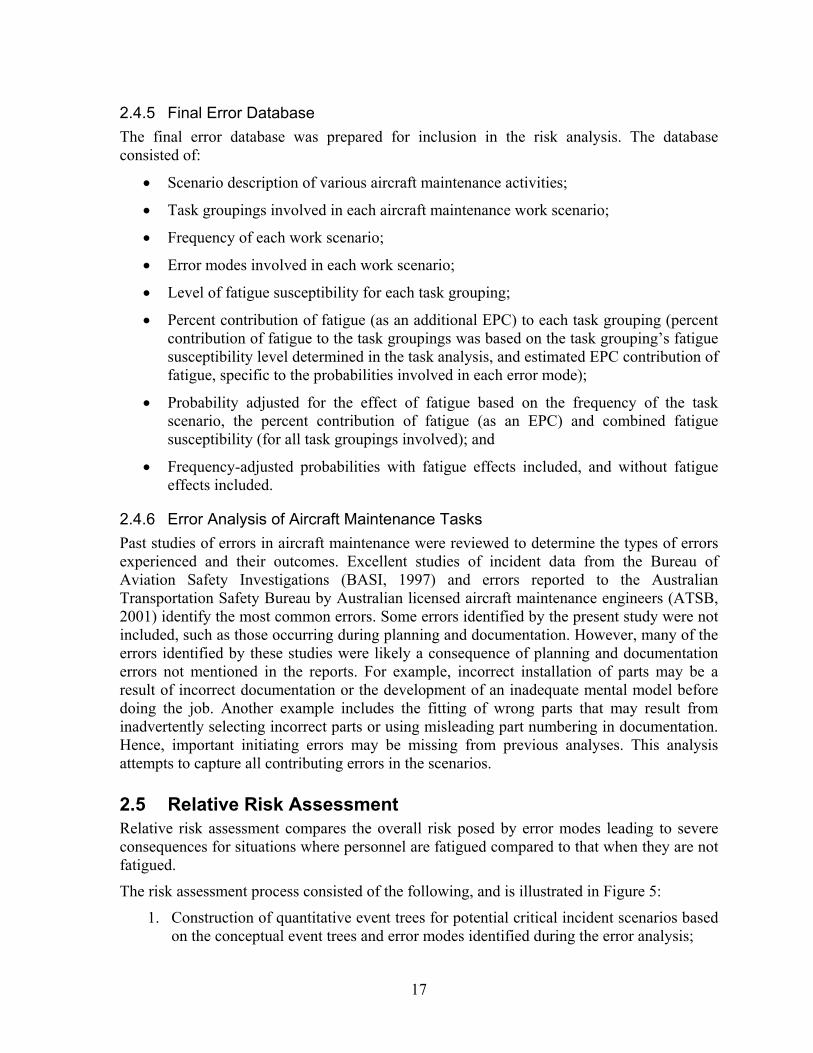
17
2.4.5 Final Error Database The final error database was prepared for inclusion in the risk analysis. The database consisted of:
• Scenario description of various aircraft maintenance activities;
• Task groupings involved in each aircraft maintenance work scenario;
• Frequency of each work scenario;
• Error modes involved in each work scenario;
• Level of fatigue susceptibility for each task grouping;
• Percent contribution of fatigue (as an additional EPC) to each task grouping (percent contribution of fatigue to the task groupings was based on the task grouping’s fatigue susceptibility level determined in the task analysis, and estimated EPC contribution of fatigue, specific to the probabilities involved in each error mode);
• Probability adjusted for the effect of fatigue based on the frequency of the task scenario, the percent contribution of fatigue (as an EPC) and combined fatigue susceptibility (for all task groupings involved); and
• Frequency-adjusted probabilities with fatigue effects included, and without fatigue effects included.
2.4.6 Error Analysis of Aircraft Maintenance Tasks Past studies of errors in aircraft maintenance were reviewed to determine the types of errors experienced and their outcomes. Excellent studies of incident data from the Bureau of Aviation Safety Investigations (BASI, 1997) and errors reported to the Australian Transportation Safety Bureau by Australian licensed aircraft maintenance engineers (ATSB, 2001) identify the most common errors. Some errors identified by the present study were not included, such as those occurring during planning and documentation. However, many of the errors identified by these studies were likely a consequence of planning and documentation errors not mentioned in the reports. For example, incorrect installation of parts may be a result of incorrect documentation or the development of an inadequate mental model before doing the job. Another example includes the fitting of wrong parts that may result from inadvertently selecting incorrect parts or using misleading part numbering in documentation. Hence, important initiating errors may be missing from previous analyses. This analysis attempts to capture all contributing errors in the scenarios.
2.5 Relative Risk Assessment Relative risk assessment compares the overall risk posed by error modes leading to severe consequences for situations where personnel are fatigued compared to that when they are not fatigued.
The risk assessment process consisted of the following, and is illustrated in Figure 5:
1. Construction of quantitative event trees for potential critical incident scenarios based on the conceptual event trees and error modes identified during the error analysis;

18
2. Assignment of error frequencies to event tree entries without the effect of fatigue;
3. Assignment of error frequencies to the same event tree scenarios (as in two), for the fatigued condition;
4. Summation of risks for accident sequences for each scenario, for error modes in a given task grouping and for task groupings for fatigued and non-fatigued conditions;
5. Comparison of risks for fatigued and non-fatigued conditions to derive an understanding of the relative influence of fatigue during maintenance operations on accident risk;
6. Discussion of the potential influence of fatigue during maintenance on overall aircraft accident risk.
Figure 5 Relative Risk Assessment Process
2.5.1 Quantitative Event Trees Quantitative event trees were prepared using conceptual event trees and data from the human error database (created as described in section 2.4.5). Figure 4 illustrates the basic structure of a conceptual event tree. See Figure 6 for an example of a quantitative event tree. The probabilities identified through error analysis, for each error mode identified in the conceptual event trees, were used to populate the quantitative event trees with the maintenance error nodes (points where errors could potentially occur). For accident sequences that contain more than one maintenance human error, an evaluation was made of the independence of the events based on human factors literature and the expert judgement of researchers. For human errors that are assessed to be dependent, either a conditional human error probability was used, or an adjustment was made based on information available in the literature. Methods for establishing the combined probability of human error events are described by Hollnagel (1998).
Relative Risk Analysis
AAssssiiggnnmmeenntt ooff pprroobbaabbiilliittiieess ttoo eevveenntt
ttrreeeess
CCaallccuullaattiioonn ooff rreellaattiivveerriisskk ffoorr eeaacchh sscceennaarriioo
CCaallccuullaattiioonn ooff oovveerraallll rreellaattiivvee rriisskk ooff ffaattiigguuee
iinn aaiirrccrraafftt mmaaiinntteennaannccee ooppeerraattiioonnss
Definition Process Overall Relative Risk of Fatigue
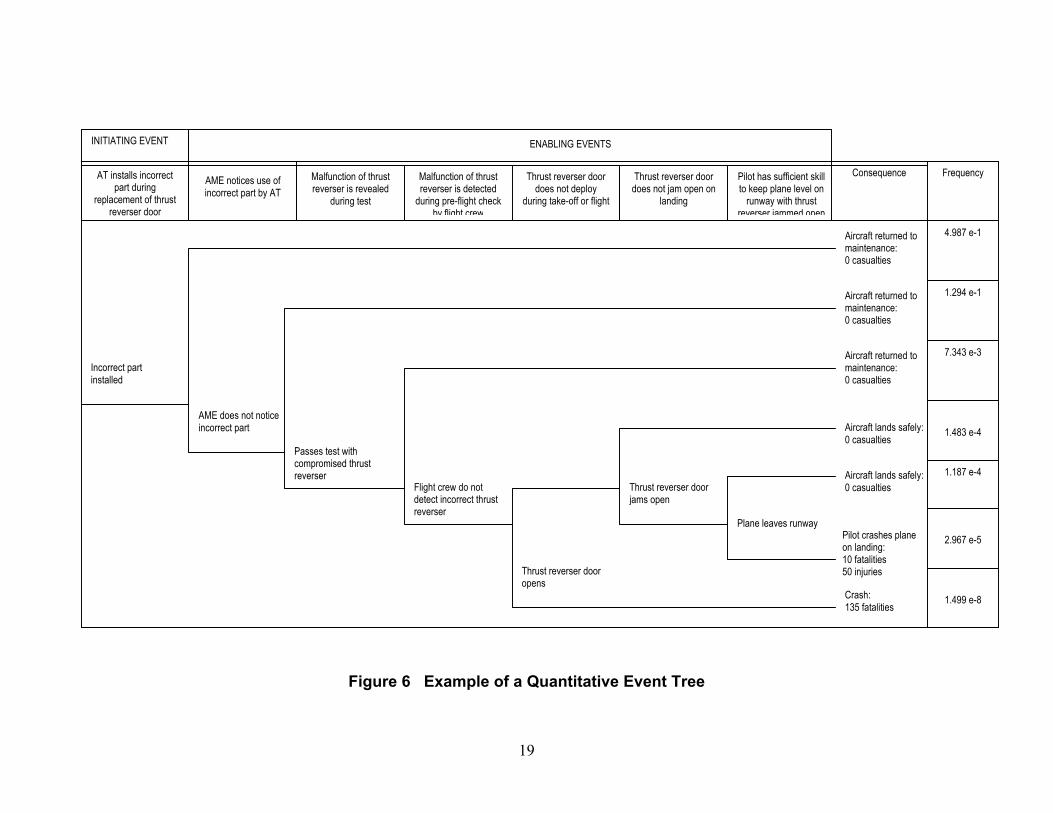
19
Figure 6 Example of a Quantitative Event Tree
AT installs incorrect part during
replacement of thrust reverser door
AME notices use of incorrect part by AT
Malfunction of thrust reverser is revealed
during test
Malfunction of thrust reverser is detected
during pre-flight check by flight crew
Thrust reverser door does not deploy
during take-off or flight
Thrust reverser door does not jam open on
landing
Pilot has sufficient skillto keep plane level on
runway with thrust reverser jammed open
Consequence
Aircraft returned tomaintenance: 0 casualties
Aircraft returned to maintenance: 0 casualties
Aircraft returned to maintenance: 0 casualties
Aircraft lands safely: 0 casualties
Aircraft lands safely: 0 casualties
Pilot crashes plane on landing: 10 fatalities 50 injuries
Crash: 135 fatalities
Incorrect part installed
AME does not notice incorrect part
Passes test with compromised thrust reverser
Flight crew do not detect incorrect thrust reverser
Thrust reverser door opens
Thrust reverser door jams open
Plane leaves runway
INITIATING EVENT ENABLING EVENTS
Frequency
4.987 e-1
1.294 e-1
7.343 e-3
1.483 e-4
1.187 e-4
2.967 e-5
1.499 e-8

20
The researchers initially estimated the probabilities of error event tree nodes that do not relate to human errors during maintenance with additional input sought from SMEs. Examples of these include pilot error, airline flight-decision error, unexpected part failure or failure of materials, etc. It is anticipated that these values were somewhat tentative; however their influence on the relative comparison of risk for the fatigued and non-fatigued condition are expected to be of secondary importance to human error frequencies for maintenance tasks.
Separate calculations were prepared for the fatigued condition and the non-fatigued condition (see the risk spreadsheets in the Excel file on the CD in the sleeve attached to the back cover of this report for the detailed calculations). Summary data for these tables are contained in Appendix L. The error mode’s probability of occurrence can be calculated according to the proportional impact of fatigue on each specific action occurring in the sequence. The resulting probabilities for the fatigued and non-fatigued states can then be compared for each scenario.
2.5.2 Calculation of Probabilities The probabilities of each error mode were entered into the event tree model for each scenario, using the probabilities contained in the error database. Probabilities based on scenarios where personnel are fatigued, and those where personnel are non-fatigued were calculated according to their respective entries in the risk spreadsheet.
2.5.3 Comparison of Risk for Each Scenario The levels of risk posed when fatigue is included versus when it is removed were compared for each scenario, event tree, task grouping and the overall integrated relative fatigue risk of all tasks groupings assessed in the study. Summary tables showing these results were prepared and the role of fatigue to accident risk resulting from maintenance errors discussed.
2.5.4 Impact of the Relative Fatigue Risk on System Safety The relative risk of fatigue during aircraft maintenance to overall aviation system safety is discussed based on the results of the analysis and other risk contributors that do not relate to maintenance errors.
2.5.5 Other Uses for the Data The utility of the data for determining other countermeasures for the reduction of serious error modes is discussed as part of this project.
2.5.6 Human Errors and their Application to Event Tree Analysis Human errors during maintenance may result in a wide variety of outcomes. Many errors may have innocuous outcomes or be readily detected and corrected before the aircraft is released from maintenance. Others may lead to disastrous consequences if not readily detected (i.e. latent, and unnoticed) and/or left unchecked. We have taken an approach to error analysis and risk assessment that involves the identification of errors, the error producing conditions that affect them, and the intervening checks and measures taken to control for such errors. The approach is influenced by the works of Reason (1987), Hollnagel (1998) and Williams (1988) and focuses on the context in which errors are made and resulting risk levels.

21
In this study, we are interested in errors that may have flight safety implications and that could, ultimately, lead to an accident resulting in injury or fatality during taxiing, initial take-off roll, take-off, cruise, landing or landing roll. Several general events must occur before a human error would result in such dramatic consequences. These general events are as follows:
Maintenance Error Events According to task analysis of the maintenance operations and review of the TSB accident reports on maintenance errors, for a scenario to have flight safety implications they must fall into one of three types:
• Error renders aircraft component or system unable to safely perform its function (e.g. entertainment system has a shorted circuit that may start an electrical fire that could spread to vital flight control systems).
• Error disables system that has a role that is important to flight safety (e.g. navigation system provides incorrect information to flight crew, which could lead to controlled flight into terrain).
• Error results in a pre-existing condition that would affect flight safety not being detected or corrected during maintenance (e.g. corrective maintenance performed on an incorrect hydraulic module in a redundant train of control surface hydraulics resulting in the plane being released from maintenance with the original fault un-repaired and not meeting minimum equipment list (MEL) flight criteria).
The first two error types are accident-initiating events (i.e. the first event in the chain of events that leads to an accident). The third type of error is an enabling event. This means that there must be a pre-existing condition prior to the event (e.g. a failure that requires repair) to obtain the accident sequence. Initiating events are shown at the beginning of the event tree (i.e. the left hand side). Enabling events are intermediate events that are between the initiating event on the left of the tree and the different possible outcomes on the right. The enabling events create branching nodes that result in different possible outcomes, described in the consequence column at the right of the tree.
The relationship between human error and failure mode depends on the manner in which human errors are defined. A very specific human error such as ‘technician strikes body of fuel intake casting while attempting to loosen injector housing bolt’ may lead to a distinct failure mode such as ‘rupture of fuel intake casting leads to fuel leak and ignition of fuel by hot engine components’. A more general definition of human error such as ‘Aircraft Technician damages surrounding equipment during engine disassembly/assembly’ may lead to a range of failure modes such as variable thrust output, total loss of thrust, engine fire fuel leak depending on the actual component that was damaged and how seriously it was damaged.
A highly specific identification of human errors may appear more straightforward because of the direct relationship between such specific human errors and equipment failure mode. This approach can be practical for a highly targeted risk assessment such as one used to certify a particular engine design. For an integrated risk assessment, intended to cover all maintenance

22
tasks for a range of different aircraft, this specific human error approach is impractical. Since each aircraft will have a many different maintenance tasks and each task will have various different possible human errors, the analysis would quickly expand into an extremely large number of scenario permutations. Another limitation on the specific error approach is the nature of human errors. These tend not to be as much a collection of distinct things that can go wrong as a continuum of errors that can vary in degree and timing (e.g. errors such as incorrect reassembly and damage to equipment can take on a wide variety of possibilities). The latter point is of particular importance since the objective of this assessment is to focus in on the implications of human errors and how they are affected by fatigue.
Another key aspect of a failure mode is the potential to be detected and corrected before no recovery is possible as during the critical stages of the take-off. Errors that have a high visibility such as ones that are directly visible to maintenance of flight crew, are clearly indicated by test results or cockpit instrumentation are much more likely to be corrected before an in-flight incident occurs, than errors that result in latent defects such as a damaged solenoid valve that passes ground tests and only manifests themselves into symptoms during the stresses of flight. For a maintenance error to result in an accident, one of the following scenarios must evolve:
1. Immediate Loss or Impairment of Equipment Function
A human error that results in an immediate loss or impairment of equipment function will normally be detected and corrected before an accident occurs, unless one (a, b, or c) or several (a, b or c and d, e, or f) of the following conditions prevail:
a. The loss or impairment of function is not directly observable by maintenance supervisor or flight crew (e.g. structural defect only detectable by inspection of hidden components, dye penetrant or ultrasonics, etc.)
b. Maintenance staff fail to inspect and test the equipment following maintenance (i.e. a second human error)
c. Maintenance staff perform the inspections incorrectly such that they do not detect the loss or impairment of function (i.e. a second human error)
d. Maintenance staff detect the loss or impairment of function during inspection or test but fail to document that the aircraft is not flight worthy (i.e. a second human error)
e. Flight crew fail to perform required checks, tests or inspections that would detect loss or impairment of equipment function (i.e. a third human, flight crew, error)
f. Flight crew perform the checks, inspections or tests incorrectly such that they do not detect the loss or impairment of function (i.e. a third human, flight crew, error)
g. Flight crew detect the loss or impairment of function during checks, inspections or test but fail to abort the impending flight (i.e. a third human, flight crew, error)

23
h. Flight crew detect the loss or impairment of function during checks, normal operation or tests during flight, but fail to report/document the event post-flight
The errors in events “b” though “d” are represented as distinct events on the event tree. The errors in events “e” through “g” are represented as a single flight crew error event in the event trees. It is important to note that events “b” through “d” may not be independent from the human error-initiating event, since they likely involve the same maintenance crew, whereas events “e” through “h” are most likely independent, since they pertain to the flight crew.
2. Latent Loss or Impairment of Equipment Function
A human error that results in a latent loss or impairment of equipment function is much less likely to be detected before the point where no recovery is possible than an error that has immediate effect on function. The one exception is an error that results in conditions such as low hydraulic fluid level that are monitored by sensors. Unmonitored errors that result in latent loss of function include:
• Damage to equipment that is not externally visible and that weaken the equipment but do not result in its outright failure;
• Improperly secured fasteners, hoses and electrical connectors, which result in no functional impairment during ground tests, but which may result in early failure during flight; and
• Mis-configuration error of software systems where the error is not self-indicating.
Maintenance Events Not Directly Related to Maintenance Error Some maintenance events contributing to accident sequences may be indirectly related to maintenance human error. For example, if a spare part is defective, the defect is not directly caused by a maintenance error. However, it may be part of an accident sequence if a technician fails to test the system correctly and does not discover that a defective part has been installed before the aircraft is released for service.
Events that do not contain maintenance-related errors (e.g. parts personnel provide an incorrect part) are included in the event sequences where maintenance error-enabling events have been identified (e.g. aircraft technician misses cue during test procedure) and a condition other than human error during maintenance (e.g. defective part) may have a significant contribution to the initiating event frequency.
Equipment failure not resulting from maintenance-related human error events may also be present as enabling events during maintenance. For example, an aircraft technician may correctly follow a test procedure, but may conclude that the equipment passes a test as a result of a faulty reading from defective test equipment. While these types of scenarios may be possible they are not included in this risk assessment. The probability of the test equipment failing in a mode that gives a false aircraft systems ‘OK’ status is considered to be much less likely than making an erroneous decision that an aircraft is in good working order and can be released from maintenance.

24
Events Not Directly Related to Maintenance Other factors contributing to accidents may exist. These may include:
• environmental conditions such as weather;
• hazardous conditions as luggage self-igniting, or a passenger discarding a lit cigarette in waste-bin;
• pilot, flight crew, or ground crew failing to detect a problem; or
• failure of other aircraft systems that are independent of the maintenance initiating event sequence and inability of pilot to control disabled aircraft.
While these types of events are not directly related to human error during maintenance they establish the overall safety risk of the maintenance error. In this assessment the non-maintenance events have been modelled at a coarse level to provide insight into the risk significance of specific maintenance error event sequences.
The following types of non-maintenance events have been modelled:
• Pilot, flight crew or ground crew fail to detect abnormal equipment status during required pre-flight checks, inspections and tests, or fail to abort flight as a result of such conditions;
• Environmental (or other) conditions that place demands on aircraft systems, exacerbating the consequences of a maintenance error;
• Initiating events within the aircraft, such as a fire started by a passenger that cannot be effectively caught by maintenance personnel;
• Failure of redundant, back-up or mitigating systems independent of the maintenance error initiating event sequence; and
• Failure of pilot to control disabled aircraft (due to pilot error, insufficient skill, etc.).

25
3 Demographics
The team composition for the observed aircraft maintenance personnel typically included:
• One aircraft maintenance engineer (AME) for each category of responsibility (airframe, mechanical, avionics);
• One to two aircraft technicians (AT) for each category; and
• One apprentice for each category.
Maintenance crews worked together as a team for large jobs, or split up to work on smaller jobs, sometimes working solo. For example, A-checks and C-checks involved all categories and usually included the full compliment of personnel types. An A-check team might be composed of an AME, two ATs and apprentices for each of the categories. These checks, based on air hours and the age of the aircraft, are scheduled inspections that determine the condition of the aircraft, and include scheduled replacements of components and fluids.
However, if an aircraft is sent to the hangar to have an unforeseen avionics problem assessed, only avionics maintenance personnel are required. Likewise, mechanical teams perform mechanical repairs. Table 1 gives the breakdown for the individuals observed for each job in the analysis.
Table 1 Demographic Makeup of Personnel Observed
Category
Jobs Observed AME AT Apprentice Total
C-Check (also included repair/replacement subtasks) 3 6 5 14
A-Check (also included several repair/replacement subtasks)
3 6 4 14
Service check -- 3 -- 3
Engine replacement 1 5 2 8
Actuator (prime and backup) replacement 1 1 1 3
Wheel/Tire replacement -- 1 -- 1
Troubleshooting a door sensor 1 2 -- 3
Total 9 24 12 46

26
The demographic breakdown for the individuals who were given and who completed questionnaires is shown in Table 2.
Table 2 Demographic Makeup of the Sample for the Questionnaires
Category
AME AT Apprentice Total
Distributed 3 6 13 22
Received 1 1 5 7
The breakdown for the demographic makeup of individuals interviewed is given in Table 3.
Table 3 Demographic Makeup of the Sample for the Interviews
Category
AME AT Apprentice Total
2 8 1 11
In addition, three groups of up to seven aircraft maintenance personnel were interviewed. These groups consisted of a mix of personnel types and categories of responsibilities.

27
4. Findings
4.1 Literature Review Results The following is a compilation of the results of the literature review. This section is organized into the following two subsections:
i. Support for the task component approach; and
ii. Rationale for the proposed error analysis approach.
4.1.1 Fatigue Fatigue can be accumulated when:
• sleep is disrupted from awakenings caused by noise, pain, a partner’s snoring, sleep apnoea (sleeper stops breathing), etc.;
• sleep is truncated or cut short by awakening too early in the natural sleep period;
• the structure of the sleep is degraded by substances in the body such as drugs, caffeine, alcohol, etc.; or
• a sleeper cannot get to sleep (insomnia).
Fatigue can also be acute when a person stays awake for long periods of time to complete work. Often, both types of fatigue co-exist. Personnel may suffer from accumulated fatigue, then work on a job that takes over 12 hours to complete. Although reference made to fatigue in the following discussion is based on the level of performance decrement expected after personnel have been awake for 12 hours or more, for most cognitive components the combined effects of accumulated and acute fatigue should be considered (Williamson et al., 2000; Arnedt et al., 2001). Note that for most cognitive components, performance showed an increasingly greater decrement as the number of hours of wakefulness increased beyond 12 hours. Also note that degradation in performance begins gradually after only nine hours of wakefulness (time since rising from the previous main sleep period) and becomes significant by 12 hours (Williamson et al., 2000). AM personnel suffering from accumulated fatigue are likely to perform worse than those in the studies, since the groups were fully rested before study trials began (Rhodes, 2001).
4.1.2 Support for the Task Component Approach Since the present work uses fatigue susceptibility of task components to determine the likely overall effect of fatigue on a task grouping, it is important to base this on experiences contained in the literature. Several studies have developed and tested a number of cognitive tests to show their validity as indicators of fatigue (Beatty and Katz, 1977; Blagrove, 1996; Blagrove et al., 1995; Brown et al., 1994; Englund et al., 1984; Harrison and Horne, 1996; 1997a; 1997b; 1998; 2000a; 2000b; Harrison et al., 1997; Angus and Heslegrave, 1985; Hockey et al., 1998; May and Kline, 1988; Pilcher and Huffcutt, 1996; Ryman et al., 1984; Williamson and Feyer, 1995; and Wimmer et al., 1992). These studies point to the impact of fatigue on specific cognitive task components.

28
Memory, Attention, Vigilance and Reasoning Sleep deprivation studies have shown that a high level of fatigue (over 20 hours of sustained wakefulness) significantly impairs working memory, and reduces attention and logical reasoning skills (Angus et al., 1992; Drummond and Brown, 2001; Dummond et al., 1998; Angus and Heslegrave, 1985; Pilcher and Huffcutt, 1996; Proctor et al., 1996; and Ryman et al., 1985). Studies by Lemond and Dawson (1999) and Arnedt et al. (2002) show that these cognitive areas are degraded even after nine hours of being awake. These same studies show that after 17 hours, performance is equivalent to that found in subjects having over 0.08 percent blood alcohol concentration. Williamson et al. (2000) found that assessments of truck drivers participating in simulated driving tasks showed significant performance decrements due to fatigue in reaction time, tracking behaviour, vigilance, coding numbers, and using working memory. Vigilance during inspection is critical, yet fatigue causes a reduction in attentiveness and the ability to maintain focus on defects (Beatty and Katz, 1977; De Gennaro et al., 2001; Drury et al., 1997a; Hockey et al., 1998; Proctor et al., 1996). Decrements in working memory included poorer recollection of events or objects seen in the immediate past (Harrison and Horne, 2000a); and profound short- and long-term memory loss after accumulated long-term partial sleep deprivation (Pilcher and Huffcutt, 1996).
Communications, Planning and Decision-Making Communications coherency was significantly degraded by fatigue in numerous studies (Kim et al., 2001; Harrison and Horne, 1997a; 1997b; 1998; Whitmore and Fisher, 1996). Decision-making and innovative thinking was shown to be significantly degraded by fatigue in a number of studies (Harrison and Horne, 1999; 2000b; Larsen, 2001; Neri et al., 1992).
Studies by Harrison and Horne (1996) and Harrison et al., (1997) indicated that planning tasks were significantly degraded by fatigue. This research shows that the ability to plan strategy and process complex information is highly sensitive to the effects of fatigue.
Physical Tasks Although several studies found that cognitive tasks were affected by fatigue, physical tasks do not seem to be affected to the same degree (Patton et al, 1989). Physical tasks are only degraded after extremely long periods of wakefulness (greater than 36 hours). However, the U.S. Naval Health Research Center has conducted studies on the impact of sustained operations (over 48 hours of sustained wakefulness), and results show that sleep deprivation does reduce the speed of coordinated movements (Hodgdon, 1986). This is important for AM personnel who use fine motor actions for many subtasks in disassembly and reassembly tasks. In effect they become clumsier as they become more fatigued. Accumulated fatigue likely affects AM personnel similarly.
Circadian Effects Circadian effects have been shown to seriously degrade cognitive performance and may have a synergetic effect when combined with fatigue (Englund et al., 1984). Performance between 03:00 and 05:00 is lower for anyone, sleep deprived or not. Kelly (1996) reviewed the literature and found that circadian effects alone could cause significant (20 to 40 percent)

29
degradation in cognitive performance. Williamson and Feyer (1995) found that more than half the accidents they studied in an Australia-wide data collection for all work facilities, occurred at night. Adding fatigue to already degraded night-time cognitive performance will cause even greater performance decrements.
4.1.3 Aircraft Maintenance Task Groupings Review of the literature, discussions with AM personnel, and observations of aircraft maintenance tasks resulted in the following task groupings:
• Inspection
• Job planning
• Troubleshooting
• Disassembly/reassembly
• Repair
• Calibration
• Testing
• Documentation
• Supervision
• Training
• Lubrication
• Communications with other trades
• Cleaning
• Operating hoist equipment
• Operating transport equipment
4.1.4 Cognitive and Physical Components of the Task Groupings Table 4 lists the physical and cognitive components for each task grouping. The cognitive and physical components of the task groupings have been derived from observations and descriptions made by Drury et al. (1990) and Hobbs and Williamson (2002). Task groupings and their associated task components are described in the paragraphs following Table 4.

30
Table 4 Task Groupings
Task Grouping Physical Components Cognitive Components
Inspection • Fine motor • Large motor
• Attention (vigilance) • Visual perception (search) • Working memory • Decision making • Information processing • Psychomotor activity
Job planning • Fine motor • Working memory • Information processing • Decision making • Communications • Visual perception (search) • Attention • Long term memory
Trouble-shooting • Fine motor • Light large motor
• Working memory • Information processing • Decision making • Communications • Attention • Long term memory
Disassembly/ Reassembly • Small motor • Large motor • Light and heavy lifting • Pushing and pulling
• Attention • Working memory • Decision making • Communications • Attention • Long-term memory • Psychomotor
Repair • Small motor • Large motor • Light and heavy lifting • Pushing
• Attention • Working memory • Decision making • Long term memory • Psychomotor
Calibration • Fine motor • Light large motor
• Attention • Visual and auditory perception • Working memory • Information processing • Decision making
Continued...
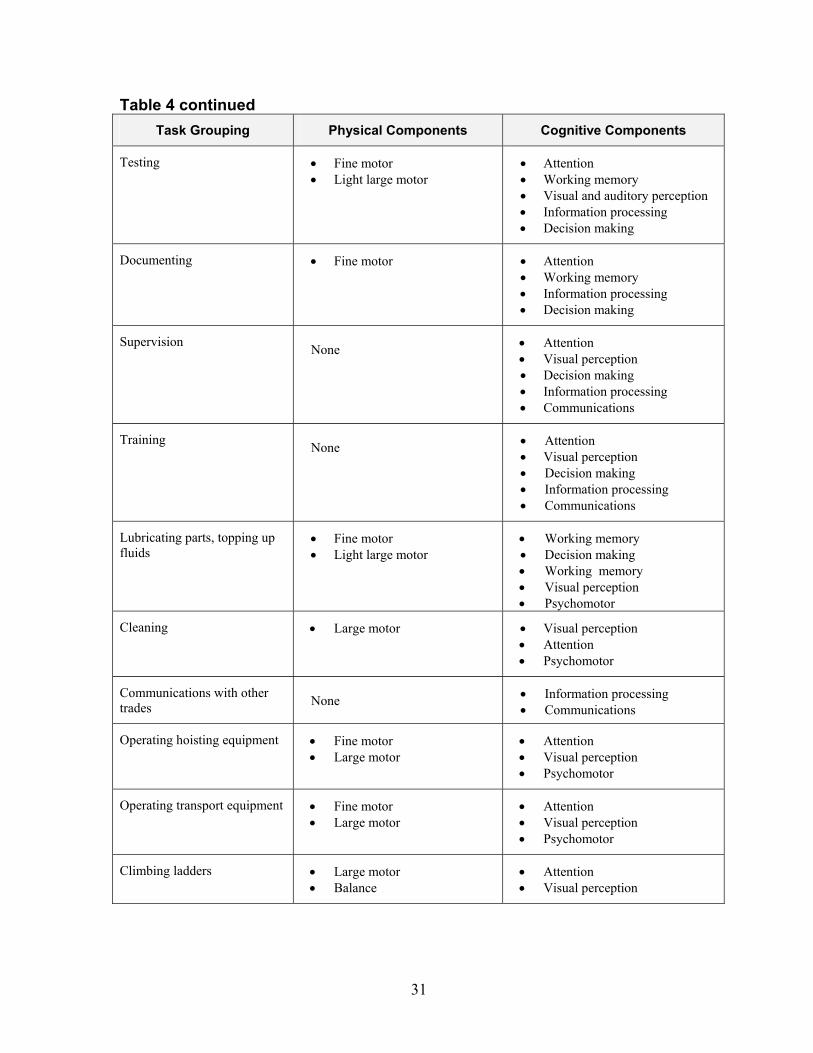
31
Table 4 continued Task Grouping Physical Components Cognitive Components
Testing • Fine motor • Light large motor
• Attention • Working memory • Visual and auditory perception • Information processing • Decision making
Documenting • Fine motor
• Attention • Working memory • Information processing • Decision making
Supervision None • Attention • Visual perception • Decision making • Information processing • Communications
Training None • Attention • Visual perception • Decision making • Information processing • Communications
Lubricating parts, topping up fluids
• Fine motor • Light large motor
• Working memory • Decision making • Working memory • Visual perception • Psychomotor
Cleaning • Large motor • Visual perception • Attention • Psychomotor
Communications with other trades None • Information processing
• Communications
Operating hoisting equipment • Fine motor • Large motor
• Attention • Visual perception • Psychomotor
Operating transport equipment • Fine motor • Large motor
• Attention • Visual perception • Psychomotor
Climbing ladders • Large motor • Balance
• Attention • Visual perception

32
Inspection Drury et al. (1990) describe the inspection task during their task analysis of aircraft inspection jobs. The subtasks include:
• Initiating – Review work cards, read manual/manufacturer’s information, understand what is to be done.
• Accessing – Locate area on aircraft and get into position to do task.
• Searching – Move eyes systematically across the area to be inspected.
• Decision making – Compare area inspected with standards.
• Responding – Mark defect, write up repair sheet or if no defect, return to search.
• Repairing – Correct defect.
• Final inspection – Visually inspect marked area after repair is completed.
Initiation involves visual perception and information processing (comprehending written material). Accessing equipment involves small motor control to operate small hand tools and latches on access panels, and large motor activity involved in walking, climbing, swinging nacelles, access panels and doors open or closed. Searching involves visual perception. Decision making is also required for the inspection job, such as determining what the next course of action will be. Fine motor control is needed for marking the defect and for completing the maintenance repair sheet. Repair involves the elements for disassembly/reassembly and/or repair as described in this literature review (Drury et al., 1990). Final inspection involves visual perception and decision making (the ability to determine whether the repair is acceptable).
Much of the work in service, A- and C-checks (partial and complete overhauls of the aircraft) involves inspecting various parts of the aircraft according to the age of the aircraft and number of hours in the air since the last check. These inspection subtasks are degraded by fatigue: memory, decision-making and vigilance components (Harrison and Horne, 1996; 2000). Hence, remembering to cover all items on the checklists, deciding on the condition of components, airframe and surfaces, and maintaining focus on the subtask at hand are all degraded by fatigue. Attempting this critical process after 12 hours of being awake, early in the morning, is demanding and requires extra effort to accomplish effectively.
Personnel must inspect their work on completion to ensure that job has been accomplished satisfactorily. This often occurs at the end of very long shifts. The visual search component is affected by fatigue to a lesser degree, in that accuracy is somewhat degraded. However, the duration of the search becomes longer, which decreases the efficiency of personnel (De Gennaro et al., 2001).
Planning the Job Job planning involves reading documentation (manuals, drawings, part labels, work orders, etc.), communicating with others, deciding on correct procedures, computer research, obtaining tools and support equipment, processing information (working out strategies and access options), and entering part numbers on part request forms. Personnel must remember

33
to bring the correct parts and tools to the repair site. Planning requires creative thought if the job is unfamiliar and difficult.
Job planning requires high-level thinking, which is degraded by fatigue. Identifying parts, planning work strategies, reviewing diagrams and procedures, and determining what tools are needed is negatively impacted when personnel are fatigued (Harrison and Horne, 1996). Decisions about parts required, substitute parts, correct procedure and appropriate tools are significantly affected by fatigue (Harrison and Horne, 1999). Fatigue may degrade the visualization of the task steps and process, since this brain function is mostly processed by the frontal lobe of the brain, an area that is significantly disabled when a person is fatigued (Harrison and Horne, 1996). Fatigue may also cause some reduction in the attention to detail. Reviewing the procedure for an unfamiliar design may be done more hastily than when rested.
The time of day also affects how well task components can be accomplished. People become far less effective between 03:00 and 05:00 (Wright et al., 1999). Memory often becomes more limited and retrieving the wrong tools can occur. Although technically the disassembly subtask requires following a procedure, experienced maintenance personnel use their skills and knowledge of similar equipment to accomplish subtasks. Procedures are usually referred to only when personnel are faced with a completely new piece of equipment. However, the planning stage involves checking the documentation prior to doing the job. If the disassembly appears to be different than past experience would suggest, maintenance personnel are more likely to follow procedures. This process is significantly affected by fatigue.
Since decision-making, attention and memory are sensitive to fatigue, maintenance personnel are less likely to pick up subtle differences between past component designs and a new design. If keying of parts, particularly connectors, is not used, the chance of attaching the wrong hose, cable or tube is greater when fatigued.
Disassembly and Assembly of Components and Structures Removal and replacement of equipment involves large and small motor activity to handle tools, open access panels and doors, and lift equipment. Personnel use visual perception to access fasteners, clamps, connectors, etc. Psychomotor activity is required for deft handling of tools and lock wire removal etc. Memory is required to recall the sequence of actions required, proper orientation of parts, and the proper operation of certain fasteners, clamps etc. One of the most important actions in the reassembly subtask involves remembering all of the necessary steps. Forgetting to complete a particular step may be crucial to the safe operation of the aircraft.
Physical subtask components such fine motor control for using wrenches, cutting lock wire, removing/replacing clamps, etc., and lifting light components, will be less sensitive to fatigue than large motor activities such as lifting heavy components and attaching and removing jigs (Patton et al, 1989; Hodgedon, 1986).
Assembly requires that maintenance personnel remember the steps and their sequence. Remembering proper step sequence is degraded by fatigue (Harrison and Horne, 2000). When assembling unfamiliar equipment, fatigued maintenance personnel are more likely to inadvertently follow a process normally used for more familiar equipment (Harrison and Horne, 1999).

34
Troubleshooting Troubleshooting involves accessing on-board equipment, displays, and controls. Visual perception, small motor actions such as using the keyboard on on-board computers and listening for feedback (auditory cues, correct auditory response of equipment etc.) involving auditory perception are all required. According to Drury (1997b), in addition to visual and touch cues, maintenance personnel also use their sense of smell to locate problems when inspecting equipment. Personnel must decide on the correct procedure, read it if it is unfamiliar and develop a strategy (information processing). Since troubleshooting may also involve complex lengthy procedures, memory is involved. Most importantly, creative thought is necessary to track problems well. Complex information processing is a major component of troubleshooting subtasks. Both creative thought and complex information processing are severely degraded by moderate levels of fatigue (Harrison and Horne, 1999).
The troubleshooting subtask requires that AM personnel rely on past experience (long-term memory), a mental model of the situation (information processing), attention (being vigilant for system responses or clues), and the ability to keep track of the process (working memory). All of these brain functions are degraded by fatigue (Harrison and Horne, 1999). The troubleshooting component that may be most susceptible to fatigue is the establishment of an accurate mental model (appraising the situation and updating information to maintain situational awareness). When fatigued, maintenance personnel are tempted to fall back on their experience in similar situations. The danger is that the new situation is different enough that it is inappropriate. Once a mental model is established, even an inappropriate one, it is difficult to change, particularly when the individual is fatigued and less able to think creatively.
Repair of Components and Structures Repair requires a high degree fine motor control and psychomotor skill. Usually subtasks require operating hand tools, manipulation of materials and attention to detail. Creative thought is necessary when a job requires novel approaches. Adequate visual and auditory perception is needed to ensure that all portions of the job are done within the specifications.
Repair of components, structures and aircraft surfaces (often involving the airframe and fuselage), require a high degree of skill and ingenuity. Repairing damage to the airframe or to an associated subassembly requires attention to detail, planning, and skilled psychomotor control. Fatigue degrades all of these elements somewhat, but maintaining attention to detail is affected most. Personnel must concentrate on overcoming the effects of fatigue when the job requires precision and accuracy. However, there is a point where the individual becomes less careful; motivation to perform well decreases and the consequences of errors become less important (Folkard, 1996). Although well-practised techniques suffer less, any repair work that requires an unfamiliar approach is seriously degraded by fatigue (Harrison and Horne, 1999).
Calibration Maintenance personnel sometimes calibrate on-board equipment. As with troubleshooting, this subtask involves visual perception (viewing readouts on displays, locating keys on keypads and controls for adjusting equipment), fine motor control (using dials and entering

35
data on keypads and keyboards), auditory perception (listening to auditory cues), and decision making (deciding on the correct procedure and interpreting equipment response). Memory is important for following procedures and remembering correct settings, etc.
Calibration is mostly rule-based and requires staying on task and tracking a series of steps. Since working memory is significantly affected by fatigue, performance of calibration is adversely affected (Harrison and Horne, 2000).
Testing This subtask involves visual perception (viewing readouts on displays, locating keys on keypads and controls for adjusting equipment), fine motor control (using dials and entering data on keypads and keyboards), auditory perception (listening to auditory cues), and decision making (deciding on the correct procedure and interpreting equipment response). The subtask also involves recording data and following procedures.
Test procedures are mostly rule-based, requiring the performer to stay on task and keep track of the steps involved. Working memory is a key part of the subtask. Forgetting the step sequence or missing a step can be disastrous. Fatigue affects the memory component of this subtask (Harrison and Horne, 1999).
Documenting Work Recording information requires memory, attention, visual perception and small motor skills. After a job has been completed, AM personnel must document the work on forms provided by their maintenance operation. They must record the numbers of the parts used and removed, the condition of the parts removed, any irregularities in the airframe components, surfaces or interfaces, problems encountered, and their signature (or an authorized individual’s if they are not able to sign off) to verify that the job was done correctly. Decisions are made based on the results of the subtask and recommendations considered. The authorized AM technician stamps the form, certifying that the work has been completed correctly and completely. Fatigue degrades both the memory and decision-making components of the documenting subtask.
Supervision of Other Aircraft Maintenance Personnel This subtask involves keeping track of work under way, helping others with subtasks if necessary, and monitoring and approving the work completed. This subtask requires attention (vigilance), communications, creative thought (information processing), and visual perception.
Supervising others involves conveying information correctly, clearly and in a timely fashion to ensure that the individual receiving it can respond and act appropriately. Decisions must be made about how personnel are to respond to changing situations, with appropriate directions. Supervision includes monitoring staff and the changing operational environment. The communications, attention and decision-making, logical reasoning, and appraisal of supervision are degraded by fatigue. Harrison and Horne have shown that decision-making processes and critical reasoning are significantly affected by fatigue (2000; 1996). These

36
same researchers also found that speech and language abilities are degraded significantly by fatigue (Harrison and Horne, 1997; 1998).
Training of Other Aircraft Maintenance Personnel Like supervision, this subtask involves monitoring the work of others, helping others with subtasks if necessary (coaching), and approving the work completed. This subtask requires attention, vigilance, communications, creative thought (information processing), and visual perception.
As in supervision, communications, attention, logical reasoning and decision-making components of training are degraded by fatigue.
Communications with Other Aircraft Maintenance Personnel, Pilots, Cabin Crew, and Management Harrison and Horne (1998) have found that forming and completing coherent sentences can be very difficult for people when they are fatigued. Communications are incomplete and do not always make sense, particularly to others who are also fatigued.
Lubricating Components, Topping Up and Replacing Fluids Lubrication activities require that personnel pay attention to schedules, remember to top up reservoirs when servicing aircraft, and exercise care when filling reservoirs. Forgetting to fill or top up a reservoir is potentially disastrous. A well-functioning working memory is important, as is maintaining up-to-date situational awareness. These task components are highly susceptible to the effects of fatigue.
Cleaning Components and Surfaces Cleaning is an important subtask that must be thoroughly done. If cleaning is not done properly, parts may not fit together properly, seals may not seat and leaks may result. This requires attentiveness and focus, in addition to reasonable psychomotor ability (to be able to properly clean the surfaces of parts). Visual perception must be good, and a sensitive touch is important. Fatigue may degrade visual perception significantly, and to a lesser extent, touch sensitivity may be dulled.
Operating Heavy Equipment Psychomotor skills like tracking and eye-hand coordination are necessary to operating most heavy equipment in the hangar, or out on the ramp. This is also required when starting up aircraft engines, towing and sometimes taxiing the aircraft, and running many of the systems. Following procedures is critical. When fatigued, personnel find it more difficult to concentrate on the steps involved in procedures, and experience reduced psychomotor performance.

37
4.2 Fatigue Susceptibility of Aircraft Maintenance Task Components
Task components are rated according to potential performance degradation (susceptibility) due to fatigue.
The fatigue susceptibility scale is: 4 = very susceptible; 3 = susceptible; 2 = somewhat susceptible; and 1 = negligible susceptibility. Table 5 shows the level of susceptibility for each task component as derived from the literature (i.e. estimated sensitivity to fatigue). These values are then multiplied against the percent breakdown values for task components of the task groupings in Table 6 for the final estimate of the effect of fatigue on that task grouping.
Table 5 Task Component Susceptibility
Task Component
Fatigue Susceptibility
Level
References
(see list of references)
Cognitive Components
Attention 4 2, 5, 7, 8, 10, 18, 20, 23, 24, 25, 26, 28, 29, 30, 31, 33, 39, 40, 42, 45, 46, 47, 48, 56, 58
Visual perception 3 2, 5, 7, 8, 10, 18, 20, 23, 24, 25, 26, 28, 29, 30, 31, 33, 39, 40, 42, 45, 46, 47, 48, 56, 58
Auditory perception 3 2, 5, 7, 8, 10, 20, 23, 24, 25, 26, 28, 29, 30, 31, 33, 39, 40, 42, 45, 47, 48, 56, 58
Working memory 4 2, 5, 7, 8, 10, 20, 23, 24, 25, 26, 28, 29, 30, 31, 33, 39, 40, 42, 45, 47, 48, 56, 58
Information processing
4 2, 5, 7, 8, 10, 20, 23, 24, 25, 26, 28, 29, 30, 31, 33, 39, 40, 42, 45, 48, 56, 58
Decision making 4 27, 29, 39, 43
Communications 4 24, 25, 38, 55
Psychomotor 3 31, 56
Physical Components
Fine motor 3 34, 44
Large motor 2 34, 44
Pushing and pulling 2 34, 44
Light lifting 1 34, 44
Heavy lifting 2 34, 44
Bending/Stooping 2 34, 44
Reaching 2 34, 44
Climbing 2 34, 44

38
4.3 Summaries for Aircraft Maintenance Task Groupings Each task component was assessed for susceptibility to the impact of fatigue, based on the literature review. The assessment of fatigue involved assigning a level of fatigue as suggested by the results of studies measuring fatigue effects on particular task components.
Step 1
The contribution of each task component to the composition of each observed subtask was totalled. For example, the percent contributions of each physical and cognitive component for the engine disassembly/reassembly subtask were added together. The observed subtask, engine disassembly/reassembly of the engine replacement job, involved 35 task elements (see line items in Table A1 in Appendix A). Figure 7 is a graphic illustration of step 1.
Step 2
Now, taking fine motor control as an example, we average the contributions of fine motor control for the SUBTASK disassembly/reassembly of the engine by dividing the sum of all percent contributions for fine motor control (635 percent) by the total number of task elements in the subtask, which is 35 (see Figure 8).
Step 3
The averages for the percent contribution of the total for the task component “fine motor control” for all disassembly/reassembly subtasks required in all maintenance activities are then added (see Figure 9).
Step 4
We then divide the total of the averages by the number of subtasks (see Figure 10).
Step 5
The percent contribution (Figure 11) of each task component for each task grouping is multiplied by its respective fatigue rating. [Note that the fatigue rating just happens to be the same number as the number of subtasks – hence the fatigue index just happens to be the same number as the total averages].
Table 6 shows the summary data percent contributions and associated fatigue scores for the task groupings. The table includes the average percent contribution of task components to each task grouping. The calculated fatigue index is shown beside each percent of contribution. The total fatigue index for all of the task components can be found in the last row of the table. Of course the total percent of all percent contributions for each task component equals 100 percent.

39
Figure 7 Step 1 Calculation
Fine motor 20%
Pushing/ pulling 50%
Visual perception 10%
TASK ELEMENT #1
AME and ATs open nacelle
covers
Fine motor 50%
Psychomotor 20%
TASK ELEMENT #2
AME and ATs disconnect hoses, tubing, fuel lines
etc.
TASK ELEMENT #35
Record the job completion
information into logbook.
Fine motor 20%
= Total percent contribution for fine motor for this subtask
Task Components
Task Elements
Pushing/ pulling 0%
Pushing/ pulling 0%
Large motor 0% Large motor 0% Large motor 0%
Psychomotor 0% Psychomotor 0%
Visual perception 0%
Visual perception 20%
= Total percent contribution for push-pull for this subtask
= Total percent contribution for large motor for this subtask
Total percent contribution for psychomotor for this subtask
= Total percent contribution for visual perception for this subtask
=
Example for the following
steps
... etc.
AIRCRAFT MAINTENANCE JOB e.g. replace engine
Job Planning Disassembly/Reassembly Testing
1. AME and ATs open nacelle covers
1. AME obtains job card describing snag.
Large motor activity 80%
Visual attention 10%
Information Proc. 10%
Fine motor 20%
Pushing/ Pulling 50%
Visual perception 10%
Attention 10%
Each task element has physical and cognitive components, each with a percent contribution to that task element.
Communications 10%
Engine change out subtasks
Task Element

40
Figure 8 Step 2 Calculation
Figure 9 Step 3 Calculation
Figure 10 Step 4 Calculation
Figure 11 Step 5 Calculation
Average of fine motor percent contribution
for subtask disassembly/
reassembly of engine
18.1%
Average of fine motor percent contribution
for subtask disassembly/
reassembly of stator vane actuator
23.6%
Average of fine motor percent contribution
for disassembly/ reassembly of the
thrust reverser door
28.6%
= Total of averages
of fine motor percent
contribution for all disassembly/
reassembly subtasks 70.3%
SUBTASK 1 SUBTASK 2 SUBTASK 3 TOTAL
TOTAL OF AVERAGES
70.3% ÷
NUMBER OF SUBTASKS
3 =
OVERALL AVERAGE PERCENT CONTRIBUTION FOR FINE MOTOR
CONTROL TASK COMPONENT FOR THE DISASSEMBLY/REASSEMBLY TASK
GROUPING
23.4%
Percent Contribution for Fine Motor for
Disassembly/reassembly Task Grouping
23.4%
Fatigue rating for fine motor control
3 =
Fatigue Index for Fine Motor for Disassembly/
reassembly Task Grouping
70.3
635% / 35 = 18.14 % Average percent contribution of fine motor for specific subtask

41
Table 6 Percent Contributions and Associated Fatigue Scores for Task Groupings
Average Contribution
(%)
Fatigue Index
Average Contribution
(%)
Fatigue Index
Average Contribution
(%)
Fatigue Index
Average Contribution
(%)
Fatigue Index
Average Contribution
(%)
Fatigue Index
Average Contribution
(%)
Fatigue Index
Average Contribution
(%)
Fatigue Index
Average Contribution
(%)
Fatigue Index
Cognitive Components Attention (4) 13.2 52.9 0.0 0.0 20.9 83.6 2.2 8.7 10.0 40.0 7.8 31.1 20.0 80.0 0.0 0.0
Visual perception (3) 25.4 76.2 21.1 63.3 23.6 70.9 11.9 35.7 20.0 60.0 25.0 75.0 15.0 45.0 20 60.0
Auditory perception (3) 0.0 0.0 0.0 0.0 4.5 13.6 1.2 3.6 10.0 30.0 0.0 0.0 5.0 15.0 0.0 0.0
Working memory (4)2.4 9.6 5.6 22.2 0.0 0.0 4.9 19.6 5.0 20.0 0.0 0.0 5.0 20.0 0.0 0.0
Information processing (4)14.9 59.6 15.0 60.0 9.1 36.4 0.9 3.4 5.0 20.0 17.8 71.1 10.0 40.0 30 120.0
Decision making (4) 23.4 93.6 10.6 42.2 13.6 54.5 7.7 31.0 10.0 40.0 14.4 57.8 20.0 80.0 20 80.0
Communications (4) 8.1 32.5 28.3 113.3 12.3 49.1 3.6 14.3 0.0 0.0 27.8 111.1 5.0 20.0 0.0 0.0
Psychomotor (3) 1.3 3.8 2.2 6.7 7.3 21.8 19.1 57.4 10.0 30.0 2.2 6.7 10.0 30.0 10 30.0
Physical Components
Fine motor (3) 5.5 16.5 8.3 25.0 8.6 25.9 23.4 70.3 20.0 60.0 5.0 15.0 10.0 30.0 20 60.0
Large motor (2) 1.7 3.4 8.9 17.8 0.0 0.0 18.6 37.1 10.0 20.0 0.0 0.0 0.0 0.0 0.0 0.0
Pushing and pulling (2)2.2 4.4 0.0 0.0 0.0 0.0 4.4 8.8 0.0 0.0 0.0 0.0 0.0 0.0 0.0 0.0
Light lifting (1) 0.0 0.0 0.0 0.0 0.0 0.0 0.0 0.0 0.0 0.0 0.0 0.0 0.0 0.0 0.0 0.0
Heavy lifting (2) 0.9 1.9 0.0 0.0 0.0 0.0 1.3 2.7 0.0 0.0 0.0 0.0 0.0 0.0 0.0 0.0
Bending and stooping (2) 0.6 1.3 0.0 0.0 0.0 0.0 0.4 0.8 0.0 0.0 0.0 0.0 0.0 0.0 0.0 0.0
Reaching (2) 0.0 0.0 0.0 0.0 0.0 0.0 0.7 1.3 0.0 0.0 0.0 0.0 0.0 0.0 0.0 0.0
Climbing (2) 0.3 0.6 0.0 0.0 0.0 0.0 0.0 0.0 0.0 0.0 0.0 0.0 0.0 0.0 0.0 0.0
Total 100.0 356.3 100.0 350.6 100.0 355.9 100.2 294.6 100.0 320.0 100.0 367.8 100.0 360.0 100.0 350.022.3 21.9 22.2 18.4 20.0 23.0 22.5 21.9
Task Grouping
Repair CalibrationTask Components
(Fatigue Level)
Testing DocumentingInspection Job planning Trouble-shooting Disassembly/ Assembly
Continued ...

42
Table 6 continued
Average Contribution
(%)
Fatigue Index
Average Contribution
(%)
Fatigue Index
Average Contribution
(%)
Fatigue Index
Average Contribution
(%)
Fatigue Index
Average Contribution
(%)
Fatigue Index
Average Contribution
(%)
Fatigue Index
Average Contribution
(%)
Fatigue Index
Cognitive Components
Attention (4) 20.0 80.0 10.0 40.0 10.0 40.0 5 20.0 5 20.0 20 80.0 20 80.0 740.4 49.4
Visual perception (3) 15.0 45.0 10.0 30.0 10.0 30.0 5 15.0 0.0 0.0 20 60.0 20 60.0 908.3 60.6
Auditory perception (3) 5.0 15.0 5.0 15.0 0.0 0.0 0.0 0.0 5 15.0 0.0 0.0 5 15.0 147.9 9.9
Working memory (4)5.0 20.0 5.0 20.0 20.0 80.0 0.0 0.0 0.0 0.0 0.0 0.0 0.0 0.0 264.4 17.6
Information processing (4)5.0 20.0 5.0 20.0 0.0 0.0 0.0 0.0 0.0 0.0 0.0 0.0 0.0 0.0 563.1 37.5
Decision making (4) 20.0 80.0 10.0 40.0 10.0 40.0 5 20.0 20 80.0 15 60.0 15 60.0 1013.9 67.6
Communications (4) 30.0 120.0 40.0 160.0 0.0 0.0 0.0 0.0 70 280.0 0.0 0.0 0.0 0.0 1125.4 75.0
Psychomotor (3) 0.0 0.0 0.0 0.0 10 30.0 10 30.0 0.0 0.0 20 60.0 20 60.0 428.5 28.6
Physical ComponentsFine motor (3) 0.0 0.0 10.0 30.0 20 60.0 50 150.0 0.0 0.0 15 45.0 10 30.0 793.6 52.9
Large motor (2) 0.0 0.0 5.0 10.0 10 20.0 25 50.0 0.0 0.0 10 20.0 10 20.0 277.5 18.5
Pushing and pulling (2)0.0 0.0 0.0 0.0 0.0 0.0 0.0 0.0 0.0 0.0 0.0 0.0 0.0 0.0 19.7 1.3
Light lifting (1) 0.0 0.0 0.0 0.0 10 10.0 0.0 0.0 0.0 0.0 0.0 0.0 0.0 0.0 20.0 1.3
Heavy lifting (2) 0.0 0.0 0.0 0.0 0.0 0.0 0.0 0.0 0.0 0.0 0.0 0.0 0.0 0.0 6.8 0.5
Bending andstooping (2) 0.0 0.0 0.0 0.0 0.0 0.0 0.0 0.0 0.0 0.0 0.0 0.0 0.0 0.0 3.0 0.2
Reaching (2) 0.0 0.0 0.0 0.0 0.0 0.0 0.0 0.0 0.0 0.0 0.0 0.0 0.0 0.0 2.0 0.1
Climbing (2) 0.0 0.0 0.0 0.0 0.0 0.0 0.0 0.0 0.0 0.0 0.0 0.0 0.0 0.0 0.9 0.1
Total 100.0 380.0 100.0 365.0 100.0 310.0 100.0 285.0 100.0 395.0 100.0 325.0 100.0 325.0 421.023.8 22.8 19.4 17.8 24.7 20.3 20.3
Task Grouping
Total
Overall Average Contri-bution
Task Components (Fatigue Level)
Operating hoisting equipment
Operating transport equip-mentSupervision Communications
with other tradesTraining Lubricating parts, topping up fluids Cleaning

43
4.4 Fatigue Susceptibility of Task Groupings Fatigue susceptibility ratings (fatigue index) were calculated for each task grouping based on the calculations described in 4.3. Table 7 contains the fatigue susceptibility level for each task grouping and shows the associated fatigue score ranking from 1 (most affected by fatigue) to 15 (least affected). The fatigue index shown in Table 7 is based on component contributions for each task grouping, calculated by summing the products of the un-weighted fatigue estimate obtained from the task component multiplied by the contribution of each of these components. These contribution-weighted fatigue indices will be used for the risk analysis. Note that there is a 27.8 percent difference in the fatigue rating between the highest ranked task grouping and that of the lowest.
Table B1 in Appendix B shows the calculations for the fatigue indices.
Table 7 Fatigue Index for Task Groupings
Task Grouping Fatigue Index
Score (Score X 0.01)
Rank
Communications with other trades 395.0 (3.950) 1
Supervision 380.0 (3.800) 2
Calibration 367.8 (3.678) 3
Training 365.0 (3.650) 4
Testing 360.0 (3.600) 5
Inspection 356.3 (3.563) 6
Troubleshooting 355.9 (3.559) 7
Job planning 350.6 (3.506) 8
Documenting 350.0 (3.500) 9
Operating transport equipment 325.0 (3.250) 10
Operating hoisting equipment 325.0 (3.250) 11
Repair 320.0 (3.200) 12
Lubricating parts, topping up fluids 310.0 (3.100) 13
Disassembly/assembly 294.6 (2.946) 14
Cleaning 285.0 (2.850) 15

44
4.5 Discussion of Fatigue Estimates The results reported in Table 7 show that, as expected, tasks that are mostly cognitive, particularly reliant on attention, working memory, decision making and communications, show the highest estimates for fatigue susceptibility (i.e. the highest fatigue index).
The task groupings least affected are those that have a higher contribution of physical components. Although these components can be affected by fatigue, personnel can more easily compensate for the effects (i.e. easier to pace themselves) compared to cognitive components. Also, it has been shown that the effects of fatigue on physical tasks do not become significant until personnel remain awake for longer periods of time than the lesser amount of time it takes for cognitive tasks to become degraded. Thus, it is the memory and attention components of the disassembly/reassembly task grouping that are most susceptible to fatigue. However, most of this task grouping involves physical components. Hence, the disassembly/reassembly task grouping received a low-level estimate for fatigue susceptibility. The cleaning task is almost entirely physical, with some decision making, visual perception and attention components.
The un-weighted estimates of fatigue susceptibility are derived from the literature, which does not consider the impact of work conditions. These estimates only consider the impact fatigue has on these task components given near ideal conditions, since many studies were conducted in less complex laboratories or field environments than found in aircraft maintenance. Using the HEART method, the human error analysis (section 4.6), considers the impact of boredom, time of day, environmental conditions, and time limitations on fatigue susceptibility.
4.6 Human Error Analysis 4.6.1 Findings from the Human Error Analysis The findings for human error analysis are organised as follows:
• Description of scenarios developed
o List of storyboards developed (see Appendix G – Scenarios) o Underlying assumptions
• Conceptual event trees
o List of event trees (see Appendix H) o Final scenarios and event trees used for risk analysis
• Error modes conditions consequences analysis (EMCCA – see Appendix I)
o List of error modes for each task grouping
• Relationship Between Error Modes and Fatigue
• Discussion of error modes and their relationship to error producing condition

45
• HEART Analysis o See Appendix J for HEART tables of probabilities for all error modes for each
task grouping
o Summary results of HEART analysis
4.6.2 Scenarios Used in the Analysis Jobs used for scenarios, and subsequently for event trees, included those observed and analysed during the task analysis. These jobs provide adequate coverage of the task groupings so that the impact of fatigue on risk can be estimated. The following scenarios were used to assess the relative risk of fatigue for aircraft maintenance tasks:
• Scenario 1 - Engine replacement: o Planning o Disassembly/reassembly o Testing
• Scenario 2 – Stator vane actuator replacement o Planning o Disassembly/reassembly o Testing
• Scenario 3 – C-check – Replacement of thrust-reverser door o Planning o Disassembly/reassembly o Testing
• Scenario 4 – A-Check – Part 1 o Avionics inspection
• Scenario 5 – A-Check – Part 2 o Mechanical inspection
• Scenario 6 – A-Check – Part 3 o Avionics adjustment
• Scenario 7 – A-check –Part 4 o Planning for A-Check jobs o Cargo bay inspection
• Scenario 8 – Service-check – Part 1 o Troubleshoot snag – door position sensor
• Scenario 9 – Service-Check – Part 2 o Inspections of tires, fluid levels and snag list
• Scenario 10 – Service-Check – Part 3 o Topping up fluids
The storyboards describing these scenarios and associated assumptions are found in Appendix G. It is assumed that rested individuals who are working their first night after four days off are used for risk and probability calculations made without fatigue. Risk and probability calculations made including fatigue are based on the assumption that personnel

46
are working their fourth 10-hour 40-minute night shift, including the usual amount of overtime (i.e. an extra one to two hours per shift as observed and reported by several personnel, and as also indicated in the Phase 1 report – Rhodes, 2002). The general assumptions affecting the events depicted in the storyboards are:
• The lighting conditions around equipment is adequate to very poor (i.e. a portable service lamp is used to see components, some areas are very poorly lit, and some components are impossible to see, while other equipment is adequately visible – this is the norm for aircraft maintenance).
• The necessary documentation (drawings, task steps, tool information) is available in the area of the maintenance or in the ready room.
• The correct support equipment and tools are readily available. • Personnel who support the maintenance are assumed to be well rested. • A full complement of qualified aircraft maintenance personnel is available. • The replacement of equipment is a result of the malfunctioning of critical components
as identified by the snag log or according to an established schedule for a planned replacement/service of the item.
• The experience levels of the AMEs, ATs and apprentices are the average number of years for each.
For any departure from these assumptions it would be assumed that the risk would be either higher (e.g. when flight and cabin crew are fatigued; the maintenance crew is short staffed; few experienced personnel are available; documentation is not available or too difficult to obtain etc.) or lower (e.g. the maintenance action is being performed in a well-lit environment, etc.).
4.6.3 Relationship between the scenarios and the task groupings Table 8 shows the task groupings and the storyboards that apply.
Table 8 Storyboards that Apply to Task Groupings
Task Grouping Associated Storyboards (SBs) SB Number
Job Planning All scenarios All
Engine replacement 1
Replacement of Stator Vane Actuators 2
Disassembly/Reassembly
Replacement of Thrust Reverser Door 3
continued...

47
Table 8 continued
Task Grouping Associated Storyboards (SBs) SB Number
Testing Engine replacement 1
Replacement of Stator Vane Actuators 2
Replacement of Thrust Reverser Door 3
Avionics inspection 4
Mechanical inspection 5
Mechanical adjustment 6
Cargo bay inspection 7
Troubleshooting door sensor 8
Documentation Engine replacement 1
Replacement of Stator Vane Actuators 2
Replacement of Thrust Reverser Door 3
Avionics inspection 4
Mechanical inspection 5
Mechanical adjustment 6
Cargo bay inspection 7
Troubleshooting door sensor 8
Inspection Avionics inspection 4
Mechanical inspection 5
Cargo bay inspection 7
Service check - general 9
Troubleshooting Troubleshooting door sensor 8
Calibration Mechanical adjustment 6
continued...

48
Table 8 continued
Task Grouping Associated Storyboards (SBs) SB Number
Supervision Engine replacement 1
Replacement of Stator Vane Actuators 2
Replacement of Thrust Reverser Door 3
Avionics inspection 4
Mechanical inspection 5
Mechanical adjustment 6
Cargo bay inspection 7
Troubleshooting door sensor 8
Operating transport equipment Engine replacement 1
Communications with other trades Engine replacement 1
Avionics inspection 4
Mechanical inspection 5
Mechanical adjustment 6
Lubricating parts, topping up fluids Service Check Part 2 - general 9
Service Check Part 3 – Topping up fluids
10
Training No specific scenario N/A
Cleaning No specific scenario N/A
Operating hoisting equipment No specific scenario N/A
Repair No specific scenario N/A
4.6.4 Conceptual Event Trees See Appendix H for conceptual event trees. These trees allowed the analysts to determine the events contributing to overall risk. The conceptual event trees were based on the scenarios described in 4.7.2. These trees show the sequence of events and causal relationships included in the analysis.

49
4.6.5 Error Modes Conditions Consequences Analysis Appendix I contains the tables for EMCCA information. This information briefly describes the human factors that potentially cause error and the conditions likely to prevail at the time error modes are analysed.
The error modes were identified during the development of the event sequence for the conceptual event trees, based on the likely events that could occur leading to a potentially disastrous outcome. Only error modes potentially leading to such outcomes were considered for the comparative analysis of fatigue risks. If initiating errors had no serious consequence regardless of the enabling events, they were omitted.
Table 9 lists the error modes included in the analysis. Fifty-four individual error modes that could lead to disastrous consequences were identified.
Table 9 List of Error Modes Analysed
Task Grouping Error Modes
1. The AME/ATs misinterpret data on the job card.
2. The AME communicates conflicting/ambiguous information to the ATs.
3. The AME forgets to provide an important piece of information to ATs.
4. AME elects to perform tasks for which he/she lacks time.
5. The ATs do not check the procedure for a non-routine job.
Planning
6. The ATs neglect to check part numbers and subsequently obtain an incorrect part from stores.
7. AT installs incorrect part.
8. AT reconnects incorrect hose, coupling, cable.
9. AT follows incorrect procedure.
10. AT misses a step in the procedure.
11. AT damages fastener, connector, coupling, clamp, interface, part.
12. AT damages surrounding equipment.
13. AT fails to check work.
Disassembly/ Reassembly
14. AT fails to notice damage of an adjacent part.
15. AT forgets to record important information.
16. AT enters the wrong information on the job completion form.
17. AT approves documentation without performing a work inspection.
18. AT follows incorrect test procedure.
19. AT misses a cue during test procedure.
Documenting
20. AT enters incorrect command during test procedure.
continued...

50
Table 9 continued
Task Grouping Error Modes
21. AT follows incorrect troubleshooting procedure.
22. AT misses a cue during troubleshooting procedure.
Troubleshooting
23. AT enters incorrect command during troubleshooting procedure.
24. AME misses a critical error made by AT or apprentice.
25. AME provides incorrect information to AT or apprentice.
Supervision
26. AME forgets to check work of AT or apprentice.
27. AT damages fastener, connector, coupling, clamp, interface, part.
28. AT damages surrounding equipment.
Repair
29. Repair is substandard.
30. AT misses defect during inspection.
31. AT inspects wrong equipment.
32. AT forgets to replace equipment removed during the inspection process.
Inspection
33. AT damages equipment during the inspection process.
34. AT follows incorrect calibration procedure.
35. AT misses a cue during calibration procedure.
Calibration
36. AT enters incorrect command during procedure.
37. AME/AT misses critical error made by apprentice.
38. AME/AT provides incorrect information to apprentice.
Training
39. AME/AT forgets to check work of apprentice.
40. AT mishears/misinterprets instruction from other personnel (ramp, stores, etc.).
41. AT provides incorrect information to other personnel (ramp, stores, etc.).
Communications with other trades
42. AT forgets to inform other personnel (ramp, stores, etc.) of important information.
43. AT forgets to check fluid level.
44. AT misinterprets indication of fluid level.
45. AT forgets to top up or fill reservoir.
Lubricating parts, topping up fluids
46. AT inadvertently fills reservoir with an unapproved fluid.
continued ...

51
Table 9 continued
Task Grouping Error Modes
47. AT forgets to check area for obstacles before operating the hoist.
48. AT moves hoist in direction other than that intended.
Operating hoist equipment
49. AT misjudges distance and overshoots target.
50. AT forgets to check area for obstacles before operating the transport vehicle.
51. AT moves vehicle beyond the bounds of the area intended.
Operating transport
equipment
52. AT misjudges placement of vehicle.
53. AT damages equipment when cleaning. Cleaning
54. AT forgets to reinstall equipment removed for cleaning.
4.6.6 Relationship Between Error Modes and Fatigue The impact of fatigue on each error mode was estimated from the experience of the analysts and the fatigue index value obtained from the task analysis results. The impact of fatigue was calculated for each error mode for each task grouping (see Figure 5). This approach allowed a more efficient, general means of developing error probabilities for use in event tree analysis.
The calculation of fatigue contribution as an error-producing condition to specific error modes is shown in Appendix E.
4.6.7 HEART Analysis HEART-generated error frequencies for each task grouping are found in Appendix J. These probabilities were used to populate the risk spreadsheets described in Appendix M and contained on the CD attachment located on the back cover of this report. The risk spreadsheets show the contribution of each error mode from initiating event through all of the intervening events to the consequence. Each initiating event is represented by a risk spreadsheet.
Table 10 provides a summary of the HEART error frequencies for each task grouping, and associated error modes. The table shows individual potential error modes, associated frequencies with and without fatigue factored in, and the percent contribution of fatigue. Note that these error modes are considered to be the initiating events for the quantitative risk analysis described below in section 4.7.

52
Table 10 Summary of HEART Frequencies for Each Task Grouping
Task Grouping/Error Mode Frequencies without fatigue
Frequencies including
fatigue
Percent increase due to fatigue
Planning percent
1. The AME/ATs misinterpret data on the job card. 0.0216 0.1092 405.56
2. The AME communicates conflicting/ambiguous information to the ATs. 0.0302 0.1620 435.71
3. The AME forgets to provide an important piece of information to ATs. 0.0126 0.0480 280.95
4. AME elects to perform tasks that he/she does not have time for. 0.0126 0.0792 528.57
5. The ATs do not check with the procedure for a non-routine job. 0.0529 0.1998 277.55
6. The ATs neglect to check the part numbers and subsequently obtain an incorrect part from stores. 0.0126 0.0528 319.05
Disassembly/Reassembly
7. AT installs incorrect part. 0.05292 0.1998 277.55
8. AT reconnects incorrect hose, coupling, cable. 0.02058 0.0756 267.35
9. AT follows incorrect procedure. 0.02798 0.0952 240.33
10. AT misses a step in the procedure. 0.03427 0.1102 221.43
11. AT damages fastener, connector, coupling, clamp, interface, part. 0.0189 0.0540 185.71
12. AT damages surrounding equipment. 0.0101 0.0216 114.28
13. AT fails to check work. 0.0072 0.0126 75.00
14. AT fails to notice damage of an adjacent part. 0.0529 0.1998 277.55
Documenting
15. AT forgets to record important information. 0.0206 0.1020 395.63
16. AT enters the wrong information onto job completion form. 0.02058 0.1020 395.63
17. AT approves documentation without doing an inspection of the work. 0.0307 0.1162 278.13
Troubleshooting
18. AT follows incorrect troubleshooting procedure. 0.0206 0.0840 308.16
19. AT misses a cue during troubleshooting procedure. 0.0176 0.0680 285.71
20. AT enters incorrect command during troubleshooting procedure. 0.0176 0.0486 175.51
Continued...

53
Table 10 continued
Task Grouping/Error Mode Frequencies without Fatigue
Frequencies including
fatigue
Percent increase due to fatigue
Testing 21. AT follows incorrect test procedure. 0.0528 0.2158 312.74
22. AT misses a cue during test procedure. 0.0176 0.0520 194.90
23. AT enters incorrect command during test procedure. 0.0176 0.0680 285.71
Supervision 24. AME misses critical error made by AT or apprentice. 0.0206 0.0680 230.61
25. AME provides incorrect information to AT or apprentice. 0.0206 0.0826 301.45
26. AME forgets to check work of AT or apprentice. 0.0206 0.0680 230.61
Repair 27. AT damages fastener, connector, coupling, clamp, interface, part. 0.0176 0.0486 175.51
28. AT damages surrounding equipment. 0.0176 0.0583 230.61
29. Repair is substandard 0.0176 0.0538 204.76
Inspection 30. AT misses defect during inspection. 0.0206 0.1020 395.63
31. AT inspects wrong equipment. 0.0206 0.0875 325.07
32. AT forgets to replace equipment removed during the inspection process. 0.0206 0.1020 395.63
33. AT damages equipment during the inspection process. 0.0236 0.1020 333.67
Calibration 34. AT follows incorrect calibration procedure. 0.0024 0.0110 368.37
35. AT misses a cue during calibration procedure. 0.0017 0.0043 149.54
36. AT enters incorrect command during procedure. 0.0024 0.0091 285.71
Training
37. AME/AT misses critical error made by apprentice. 0.0206 0.0826 301.46
38. AME/AT provides incorrect information to apprentice. 0.0206 0.1080 424.78
39. AME/AT forgets to check work of apprentice. 0.0206 0.0826 301.46
Continued...

54
Table 10 continued
Task Grouping/Error Mode Frequencies without fatigue
Frequencies including
fatigue
Percent increase due to fatigue
Communications with other trades 40. AT mishears/misinterprets instruction from other personnel (ramp, stores, etc.). 0.0235 0.1080 359.18
41. AT provides incorrect information to other personnel (ramp, stores, etc.). 0.0205 0.1080 424.78
42. AT forgets to inform other personnel (ramp, stores, etc.) of important information. 0.0206 0.0778 277.84
Lubricating parts, topping up fluids 43. AT forgets to check fluid level. 0.0176 0.0384 117.69
44. AT misinterprets indication of fluid level. 0.0176 0.0384 117.69
45. AT forgets to top up or fill reservoir. 0.0176 0.0384 117.69
46. AT inadvertently fills reservoir with an unapproved fluid. 0.0176 0.0384 117.69
Operating hoist equipment 47. AT forgets to check area for obstacles before operating the transport vehicle. 0.0027 0.0071 161.22
48. AT moves vehicle beyond the bounds of the area intended. 0.0027 0.0071 161.22
49. AT misjudges placement of vehicle. 0.0027 0.0061 123.91
Operating transport equipment 50. AT forgets to check area for obstacles before operating the transport vehicle. 0.0027 0.0072 161.22
51. AT moves vehicle beyond the bounds of the area intended. 0.0027 0.0072 161.22
52. AT misjudges placement of vehicle. 0.0027 0.0072 161.22
Cleaning 53. AT damages equipment when cleaning. 0.0270 0.1020 277.78
54. AT forgets to reinstall equipment removed for cleaning. 0.0206 0.0680 230.61
4.7 Risk Analysis 4.7.1 Construction of Event Trees Event trees allow analysts to account for all contributing factors and associated frequencies of occurrence. Each event in the sequence is multiplied to arrive at an overall frequency of occurrence of the final outcome. Subsection 4.7.2 describes in detail how the frequencies were calculated and gives an example of the process.

55
The starting point for constructing event trees is the Aircraft Maintenance Task database in Appendix A of this report. A conceptual event tree developed for each scenario is based on human error initiating and/or enabling events selected from the task group and error modes in Table 9. Conceptual event trees and associated human errors are listed in Table 11 and graphically depicted in Appendix H.
4.7.2 Quantitative Event Trees Quantitative event trees were created for each of the conceptual event trees in Appendix H, including error modes, identified in Table 9. Appendix K contains the quantitative event trees for each scenario and the various potential initiating events for each. It also presents for each event tree, the assumptions made during its construction and during the calculation of frequencies. These assumptions provide the baseline information other analysts use to explore scenarios where the impact of error producing conditions may be different, the underlying conditions of the aircraft may vary, and the response of flight crew or other personnel may be different.
Table 11 Conceptual Event Trees and Associated Human Errors
4.7.3 Quantification Of Event Trees Event trees are quantified to determine the frequency of each event sequence and assign a severity that can be converted to equivalent fatalities. Each of the event trees described in section 4.7.1 has been quantified and is used as a master sequence for developing the risk spreadsheets. The quantified event trees are provided in Appendix K and the risk spreadsheets are provided on the CD attachment. There is no quantified event tree for the brake fluid top-up task since the conceptual event tree shows no fatality or injury consequences and therefore no significant safety risk.
Conceptual Event Tree Initiating / Enabling Human Error
1. Engine Replacement AT damages surrounding equipment
2. Stator Vane Actuator Replacement AT applies incorrect procedure
3. Thrust Reverser Door Replacement AT selects or installs incorrect part
4. Avionics Inspection AT follows incorrect procedure during test
5. Cockpit Mechanical Inspection AT follows incorrect procedure during test
6. Cargo Bay Inspection AT follows incorrect procedure during Inspection
7. Avionics Adjustment AT follows incorrect calibration procedure
8. Troubleshooting Door Sensor AT misses cue during troubleshooting
9. Service Check AT misses defect
10. Brake Fluid Top-up AT misses defect

56
Initiating event frequencies are expressed in events per 100,000 flight hours. This unit was selected to provide easy comparison to data on actual aircraft incidents published by the Transportation Safety Board Canada (TSBC, 2000).
In cases where the initiating event is a maintenance task, task frequency is tentative based on partial information obtained from a major airline. Human error frequency is calculated as task frequency multiplied by human error frequencies derived by Williamson (1988). These values are listed in Appendix J. Finally, when the initiating event is an equipment failure, the failure rate is assessed based on researchers’ judgement and experiences with reliability analyses and several years of work in the aerospace and aviation work environment. The frequency of the human error an enabling event during maintenance is derived from the HEART analysis for the non-fatigued condition using the values in Appendix J.
The frequency of an enabling event unrelated to maintenance is based on personal judgement and experience of the authors. Human error frequency for the flight crew is established based on a general evaluation of the circumstances and consideration of generic data in human error databases. Human error frequency for flight crew is not as accurate as that established for maintenance tasks using the HEART method. While the absolute level of risk is affected by reduced accuracy, the relative risk of maintenance errors for fatigued and non-fatigued conditions is influenced less, since the inaccuracies are partially cancelled out in the relative comparison. The frequency of equipment failures and environmental conditions is also based on the authors’ judgement and experience. As with the human error frequency, inaccuracy in such values has less influence on the relative comparison of risk for the maintenance errors under fatigued and non-fatigued conditions than for absolute risk.
The consequences of the event sequences are determined based on the review of Transportation Safety Board accident statistics and the judgement of the authors of this report, taking into consideration the circumstances described in Appendix K for each accident sequence (scenario). The researchers reviewed all TSB incident/accident reports relating to fatigue, specific equipment involved, and specific types of events that related to the scenarios. From this information the researchers were able to determine the severity of the consequences (safety critical, catastrophic, and disastrous). Any consequences less than critical was not included in the analysis. A safety critical outcome involves the loss of a life and a critical system, catastrophic indicates a loss of several lives and the aircraft, and disastrous indicates the loss of hundreds of lives, the aircraft, and other significant property (e.g. urban area or industrial centre).
The following example of a quantitative event tree explains how the frequencies were calculated.
EXAMPLE OF A QUANTITATIVE EVENT TREE The following example illustrates how event trees are created. The scenario used for illustration is Scenario 3, Replacement of the Thrust Reverser Door. The quantitative event tree for the thrust reverser door is shown in Figure 12. The assumptions for the event tree are provided first, and then the scenario is described.

57
Assumptions for the Example (Thrust Reverser Door Replacement Event Tree)
Human errors during thrust reverser door replacement are assumed to lead to one of the three following hazardous conditions:
• Thrust reverser door that deploys unexpectedly
• Thrust reverser door that jams open
The conditions were selected based on the authors’ judgements and discussions with aircraft jet engine manufacturing staff. The event tree is structured so that probability can be assigned to each hazardous condition for each human error initiating sequence. In general, it is assumed that the thrust reverser door jamming open is the more likely of the two conditions.
A thrust reverser door unexpectedly opening is assumed to be critical any time during flight, take-off and landing. The consequence of the thrust reverser door opening unexpectedly is assumed to be total loss of the aircraft, crew and passengers. It is assumed that, because of the severity of this event, design provisions ensure that its probability is very low. Thrust reversers are normally deployed during landing. The scenario of thrust reversers jamming open is assumed to occur when the pilot attempts to retract the thrust reversers after the aircraft has slowed down. If thrust reversers on one wing retract whereas the thrust reversers on the opposite wing jam open and the aircraft is still at a relatively high speed, it is assumed that the aircraft may veer off the runway, tip over and crash.
It is assumed that there is no potential for the pilot to recover from thrust reverser door unexpectedly opening during take-off, flight or landing. The potential for an accident to occur if the thrust reverser door jams open during landing depends on the speed of the plane at the time that the doors are retracted and the pilot’s skill in keeping the aircraft on the runway during thrust imbalance conditions.

58
Figure 12 Quantitative Event Tree
AT installs incorrect part during
replacement of thrust reverser door
AME notices use of incorrect part by AT
Malfunction of thrust reverser is revealed
during test
Malfunction of thrust reverser is detected
during pre-flight check by flight crew
Thrust reverser door does not deploy
during take-off or flight
Thrust reverser door does not jam open on
landing
Pilot has sufficient skillto keep plane level on
runway with thrust reverser jammed open
Consequence
Aircraft returned tomaintenance: 0 casualties
Aircraft returned to maintenance: 0 casualties
Aircraft returned to maintenance: 0 casualties
Aircraft lands safely: 0 casualties
Aircraft lands safely; 0 casualties
Pilot crashes plane on landing: 10 fatalities 50 injuries
Crash: 135 fatalities
Incorrect part installed
AME does not notice incorrect part
Passes test with compromised thrust reverser
Flight crew do not detect incorrect thrust reverser
Thrust reverser door opens
Thrust reverser door jams open
Plane leaves runway
INITIATING EVENT ENABLING EVENTS
Frequency
1.256 e-1
4.921 e-1
4.628 e-3
9.349 e-4
7.555 e-4
1.889 e-5
9.445 e-8

59
Scenario Description
The initiating event of the scenario involves the selection and installation of an incorrect part. In this case a thrust reverser door, which is a hinged flap-like structure that swings into position to deflect the engine’s rush of hot gasses toward the front of the aircraft, thereby slowing its forward motion. An actuator controls the door’s movement. There are a number of such doors on each engine, working in unison to form a solid barrier to redirect gasses forward. The aircraft maintenance technician installing the door does not recognize his slip obtaining the incorrect part either due to time constraints, no noticeable differences between the correct and incorrect part, and an installation procedure that is very similar.
Risk Calculations for the Example
The initiating event is assigned a frequency of making such an error, when fully rested, based on:
• The number of times the task occurs in 100,000 hours of aircraft operation based on a frequency of once every 5000 hours = 20
• And, the probability of making the error of selecting and installing an incorrect part (0.0126+0.0529 as shown in the HEART table in Appendix J) = 0.0655
The frequency of this human error per 100,000 hours of equipment operation is 20 x 0.0655 = 1.3104. This is the value that is shown below the first event box in Figure 8 (i.e. the initiating event). The next event is the job inspection by an AME. If the AME does not do the check or does not notice the discrepancy, a second error occurs. The probability of this error occurring is 0.0411, the probability shown below the second event box in Figure 8. Each intermediate event is assigned a probability of failure.
Finally, initiating event frequency is multiplied by the enabling event probability for respective success and failure states to arrive at the overall frequency per 100,000 hours that the given outcome will occur, assuming that the events are independent of each other. For instance, an aircraft crash resulting in more than 100 casualties will be a frequency of 0.00000000944 per 100,000 hours. The frequency of the pilot crashing a plane when landing is 0.0000001889. However, increasing the negative effects of any error producing condition (such as fatigue) that may cause human error increases the likelihood of initiating or enabling errors (errors that occur after the initiating event) and increases accident frequency by at least a magnitude or more (>10 times the base frequency).
4.7.4 Risk Analyses Spreadsheets In this study, spreadsheets have been used due to the relative ease of replicating large numbers of similar event tree calculations for each maintenance task. The spreadsheets also permit the risk to be calculated by multiplying frequency by severity for each event sequence and then summing the total for each event tree. An explained example of calculations with the spreadsheets is provided in Appendix M. All risk spreadsheets are included on the CD attachment.
The risk due to maintenance errors for each maintenance task is summarised in Appendix L. The tables in Appendix L list the risk summation outputs of each spreadsheet and then sum

60
the risks. One table is provided for each scenario. There is no risk table for the brake fluid top-up job since the conceptual event tree shows no fatality or injury consequences (no significant safety risk exists). The left column of the summary table lists initiating maintenance errors or, if the initiating event is not a human error, the first enabling human error in a sequence. The two event sequence risk columns are calculated, in units of equivalent fatalities per 100,000 flight hours, with and without fatigue affecting maintenance staff for all sequences associated with the human error in the left column. The fatigue contribution column shows the ratio of risk with and without fatigue. The last column shows the percent contribution of each human error to the overall risk associated with a maintenance task, both with and without fatigue.
Once the quantified event trees have been established for each maintenance error scenario, the risk related to these errors is calculated. The process is repeated twice for each scenario to obtain the risk related to the fatigued and non-fatigued conditions. This analysis involves the solution of a large number of similarly structured event trees.
4.7.5 Risk Benchmarking The current analyses include many assumptions affecting the accuracy of absolute risk. It is helpful to examine actual aircraft accident experience to gain a perspective on how the predicted risks compare to experience. The Transportation Safety Board (TSB) publishes accident statistics for use as a basis for comparison.
The TSBC’s Air 2000 report (TSBC, 2000) provides consolidated air accident statistics for the decade of 1990 to 1999. The statistics for airliners are the most relevant to this project since the maintenance task database of task analysis is exclusively airliner maintenance. The data in this report show that 10,717,000 airliner flight hours resulted in a total of 254 passenger fatalities and 30 crew fatalities over the ten-year period (total of 284 airliner fatalities). Non-fatal injuries are unavailable in this data. The mean airliner fatality rate over the decade was 2.65 fatalities per 100,000 flight hours.
The predicted risk for each individual maintenance job is below 2.65 fatalities per 1000,000 flight hours. The risk of maintenance errors in the Cockpit Mechanical A-check is a tenth of this value without fatigue. The risk of maintenance errors with fatigue during the Cockpit Mechanical A-Check is 2.13 fatalities per 100,000 flight hours and the risk of maintenance errors with fatigue during the Engine Replacement is 1.65 fatalities per 100,000 flight hours. It should be recognized that the prevalence of fatigue during maintenance is not 100 percent and that the fraction of time that work is being performed in the fatigued condition must be considered when calculating the maintenance error risk. For example, if fatigue is present 20 percent of the time the risk of maintenance error during engine replacement is weighted to arrive at a risk of 0.27 fatalities per 100,000 flight hours, and the same for the mechanical A-check would be approximately 0.43 fatalities per 100,000 flight hours.

61
A detailed breakdown of accident causes is not available in the TSB summary statistics, but general observations can be made on contributing causes to fatal accident risk. The 284 airliner fatalities were the result of 9 fatal airliner accidents from 1990 to 1999 characterized by the following initiating events:
• Control loss 1 accident
• Power loss 1 accident
• Collision with terrain 3 accidents
• Component system-related event 2 accidents
• Other/Unknown 2 accidents
It is unclear from these descriptions which accidents were caused by flight crew errors, foul weather, equipment failures, maintenance error, manufacturing/design deficiencies, or a combination of these. The ATSB (2001) in Australia reports that about 12 percent of all airline accidents are directly caused by errors in maintenance. This is consistent with rates quoted elsewhere (Nagel, 1988). The recorded rate for maintenance caused accidents in Australia for all aircraft is about 4.5 percent (ATSB, 2001). This does not take into account the effect of maintenance errors that go unnoticed, but may degrade aircraft performance and increase handling difficulties for pilots (neglect of preventive maintenance such as lubrication, cleaning, timely replacement etc.). According to this information, equipment failures may significantly contribute to airliner fatality risk. The maintenance error risk predicted in this study is therefore consistent with this level of risk contribution.
The research in this paper has focussed on the relative impact of fatigue on system safety. Fatigue is found to contribute directly to about 12 percent of incidents reported by licensed aircraft maintenance engineers in Australia (ATSB. 2001). As well it is reported as the main cause for 20 percent of the incidents contained in the BASI incident reporting system (BASI, 1997). These statistics strongly support the need to reduce the impact of fatigue on performance of maintenance personnel to effectively reduce considerable system risk. In fact, it is likely that much more reduction is realized since fatigue, in conjunction with other factors, contributes indirectly in many other cases as well.
The time on shift and the hours into the shift (incident rates were worse toward the end of the shift) have shown a significant correlation to error incidence. Rescheduling tricky jobs to the daytime or earlier in the nightshift also reduces risk.
4.8 Relative Fatigue Risk Analysis This section discusses the findings of the relative risk analysis. Note that the relative aircraft safety risk of personnel performing maintenance when rested to that when fatigued is a calculation based on:
• the HEART error mode values for unreliability (last two columns in the tables contained in Appendix F); and
• the likelihood of intervening events in the event trees not occurring as planned.
For complex tasks such as the replacement of engines and their components, the level of risk posed by fatigue is higher since those involved in the intervening maintenance activities are

62
also considered to be fatigued. The ratio of the aircraft safety risk due to fatigue compared to that without (i.e. Ratio of risk) is considerable when the probabilities of intervening events are multiplied. Therefore, scenarios involving fewer intervening maintenance activities show lower overall ratios.
In essence, fatigue commonly affects the reliability of multiple human activities during maintenance. Fatigue thereby undermines the independence of activities such as checks and tests that are intended to safeguard against an aircraft that is not flightworthy being released from maintenance.
4.8.1 Overall Contribution of Fatigue to Aircraft Safety Risk Table 12 shows the comparison of risk levels for each scenario with fatigue included and not included. The contribution of fatigue to risks for major error modes is summarized in Appendix L.
Table 12 Comparative Risks for Scenarios with Fatigue Excluded and Included
Scenario
Risk Excluding Fatigue
(Equivalent fatalities per
100,000 flight hours)
Risk Including Fatigue
(Equivalent fatalities per
100,000 flight hours)
Ratio of Risk with fatigue to Risk without
fatigue (col. 3/col. 2)
1. Engine Replacement 0.099113 1.658427 16.73
2. Stator Vane Actuator Replacement 0.000875 0.013876 15.86
3. Thrust Reverser Door 0.000472 0.006064 12.85
4. Avionics Inspection 0.002860 0.013623 4.76
5. Mechanical Inspection 0.467977 2.128352 4.55
6. Cargo Bay Inspection 0.022977 0.434097 18.89
7. Avionics Adjustment 0.012134 0.065682 5.41
8. Troubleshooting Door Sensor 0.000580 0.002863 4.94
9. General Service Check 0.025938 0.104690 4.04
10. Topping Up Fluids N/A N/A N/A
Overall Average Risk Ratio 9.78
The table contains the aircraft safety risk expressed as the number of equivalent fatalities per 100,000 hours that would occur as a result of human errors during each of the scenarios shown in column 1. Column 2 lists the aircraft safety risk for maintenance by rested

63
personnel, compared with the risk for those who are fatigued (column 3). Column 4 gives the overall ratio of flight safety risk shown in column 2 to those in column 3 (column 3 divided by column 2).
The greatest increase in risk posed by fatigue effects appears in equipment replacement tasks. Since the task analysis assigns the estimate of effect of fatigue as an EPC based on the task grouping, the type of error mode (estimated according to whether error mode is worsened by fatigue), and the level at which fatigue can increase the impact of other EPCs, certain jobs are revealed to be more affected by fatigue than others. For example, cargo bay inspection involves the inspection of critical equipment such as fire suppression equipment, door latches etc. Serious consequences can occur if the AT misses a defect in the door latches for the cargo bay, or causes damage to the latch during inspection. Furthermore, the inspection task is mostly cognitive, involving several task components that are highly susceptible to the effects of fatigue, resulting in a higher fatigue ratio.
Planning activities, for example, is also considerably degraded by fatigue, and if done under time pressure, is degraded even more. Fatigue, in fact, may have a synergetic effect on task performance while under stress, such that performance suffers increasingly, if these tasks involve higher-level cognitive processes, such as those in planning. Although planning typically occurs at the beginning of a shift, and is therefore less affected by fatigue for those starting a shift, members of the outgoing shift may be fatigued and fail to provide the ideal level of information required to carry on the job. Planning a job at 04:00 is riskier. Another activity adversely affected by fatigue might include documenting completed jobs at the end of a shift, which can compound the level of fatigue. Hence, a job that includes planning, documenting, communicating, supervising, etc. (all task groupings that are more susceptible to the effects of fatigue) has a risk level greater than one requiring only psychomotor and physical task components.
4.8.2 Initiating Error Modes Most Affected by Fatigue Some initiating error modes identified in the analysis are more affected by fatigue than others. For example, error modes involving communications, memory or decision making task components are more susceptible to fatigue. That is, the resulting performance is degraded more than in error modes involving visual or audio perception, psychomotor or physical task components. If distractions occur, tasks involving working memory may be seriously affected when personnel are fatigued. Motivation to track activities is lower and ability to remember is degraded. When personnel are fatigued, decisions will be based on less information and are more spontaneous. Hence, rather than seek corroborating information about a part to ensure it’s the right one, personnel may be compelled to use visual inspection only to verify the suitability of the part. This is precisely what occurred when an AME replaced the bolts during the replacement of a windscreen on a BAC1-11 aircraft with similar, but incorrect ones (Maurino et al, 1995). The bolts looked like the originals but failed while the aircraft was in flight because they were slightly smaller in diameter.
The initiating event (error mode) is more likely to result in a serious consequence if the intervening checks in the system are confounded. If these intervening checks are not performed or are performed incorrectly or inadequately, the trajectory of the initiating event can make its way all the way to a disaster. Since many of the intervening events involve high-level cognitive task components such as communications, decision making and

64
information processing, the impact of fatigue is potentially critical. Forgetting to do a check, or not performing the check adequately, can help enable an initiating event to lead to an unacceptable outcome. James Reason refers to this as the penetration of the initiating error through the existing defences, barriers and safeguards (Reason, 1987).
If each of the intervening events is prone to errors that occur more readily if the person responsible is fatigued, then the contribution of fatigue to the overall risk is higher. Table 13 contains the top ten initiating error modes, their associated scenario and ratio of risk with fatigue to that without, and the contribution of the initiating error mode event to the overall risk of the scenario, with fatigue included and without.
Table 13 Top Ten Fatigue Related Initiating Events From Study Scenarios
No.
Initiating Event
(Error Mode)
Scenarios Involved
Ratio of Risk with Fatigue Included to
Risk without Fatigue
1 AT reconnects incorrect hose, coupling, cable during component replacement
1, 3 81.52
2 AT forgets to replace equipment removed during the inspection process
5, 4 62.85 to 72.52
3 AT misses a step in the procedure 1, 3 71.33
4 AT enters the wrong information onto job completion form
1, 3, 4, 5, 6 55.19 to 58.84
5 AT forgets to record important information 1, 3, 4, 5, 6 55.19 to 58.84
6 AT enters incorrect command 6 48.91
7 AT neglects to check the part numbers and subsequently obtains an incorrect part from stores or installs incorrect part
3 48.89
8 AT does not check with the procedure or follows incorrect procedure
6 48.37
9 Troubleshooting fails to identify fault due to the AT following incorrect troubleshooting procedure
8
32.10
10 AT misses a cue during calibration 6 31.64
The main initiating error mode events that showed the highest ratios of risk with fatigue to that without fatigue were:
• AT reconnects incorrect hose, coupling, cable during component replacement;
• AT forgets to replace equipment removed during the inspection process;

65
• AT misses a step in the procedure;
• AT enters the wrong information onto job completion form;
• AT forgets to record important information;
• AT enters incorrect command;
• The ATs neglect to check the part numbers and subsequently obtain an incorrect part from stores or install incorrect part;
• The ATs do not check the procedure or follow an incorrect procedure;
• Troubleshooting fails to identify fault due to the AT following incorrect troubleshooting procedure; and
• AT misses a cue during calibration.
Table 14 shows the relationship between the error modes and associated task components that are susceptible to the effects of fatigue. These components are cognitive in nature and play a role in the susceptibility of the error mode to the effects of fatigue. The most common task components that may lead to an error are decision making and working memory. The following describes the most likely error modes, their associated task components, and levels of fatigue susceptibility as shown in Table 14.
Table 14 Associated Task Components for Top Ten Error Modes
Task Grouping/Error Mode Task Components
Involved Fatigue Rating
1. AT reconnects incorrect hose, coupling, cable during component replacement
Working memory Decision making
4 4
2. AT forgets to replace equipment removed during the inspection process Working memory 4
3. AT misses a step in the procedure Working memory 4
4. AT enters the wrong information onto job completion form Decision making 4
5. AT forgets to record important information Working memory 4
6. AT enters incorrect command Decision making Information processing
Long-term Memory Psychomotor
4 4 3 3
7. AT neglects to check the part numbers and subsequently obtains an incorrect part from stores or installs incorrect part
Decision making Information processing
4 4
8. AT does not check the procedure or follows an incorrect procedure
Information processing Decision making
4 4
continued
66
Table 14 Continued
Task Grouping/Error Mode Task Components
Involved Fatigue Rating
9. Troubleshooting fails to identify fault due to the AT following incorrect troubleshooting procedure
Decision making Working memory
4 4
10. AT misses a cue during calibration Attention Decision making
Visual and auditory perception
4 4 3
Reconnecting Incorrect Equipment (Number 1 in Table 14) Where connectors and couplings are not keyed to prevent incorrect mating of hoses, tubes, and cables, there is potential for configuring equipment incorrectly (i.e. making an incorrect decision). The main causes of this type of error are a breakdown in decision making and memory due to distractions, unfamiliarity with equipment, and time pressure. Fatigue exacerbates the effect of all of these causes, particularly those of memory and decision making. A fatigued individual is less likely to obtain and consult documentation, is more impatient and susceptible to time constraints, is prone to poorer decision making, and is less able to remember procedures and details.
Forget to Replace Equipment Removed During Maintenance (Number 2 in Table 14) Fatigue affects working memory and attentional abilities, resulting in situations where passing relevant important information to the next crew may not occur, or when returning to the job after a period of time, a piece of equipment may be overlooked during assembly. Although maintenance personnel are aware of this problem, implementing double checks and adopting procedures so that all equipment to be installed is displayed clearly on the bench etc., a fatigued crew may be less likely to carry out some of these measures, and will be more likely to forget items. Each person involved in the job may believe that the other has taken care of ensuring that a particular piece of equipment has been installed. Communications between crew members becomes less effective as fatigue increases, and diligence to check work becomes somewhat diminished.
Missing a Step in a Procedure (Number 3 in Table 14) The initiating error mode event with the third highest ratio of estimated risk when personnel are fatigued to that of when they are rested was that of missing a step when replacing a part on an engine. There is a much higher probability of missing a step when personnel are fatigued due to the nature of the tasks involved, where routine complex activities are required to ensure that the job is done correctly. Several steps in the operation involve decision making and memory and must be done correctly and checked for quality as the job progresses. This results in numerous points in the process where error may occur due to forgetting to perform all actions required or doing an action incorrectly, particularly when personnel are fatigued. Although this finding may seem contrary to the fact that disassembly/reassembly tasks were found to be less susceptible to fatigue, generally, this

67
particular error mode (missing a step), is working-memory- and decision-based. Hence, the action of missing a step is highly sensitive to the effects of fatigue.
Failing to Provide Important Information or Forgets to Provide Important Information (Numbers 4 and 5 in Table 14) Planning activities will be grossly affected by high levels of fatigue, especially at the end of the last shift at the end of the work cycle (i.e. after four nights). The handing off of a job between shifts is usually critical and the expected high levels of fatigue experienced by the outgoing crew degrade the process. Critical information that is not conveyed to the receiving crew leads to a problem(s) that may slip through the checking process. Communication is often degraded by fatigue, as is decision making and memory. The outgoing crew will not be adequately reliable by the time the hand over is done.
Enters Wrong Information into Diagnostics System (Number 6 in Table 14) Fatigue often degrades the ability to avoid entry errors when operating test and diagnostics equipment. Although these types of errors are usually immediately recovered, fatigue reduces the maintenance technician’s ability to catch such errors, particularly when under severe time constraints or when there are many distractions and disruptions in the work environment. Entering wrong information may be a result from:
• a lapse in memory, where the wrong information is entered as correct;
• incorrect information obtained as a result of a wrong choice of procedure is entered; or
• the incorrect key has been pressed due to poor psychomotor action or incorrect decision making and the individual fails to catch the error.
Neglect to Verify a Part Number or to Consult a Procedure (Number 7 Table 14) Maintenance personnel do not always see the risk in taking shortcuts. Shortcuts are used when maintenance personnel are rushed, overconfident or lulled into taking them as a matter of routine, i.e. the “normal” way of doing business. This occurs in many work environments including those that are safety sensitive, and has been classically described in Vaughn’s book on the Challenger disaster (Vaughn, 1996). She refers to this as the “normalization of deviance”. This normalization process evolves when the organization becomes procedure- laden and too narrowly focussed. Procedures that vary from their original form and intention become shortened to accommodate a changing work environment. Some checks and measures may disappear, and the personnel responsible may lose sight of the valid signs that things are not quite right. Rather than step back and question an action, it is often easier to fall back on the comfort that no problems have occurred so far so the truncated procedure must be fine. Decision making becomes increasingly based on misleading information.
When personnel are fatigued, taking shortcuts becomes more tempting. Motivation to be thorough and to do things “by the book” decreases, and standards written into procedures sometimes seem unwieldy and cumbersome. The non-routine job at hand may be similar enough to a routine job that consulting the procedure is considered unnecessary, particularly when personnel are fatigued. When personnel are fatigued, quick decisions to circumvent

68
certain details in the procedure are made. Time pressures, lack of awareness of incidents resulting from incorrect part instalment, or some other similar error may reinforce deviant decisions.
Does Not Check Procedure or Applies Incorrect Procedure (Number 8 in Table 14) Maintenance personnel suffering from fatigue are less able to notice small differences due to depressed motivation and increasing impatience. There is a higher risk of selecting the wrong procedure when procedures for different maintenance activities are very similar and their documentation is almost indistinguishable. Such situations require keen decision-making and information processing skills to pick up the slight differences. Fatigue degrades these skills. Applying incorrect standards often results in problems such as an incorrect setting or action that may produce a latent condition that is undetectable until the aircraft is already in a critical part of its flight profile. Furthermore, applying procedures requires creative thought, since procedures are rarely followed to the letter. Procedures are adapted to the specifics of the task-related circumstances (see Dekker, 2003). Maintenance personnel must be able to make quick rational decisions about how to apply a procedure effectively and safely.
Troubleshooting Fails to Identify Fault Due to the AT Following Incorrect Troubleshooting Procedure (Number 9 in Table 14) Troubleshooting often involves following a procedure to identify problems. Some procedures are specific to a given set of symptoms. However, personnel must make a decision as to which procedure applies to the symptoms. Applying the incorrect procedure can lead to a failure to identify the problem since the procedure may not effectively indicate the data needed to further diagnose a problem. This decision-making process is not as effective when personnel are fatigued. Preconceived mental models of the state of the system according to the symptoms based on past experience are more likely to be followed when personnel are fatigued. Ready acceptance of this mental model, without consideration of all available facts, leads to the application of an inappropriate procedure. This in turn leads to a missed opportunity to identify an underlying problem or a misinterpretation of the critical nature of the problem.
Misses a Cue During Diagnostics (Number 10 in Table 14) This error usually results from inattentiveness. Attention is highly susceptible to the effects of fatigue. Other factors include distractions and interruptions, time constraints and poor visual and auditory perception. Fatigue has a moderate effect on perceptual abilities.
Personnel Take on too Many Tasks (General to several error modes) A fatigued individual is more susceptible to making bad decisions and experiencing compromised judgement. If tasks are routine, a fatigued individual may insist on helping by assuming more responsibility to get the job done so they all can go home and get some sleep. The situation can result in taking short cuts and rushing some activities.

69
Damage to Equipment (General to several error modes) Initial results also show that the greatest impact of fatigue on the overall outcome probability occurs where damage to equipment results from certain maintenance activities such as when cleaning or repairing equipment. This is a consequence of the increased risk of damage being overlooked and not caught with the normal procedures in the existing maintenance environment. Where damage occurs during routine activities, maintenance personnel may not be likely to notice the damage since they are not specifically looking for it. For instance, the damage may have occurred when inspections were being carried out, or during routine equipment replacement or repair. Although a separate inspection by a separate qualified individual follows the maintenance, this is not always the case. Often, qualified maintenance personnel sign off their own work. If this individual does not realize they have damaged a piece of surrounding equipment, there is a high probability that the damage will go undetected by maintenance personnel. Damage may be detected during testing, or when the flight crew do their pre-flight checkout. However, if all appears normal, the damage is overlooked.
Fatigue influences damage detection by degrading communications with other maintenance personnel, reducing attention to detail, decreasing motivation to recheck work, and an increased focus on immediate goals as getting the work done on schedule at the expense of ultimate goals such as ensuring that the aircraft is airworthy.
4.8.3 Relationship Between Task Groupings and Risk The level of risk due to the effects of fatigue is based on a calculation of task grouping fatigue susceptibility and estimated impact of fatigue on the associated error modes. The averages of the percent increase in error likelihood were calculated from the data in the last column of Table 10. Task groupings such as planning, inspection, and testing all involve these highly fatigue susceptible task components, and often set up a latent condition that is overlooked. This causes a situation whereby the result of an error is not detectible and affects the aircraft during a critical point in its flight profile (journey).
Table 15 illustrates the relationship between task groupings and fatigue risk. Note that the task groupings that have the greatest increase in the probability of making an error due to fatigue are those that are highly cognitive and involve complex decision making and personnel interaction. The next group with high to mid-range increase are task groupings involving strong cognitive components. Task groupings with a mix of physical and cognitive components have the lowest increase in potential for errors due to fatigue.

70
Table 15 Task Groupings and Risk
Task Grouping Average Percent Increase in Risk Due to Fatigue
Planning 374.56
Inspection 362.50
Documenting 356.46
Communications with other trades 353.93
Training 342.57
Calibration 267.87
Testing 264.45
Troubleshooting 256.46
Supervision 254.22
Cleaning 254.20
Disassembly/Reassembly 207.40
Repair 203.63
Operating transport equipment 161.22
Operating hoist equipment 148.78
Lubricating parts, topping up fluids 117.69

71
5 Conclusions
This section begins with the general conclusions for the task analysis, then those for the fatigue relative risk assessment. This is followed by detailed conclusions for the following areas of interest:
• Estimates of Fatigue-Susceptibility in Task Groupings;
• Fatigue and Task Group Scheduling;
• Nature of the Risk of Fatigue on Aircraft Maintenance Tasks;
• Human Factors of Each Error Mode;
• Magnitude of the Relative Risk of Fatigue;
• Implications of the Risk of Fatigue in Aircraft Maintenance Operations; and
• Fatigue Risk Countermeasures.
Task Analysis The results of the task analysis indicate that fatigue most affects cognitive subtasks requiring planning, decision making, information processing and communications. Working four 10- to 12-hour nights in a row inevitably leads to significant levels of cumulative fatigue. The task groupings involving these cognitive components are severely degraded. Some critical subtasks are affected. This is most likely to occur during the lowest part of the circadian rhythm (nadir) of the night.
Maintenance personnel have developed coping strategies to offset this fatigue effect by taking extra time, rechecking their own work, and also relying on other people to check work. Where such strategies are less feasible, such as when time pressures exist or environmental conditions are not ideal, maintenance personnel are prone to making errors or compromising the quality of their work.
Scheduling subtasks such as inter-trade communications, in-depth supervision (e.g. advising an apprentice on job details prior to starting a job), training (e.g. involved sit down presentations), troubleshooting, testing, calibration, inspection, job planning, and documenting work to times during which fewer fatigue effects occur, are useful strategies to reduce risk. Since fatigue affects disassembly/reassembly tasks less, it is likely that such scheduling is feasible, since most tasks during these times involve physical work, which is less affected by fatigue. However, note that even the physical tasks of disassembly/reassembly have a number of cognitive task components, particularly in the reassembly portion. An alternative strategy might be to ensure that more experienced personnel are involved in fatigue-susceptible tasks during the times of day when fatigue effects are highest or when it is expected that crews work longer shifts involving jobs that consist of fatigue-susceptible task groupings.

72
Fatigue Relative Risk Assessment The relative risk of fatigue on aircraft maintenance job tasks and its overall impact on system risk is severe enough to warrant countermeasures. Potentially, fatigue can increase the overall system risk by a ratio of 10:1 (fatigued state: non-fatigued state). The potential increase in risk posed by fatigue during individual aircraft maintenance jobs can be as high as 81:1. This result is based on:
• the negative impact of fatigue on task performance expected according to the results of studies of cognitive and physical task performance; and
• the estimated negative effects of error-producing conditions such as time constraints, working conditions, and personnel training and experience.
5.1 Estimates of Fatigue-Susceptibility in Task Groupings Most of the estimates of fatigue susceptibility for the task groupings are very similar. However, the rankings shown in Table 7 can help as a guide when assigning, planning and scheduling work. For example, the task grouping “disassembly/reassembly” is about 25 percent less susceptible to the impact of fatigue than the task grouping “communications with other trades”.
Each maintenance facility has its own characteristics and therefore the contribution of task components to task groupings varies accordingly. Variability can be addressed by adjusting the percent contributions for each task component to better fit the maintenance environment under consideration. This allows an analyst to adjust these estimates for each type of facility, or planned maintenance activity, to arrive at an estimate of fatigue susceptibility for each job. The best strategy for a job at a particular facility can then be determined. Heavy contributions of the most affected task components for task groupings involved in a job are identified and if possible, scheduled to be more compatible with the expected fatigue levels of assigned personnel. If the job requires a great deal of planning involving all trades, serious troubleshooting, and considerable testing, it is best to ensure that a fresh crew be assigned.
The outgoing crew should hand over the testing portion to the morning crew. If the job involves task groupings that are less susceptible to fatigue a less alert crew can handle the job. For example, if a job is to be completed during the lowest point of the circadian rhythm (roughly between 03:00 and 06:00) it should consist primarily of the following:
• be mostly disassembly/reassembly activities;
• require minimal planning;
• require little communications and co-ordination with other trades;
• involve no troubleshooting; and
• require minimal testing.
However, their performance may be compromised and any extension to the shift may be risky. Hence, the work should be checked by rested personnel to ensure quality.
Note that the decrement in task performance for maintenance tasks involving task components most susceptible to fatigue are a function of working conditions (time of day,

73
length of shift, point in the work cycle, tool and equipment design, environment, procedures, staffing, time pressures, etc.), supervisory support at the time, and prior training and experience. Strategies to schedule highly affected tasks should take these factors into consideration.
5.2 Fatigue and Task Group Scheduling Since fatigue occurs according to prevailing conditions, the timing of task groupings is important. Tired crews are able to handle certain subtasks, but other subtasks may be more difficult and error prone. Under conditions of severe fatigue and other performance limiting factors such as time constraints and poor lighting, personnel function well below acceptable levels. The following discussion provides a guide to planning maintenance activities while considering the effects of fatigue.
5.2.1 Communications with Other Airport Personnel Maintenance personnel must often co-ordinate their activities with personnel responsible for parts stores, cleaning, ramp operations, and airport administration. Collaboration activities involve a considerable amount of communication and decision making. Fresh personnel should handle most co-ordination near the beginning of the shift.
5.2.2 Supervision Supervisory support involving detailed direction during planning can be more helpful at the beginning of the night shift, than later. Only checks on progress and corrective feedback should be done through the early hours of the morning and detailed training done earlier rather than later in the shift. As in training, it is best for supervising personnel to limit their activity during the middle and latter parts of the night to basic supervisory activities that involve low levels of communication, decision making, information processing or attention. However, it is also important that supervising personnel check the work of inexperienced personnel such as apprentices during the shift, particularly during the nadir period of the night shift. Also, task groupings that involve a high cognitive component should be handled by experienced personnel and checked by well-rested personnel before release. Fatigued supervisors should not be expected to make final checks by themselves before releasing aircraft. Discussion with the in-coming supervisor and subsequent checks by that supervisor is an effective way to ensure that errors are caught.
5.2.3 Calibration The task components for calibrating equipment include attention, decision making, and working memory, all highly susceptible to the effects of fatigue. Steps can be forgotten, decisions may be based on incomplete information, and cues may be missed. Calibration subtasks should be scheduled for earlier in a shift, rather than later, or done by well-rested personnel.
5.2.4 Training On-the-job training that involves learning new, complex jobs should not be done at the end of the work cycle (i.e. after four consecutive ten or more hour night shifts) nor should it be done during the nadir period of the night or at the end of a night shift. The same applies to

74
classroom training or update meetings. Having maintenance personnel sit in a darkened room after a night shift is not compatible with their biological and psychological state. Personnel have worked all night and are ready to return home to go to bed. Training at this particular time would be next to useless.
5.2.5 Testing Testing of equipment subsequent to assembly is often done at the end of the job and shift, often corresponding to the time of day when the circadian rhythm is beginning to rise. This is not ideal. Unless a fresh crew is involved in the process, poor performance can be expected. Fatigued personnel are less able to perform the cognitive subtasks required, and the likelihood of errors is higher than would be expected of well-rested maintenance personnel.
5.2.6 Inspection Inspection subtasks are degraded as the night wears on, worsening considerably during the circadian rhythm’s low point (nadir period). High priority and high-risk components should be inspected during the early part of the shift when personnel are less fatigued. As is the case with testing, inspection of a completed job often occurs at the end of the shift. This is difficult for fatigued individuals. On-going inspection of each element of the job throughout the shift is recommended to ensure that by the end of the job, minimal overall inspection is required. Of course, this also depends on the time pressures on the crew during the night. Time constraints restrict their ability to perform the on-going inspections of their work effectively, or others who are to check their work.
5.2.7 Troubleshooting Since troubleshooting subtasks involve considerable levels of attention, decision making, memory and information processing, they should be scheduled for the beginning of the shift, and avoided during the nadir and at the end of the shift.
5.2.8 Job Planning Initial planning for jobs should be performed during the early part of the shift, and not during the nadir. This is consistent with most jobs scheduled for the shift. If a new job is started during the latter part of the night, higher risk of planning errors may exist.
5.2.9 Documenting the Job The documentation of each job should be performed when personnel are alert and able to engage effectively in higher-level cognitive task components such as decision making, communicating and information processing. Spreading the process of documenting subtasks over the night is often beneficial, so that only last minute outcome information needs handling at the end of the job and shift. Detailed documentation supporting initial job planning should be done early in a shift. This is feasible since most jobs are assigned at the beginning of the shift. However, if one job has been completed, and another is beginning, it is best to do initial planning documentation for both earlier in the shift.
5.2.10 Operating Transport and Hoisting Equipment These two task groupings involve combined physical and cognitive activities, particularly, high demands on psychomotor abilities. Fatigue can dull the ability to maintain good eye-

75
hand co-ordination, but the research shows that experienced personnel can still maintain acceptable levels, even when severely fatigued. However, attention is more greatly affected by fatigue and often personnel tend to focus on the psychomotor part of the subtask and ignore the need to be vigilant (i.e. watch out for obstacles, personnel etc.). One proposed strategy is to add a person to watch out for potential safety hazards while another operates the hoist or other mobile equipment. This is effective only if communications and close coordination between the two personnel is diligent. Since fatigue also erodes diligence and communications, this strategy is only a marginal improvement. These task groupings should probably be done outside the nadir period.
5.2.11 Performing Repairs Repairs to airframe, fuselage, interior structural components, etc. require attention to detail at times, and routine activities at others. The impact of fatigue on this type of work depends on the difficulty level of creative and reconstructive elements. Routine subtasks that are less safety relevant can be done at any time during the shift, even at night. Subtasks involving repair to airframe and fuselage, however, should probably be handled early in the shift, and avoided during the nadir period. Additional independent inspection during and on completion of the job may be necessary if the repair is done during the nadir period.
5.2.12 Disassembling and Reassembling Equipment The disassembly and reassembly (D/R) of equipment on aircraft involves a balanced mix of cognitive and physical activities. The physical nature of D/R subtasks involves maintenance personnel directly and is conducive to maintaining alertness, even during the nadir period. However, the decision-making and memory components of these subtasks are more affected by fatigue. Maintenance personnel should use strategies such as: documenting subtasks as they are completed (rather than wait until the end of the job), refer to documentation to remind them of the proper sequence of steps and particular cautions (manuals, drawings, diagrams, etc.), and rechecking work as each step is completed.
5.2.13 Cleaning Cleaning activities are important during inspection, D/R and troubleshooting. If foreign materials mask problems, or cause improper interfaces between components, these subtasks are not effective. The most fatigue-sensitive part of the cleaning process is the attention to detail required to maintain thoroughness. A check by other personnel can help to catch problems if the subtask is performed during the nadir period or at the end of the shift. Since much of the cleaning must be done before a job commences or early in the process, it is rare for the cleaning to occur at the most vulnerable times of the shift.
5.3 Nature of the Risk of Fatigue on Aircraft Maintenance Tasks 5.3.1 Role of Task Groupings in Fatigue Risks The impact of fatigue on aircraft maintenance tasks can be partly explained by the susceptibility of the task groupings involved. Jobs involving task groupings that are highly susceptible to fatigue will, as a group, contribute to greater risk. Task groupings such as communications, supervision, training, inspection, troubleshooting, testing, job planning and

76
job documentation all show significant performance degradation when personnel are fatigued. This results in greater error risk and unacceptable outcomes.
5.3.2 Contribution of Fatigue Risks to Outcomes Fatigue increases the likelihood of errors, particularly those that may result in serious to disastrous consequences. Errors leading to latent conditions that are difficult to detect, such as those occurring during planning and verification activities, may set up a situation where the result of the initial error is missed during routine checks. Examples of these types of errors include:
• following an incorrect or incomplete procedure;
• excluding a final check of work at the end of the job; or
• neglecting to provide critical information alerting others to the existence of an non-airworthy aircraft condition prior to release.
When engines or flight surfaces (including avionics inputs) are involved, such conditions may lead to loss of control or performance at a critical moment in the flight profile.
5.4 Human Factors of Each Error Mode The error modes described above are a result of several error producing conditions, of which fatigue is one. Other error producing conditions to consider are:
• time constraints and the resulting increases in workload;
• skill levels and training; and
• environmental conditions such as lighting, ventilation, temperature, and humidity.
Human mental processes respond to these conditions in very predictable ways. The human brain can sustain alertness and attention on a stimulus for a limited time before reinitiating the process. Human information processing capabilities limit the amount of data personnel can handle. Human working memory is limited to finite amounts of information that can be stored and retrieved in a given amount of time.
Fatigue affects all of these limitations negatively. Slowing the pace and rechecking work become useful countermeasures when this happens. In a time-pressured, busy work environment, these countermeasures may be compromised.
The following subsections briefly describe some of the cognitive difficulties personnel encounter when fatigued.
5.4.1 Errors Related to Memory Lapses Errors result from personnel forgetting to perform a step in a procedure. An error example in the aircraft maintenance environment is the omission of a critical step in the inspection, reassembly, or recalibration procedures. The individual responsible for this task initiates the sequence of events by following the procedure by memory because access to the maintenance manual is inconvenient, or because the job has been done many times before. Interruptions during the procedure (or an incorrect mental model formed from partial memory of data) results in a missed step. If everything seems to be working, then the error

77
will go unnoticed. Later, this latent error condition will cause problems when the right circumstances occur.
Memorizing steps in a procedure is difficult when personnel are fatigued. Working-memory is most affected, so interruptions to the procedure or trying to remember what the manual said can result in missed steps. Retrieval of information from long-term memory is affected to a lesser degree, but is degraded enough that it is less reliable. Hence, jobs that are done less frequently are best done using documentation to ensure accurate performance, rather than relying solely on past experience.
5.4.2 Attention Errors Equipment inspection during reassembly or after any work has been completed (usually rechecked by a qualified person), requires thoroughness and attention to detail. The procedure likely involves the operation of equipment, use of mirrors and other specialized tools, and considerable patience when seeing the finished work is awkward and difficult. In some jobs another person is required to assist in the procedure but is not available. When personnel are fatigued, they are less motivated to attend effectively, and decision-making skills weaken (see section 5.4.3). Diligence in ensuring that the job is done properly is severely reduced when fatigued. Checks by other personnel become more cursory, and their confidence in the abilities of the person who did the job becomes greater. Trust levels in the work of others artificially increases due to decreased motivation to be diligent.
5.4.3 Decision-Making Errors Personnel faced with critical decisions must be able to weigh all available facts to ensure that the proper mental model of the situation is developed. If attention flags, time constraints can truncate or eliminate some necessary activities required for obtaining information, data may be overlooked, and decision-making becomes unreliable. Aircraft maintenance personnel must maintain an alert and dedicated focus on the job at hand to execute effective attention and decision-making activities. As the shift progresses these activities become more difficult. If a person is already fatigued, the difficulty increases dramatically.
5.4.4 Perceptual Errors Poor lighting, noise, distracting activity, noxious fumes etc. can all reduce the ability of personnel to properly focus on their work. When an aircraft technician cannot properly see the equipment being maintained, critical errors can occur. The same visual impediment faced by the technician will likely be faced by the AME checking the work. The design of aircraft often results in situations where equipment is obscured or located in places where awkward postures are required. Since fatigued maintenance personnel are less able to visually or aurally focus on stimuli, it becomes very important to ensure that good lighting, a quiet non-distracting work environment, and better aircraft maintainability exist for critical jobs. This may be nearly impossible in some maintenance operations, but should be attempted wherever possible.

78
5.5 Magnitude of the Relative Risk of Fatigue 5.5.1 Where the Relative Risk of Fatigue in Maintenance Operations Poses the
Greatest Problem The impact of fatigue on the risk to the air transportation system appears to range from a risk ratio (risk when fatigue is factored in compared to that when it is not a factor) of 2:1 to 81:5 depending on the type of initiating error event (see Table 13). However, if the averages for the risk ratios of each scenario are considered the range is from approximately 4:1 to 19:1 (see Table 12), the error modes that led to the greatest fatigue risk ratios include:
• AT reconnects incorrect hose, coupling, or cable (81:1);
• AT forgets to replace equipment removed during the inspection process (72:1);
• AT misses a step in the reassembly procedure (71:1);
• AT enters the wrong information onto the job completion form (59:1)
• AME forgets to provide an important piece of information to ATs during planning (59:1);
• AT neglects to check part number (49:1)
• AT does not check the procedure for a non-routine job (48:1);
• Troubleshooting fails to identify fault due to the AT following an incorrect procedure (32:1);
• AT misses a cue during calibration (31:1)
These errors are consistent with those identified by the survey conducted by the Australian Transportation Safety Bureau (ATSB, 2001), shown in Table 16. Errors with the highest risk identified in the present study, as listed above, are either directly related to the ATSB errors or are initiating events to these errors (for example, planning error leading to installation of incorrect part or improper installation). The ATSB report does not, however, provide the risk levels posed by each error (i.e. effect on system risk).
Table 16 Top Eight Identified Errors from ATSB Study
ATSB Top Eight Identified Errors
Incorrect installation of components
Fitting the wrong parts
Electrical wiring discrepancies
Loose objects left in aircraft
Inadequate lubrication
Cowlings, access panels, and fairings not secured
Fuel/oil caps and refuel panels not secured
Landing gear ground lock pins not removed before departure

79
The scenarios posing the greatest overall fatigue risk were approximately:
• Cargo bay inspection (19:1)
• Engine replacement (17:1) mostly due to planning and inspection errors;
• Stator vane actuator replacement (16:1) mostly due to planning and inspection errors; and
• Thrust reverser door replacement (13:1), mostly due to planning and inspection errors.
5.5.2 Overall Relative Risk of Fatigue in Maintenance Operations and Aircraft Safety
The potential overall average risk increase to the system posed by fatigue is about 10:1 (Table 12). The chances of an incident are approximately ten times as likely to occur when personnel are fatigued as when they are rested. This is based on the fact that all maintenance crewmembers are equally fatigued and those involved later in the scenario (e.g. flight crew and ramp personnel) are well rested. Hence, this is a conservative risk estimate. It could be much higher if the conditions are worse (flight crew and others involved are fatigued, weather is poor, flight crew is inexperienced, etc. - see discussion of assumptions in section 4.8). Predictably, risk is considerably lower when fatigue is removed and ideal conditions prevail.
5.6 Implications of the Risk of Fatigue in Aircraft Maintenance Operations
5.6.1 Focus on Working Conditions Work schedules and the number of hours that personnel work and rest are pivotal in the ability of staff to begin work in an adequately rested state and maintain an adequate level of fitness throughout their work. Working conditions such as workload, safety culture, environmental conditions, training, supervisory support, and co-operation with others supporting the operation also affect the ability of personnel to cope. For example, stress in the workplace can lead to sleep difficulties contributing to fatigue regardless of work-rest cycles.
5.6.2 Long-term Effects on Personnel Continually working in a fatigued state can lead to health problems and significantly reduced performance. This may cause personnel to require (take) more breaks, work at a slower pace, take more days off, be less co-operative, suffer diminished motivation, and ultimately seek other job opportunities. Since humans are biological entities and not machines, even the best, most robust members of the workforce will suffer.
5.7 Fatigue Risk Countermeasures Increase in risk due to fatigue is high enough to warrant countermeasures. One effective countermeasure is to incorporate a fatigue management program into the operational process.

80
The program should include fatigue management training for all technical, support and management personnel involved in the process, re-examination of scheduling practices, implementation of a confidential error reporting process, program evaluation from time to time, and on-going support to accommodate effective operational fatigue countermeasure strategies for personnel.
5.7.1 Fatigue Management Training Fatigue management training should involve all personnel directly responsible for the maintenance process. Training only frontline personnel does not ensure that the proper level of support is available to those applying the knowledge and strategies gained in the training session. Scheduling that runs counter to adequate rest work patterns or lack of facilities for planned naps (particularly prior to the drive home after night shifts), inadequate meal facilities during nights, and workloads that do not allow those on the night shift to pace according to their human limitations will lead to increased errors and a higher potential safety risk.
The training program should include either single level training that all may attend, or for management, a more directed, less intense session that ensures that basic required information is presented in less time. Job and personnel schedulers, supervising maintenance personnel, parts and supply personnel, immediate managers, health and safety officers, and aircraft maintenance technicians (including AMEs) should take part in the full-day sessions. Upper management for maintenance and health and safety could take a less intense, awareness session.
5.7.2 Re-examination of Scheduling Practices Since work schedules are often a major contributor to fatigue, an examination of schedules and their fatigue risk potential should be considered. Software programs are available which allow schedulers to determine the best work schedules that reduce fatigue, but still meet operational constraints. Such programs take into account work/rest periods and the number of nights worked (the number of daytime sleeps) calculating the sleep debts personnel are expected to build over the course of a work cycle, and are as a result risk-based. Such programs can be adapted to existing scheduling programs.
5.7.3 Other Countermeasures The error reduction approach adopted by most recent initiatives is the Reason error classification model to determine the countermeasures that best apply (Reason, 1987). The model includes the error classification shown in Figure 13. Hobbs (2001) suggests that most fatigue-related errors include skill-based errors that involve several error producing conditions (EPCs) like time pressure, poor environmental conditions, bad design, etc., as well as fatigue. These other EPCs should be addressed and may require changes such as redesign of equipment, increased staffing, and/or improved working conditions. Reducing fatigue involves education and training, changes in policies and procedures, and/or redesign of equipment and facilities.

81
Figure 13 Reason’s Error Model and Associated Countermeasures (Adapted from Reason, 1997)
5.8 Validation of Data A more comprehensive task and risk analysis is necessary to validate whether the results are representative of all aircraft maintenance operations and job tasks. For example, smaller operations have different procedures and resources (parts, documentation, equipment, and staffing levels). Field-type operations are more limited in all aspects, in addition to potentially more severe working conditions. The level of risk in these operations may vary from larger, resource-rich facilities.
Skill-Based Errors Rule-Based Errors Knowledge-based Errors
• Slips (wrong action) • Memory lapses • Misses information
• Rule violation o Short cuts o Omissions
• Mistakes o Apply wrong rule o Apply rule
incorrectly
ERROR TYPES
COUNTERMEASURES
• Eliminate or control EPCs (including fatigue)
• Improve procedures • Eliminate or control
EPCs
• Improve training • Eliminate or control
EPCs

82

83
6. Suggested Strategies to Reduce Fatigue Risk
The following fatigue reduction strategies are based on the results of task analysis and fatigue risk assessment:
• Consider the task groupings involved in a particular job when scheduling work – those with a high expected contribution of complex cognitive activities should be planned for a time when personnel are expected to be more alert and an adequate number of experienced personnel are available;
• Ensure that personnel have the opportunity for adequate rest between shifts and during days off – discourage personnel from using too many rest days to work overtime, and ensure that shift length is rarely over 12 hours;
• Evaluate shift rotation schemes to take maximum advantage of the biological rhythms of maintenance personnel, taking into account previous rest opportunities and the time of day;
• Examine ways to improve the shift changeover procedure so that tired personnel handing the job over can remember what they need to pass on to the fresh crew, and that the in-coming crew is prepared to ask the right questions to ensure all critical information is conveyed or recorded;
• Educate personnel (including maintenance personnel, management and support staff such as personnel schedulers, parts and stores clerks etc.) about fatigue management;
• Investigate whether it is more effective to have staff record the results and observations and other maintenance documentation as they progress though the maintenance rather than waiting until the completion of the tasks (when they will be more fatigued) to record information;
• Consider investigating the feasibility of improved job scheduling and team composition as effective countermeasures.
• Consider developing, implementing and evaluating a confidential error reporting system (CERS); and
• Consider analysis of the error data related to fatigue as collected over the first one or two years of operation of the CERS.

84

85
7. References
1. Angus, R., Pigeau, R. and Heslegrave, R (1992) Sustained-operations studies: from the field to the laboratory. In Stampi, C. (ed.), Why We Nap: Evolution, Chronobiology, and Functions of Polyphasic and Ultrashort Sleep. Boston; Birkhäuser.
2. Angus, R. and Heslegrave, R. (1985) Effect of sleep loss on sustained cognitive performance during a command and control simulation. Behavior Research Methodology and Instrumentation, 17: pp. 55-67.
3. Arnedt, J., Wilde, G., Munt, P., and MacLean, A. (2000) Simulated driving performance following prolonged wakefulness and alcohol consumption: separate and combined contributions to impairment. Journal of Sleep Research, 9: pp. 233-231.
4. ATSB (2001) ATSB Survey of Licenced Aircraft Maintenance Engineers in Australia. ATC, Australia; Australian Transport Safety Bureau.
5. BASI (1997) Human Factors in Airline Maintenance: A Study of Incident Reports. ATC, Australia; Bureau of Air Safety Investigation (now referred to as ATSB).
6. Bartlett, F. (1943) Fatigue following highly skilled work. Proceedings of the Royal Society, Series B, Vol. 131: pp. 247-257.
7. Beatty, J. and Katz, R. (1977) Sleep deprivation and the vigilance of anesthesiologists during simulated surgery. In R. Mackie (ed.), Vigilance Theory, Operational Performance and Physiological Correlates. New York; Plenum.
8. Beaumont M, Batejat D, Pierard C, Coste O, Doireau P, Van Beers P, Chauffard F, Chassard D, Enslen M, Denis Jb, Lagarde D. (2001) Slow release caffeine and prolonged (64-h) continuous wakefulness: effects on vigilance and cognitive performance. Journal of Sleep Research, 10(4):265-76.
9. Blagrove, M. (1996) The effects of length sleep deprivation on interrogative suggestibility. Journal of Experimental Psychology – Applied, 2: pp. 48-59.
10. Blagrove, M., Alexander, C., Horne, J. (1995) The effects of chronic sleep reduction on the performance of cognitive tasks sensitive to sleep deprivation. Applied Cognitive Psychology, 9 (1): pp 21-40.
11. Brown, G., Van Susternen, T., Onsager, D., Simpson, D. and Condon, R. (1994) Influence of sleep deprivation on learning among surgical house staff and medical students. Surgery, 115: 604-610.
12. Daniels, K., Harris, C, and Briner, R. (2002) Understanding Risk: A Cognitive Approach. Health and Safety Executive contractor report 427/2002
13. Dekker, S. (2003) Failure to adapt or adaptations that fail: contrasting models on procedures and safety. Applied Ergonomics, 34 (3): 233-238.
14. De Gennaro, L., Ferra, M., Curcio, G. and Bertini, M. (2001) Visual search performance across 40 h of continuous wakefulness: Measures of speed and accuracy and relation with occulomotor performance. Physiology and Behavior, 74 (1-2): pp. 197-204.
86
15. Draycott, S. (1996) Validation of AGARD-STRES battery of performance tests. Human Factors, 38 (2): 347-361.
16. Drummond, S. and Brown, G. (2001) The effects of total sleep deprivation on cerebral responses to cognitive performance. Neuropsychopharmocology, 25 (Suppl5): pp S68-S73.
17. Drummond, S., Gillan, J., and Brown, G. (1998) Effects of working memory load on learning after sleep. Sleep, 21 (3 Supplement): pp 233.
18. Drury, C. (1991) Errors in aviation maintenance: taxonomy and control. Proceedings of the 35th Annual Meeting of the Human Factors Society. pp 42-46.
19. Drury, C., Prabhu, P., Gramopadhye, A. (1990) Task analysis of aircraft inspection activities: methods and findings. Proceedings of the Human Factors Society 34th Annual Meeting: pp 1181-1185.
20. Drury, C., Shepherd, W., and Johnson, W. (1997a) Measuring human detection performance in aircraft visual inspection. Proceedings of the Human Factors and Ergonomics Society 41st Annual Meeting. pp. 304-308.
21. Drury, C., Shepherd, W., and Johnson, W. (1997b) Error reduction in aviation maintenance. In K. Kuhla, and E. Hanninen (eds), Proceedings of the 13th Triennal Congress of the International Ergonomics Association (Helsinki: Finnish Institute of Occupational Health).
22. Englund, C., Ryman, D., Naitoh, P. and Hodgson, J. (1984) Cognitive Performance During Successive Sustained Physical Work Episodes. U.S. Naval Health Research Center, report No. 84-31.
23. Folkard, S. (1996) Effects on performance efficiency. In Colquhoun, P., Costa, G., Folkard, S. and Knauth, P. (eds.) Shiftwork: Problems and Solutions. Berlin; Peter Lang.
24. Harrison, Y. and Horne, J. (1996) Sleep loss affects frontal lobe function, as shown in complex “real world” tasks. Sleep Research, 25: 467.
25. Harrison, Y. and Horne, J. (1997a) Sleep deprivation affects speech. Sleep, 20 (10): 871-877.
26. Harrison, Y. and Horne, J. (1997b) Sleep loss performance decrements on frontal lobe tasks show no improvement with caffeine. Sleep Research, 26:616.
27. Harrison, Y. and Horne, J. (1998) Sleep loss impairs short and novel language tasks having a prefrontal focus. Journal of Sleep Research, 7 (2): pp. 95-100.
28. Harrison, Y. and Horne, J. (1999) One night of sleep loss impairs innovative thinking and flexible decision making. Organizational Behavior & Human Decision Processes. 78 (2): pp. 128-145.
29. Harrison, Y. and Horne, J. (2000a) Sleep loss and temporal memory. Human Experimental Psychology, 53 (1): 271-279.
30. Harrison, Y. and Horne, J. (2000b) The impact of sleep deprivation on decision making: a review. Journal of Experimental Psychology – Applied, 6 (3): 236-249.

87
31. Harrison, Y., Horne, J. and Rothwell, A. (1997) Sleep loss performance decrements on frontal lobe tasks show no improvement with caffeine. Sleep Research, 26:616.
32. Hobbs, A. and Williamson, A. (2002) Skills, rules and knowledge in aircraft maintenance: errors in context. Ergonomics 45 (4): 290-308.
33. Hockey, G., Westell, D., and Sauer, J. (1998) Effects of sleep deprivation and user interface on complex performance: multilevel analysis of compensatory control. Human Factors, 40 (2): pp. 233-253.
34. Hodgedon, J. (1986) Physical fitness as it pertains to military operations. Naval Health Research Center, Report No. A259-109.
35. Hollnagel, E. (1998) Cognitive Reliability and Error Analysis Method. New York; Elsevier.
36. Kelly, T. (1996) Circadian Rhythms: Importance for Models of Cognitive Performance. U.S. Naval Health Research Center, Report No. A310-265.
37. Kim, D., Lee, H., Kim, M., Park, Y., Go, H., Kim, K., Lee, S., Chae, J., and Lee, C. (2001) The effect of total sleep deprivation on cognitive functions in normal adult male subjects. International Journal Neuroscience, 109 (1-2): pp. 127-137.
38. Larsen, R. (2001) Decision making by military students under severe stress. Military Psychology, 13 (2): 89-98.
39. Lemond, N. and Dawson, D. (1999) Quantifying the performance impairment associated with fatigue. Journal of Sleep Research, 8: pp. 255-262.
40. Mason, S. (2001) Improving maintenance by reducing human error. Proceedings of the 15th Annual Human Factors in Aviation Maintenance. Obtain from following web site - http://www.plant-maintenance.com/articles/maintenance_human_error.pdf
41. Maurino, D., Reason, J., Johnston, N., and Lee, R. (1995) Beyond Aviation Human Factors. Aldershot; Ashgate.
42. May, J. and Kline, P. (1988) An objective measure of fatigue derived from a set of brief tasks. Work & Stress, 2 (1): pp.59-70.
43. Neri, D., Shappell, S. and DeJohn, C. (1992) Simulated sustained flight operations and performance: I. Effects of Fatigue. Military Psychology. 4 (3): 137-155.
44. Patton, J., Vogel, J., Damakosh, A., and Mello, R. (1989) Effects of continuous military operations on physical fitness capacity and physical performance. Work & Stress, 3 (1): pp. 69-77.
45. Pilcher, J. and Huffcutt, A. (1996) Effects of sleep deprivation on performance: a meta-analysis. Sleep, 19 (4): pp. 318-326.
46. Proctor, S., White, R., Robins, T., Echiverria, D. and Rocskay, A. (1996) Effect of overtime on cognitive function in automotive workers. Scandinavian Journal of Work, Environment & Health, 22 (2): pp. 124-132.
47. Reason, J. (1987) Managing the Risk of Organizational Accidents. Aldershot; Ashgate.

88
48. Reason, J and Hobbs, A. (2003) Managing Maintenance Error. Aldershot; Ashgate.
49. Rhodes, W. (2001) Assessment of Aircraft Maintenance Engineers (AMEs) Hours of Work: Phase 1. Transportation Development Centre, Transport Canada, TP 13875E.
50. Ryman, D., Naitoh, P. and Englund, C. (1984) Minicomputer administered tasks in the study of effects of sustained work on human performance. Behavioral Research Methods, Instruments & Computers, 16 (2), 256-261.
51. Ryman, DH; P Naitoh, and CE Englund (1985) Decrements in logical reasoning performance under conditions of sleep loss and exercise fatigue: The factor of sentence complexity. Perceptual Motor Skills, 61: pp.1179-1188.
52. Schlegel, R. and Gilliland, K. (1992) Development of the UTC-PAB Normative Database: Final report. FAA technical report.
53. Stokes, A. and Kite, K. (1994) Flight Stress: Stress, Fatigue, and Performance in Aviation. Brookfield; Ashgate.
54. Taylor, J. and Patankar, M. (2000) Role of communication in the reduction of errors. Proceedings of the 14th Annual Human Factors in Aviation Maintenance. Obtain from following web site - http://www.hf.faa.gov/docs/508/docs/taylor14.pdf
55. Thorne DR, Genser SG, Sing HC, Hegge FW. (1985) The Walter Reed performance assessment battery. Neurobehav Toxicol Teratol, 7 (4): pp 415-418
56. TSBC (2000) TSB Statistical Summary, Aviation Occurrences 1999. Hull; Transportation Safety Board of Canada.
57. Vaughn, D. (1996) The Challenger Launch Decision. Chicago; University of Chicago Press.
58. Whitmore, J. and Fisher, S. (1996) Speech during sustained operations. Speech Communication, Special Issue – Speech Under Stress, 20 (1-2): pp. 55-70.
59. Williams, J. (1988) A data-based method for assessing and reducing human error to improve operational performance. Proceedings of the IEEE Conference on Human Factors and Power Plants, Monterey, California.
60. Williamson, A. and Feyer, A. (1995) Causes of accidents and the time of day. Work & Stress, 9 (2/3):pp 158-164.
61. Williamson, A., Feyer, A., Friswell, R., Finlay-Brown, S. (2000) Developing Measures of Fatigue Using an Alcohol Comparison to Validate the Effects of Fatigue on Performance. ATSB, Report 189. Canberra; ATSB.
62. Wimmer, F., Hoffman, R. and Moffitt, A. (1992) The effects of sleep deprivation on divergent thinking and attention processes. Journal of Research, 1: 223-230.
63. Wright, B., Koppa, A. and Rodger, J. (1999) The circadian variability of human performance in the military air combat environment. Human Performance in Extreme Environments, 4 (1): pp. 21-26.

Appendix A
Aircraft Maintenance Task Database


A-1
Table A1: Aircraft Maintenance Task Database SUBTASK: Planning Engine Replacement
Subtask/Task Element
Number of Personnel
Physical Components *
Cognitive Components * Cautions Working Conditions
Point in Cycle/Time
of Day
Comments
Task: Engine Replacement
Planning
1. AME obtains job card describing snag.
1 - AME obtains card from shift team leader .
large motor (walking – 80%)
Visual perception (10%) Information processing (10%)
N/A 32º C (Humidex = 42º C) Night shift Time constraint
Last day in 4-day cycle
Entire night
No Data
2. AME and ATs review items on the job card.
4 – Team leader briefs the AMEs and ATs on the work to be done.
None Psychomotor (20%) Communications (45%) Decision making (10%) Information processing (15%) Visual perception (10%)
Information about the job must be entered into the log as the job continues, not just at the end.
No Data No Data No Data
3. AME ATs divide up the individual subtasks and distribute them amongst the crewmembers.
1 AME 3 mech. ATs 1 Avionics AT 2 mechanical apprentices
None Visual perception (10%) Communications (50%) Information processing (10%) Working memory (5%) Decision-making (25%)
AME must make sure inexperienced crew members are teamed with those who know the task.
No Data No Data No Data
* Percentages are derived from the estimated time consumed by each component, based on observations. Where possible, information based on past task analysis results is used to further verify the estimates.
continued...

A-2
Table A1 Engine Replacement – Planning continued
Subtask/Task Element
Number of Personnel
Physical Components *
Cognitive Components * Cautions Working Conditions
Point in Cycle/Time
of Day
Comments
4. AME enters any additional information onto the job forms.
1 AME Fine motor (40%) Information processing (30%) Visual perception (20%) Decision-making (10%)
Distractions can cause errors in entering data or incomplete information.
Time constraints are evident.
No Data AME must quickly decide on course of action.
5. AME (mech.) discusses the job with the crew (crew briefing).
1 AME None Communications (75%) Working memory (5%) Information processing (20%)
If the job is unfamiliar, or there are many inexperienced crewmembers, this step is very important.
No Data No Data AME assigns a ATATto coordinate the job with the other crewmembers.
6. The AME orders the special equipment required to do the engine change, and order the new engine.
1 AME None Communications (75%) Information processing (10%) Decision making (10%) Working memory (5%)
AME must locate parts which may have to be shipped in. Potential for affecting the timeline is high.
At night it is difficult to reach some supply personnel.
No Data AME has to negotiate with the supply office to obtain equipment and have the engine delivered.
7. ATs review the drawings and specification on the computer describing the particular subtask they will do for the change out of the specified engine.
4 ATs
2 Apprentices
Fine motor (10%) Visual perception (40%)
Working memory (20%)
Information processing (10%)
Decision making (10%)
Communications (10%)
Not all information is available on the computer, and must be obtained through paper manuals or on microfiche. Some information may be out of date. Some bulletins on the part/system may be missing.
Ready room is busy and can be noisy. Concentration may be difficult to achieve. Distractions may occur.
No Data No Data
continued...

A-3
Table A1 Engine Replacement – Planning continued
Subtask/Task Element
Number of Personnel
Physical Components *
Cognitive Components * Cautions Working Conditions
Point in Cycle/Time
of Day
Comments
8. Each AME or AT completes a parts requisition form and takes it to the parts room.
4 ATs
2 apprentices
Fine motor (15%) Visual perception (50%) Working memory (5%) Information processing (15%) Decision making (15%)
No Data No Data No Data No Data
9. Each AME or AT goes to the parts bin for any other parts required (other than the engine itself or special tools) and obtains them.
4 ATs
2 apprentices
Fine motor (10%) Visual perception (50%) Working memory (10%) Information processing (15%) Decision making (15%)
Parts system must be up to date. Parts must be properly marked and stored. Parts personnel must be knowledgeable.
Stock room (bin) lighting may be poor. Labelling may be inadequate.
No Data No Data
continued...

A-4
Table A1 continued SUBTASK: Disassembly/Reassembly for Engine Replacement
Subtask/Task Element
Number of Personnel
Physical Components *
Cognitive Components * Cautions Working Conditions
Point in Cycle/Time
of Day
Comments
Task: Engine Replacement
Disassembly/ Reassembly
5 mechanical ATs plus 1 avionics AT required for task.
N/A N/A N/A 32º C (Humidex = 42º C) Night shift Time constraint
N/A N/A
1. ATs open nacelle covers
2 persons Fine motor (20%)
Pushing/ pulling (50%)
Visual perception (10%) Attention (10%) Communications (10%)
Covers are pneumatically assisted and will spring outward when released.
No Data No Data No Data
2. ATs disconnect hoses, tubing, fuel lines, air ducts and cables; cut lock wire
2 persons (one each side)
Fine motor (50%) Psychomotor (20%)
Working Memory (15%) Decision making (15%)
Pressure from pneumatic system must be bled off first.
Lock wire must be cut and removed.
Low light
Constrained space
Layered components (difficult to access hardware)
No Data No Data
3ATs install bootstrap kit for nacelle covers
2 persons (one each side)
Heavy lifting (20%)
Fine motor (25%)
Reaching (5%)
Communications (5%) Visual perception (30%) Working memory (5%) Psychomotor (10%)
Components are heavy and require some force to position correctly in the tight confines of the nacelle.
No Documentation provided
No Data No Data
continued...

A-5
Table A1 Engine Replacement – Disassembly/Reassembly continued
Subtask/Task Element
Number of Personnel
Physical Components *
Cognitive Components * Cautions Working Conditions
Point in Cycle/Time
of Day
Comments
4. ATs unbolt nosecone
2 persons Fine motor (30%)
Bending (20%)
Reaching (10%)
Communications (5%) Psychomotor (10%) Visual perception (20%) Decision-making (5%)
Requires that personnel assume awkward postures.
Some fasteners are extremely difficult to access and require a lengthy removal process.
No Data No Data
5. ATs install bootstrap supports for lowering engine into cradle.
2 persons Heavy Lifting (20%) Fine motor (10%) Large motor (20%) Reaching (5%)
Communications (5%) Psychomotor (10%) Visual perception (20%) Decision making (10%)
Components are heavy and require some force to position correctly in the tight confines of the nacelle.
Confined space – awkward for positioning heavy tool
No Data No Data
6. AT attaches dynamometers to the bootstrap supports
1 person Heavy Lifting (20%) Fine motor (10%) Large motor (20%)
Communications (20%) Psychomotor (10%) Visual perception (20%)
Dynamometers must be properly calibrated.
No Data No Data No Data
7. Team prepares cradle to support engine
5 persons Heavy pushing and pulling (50%)
Heavy lifting (10%)
Communication (25%) Decision making (5%) Psychomotor (10%)
Requires brute force to prepare cradle. Co-ordination of several people to level the cradle.
No Data No Data No Data
8. Team positions empty cradle under engine
5 persons Heavy pushing and pulling (60%)
Communication (15%) Visual perception (10%) Psychomotor (10%) Decision making (5%)
Cradle is heavy and requires five people to move it. Requires accuracy to line it up.
No Data No Data Requires that a AT eyeball the right angle of entry below the engine.
continued...

A-6
Table A1 Engine Replacement – Disassembly/Reassembly continued
Subtask/Task Element
Number of Personnel
Physical Components *
Cognitive Components * Cautions Working Conditions
Point in Cycle/Time
of Day
Comments
9. Team adjusts position of winch hooks to attach to the cradle eyebolts.
4 persons to man each winch
1 person to coordinate
Medium pulling (40%) Psychomotor (30%)
Visual perception (30%)
Hooks must be securely positioned in the eyebolts.
No Data No Data Personal injury.
Must back off winches to reach the dynamometers and the cradle.
10. ATs disconnect upper part of cradle from lower.
1 to 2 persons Fine motor (20%)
Large motor (20%)
Bending (20%)
Psychomotor (20%)
Visual perception (10%)
Decision making (10%)
Clamps must be secured by temporary straps to keep them clear of the interface between the upper and lower parts of the cradle.
No Data No Data Clamps are crushed between the upper and lower parts of the cradle, causing the loss of a clamp.
11. Team winches upper cradle toward engine until the dynamometers display approved recommended force values.
4 persons Fine motor (20%)
Large motor (30%)
Psychomotor (10%)
Visual perception (10%)
Decision making (20%)
Attention (10%)
Each person must winch at the same rate and watch, carefully, to ensure that force values do not exceed recommended values.
No Data No Data All four personnel must exert equal pressure on pylon.
12. ATs unbolt the engine at the mounts.
1 to 2 persons Fine motor (20%)
Large motor (40%)
Psychomotor (20%)
Visual perception (20%)
Lock wire must be cut and removed before nuts can be accessed and removed.
No Data No Data Damage to engine and/or personal injury may result if engine shifts during transit and falls to ground.
continued...

A-7
Table A1 Engine Replacement – Disassembly/Reassembly continued
Subtask/Task Element
Number of Personnel
Physical Components *
Cognitive Components * Cautions Working Conditions
Point in Cycle/Time
of Day
Comments
14. Team lowers upper part of cradle with engine attached, down to the lower part of the cradle.
4 persons Fine motor (20%)
Large motor (40%)
Psychomotor (20%)
Visual perception (20%)
No Data No Data No Data No Data
15. Disconnect the lower hooks of the dynamometers from the cradle.
1 person Fine motor (20%)
Large motor (40%)
Psychomotor (20%)
Visual perception (20%)
Upper part of cradle must be aligned properly with lower part before removing the dynamometers.
No Data No Data No Data
15. Re-clamp upper part of cradle to lower.
1 person Fine motor (10%)
Large motor (50%)
Psychomotor (20%)
Visual perception (20%)
Proper alignment of upper and lower parts of the cradle is required to allow clamps to be closed completely.
No Data No Data Damage to engine and/or personal injury may result if engine shifts during transit and falls to ground.
16 Roll the cradle with the malfunctioning engine to holding area.
1 person
Use of tractor
Large motor (30%)
Pushing/pulling (30%)
Psychomotor (20%)
Visual perception (20%)
No Data No Data No Data No Data
17. Roll cradle with replacement engine over to aircraft.
1 person
Use of tractor
Heavy pushing and pulling (70%)
Communication (15%)
Psychomotor (15%)
Requires 2-4 people to safely move the cradle.
No Data No Data No Data
continued...

A-8
Table A1 Engine Replacement – Disassembly/Reassembly continued
Subtask/Task Element
Number of Personnel
Physical Components *
Cognitive Components * Cautions Working Conditions
Point in Cycle/Time
of Day
Comments
18. Adjust the cradle to the proper height.
5 persons Heavy pushing and pulling (50%)
Lifting (20%)
Communication (25%)
Decision making (5%)
Requires brute force to prepare cradle. Co-ordination of several people to level the cradle.
No Data No Data
19. Position engine under pylon.
5 persons Heavy pushing and pulling (80%)
Communication (10%)
Visual perception (10%)
Cradle is heavy and requires 5 people to move it. Requires accuracy to line it up.
No Data No Data
20. Lower the lower hooks of the dynamometers to the cradle eyebolts and attach.
4 persons to man each winch
1 person to coordinate
Medium pulling (60%) Psychomotor (20%)
Visual perception (20%)
Hooks must be securely positioned in the eyebolts (holes?).
No Data No Data Personal injury.
Must back off winches to reach the dynamometers and the cradle.
21. Unlatch the upper-lower securing clamps on the cradle.
1 to 2 persons Fine motor (20%)
Large motor (40%)
Psychomotor (20%)
Visual perception (15%)
Decision making (5%)
Clamps must be secured by temporary straps to keep them clear of the interface between the upper and lower parts of the cradle.
No Data No Data Clamps are crushed between the upper and lower parts of the cradle, causing the loss of a clamp.
22. Winch the upper part of the cradle holding the replacement engine until the dynamometers indicate the appropriate force values.
4 persons Fine motor (10%)
Large motor (30%)
Psychomotor (20%)
Visual perception (20%)
Decision making (10%)
Communications (10%)
Each person must winch at the same rate and watch, carefully, to ensure that force values do not exceed recommended values.
No Data No Data All four personnel must exert equal pressure on pylon.
continued...

A-9
Table A1 Engine Replacement – Disassembly/Reassembly continued
Subtask/Task Element
Number of Personnel
Physical Components *
Cognitive Components * Cautions Working Conditions
Point in Cycle/Time
of Day
Comments
23. Bolt the engine to the pylon engine mounts.
1 to 2 persons Fine motor (20%)
Large motor (30%)
Psychomotor (20%)
Visual perception (20%)
Decision making (10%)
Lock wire must be properly threaded through nut and secured.
No Data No Data Safety margin of redundancy of bolts allows the engine to remain secure, however, if left unchecked may eventually cause bolts to break.
24. Lower the top part of the cradle onto the lower part.
4 persons Fine motor (20%) Large motor (40%)
Psychomotor (20%)
Visual perception (20%)
No Data No Data
25 Re-clamp upper part of cradle to lower.
1 person Fine motor (10%) Large motor (50%)
Psychomotor (20%)
Visual perception (20%)
Proper alignment of upper and lower parts of the cradle is required to allow clamps to be closed completely.
No Data No Data Damage to engine and/or personal injury may result if engine shifts during transit and falls to ground.
26. Roll the cradle over to the holding area.
1 person
Use of tractor
Large motor (70%)
Psychomotor (10%)
Visual perception (20%)
No Data No Data No Data No Data
27. Connect hoses, fuel lines, air ducts and cables.
2 persons (one each side)
Fine motor (40%)
Large motor (20%)
Visual perception (10%)
Psychomotor (20%)
Memory (10%)
Decision making (10%)
Some connectors are not keyed.
Low light Constrained space Layered components (difficult to access hardware)
No Data No Data
continued...

A-10
Table A1 Engine Replacement – Disassembly/Reassembly continued
Subtask/Task Element
Number of Personnel
Physical Components *
Cognitive Components * Cautions Working Conditions
Point in Cycle/Time
of Day
Comments
28. Attach, thread and tighten engine mounting nuts.
2 persons (one each side)
Fine motor (30%)
Large motor (30)
Psychomotor (20%)
Memory (10%)
Decision making (10%)
Must torque the nuts to specified amount.
Low light
Constrained space
Layered components (difficult to access hardware)
No Data No Data
29. Thread the lock wire through nuts and housing, and tighten.
2 persons (one each side)
Fine motor (40%)
Large motor (10%)
Psychomotor (30%)
Memory (10%)
Decision making (10%)
No Data Low light
Constrained space
Layered components (difficult to access hardware)
No Data No Data
30. Bolt nose cone to engine.
2 persons Fine motor (50%)
Communications (10%)
Visual perception (10%)
Decision-making (10% - pattern of bolt removal)
Psychomotor (20%)
Requires that personnel assume awkward postures.
Must use a torque wrench
Some nuts are extremely difficult to access and require a lengthy removal process.
No Data No Data
continued...

A-11
Table A1 Engine Replacement – Disassembly/Reassembly continued
Subtask/Task Element
Number of Personnel
Physical Components *
Cognitive Components * Cautions Working Conditions
Point in Cycle/Time
of Day
Comments
31. Remove engine bootstrap supports from pylon.
2 persons (one each side)
Lifting + fine motor (50%) Communications (20%)
Visual perception (10%)
Psychomotor (20%)
Components are heavy and require some force to position correctly in the tight confines of the nacelle.
No Documentation provided
No Data No Data
32. Remove nacelle cover bootstrap supports.
2 persons Heavy Lifting (20%)
Fine motor (30%)
Communications (20%)
Visual perception (10%)
Psychomotor (20%)
Components are heavy and require some force to position correctly in the tight confines of the nacelle.
Constrained space – awkward for positioning heavy tool
No Data No Data
33. Complete avionics setup tasks.
1 Avionics AT None Information processing (50%)
Visual perception (20%)
Decision making (20%)
Attention (10%)
No Data No Data No Data No Data
34. Close nacelle covers and secure.
2 persons Fine and large motor (20%) Large motor - pushing/ pulling (70%)
Attention (10%) Covers are pneumatically assisted and will spring outward unless secured.
No Data No Data No Data
35 Record job completion information into log book.
AME or AT Fine motor (20%) Information processing (40%)
Visual perception (20%)
Decision making (20%)
Information about the job must be entered as the job continues, not just at the end.
Extremely fatigued.
End of a 15-hour shift.
No Data
continued...

A-12
Table A1 continued SUBTASK: A-Check – Planning
Subtask/Task Element
Number of Personnel
Physical Components *
Cognitive Components * Cautions Working Conditions
Point in Cycle/Time
of Day
Comments
Task: A-Check -
Planning
1. Team leader distributes the job cards for the night.
1 AME None Decision Making (40%) Visual perception (40%) Communications (20%)
No Data No Data Beginning of cycle
Task completion can be unpredictable
2. Each AME reviews all of the job cards pertaining to the A-check, including the checklist of items to be inspected and replaced.
All AME’s None Information Processing (50%) Decision Making (30%) Visual perception (20%)
No Data No Data Beginning No Data
3. Identify Minimum Equipment List (MEL) items and snags and determine repairs that are required.
Depends on the task and area being investigated
None Information Processing (40%) Decision Making (40%) Visual perception (20%)
No Data No Data No Data No Data
4. Briefing - AMEs and ATs discuss each trade’s items and any coordination between trades
Entire Team None Information Processing (20%) Decision Making (30%) Communications (50%)
No Data No Data No Data A more experienced team may be able to make more accurate decisions
continued...

A-13
Table A1 A-Check – Planning continued
Subtask/Task Element
Number of Personnel
Physical Components *
Cognitive Components * Cautions Working Conditions
Point in Cycle/Time
of Day
Comments
5. AMEs distribute job cards to ATs not at briefing.
AME’s None Decision Making (40%) Information Processing (30%) Communications (30%)
No Data No Data No Data No Data
6. AMEs discuss jobs with ATs not at briefing.
2 or more None Information Processing (20%) Communications (60%) Memory (20%)
No Data No Data No Data No Data
7. AME and ATs plan out their strategy and divide up the tasks.
2 or more None Decision Making (30%) Information Processing (30%) Communications (40%)
No Data No Data No Data
8. Each AME and AT reviews the details of the job cards and calls up the appropriate pages on the computer of microfiche reader, and prints off the pages they need to do the job.
Each AME and AT
Operation of computer based references Fine motor (20%)
Visual perception (30%) Information Processing (20%) Decision Making (30%)
No Data Office Environment
No Data No Data
9. Each AME and AT push their tool cabinet over to a convenient spot near the plane
Each AT Pushing (30%)
Large motor (20%)
Attention (10%) Visual perception (30%) Decision Making (10%)
No Data No Data No Data CAT’s need to collect tools that are not in their cart from the tool crib
continued...
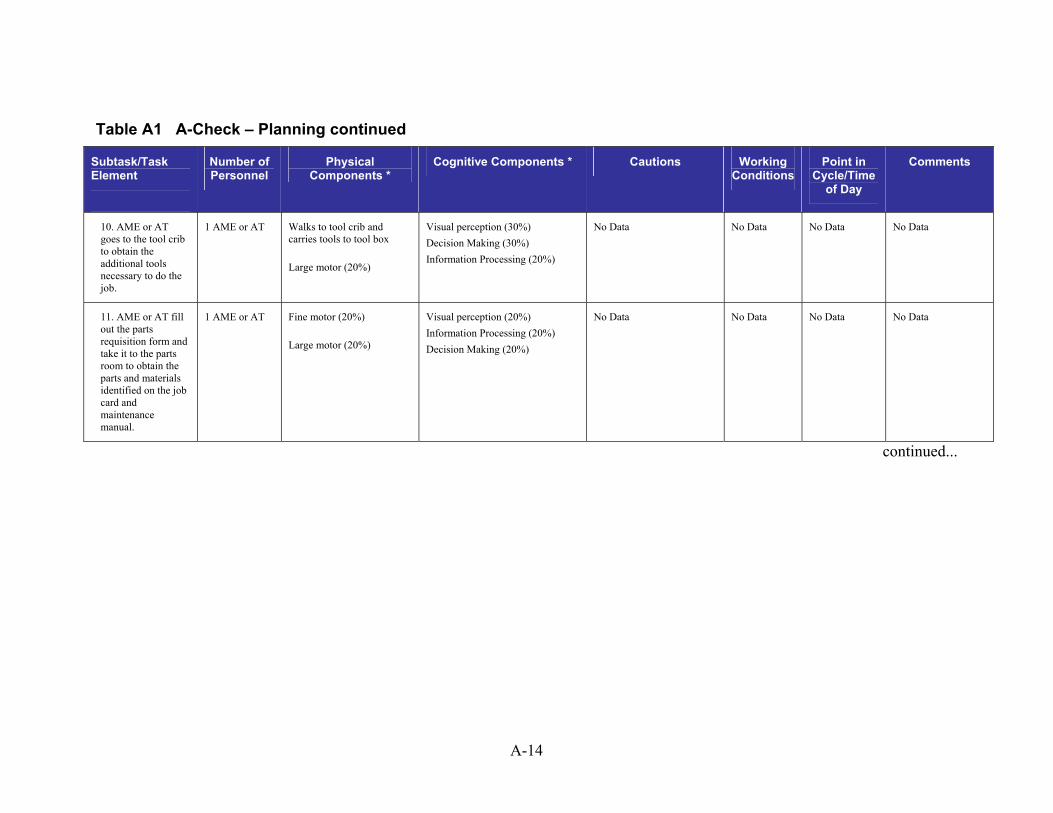
A-14
Table A1 A-Check – Planning continued
Subtask/Task Element
Number of Personnel
Physical Components *
Cognitive Components * Cautions Working Conditions
Point in Cycle/Time
of Day
Comments
10. AME or AT goes to the tool crib to obtain the additional tools necessary to do the job.
1 AME or AT Walks to tool crib and carries tools to tool box
Large motor (20%)
Visual perception (30%) Decision Making (30%) Information Processing (20%)
No Data No Data No Data No Data
11. AME or AT fill out the parts requisition form and take it to the parts room to obtain the parts and materials identified on the job card and maintenance manual.
1 AME or AT Fine motor (20%)
Large motor (20%)
Visual perception (20%) Information Processing (20%) Decision Making (20%)
No Data No Data No Data No Data
continued...

A-15
Table A1continued SUBTASK: A-Check – Avionics Inspection – Cockpit Equipment – Electrical/Electronic
Subtask/Task Element
Number of Personnel
Physical Components *
Cognitive Components * Cautions Working Conditions
Point in Cycle/Time
of Day
Comments
A-Check: Avionics Inspection – Cockpit – Electrical/ Electronic
1. AT identifies items to inspect on checklist pertaining to this particular A-check.
1 AT None Attention (10%) Visual perception (50%) Information processing (20%) Decision making (30%)
Necessary to read each item carefully to determine all components of check (each check may be different)
Checklists are very similar for each aircraft.
Time to complete check is limited.
No Data No Data
2. AT pulls (switches off) appropriate circuit breakers
1 AT Fine motor (10%) Attention (10%)
Visual perception (40%)
Information processing (10%)
Decision making (30%)
If a particular switch is not pulled, activation of hydraulics or other system may occur inadvertently, potentially causing injury to personnel.
Confined space.
Limited timeline.
No Data No Data
3. AT activates equipment specified in the checklist, and looks for response, recording whether status is a pass or fail as indicated by response.
1 AT Fine motor (10%) Attention (15%)
Visual perception (35%) Information processing (10%) Decision making (30%)
All equipment being tested or placed in a safe state for inspection must be tagged to indicate to other personnel that the breakers must not be closed.
Breakers are very close together, labelling in small, lighting is barely adequate and breaker design is identical. Space is restrictive.
No Data No Data
4. Run specific test routines, recording results as each test is completed.
1 to 2 ATs
1 AT may have to spot.
None Visual perception (30%)
Attention (20%)
Information processing (20%)
Decision making (30%)
Another person may be required to act as a spotter, as certain systems are operated.
May be very hot or confined environments
No Data No Data
continued...

A-16
Table A1 A-Check – Avionics Inspection – Cockpit Equipment – Electrical/Electronic continued
Subtask/Task Element
Number of Personnel
Physical Components *
Cognitive Components * Cautions Working Conditions
Point in Cycle/Time
of Day
Comments
5. If a test results in a failure response, the CAT/AT may run additional tests to determine what the problem is, recording what action is required to rectify the problem.
1 AT None Attention (20%)
Visual perception (30%)
Information processing (20%)
Decision making (30%)
Another person may be required to act as a spotter, as certain systems are operated.
ATmay not see all persons entering the area.
May need to move to other parts of the plane to perform additional tests.
No Data No Data
6. Ensure all light bulbs, displays, buttons, switches and printer are fully functional.
1 AT None Attention (20%)
Visual perception (30%)
Information processing (20%)
Decision making (30%)
Lights may make buttons very hot.
Some breakers & buttons are over head and in awkward positions
Confined space - may encounter awkward postures to perform full assessments
No Data No Data
continued...

A-17
Table A1 continued SUBTASK: A-Check – Avionics Inspection – Cockpit Equipment - Mechanical – (including hydraulics)
Subtask/Task Element
Number of Personnel
Physical Components *
Cognitive Components * Cautions Working Conditions
Point in Cycle/Time
of Day
Comments
A-Check –
Avionics Inspection – Cockpit – Mechanical – Including hydraulics
1. AT identifies mechanical systems to inspect on checklist pertaining to this particular A-check.
1 AT None Attention (10%)
Visual perception (50%)
Decision making (20%)
Information processing (20%)
Necessary to read each item carefully to determine all components of check (each check may be different)
Checklists are very similar for each aircraft.
Time to complete check is limited.
No Data No Data
2. AT pulls (switches off) appropriate circuit breakers and switch on breakers for specific equipment to be tested.
2 ATs Fine motor (10%) Attention (10%)
Visual perception (40%)
Decision making (20%)
Psychomotor (20%)
If a particular switch is not pulled, activation of hydraulics or other system may occur inadvertently, potentially causing injury to personnel.
No Data No Data
3. ATpositions a spotter (another CAT/AT) at the site of the piece of equipment to be tested.
2 ATs None Visual perception (20%)
Communications (70%)
Decision making (10%)
All equipment being tested or placed in a safe state for inspection must be tagged to indicate to other personnel that the breakers must not be closed.
May be in and around the entire aircraft
No Data AT must never assume that no one is working on or near the aircraft
4. AT in cockpit tells the spotter when test is to be started (via earphones, sometimes).
2 ATs None Attention (20%)
Communications (80%)
Another person may be required to act as a spotter, as certain systems are operated.
No Data No Data No Data
continued...

A-18
Table A1 A-Check – Avionics Inspection – Cockpit Equipment - Mechanical – (including hydraulics) continued
Subtask/Task Element
Number of Personnel
Physical Components *
Cognitive Components * Cautions Working Conditions
Point in Cycle/Time
of Day
Comments
5. Spotter clears the area and watches for anyone coming into the area.
2 ATs None Attention (30%)
Visual perception (50%) Communications (20%)
Another person may be required to act as a spotter, as certain systems are operated.
No Data No Data Line of sight around aircraft is not 100%
6. AT in cockpit initiates test when spotter gives the all-clear signal.
2 ATs Fine motor (5%) Attention (30%) Visual perception (40%) Communications (25%)
Personnel are often moving around the aircraft at all times. Difficult to keep personnel clear of the aircraft.
No Data No Data No Data
7. Spotter observes action of external equipment to verify correct operation.
1 AT None Visual perception (40%) Attention (40%) Decision making (20%)
Spotter must keep at a safe distance from moving equipment.
No Data No Data No Data
8. Spotter gives CAT/AT feedback about operation of external equipment – okay or no good signal or verbal report.
2 ATs None Visual perception (30%) Attention (30%) Decision making (20%) Communications (20%)
AT in cockpit may have difficulty communicating with the spotter. Spotter must use hand signals and verbal commands to communicate with AT in cockpit.
Noise from operating hydraulics makes verbal communications difficult.
No Data No Data
9. AT in cockpit records result of test, noting any irregularities, failures etc.
2 ATs Fine motor (30%) Visual perception (40%)
Information processing (20%)
Decision making (10%)
No Data No Data No Data No Data
continued...

A-19
Table A1 continued SUBTASK: A-Check – Avionics Adjustments – Cockpit Equipment - Mechanical – (including hydraulics)
Subtask/Task Element
Number of Personnel
Physical Components *
Cognitive Components * Cautions Working Conditions
Point in Cycle/Time
of Day
Comments
A-Check –
Avionics Adjustments – Cockpit – Mechanical – Including hydraulics
1. AT identifies mechanical systems to adjust on checklist pertaining to this particular A-check, or as identified by the results of a previous test.
1 AT avionics and 1 AT mechanical
None Visual perception (45%)
Information processing (20%)
Decision making (30%)
Communications (5%)
Necessary to read each item carefully to determine all components of check (each check may be different)
Checklists are very similar for each aircraft.
Time to complete check is limited.
No Data No Data
2. Pull (switch off) appropriate circuit breakers and switch on breakers for specific equipment to be tested.
1 AT(AV or ME)
Fine motor (40%) Psychomotor (20%)
Information processing (20%)
Decision making (20%)
If a particular switch is not pulled, activation of hydraulics or other system may occur inadvertently, potentially causing injury to personnel.
Very small switches in confined areas
No Data Breaker can be over head, behind the seated AT and in awkward positions
3. Position a spotter (another CAT/AT) at the site of the piece of equipment to be adjusted.
2 AT None Visual perception (20%)
Communications (70%)
Decision making (10%)
All equipment being tested or placed in a safe state for inspection must be tagged to indicate to other personnel that the breakers must not be closed.
No Data No Data No Data
continued...

A-20
Table A1 A-Check – Avionics Adjustments – Cockpit Equipment - Mechanical – (including hydraulics) continued
Subtask/Task Element
Number of Personnel
Physical Components *
Cognitive Components * Cautions Working Conditions
Point in Cycle/Time
of Day
Comments
4. AT in cockpit tells the spotter when operation of equipment is to begin.
2 AT None Visual perception (20%) Information processing (20%) Communications (60%)
Another person may be required to act as a spotter, as certain systems are operated.
No Data No Data No Data
5. Spotter clears the area and watches for anyone coming into the area.
1 AT None Visual perception (40%) Attention (20%) Information processing (20%) Decision making (20%)
Another person may be required to act as a spotter, as certain systems are operated.
AT may not see all persons entering the area.
No Data No Data No Data
6. AT in cockpit initiates operation when spotter gives the all-clear signal.
2 AT Fine motor (5%) Attention (20%) Visual perception (50%) Communications (25%)
AT may not see all persons entering the area. Signal or external noise may distract the concentration of CAT
No Data No Data No Data
7. Spotter observes action of equipment and any gauges/meters attached to equipment, monitoring the operation.
2 AT None Visual perception (30%)
Attention (30%)
Information processing (20%)
Decision making (20%)
View of equipment being tested may be incomplete.
No Data No Data No Data
continued...

A-21
Table A1 A-Check – Avionics Adjustments – Cockpit Equipment - Mechanical – (including hydraulics) continued
Subtask/Task Element
Number of Personnel
Physical Components *
Cognitive Components * Cautions Working Conditions
Point in Cycle/Time
of Day
Comments
8. Spotter reports the results back to the AT in cockpit.
2CAT/AT None Visual perception (20%)
Communications (80%)
CAT/AT in cockpit may misinterpret
No Data No Data
9. AT in cockpit records result into checklist and enters any comments.
1 AT None Information processing (60%) Decision making (30%) Communications (10%)
No Data No Data Depending on time of task, ATmay forget all detail to be recorded or confuse information with past information
continued...

A-22
Table A1 continued SUBTASK: A-Check – Mechanical Checks – Cargo Bay
Subtask/Task Element
Number of Personnel
Physical Components *
Cognitive Components * Cautions Working Conditions
Point in Cycle/Time
of Day
Comments
A-Check –
Mechanical Checks – Cargo Bay
1. AT identifies mechanical systems to inspect according to the checklist pertaining to this particular A-check.
1 AT None Attention (10%)
Visual perception (40%)
Information processing (20%)
Decision making (30%)
Necessary to read each item carefully to determine all components of check (each check may be different)
Checklists are very similar for each aircraft.
Time to complete check is limited.
Lighting conditions in the cargo bay are minimal.
No Data No Data
2. AT obtains tools and ladder/steps, to gain access to cargo bay.
1 AT Heavy lifting (15%) Pushing/pulling (30%)
Attention (10%) Visual Perception (15%) Working memory (20%) Decision making (10%)
Ladder/steps require care when moving near the aircraft, and through the hangar.
When busy and many aircraft are being serviced, manoeuvring through the hangar can be difficult.
No Data No Data
3. AT climbs into cargo bay and begins inspection of each of the items on the checklist, recording the condition of each item on the checklist.
1 AT Climbing (5%) Pushing/pulling (5%) Light lifting (5%) Bending/ stooping (10%) Large motor (10%)
Visual perception (20%) Attention (30%) Information processing (10%) Decision making (10%)
Cargo bay has several locations on the floor where feet can become trapped, and cause a trip hazard.
AT may be unfamiliar with the aircraft. AT may be rushed to complete inspection. AT’s training may be limited.
No Data No Data
continued...

A-23
Table A1 A-Check – Mechanical Checks – Cargo Bay - continued
Subtask/Task Element
Number of Personnel
Physical Components *
Cognitive Components * Cautions Working Conditions
Point in Cycle/Time
of Day
Comments
4. AT prepares maintenance request sheet for items that have failed inspection.
1 AT Fine motor (30%)
Visual perception (20%)
Information processing (20%)
Decision making (20%)
Working memory (10%)
No Data CAT/AT may be unfamiliar with the aircraft.
CAT/AT may be rushed to complete inspection.
CAT/AT’s training may be limited.
No Data No Data
5. AT completes the maintenance report for this A-check component.
1 AT Fine motor (30%)
Visual perception (30%)
Information processing (20%)
Decision making (10%)
Working memory (10%)
No Data AT may be rushed to complete inspection.
No Data No Data
continued...

A-24
Table A1 continued SUBTASK: A-Check Snag: Replace Stator Vane Actuator – Disassembly/Reassembly
Subtask/Task Element
Number of Personnel
Physical Components *
Cognitive Components * Cautions Working Conditions
Point in Cycle/Time
of Day
Comments
Task: A-Check Snag – Replace stator vane control actuators (2 units, prime and redundant on one engine) Disassembly/Reassembly
1. ATs open nacelle access panels.
2 persons – one on each side of the engine
Fine motor (20%) Large motor - pushing/ pulling (50%)
Visual perception (10%) Attention (10%) Communications (10%)
Covers are pneumatically assisted and will spring outward when released.
Beginning of first night.
No Data
2. AT disconnects the power and control connector.
2 persons (one each side)
Fine motor (50%) Psychomotor (20%) Working Memory (15%) Decision making (15%)
Engine may be extremely hot.
CAT/AT may sustain a burn to hands, arms or face
Low light
Constrained space
Layered components (difficult to access hardware)
No Data No Data
3. AT removes lock wire from mounting bolts and bolt that attaches the actuator to the control arm for the N2 fan veins.
2 persons (one each side)
Fine motor (20%)
Large motor (30%)
Psychomotor (20%) Working Memory (15%) Decision making (15%)
Lock wire must be cut and removed.
Low light
Constrained space Layered components (difficult to access hardware)
No Data No Data
4. AT unbolts the actuator unit from the control arm.
2 persons (one each side)
Fine motor (20%)
Large motor (30%)
Psychomotor (20%) Working Memory (15%) Decision making (15%)
No Data Low light Constrained space Layered components (difficult to access hardware)
No Data No Data
continued...
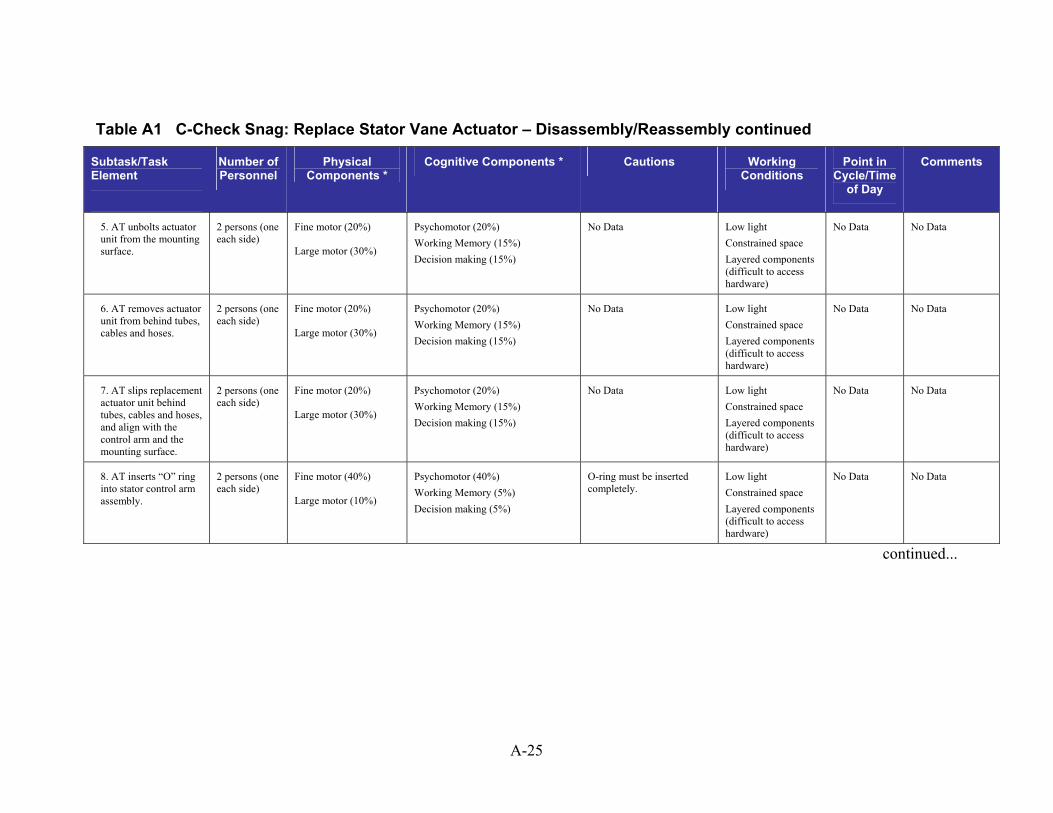
A-25
Table A1 C-Check Snag: Replace Stator Vane Actuator – Disassembly/Reassembly continued
Subtask/Task Element
Number of Personnel
Physical Components *
Cognitive Components * Cautions Working Conditions
Point in Cycle/Time
of Day
Comments
5. AT unbolts actuator unit from the mounting surface.
2 persons (one each side)
Fine motor (20%)
Large motor (30%)
Psychomotor (20%) Working Memory (15%) Decision making (15%)
No Data Low light Constrained space Layered components (difficult to access hardware)
No Data No Data
6. AT removes actuator unit from behind tubes, cables and hoses.
2 persons (one each side)
Fine motor (20%)
Large motor (30%)
Psychomotor (20%) Working Memory (15%) Decision making (15%)
No Data Low light Constrained space Layered components (difficult to access hardware)
No Data No Data
7. AT slips replacement actuator unit behind tubes, cables and hoses, and align with the control arm and the mounting surface.
2 persons (one each side)
Fine motor (20%)
Large motor (30%)
Psychomotor (20%) Working Memory (15%) Decision making (15%)
No Data Low light Constrained space Layered components (difficult to access hardware)
No Data No Data
8. AT inserts “O” ring into stator control arm assembly.
2 persons (one each side)
Fine motor (40%)
Large motor (10%)
Psychomotor (40%) Working Memory (5%) Decision making (5%)
O-ring must be inserted completely.
Low light Constrained space Layered components (difficult to access hardware)
No Data No Data
continued...

A-26
Table A1 C-Check Snag: Replace Stator Vane Actuator – Disassembly/Reassembly continued
Subtask/Task Element
Number of Personnel
Physical Components *
Cognitive Components * Cautions Working Conditions
Point in Cycle/Time
of Day
Comments
9. AT inserts bolt through actuator’s piston arm, and the stator vane control arm, and attach nut and tighten.
2 persons (one each side)
Fine motor (30%)
Large motor (20%)
Psychomotor (40%) Working Memory (5%) Decision making (5%)
No Data Low light Constrained space Layered components (difficult to access hardware)
No Data No Data
10. AT attaches nuts to the mounting bolts on the engine and tighten.
2 persons (one each side)
Fine motor (30%)
Large motor (20%)
Psychomotor (40%) Working Memory (5%) Decision making (5%)
No Data Low light Constrained space Layered components (difficult to access hardware)
No Data No Data
11. AT threads lock wire through all nuts and secures to unit.
2 persons (one each side)
Fine motor (40%)
Large motor (10%)
Psychomotor (30%) Working Memory (10%) Decision making (10%)
No Data Low light Constrained space Layered components (difficult to access hardware)
No Data No Data
12. AT reconnects hydraulic tube to unit.
2 persons (one each side)
Fine motor (30%)
Large motor (20%)
Psychomotor (30%) Working Memory (10%) Decision making (10%)
Hydraulic tube connector nut must be tightened to specified torque.
Low light Constrained space
Layered components (difficult to access hardware)
No Data No Data
continued...

A-27
Table A1 C-Check Snag: Replace Stator Vane Actuator – Disassembly/Reassembly continued
Subtask/Task Element
Number of Personnel
Physical Components *
Cognitive Components * Cautions Working Conditions
Point in Cycle/Time
of Day
Comments
13. AT checks over all connections and fasteners to ensure they are tight and at correct torque levels.
2 persons (one each side)
Fine motor (20%)
Large motor (20%)
Psychomotor (30%) Working Memory (10%) Decision making (20%)
CAT/AT must use the preset style of torque wrench, and make sure that the setting on the wrench is correct.
The torque setting display on the torque wrench is not easy to read in low light. Display is small and requires normal reading vision.
Nadir period (between 03:00 and 05:00)
No Data
14. AT closes nacelle covers.
2 persons Fine and large motor (20%) Large motor - pushing/ pulling (70%)
Attention (10%) Covers are pneumatically assisted and will spring outward unless secured.
No Data No Data No Data
continued...

A-28
Table A1 continued SUBTASK: Troubleshooting an External Door Sensor
Subtask/Task Element
Number of Personnel
Physical Components *
Cognitive Components * Cautions Working Conditions
Point in Cycle/Time
of Day
Comments
Troubleshooting a External Door Sensor
1. Lead AT obtains job card on snag and checks the defect log for a description of the problem, and reads the details.
1 AT
(2 ATs to assist)
None Information processing (50%) Visual perception (45%) Decision making (5%)
No Data No Data No Data No Data
2. Lead AT discusses problem with two other CAT/ATs assisting.
1 AT
(2 ATs to assist)
None Communications (75%) Decision making (25%)
No Data No Data No Data No Data
3. One AT is posted outside the gangway door to make sure that all personnel stay clear.
1 AT
(2 ATs to assist)
None Attention (75%) Visual perception (25%)
No Data No Data No Data No Data
4. Second AT stands by inside the door to make sure all personnel stay clear.
1 AT
(2 ATs to assist)
None Attention (40%) Visual perception (40%) Decision making (10%) Information processing (10%)
No Data No Data No Data No Data
continued...

A-29
Table A1 Troubleshooting an External Door Sensor continued
Subtask/Task Element
Number of Personnel
Physical Components *
Cognitive Components * Cautions Working Conditions
Point in Cycle/Time
of Day
Comments
5. Lead AT sets up safety systems and readies aircraft for pressurization.
1 AT
(2 ATs to assist)
Fine motor (25%) Attention (15%) Visual perception (20%) Information processing (10%) Decision making (10%) Communications (10%) Psychomotor (10%)
No Data No Data No Data No Data
6. Lead AT warns the other two ATs that he is ready to pressurize the cabin
1 AT
(2 ATs to assist)
None Communications (50%) Audio perception (20%) Visual Perception (20%) Decision making (10%)
No Data No Data No Data No Data
7. Lead AT pressurizes cabin to specified level above normal operating pressure, to recreate the same pressure differential found at altitude.
1 AT
(2 ATs to assist)
Fine motor (20%) Visual perception (30%) Audio perception (10%) Attention (20%) Psychomotor (20%)
No Data No Data No Data No Data
8. Lead AT monitors pressure and other affected systems, watching for the loss of door-seal indicator.
1 AT
(2 ATs to assist)
None Attention (40%) Visual perception (20%) Audio perception (10%) Decision making (20%) Information processing (10%)
No Data No Data No Data No Data
continued...

A-30
Table A1 Troubleshooting an External Door Sensor continued
Subtask/Task Element
Number of Personnel
Physical Components *
Cognitive Components * Cautions Working Conditions
Point in Cycle/Time
of Day
Comments
9. Lead AT waits for established test time, watching the indications on the display and decides that seal is working fine, and that sensor appears good.
1 AT Fine motor (10%) Decision making (50%)
Attention (20%)
Information processing (10%)
Psychomotor (10%)
No Data No Data No Data No Data
10. Lead AT depressurizes cabin.
1 AT Fine motor (20%) Visual perception (30%) Audio perception (10%) Attention (20%) Psychomotor (20%)
No Data No Data No Data No Data
11. Lead AT records results of test in maintenance log.
1 AT Fine motor (20%) Visual perception (30%) Information processing (10%) Decision making (20%) Psychomotor (20%)
No Data No Data No Data No Data
continued...
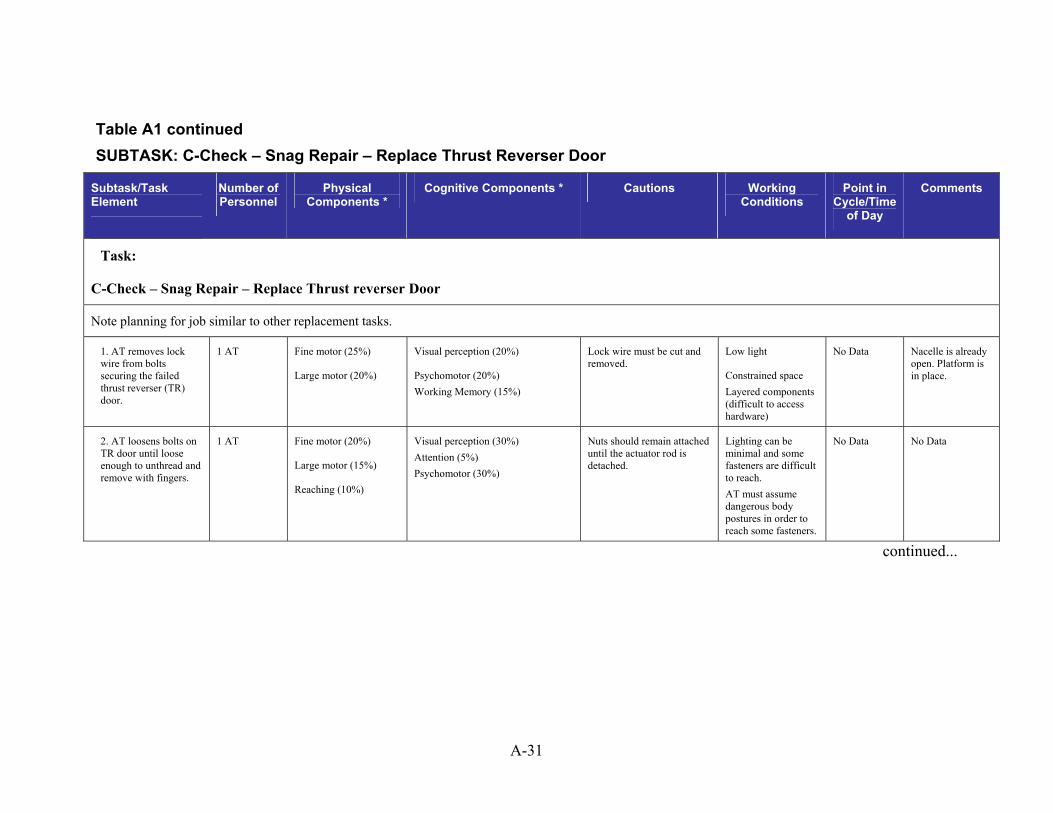
A-31
Table A1 continued SUBTASK: C-Check – Snag Repair – Replace Thrust Reverser Door
Subtask/Task Element
Number of Personnel
Physical Components *
Cognitive Components * Cautions Working Conditions
Point in Cycle/Time
of Day
Comments
Task:
C-Check – Snag Repair – Replace Thrust reverser Door
Note planning for job similar to other replacement tasks.
1. AT removes lock wire from bolts securing the failed thrust reverser (TR) door.
1 AT Fine motor (25%)
Large motor (20%)
Visual perception (20%)
Psychomotor (20%) Working Memory (15%)
Lock wire must be cut and removed.
Low light
Constrained space Layered components (difficult to access hardware)
No Data Nacelle is already open. Platform is in place.
2. AT loosens bolts on TR door until loose enough to unthread and remove with fingers.
1 AT Fine motor (20%)
Large motor (15%)
Reaching (10%)
Visual perception (30%) Attention (5%) Psychomotor (30%)
Nuts should remain attached until the actuator rod is detached.
Lighting can be minimal and some fasteners are difficult to reach. AT must assume dangerous body postures in order to reach some fasteners.
No Data No Data
continued...

A-32
Table A1 C-Check – Snag Repair – Replace Thrust Reverser Door continued
Subtask/Task Element
Number of Personnel
Physical Components *
Cognitive Components * Cautions Working Conditions
Point in Cycle/Time
of Day
Comments
3. AT loosens bolts on control rods at TR door interface and removes bolts
1 AT Fine motor (30%)
Large motor (15%)
Reaching (10%)
Visual perception (20%) Attention (5%) Psychomotor (20%)
No Data Lighting can be minimal and some fasteners are difficult to reach. CAT/AT must assume dangerous body postures in order to reach some fasteners.
No Data No Data
4. AT removes bolts from TR door and removes TR door from engine housing.
1 AT Fine motor (35%)
Reaching (10%)
Visual perception (20%) Touch (10%) Attention (5%) Psychomotor (20%)
No Data Lighting can be minimal and some fasteners are difficult to reach. CAT/AT must assume dangerous body postures in order to reach some fasteners.
No Data No Data
5. AT tags failed unit and records part serial number (SN) on the job sheet.
1 AT Fine motor (20%) Visual perception (30%) Decision making (30%) Working memory (20%)
This step is best done immediately after removing the part.
No Data No Data
continued...

A-33
Table A1 C-Check – Snag Repair – Replace Thrust Reverser Door continued
Subtask/Task Element
Number of Personnel
Physical Components *
Cognitive Components * Cautions Working Conditions
Point in Cycle/Time
of Day
Comments
6. AT compares the replacement TR door with the failed unit and checks part number and serial number, recording the SN of the replacement unit on the job sheet.
1 AT Fine motor (20%) Visual perception (30%) Decision making (30%) Working memory (20%)
CAT/AT must check that part number matches manual recommendation.
Lighting can be minimal and some fasteners are difficult to reach. CAT/AT must assume dangerous body postures in order to reach some fasteners.
No Data No Data
7. AT orients the replacement TR door into the correct position on the interfacing surface, and holding in place, slides the bolts into the holes and turns them a few times to engage the threads, allowing the unit to remain in place.
1 AT Fine motor (50%) Visual perception (20%)
Psychomotor (30%)
Awkward posture required. Must align and thread bolt by feel.
Lighting is marginal and other components obscure the view of the assembly.
No Data No Data
8. AT tightens the bolts with fingers until finger tight against the housing of the TR door.
1 AT None Fine motor (50%) Visual perception (20%) Psychomotor (30%)
No Data No Data No Data
9. AT tightens the bolts with socket torque wrench until specified torque is reached (CAT/AT checks torque specification on a printed page from the manual).
1 AT Fine motor (30%)
Large motor (20%)
Visual perception (10%)
Audio perception (10%) Psychomotor (30%)
Bolts must be tightened to specified torque using a cross pattern procedure to ensure equal pressure on the interfacing surface.
Lighting is marginal and other components obscure the view of the assembly.
No Data No Data
continued...

A-34
Table A1 C-Check – Snag Repair – Replace Thrust Reverser Door continued
Subtask/Task Element
Number of Personnel
Physical Components *
Cognitive Components * Cautions Working Conditions
Point in Cycle/Time
of Day
Comments
10. AT checks the torque on all bolts.
1 AT Fine motor (30%)
Large motor (20%)
Visual perception (10%)
Audio perception (10%) Psychomotor (30%)
Bolts must be tightened to specified torque using a cross pattern procedure to ensure equal pressure on the interfacing surface.
Lighting is marginal and other components obscure the view of the assembly.
No Data No Data
11. AT prepares lock wire and threads through the bolts and the engine housing, and twists the lock wire tight.
1 AT Fine motor (50%)
Visual perception (20%) Psychomotor (30%)
Lock wire must be long enough to allow twisted end to remain secure.
Specific technique is required to ensure that lock wire remains secure.
Lighting is marginal and other components obscure the view of the assembly.
No Data No Data
12. AT checks to ensure that all bolts have been properly lock wired.
1 AT Fine motor (20%)
Visual perception (30%)
Attention (20%) Psychomotor (30%)
Lock wire must be long enough to allow twisted end to remain secure.
Specific technique is required to ensure that lock wire remains secure.
Lighting is marginal and other components obscure the view of the assembly.
No Data No Data
13. AT arranges with avionics ATto operate the TR doors to test their operation.
2 AT
(mech. and avionics)
None Communications (60%)
Audio perception (20%)
Decision making (20%)
No Data Noisy environment where conversations are often disrupted by ambient noise.
No Data No Data
14. AT mech. observes action of TR door to verify correct operation.
2 AT
(mech. and avionics)
Fine motor (20%) Communications (10%)
Attention (20%)
Visual perception (20%)
Audio perception (10%)
Decision making (20%)
AT must carefully watch for any defective action in the door’s mechanism.
Distracting noises and visual cues can interrupt observations of equipment operation.
No Data No Data
continued...

A-35
Table A1 continued SUBTASK: C-Check – Top Up Brake Fluid
Subtask/Task Element
Number of Personnel
Physical Components *
Cognitive Components * Cautions Working Conditions
Point in Cycle/Time
of Day
Comments
A-Check - Top up Brake Fluid
1. AT reviews checklist to confirm understanding about what fluid levels to check and where to find them.
1 Fine motor (10%)
Attention (10%) Visual perception (50%) Decision making (20%) Memory (10%)
No Data No Data No Data No Data
2. AT collects tools and replacement fluid required.
1 Fine motor (10%)
Large motor (5%)
Attention (5%) Visual perception (60%) Decision making (10%) Memory (10%)
No Data No Data No Data No Data
3. AT uses flashlight to check levels of fluid in designated areas of the aircraft
1 Fine motor (5%) Large motor (5%) Reaching (5%)
Attention (25%) Visual perception (40%) Decision making (10%) Memory (10%)
Some differences exist between aircraft.
Awkward postures are required to properly view some reservoir level indicators.
Some reservoirs are located in dark and difficult to reach areas of the aircraft.
No Data No Data
4. AT fills the reservoir to the appropriate level.
1 Fine motor (15%) Large Motor (10%) Reaching (5%)
Attention (20%) Visual perception (30%) Decision making (10%) Memory (10%)
Awkward postures are required to top up some reservoirs.
Spillage of corrosive fluids can occur.
Difficult to reach reservoirs make filling difficult.
Some aircraft do not provide adequate space to easily accomplish the task.
No Data No Data
continued...

A-36
Table A1 C-Check – Top Up Brake Fluid continued
Subtask/Task Element
Number of Personnel
Physical Components *
Cognitive Components * Cautions Working Conditions
Point in Cycle/Time
of Day
Comments
5. Using the flashlight AT rechecks level to make sure it is correct.
1 Fine motor (5%) Large motor (5%) Reaching (5%)
Attention (25%) Visual perception (40%) Decision making (10%) Memory (10%)
Some differences exist between aircraft.
Awkward postures are required to properly view some reservoir level indicators.
Some reservoirs are located in dark and difficult to reach areas of the aircraft.
No Data No Data

A-37
Table A1 continued SUBTASK: Service Check
Subtask/Task Element
Number of Personnel
Physical Components *
Cognitive Components * Cautions Working Conditions
Point in Cycle/Time
of Day
Comments
Subtask:
Service Check
1. AT obtains service check checklist from the team leader, and reviews the list.
Team Leader None Attention (10%) Visual perception (10%) Information processing (40%) Decision making (30%) Communications (10%)
List is similar for all service checks, however, some items will differ depending on the specific aircraft.
No Data No Data AT is prioritizing tasks but this prioritization is not complete until all the aircrafts are in for the night
2. AT reviews AMTAC “Open Items List” and identifies items that must be included in the services check.
Each AT None Attention (10%) Information processing (20%) Decision making (60%) Communications (10%)
No Data No Data No Data Main component of task is to prioritize
3. AT obtains the tools, fluids and materials necessary to complete the items on the list.
Each AT Large motor (10% avg.) Communication (10%) Information processing (20%) Decision making (40%) Psychomotor (20%)
No Data No Data No Data No Data
4. AT proceeds through the checklist item by item, noting condition, and checking off the item or recording maintenance action to be taken if condition is out of specification.
Depending on Task
Fine motor (15% avg.)
Attention (10%)
Visual perception (15%)
Information processing (20%)
Decision making (40%)
Communications (10%)
No Data No Data No Data No Data
continued...

A-38
Table A1 Service Check continued
Subtask/Task Element
Number of Personnel
Physical Components *
Cognitive Components * Cautions Working Conditions
Point in Cycle/Time
of Day
Comments
5. AT records results from Non-FDE Faults interrogation on to Interrogation Record sheet, and faxes to Montreal.
1 AT Fine motor (10%) Information processing (40%)
Decision making (30%)
Communications (20%)
No Data No Data No Data No Data
6. AT tops up fluid levels required and records action in the Journey Log.
1 AT Fine motor (10%)
large motor (10%)
Attention (10%)
Visual perception (20%)
Information processing (10%)
Decision making (15%)
Working memory (15%)
Communications (10%)
No Data No Data No Data No Data
7. AT pressurizes tires to specifications and records in Journey Log.
1 AT Fine motor (20%)
Large motor (10%)
Visual perception (20%)
Information processing (20%)
Decision making (30%)
No Data No Data No Data No Data

Appendix B
Calculations for Fatigue Susceptibility Scores


B-1
Table B1: Calculations for the Fatigue Susceptibility Scores
Task Grouping Calculation * (see section 4.3 for details of formula )
Weighted Fatigue Susceptibility
Score (Score X 0.01)
Rank
Inspection Inspection [4AT+3VP+3AP+4WM+4IP+4DM+4CO+3PM+3FM+2LM+2PP+1LL+2HL+2BS+2RC]
356.3 (3.563) 6
Job planning Job Planning [4AT+3VP+3AP+4WM+4IP+4DM+4CO+3PM+3FM+2LM+2PP+1LL+2HL+2BS+2RC]
350.6 (3.506) 8
Troubleshooting Troubleshooting [4AT+3VP+3AP+4WM+4IP+4DM+4CO+3PM+3FM+2LM+2PP+1LL+2HL+2BS+2RC]
355.9 (3.559) 7
Disassembly/ Assembly Disassembly/ Assembly [4AT+3VP+3AP+4WM+4IP+4DM+4CO+3PM+3FM+2LM+2PP+1LL+2HL+2BS+2RC]
294.6 (2.946) 14
Repair Repair [4AT+3VP+3AP+4WM+4IP+4DM+4CO+3PM+3FM+2LM+2PP+1LL+2HL+2BS+2RC]
320.0 (3.200) 12
Calibration Calibration [4AT+3VP+3AP+4WM+4IP+4DM+4CO+3PM+3FM+2LM+2PP+1LL+2HL+2BS+2RC]
367.8 (3.678) 3
Testing Testing [4AT+3VP+3AP+4WM+4IP+4DM+4CO+3PM+3FM+2LM+2PP+1LL+2HL+2BS+2RC]
360.0 (3.600) 5
Documenting Documenting [4AT+3VP+3AP+4WM+4IP+4DM+4CO+3PM+3FM+2LM+2PP+1LL+2HL+2BS+2RC]
350.0 (3.500) 9
Supervision Supervision [4AT+3VP+3AP+4WM+4IP+4DM+4CO+3PM+3FM+2LM+2PP+1LL+2HL+2BS+2RC]
380.0 (3.800) 2
Training Training [4AT+3VP+3AP+4WM+4IP+4DM+4CO+3PM+3FM+2LM+2PP+1LL+2HL+2BS+2RC]
365.0 (3.650) 4
Lubricating parts, topping up fluids
Lubricating [4AT+3VP+3AP+4WM+4IP+4DM+4CO+3PM+3FM+2LM+2PP+1LL+2HL+2BS+2RC]
310.0 (3.100) 13
Cleaning Cleaning [4AT+3VP+3AP+4WM+4IP+4DM+4CO+3PM+3FM+2LM+2PP+1LL+2HL+2BS+2RC]
285.0 (2.850) 15
Communications with other trades
Communications [4AT+3VP+3AP+4WM+4IP+4DM+4CO+3PM+3FM+2LM+2PP+1LL+2HL+2BS+2RC]
395.0 (3.950) 1
Operating hoisting equipment
Operating hoisting equipment [4AT+3VP+3AP+4WM+4IP+4DM+4CO+3PM+3FM+2LM+2PP+1LL+2HL+2BS+2RC]
325.0 (3.250) 11
Operating transport equipment
Operating transport equipment 4*(AT+VP+AP+WM+IP+DM+CO+PM+FM+LM+PP+LL+HL+BS+RC+CL)
325.0 (3.250) 10

B-2
* The abbreviations for Table B1are listed below: AT = Attention DM = Decision making VP = Visual perception AP = Auditory perception WM = Working memory IP = Information processing PM = Psychomotor CO = Communications FM = Fine motor LM = Large motor PP = Pushing/pulling LL = Light lifting HL = Heavy lifting BS = Bending/stooping RC = Reaching CL = Climbing

Appendix C
Observational Sheets


C-1
Date: __________ Facility:_________________________ Page 1 of ______ Start Time: __________ Finish Time: ____________ Observer: __________________Observed Personnel: _________________________________________________________
Location: Hanger Ramp Other: ______________________________ Job: ________________________________________________________ 1.: ________________________________________________________________________________
2.: _________________________________________________________________________3.: _________________________________________________________________________4.: _________________________________________________________________________
1.: ________________________________________________________________________________
2.: _________________________________________________________________________
3.: _________________________________________________________________________
Lighting: Dark Low Light Medium Light Bright
Task Lighting: Yes No Effectiveness: Poor Adequate Good
Noise: Very Loud Loud Medium Quiet Can’t hear conversation Difficult to hear Can converse easily Can hear whisper
Air Quality: Good Ventilation Poor Ventilation Temperature: Hot OK Cold
Humidity: Very Uncomfortable Uncomfortable Comfortable
If work is outside: Precipitation: Light Rain Medium Rain Heavy Rain
Wind: None Light Breeze Windy Strong Wind
Aircraft Maintenance Task Observational Sheet
Information about the Facility
Environmental Conditions
Primary Tools Used for Main Tasks
B: 1 2 3 4 5 6 7
M: 1 2 3 4 5 6 7
Support Equipment
E: 1 2 3 4 5 6 7
Level of Alertness

C-2
Page 2 of ______Sketch of the Work Area

C-3
Page 3 of ________
Subtasks Equipment Involved
Personnel Interactions
Cognitive/ Physical
Components
Potential Errors
Comments (Include Borg scale where appropriate)
Task: _____________________________________________

C-4
Key for Observational Sheet 1. Level of alertness:
B = before the start of the job
M = in the middle of the job
E = at the end of the job
Alertness Scale
1 = Impossible to keep eyes open, constantly nodding, cannot stay awake.
2 = Overwhelming urge to sleep, hard to keep eyes open, some nodding.
3 = Strong desire to sleep, but not nodding off, very difficult to concentrate on task.
4 = Feeling very tired, difficult to concentrate on the task.
5 = Beginning to tire, some difficulty concentrating on the task.
6 = Feeling mostly alert and concentration on the task is no problem.
7 = Feeling wide awake, alert and energized.
2. Task Sheet
Task/Element
This column requires that a brief description of the task be entered. A simple word or phrase should be used. For example, the removal of a hydraulic pump would be entered as “hydraulic pump removal”. The lower level task elements would then be entered as “remove access panel”, “check pressure”, “disconnect feeder hose”, “unfasten pump”, etc.
Equipment Involved
This requires that the specific tool used for the task element be identified. For example removal of the access panel will require that “socket wrench” be entered into this column.
Personnel Interactions
This column should contain the job type of the person(s) that the observed technologist must interact with for the given task if the interaction applies to all elements, or to a specific task element. The interactive activity should also be given.
Cognitive Components
Use the following codes:
Memory = Mem
Information Processing = IP
Decision Making = DM
Perception = AUD for audio, VIS for visual
Psychomotor = PSM
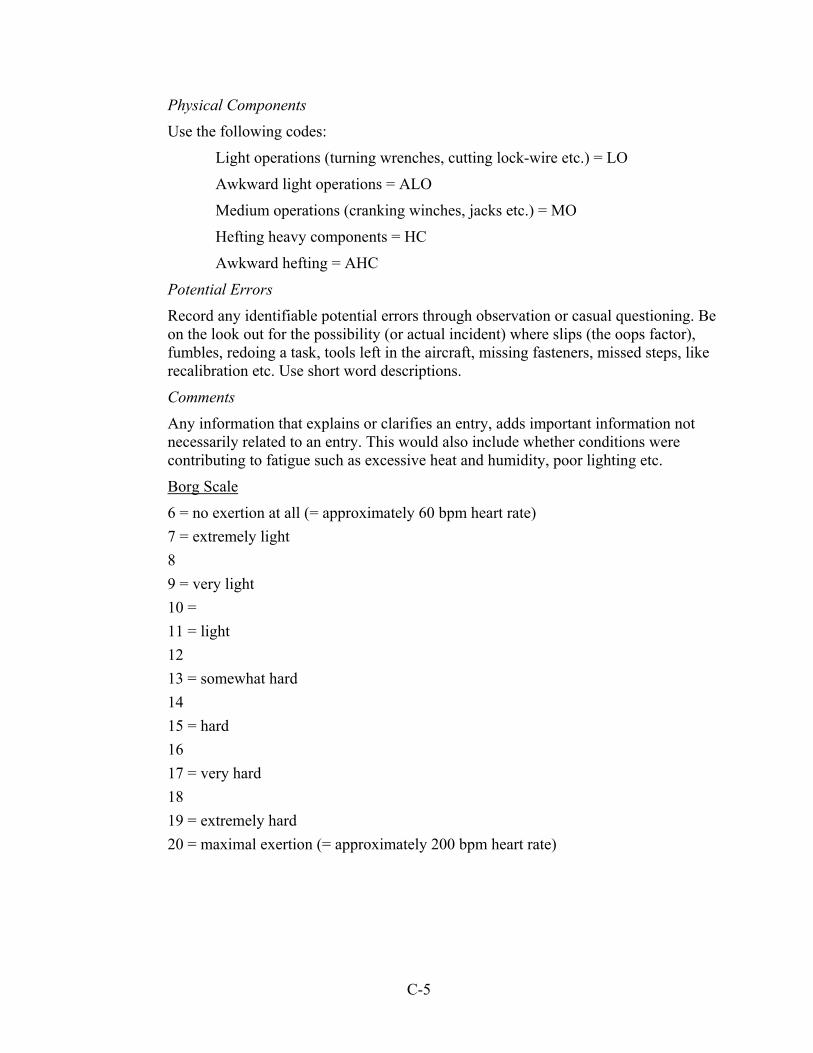
C-5
Physical Components
Use the following codes:
Light operations (turning wrenches, cutting lock-wire etc.) = LO
Awkward light operations = ALO
Medium operations (cranking winches, jacks etc.) = MO
Hefting heavy components = HC
Awkward hefting = AHC
Potential Errors
Record any identifiable potential errors through observation or casual questioning. Be on the look out for the possibility (or actual incident) where slips (the oops factor), fumbles, redoing a task, tools left in the aircraft, missing fasteners, missed steps, like recalibration etc. Use short word descriptions.
Comments
Any information that explains or clarifies an entry, adds important information not necessarily related to an entry. This would also include whether conditions were contributing to fatigue such as excessive heat and humidity, poor lighting etc.
Borg Scale
6 = no exertion at all (= approximately 60 bpm heart rate) 7 = extremely light 8 9 = very light 10 = 11 = light 12 13 = somewhat hard 14 15 = hard 16 17 = very hard 18 19 = extremely hard 20 = maximal exertion (= approximately 200 bpm heart rate)


Appendix D
Questionnaire


D-1
Aircraft Maintenance Task Survey
The following survey has been designed to collect task data as an attempt to better understand the underlying conditions of the work environment that influence maintenance operations. The main objective of this survey is to identify tasks and workplace conditions that may lead to errors in maintenance activities, and secondarily, identify the types of tasks that are the most sensitive or resistive to the negative effects of fatigue. The information will be used to help identify strategies to reduce the impact of fatigue on overall safety of the maintenance operation and ultimately, the aviation system.
The information you provide will be kept in complete confidence. Only the contractor’s research team will read your answers. Only general statements that do not refer to specific individuals will be reported.
Please complete the questionnaire to the best of your ability and place the questionnaire in the envelope provided. You may give the sealed envelope on to either <Name of contact> or <Name of contact>, who will pass the envelopes on to us, Rhodes & Associates Inc., or you may send the questionnaire to us directly at the following address:
Rhodes & Associates Inc.
177 Jenny Wrenway,
Toronto, Ontario, M2H 2Z3
Attention: Dr. Wayne Rhodes
Phone: (416) 494-2816
On behalf of Rhodes & Associates Inc., I thank you very much for your valuable information and cooperation. The results of this study will help to further improve the safety of aviation.
Regards,
Wayne Rhodes,
President

D-2
Maintenance Task Survey
Name: _______________________ Job Type (Title): __________________
Phone Number: __________________ email: ________________________
Site: ___________________________________ Date: ______________
1. How long have you been in the present job type? _____ years. 2. How long have you been involved in aircraft maintenance? _____ years. 3. What type of training did you receive (please include all relevant training)? _____________________________________________________________ 4. What are your present primary job responsibilities? (Check as many as
apply).
Airframe Power plant Avionics Cabin Components
Quality Assurance, Inspection External Components (e.g. landing gear)
Other: (please specify) ________________________________
5. What are your primary job tasks (performed daily or weekly): (Please rank each according to amount of time spent on the task starting with “1” as the highest ranking):
Disassembly/Assembly (Rank:____)
Repair (Rank:____)
Cleaning (Rank:____)
Calibration (Rank:____)
Inspection (Rank:____)
Testing (Rank:____)
Troubleshooting (Rank:____)
Documenting (Rank:____)
Supervision (Rank:____)
Training (Rank:____)
Communications (Rank:____)
Lubrication/Fluids
Other: specify:_________ (Rank:____)

D3
Contact: ___________________________________ Date: ______________
6. What potential errors can occur when working at your present job tasks ranked in question 5 (Start with the highest ranking – i.e. task ranked “1” –and proceed sequentially to lowest ranked task)?
Rank Task Brief Description of Potential Errors
1
2
3
4
5
6
7
8
9
10
11
12
7. Which of the following may contribute to making errors (please check as
many as apply)? Please describe how for in each checked contributing factor.
Time constraints – describe how: ___________________________________ ________________________________________________________________
Poor equipment and tools – describe how: ____________________________ ________________________________________________________________
Poor working conditions (lighting, temperature, noise, distractions) _________ ________________________________________________________________
Continued

D4
Contact: ___________________________________ Date: ______________
Communications problems – describe how: ___________________________ ________________________________________________________________
Unfamiliar procedure due to different equipment or tools – describe how: ____
________________________________________________________________
Poor feedback (indication) for completion of a task – describe how: ________
________________________________________________________________
Inadequate training – describe how: _________________________________
________________________________________________________________
No obvious way to reverse an unintended action – describe how: __________ ________________________________________________________________
Fatigue – describe how: __________________________________________
________________________________________________________________
Lack of teamwork – describe how: __________________________________
________________________________________________________________
Time of day – describe how: _______________________________________ ________________________________________________________________
Other (Please specify: _____________) – describe how: ________________ ________________________________________________________________

D5
Contact: ___________________________________ Date: ______________
8. What would you suggest would improve the situation(s) described in 7? (Please write the name of the contributing factor on the line followed by your suggestions). _____________________________________________________________ _____________________________________________________________ _____________________________________________________________ _____________________________________________________________ _____________________________________________________________
_____________________________________________________________
_____________________________________________________________
_____________________________________________________________
_____________________________________________________________
_____________________________________________________________
_____________________________________________________________
_____________________________________________________________
_____________________________________________________________
_____________________________________________________________
_____________________________________________________________
_____________________________________________________________
9. Can you describe some example situations where error has or could occur?
1. ___________________________________________________________
_____________________________________________________________
_____________________________________________________________
_____________________________________________________________
_____________________________________________________________
_____________________________________________________________
_____________________________________________________________
Continue on next page

D6
Contact: ___________________________________ Date: ______________
2. ___________________________________________________________
_____________________________________________________________
_____________________________________________________________
_____________________________________________________________
_____________________________________________________________
_____________________________________________________________
_____________________________________________________________
3. ___________________________________________________________
_____________________________________________________________
_____________________________________________________________
_____________________________________________________________
_____________________________________________________________
_____________________________________________________________
_____________________________________________________________
Please use other side of page if you require more room for your description.
10. What would you suggest would improve the situation(s) described in 9? (Please use the numbers in question 9 to refer to each error description).
1. ___________________________________________________________
_____________________________________________________________
_____________________________________________________________
_____________________________________________________________
_____________________________________________________________
_____________________________________________________________
2. ___________________________________________________________
_____________________________________________________________
_____________________________________________________________
_____________________________________________________________
_____________________________________________________________
_____________________________________________________________
Continue on next page

D7
Contact: ___________________________________ Date: ______________
3. ___________________________________________________________
_____________________________________________________________
_____________________________________________________________
_____________________________________________________________
_____________________________________________________________
_____________________________________________________________
Please use other side of page if you require more room for your description.
11. Please indicate, in your opinion, how much the following tasks would be negatively affected by fatigue?
Disassembly/Assembly
Not at All A Great Deal
Repair Not at All A Great Deal
Cleaning Not at All A Great Deal
Calibration Not at All A Great Deal
Inspection Not at All A Great Deal
1 2 3 4 5 6
1 2 3 4 5 6
1 2 3 4 5 6
1 2 3 4 5 6
1 2 3 4 5 6
Continue on next page

D8
Contact: ___________________________________ Date: ______________
Testing Not at All A Great Deal
Troubleshooting Not at All A Great Deal
Documenting
Not at All A Great Deal
Supervision
Not at All A Great Deal
Training
Not at All A Great Deal
Communications problems
Not at All A Great Deal
Lubrication/Fluids
Not at All A Great Deal
1 2 3 4 5 6
1 2 3 4 5 6
1 2 3 4 5 6
1 2 3 4 5 6
1 2 3 4 5 6
1 2 3 4 5 6
1 2 3 4 5 6
Continue on next page

D9
Contact: ___________________________________ Date: ______________
Other – (please specify: ________________)
Not at All A Great Deal
12. What else do you think contributes to potential errors?
_____________________________________________________________
_____________________________________________________________
_____________________________________________________________
_____________________________________________________________
_____________________________________________________________
_____________________________________________________________
_____________________________________________________________
13. Do you have any other comments that may help us?
_____________________________________________________________
_____________________________________________________________
_____________________________________________________________
_____________________________________________________________
_____________________________________________________________
_____________________________________________________________
_____________________________________________________________
_____________________________________________________________
Thank you for your assistance. This research will be used to help the aviation industry learn more about how to improve the safety of personnel and the public.
Please place the completed survey in the envelope provided, seal, and hand to either _____________ or ___________, who will pass it along to the research team, or mail the
envelope to Rhodes & Associates Inc. Rhodes & Associates Inc.
177 Jenny Wrenway, Toronto, Ontario, M2H 2Z3
Attention: Dr. Wayne Rhodes
1 2 3 4 5 6

D10

Appendix E
HEART Analysis Method


E-1
HEART Method
The method involves the following steps:
a) Assign identified tasks (from task analysis) to their generic task types (see Table F2 in Appendix F).
b) List the error modes for each task type. c) Determine the EPCs that affect the potential for error from Table F1 in Appendix F. d) Determine the proportional impact of the EPCs for each error mode. e) Arrange data as seen in Table I-1 in Appendix J. f) Report risk data in a table showing actual task name, its assigned task type, error
modes that might occur, and their calculated probabilities. g) Apply risk levels to event trees to determine overall risk of key error modes during
accident investigations or to prioritize error modes for countermeasure activities.
The procedure for the calculations is described in the following section (HEART Risk calculations).
HEART Risk Calculations
Basic Equations The probability calculations for Table E1 (below) were derived from the combined estimate of the estimated impact of applicable EPCs (see table F1) on established levels of unreliability for generic types of tasks shown in Table F2. Refer to Appendix L for the Excel calculations for Table E1 in Appendix E. The calculation for the level of unreliability for each applicable EPC, as recommended by Williams (1988), is as follows:
Equation 1:
(EPCi) = (EPCM – 1) x (EPCP) + 1
Where:
EPCi is the contribution of a specific EPC to the overall level of unreliability EPCM is the EPC impact multiplier EPCP is the proportion of estimated effect of the EPC on error occurrence “- 1” : the EPCM is reduced by 1 to arrive at the degrees of freedom to be used for the calculation of the product of the EPCM and EPCP. “+ 1” : The number 1 is the product of the EPCM and EPCP.
The EPC multiplier is taken from Table F.1 in Appendix F.

E-2
The proportion of estimated effect is determined by the expert judgement of the analyst using criteria that includes:
1. The proportion of time that the EPC would apply to a particular situation; and
2. The strength in which the EPC would influence the erroneous action.
The result in Equation 1 is an estimate for the contribution a particular EPC to the overall unreliability of a specific error mode.
The contribution of each EPC to the overall level of unreliability are multiplied together to arrive at the overall estimate of unreliability posed by a particular error mode, as shown by Equation 2:
Equation 2:
Total EPC Effect = (Contribution of EPC1) x (Contribution of EPC2) x …(Contribution of EPCn)
The result in equation 2 gives the combined effect posed by the EPCs.
Rationale for HEART Calculations EPC Weightings The weighting is:
• The percent the EPC contributes to the likelihood that the error will occur without fatigue (column 6).
The increase due to fatigue (column 7) is:
• Based on the fatigue susceptibility of the task components involved.
Percent Contribution of EPC The percent contribution of an EPC to the likelihood that an error will occur is determined by:
• Proportion of time that the condition is expected to occur in daily operations; and
• Strength of the EPC’s effect in causing the error mode, based on:
o Strong = EPC has a very noticeable effect (awareness of EPC effect is constant);
o Medium = EPC has a noticeable effect (awareness of EPC effect is intermittent);
o Low = EPC has a somewhat noticeable but indirect effect (background only).
The following rough guideline is used:

E-3
• If the EPC is present all of the time and has a strong influence on the error mode, the percent contribution is between 80% and 100%;
• If the EPC is present some of the time and has a strong influence on the error mode, the percent contribution is 60 to 79%;
• If the EPC is present all of the time and has medium strength influence on the error mode the percent contribution is 60% to 79%;
• If the EPC is present all of the time and has a low strength influence, the percent contribution is 40% to 59%;
• If the EPC is present some of the time and has medium strength influence, the percent contribution is 40% to 59%;
• If the EPC is present some of the time and has low strength influence the percent contribution is 20% to 39%;
• If the EPC is present rarely and has low strength influence the percent contribution is 10 to 20%.
EPC Fatigue Increase Factor The increase in the EPC’s effect due to fatigue is based on:
• The task components involved in the action that exists when the error occurs.
The following rough guideline is used:
• If the task components have an average susceptibility rating of 4 increase the non-fatigued EPC by 200%;
• If the task components have an average susceptibility rating of 3 increase the non-fatigued EPC by 150%;
• If the task components have a susceptibility rating of 2 increase the non-fatigued EPC by 110%.
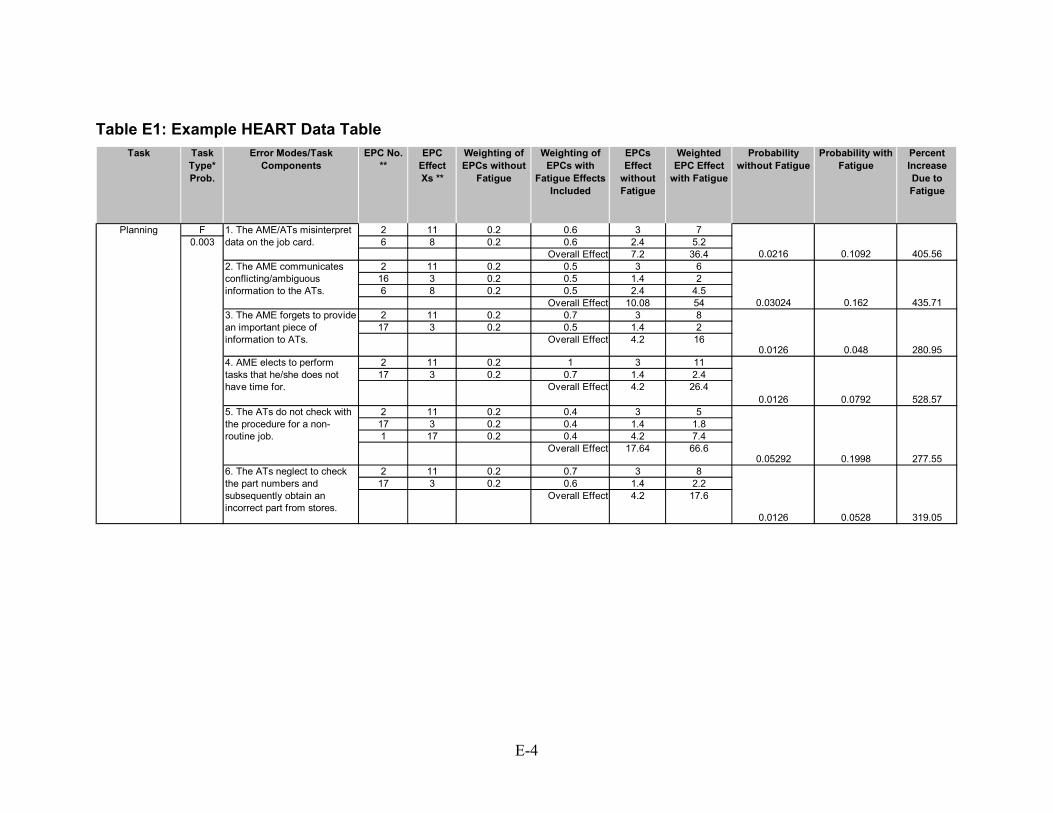
E-4
Table E1: Example HEART Data Table
F 2 11 0.2 0.6 3 76 8 0.2 0.6 2.4 5.2
Overall Effect 7.2 36.42 11 0.2 0.5 3 6
16 3 0.2 0.5 1.4 26 8 0.2 0.5 2.4 4.5
Overall Effect 10.08 542 11 0.2 0.7 3 8
17 3 0.2 0.5 1.4 2Overall Effect 4.2 16
2 11 0.2 1 3 1117 3 0.2 0.7 1.4 2.4
Overall Effect 4.2 26.4
2 11 0.2 0.4 3 517 3 0.2 0.4 1.4 1.81 17 0.2 0.4 4.2 7.4
Overall Effect 17.64 66.6
2 11 0.2 0.7 3 817 3 0.2 0.6 1.4 2.2
Overall Effect 4.2 17.6
280.95
319.05
0.0216 0.1092 405.56
0.03024 0.162 435.71
0.0126 0.048
0.0126 0.0792 528.57
0.05292 0.1998 277.55
0.0126 0.0528
0.003Planning 1. The AME/ATs misinterpret
data on the job card.
6. The ATs neglect to check the part numbers and subsequently obtain an incorrect part from stores.
2. The AME communicates conflicting/ambiguous information to the ATs.
3. The AME forgets to provide an important piece of information to ATs.
4. AME elects to perform tasks that he/she does not have time for.
5. The ATs do not check with the procedure for a non-routine job.
Weighting of EPCs without
Fatigue
Weighting of EPCs with
Fatigue Effects Included
Weighted EPC Effect
with Fatigue
EPC No. **
EPC EffectXs **
EPCs Effect
without Fatigue
Task Probability with Fatigue
Task Type*Prob.
Error Modes/Task Components
Percent Increase Due to Fatigue
Probability without Fatigue

Appendix F HEART Tables


F-1
Table F-1: Abbreviated List of Error Producing Conditions from Williams (1988)
Error Producing Condition Max. Predicted Nominal Effect*
1. Unfamiliarity with a situation, which is potentially important but which only occurs infrequently or which is novel.
x17
2. A shortage of time available for error detection and correction. X11
3. A low signal to noise ratio. X10
4. A means of suppressing or over-riding information or features that is too easily accessible.
X9
5. No means of conveying spatial and functional information to operators in a form that they can readily assimilate.
X8
6. A mismatch between an operator’s model of the world and that imagined by the designer (or by field personnel).
X8
7. No obvious means of reversing an unintended action. X8
8. A channel capacity overload, particularly one caused by simultaneous presentation of non-redundant information.
X6
9. A need to unlearn a technique and apply one that requires the application of an opposing philosophy.
X6
10. The need to transfer specific knowledge from task to task without loss. X5.5
11. Ambiguity in the required performance standards. X5
12. A mismatch between perceived and real risk. X4
13. Poor, ambiguous or ill-matched system feedback. X4
14. No clear direct or timely confirmation of intended action from system. X4
15. Operator experience (e.g. a newly-qualified tradesman, but not an expert. X3
16. An impoverished quality of information conveyed by procedures and person/person interaction.
X3
17. Little or no independent checking or testing of output. X3
18. Fatigue that is severe enough to cause significant degradation in performance (more than 17 continuous hours awake after 8 hours of prior sleep – or poor sleep obtained over several days).
X3**
* Maximum predicted nominal amount by which a generic task’s probability of unreliability is made worse by the EPC.
** Williams (1988) did not consider severe sleep loss, only referring to work during unfavourable periods of the human circadian rhythm. This analysis considers the estimated effect of reasonable levels of sleep loss that may be experienced by most aircraft maintenance personnel working nights.

F-2
Table F-2: List of Generic Tasks and Associated Proposed Nominal Unreliability
Generic Task Proposed Nominal
Human Unreliability
(5th – 95th Percentile Bounds)
A. Totally unfamiliar task, performed at speed with no real idea of likely consequence.
0.55
(0.35 – 0.97)
B. Shift or restore system to a new or original state on a single attempt without supervision or procedure.
0.26
(0.14 – 0.42)
C. Complex task requiring high level of comprehension and skill. 0.16
(0.12 – 0.28)
D. Fairly simple task performed rapidly or given scant attention. 0.09
(0.06 – 0.13)
E. Routine, highly practised, rapid task involving relatively low level of skill. 0.02
(0.007 – 0.045)
F. Restore or shift system to a new or original state following procedures, with some checking.
0.003
(0.0008 – 0.007)
G. Completely familiar, well designed, highly practised, routine task occurring several times per hour, performed to the highest possible standards by highly trained and experienced person, totally aware of the implications of failure, with time to correct potential error, but without the benefit of significant job aids.
0.0004
(0.00008 – 0.009)
H. Respond correctly to system command even when there is an augmented or automated supervisory system providing accurate interpretation of system state.
0.00002
(0.000006 – 0.0009)
I. GENERIC TASK – Miscellaneous task for which no description can be found.
0.03
(0.008 – 0.11)

Appendix G
Storyboards


G-1
Scenario 1: Engine ReplacementAssumptions
1. The lighting conditions around the engine are marginal to very poor. It is assumed that a portable servicelamp will be used to see all components properly. Even with the light, some areas are still poorly lit.
2. The necessary documentation (drawings, task steps, tool information) is available in the area of themaintenance.
3. The correct support equipment and tools are available.
4. A full compliment of qualified aircraft maintenance personnel is available.
5. The replacement of the engine is a result of the malfunctioning of critical components as identified by thesnag log.
6. The experience levels of the AMEs, ATs and apprentices are the average number of years for each.
Page 1 of 3

G-2
AME receives jobcard for engine
replacement
AME and ATsreview job card
and discussstrategy
AME allocates thetask elements to
the ATs
ATs review theprocedure for
replacement ofengine
ATs obtain thenecessary toolsand equipment
TeamTeam TeamIndividual and
ATs verifyapproach andagree to teamconfigurations
ATs obtainnecessary partsaccording to the
job card andprocedure
TeamIndividual and
AME and ATsmove equipment
and tools tolocation of engine
to be replaced
PLANNING SUBTASK
DISASSEMBLY/REASSEMBLY SUBTASK
ATs open enginecowling
Storyboard 1: Engine Replacement
ATs installbootstrap (jig forengine removal)
ATs remove alllock wire fromrequired nuts,bolts, clamps,
couplings,connectors, etc.
ATs disconnecthoses, cables and
tubing.
ATs loosen allapplicable nuts
and bolts.
AME checks tomake sure all task
elements havebeen
accomplished tospec
ATs check tomake sure all
applicableconnections andmountings are
loose
ATs disconnectand remove allequipment as
specified by theprocedure
ATs check tomake sure all
applicabledisconnectionsand equipmentare as specified
ATs push/drag theengine transportcradle over to the
failed engine
ATs preparecradle and setupdial gauges and
winches forlowering engine
onto cradle.
AME checks tomake sure setup
has beenaccomplished to
spec
ATs lower engineusing the winches
TeamIndividual and
TeamIndividual and
Individual
Team Team
Individual andTeam
Individual andTeam
Individual andTeam
Individual andTeam
Individual andTeam
ATs push/pull thefailed engine in
cradle over to thereturn area
TeamIndividual and
TeamIndividual and
Individual Team Team TeamIndividual
ATs push/pull thereplacement
engine in cradleover to the area of
repair
ATs prepare thecradle for
positioning belowthe area ofinstallation
ATs attach thewinches to thecradle ready for
raising the engineto the mounts
ATs raise thereplacement
engine with thewinches, using the
dial gauges toensure proper
mounting pressure
ATs thread nutsonto mounting
bolts and tighten tospec with torque
wrench
ATs mountremoved
equipment, threadnuts and bolts, and
tighten to specusing torque
wrench
Continuedon page 2
Page 2 of 3
Team Team Team TeamTeam Individual and
Team
Individual andTeam
Continued on page 3

G-3
ATs attach andtighten all
appropriateclamps, couplingsand connectors.
Frompage 1
Page 3 of 3
Storyboard 1: Engine Replacement Continued
ATs loosen andremove bootstrap
assembly.
ATs inspect theengine to ensureall equipment hasbeen installed and
all fasteners,connectors,
couplings andclamps are secure.
ATs lock wire allappropriate
fasteners, clamps,couplings andconnectors.
AME inspectsengine to ensurethat all work has
been completed tospecification.
ATs documentwork as completed
and sign-off.
AME stamps thedocumentation for
sign-off.
DISASSEMBLY/REASSEMBLY SUBTASK continued
DOCUMENTATION SUBTASK
Individual andTeam
Individual andTeam
Individual andTeam
Individual andTeam
Individual
Individual andTeam
Individual
From page 2

G-4
1. The lighting conditions around the engine are marginal. It is assumed that a portable service lamp will beused to see all components properly. Even with the light, some areas are still poorly lit.
2. The necessary documentation (drawings, task steps, tool information) is available in the area of themaintenance.
3. The correct support equipment and tools are available.
4. The AT performing the work is qualified.
5. The replacement of the stator vane actuators is a result of the malfunctioning of critical components asidentified by inspection during a C-check.
6. The experience levels of the AMEs, ATs and apprentices are the average number of years for each.
Page 1 of 3
Scenario 2: A-Check - Prime and Backup Stator Vane Actuator ReplacementAssumptions

G-5
AME receives jobcard for engine
replacement
AME and ATsreview job card
and discussstrategy
ATs review theprocedure for
replacement ofactuator
ATs obtain thenecessary toolsand equipment
Team
ATs obtainnecessary partsaccording to the
job card andprocedure
ATs moveequipment and
tools to location ofactuators to be
replaced
PLANNING SUBTASK
DISASSEMBLY/REASSEMBLY SUBTASK
ATs open enginecowling
Storyboard 2: A-Check - Stator Vane Actuators Replacement
ATs remove alllock wire fromrequired nuts,bolts, clamps,
couplings,connectors, etc.
Working on eachside of the engine,
ATs disconnecthoses, cables and
tubing.
ATs loosen allapplicable nuts
and bolts onequipment to be
removed.
ATs check tomake sure all
applicableconnections andmountings are
loose
ATs disconnectand removeequipment
interfering withremoval ofactuators.
ATs check tomake sure all
applicabledisconnectionsand equipment
are as specified byprocedure.
Individual
Continuedon page 3
Page 2 of 3
ATs align and boltreplacementactuators tomountinginterface.
ATs tighten boltswith a torque
wrench tospecified rating .
ATs couple airlines and
reconnect power/data cables.
ATs lock wirefasteners,
couplings andconnectors onactuators and
linkages.
ATs rechecktorque levels with
torque wrench.
ATs Disconnect,uncouple, unboltand remove the
actuators.
ATs reinstall therest of theequipment.
ATs tightenfasteners andcouplings with
torque wrench tospecified torque
levels.
ATs install lockwire on all
fasteners forinstalled
equipment.
ATs rechecktorque levels on all
remainingapplicablefasteners.
ATs check allconnections.
Team Team Team
Team Team TeamTeam
NOTE:Both prime and redundant stator vane actuators must be replaced.
TeamTeam Team
Team Team Team Team Team Team Team
TeamTeamTeamTeamTeam
Continued on page 3
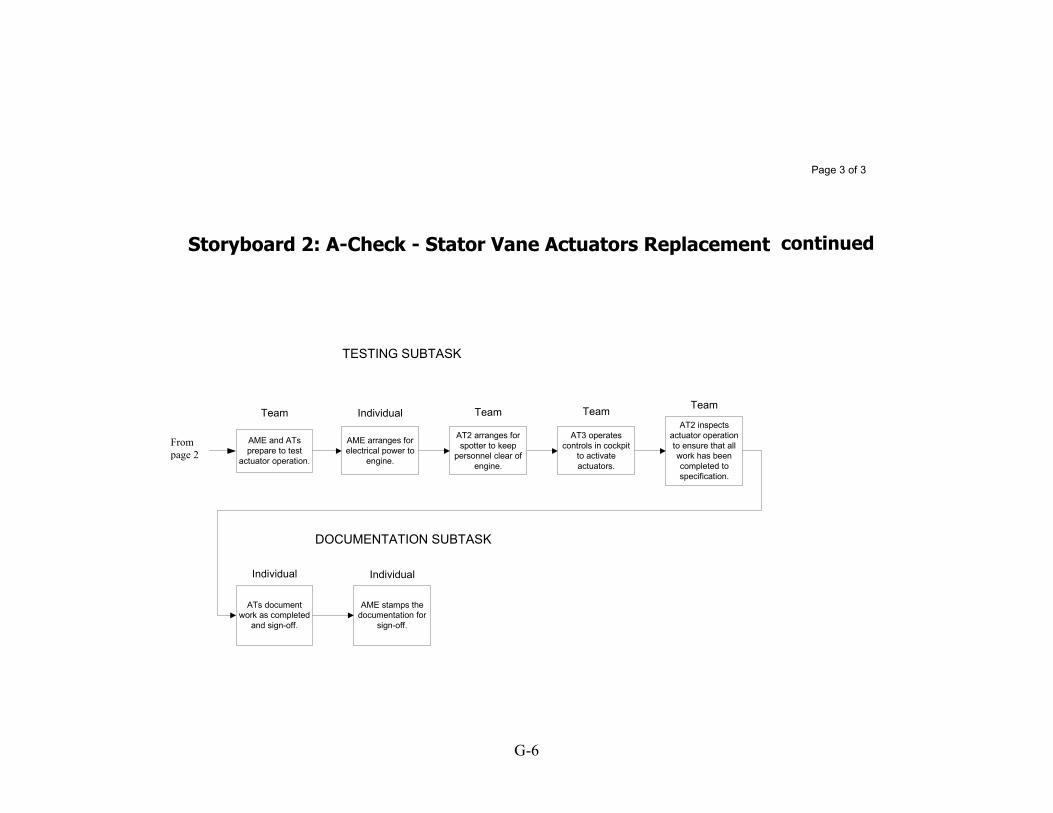
G-6
AME and ATsprepare to test
actuator operation.
Frompage 2
Page 3 of 3
AT3 operatescontrols in cockpit
to activateactuators.
AT2 arranges forspotter to keep
personnel clear ofengine.
AT2 inspectsactuator operationto ensure that allwork has beencompleted tospecification.
ATs documentwork as completed
and sign-off.
AME stamps thedocumentation for
sign-off.
TESTING SUBTASK
DOCUMENTATION SUBTASK
Individual
Team
AME arranges forelectrical power to
engine.
Individual Team Team Team
Individual
Storyboard 2: A-Check - Stator Vane Actuators Replacement continued
From page 2

G-7
Page 1 of 3
1. The lighting conditions around the engine are marginal. It is assumed that a portable service lamp will beused to see all components properly. Even with the light, some areas are still poorly lit.
2. The necessary documentation (drawings, task steps, tool information) is available in the area of themaintenance.
3. The correct support equipment and tools are available.
4. The AT performing the work is qualified.
5. The replacement of the reverse thruster door is a result of the malfunctioning of critical components asidentified by inspection during a C-check.
6. The experience levels of the AMEs, ATs and apprentices are the average number of years for each.
Scenario 3: C-Check - Thrust Reverser Door ReplacementAssumptions
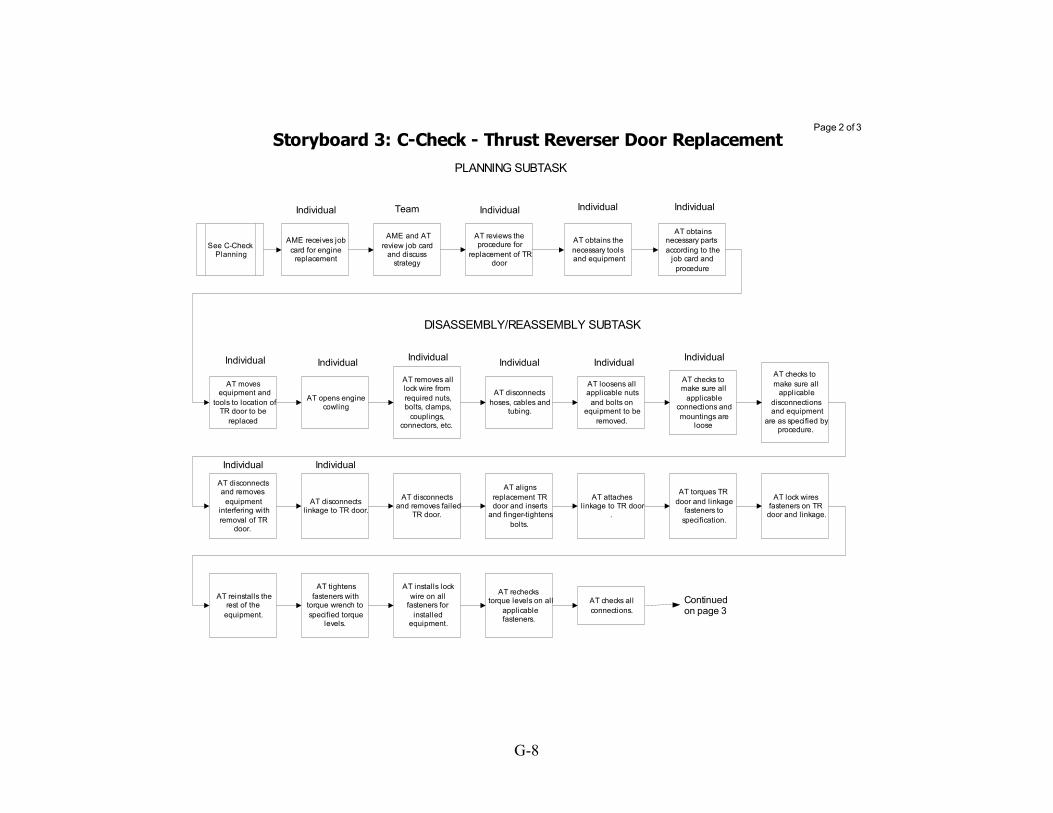
G-8
AME receives jobcard for engine
replacement
AME and ATreview job card
and discussstrategy
AT reviews theprocedure for
replacement of TRdoor
AT obtains thenecessary toolsand equipment
Team
AT obtainsnecessary partsaccording to the
job card andprocedure
AT movesequipment and
tools to location ofTR door to be
replaced
PLANNING SUBTASK
DISASSEMBLY/REASSEMBLY SUBTASK
AT opens enginecowling
Storyboard 3: C-Check - Thrust Reverser Door Replacement
AT removes alllock wire fromrequired nuts,bolts, clamps,
couplings,connectors, etc.
AT disconnectshoses, cables and
tubing.
AT loosens allapplicable nuts
and bolts onequipment to be
removed.
AT checks tomake sure all
applicableconnections andmountings are
loose
AT disconnectsand removes
equipmentinterfering withremoval of TR
door.
AT checks tomake sure all
applicabledisconnectionsand equipment
are as specified byprocedure.
Individual
Individual
Continuedon page 3
Page 2 of 3
Individual IndividualIndividual
Individual Individual Individual Individual Individual Individual
Individual
AT disconnectsand removes failed
TR door.
AT alignsreplacement TRdoor and inserts
and finger-tightensbolts.
AT attacheslinkage to TR door
.
AT torques TRdoor and linkage
fasteners tospecification.
AT lock wiresfasteners on TR
door and linkage.
AT disconnectslinkage to TR door.
AT reinstalls therest of the
equipment.
AT tightensfasteners with
torque wrench tospecified torque
levels.
AT installs lockwire on all
fasteners forinstalled
equipment.
AT recheckstorque levels on all
applicablefasteners.
AT checks allconnections.
See C-CheckPlanning

G-9
AME and ATprepare to testdoor operation.
Frompage 2
Page 3 of 3
Scenario 3: Thrust Reverser Door Replacement Continued
AT operatescontrols in cockpit
to activate TRdoors.
AT arranges forspotter to keep
personnel clear ofengine.
AME inspects TRdoor operation to
ensure that allwork has beencompleted tospecification.
AT documentswork as completed
and signs-off.
AME stamps thedocumentation for
sign-off.
TESTING SUBTASK
DOCUMENTATION SUBTASK
Individual
Team
AME arranges forelectrical power to
engine.
Individual Team Team Team
Individual

G-10
1. The lighting conditions in many areas are marginal. It is assumed that a portable service lamp or flashlightwill be used to see all controls and circuit breakers properly. Even with the light, some areas are still poorly lit.
2. The necessary documentation (drawings, task steps, tool information) is available in the area of themaintenance.
3. The correct support equipment and tools are available.
4. The AT performing the work is qualified.
5. The experience levels of the AMEs, ATs and apprentices are the average number of years for each.
Scenario 4: A-Check - Avionics Inspection - Cockpit EquipmentAssumptions
Page 1 of 3

G-11
AT identifies items toinspect by referring tothe A-Check checklist
AT retrieves jobcards for theinspections
AME and ATsreview job cards
and discussstrategy
ATs obtain thenecessaryequipment
Team
PLANNING SUBTASK
TESTING SUBTASK
AT pullsappropriate circuit
breakers, locksthem out or tags
them
Scenario 4: A-Check - Avionics Inspection
AT pushes inrequired circuit
breakers and tagsthem
AT records resultsof test routine
AT activatesspecified
equipmentaccording to thechecklist item
AT runs specifictest routine for the
equipment
AT or spotterobserves responseof equipment and
results of testroutine
AT decideswhether response
of equipmentqualifies as a pass
or fail
AT records pass orfail status on
checklist
AT may performadditional tests to
troubleshootequipment
showing a failureresponse
AT records anyrequired action to
resolve problem orcontinue
troubleshooting
Individual
AT checksfunctionality of all
light bulbs,displays, switches,
and printer
Individual Team
AT disconnectselectrical power
AT removes tagsand collars fromcircuit breakers
and restores themto originalpositions
Continuedon page 3
Page 2 of 3
Team
Individual Individual Team
Individual Individual
IndividualIndividual
Individual
Individual
Individual
Individual
Individual
AT communicateswith other
personnel toensure it is safe to
apply power toaircraft
Team

G-12
Frompage 2
Page 3 of 3
Scenario 4: A-Check - Avionics Inspection Continued
DOCUMENTATION SUBTASK
AT documents thework as completed
and sign it off
AME stamps thedocumentation for
sign-off
IndividualIndividual

G-13
1. The lighting conditions in many areas are marginal. It is assumed that a portable service lamp or flashlightwill be used to see all controls and circuit breakers properly. Even with the light, some areas are still poorly lit.
2. The necessary documentation (drawings, task steps, tool information) is available in the area of themaintenance.
3. The correct support equipment and tools are available.
4. The AT performing the work is qualified.
5. The experience levels of the AMEs, ATs and apprentices are the average number of years for each.
Scenario 5: A-Check - Mechanical Inspection -Assumptions
Page 1 of 3

G-14
AT identifiesmechanical systems to
be inspected byreferring to the A-
Check checklist or toprevious test results
AT retrieves jobcards for theinspectionprocedures
AME and ATsreview job cards
and discussstrategy
ATs obtain thenecessary toolsand equipment
Team
ATs movenecessary tools
and equipment tolocation of system
to be adjusted
PLANNING SUBTASK
INSPECTION SUBTASK
AT pullsappropriate circuit
breakers, locksthem out or tags
them
Scenario 5: A-Check - Mechanical Inspection
AT pushes inrequired circuit
breakers and tagsthem
AT communicateswith other
personnel toensure it is safe toturn on hydraulic
power
ATs set up testequipment or
gauges
AT2 is positionedas spotter at site of
equipment to beadjusted
AT1 in cockpitinitiates operationof equipment and
describes action toAT2
AT notifies AT2from cockpit that
operation ofequipment is to
begin
AT2 ensures thearea is clear of
personnel
AT2 notifies AT1that it is safe to
operate theequipment
AT2 observesaction of
equipment
AT2 confirms thataction of
equipment isconsistent with
action initiated byAT1
AT2 monitors andreports to AT1readings offcalibration
equipment orguages
AT1 recordsresults and anycomments on
checklist
Individual
ATs removecalibration
equipment orguages
Team
Team
AT removes tagsand collars fromcircuit breakers
and restores themto originalpositions
ATs disconnecthydraulic power
Continuedon page 3
Page 2 of 3
Team
Team Individual Team
Team Team TeamTeam
TeamTeamTeam
Team
Team
Individual
Individual Individual
Individual

G-15
Frompage 2
Page 3 of 3
Scenario 5: A-Check - Avionics Adjustments Continued
DOCUMENTATION SUBTASK
ATs document thework as completed
and sign it off
AME stamps thedocumentation for
sign-off
IndividualIndividual
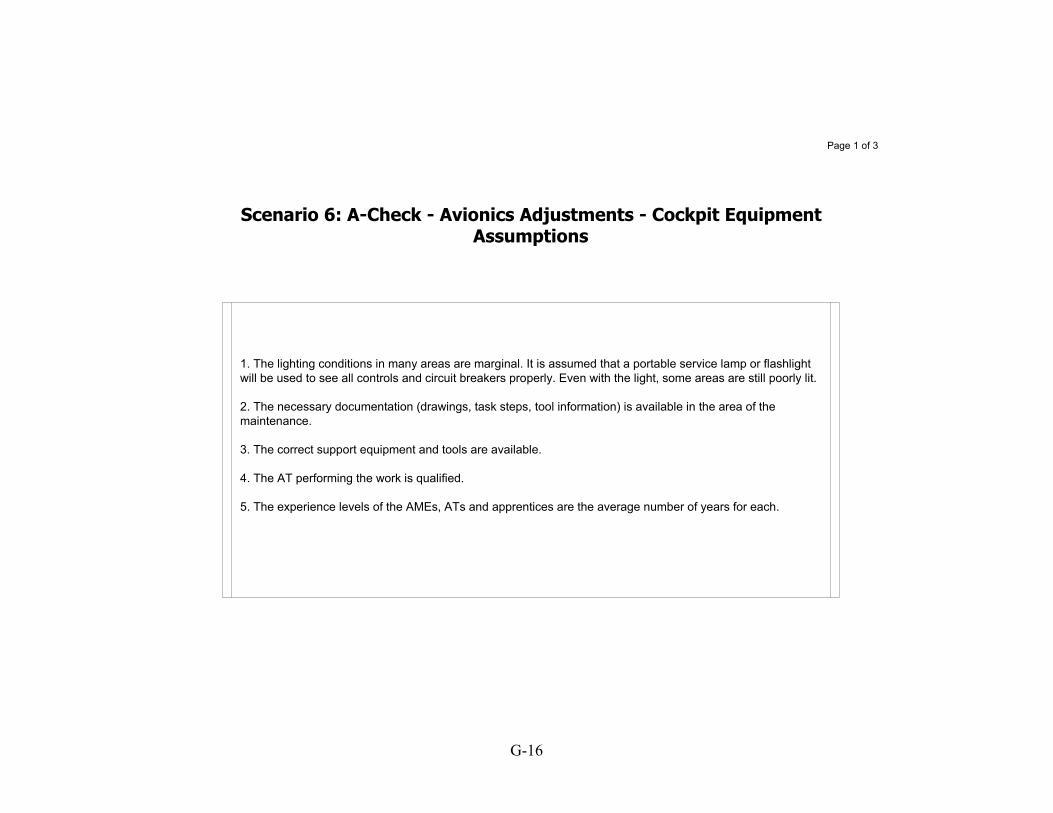
G-16
1. The lighting conditions in many areas are marginal. It is assumed that a portable service lamp or flashlightwill be used to see all controls and circuit breakers properly. Even with the light, some areas are still poorly lit.
2. The necessary documentation (drawings, task steps, tool information) is available in the area of themaintenance.
3. The correct support equipment and tools are available.
4. The AT performing the work is qualified.
5. The experience levels of the AMEs, ATs and apprentices are the average number of years for each.
Scenario 6: A-Check - Avionics Adjustments - Cockpit EquipmentAssumptions
Page 1 of 3

G-17
AT identifiesmechanical systems to
be adjusted byreferring to the A-
Check checklist or toprevious test results
AT retrieves jobcards for theadjustments
AME and ATsreview job cards
and discussstrategy
ATs obtain thenecessary toolsand equipment
Team
ATs movenecessary tools
and equipment tolocation of system
to be adjusted
PLANNING SUBTASK
INSPECTION SUBTASK
AT pullsappropriate circuit
breakers, locksthem out or tags
them
Scenario 6: A-Check - Avionics Adjustment
AT pushes inrequired circuit
breakers and tagsthem
AT communicateswith other
personnel toensure it is safe toturn on hydraulic
power
ATs set upcalibration
equipment orguages
AT2 is positionedas spotter at site of
equipment to beadjusted
AT1 in cockpitinitiates operationof equipment and
describes action toAT2
AT notifies AT2from cockpit that
operation ofequipment is to
begin
AT2 ensures thearea is clear of
personnel
AT2 notifies AT1that it is safe to
operate theequipment
AT2 observesaction of
equipment
AT2 confirms thataction of
equipment isconsistent with
action initiated byAT1
AT2 monitors andreports to AT1readings offcalibration
equipment orguages
AT1 recordsresults and anycomments on
checklist
Individual
ATs removecalibration
equipment orguages
Team
Team
AT removes tagsand collars fromcircuit breakers
and restores themto originalpositions
ATs disconnecthydraulic power
Continuedon page 3
Page 2 of 3
Team
Team Individual Team
Team Team TeamTeam
TeamTeamTeam
Team
Team
Individual
Individual Individual
Individual

G-18
Frompage 2
Page 3 of 3
Scenario 6: A-Check - Avionics Adjustments Continued
DOCUMENTATION SUBTASK
ATs document thework as completed
and sign it off
AME stamps thedocumentation for
sign-off
IndividualIndividual

G-19
Page 1 of 3
Scenario 7: A-Check - Cargo Bay Inspection
1. The lighting conditions in the cargo bay are marginal. It is assumed that a portable service lamp will be usedto see all components properly. Even with the light, some areas are still poorly lit.
2. The necessary documentation (drawings, task steps, tool information) is available in the area of themaintenance.
3. The correct support equipment and tools are available.
4. The AT performing the work is qualified.
5. The experience levels of the AMEs, ATs and apprentices are the average number of years for each.

G-20
AT receives jobcard for cargo bay
inspection
AME and ATsreview job card
and discussstrategy
AT reviews theprocedure
AT obtains thenecessary toolsand equipment
Team
AT movesequipment and
tools to location ofcargo bay
PLANNING SUBTASK
INSPECTION SUBTASK
AT sets up ladderor steps and
ensures it is safeto climb up
Scenario 7: A-Check - Cargo Bay Inspection
Individual
Continuedon page 3
Page 2 of 3
IndividualIndividual
IndividualIndividual
AT gains access toarea by removingaccess panels orinspection covers
AT observescondition of itemusing flashlight
and mirror ifnecessary
AT comparescondition of item to
specifications
AT checks off theitem off on the
checklist
Individual
Individual IndividualIndividual
AT reads item onchecklist
AT movesnecessary
equipment andtools to location ofitem to be checked
AT assesses what(if any)
maintenanceactions are
required for theitem, and recordsaction on checklist
AT replacesaccess panels orinspection covers
Individual Individual
Individual Individual
AT descendsladder or stairsand removes
equipment fromarea
Individual
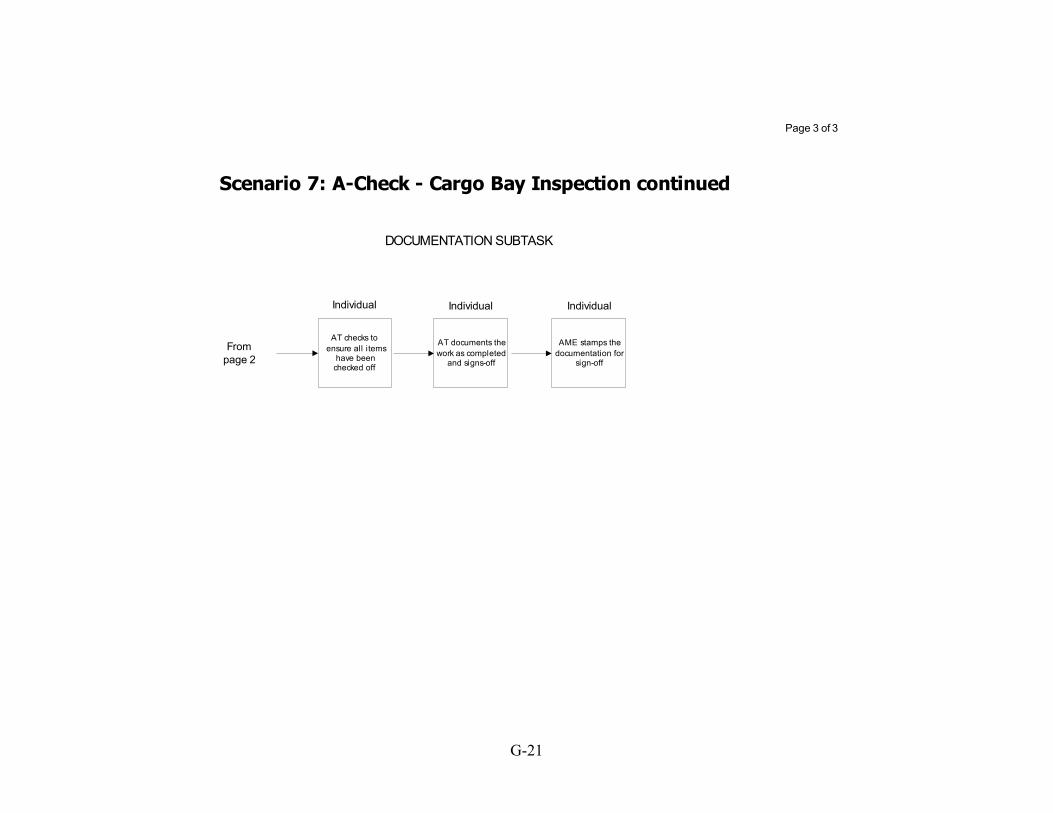
G-21
Page 3 of 3
DOCUMENTATION SUBTASK
AT checks toensure all items
have beenchecked off
Individual
AT documents thework as completed
and signs-off
Individual
AME stamps thedocumentation for
sign-off
Individual
Frompage 2
Scenario 7: A-Check - Cargo Bay Inspection continued

G-22
Page 1 of 2
1. The lighting conditions in the aircraft are marginal. It is assumed that a portable service lamp or flashlight willbe used to see all controls and circuit breakers properly. Even with the light, some areas are still poorly lit.
2. The necessary documentation (drawings, task steps, tool information) is available in the area of themaintenance.
3. The correct support equipment and tools are available.
4. The AT performing the work is qualified.
5. The troubleshooting of the door sensor is a result of the malfunctioning of components as identified by flightcrew or during a maintenance check.
6. The experience levels of the AMEs, ATs and apprentices are the average number of years for each.
Scenario 8: C-Check - Troubleshoot Door Sensor Assumptions

G-23
Lead AT receivesjob card for thereported snag
Lead AT locatesand reads snag
entry in the defectlog
Lead AT and 2other ATs review
problem anddiscuss strategy
ATs obtain thenecessary toolsand equipment
Team
ATs movenecessary tools
and equipment towork area
PLANNING SUBTASK
TESTING SUBTASK
ATs connectpressurizationequipment orprepare to run
APU
Scenario 8: Troubleshooting an External Door Sensor
AT2 is postedoutside gangway
door to keeppersonnel clear
Lead AT informsother ATs that
pressurization is tobegin
Lead AT observesthat the seal ismaintained andconcludes that
sensor appears tobe functional
Lead ATpressurizes cabinto specified level
Lead AT monitorspressure and otheraffected systemswhile observing
door seal indicator
Lead AT monitorsdoor seal indicatorfor specified test
period
Lead ATdepressurizes
cabin at specifiedrate
Lead AT recordsresults of test inmaintenance log
Lead AT closesthe action in the
defect log
Individual
AME stamps thedocumentation for
sign-off
Individual
Team
Page 2 of 2
Team
Team Team Individual
Individual Individual Individual
Team
Individual
Individual
Individual Individual
Individual
AT2 is postedinside gangway
door to keeppersonnel clear
Individual
Lead AT sets upsafety systemsand prepares
aircraft forpressurization
DOCUMENTATION SUBTASK
ATs disconnect airsupply or shut
down APU
Individual
ATs remove ordisconnect safety
systems
Individual

G-24
AT receivesservice checkchecklist fromTeam Leader
AT reviewschecklist
AT reviews AMTAC“Open Items List” and
identifies items toinclude in service
check
ATs obtain thenecessary tools,
fluids, andmaterials
Team
AT reads item onchecklist
PLANNING SUBTASK
INSPECTION SUBTASK
AT movesnecessary
equipment andtools to location ofitem to be checked
Scenario 9: Service Check - General Procedure
AT communicateswith other personneland takes necessary
precautions toensures area is safe
for the requiredoperation
AT gains access toarea by removingaccess panels orinspection covers
AT observescondition of itemusing flashlight
and mirror ifnecessary
AT comparescondition of item to
specifications
AT records resultsfrom non-FDE
faults interrogationonto interrogation
record sheet
AT checks off theitem off on the
checklist
AT assesses what(if any)
maintenanceactions are
required for theitem, and recordsaction on checklist
AT replacesaccess panels orinspection covers,and removes anysafety equipment
AT movesnecessary tools
and fluids tolocation of fluid
level to bechecked
AT removesaccess panels or
covers to gainaccess to sight
glass and filler cap
AT compares fluidlevel to
specification
AT removes fillercap
Individual
AT observeshazardous
materials handlingprocedures
Individual Individual
AT fills reservoirwith required fluid
AT records addedquantity onchecklist
AT replaces andsecures filler cap
AT cleans up anyspilled fluid
AT replacesaccess panels
AT movesnecessary tools
and equipment tolocation of landing
gear
Continuedon page 2
Page 1 of 2
Individual Individual
Individual Individual TeamIndividual Individual
Individual Individual Individual Individual
Individual Individual Individual IndividualIndividual
Individual
IndividualIndividual
IndividualIndividual

G-25
AT sets upequipment to
pressurize tires
Frompage 1
Page 2 of 2
Scenario 9: Service Check General Continued
AT pressurizestires to
specifications andrecords tirepressure on
checklist
AT records fluidlevels, fluid
quantity added,and tire pressures
in Journey Log
AT faxesinterrogation
record sheet toMontreal
INSPECTION SUBTASK continued
DOCUMENTATION SUBTASK
Individual
Individual
AT checks toensure all items
have beenchecked off
IndividualIndividual
Individual
AT removesequipment
Individual
AT documents thework as completed
and signs-off
Individual
AME stamps thedocumentation for
sign-off
Individual

G-26
AME receives job cardfor brake fluid top-up
AT opens enginecowling or access
panels
AT moves tools andreplacement fluid to
location of job
AT obtains thenecessary tools and
replacement fluidaccording to the jobcard and procedure
AT reviews theprocedure to confirmwhere to read fluid
levels, what levels areacceptable, and
required fluid brand ortype (health and safety
precautions? Enviroprecautions? Spill
clean-up equipment?Gloves? Masks?)
AME and ATs reviewjob card and discuss
strategy
AT repeats subtask forall hydraulic systems
until complete???
AT cleans up any fluidspilt in area
AT uses flashlight torecheck fluid level
AT replaces fill cap andsecures locking device
AT fills reservoir to theappropriate level
AT removes fill capAT uses flashlight toread fluid level
AT communicates withAME/Supervisor to
ensure hydraulic poweris not applied to the
aircraft (pull any CBs?)
AME inspects fill capsto ensure safely sealed
and locked???
AME stamps thedocumentation for sign-
off
AT documents work ascompleted and signs-off
Scenario 10: Replace Brake Fluid Page 1 of 1

Appendix H
Conceptual Event Trees


H-1
Conceptual Event Tree: Scenario 1 – Engine Replacement – Initiating Event 1 AT dam ages surroundingequipm ent during enginedisassem bly / assem bly
AT Checks workfollow ing
reas s em bly
AT noticesdam age to
adjacent part
Malfunction ofengine is revealed
during tes t
AME Notices Error Engine m aintainsthrus t during
take-off
H igh thrus t is notrequired to m aintain
plane airborne (e.g. noic ing condit ions)
Engine Dam aged
Dam age not detected
Pas s es Tes t w ith Latent Dam age
AT Fails to Check Work
Pas s es Tes t w ith Latent Dam age
Page 2
Page 3
Page 4
Page 5
Page 6
Error not noticedPage 7
Engine fails pas t no-abort s peed
Page 8
Error not noticedPage 9
Engine fails pas t no-abort s peed
Page 10

H-2
Conceptual Event Tree: Scenario 1 – Engine Replacement – Initiating Event 2
Engine m aintainsthrus t during
take-off
H igh thrus t is notrequired to m aintain
plane airborne (e.g. noic ing condit ions )
Engine fueldelivery s ys temdoes not leak
Engine does notcatch fire
Other engines andaircraf t sys tems
continue to f unction
Pilot has s ufficients kill to fly and land
dis abled plane
Cons equence
Page 1
Aircraft returned to m aintenance - 0 cas ualties

H-3
Conceptual Event Tree: Scenario 1 – Engine Replacement – Initiating Event 3
Engine m aintainsthrus t during
take-off
H igh thrust is notrequired to m aintain
plane airborne (e.g. noic ing condit ions)
Engine fueldelivery s ys temdoes not leak
Engine does notcatch fire
Other engines andairc raf t systems
continue to function
Pilot has s ufficients kill to fly and land
dis abled plane
Cons equence
Page 1
Aircraft returned to m aintenance - 0 cas ualties

H-4
Conceptual Event Tree: Scenario 1 – Engine Replacement – Initiating Event 4
Engine m aintainsthrus t during
take-off
H igh thrus t is notrequired to m aintain
plane airborne (e.g. noic ing condit ions)
Engine fueldelivery s ys temdoes not leak
Engine does notcatch fire
Other engines andaircraf t systems
continue to function
Pilot has s ufficients kill to fly and land
dis abled plane
Cons equence
Page 1
Aircraft returned to m aintenance - 0 cas ualties

H-5
Conceptual Event Tree: Scenario 1 – Engine Replacement – Initiating Event 5
Engine m aintainsthrus t during
take-off
H igh thrus t is notrequired to m aintain
plane airborne (e.g. noic ing condit ions )
Engine fueldelivery s ys temdoes not leak
Engine does notcatch fire
Other engines andaircraf t sys tems
continue to f unction
Pilot has s ufficients kill to fly and land
dis abled plane
Cons equence
Page 1
Aircraft returned to m aintenance - 0 cas ualties

H-6
Conceptual Event Tree: Scenario 1 – Engine Replacement – Initiating Event 6
Engine m aintainsthrus t during
take-off
H igh thrust is notrequired to m aintain
plane airborne (e.g. noic ing condit ions)
Engine fueldelivery s ys temdoes not leak
Engine does notcatch fire
Other engines andairc raf t systems
continue to function
Pilot has s ufficients kill to fly and land
dis abled plane
Cons equence
Page 1
Aircraft returned to m aintenance - 0 cas ualties

H-7
Conceptual Event Tree: Scenario 1 – Engine Replacement – Initiating Event 7
Engine m aintainsthrus t during
take-off
H igh thrus t is notrequired to m aintain
plane airborne (e.g. noic ing condit ions)
Engine fueldelivery s ys temdoes not leak
Engine does notcatch fire
Other engines andaircraf t systems
continue to function
Pilot has s ufficients kill to fly and land
dis abled plane
Cons equence
Page 1
Other Engine /aircraft s ys tem s fail
Aircraft Lands Safely
Aircraft Lands Safely
Pilot cras hes Pilot c rashes plane on landing - 10 fatalities , 50 injuries
Fuel leak
Engine Catches Fire
Other engine / aircraft s ys tem s fa il
Aircraft Lands Safely
Dead Stick landing - passengers psychologically traumatised
Pilot cras hes Cras h - 135 Fatalities
Pilot does not is olate leak
Dead Stick landing - passengers psychologically traumatised
Other engine / aircraft s ys tem s fa il
Aircraft Lands Safely
Pilot c rash lands planew ith engine f ire - 40 fatalities , 65 injuries
Pilot cras hes Cras h - 135 Fatalities

H-8
Conceptual Event Tree: Scenario 1 – Engine Replacement – Initiating Event 8
Enginem aintains thrus t
during take-offQ=5.000e-5
H igh thrus t is notrequired to m aintainplane airborne (e.g.no ic ing condit ions)
Q=5.000e-4
Engine fueldelivery s ys temdoes not leakQ=5.000e-4
Engine does notcatch fire
Q=1.000e-3
Other engines andairc raf t sy s tem s
cont inue to f unc tion
Q=2.000e-4
Pilot has suf f ic ientskill to f ly and land
disabled plane
Q=1.000e-2
Cons equence Frequency
Engine fails pas t no-abort s peed
Page 1
High thrus t required
Other engine / aircraf t systems fail
Other engine / aircraf t systems fail
Cras h - 135 Fatalities
5.048e-12
Cras h - 135 Fatalities
1.263e-11
Cras h - 135 Fatalities 2.527e-15
Aircraft Lands Safely
2.498e-8
Pilot cras hes Pilot crashes plane on landing - 10 fatalities, 50 injuries
2.524e-10
Fuel leak
Engine Catches Fire
Other engine / aircraf t systems fail
Aircraft Lands Safely 1.249e-11
D ead Stick landing - passengers psy chologically t raum at ised
2.498e-15
Pilot cras hes Cras h - 135 Fatalities
2.523e-17
Pilot does not is olate leak Dead Stick landing -
passengers psychologically traum atised
1.261e-13
Other engine / aircraf t systems fail
Aircraft Lands Safely 1.262e-14
Pilot c rash lands planewith engine f ire - 40 f atalit ies , 65 injuries
2.500e-18
Pilot cras hes Cras h - 135 Fatalities 2.525e-20

H-9
Conceptual Event Tree: Scenario 1 – Engine Replacement – Initiating Event 9
Engine m aintainsthrus t during
take-off
H igh thrus t is notrequired to m aintain
plane airborne (e.g. noic ing condit ions)
Engine fueldelivery s ys temdoes not leak
Engine does notcatch fire
Other engines andaircraf t systems
continue to function
Pilot has s ufficients kill to fly and land
dis abled plane
Cons equence
Page 1
Other Engine /aircraft s ys tem s fail
Aircraft Lands Safely
Aircraft Lands Safely
Pilot cras hes Pilot c rashes plane on landing - 10 fatalities, 50 injuries
Fuel leak
Engine Catches Fire
Other engine / aircraft s ys tem s fail
Aircraft Lands Safely
Dead Stick landing - passengers psychologically traumatised
Pilot cras hes Cras h - 135 Fatalities
Pilot does not is olate leak
Dead Stick landing - passengers psychologically traumatised
Other engine / aircraft s ys tem s fail
Aircraft Lands Safely
Pilot c rash lands planew ith engine f ire - 40 fatalities, 65 injuries
Pilot cras hes Cras h - 135 Fatalities

H-10
Conceptual Event Tree: Scenario 1 – Engine Replacement – Initiating Event 10
Enginem aintains thrus t
during take-offQ=5.000e-5
H igh thrust is notrequired to m aintainplane airborne (e.g.no ic ing condit ions)
Q=5.000e-4
Engine fueldelivery s ys temdoes not leakQ=5.000e-4
Engine does notcatch fire
Q=1.000e-3
Other engines andaircraf t sy stem s
continue to f unc t ion
Q=2.000e-4
Pilot has suf f ic ientskill to f ly and land
disabled plane
Q=1.000e-2
Cons equence Frequency
Engine fails pas t no-abort s peed
Page 1
High thrus t required
Other engine / airc raf t systems fail
Other engine / airc raf t systems fail
Cras h - 135 Fatalities
5.085e-12
Cras h - 135 Fatalities
1.272e-11
Cras h - 135 Fatalities 2.545e-15
Aircraft Lands Safely
2.517e-8
Pilot cras hes Pilot crashes plane on landing - 10 fatalities, 50 injuries
2.542e-10
Fuel leak
Engine Catches Fire
Other engine / airc raf t systems fail
Aircraft Lands Safely 1.258e-11
D ead Stick landing - passengers psy chologically traum atised
2.516e-15
Pilot cras hes Cras h - 135 Fatalities
2.541e-17
Pilot does not is olate leak Dead Stick landing -
passengers psychologically traumatised
1.270e-13
Other engine / airc raf t systems fail
Aircraft Lands Safely 1.272e-14
Pilot c rash lands planewith engine f ire - 40 f atalit ies , 65 injuries
2.518e-18
Pilot cras hes Cras h - 135 Fatalities 2.544e-20

H-11
Conceptual Event Tree: Scenario 2 – Replacement of Stator Vane Actuator – Initiating Event 1
AT applies incorrect procedure orfollows incorrect procedure when
installing Stator Vane Actuator
AT Checks workfollowing reassembly
Malfunction of engineis revealed during
test
Engine maintainsthrust during take-off
H igh thrus t is not required tom aintain plane airborne (e.g.
no ic ing condit ions)
Engine does notsurge following
take-off
Incorrect Installation of Actuator
Page 2
AT Fails to Check W ork
Page 3
Passes Test with Incorrect Engine Function
Engine stalls past no-abort speed
Page 4
Page 5
High thrust requiredPage 6

H-12
Conceptual Event Tree: Scenario 2 – Replacement of Stator Vane Actuator – Initiating Event 2
H igh thrus t is not required tom aintain plane airborne (e.g.
no ic ing condit ions )
Engine does notsurge following
take-off
Other engines andaircraft systems
continue to function
Pilot has suf f ic ient skill tof ly and land plane w ith
engine malfunction
Consequence Frequency
Page 1
Aircraft returned to maintenance - 0 casualties

H-13
Conceptual Event Tree: Scenario 2 – Replacement of Stator Vane Actuator – Initiating Event 3
H igh thrus t is not required tom aintain plane airborne (e.g.
no ic ing condit ions )
Engine does notsurge following
take-off
Other engines andaircraft systems
continue to function
Pilot has suf f ic ient skill tof ly and land plane w ith
engine malfunction
Consequence Frequency
Page 1
Aircraft returned to maintenance - 0 casualties

H-14
Conceptual Event Tree: Scenario 2 – Replacement of Stator Vane Actuator – Initiating Event 4
H igh thrus t is not required tom aintain plane airborne (e.g.
no ic ing condit ions)
Engine does notsurge following
take-off
Other engines andaircraft systems
continue to function
Pilot has suf f ic ient skill tof ly and land plane w ith
engine malfunction
Consequence Frequency
Page 1
Other Engine /aircraft systems fail
Aircraft Lands Safely
Aircraft Lands Safely
Pilot crashes Pilot crashes plane on landing - 10 fatalities, 50 injuries
Engine Surge
Other engine / aircraftsystems fail
Aircraft Lands Safely
Plane crashes on landing Pilot crashes plane
on landing - 10 fatalities, 50 injuries
Plane crashes after take-off
Crash - 135 Fatalities
Plane crashes after take-off
Crash - 135 Fatalities

H-15
Conceptual Event Tree: Scenario 2 – Replacement of Stator Vane Actuator – Initiating Event 5
H igh thrus t is not required tom aintain plane airborne (e.g.
no ic ing condit ions )
Engine does notsurge following
take-off
Other engines andaircraft systems
continue to function
Pilot has suf f ic ient skill tof ly and land plane w ith
engine malfunction
Consequence Frequency
Page 1Other engine / aircraftsystems fail
Crash - 135 Fatalities
Aircraft Lands Safely
Pilot crashes Pilot crashes plane on landing - 10 fatalities, 50 injuries

H-16
Conceptual Event Tree: Scenario 2 – Replacement of Stator Vane Actuator – Initiating Event 6 H igh thrus t is not required to
m aintain plane airborne (e.g.no ic ing condit ions)
Engine does notsurge following
take-off
Other engines andaircraft systems
continue to function
Pilot has suf f ic ient skill tof ly and land plane w ith
engine malfunction
Consequence Frequency
High thrust required
Page 1
Other engine / aircraftsystems fail
Crash - 135 Fatalities
Crash - 135 Fatalities

H-17
Conceptual Event Tree: Scenario 3 – Replacement of Thrust Reverser Door – Initiating Event 1
AT ins talls incorrec tpart during
replacem ent of thrus trev erser door
AME noticesuse of incorrect
part by AT
Malf unc tion of thrus trev erser is rev ealed
during test
Malf unc tion of thrustrev erser is detected
during pre-f lightcheck by f light crew
Thrus t rev erser doordoes not deploy
during take-of f orf light
Thrust reverserdoor does not jamopen on landing
Pilot has sufficient skill tokeep plane level on runway
with reverse thrusterjam m ed open
Consequence
Incorrect part installed AME does not
notice incorrect part Pas s es Tes t w ith
Com prom is ed Thrus t revers er
Flight crew do notdetect incorrect thrus t revers er operation
Thrust Reverser Door Opens
Aircraft returned to maintenance - 0 casualties
Aircraft Lands Safely
Crash - 135 Fatalities
Aircraft returned to maintenance - 0 casualties
Aircraft returned to maintenance - 0 casualties
Thruster reverser door jams open
Aircraft Lands Safely
Plane leaves runway
Pilot crashes plane on landing- 10 fatalities, 50injuries

H-18
Conceptual Event Tree: Scenario 4 - Avionics Inspection – Initiating Event 1
Avionics faultdetectable by
tes t
AT follows incorrectprocedure during test
and does not detect fault
F light c rew detec tabnorm al av ionics
during pre f lightchecks
Avionics not requiredfor flight safety (e.g.night flighing, poor
weather)
Avionicsoperate
Avionicsprovide correct
inform ation
Back-up avion icssystem s ava i lab le
Pilot has suf f ic ientsk ill to f ly and land
plane withoutav ionics
Cons equence
Avionics FaultAvionics Fault not Detected
A ircraf t returned to maintenance - 0 casualties
Flight Crew do not detect Avionics
required for flight
A ircraf t returned to maintenance - 0 casualties
Avionics do not operate
No back-up available
Aircraft Lands Safely
Aircraft Lands Safely
Pilot cras hes Cras h - 135 Fatalities
Aircraft Lands Safely
Aircraft Lands Safely
A vionics prov ide incorrect information
Back-up providescorrect information
No back-up available
Pilot recognizes information is incorrect Aircraft Lands
Safely
Pilot cras hes Cras h - 135 FatalitiesPilot unaware
of incorrect inform ation Cras h - 135
Fatalities

H-19
Conceptual Event Tree: Scenario 5 - Mechanical Inspection – Initiating Event 1
Hydrau l ics DefectDetectab leDuring T est
AT follows incorrectprocedure during test
and does not detect fault
F light c rew detec tabnorm al
hy draulics duringpre f light checks
Hydrau l icsfunction correctly
during take-off
Hydraulicsoperate during
flight
Back-uphydrau l ic system s
ava i lab le
Hydrau l icsopera te correctlyduring land ing
Pilot has suf f ic ientsk ill to f ly and landplane with H y drulic
Malf unct ion
Cons equence
Hydraulics Defect Hydraulic
Defect not Detected
Flight Crew do not detect
Malfunction during take-off
Hydraulics fail
Back-up hydraulics fail
A ircraf t returned to maintenance - 0 casualties
A ircraf t returned to maintenance - 0 casualties
Aircraft Lands Safely
Total los s of control Cras h - 135
Fatalities
Aircraft Lands Safely
Plane cras hes on landing Plane cras hes
-20 fatalities , 60 injuries
Hydraulics fail during landing
Passengers psychog ica l ly traum atized by near m issPlane cras hes
on landing Plane cras hes -20 fatalities , 60 injuries
Aircraft Lands Safely
Plane cras hes after take-off Cras h - 135
FatalitiesBack-up hydraulics fail Cras h - 135
Fatalities

H-20
Conceptual Event Tree: Scenario 6 - Avionics Adjustment – Initiating Event 1
A-Check:Avionics
Adjus tm ent
AT f ollows incorrec tcalibrat ion procedure
AME detects c rit icalerror m ade by AT or
Apprentice
Hydraulicsfunction correctly
during take-off
Hydraulicsoperate during
flight
Hydraulicsoperate correctly
during landing
Pilot has suf f ic ientsk ill to f ly and landplane with H y drulic
Malf unc tion
Cons equence
Avionics Adjus tm ent Hydraulics
incorectly calibrated
AME does not detect error
Malfunction during take-off
Hydraulics fail
Aircraft returned to m aintenance - 0 cas ualties
Aircraft returned to m aintenance - 0 cas ualties
Aircraft Lands Safely
Aircraft Lands Safely
Plane cras hes on landing Plane cras hes
-20 fatalities , 60 injuries
Hydraulics fail during landing
Passengers psychogically traumatized by nearmissPlane cras hes
on landing Plane cras hes -20 fatalities , 60 injuries
Aircraft Lands Safely
Plane cras hes after take-off Cras h - 135
Fatalities

H-21
Conceptual Event Tree: Scenario 7 – Cargo Bay Inspection – Initiating Event 1 The ATs apply
incorrec t procedureto the cargo bay
A-check
AME detectscrit ical error m ade
by AT orApprent ice
F light c rew detectabnorm al cargo
bay s tatus duringpre f light checks
Cargo bay doorproperly securedprior to take-o ff
F light sy s tem s notdam aged by
sudden loss ofpressure
Fire does notignite in
Cargo Bay
Fire detectionand suppression
operate
Pilot has sufficient skillto fly and land planewith dam aged flight
system s
Consequence
Incorrect CargoBay Check AME Fails to
Detect Error Flight Crew donot detect
C argo Bay D oor Im properly Secured
Ai rcra ft re tu rned to m ain tenance - 0 casua l tiesAi rcra ft re tu rned to m ain tenance - 0 casua l ties
Aircraft Lands Safely
Aircraft Lands Safely
Flight Sys tem s Dam aged
Plane crasheson landing Plane crashes -20
fata l i ties, 60 in juries
Plane crashes Crash - 135 Fatalities
Fire ignites in Cargo Bay Fire detection /
suppress ion fails
Aircraft Lands Safely
Crash - 135 Fatalities
Fire ignites in Cargo Bay Fire detection /
suppress ion fails
Aircraft Lands Safely
Crash - 135 Fatalities
Fire ignites in Cargo Bay
Fire detection / suppress ion fails Crash - 135
Fatalities
Plane crasheson landing Plane crashes -20
fata l i ties, 60 in juries
Plane crashes Crash - 135 Fatalities

H-22
Conceptual Event Tree: Scenario 8 – Troubleshooting Door Sensor – Initiating Event 1
The ATs m isses cueduring troubleshootingExternal Door Sensor
AME detec tsc rit ical error m ade
by AT orApprentice
F light c rew detec tabnorm al door
sensor during pref light checks
Door seal andlatch function
correctly
Plane retainspressure athigh altitude
Plane Doorremains secureat high altitude
Oxygen s upplys ys tem savailable
Cockpit oxygensystems availble
Consequence
Sensor Failurecue missed AME Fails to
Detect Error
Aircra ft re tu rned to m a in tenance - 0 casua l ties
Flight Crew donot detect Door latch / seal
malf unc tions
Aircra ft re tu rned to m a in tenance - 0 casua l ties
plane looses pressure
Loss of cabin oxygen
Aircraft Lands Safely
Passegers co l lapse - 15 in juriesPilot unconc ious
- plane crashes Crash - 135 Fatalities
Aircraft Lands Safely
Aircraft Lands Safely
plane door detaches
Loss of cabin oxygen
Sudden depressurizat ion - 6 f atalit ies , 30 injuriesPilot unconc ious
- plane crashes Crash - 135 Fatalities
Pilot unconc ious - plane crashes Crash - 135
Fatalities
Sudden depressurizat ion - 6 f atalit ies , 30 injuriesPilot unconc ious
- plane crashes Crash - 135 Fatalities

H-23
Conceptual Event Tree: Scenario 8 – Troubleshooting Door Sensor – Initiating Event 2
The ATs m isses cueduring troubleshootingExternal Door Sensor
AME detectsc rit ical error m ade
by AT orApprent ice
F light c rew detec tabnorm al door
sensor during pref light checks
Door seal andlatch function
correctly
Plane retainspressure athigh altitude
Plane Doorremains secureat high altitude
Oxygen s upplys ys tem savailable
Cockpit oxygensystems availble
Consequence
Sensor Failurecue missed AME Fails to
Detect Error
Ai rcra ft re turned to m ain tenance - 0 casua l ties
Flight Crew donot detect Door latch / seal
malfunctions
Ai rcra ft re turned to m ain tenance - 0 casua l ties
plane looses pressure
Loss of cabin oxygen
Aircraft Lands Safely
Passegers co l lapse - 15 in juriesPilot unconc ious
- plane crashes Crash - 135 Fatalities
Aircraft Lands Safely
Aircraft Lands Safely
plane door detaches
Loss of cabin oxygen
Sudden depressurizat ion - 6 f atalit ies , 30 injuriesPilot unconc ious
- plane crashes Crash - 135 Fatalities
Pilot unconc ious - plane crashes Crash - 135
Fatalities
Sudden depressurizat ion - 6 f atalit ies , 30 injuriesPilot unconc ious
- plane crashes Crash - 135 Fatalities

H-24
Conceptual Event Tree: Scenario 9 – General Service Check Initiating – Event 1
Tire leaks and hasvery low pres s ure
The AT checkstires and adds air
AME detectscritical error m adeby AT or Apprentice
Tire does not fa ilon take-off
Tire does not fa ilon landing
Pilot has s ufficients kill to m aintaincontrol of aircraft
Cons equence
Tire has very low pres s ure
Aircraft returned to m aintenance - 0 cas ualties
AT m is s es defect
AME Fails to Detect Error
Tire fails on take-off
Aircraft returned to m aintenance - 0 cas ualties
Aircraft returned to m aintenance - 0 cas ualties
Aircraft Lands Safely
Pilot los es control of aircraft Plane cras hes -20
fatalities , 60 injuries
Tire fails on landing
Aircraft Lands Safely
Pilot los es control of aircraft
Pilot cras hes plane on landing - 10 fatalities , 50 injuries

H-25
Conceptual Event Tree: Scenario 10 – Fluid Refill – Service Check – Initiating Event 1
Low fluid level inbrakes
The AT checks thebrake fluid leveland adds fluid
AME detectscritical error m adeby AT or Apprentice
Brakes do not failduring taxiing
Brakes do not fa ilon landing
Pilot has s ufficients kill to m aintaincontrol of aircraft
Cons equence
Low brake fluid level
Aircraft returned to m aintenance - 0 cas ualties
AT m is s es defect
AME Fails to Detect Error
Brakes fa il
Aircraft returned to m aintenance - 0 cas ualties
Aircraft Lands Safely
Aircraft returned to m aintenance - 0 cas ualties
Pilot los es control of aircraft
Aircraft s trikes s tructure or other aircraft during taxiing
Brakes Fail
A ircraf t overruns runw ay - damage to aircraf t, passengers s tartled
Pilot los es control of aircraft
A ircraf t veers of f runw ay - aircraf t damaged, passengersstartled


Appendix I
EMCCA Table


I-1
Table I1 Error Modes Conditions Consequences Analysis (EMCCA) Tables
Task Grouping Potential Effect of Time of Day
Effect of Working Conditions
Effect of Fatigue Potential Error Modes First Coincidental Event Second Coincidental Event
Immediate Consequences Potential System Consequences
1. The AME/ATs misinterpret data on the job card.
1. The AME and none of the ATs detect the misinterpretation.
1. The pilot does not detect the problem.
1. The wrong system is repaired and the failed system is still unvailable or operating at substandard level.
1. If system is critical, the aircraft may crash.
2. The AME communicates conflicting/ambiguous information to the ATs.
2. The ATs do not try to verify the information and apply their own interpretation instead.
2. The pilot does not detect the problem.
2. The wrong part may be installed, or an incorrect procedure used.
2. If the part is critical the aircraft may crash.
3. The AME forgets to provide an important piece of information to ATs.
3. The ATs do not notice the lack of information.
3. The pilot does not detect the problem.
3. The missing information may be critical to correct completion of the job.
3. If the missing information affects a part or system that is critical, the aircraft may crash.
4. AME elects to perform tasks that he/she does not have time for.
4. The ATs do not volunteer to relieve the AME of the additional task.
4. The pilot does not detect the problem.
4. The completion of the task may be substandard or other tasks performed by the Ats may be degraded.
4. If critical systems are affected the aircraft may crash.
5. The ATs do not check with the procedure for a non-routine job.
5. The procedure is sufficiently different to cause a severe problem.
5. The pilot does not detect the problem.
5. The incorrect procedure may cause incorrect or substandard maintenance.
5. If critical systems are affected the aircraft may crash.
6. The ATs apply incorrect procedure to the job.
6. None of the ATs recognize that procedure is inappropriate.
6. The pilot does not detect the problem.
6. The incorrect procedure may cause incorrect or substandard maintenance.
6. If critical systems are affected the aircraft may crash.
7. The ATs neglect to check the part numbers and subsequently obtain an incorrect part from stores.
7. Stores clerk provides incorrect part.
7. The pilot does not detect the problem.
7. The incorrect part may function abnormally or fail.
7. If critical systems are affected the aircraft may crash.
Initial planning Task requires clear thinking and reasonable level of alertness – beginning of night shift okay but performance degrades toward 03:00 – 05:00, where it is at its worst
Error Producing Conditions
Lighting must be good.
No disruptions during the planning.
Requires coordination of team members.
Must take the time to cover all necessary aspects of the job.
Verification of procedures, parts, tools, and appropriate documentation is required.
Planning tasks are significantly affected by severe fatigue. Details can be missed, errors made, misunderstandings can occur, and calculations can be error-prone.
References: 21, 2, 17
continued...

I-2
Table I1 continued
Task Grouping Potential Effect of Time of Day
Effect of Working Conditions
Effect of Fatigue Potential Error Modes First Coincidental Event Second Coincidental Event
Immediate Consequences Potential System Consequences
1. The AME/ATs misinterpret data on the job card.
1. The AME and none of the ATs detect the misinterpretation.
1. The pilot does not detect the problem.
1. The wrong system is repaired and the failed system is still unvailable or operating at substandard level.
1. If system is critical, the aircraft may crash.
2. The AME communicates conflicting/ambiguous information to the ATs.
2. The ATs do not try to verify the information and apply their own interpretation instead.
2. The pilot does not detect the problem.
2. The wrong part may be installed, or an incorrect procedure used.
2. If the part is critical the aircraft may crash.
3. The AME forgets to provide an important piece of information to ATs.
3. The ATs do not notice the lack of information.
3. The pilot does not detect the problem.
3. The missing information may be critical to correct completion of the job.
3. If the missing information affects a part or system that is critical, the aircraft may crash.
4. AME elects to perform tasks that he/she does not have time for.
4. The ATs do not volunteer to relieve the AME of the additional task.
4. The pilot does not detect the problem.
4. The completion of the task may be substandard or other tasks performed by the Ats may be degraded.
4. If critical systems are affected the aircraft may crash.
5. The ATs do not check with the procedure for a non-routine job.
5. The procedure is sufficiently different to cause a severe problem.
5. The pilot does not detect the problem.
5. The incorrect procedure may cause incorrect or substandard maintenance.
5. If critical systems are affected the aircraft may crash.
6. The ATs apply incorrect procedure to the job.
6. None of the ATs recognize that procedure is inappropriate.
6. The pilot does not detect the problem.
6. The incorrect procedure may cause incorrect or substandard maintenance.
6. If critical systems are affected the aircraft may crash.
7. The ATs neglect to check the part numbers and subsequently obtain an incorrect part from stores.
7. Stores clerk provides incorrect part.
7. The pilot does not detect the problem.
7. The incorrect part may function abnormally or fail.
7. If critical systems are affected the aircraft may crash.
Initial planning Task requires clear thinking and reasonable level of alertness – beginning of night shift okay but performance degrades toward 03:00 – 05:00, where it is at its worst
Error Producing Conditions
Lighting must be good.
No disruptions during the planning.
Requires coordination of team members.
Must take the time to cover all necessary aspects of the job.
Verification of procedures, parts, tools, and appropriate documentation is required.
Planning tasks are significantly affected by severe fatigue. Details can be missed, errors made, misunderstandings can occur, and calculations can be error-prone.
References: 21, 2, 17
continued...

I-3
Table I1 continued
Task Grouping Potential Effect of Time of Day
Effect of Working Conditions
Effect of Fatigue Potential Error Modes First Coincidental Event Second Coincidental Event
Immediate Consequences Potential System Consequences
1. AT installs incorrect part.
1. Part is sufficiently similar to allow installation without easy detection.
1. AME or pilot does not detect incorrect part has been installed.
1. The incorrect part may function abnormally or fail.
1. If critical systems are affected the aircraft may crash.
2. AT reconnects incorrect hose, coupling, cable.
2. Part is sufficiently similar to allow installation without easy detection.
2. AME or pilot does not detect incorrect part has been installed.
2. The incorrect part may function abnormally or fail.
2. If critical systems are affected the aircraft may crash.
3. AT follows incorrect procedure.
3. Procedure is sufficiently similar to allow installation without easy detection.
3. AME or pilot does not detect incorrect procedure has been applied.
3. The incorrect procedure may cause incorrect or substandard maintenance.
3. If critical systems are affected the aircraft may crash.
4. AT misses a step in the procedure.
4. Subtask can be completed without detection of immediate consequence of missed step.
4. AME or pilot does not detect problem due to missed step.
4. The incorrect procedure may cause incorrect or substandard maintenance.
4. If critical systems are affected the aircraft may crash.
5. AT damages fastener, connector, coupling, clamp, interface, part.
5. AT does not notice damage or considers damage not important.
5. AME or pilot does not detect problem due to damage.
5. Damaged part may fail. 5. If critical systems are affected the aircraft may crash.
6. AT damages surrounding equipment.
6. AT does not notice damage or considers damage not important.
6. AME or pilot does not detect problem due to damage.
6. Damaged part may fail. 6. If critical systems are affected the aircraft may crash.
7. AT fails to check work. 7. AME does not check the work.
7. Pilot does not detect a problem.
7. Equipment may not be properly installed and may fail.
7. If critical systems are affected the aircraft may crash.
8. AT fails to notice damage of an adjacent part.
8. AME does not check the work.
8. Pilot does not detect a problem.
8. Damaged part may fail. 8. If critical systems are affected the aircraft may crash.
Many of the activities are routine and require minimal information processing.
Some elements require concentrated decision making and attention.
Early morning nadir may cause problems for these decision making- and attention-based elements.
Disassembly/ Assembly
Lighting is crucial for completing tasks efficiently and correctly.
Distractions during reassembly may cause steps to be missed or improper alignment or set-up.
Cold or hot temperatures or high humidity will degrade the ability to do tasks efficiently.
Rushed schedules may lead to sloppy or incomplete work.
Error Producing Conditions
Both mental and physical fatigue can occur simultaneously.
Fatigue will slow the process down, where extra checking is necessary and physical handling of tools may be less efficient.
Following steps may be more difficult for unfamiliar jobs, and some steps may be missed.
Remembering the correct approach may be degraded.
continued...

I-4
Table I1 continued
Task Grouping Potential Effect of Time of Day
Effect of Working Conditions
Effect of Fatigue Potential Error Modes First Coincidental Event Second Coincidental Event
Immediate Consequences
1. AT damages fastener, connector, coupling, clamp, interface, part.
1. AT does not notice damage or considers damage not important.
1. AME or pilot does not detect problem due to damage.
1. Damaged part may fail.
2. AT damages surrounding equipment.
2. AT does not notice damage or considers damage not important.
2. AME or pilot does not detect problem due to damage.
2. Damaged part may fail.
3. Repair is substandard 3. AT does not notice substandard condition.
3. AME or pilot does not detect problem due to substandard condition.
3. Equipment may not function to specification.
1. AT damages equipment when cleaning.
1. AT does not notice damage or considers damage not important.
1. AME or pilot does not detect problem due to damage.
1. Damaged part may fail.
2. AT forgets to reinstall equipment removed for cleaning.
2. AT does not check equipment after cleaning.
2. AME or pilot does not detect problem due to damage.
2. Equipment fails.
1. AT follows incorrect calibration procedure.
1. Incorrect procedure results in improper calibration.
1. AME or pilot does not detect problem due to damage.
1. Equipment does not function to specification.
2. AT misses a cue during calibration procedure.
2. Missed cue results in incorrect calibration.
2. AME or pilot does not detect problem.
2. Equipment does not function to specification.
3. AT enters incorrect command during procedure.
3. Incorrect settings result in improper calibration.
3. AME or pilot does not detect problem.
3. Equipment does not function to specification.
Both mental and physical fatigue can occur simultaneously.
Fatigue will slow the process down, where extra checking is necessary and physical handling of tools may be less efficient.
Following steps may be more difficult for unfamiliar jobs, and some steps may be missed.
Remembering the correct approach may be degraded.
Lighting is crucial for completing tasks efficiently and correctly.
Distractions may cause steps to be missed.
Rushed schedules may lead to sloppy or incomplete work.
Little effect of time of day on cleaning tasks.
Physical activity will mostly offset the effects of the nadir period.
Repair Physical tasks such as cutting, shaping, detailed painting, drilling, and grinding will be more difficult during the nadir period of the morning.
Remembering steps will be somewhat degraded.
Cleaning Fatigue may cause reduced efficiency in job tasks.
Calibration The nadir period of the night shift will cause some degradation in the attention, information processing, decision-making and communications components.
Lighting should be adequate to see surfaces and enclosed areas. Task lighting will be necessary.
Rushed schedules may lead to sloppy or incomplete work Fatigue will degrade
the decision-making and communications components.
The effect of fatigue will be worsened by the nadir period during a night shift.
Error Producing Conditions
Lighting is crucial for completing tasks efficiently and correctly.
Distractions may cause steps to be missed.
Cold or hot temperatures or high humidity will degrade the ability to do tasks efficiently.
Rushed schedules may lead to sloppy or incomplete work.
continued...

I-5
Table I1 continued
Task Grouping Potential Effect of Time of Day
Effect of Working Conditions
Effect of Fatigue Potential Error Modes First Coincidental Event Second Coincidental Event
Immediate Consequences Potential System Consequences
1. AT misses defect during inspection.
1. AME or pilot does not detect problem.
1. Defect is serious. 1. Equipment failure occurs. 1. If critical systems are affected the aircraft may crash.
2. AT inspects wrong equipment.
2. AME does not check work.
2. Pilot does not detect problem.
2. Equipment failure occurs. 2. If critical systems are affected the aircraft may crash.
3. AT forgets to replace equipment removed during the inspection process.
3. AME does not check work.
3. Pilot does not detect problem.
3. Equipment failure occurs. 3. If critical systems are affected the aircraft may crash.
4. AT damages equipment during the inspection process.
4. AT does not notice damage or considers damage not important.
4. AME or pilot does not detect problem.
4. Damaged part may fail. 4. If critical systems are affected the aircraft may crash.
1. AT follows incorrect test procedure.
1. Test results are misleading and problem is not detected.
1. AME or pilot does not detect problem.
1. Equipment failure occurs. 1. If critical systems are affected the aircraft may crash.
2. AT misses a cue during test procedure.
2. Test is misread as a pass despite a problem occurring.
2. AME or pilot does not detect problem.
2. Equipment failure occurs. 2. If critical systems are affected the aircraft may crash.
3. AT enters incorrect command during test procedure.
3. Test results are misleading and problem is not detected.
3. AME or pilot does not detect problem.
3. Equipment failure occurs. 3. If critical systems are affected the aircraft may crash.
1. AT follows incorrect troubleshooting procedure.
1. Test results are misleading and problem is not detected.
1. AME or pilot does not detect problem.
1. Equipment failure occurs. 1. If critical systems are affected the aircraft may crash.
2. AT misses a cue during troubleshooting procedure.
2. Test is misread as a pass despite a problem occurring.
2. AME or pilot does not detect problem.
2. Equipment failure occurs. 2. If critical systems are affected the aircraft may crash.
3. AT enters incorrect command during troubleshooting procedure.
3. Test results are misleading and problem is not detected.
3. AME or pilot does not detect problem.
3. Equipment failure occurs. 3. If critical systems are affected the aircraft may crash.
Noise often beyond safe levels (require ear protection).
If outdoors can be cold, hot, humid, wet or windy.
Some equipment is difficult to reach.
Rushed schedules may lead to sloppy or incomplete work.
Decision-making and communications task components will be degraded most.
Some degradation in the attention component will occur.
If outdoors can be cold, hot, humid, wet or windy.
Some equipment is difficult to reach.
Rushed schedules may lead to sloppy or incomplete work.
Decision-making, information processing and communications task components will be degraded most.
Some degradation in the attention component will occur.
The nadir period of the night shift will cause some degradation in the attention, information processing, decision-making, memory and communications components.
Lighting is crucial for completing tasks efficiently and correctly.
Distractions may cause steps to be missed.
Rushed schedules may lead to sloppy or incomplete work.
Fatigue will further degrade inspection performance during the night shift.
Decision-making and communications task components will be degraded most.
Some degradation in the attention component will occur.
Testing The nadir period of the night shift will cause some degradation in the attention, information processing, decision-making, memory and communications components.
Inspection
Troubleshooting
Error Producing Conditions
The nadir period of the night shift will cause some degradation in the attention, information processing, decision-making, memory and communications components.
continued...

I-6
Table I1 continued
Task Grouping Potential Effect of Time of Day
Effect of Working Conditions
Effect of Fatigue Potential Error Modes First Coincidental Event Second Coincidental Event
Immediate Consequences Potential System Consequences
1. AT forgets to check fluid level.
1. AME does not check work.
1. Pilot do not detect problem.
1. Equipment failure occurs. 1. If critical systems are affected the aircraft may crash.
2. AT misinterprets indication of fluid level.
2. AME does not check work.
2. Pilot do not detect problem.
2. Equipment failure occurs. 2. If critical systems are affected the aircraft may crash.
3. AT forgets to top up or fill reservoir.
3. AME does not check work.
3. Pilot do not detect problem.
3. Equipment failure occurs. 3. If critical systems are affected the aircraft may crash.
4. AT inadvertently fills reservoir with an unapproved fluid.
4. AME does not check work.
4. Pilot do not detect problem.
4. Equipment failure occurs. 4. If critical systems are affected the aircraft may crash.
1. AT forgets to check area for obstacles before operating the hoist.
1. AT causes damage to A/C equipment.
1. AT/AME/Pilot do not notice damage.
1. Damage results in malfucntion of equipment.
1. If critical systems are affected the aircraft may crash.
2. AT moves hoist in direction other than that intended.
2. AT causes damage to A/C equipment.
2. AT/AME/Pilot do not notice damage.
2. Damage results in malfucntion of equipment.
2. If critical systems are affected the aircraft may crash.
3. AT misjudges distance and overshoots target.
3. AT causes damage to A/C equipment.
3. AT/AME/Pilot do not notice damage.
3. Damage results in malfucntion of equipment.
3. If critical systems are affected the aircraft may crash.
1. AT forgets to check area for obstacles before operating the transport vehicle.
1. AT causes damage to A/C equipment.
1. AT/AME/Pilot do not notice damage.
1. Damage results in malfucntion of equipment.
1. If critical systems are affected the aircraft may crash.
2. AT moves vehicle beyond the bounds of the area intended.
2. AT causes damage to A/C equipment.
2. AT/AME/Pilot do not notice damage.
2. Damage results in malfucntion of equipment.
2. If critical systems are affected the aircraft may crash.
3. AT misjudges placement of vehicle.
3. AT causes damage to A/C equipment.
3. AT/AME/Pilot do not notice damage.
3. Damage results in malfucntion of equipment.
3. If critical systems are affected the aircraft may crash.
Operating transport equipment
The nadir period of the night shift will cause some degradation in the attention, information processing, decision-making, and memory components.
The nadir period of the night shift will cause some degradation in the attention, information processing, decision-making, and memory components.
Fatigue will degrade the memory and attention components of the task. Distractions or time pressures may combine with the effects of fatigue to cause maintenance personnel to miss checking, refilling or topping up fluids.
Poor lighting will degrade psychomotor performance.
Rushed schedules may lead to sloppy operation.
Fatigue will increase risk taking.
Psychomotor and attention components will be degraded.
Decision making will be less confident.
Fatigue will increase risk taking.
Psychomotor and attention components will be degraded.
Decision making will be less confident.
Noise sometimes beyond safe levels (require ear protection).
If outdoors can be cold, hot, humid, wet or windy.
Rushed schedules may lead to sloppy or incomplete work.
Poor lighting will degrade psychomotor performance.
Rushed schedules may lead to sloppy operation.
Error Producing Conditions
Operating hoist equipment
Lubrication/Fluids The nadir period of the night shift will cause some degradation in the memory component.

Appendix J
HEART Data Tables

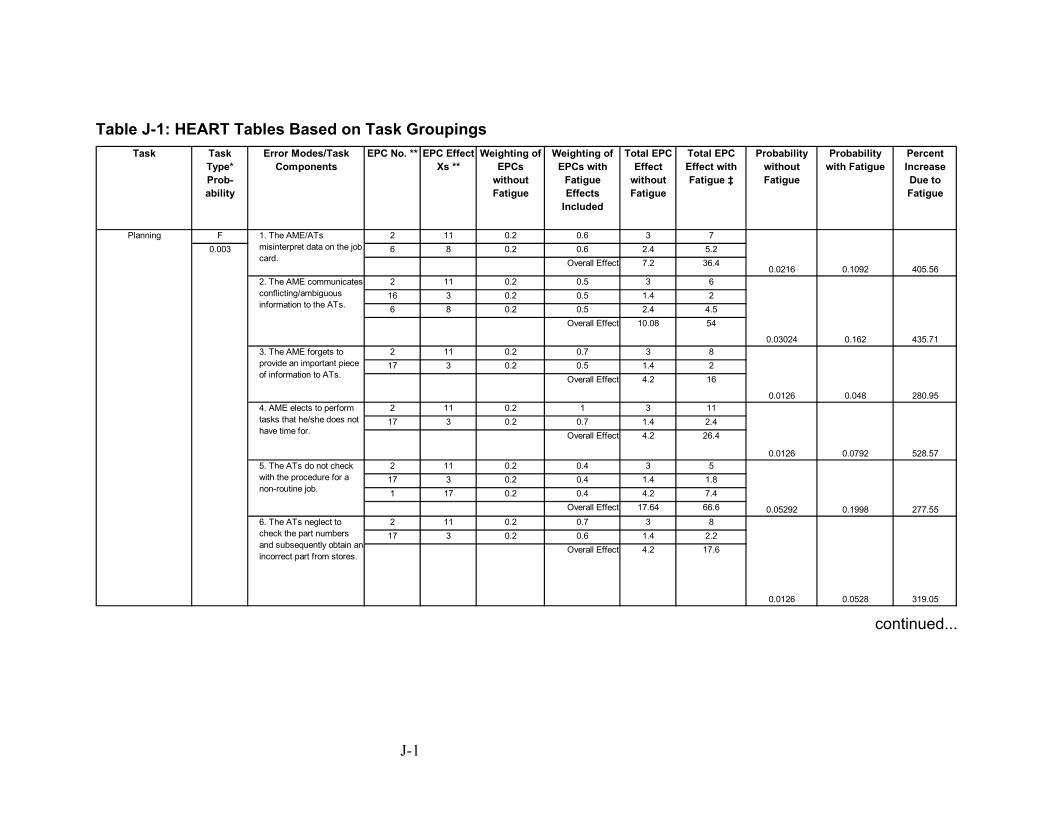
J-1
Table J-1: HEART Tables Based on Task Groupings
F 2 11 0.2 0.6 3 76 8 0.2 0.6 2.4 5.2
Overall Effect 7.2 36.4
2 11 0.2 0.5 3 616 3 0.2 0.5 1.4 26 8 0.2 0.5 2.4 4.5
Overall Effect 10.08 54
2 11 0.2 0.7 3 817 3 0.2 0.5 1.4 2
Overall Effect 4.2 16
2 11 0.2 1 3 1117 3 0.2 0.7 1.4 2.4
Overall Effect 4.2 26.4
2 11 0.2 0.4 3 517 3 0.2 0.4 1.4 1.81 17 0.2 0.4 4.2 7.4
Overall Effect 17.64 66.6
2 11 0.2 0.7 3 817 3 0.2 0.6 1.4 2.2
Overall Effect 4.2 17.6
0.05292 0.1998 277.55
0.0126 0.0528 319.05
0.048 280.95
0.0126 0.0792 528.57
0.03024
0.0126
0.0216 0.1092 405.56
0.162 435.71
Planning 1. The AME/ATs misinterpret data on the job card.
6. The ATs neglect to check the part numbers and subsequently obtain an incorrect part from stores.
5. The ATs do not check with the procedure for a non-routine job.
4. AME elects to perform tasks that he/she does not have time for.
0.003
2. The AME communicates conflicting/ambiguous information to the ATs.
3. The AME forgets to provide an important piece of information to ATs.
Total EPC Effect with Fatigue ‡
Probability without Fatigue
Probability with Fatigue
Percent Increase Due to Fatigue
EPC EffectXs **
Weighting of EPCs
without Fatigue
Weighting of EPCs with
Fatigue Effects
Included
Total EPC Effect
without Fatigue
Task Task Type*Prob-ability
Error Modes/Task Components
EPC No. **
continued...

J-2
Table J-1 continued
F 2 11 0.2 0.4 3 517 3 0.2 0.4 1.4 1.81 17 0.2 0.4 4.2 7.4
Overall Effect 17.64 66.62 11 0.25 0.6 3.5 717 3 0.2 0.5 1.4 215 3 0.2 0.4 1.4 1.8
Overall Effect 6.86 25.2
2 11 0.15 0.3 2.5 417 3 0.15 0.3 1.3 1.66 8 0.15 0.3 2.05 3.115 3 0.2 0.3 1.4 1.6
Overall Effect 9.3275 31.744
2 11 0.2 0.35 3 4.517 3 0.2 0.35 1.4 1.76 8 0.1 0.2 1.7 2.415 3 0.3 0.5 1.6 2
Overall Effect 11.424 36.722 11 0.2 0.4 3 517 3 0.2 0.4 1.4 1.815 3 0.25 0.5 1.5 2
Overall Effect 6.3 182 11 0.1 0.2 2 317 3 0.1 0.25 1.2 1.515 3 0.2 0.3 1.4 1.6
Overall Effect 3.36 7.22 11 0.1 0.2 2 317 3 0.1 0.2 1.2 1.4
Overall Effect 2.4 4.22 11 0.1 0.25 2 3.517 3 0.1 0.25 1.2 1.5
Overall Effect 2.4 5.25
0.0072 0.0126 75.00
0.0072 0.01575 118.75
0.0189 0.054 185.71
0.01008 0.0216 114.29
0.0279825 0.095232 240.33
0.034272 0.11016 221.43
277.55
0.02058 0.0756 267.35
0.05292 0.1998
Total EPC Effect with Fatigue ‡
Probability without Fatigue
Probability with Fatigue
Percent Increase Due to Fatigue
EPC EffectXs **
Weighting of EPCs
without Fatigue
Weighting of EPCs with
Fatigue Effects
Included
Total EPC Effect
without Fatigue
Task Task Type*Prob-ability
Error Modes/Task Components
EPC No. **
3. AT follows incorrect procedure.
6. AT damages surrounding equipment.
Disassembly/ Reassembly
1. AT installs incorrect part.
4. AT misses a step in the procedure.
8. AT fails to notice damage of an adjacent part.
0.003
2. AT reconnects incorrect hose, coupling, cable.
7. AT fails to check work.
5. AT damages fastener, connector, coupling, clamp, interface, part.
continued...

J-3
Table J-1 continued
F 2 11 0.15 0.3 2.5 46 8 0.15 0.3 2.05 3.11 17 0.15 0.3 3.4 5.8
Overall Effect 17.425 71.922 11 0.2 0.6 3 715 3 0.2 0.4 1.4 1.817 3 0.2 0.4 1.4 1.8
Overall Effect 5.88 22.682 11 0.2 0.5 3 615 3 0.2 0.35 1.4 1.717 3 0.2 0.35 1.4 1.7
Overall Effect 5.88 17.34F 2 11 0.25 0.75 3.5 8.5
15 3 0.2 0.5 1.4 217 3 0.2 0.5 1.4 2
Overall Effect 6.86 34
2 11 0.25 0.75 3.5 8.515 3 0.2 0.5 1.4 217 3 0.2 0.5 1.4 2
Overall Effect 6.86 342 11 0.3 0.7 4 815 3 0.3 0.6 1.6 2.217 3 0.3 0.6 1.6 2.2
Overall Effect 10.24 38.72
0.01764 0.06804 285.71
0.052275 0.21576 312.74
395.630.1020.02058
0.01764 0.05202 194.90
0.03072 0.11616 278.13
0.02058 0.102 395.63
Total EPC Effect with Fatigue ‡
Probability without Fatigue
Probability with Fatigue
Percent Increase Due to Fatigue
EPC EffectXs **
Weighting of EPCs
without Fatigue
Weighting of EPCs with
Fatigue Effects
Included
Total EPC Effect
without Fatigue
Task Task Type*Prob-ability
Error Modes/Task Components
EPC No. **
Testing 1. AT follows incorrect procedure.
3. AT enters incorrect command during procedure.
0.003
2. AT enters the wrong information onto job completion form.
3. AT approves documentation without doing an inspection of the work.
Documentation 1. AT forgets to record important information.
0.003
2. AT misses a cue during procedure.
continued...

J-4
Table J-1 continued
F 2 11 0.2 0.4 3 515 3 0.2 0.4 1.4 1.817 3 0.2 0.4 1.4 1.8
Overall Effect 5.88 16.2
2 11 0.2 0.5 3 615 3 0.2 0.4 1.4 1.817 3 0.2 0.4 1.4 1.8
Overall Effect 5.88 19.44
2 11 0.25 0.6 3.5 715 3 0.2 0.3 1.4 1.617 3 0.1 0.3 1.2 1.6
Overall Effect 5.88 17.92
F 2 11 0.25 0.6 3.5 715 3 0.2 0.5 1.4 217 3 0.2 0.5 1.4 2
Overall Effect 6.86 282 11 0.2 0.6 3 715 3 0.2 0.4 1.4 1.817 3 0.2 0.4 1.4 1.8
Overall Effect 5.88 22.682 11 0.2 0.4 3 515 3 0.2 0.4 1.4 1.817 3 0.2 0.4 1.4 1.8
Overall Effect 5.88 16.2
0.01764 0.06804 285.71
0.01764 0.0486 175.51
0.01764 0.05376 204.76
0.02058 0.084 308.16
0.01764 0.0486 175.51
0.01764 0.05832 230.61
Total EPC Effect with Fatigue ‡
Probability without Fatigue
Probability with Fatigue
Percent Increase Due to Fatigue
EPC EffectXs **
Weighting of EPCs
without Fatigue
Weighting of EPCs with
Fatigue Effects
Included
Total EPC Effect
without Fatigue
Task Task Type*Prob-ability
Error Modes/Task Components
EPC No. **
0.003
2. AT misses a cue during troubleshooting procedure.
3. AT enters incorrect command during troubleshooting procedure.
Troubleshooting 1. AT follows incorrect troubleshooting procedure.
0.003
2. AT damages surrounding equipment.
3. Repair is substandard
Repair 1. AT damages fastener, connector, coupling, clamp, interface, part.
continued...

J-5
Table J-1 continued
F 2 11 0.25 0.75 3.5 8.515 3 0.2 0.5 1.4 217 3 0.2 0.5 1.4 2
Overall Effect 6.86 34
2 11 0.25 0.8 3.5 915 3 0.2 0.4 1.4 1.817 3 0.2 0.4 1.4 1.8
Overall Effect 6.86 29.16
2 11 0.25 0.75 3.5 8.515 3 0.2 0.5 1.4 217 3 0.2 0.5 1.4 2
Overall Effect 6.86 34
2 11 0.3 0.75 4 8.515 3 0.2 0.5 1.4 217 3 0.2 0.5 1.4 2
Overall Effect 7.84 34G 2 11 0.2 0.75 3 8.5
15 3 0.2 0.4 1.4 1.8
17 3 0.2 0.4 1.4 1.8Overall Effect 5.88 27.54
2 11 0.2 0.45 3 5.515 3 0.1 0.2 1.2 1.4
17 3 0.1 0.2 1.2 1.4
Overall Effect 4.32 10.782 11 0.2 0.6 3 7
15 3 0.2 0.4 1.4 1.817 3 0.2 0.4 1.4 1.8
Overall Effect 5.88 22.68
Total EPC Effect with Fatigue ‡
Probability without Fatigue
Probability with Fatigue
Percent Increase Due to Fatigue
EPC EffectXs **
Weighting of EPCs
without Fatigue
Weighting of EPCs with
Fatigue Effects
Included
Total EPC Effect
without Fatigue
Task Task Type*Prob-ability
Error Modes/Task Components
EPC No. **
Inspection0.003
0.02352
3. AT forgets to replace equipment removed during the inspection process.
0.02058
0.02058
4. AT damages equipment during the inspection process.
0.102 333.67
0.001728 149.540.0043124. AT enters incorrect command during procedure.
0.002352 285.71
395.63
Calibration 1. AT follows incorrect calibration procedure.
0.002352 0.011016 368.37
0.0004
0.102
0.009072
3. AT misses a cue during procedure.
325.07
2. AT inspects wrong equipment.
0.08748
1. AT misses defect during inspection.
0.02058 0.102 395.63
continued...

J-6
Table J-1 continued
I 2 11 0.3 0.8 4 915 3 0.2 0.5 1.4 217 3 0.2 0.5 1.4 2
7.84 36
2 11 0.25 0.8 3.5 915 3 0.2 0.5 1.4 217 3 0.2 0.5 1.4 2
Overall Effect 6.86 36
2 11 0.25 0.7 3.5 815 3 0.2 0.4 1.4 1.817 3 0.2 0.4 1.4 1.8
Overall Effect 6.86 25.92
I 2 11 0.25 0.6 3.5 715 3 0.2 0.4 1.4 1.817 3 0.2 0.4 1.4 1.8
Overall Effect 6.86 22.68
2 11 0.25 0.75 3.5 8.5
15 3 0.2 0.4 1.4 1.8
17 3 0.2 0.4 1.4 1.8Overall Effect 6.86 27.54
2 11 0.25 0.6 3.5 715 3 0.2 0.4 1.4 1.817 3 0.2 0.4 1.4 1.8
Overall Effect 6.86 22.68
0.02058 0.08262 301.46
0.02058 0.06804 230.61
0.02058 0.07776 277.84
0.02058 0.06804 230.61
0.02352 0.108 359.18
0.02058 0.108 424.78
Total EPC Effect with Fatigue ‡
Probability without Fatigue
Probability with Fatigue
Percent Increase Due to Fatigue
EPC EffectXs **
Weighting of EPCs
without Fatigue
Weighting of EPCs with
Fatigue Effects
Included
Total EPC Effect
without Fatigue
Task Task Type*Prob-ability
Error Modes/Task Components
EPC No. **
0.003
2. AME provides incorrect information to AT or apprentice.
3. AME forgets to check work of AT or apprentice.
Supervision 1. AME misses critical error made by AT or apprentice.
0.003
2. AT provides incorrect information to other personnel (ramp, stores, etc.).
3. AT forgets to inform other personnel (ramp, stores, etc.) of important information.
Communications with other groups
1. AT mishears/misinterprets instruction from other personnel (ramp, stores, etc.).
continued...

J-7
Table J-1 continued
I 2 11 0.25 0.75 3.5 8.515 3 0.2 0.4 1.4 1.817 3 0.2 0.4 1.4 1.8
Overall Effect 6.86 27.54
2 11 0.25 0.8 3.5 915 3 0.2 0.5 1.4 217 3 0.2 0.5 1.4 2
Overall Effect 6.86 36
2 11 0.25 0.75 3.5 8.515 3 0.2 0.4 1.4 1.817 3 0.2 0.4 1.4 1.8
Overall Effect 6.86 27.54
F 2 11 0.2 0.4 3 515 3 0.2 0.3 1.4 1.617 3 0.2 0.3 1.4 1.6
Overall Effect 5.88 12.8
2 11 0.2 0.4 3 515 3 0.2 0.3 1.4 1.617 3 0.2 0.3 1.4 1.6
Overall Effect 5.88 12.8
2 11 0.2 0.4 3 515 3 0.2 0.3 1.4 1.617 3 0.2 0.3 1.4 1.6
Overall Effect 5.88 12.82 11 0.2 0.4 3 515 3 0.2 0.3 1.4 1.617 3 0.2 0.3 1.4 1.6
Overall Effect 5.88 12.8 117.69
117.69
0.003
2. AT misinterprets indication of fluid level.
0.01764 0.0384 117.693. AT forgets to top up or fill reservoir.
0.01764 0.0384 117.69
Lubricating parts, topping fluids
1. AT forgets to record important information.
0.01764 0.0384
4. AT inadvertently fills reservoir with an unapproved fluid.
0.01764 0.0384
Task Task Type*Prob-ability
Error Modes/Task Components
EPC No. ** EPC EffectXs **
Weighting of EPCs
without Fatigue
Weighting of EPCs with
Fatigue Effects
Included
Total EPC Effect
without Fatigue
Total EPC Effect with Fatigue ‡
Probability without Fatigue
Probability with Fatigue
Percent Increase Due to Fatigue
301.46
0.003
2. AME/AT provides incorrect information to apprentice.
0.02058 0.108 424.783. AME/AT forgets to check work of apprentice.
0.02058 301.46
Training 1. AME/AT misses critical error made by apprentice.
0.02058 0.08262
0.08262
continued...

J-8
Table J-1 continued
F 2 11 0.3 0.75 4 8.515 3 0.25 0.5 1.5 217 3 0.25 0.5 1.5 2
Overall Effect 9 34
2 11 0.25 0.6 3.5 715 3 0.2 0.4 1.4 1.817 3 0.2 0.4 1.4 1.8
Overall Effect 6.86 22.68
G 2 11 0.25 0.6 3.5 715 3 0.2 0.3 1.4 1.617 3 0.2 0.3 1.4 1.6
Overall Effect 6.86 17.92
2 11 0.25 0.6 3.5 715 3 0.2 0.3 1.4 1.617 3 0.2 0.3 1.4 1.6
Overall Effect 6.86 17.922 11 0.25 0.5 3.5 615 3 0.2 0.3 1.4 1.617 3 0.2 0.3 1.4 1.6
Overall Effect 6.86 15.36
Total EPC Effect with Fatigue ‡
Probability without Fatigue
Probability with Fatigue
EPC EffectXs **
Weighting of EPCs
without Fatigue
Weighting of EPCs with
Fatigue Effects
Included
Total EPC Effect
without Fatigue
Task Task Type*Prob-ability
Error Modes/Task Components
EPC No. **
Operating hoisting equipment
1. AT forgets to check area for obstacles before operating the hoist.
0.002744 0.007168
0.006144
0.0004
2. AT moves hoist in direction other than that intended.
0.002744 0.0071683. AT misjudges distance and overshoots target.
0.002744
Cleaning 1. AT damages equipment when cleaning.
0.027 0.102
0.003
2. AT forgets to reinstall equipment removed for cleaning.
0.02058 0.06804
continued...

J-9
Table J-1 continued
G 2 11 0.25 0.6 3.5 715 3 0.2 0.3 1.4 1.617 3 0.2 0.3 1.4 1.6
Overall Effect 6.86 17.92
2 11 0.25 0.6 3.5 715 3 0.2 0.3 1.4 1.617 3 0.2 0.3 1.4 1.6
Overall Effect 6.86 17.92
2 11 0.25 0.6 3.5 715 3 0.2 0.3 1.4 1.617 3 0.2 0.3 1.4 1.6
Overall Effect 6.86 17.92
Total EPC Effect with Fatigue ‡
Probability without Fatigue
Probability with Fatigue
Percent Increase Due to Fatigue
EPC EffectXs **
Weighting of EPCs
without Fatigue
Weighting of EPCs with
Fatigue Effects
Included
Total EPC Effect
without Fatigue
Task Task Type*Prob-ability
Error Modes/Task Components
EPC No. **
0.002744
161.22
161.223. AT misjudges placement of vehicle.
0.002744 161.22
0.007168
0.007168
0.0004
2. AT moves vehicle beyond the bounds of the area intended.
0.007168
Operating transport equipment
1. AT forgets to check area for obstacles before operating the transport vehicle.
0.002744
** Error Producing Conditions (EPCs) as shown in Appendix C, Table C1.
‡ This multiplier is based on expert opinion and involves the estimated effect fatigue has on the EPC it is applied to - note that multiplier 1.5 is the base rate suggested by Williams (1988) for fatigue.
* Classification of tasks based on those used by Williams (1988) for determining error rates for the HEART error analysis methodology – see Appendix C, Table C2 for descriptions of the tasks.

J-10

Appendix K Quantitative Event Trees


K-1
Event Trees
1. Engine Replacement
2. Stator Vane Actuator Replacement
3. Thrust Reverser Door Replacement
4. Cargo Bay Inspection
5. Avionics Inspection
6. Mechanical Inspection
7. Avionics Adjustment
8. Troubleshooting Door Sensor
9. General Service Check
10. Topping Up Fluids
The following event trees represent the scenarios listed here and their associated error modes and events. The calculations for the event tree probabilities are contained in the detailed data sheets found in Appendix M.

K-2
Assumptions for the Engine Replacement Event Tree Human errors during engine replacement are assumed to lead to one of the three following hazardous conditions:
• Loss of engine thrust
• Engine fire
• Leak in fuel feed to engine
The conditions were selected based on a review of transportation safety board data and the authors’ evaluations of possible hazardous scenarios. The event tree is structured such that a probability can be assigned to each hazardous condition for each human error initiating sequence. In this way some human errors may be assigned, say, a greater probability of leading to a fuel leak whereas others may be assigned a greater probability of leading to loss of thrust.
Loss of thrust is considered to be the most safety critical during the take-off phase of flight when the aircraft weight is greatest and the thrust demand is highest. It is assumed that all airliners considered in this study are multi-engined and that loss of thrust from one engine is not critical during normal flight. The one exception where loss of thrust is considered to be critical is during take-off with abnormally high loads such as might occur with ice on the skin of the aircraft or take-off during high wind/gusting conditions. Once the aircraft is airborne and at sufficient altitude to clear terrain and buildings, it is assumed that loss of thrust from more than one engine would be needed to result in a critical situation. The independent failure of another engine or system (e.g. aileron control) is considered as a possibility that may lead to a critical situation during the flight phase.
The ability to recover from failures and land the aircraft safely is assumed to be dependent on the skill of the pilot and the presence of weather and other conditions that may make the pilot’s task more difficult.
The consequences of the pilot being unable to control the aircraft are considered to vary between a crash landing in which some passengers escape to total loss of the aircraft, crew and passengers. The ignition and spread of fire following a crash landing is considered to be a key factor in determining the number of passengers that may escape the aircraft and avoid injury.

K-3
Quantitative Event Tree 1: Engine Replacement Scenario Page 1
AT damages surroundingequipment during enginedisassem bly / assem bly
w=1.890
AT Checks workfollow ing
reas s em blyQ=7.200e-3
AT noticesdam age to
adjacent partQ=7.200e-3
Malfunction ofengine is revealed
during tes t
Q=9.088e-1
AME NoticesError
Q=4.116e-2
Enginem aintains thrus tduring take-off
Q=5.000e-5
H igh thrust is notrequired to m aintainplane airborne (e.g.no ic ing condit ions )
Q=5.000e-4
Engine fueldelivery s ys temdoes not leakQ=5.000e-4
Engine Dam aged
Dam age not detected Pas s es Tes t w ith
Latent Dam age
AT Fails to CheckWork Pas s es Tes t w ith
Latent Dam age
Page 2
Page 3
Page 4
Page 5
Page 6
Error not noticedPage 7
Engine fails pas t no-abort s peed
Page 8
Error not noticedPage 9
Engine fails pas t no-abort s peed
Page 10

K-4
Quantitative Event Tree 1: Engine Replacement Scenario Page 2 Engine
m aintains thrus tduring take-offQ=5.000e-5
H igh thrus t is notrequired to m aintainplane airborne (e.g.no ic ing condit ions )
Q=5.000e-4
Engine fueldelivery s ys temdoes not leakQ=5.000e-4
Engine does notcatch fire
Q=1.000e-3
Other engines andairc raf t sy s tem s
continue to f unc t ion
Q=2.000e-4
Pilot has suf f ic ientskill to f ly and land
disabled plane
Q=1.000e-2
Cons equence Frequency
Page 1
Aircraft returned to m aintenance - 0 cas ualties
1.863

K-5
Quantitative Event Tree 1: Engine Replacement Scenario Page 3
Enginem aintains thrus t
during take-offQ=5.000e-5
H igh thrus t is notrequired to m aintainplane airborne (e.g.no ic ing condit ions )
Q=5.000e-4
Engine fueldelivery s ys temdoes not leakQ=5.000e-4
Engine does notcatch fire
Q=1.000e-3
Other engines andairc raf t sy s tem s
continue to f unc t ion
Q=2.000e-4
Pilot has suf f ic ientskill to f ly and land
disabled plane
Q=1.000e-2
Cons equence Frequency
Page 1
Aircraft returned to m aintenance - 0 cas ualties
1.233e-3

K-6
Quantitative Event Tree 1: Engine Replacement Scenario Page 4
Engine
m aintains thrus tduring take-off
Q=5.000e-5
H igh thrus t is notrequired to m aintainplane airborne (e.g.no ic ing condit ions)
Q=5.000e-4
Engine fueldelivery s ys temdoes not leakQ=5.000e-4
Engine does notcatch fire
Q=1.000e-3
Other engines andairc raf t sy s tem s
cont inue to f unc t ion
Q=2.000e-4
Pilot has suf f ic ientskill to f ly and land
disabled plane
Q=1.000e-2
Cons equence Frequency
Page 1
Aircraft returned to m aintenance - 0 cas ualties
1.177e-2

K-7
Quantitative Event Tree 1: Engine Replacement Scenario Page 5
Engine
m aintains thrus tduring take-offQ=5.000e-5
H igh thrust is notrequired to m aintainplane airborne (e.g.no ic ing condit ions )
Q=5.000e-4
Engine fueldelivery s ys temdoes not leakQ=5.000e-4
Engine does notcatch fire
Q=1.000e-3
Other engines andairc raf t sy s tem s
continue to f unc tion
Q=2.000e-4
Pilot has suf f ic ientskill to f ly and land
disabled plane
Q=1.000e-2
Cons equence Frequency
Page 1
Aircraft returned to m aintenance - 0 cas ualties
1.242e-3

K-8
Quantitative Event Tree 1: Engine Replacement Scenario Page 6
Enginem aintains thrus t
during take-offQ=5.000e-5
H igh thrus t is notrequired to m aintainplane airborne (e.g.no ic ing condit ions)
Q=5.000e-4
Engine fueldelivery s ys temdoes not leakQ=5.000e-4
Engine does notcatch fire
Q=1.000e-3
Other engines andairc raf t sy s tem s
cont inue to f unc t ion
Q=2.000e-4
Pilot has suf f ic ientskill to f ly and land
disabled plane
Q=1.000e-2
Cons equence Frequency
Page 1
Aircraft returned to m aintenance - 0 cas ualties
1.186e-2

K-9
Quantitative Event Tree 1: Engine Replacement Scenario Page 7
Enginem aintains thrus t
during take-offQ=5.000e-5
H igh thrus t is notrequired to m aintainplane airborne (e.g.no ic ing condit ions)
Q=5.000e-4
Engine fueldelivery s ys temdoes not leakQ=5.000e-4
Engine does notcatch fire
Q=1.000e-3
Other engines andairc raf t sy s tem s
cont inue to f unc t ion
Q=2.000e-4
Pilot has suf f ic ientskill to f ly and land
disabled plane
Q=1.000e-2
Cons equence Frequency
Page 1
Other Engine /aircraf t systems fail
Aircraft Lands Safely 5.050e-4
Aircraft Lands Safely
1.000e-7
Pilot cras hes Pilot c rashes plane on landing - 10 f atalities , 50 injuries
1.010e-9
Fuel leak
Engine Catches Fire
Other engine / aircraf t systems fail
Aircraft Lands Safely
2.498e-7
Dead Stick landing - passengers psychologically traum atised
4.998e-11
Pilot cras hes Cras h - 135 Fatalities 5.048e-13
Pilot does not is olate leak
D ead St ick landing - passengers psy chologically traum atised
2.524e-9
Other engine / aircraf t systems fail
Aircraft Lands Safely
2.526e-10
Pilot c rash lands planewith engine f ire - 40 f atalit ies , 65 injuries
5.003e-14
Pilot cras hes Cras h - 135 Fatalities
5.053e-16

K-10
Quantitative Event Tree 1: Engine Replacement Scenario Page 8
Enginem aintains thrus t
during take-offQ=5.000e-5
H igh thrus t is notrequired to m aintainplane airborne (e.g.no ic ing condit ions )
Q=5.000e-4
Engine fueldelivery s ys temdoes not leakQ=5.000e-4
Engine does notcatch fire
Q=1.000e-3
Other engines andairc raf t sy s tem s
continue to f unct ion
Q=2.000e-4
Pilot has suf f ic ientskill to f ly and land
disabled plane
Q=1.000e-2
Cons equence Frequency
Engine fa ils pas t no-abort s peed
Page 1
High thrus t required
Other engine / aircraf t systems fail
Other engine / aircraf t systems fail
Cras h - 135 Fatalities
5.048e-12
Cras h - 135 Fatalities
1.263e-11
Cras h - 135 Fatalities 2.527e-15
Aircraft Lands Safely
2.498e-8
Pilot cras hes Pilot c rashes plane on landing - 10 fatalities , 50 injuries
2.524e-10
Fuel leak
Engine Catches Fire
Other engine / aircraf t systems fail
Aircraft Lands Safely 1.249e-11
D ead St ick landing - passengers psy chologically traum at ised
2.498e-15
Pilot cras hes Cras h - 135 Fatalities
2.523e-17
Pilot does not is olate leak Dead Stick landing -
passengers psychologically traum atised
1.261e-13
Other engine / aircraf t systems fail
Aircraft Lands Safely 1.262e-14
Pilot c rash lands planewith engine f ire - 40 f atalit ies , 65 injuries
2.500e-18
Pilot cras hes Cras h - 135 Fatalities 2.525e-20

K-11
Quantitative Event Tree 1: Engine Replacement Scenario Page 9
Enginem aintains thrus t
during take-offQ=5.000e-5
H igh thrust is notrequired to m aintainplane airborne (e.g.no ic ing condit ions )
Q=5.000e-4
Engine fueldelivery s ys temdoes not leakQ=5.000e-4
Engine does notcatch fire
Q=1.000e-3
Other engines andairc raf t sy s tem s
continue to f unc tion
Q=2.000e-4
Pilot has suf f ic ientskill to f ly and land
disabled plane
Q=1.000e-2
Cons equence Frequency
Page 1
Other Engine /airc raf t systems fail
Aircraft Lands Safely 5.086e-4
Aircraft Lands Safely
1.007e-7
Pilot cras hes Pilot c rashes plane on landing - 10 fatalities , 50 injuries
1.017e-9
Fuel leak
Engine Catches Fire
Other engine / airc raf t systems fail
Aircraft Lands Safely
2.516e-7
Dead Stick landing - passengers psychologically traum atised
5.034e-11
Pilot cras hes Cras h - 135 Fatalities 5.085e-13
Pilot does not is o late leak
D ead St ick landing - passengers psy chologically traum at ised
2.542e-9
Other engine / airc raf t systems fail
Aircraft Lands Safely
2.544e-10
Pilot c rash lands planewith engine f ire - 40 f atalit ies , 65 injuries
5.039e-14
Pilot cras hes Cras h - 135 Fatalities
5.090e-16

K-12
Quantitative Event Tree 1: Engine Replacement Scenario Page 10
Engine
m aintains thrus tduring take-offQ=5.000e-5
H igh thrus t is notrequired to m aintainplane airborne (e.g.no ic ing condit ions )
Q=5.000e-4
Engine fueldelivery s ys temdoes not leakQ=5.000e-4
Engine does notcatch fire
Q=1.000e-3
Other engines andairc raf t sy s tem s
continue to f unc t ion
Q=2.000e-4
Pilot has suf f ic ientskill to f ly and land
disabled plane
Q=1.000e-2
Cons equence Frequency
Engine fa ils pas t no-abort s peed
Page 1
High thrus t required
Other engine / airc raf t systems fail
Other engine / airc raf t systems fail
Cras h - 135 Fatalities
5.085e-12
Cras h - 135 Fatalities
1.272e-11
Cras h - 135 Fatalities 2.545e-15
Aircraft Lands Safely
2.517e-8
Pilot cras hes Pilot c rashes plane on landing - 10 fatalities , 50 injuries
2.542e-10
Fuel leak
Engine Catches Fire
Other engine / airc raf t systems fail
Aircraft Lands Safely 1.258e-11
D ead Stick landing - passengers psy chologically traum at ised
2.516e-15
Pilot cras hes Cras h - 135 Fatalities
2.541e-17
Pilot does not is olate leak Dead Stick landing -
passengers psychologically traum atised
1.270e-13
Other engine / airc raf t systems fail
Aircraft Lands Safely 1.272e-14
Pilot c rash lands planewith engine f ire - 40 f atalit ies , 65 injuries
2.518e-18
Pilot cras hes Cras h - 135 Fatalities 2.544e-20

K-13
Assumptions for the Stator Vane Actuator Replacement Event Tree Human errors during stator vane actuator replacement are assumed to lead to one of the two following hazardous conditions:
• Partial or total loss of engine thrust
• Un-demanded engine surge
The conditions were selected based on the author’s discussions with staff at an aircraft jet engine manufacturer. The event tree is structured such that a probability can be assigned to each hazardous condition for each human error initiating sequence. In general, it is assumed that loss of thrust is the more likely of the two conditions.
Loss of thrust is considered to be most safety critical during the take-off phase of flight when the aircraft weight is greatest and the thrust demand is highest for the same reasons as described in Section 4.8.3, for engine replacement. A surge during and immediately following take-off is considered to be safety critical due to the potential to temporarily lose control of the aircraft while it is travelling down to runway at high speed or is in close proximity to terrain. As with the engine replacement event tree, the independent failure of another engine or system (e.g. aileron control) is considered as a possibility that may lead to a critical situation during the flight phase. A surge during landing could lead to a safety critical situation but this has not been modelled in the event tree since it is assumed that the engine malfunction would be detected in an earlier phase of flight and the engine shut down prior to landing.
The ability to recover from failures and land the aircraft safely is assumed to be dependent on the skill of the pilot and the presence of weather and other conditions that may make the pilot’s task more difficult.
The consequences of the pilot being unable to control the aircraft are considered to vary between a crash landing in which some passengers escape to total loss of the aircraft, crew and passengers. The potential for a fire to develop rapidly following crash landing is considered less like than for the engine replacement scenarios that include fuel leaks and engine fire.

K-14

K-15
Quantitative Event Tree 2: Stator Vane Actuator Replacement Page 1
AT applies incorrect procedure orfollows incorrect procedure when
installing Stator Vane Actuator
w=1.749e-1
AT Checks workfollowing reas s em bly
Q=7.200e-3
Malfunction of engineis revealed during tes t
Q=8.755e-2
Engine m aintainsthrus t during take-off
Q=2.000e-2
H igh thrust is not required tom aintain plane airborne (e.g.
no ic ing condit ions )
Q=5.000e-4
Engine does nots urge following
take-offQ=2.000e-3
Incorrect Ins tallation of Actuator
Page 2
AT Fails to Check Work
Page 3
Pas s es Tes t w ith Incorrect Engine Function
Engine s talls pas t no-abort s peed
Page 4
Page 5
High thrus t requiredPage 6

K-16
Quantitative Event Tree 2: Stator Vane Actuator Replacement Page 2
H igh thrus t is not required tom aintain plane airborne (e.g.
no ic ing condit ions)
Q=5.000e-4
Engine does nots urge follow ing
take-offQ=2.000e-3
Other engines andaircraft s ys tem s
continue to functionQ=2.000e-4
Pilot has suf f ic ient skill tof ly and land plane w ith
engine malfunction
Q=2.000e-2
Cons equence Frequency
Page 1
Aircraft returned to m aintenance - 0 cas ualties
1.736e-1

K-17
Quantitative Event Tree 2: Stator Vane Actuator Replacement Page 3
H igh thrus t is not required tom aintain plane airborne (e.g.
no ic ing condit ions)
Q=5.000e-4
Engine does nots urge follow ing
take-offQ=2.000e-3
Other engines andaircraft s ys tem s
continue to functionQ=2.000e-4
Pilot has suf f ic ient skill tof ly and land plane w ith
engine malfunction
Q=2.000e-2
Cons equence Frequency
Page 1
Aircraft returned to m aintenance - 0 cas ualties
1.149e-3

K-18
Quantitative Event Tree 2: Stator Vane Actuator Replacement Page 4
H igh thrust is not required tom aintain plane airborne (e.g.
no ic ing condit ions )
Q=5.000e-4
Engine does nots urge fo llowing
take-offQ=2.000e-3
Other engines andaircraft s ys tem s
continue to functionQ=2.000e-4
Pilot has suf f ic ient skill tof ly and land plane w ith
engine malfunction
Q=2.000e-2
Cons equence Frequency
Page 1
Other Engine /aircraft s ys tem s fa il
Aircraft Lands Safely 1.078e-4
Aircraft Lands Safely 2.113e-8
Pilot cras hes Pilot cras hes plane on landing - 10 fatalities , 50 in juries
4.313e-10
Engine Surge
Other engine / a ircraft s ys tem s fa il
Aircraft Lands Safely 2.117e-7
Plane cras hes on landing Pilot cras hes plane on
landing - 10 fatalities , 50 in juries
4.235e-11
Plane cras hes after take-off
Cras h - 135 Fatalities 8.644e-13
Plane cras hes after take-off
Cras h - 135 Fatalities 4.321e-9

K-19
Quantitative Event Tree 2: Stator Vane Actuator Replacement Page 5 H igh thrus t is not required tom aintain plane airborne (e.g.
no ic ing condit ions )
Q=5.000e-4
Engine does nots urge follow ing
take-offQ=2.000e-3
Other engines andaircraft s ys tem s
continue to functionQ=2.000e-4
Pilot has suf f ic ient skill tof ly and land plane w ith
engine malfunction
Q=2.000e-2
Cons equence Frequency
Page 1Other engine / aircraft s ys tem s fail
Cras h - 135 Fatalities 4.408e-10
Aircraft Lands Safely 2.159e-6
Pilot cras hes Pilot cras hes plane on landing - 10 fatalities , 50 injuries
4.407e-8

K-20
Quantitative Event Tree 2: Stator Vane Actuator Replacement Page 6
H igh thrus t is not required tom aintain plane airborne (e.g.
no ic ing condit ions )
Q=5.000e-4
Engine does nots urge follow ing
take-offQ=2.000e-3
Other engines andaircraft s ys tem s
continue to functionQ=2.000e-4
Pilot has suf f ic ient skill tof ly and land plane w ith
engine malfunction
Q=2.000e-2
Cons equence Frequency
High thrus t required
Page 1
Other engine / a ircraft s ys tem s fa il
Cras h - 135 Fatalities 1.102e-9
Cras h - 135 Fatalities 2.205e-13

K-21
Assumptions for the Thrust Reverser Door Replacement Event Tree
Human errors during thrust reverser door replacement are assumed to lead to one of the three following hazardous conditions:
• Thrust reverser door that spuriously deploys
• Thrust reverser door that jams open
The conditions were selected based on the author’s judgement and discussions with staff at an aircraft jet engine manufacturer. The event tree is structured such that a probability can be assigned to each hazardous condition for each human error initiating sequence. In general, it is assumed that the thrust reverser door jamming open is more likely of the two conditions.
A thrust reverser door spuriously opening is assumed to be critical any time during flight as well as during take-off and landing. The consequence of the thrust reverser door spuriously opening is assumed to be total loss of the aircraft crew and passengers. It is assumed that, because of the severity of this event, design provisions ensure that its probability is very low. The thrust reversers are normally deployed during landing. The scenario of the thrust reversers jamming open is assumed to occur when the pilot attempts to retract the thrust reversers after the aircraft has slowed down. If thrust reversers on one wing retract whereas the thrust reversers on the opposite wing jam open, and the aircraft is still at a relatively high speed, it is assumed that the aircraft may veer off the runway and possibly tip over and crash.
It is assumed that there is no potential for the pilot to recover from thrust reverser door spuriously opening during take-off, flight or landing. The potential for an accident to occur if the thrust reverser door jams open during landing will depend on the speed of the plane at the time that the doors are retracted and the skill of the pilot in keeping the aircraft on the runway during a thrust imbalance condition.

K-22

K-23
Quantitative Event Tree 3: Thrust Reverser Door Replacement Page 1
AT installs incorrectpart dur ing replacem entof thrust reverser door
w=1.310
A ME notices useof incorrect part
by A T
Q=4.116e-2
Malf unc t ion ofthrust rev erser isrev ealed during
testQ=8.755e-2
M alfunction of thrustreverser is detected
during pre-flight checkby flight crew
Q=2.000e-2
Thrus t rev erserdoor does notdeploy during
take-of f or f lightQ=1.000e-4
Thrust rev erserdoor does not jam
open on landing
Q=1.000e-2
Pilot has sufficient skillto keep plane level onrunway with reverse
thruster jam m ed open
Q=2.000e-1
Cons equence Frequency
Incorrect part ins talled AME does not
notice incorrectpart
Pas s es Tes t w ith Com prom is ed Thrus t revers er Fl ight crew do not
de tect incorrect thrust reverser opera tion
Thrus t Revers er Door Opens
Aircraft returned to m aintenance - 0 cas ualties
4.921e-2
Aircraft Lands Safely 9.349e-5
Cras h - 135 Fatalities 9.445e-9
Aircraft returned to m aintenance - 0 cas ualties
4.628e-3
Aircraft returned to m aintenance - 0 cas ualties
1.256
Thrus ter revers er door jam s open
Aircraft Lands Safely 7.555e-7
Plane leaves runway
Pilot c rashes plane on landing - 10 fatalities , 50 injuries
1.889e-7

K-24

K-25
Assumptions for the Cargo Bay Inspection Event Tree Human errors during cargo bay inspection are assumed to lead to one of the two following hazardous conditions:
• Cargo bay door latching mechanism that fails in flight
• Cargo bay fire that is not detected or suppressed
These conditions are based on assumptions of safety critical tasks that may be performed during cargo bay inspection. These tasks are speculative since there is no record of specific cargo bay inspection activities recorded in the Aircraft Maintenance Task database Appendix A.
The initiating event is an incorrect cargo bay check with assumed pre-existing defects of cargo bay door latches and fire safety equipment. It is assumed that the flight crew may be able to detect some types of problems with the cargo bay door latching mechanism from cockpit indications of door status. Inoperability of the cargo bay fire detection and suppression systems is assumed to be undetectable by the flight crew. A defect in the cargo bay door latching mechanism is assumed to be most critical if it results in sudden opening of the door at altitude. Sudden opening of the cargo bay door is assumed to rapidly depressurize the cargo bay and potentially damage aircraft systems if the cabin to cargo bay pressure difference causes structural failure of the floor.
It is assumed that the pilot would be unable to recover from a cargo fire that was either not detected or detected and not suppressed. The skill of the pilot is assumed to be a potentially important factor in recovering from a cargo bay door loss that resulted in consequential damage to aircraft systems from cabin floor structural failure.
The consequence of a cargo fire that is not detected or that is detected and not extinguished is assumed to be total loss of the aircraft, crew and passengers. The consequences of opening of the cargo bay door are assumed to depend on consequential damage to flight systems from pressure induced failures across the cabin floor. If flight systems are damaged it is assumed that the aircraft will be difficult to fly, but that a skilled pilot may be able to crash land the aircraft and limit casualties. If the pilot loses control of the aircraft it is assumed that the aircraft crew and passengers will be lost due to contact with terrain or in flight break-up. If the flight systems are undamaged it is assumed that the pilot can land the aircraft safely.

K-26

K-27
Quantitative Event Tree 4: Cargo Bay Inspection Page 1
AT enters the wronginformation onto job
c ompletion formfol lowing A-Chec k
ins pec tion of CargoBay
w =2.245e+2
AME checksdocum entation
AME checksdocum entationQ=5.130e-2
A ME noticesincorrect
information
Q=2.058e-2
Flight crew detectabnorm al cargo
bay status duringpre flight checks
Q=2.000e-1
C argo bay doorproperly
secured prior totake-of f
Q=5.000e-2
Flight sy s tem snot dam aged
by sudden lossof pressure
Q=1.000e-3
Fire doesnot ignite inCargo Bay
Q=1.600e-3
Fire detec tionand
suppress ionoperate
Q=1.000e-2
Pilot has suffic ients k i l l to fly and land
plane with damagedfl ight s ys tems
Q=2.000e-1
Consequence Frequency
Wrong Info on Form AME Fails to
check D ocum entation
Airc raf t returnedto m aintenance - 0 casualt ies
2.130e+2
Airc raf t returnedto m aintenance - 0 casualt ies
1.128e+1
AME fails to notice incorrect info
Airc raf t returnedto m aintenance - 0 casualt ies
1.896e-1
Flight Crew do not detect
Cargo Bay D oorIm properly Secured
A ircraf t Lands Safely
4.496e-2
A ircraf t Lands Safely
2.364e-3
Flight SystemsDamaged
Plane crasheson landing Plane crashes
-20 f atalit ies , 60injuries
1.893e-6Plane cras hes Cras h - 135
Fatalities4.733e-7
Fire ignites in Cargo Bay
Fire detection / suppression fails
A ircraf t Lands Safely 7.133e-5
Cras h - 135 Fatalities
7.206e-7
Fire ignites in Cargo Bay
Fire detection / suppression fails
A ircraf t Lands Safely 3.751e-6
Cras h - 135 Fatalities
3.789e-8
Fire ignites in Cargo Bay
Fire detection / suppression fails Cras h - 135
Fatalities3.792e-11
Plane crasheson landing Plane crashes
-20 f atalit ies , 60injuries
3.004e-9Plane cras hes Cras h - 135
Fatalities7.509e-10

K-28

K-29
Assumptions for the Avionics Inspection Event Tree Human errors during avionics inspection are assumed to lead to one of the two following hazardous conditions:
• Avionics that do not operate when required
• Avionics that provide incorrect information to flight crew
The conditions were selected based on the authors’ judgement. It is assumed that the role of the avionics is to provide information to the flight crew for instrument-based flying. In general, it is assumed that failure of the avionics to operate is the more likely of the two conditions.
An independent failure or defect in the avionics initiates the event sequence. It is assumed that pre-flight checks by the flight crew provides them an opportunity to detect if required avionics is operable and may allow some conditions of incorrect information to be detected. In the event that the pilot does not perform the checks or does not observe the malfunction, the aircraft would take-off. If during the flight or landing, weather or lighting conditions arise where the pilot will then attempt to use the avionics and it is providing incorrect information, the pilot may or may not become aware of the malfunction. If a back-up or alternate system is available that provides conflicting information the pilot may disregard both sources of information or select one of the two sources of information based on a ‘hunch’ as to which one is correct. If there is no alternate system working there is a good chance that the pilot may be unaware that the information is incorrect and fly the aircraft into terrain or lose control of the aircraft.
If the avionics fails to operate the pilot would rely on back-up or alternate avionics systems if they were available. If the back-up systems were not available the pilot would have to fly the aircraft without the required instruments.
When the back-up systems are not available the pilot may be able to safely land the aircraft, but this would depend on a combination of pilot skill, situational awareness and the specific difficulties of aircraft control and navigation at the time.
The consequences of the pilot being unable to control the aircraft are assumed to be loss of aircraft control or controlled flight into terrain. Both of these are expected to result in total loss of the aircraft, crew and passengers.

K-30

K-31
Quantitative Event Tree 5: Avionics Inspection – Event 1 Page 1 Avionics faultdetectable by
tes tw=9.000
AT follows incorrectprocedure during testand does not detect
fault
Q=5.228e-2
F light c rew detec tabnorm al
av ionics duringpre f light checksQ=3.000e-3
Avionics not requiredfor flight safety (e.g.night flighing, poor
weather)
Q=5.000e-2
Avionicsoperate
Q=1.000e-3
Avionicsprovide correct
in form ation
Q=3.000e-3
Back-up av ionicssy s tem sav ailable
Q=2.000e-4
Pilot has sufficientskill to fly and land
plane without avionics
Q=2.000e-1
Consequence Frequency
Avionics FaultAvionics Faultnot Detected
Aircraft returnedto m ain tenance- 0 casual ties
8.530
Flight Crew do not detect Avionics
required for flight
A ircraft returnedto m ain tenance- 0 casual ties
4.691e-1
Avionics do not operate
No back-up available
Aircraft LandsSafely
7.056e-8
Aircraft LandsSafely 1.129e-11
Pilot cras hes Cras h - 135 Fatalities
2.823e-12
Aircraft LandsSafely
1.341e-3
Aircraft LandsSafely 7.029e-5
Av ionics prov ide incorrec t inf orm at ion
Back-up provides correct in form ation
No back-up available
Pilot recognizesinformation is incorrec t Aircraft Lands
Safely1.692e-7
Pilot cras hes Cras h - 135 Fatalities 4.229e-8
Pilot unawareof incorrect inform ation Cras h - 135
Fatalities 4.230e-11

K-32

K-33
Assumptions for the Cockpit Mechanical Inspection Event Tree Human errors during cockpit mechanical inspection are assumed to lead to the following hazardous condition:
• Hydraulics do not operate correctly during take-off, flight or landing
The conditions were selected based on the authors’ judgement. The assumptions are that the hydraulics operate the control surfaces and other equipment that are key to flight safety.
An independent failure or defect in the hydraulics initiates the event sequence. It is anticipated that the pilot may be able to detect some instances of incorrect hydraulics operation during pre-flight checks. If the incorrect operation is detected during pre-flight checks it is assumed that the aircraft would be returned to maintenance. If the incorrect operation is not detected during the pre-flight checks the aircraft will commence take-off. An abnormal operation of the hydraulics during and immediately following take-off is assumed to be very critical. The pilot would have very little time to respond to abnormal operation to avoid a crash. After the aircraft has gained altitude a malfunction of the hydraulics is expected to be less critical. The pilot is expected to have more time to recover from the malfunction and attempt to use alternate systems to control the aircraft. A malfunction of hydraulics during landing is also expected to be critical due to the limited time available for the pilot to recover and avoid a crash.
The consequence of a hydraulics malfunction during take-off is expected to be catastrophic unless back-up systems can kick-in to recover in a very short time frame. A crash during take-off is assumed to result in total loss of the aircraft, crew and passengers. A malfunction of the hydraulics during flight may partially disable control of the aircraft such that it can continue to be flown with difficulty. A skilled pilot may be able to land the aircraft safely or crash land the aircraft such that casualties are limited. If there are additional failures of back-up systems then control of the aircraft is assumed to be lost, leading to total loss of the aircraft, crew and passengers. If the hydraulics fail during landing it is assumed that a skilled pilot may be able to recover to prevent a crash. If the pilot is unable to recover, the crash is assumed to be such that some of the passengers are able to escape or avoid fatal injuries.

K-34

K-35
Quantitative Event Tree 6: Mechanical Inspection Page 1 Hydraul ics Defect
DetectableDuring T est
w=9.000
AT follows incorrectprocedure during test
and does not detect fault
Q=5.228e-2
Hydrau l i csfunction correctly
during take-o ff
Q=5.000e-4
Hydraulicsoperate during
flightQ=1.000e-3
Back-uphydraul ic system s
ava i lab le
Q=1.000e-4
Hydraul icsopera te correctly
during land ing
Q=1.000e-4
Pilot has suf f ic ientsk ill to f ly and landplane with H y drulic
Malf unct ionQ=2.000e-1
Cons equence Frequency
Hydraulics Defect Hydraulic
Defect not Detected
Malfunction during take-off
Hydraulics fail
Back-up hydraulics fa il
A ircraf t returned to maintenance - 0 casualties
8.530
Aircraft Lands Safely 4.697e-1
Total los s of control Cras h - 135
Fatalities 4.702e-8
Aircraft Lands Safely
3.762e-4
Plane cras hes on landing Plane cras hes
-20 fatalities , 60 in juries
9.404e-5
Hydraulics fa il during landing
Passengers psychogically traumatized by near miss
3.758e-5
Plane cras hes on landing Plane cras hes
-20 fatalities , 60 in juries
9.395e-6
Aircraft Lands Safely
1.882e-4
Plane cras hes after take-off Cras h - 135
Fatalities 4.704e-5
Back-up hydraulics fa il Cras h - 135
Fatalities2.352e-8

K-36

K-37
Assumptions for the Avionics Adjustment Event Tree Human errors during avionics adjustment are assumed to lead to the following hazardous condition:
• Hydraulics do not operate correctly during take-off, flight or landing
The conditions are essentially similar to those for the cockpit mechanical inspecting event tree described in Section 4.8.8, except that the hydraulics are considered to be out of calibration, instead of totally failed or malfunctioning.
The implications of this difference is that the flight crew are assumed not to detect the abnormality during pre-flight checks, since it will be more subtle, and that the severity of effect on flight control will be less. As a result, only calibration errors that affect flight control during take-off are considered capable of leading to total loss of the aircraft, crew and passengers. Calibration errors that affect control during other phases of flight are assumed to lead to crashes in which some passengers escape injury or a safe landing under the control of a skilled pilot.

K-38
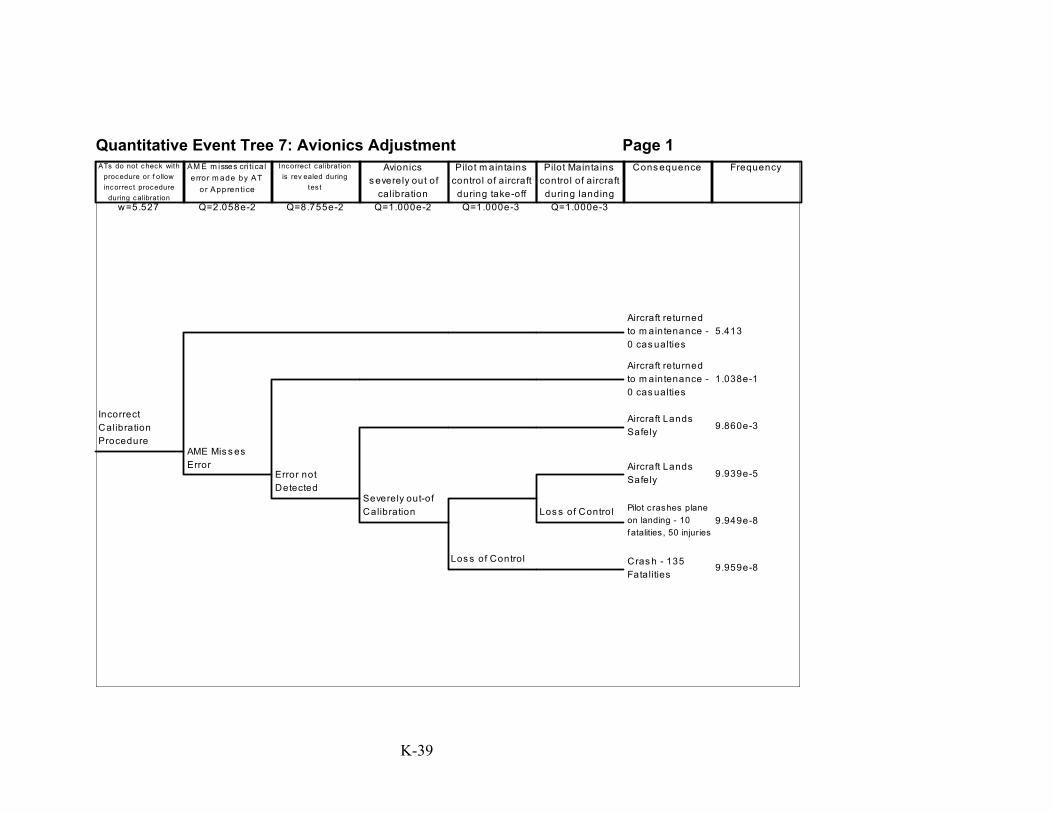
K-39
Quantitative Event Tree 7: Avionics Adjustment Page 1 ATs do not check with
procedure or f ollowincorrec t procedure
during calibrat ionw=5.527
AM E m isses cri tica le rror m ade by AT
or Apprentice
Q=2.058e-2
Incorrec t calibrat ionis rev ealed during
tes t
Q=8.755e-2
Avionicss everely out of
calibrationQ=1.000e-2
Pilot m aintainscontrol of aircraft
during take-offQ=1.000e-3
Pilot Maintainscontrol of aircraft
during landingQ=1.000e-3
Cons equence Frequency
Incorrect Calibration Procedure
AME Mis s es Error
Error not Detected
Severely out-of Calibration
Aircraft returned to m aintenance - 0 cas ualties
5.413
Aircraft returned to m aintenance - 0 cas ualties
1.038e-1
Aircraft Lands Safely 9.860e-3
Aircraft Lands Safely 9.939e-5
Los s of Control
Los s of Control Pilot c rashes plane on landing - 10 f atalities , 50 injuries
9.949e-8
Cras h - 135 Fatalities
9.959e-8

K-40

K-41
Assumptions for the Troubleshooting Door Sensor Event Tree Human errors during the trouble shooting of door sensors are assumed to lead to one of the two following hazardous conditions:
• Aircraft gradually depressurizes due to improper door seal
• Rapid aircraft depressurization due to door opening at high altitude
The conditions were selected based on a review of transportation safety board data and the authors’ evaluation of possible hazardous scenarios. The event tree is structured such that rapid depressurization is an evolution of an incipient condition of gradual pressure loss.
The event tree is initiated by a door sensor failure that is independent of the troubleshooting event. The flight crew is assumed to be capable of detecting the door sensor failure due to abnormal or inconsistent door status indications. A latent failure of the door seal or latches is needed to further develop the sequence into an accident. The failure of the door seal and latches may lead to leakage and gradual loss of cabin pressure or may progress to total failure of the door securing mechanism resulting in rapid depressurization of the cabin. If cabin depressurization occurs the event may become more serious if the cabin or cockpit oxygen supplies are not available. Loss of cabin oxygen supply will affect the passengers and loss of cockpit oxygen supply with affect the flight crew.
The skill of the pilot is not assumed to be a major factor in the event sequence, although rapid action by the pilot to reduce altitude on loss of pressure may reduce the severity of the event. Pilot physiology under loss of pressure condition is expected to be important and is integrated in to the loss of cockpit oxygen supply event. This event assumes that loss of oxygen will lead to the pilot losing consciousness. The consequences of the event sequences are determined by the effect of depressurization. Gradual depressurization of the cabin in the absence of oxygen supply is expected to lead to non-fatal injuries of some passengers who may loose consciousness. A sudden depressurization is expected to lead to greater injuries from loss of consciousness plus fatal injuries to any passengers extracted from the aircraft. Loss of oxygen supply to the cockpit is assumed to lead to loss of control of the aircraft if the pilot loses consciousness. The results are assumed to be total loss of the aircraft, crew and passengers.

K-42

K-43
Quantitative Event Tree 8: Troubleshooting Door Sensor Page 1
DoorSens orFailure
w =1.000e+1
The ATs miss escue during
troubleshootingEx ternal Door
Sens or
Q=1.764e-2
AME detec tsc rit ical error
m ade by AT orApprent ice
Q=2.058e-2
Flight crew detectabnorm al door
sensor during preflight checks
Q=1.000e-1
Door seal andlatch function
correctly
Q=5.000e-2
Plane retainspressure athigh altitude
Q=3.000e-1
Plane D oorrem ains secureat high alt itude
Q=1.000e-4
Oxy gen supplysy s tem sav ailable
Q=5.000e-3
C ockpit oxy gensy stem sav ailble
Q=2.000e-3
Consequence Frequency
Door Sens orFailure
Airc raf t returnedto m aintenance - 0 casualt ies
9.824
Fault not detected AME Fails to
Detect Error Flight Crew do not detect
D oor latch / sealm alf unc t ions
Airc raf t returnedto m aintenance - 0 casualt ies
3.267e-3
plane looses pressure
Loss of cabin oxygen
A ircraf t Lands Safely
5.407e-6
Passegers col lapse - 15 in juries
2.717e-8Pilot unconc ious- plane crashes Cras h - 135
Fatalities5.445e-11
A ircraf t Lands Safely
3.449e-4
A ircraf t Lands Safely
1.271e-5
plane door detaches
Loss of cabin oxygen
Sudden depressurization - 6 fatalities, 30 injuries
2.717e-12Pilot unconc ious- plane crashes Cras h - 135
Fatalities5.445e-15
Pilot unconc ious- plane crashes Cras h - 135
Fatalities 1.084e-8
Sudden depressurization - 6 fatalities, 30 injuries
5.407e-10Pilot unconc ious- plane crashes Cras h - 135
Fatalities1.084e-12
Airc raf t returnedto m aintenance - 0 casualt ies
1.728e-1

K-44

K-45
Assumptions for the Service Check Event Tree Human errors during the service check are assumed to lead to the following hazardous conditions:
• Tire rupture during take-off or landing
The conditions were selected based on the authors’ evaluation of possible hazardous scenarios. The event tree is structured such that a probability can be assigned to tire rupture during either the take-off or landing phase.
The event sequences are initiated by low tire pressure that may be due to a tire defect or wear. Tire rupture is assumed to occur during take-off or landing.
The ability to recover from the tire rupture is assumed to depend in part on the skill of the pilot in maintaining control of the aircraft as it travels down the runway and whether damage to the aircraft may occur once the landing gear is stowed (e.g. fire occurs that is not detected).
The consequences of the pilot being unable to control the aircraft is assumed to result in a crash in which some passengers can escape the aircraft. A crash during take-off is assumed to be more serious because the aircraft is accelerating and fully laden with combustible fuel. It is expected that the development of a serious fire while airborne shortly after takeoff could lead to the total loss of the aircraft if the fire is not detected and extinguished in time.

K-46

K-47
Quantitative Event Tree 9: General Service Check Page 1 Tire leaks
and has verylow pres s urew=1.000e+2
The ATchecks tiresand adds airQ=1.764e-2
Ground crewdetect low
tire inflationQ=3.000e-1
Tire does notfa il on
take-offQ=5.000e-2
Pilot has sufficientskill to m aintain
control of aircraft ontake-off
Q=2.000e-3
Tire does notignite follow ing
failure
Q=5.000e-4
Tire does notfa il on
landingQ=1.000e-2
Pilot has sufficentskill to m aintain
control of aircraft onlanding
Q=2.000e-3
Consequence Frequency
Tire has very low pres s ure
AT forgets to check tire Ground crew
do not detect
Tire fails on take-off
A i rcra ft re turnedto m aintenance- 0 casua l ties
9.824e+1
Aircraft re turnedto m aintenance- 0 casua l ties
1.235
Aircraft LandsSafely 4.977e-1
Aircraft LandsSafely
2.613e-2
Tire fails on landing
Aircraft LandsSafely
5.017e-3Pilot loses control of aircraf t
Pilot c rashes plane on landing - 10 f atalit ies , 50 injuries
1.005e-5
Pilot cras hes aircraft Plane crashes
-20 fatalities , 60 injuries
5.292e-5
Tire ignites Cras h - 135 Fatalities 1.320e-5
Tire fails on landing
Aircraft LandsSafely 2.634e-4
Pilot loses control of aircraf t Plane crashes
-20 fatalities , 60 injuries
5.279e-7

K-48

K-49
Assumptions for the Brake Fluid Top-up Event Tree Human errors during brake fluid replacement are assumed to lead to one of the two following hazardous conditions:
• Brakes fail during taxiing
• Brakes fail during landing
The conditions were selected based on a review of transportation safety board data and the authors’ evaluation of possible hazardous scenarios.
Brake failure during landing is considered to be the more serious condition due to higher aircraft velocity. The pilot is assumed to have a role in maintaining control of the aircraft during brake failure conditions. During taxiing the pilot must avoid collision with other aircraft or objects if the brakes fail. During landing the pilot must attempt to limit the consequences of runway overrun.
The consequences of brake failure are assumed to be limited to damage to the aircraft. The assessment is based in part on Transportation Safety Board data (TSBC, 2000) that show no fatalities for 23 runway overrun events that occurred over a ten-year period.

K-50

K-51
Quantitative Event Tree 10: Fluids Replenishment Page 1
Low flu idlevel inbrakes
w=2.000
The AT checksthe brake f luidlev el and adds
f luidQ=1.764e-2
Brakes donot fail during
taxiingQ=5.000e-3
No s tationaryobstacles in
path of airc raf t
Q=1.000e-3
Aircraf t does notenter runway
without c learance
Q=5.000e-2
Aircraf t landingon runway is ableto abort landing
Q=2.000e-2
Brakes do notf ail during
landing
Q=2.000e-3
Pilot is ableto avoid
obs taclesQ=5.000e-2
Consequence Frequency
Low brake flu id level
AT f orgets to check brake f luid
Brakes fail
A i rcraft re turnedto m aintenance- 0 casua l ties
1.965
Aircraft LandsSafely
3.503e-2
Aircraft re turnedto m aintenance- 0 casua l ties
1.671e-4
Brakes Fail
Aircraft overruns runway - dam age to aircraft, passengers startled
6.670e-5Aircraft cras hes Pilot crashes plane on
landing - 10 fatalities, 50 injuries
3.510e-6
Object in path
Aircraft re turnedto m aintenance- 0 casua l ties
1.676e-7
Aircraft strikes structure or other aircraft during taxiing
8.820e-9
Runway incurs ion
Brakes Fail
Aircraft overruns runway - dam age to aircraft, passengers startled
3.181e-7Aircraft cras hes Pilot crashes plane on
landing - 10 fatalities, 50 injuries
1.674e-8
A ircraf t unable to A bort Collision on runway -
80 fatalities, 50 injur ies
1.762e-7
Aircraft re turnedto m aintenance- 0 casua l ties
8.618e-6
Brakes Fail
Aircraft overruns runway - dam age to aircraft, passengers startled
1.641e-8Aircraft cras hes Pilot crashes plane on
landing - 10 fatalities, 50 injuries
8.635e-10

K-52

Appendix L
Risk Summary Tables


L-1
Table L-1: Probabilities for Consequences for Initiating Events in the Engine Replacement Scenario
Fatigue Contribution
Risk without AME / AT
fatigue(Eqf per
100,000 flight hours)
Risk with AME / AT
fatigue(Eqf per 100,000
flight hours)
Ratio of risk with fatigue to
risk without fatigue
Without Fatigue
With Fatigue
1 The AME/ATs misinterpret data on job card during planning of Engine Replacement - Incorrect engine replaced 0.001205059 0.0201417 16.71428571 1.21584394 1.214506
2 The AME communicates conflicting/ambiguous information to the ATs during planning of Engine Replacement - Incorrect engine replaced 0.001687083 0.02988054 17.71137026 1.70218152 1.8017397
3 The AME forgets to provide an important piece of information to ATs during planning of Engine Replacement - e.g modification status of engine not provided 0.017900584 0.36781212 20.5474926 18.0607891 22.178368
4AME elects to perform tasks that he/she does not have time for during planning of Engine Replacement - as a result the engine is not installed correctly and the work is not checked
0.007458577 0.17981926 24.10905798 7.52532878 10.842757
5 The ATs do not check with the procedure for a non-routine job during planning of Engine Replacement - as a result the engine is not installed correctly 0.031326022 0.45363495 14.48109002 31.6063809 27.35332
6The ATs neglect to check the part numbers and subsequently obtain an incorrect part from stores during planning of Engine Replacement or AT Installs Incorrect Part - as a result the engine will not function correctly
0.038784599 0.57351445 14.78716989 39.1317097 34.581825
7 AT reconnects incorrect hose, coupling, cable during Replacement of Engine - as a result the engine will not function correctly 3.61026E-06 0.00029431 81.51903185 0.00364257 0.017746
8 The ATs do not follow procedure during replacement of Engine - as a result the engine is not installed correctly 0.000681785 0.02942309 43.15597494 0.68788654 1.7741559
9 4. AT misses a step in the procedure during Replacement of Engine - as a result the engine will not function correctly 6.01219E-06 0.00042884 71.32915287 0.006066 0.0258585
10 4. AT damages fastener, connector, coupling, clamp, interface, part during Replacement of Engine - as a result the engine integrity is compromised 7.08326E-07 1.2029E-05 16.98221583 0.00071467 0.0007253
11 AT damages surrounding equipment during Replacement of Engine - as a result the integrity of surrounding equipmentis compromised 2.8707E-08 6.0607E-07 21.11230851 2.8964E-05 3.654E-05
12 AT forgets to record important information during or after Engine Replacement - Unflightworthy Plane released from maintenance 2.94501E-05 0.00173274 58.83638709 0.02971371 0.1044809
13 AT enters the wrong information onto job completion form after Engine Replacement - Unflightworthy aircraft released from maintenance 2.94501E-05 0.00173274 58.83638709 0.02971371 0.1044809
Total Risk for Engine Replacement Maintenance Errors 0.099112968 1.65842737 16.73269811 100 100
Summary of Event Sequence Risk for Each Initiating Event for Engine Replacement Task
No.
Event Sequence Risk
Initiating Event Error
Percent Contribution of Initiating Event Risk to
Total Task Risk

L-2
Table L-2: Probabilities for Consequences for Initiating Events in the Stator Vane Actuator Replacement Scenario
Fatigue Contribution
Risk without AME / AT
fatigue(Eqf per
100,000 flight hours)
Risk with AME / AT
fatigue(Eqf per 100,000
flight hours)
Ratio of risk with fatigue to
risk without fatigue
Without Fatigue
With Fatigue
1 The AME/ATs misinterpret data on job card during planning of Stator Vane Actuator Replacement - Incorrect engine maintained 8.69321E-07 1.453E-05 16.71428571 0.09934125 0.1047114
2 The AME communicates conflicting / ambiguous information to the ATs during planning of Stator Vane Actuator Replacement - Incorrect engine maintained 1.21705E-06 2.1556E-05 17.71137026 0.13907774 0.155341
3The AME forgets to provide an important piece of information to the ATs during planning of Stator Vane Actuator Replacement - e.g. modification status of engine not provided
5.821E-06 8.5054E-05 14.61155029 0.66519198 0.6129425
4The AME elects to perform part of Stator Vane Actuator Replacement procedure when the AME does not have time for this task - as a result the actuator is not installed correctly and the work is not checked
0.000105231 0.00253703 24.10905798 12.0252489 18.283138
5 The ATs do not check with the procedure during planning of Stator Vane Actuator Replacement - this results in an instalation error 0.000441971 0.00640022 14.48109002 50.5060453 46.123372
6The ATs neglect to check the part numbers and subsequently obtain an incorrect part from stores or AT installs incorrect part for Stator Vane Actuator Replacement
0.000276005 0.00408133 14.78716989 31.5403151 29.412201
7 AT reconnects incorrect hose coupling, cable Installing Stator Vane Actuator 3.15889E-07 7.7889E-06 24.65699112 0.03609809 0.0561307
8 AT follows incorrect procedure when Installing Stator Vane Actuator 1.68265E-06 3.8437E-05 22.84336328 0.19228373 0.2769995
9 AT misses a step in procedure when Installing Stator Vane Actuator 1.03948E-06 2.2427E-05 21.57486723 0.11878568 0.1616176
10 AT damages fastener, connector, coupling, clamp, interface or part when Installing Stator Vane Actuator 3.01105E-06 1.5467E-05 5.136596147 0.34408579 0.1114599
11 AT damages surrounding equipment when Installing Stator Vane Actuator 1.60589E-06 6.1866E-06 3.85244711 0.18351242 0.044584
12 AT forgets to record important information during or after Installing Stator Vane Actuator 1.06099E-05 0.00018882 17.79619116 1.21244473 1.3607096
13 AT enters the wrong information on to the job completion form after Installing the Stator Vane Actuator 2.57062E-05 0.00045747 17.79619116 2.93756929 3.2967925
Total Risk for Stator Vane Actuator Replacement Maintenance Errors 0.000875086 0.01387631 15.85709278 100 100
No.
Summary of Event Sequence Risk for Each Initiating Event for Stator Vane Actuator Replacement Task
Event Sequence Risk
Initiating Event Error
Percent Contribution of Initiating Event Risk to
Total Task Risk

L-3
Table L-3: Probabilities for Consequences for Initiating Events in the Thrust Reverser Door Replacement Scenario
Fatigue Contribution
Risk without AME / AT
fatigue(Eqf per
100,000 flight hours)
Risk with AME / AT
fatigue(Eqf per 100,000
flight hours)
Ratio of risk with fatigue to
risk without fatigue
Without Fatigue
With Fatigue
1 The AME/ATs misinterpret data on job card during planning of Thrust Reverser Door Replacement - Incorrect thrust reverser door replaced 9.51289E-06 0.000159 16.71428571 2.01576516 2.6220013
2The AME communicates conflicting/ambiguous information to the ATs during planning of Thrust Reverser Door Replacement - Incorrect thrust reverser door replaced
1.3318E-05 0.00023588 17.71137026 2.82207122 3.8897821
3The AME forgets to provide an important piece of information to ATs during planning of Thrust Reverser Door Replacement - Incorrect maintenance performed
5.66558E-05 0.00116413 20.5474926 12.0052554 19.197089
4 AME elects to perform tasks that he/she does not have time for during planning of Thrust Reverser Door Replacement - Incorrect maintenance performed 2.36066E-05 0.00056913 24.10905798 5.00218976 9.3852435
5The ATs do not check with the procedure for a non-routine job during planning or do not follow procedure during replacement of Thrust Reverser Door Replacement - Incorrect maintenance performed
0.000151574 0.0021201 13.98726446 32.1182267 34.961454
6The ATs neglect to check the part numbers and subsequently obtain an incorrect part from stores or install incorrect part during Thrust Reverser Door Replacement - Incorrect maintenance performed
5.05256E-06 0.00024701 48.88819432 1.07062868 4.0733151
7 AT reconnects incorrect hose, coupling, cable during Thrust Reverser Door Replacement - Incorrect maintenance performed 1.14266E-08 9.3148E-07 81.51903185 0.00242127 0.0153606
8 AT misses a step in the procedure during Thrust Reverser Door Replacement - Incorrect maintenance performed 1.90287E-08 1.3573E-06 71.32915287 0.00403215 0.0223825
9 AT damages fastener, connector, coupling, clamp, interface, part during Thrust Reverser Door Replacement 0.00013231 0.00067962 5.136596147 28.0362563 11.207289
10 AT damages surrounding equipment during Thrust Reverser Door Replacement 7.05653E-05 0.00033981 4.815558888 14.9526701 5.6036447
11 AT forgets to record important information during or after Thrust Reverser Door Replacement 4.6496E-06 0.00027357 58.83638709 0.98524162 4.5112188
12 AT enters the wrong information onto job completion form during Thrust Reverser Door Replacement 4.6496E-06 0.00027357 58.83638709 0.98524162 4.5112188
Total Risk for Cock Pit Mechanical A-Check Errors 0.000471925 0.00606412 12.8497553 100 100
Summary of Event Sequence Risk for Each Initiating Event for Thrust Reverser Door Replacement Task
No.
Event Sequence Risk
Enabling Event Error
Percent Contribution of Initiating Event Risk to
Total Task Risk

L-4
Table L-4: Probabilities for Consequences for Initiating Events in the Avionics Inspection Scenario
Fatigue Contribution
Risk without AME / AT
fatigue(Eqf per
100,000 flight hours)
Risk with AME / AT
fatigue(Eqf per 100,000
flight hours)
Ratio of risk with fatigue to
risk without fatigue
Without Fatigue
With Fatigue
1 Avionic components not inspected due to AME/ATs misinterpreting data on job card 2.62405E-07 1.3266E-06 5.055555556 0.00917546 0.0097381
2 Avionic components not inspected due to the AME communicates conflicting/ambiguous information to the ATs 3.67367E-07 1.968E-06 5.357142857 0.01284565 0.0144467
3 Avionic components not inspected due to the AME forgetting to provide an important piece of information to ATs 1.53069E-07 5.8312E-07 3.80952381 0.00535235 0.0042805
4 Avionic components not inspected due to the AME electing to perform tasks that he/she does not have time for 1.53069E-07 9.6215E-07 6.285714286 0.00535235 0.0070628
5Avionic components not inspected due to the ATs do not check with the procedure for a non-routine job (e.g. A-check for aircraft with unfamiliar modification status)
6.42892E-07 2.4272E-06 3.775510204 0.02247989 0.0178176
6 Avionic components not inspected due to the AT missing defect during inspection 2.50013E-07 1.2391E-06 4.956268222 0.00874218 0.0090961
7 Avionic components not inspected due to the AT inspecting wrong equipment 2.50013E-07 1.0627E-06 4.250728863 0.00874218 0.0078012
8 AT forgets to replace equipment removed during the inspection process during A-Check inspection of Avionics 9.82889E-06 0.00061774 62.8491402 0.34368528 4.5346028
9 AT damages equipment during the inspection process during A-Check inspection of Avionics 0.002832614 0.01261989 4.455210944 99.0475211 92.638361
10 AT follows incorrect procedure during test and does not detect fault 5.7155E-06 2.359E-05 4.127403156 0.19985308 0.1731676
11 AT follows incorrect procedure during test and does not detect fault 1.92868E-06 7.4392E-06 3.857142857 0.06743966 0.0546085
12 Avionic component fault is not detected due to the AT entering incorrect command during A-Check testing 1.92868E-06 5.6876E-06 2.948979592 0.06743966 0.0417509
13 AT forgets to record important information during A-Check inspection of Avionics 2.87946E-06 0.00016942 58.83638709 0.1006856 1.2436332
14 AT enters the wrong information onto job completion form during A-Check inspection of Avionics 2.87946E-06 0.00016942 58.83638709 0.1006856 1.2436332
Total Risk for Avionics A-Check Errors 0.002859853 0.01362275 4.763443529 100 100
Summary of Event Sequence Risk for Each Initiating Event for A-Check - Avionics Task
No.
Event Sequence Risk
Initiating/Enabling Event Error
Percent Contribution of Initiating Event Risk to
Total Task Risk

L-5
Table L-5: Probabilities for Consequences for Initiating Events in the Mechanical Inspection Scenario
Fatigue Contribution
Risk without AME / AT
fatigue(Eqf per
100,000 flight hours)
Risk with AME / AT
fatigue(Eqf per 100,000
flight hours)
Ratio of risk with fatigue to
risk without fatigue
Without Fatigue
With Fatigue
1 Hydraulic components not inspected/tested due to AME/ATs misinterpreting data on job card 0.000415476 0.00210046 5.055555556 0.08878122 0.0986896
2 The AME communicates conflicting/ambiguous information to the ATs resulting in hydraulics components not being tested or inspected 0.000581666 0.00311607 5.357142857 0.12429371 0.1464076
3 The hydraulic are not tested/inspected correctly because AME forgets to provide an important piece of information to ATs 0.000242361 0.00092328 3.80952381 0.05178905 0.04338
4 AME elects to perform A-Check tasks that he/she does not have time for and misses defects during inspection 0.000242361 0.00152341 6.285714286 0.05178905 0.0715771
5The ATs do not check with the procedure for a non-routine A-check (e.g. unfamiliar modification status of aircraft) and misses defect due to resulting incomplete inspection
0.001017916 0.00384315 3.775510204 0.217514 0.1805694
6 AT Misses Defect During Inspection 0.000395856 0.00196197 4.956268222 0.08458878 0.0921826
7 AT inspects wrong equipment resulting in defect inhydraulics being missed 0.000395856 0.00168268 4.250728863 0.08458878 0.0790601
8 AT forgets to replace equipment removed during the inspection process during A-Check inspection of Cock Pit Mechanical 4.66874E-05 0.00293426 62.8491402 0.00997643 0.1378656
9 AT damages hydraulic equipment during the inspection process during A-Check inspection of Cock Pit Mechanical 0.448569939 1.9984737 4.455210944 95.8529525 93.897711
10 AT follows incorrect procedure during testing and does not detect hydraulics fault 0.009049584 0.03735128 4.127403156 1.93376605 1.7549391
11 AT misses a cue during test procedure leading to hydraulics fault remaining undetected 0.003053748 0.01177874 3.857142857 0.652542 0.5534207
12 AT enters incorrect command during procedure leading to hydraulics fault remaining undetected 0.003053748 0.00900544 2.948979592 0.652542 0.423118
13 AT forgets to record important information during A-Check inspection of Cock Pit Mechanical 0.000455989 0.02682872 58.83638709 0.0974382 1.2605395
14AT enters the wrong information onto job completion form during A-Check inspection of Cock Pit Mechanical resulting in the aircraft being erroneously declared flightworthy
0.000455989 0.02682872 58.83638709 0.0974382 1.2605395
Total Risk for Cock Pit Mechanical A-Check Errors 0.467977174 2.12835188 4.547982243 100 100
Summary of Event Sequence Risk for Each Initiating Event for A-Check - Cock Pit Mechanical Task
No.
Event Sequence Risk
Enabling Event Error
Percent Contribution of Initiating Event Risk to
Total Task Risk

L-6
Table L-6: Probabilities for Consequences for Initiating Events in the Avionics Adjustment Scenario
Fatigue Contribution
Risk without AME / AT
fatigue(Eqf per
100,000 flight hours)
Risk with AME / AT
fatigue(Eqf per 100,000
flight hours)
Ratio of risk with fatigue to
risk without fatigue
Without Fatigue
With Fatigue
1 AME/ATs misinterpret data on job card during planning for avionics addjustment - Avionics adjustment not performed 0.003347568 0.01692382 5.055555556 27.5884643 25.766214
2 The AME communicates conflicting/ambiguous information to the ATs during planning for avionics addjustment - Avionics adjustment not performed 0.004686595 0.02510676 5.357142857 38.62385 38.224603
3 The AME forgets to provide an important piece of information to ATs during planning for avionics addjustment- e.g modification status of avionics not provided
0.001952748 0.00743904 3.80952381 16.0932708 11.325808
4AME elects to perform tasks that he/she does not have time for during planning for avionics adjustment - as a result the calibration is not performed correctly and the work is not checked
0.001952748 0.01227442 6.285714286 16.0932708 18.687584
5 The ATs do not check with the procedure or follow incorrect procedure during calibration 1.5435E-05 0.00074653 48.36630704 0.12720532 1.1365863
6 The ATs neglect to check the part/tool numbers and subsequently obtain an incorrect part from stores 0.000170973 0.002748 16.07270532 1.40904633 4.1837762
7 AT misses a cue during calibration 4.82554E-07 1.527E-05 31.6431386 0.00397689 0.0232476
8 AT enters incorrect command during calibration 6.56809E-07 3.2125E-05 48.91141911 0.00541299 0.0489105
9 AT forgets to record important information during or following calibration - unflightworthy aircraft released from maintenance 3.36732E-06 0.00019812 58.83638709 0.02775121 0.3016352
10 AT enters the wrong information onto job completion form following calibration - unflightworthy aircraft released from maintenance 3.36732E-06 0.00019812 58.83638709 0.02775121 0.3016352
Total Risk for Avionics Adjustment Errors 0.012133941 0.0656822 5.413096954 100 100
No.
Summary of Event Sequence Risk for Each Initiating Event for A-Check - Avionics Adjustment TaskEvent Sequence Risk
Initiating/Enabling Event Error
Percent Contribution of Initiating Event Risk to
Total Task Risk

L-7
Table L-7: Probabilities for Consequences for Initiating Events in the Troubleshooting Door Sensor Scenario
Fatigue Contribution
Risk without AME / AT
fatigue(Eqf per
100,000 flight hours)
Risk with AME / AT
fatigue(Eqf per 100,000
flight hours)
Ratio of risk with fatigue to
risk without fatigue
Without Fatigue
With Fatigue
1 AME/ATs interpret data on job card incorrectly 9.27158E-05 0.00046873 5.055555556 15.9972759 16.370047
2 AME communicates conflicting/ambiguous information to the ATs 0.000129802 0.00069537 5.357142857 22.3961862 24.285234
3 AME forgets to provide an important piece of information to ATs 5.40842E-05 0.00020604 3.80952381 9.33174426 7.1956249
4 AME elects to perform tasks that he/she does not have time for 5.40842E-05 0.00033996 6.285714286 9.33174426 11.872781
5 ATs do not check with the procedure for a non-routine job 0.000227154 0.00085762 3.775510204 39.1933259 29.951789
6 AT follows incorrect troubleshooting procedure 1.81799E-06 5.8353E-05 32.09734039 0.31367725 2.0379197
7 AT misses cue during troubleshooting procedure 1.55828E-06 1.9871E-05 12.75218659 0.26886622 0.6939943
8 AT enters incorrect command during troubleshooting procedure 1.55828E-06 1.4194E-05 9.108704706 0.26886622 0.4957102
9 AT follows incorrect procedure during testing 4.61785E-06 6.3014E-05 13.64570023 0.79676765 2.2007085
10 AT misses cue during troubleshooting of External Door Sensor - Door sensor fault not identified 1.55828E-06 1.9871E-05 12.75218659 0.26886622 0.6939943
11 AT enters incorrect command during testing 1.55828E-06 1.5193E-05 9.74968763 0.26886622 0.5305935
12 Unflightworthy aircraft released from maintenance due to the AT forgets to record important information 4.53172E-06 5.2565E-05 11.59940668 0.78190685 1.8358018
13 Unflightworthy aircraft released from maintenance due to the AT enters the incorrect information onto job completion form 4.53172E-06 5.2565E-05 11.59940668 0.78190685 1.8358018
Total Risk for Troubleshoot Door Sensor Maintenance Errors 0.000579573 0.00286334 4.940432861 100 100
Summary of Event Sequence Risk for Each Initiating Event for Troubleshooting Door Sensor
No.
Event Sequence Risk
Enabling Event Error
Percent Contribution of Initiating Event Risk to
Total Task Risk

L-8
Table L-8: Probabilities for Consequences for Initiating Events in the Cargo Bay Inspection Scenario
Fatigue Contribution
Risk without AME / AT
fatigue(Eqf per
100,000 flight hours)
Risk with AME / AT
fatigue(Eqf per 100,000
flight hours)
Ratio of risk with fatigue to
risk without fatigue
Without Fatigue
With Fatigue
1 Cargo Bay components not inspected due to AME/ATs misinterpreting data on job card 2.06742E-05 0.00010452 5.055555556 0.08997515 0.0240774
2 Cargo Bay components not inspected due to the AME communicating conflicting/ambiguous information to the ATs 2.89438E-05 0.00015506 5.357142857 0.12596521 0.0357192
3 Cargo Bay components not inspected due to the AME forgetting to provide an important piece of information to ATs 1.20599E-05 4.5943E-05 3.80952381 0.0524855 0.0105835
4 Cargo Bay components not inspected due to the AME electing to perform tasks that he/she does not have time for 1.20599E-05 7.5805E-05 6.285714286 0.0524855 0.0174627
5 Cargo Bay components not inspected due to the ATs do not check with the procedure for a non-routine job 5.06517E-05 0.00019124 3.775510204 0.22043912 0.0440537
6 Cargo Bay component failure not detected due to AT missing defect during inspection 1.96979E-05 9.7628E-05 4.956268222 0.08572632 0.0224899
7 Cargo Bay component failure not detected due to AT inspects wrong equipment 1.96979E-05 8.373E-05 4.250728863 0.08572632 0.0192884
8 AT forgets to replace equipment removed during the inspection process during A-Check inspection of Cargo Bay 0.000774392 0.04866985 62.8491402 3.3701983 11.211741
9 AT damages equipment during the inspection process during A-Check inspection of Cargo Bay 0.021501919 0.35765614 16.63368448 93.5776289 82.390808
10 Cargo Bay component failure not detected due to the AT following incorrect procedure during test 5.00343E-05 0.00020651 4.127403156 0.21775236 0.0475727
11 Cargo Bay component failure not detected due to the AT missing a cue during test 1.68839E-05 6.5124E-05 3.857142857 0.07347971 0.0150021
12 Cargo Bay component failure not detected due to the AT entering incorrect command during test 1.68839E-05 4.979E-05 2.948979592 0.07347971 0.0114698
13 AT forgets to record important information during A-Check inspection of Cargo Bay 0.000226865 0.0133479 58.83638709 0.98732895 3.0748656
14 AT enters the wrong information onto job completion form following A-Check inspection of Cargo Bay 0.000226865 0.0133479 58.83638709 0.98732895 3.0748656
Total Risk for Cargo Bay Inspection A-Check Errors 0.022977628 0.43409714 18.89216514 100 100
Summary of Event Sequence Risk for Each Initiating Event for A-Check - Cargo Bay Inspection Task
No.
Event Sequence Risk
Initiating/Enabling Event Error
Percent Contribution of Initiating Event Risk to
Total Task Risk

L-9
Table L-9: Probabilities for Consequences for Initiating Events in the General Service-Check Inspection Scenario
Fatigue Contribution
Risk without AME / AT
fatigue(Eqf per
100,000 flight hours)
Risk with AME / AT
fatigue(Eqf per 100,000
flight hours)
Ratio of risk with fatigue to
risk without fatigue
Without Fatigue
With Fatigue
1 Tire not checked/replenished because the AME/ATs misinterpret data on the job card 0.004515394 0.02282782 5.055555556 17.4081356 21.80512
2 Tire not checked/replenished because the AME communicates conflicting/ambiguous information to the ATs 0.006321551 0.03386545 5.357142857 24.3713899 32.348255
3 Tire not checked/replenished because the AME forgets to provide an important piece of information to ATs 0.00263398 0.01003421 3.80952381 10.1547458 9.5846681
4 Tire not checked/replenished because the AME elects to perform tasks that he/she does not have time for 0.00263398 0.01655644 6.285714286 10.1547458 15.814702
5 Tire not checked/replenished because AT misinterprets indication of air pressure 0.003687571 0.00802737 2.176870748 14.2166441 7.6677344
6 Tire not checked/replenished because AT forgets to top up tire with air 0.003687571 0.00802737 2.176870748 14.2166441 7.6677344
7 Unflightworthy aircraft released from maintenance because AT forgets to record important information (e.g tire defect) 0.002458363 0.00535154 2.176870748 9.47769475 5.1117863
Total Risk for Service Check - Tire Pressure Top-up Errors 0.02593841 0.1046902 4.036107002 100 100
Summary of Event Sequence Risk for Each Initiating Event for Service Check - Tire Pressure Top-up
No.
Event Sequence Risk
Enabling Event Error
Percent Contribution of Initiating Event Risk to
Total Task Risk

L-10

Appendix M
Risk Analysis Spreadsheets


M-1
Description of the Risk Analysis Spreadsheets
The structure of the spreadsheets is best observed by selecting the corresponding quantified event tree in Appendix K and observing the analogous structure of the calculations in the corresponding spreadsheet. For example, the Thrust Reverser Door Replacement event tree in Appendix K is modelled in the spreadsheet for Incorrect Part Installed during Thrust Reverser Door Replacement (see Table M1). The spreadsheet covers two pages. The second page is a continuation of the columns on the right hand side of the spreadsheet. The entire set of tables for the risk analysis spreadsheets can be found in the Excel files contained on the CD attachment.
The calculations in the spreadsheet follow the same branching structure as shown in the event tree. The initiating event and intermediate enabling events are described in the top two column headings of the spreadsheet. The initiating event is described in the left hand column heading. The intermediate events are described as success states (i.e. what must ‘go right’ to avoid an accident). This is a standard event tree convention. The columns on the right hand side of the last page of each spreadsheet contain the consequence descriptions for each event sequence, the severity expressed in equivalent fatalities, the event sequence frequencies, and the event sequence risk expressed as equivalent fatalities per 100,000 flight hours. The calculation of severity in units of equivalent fatalities is based on equating five injuries to equal one fatality.
The third row below the title contains the initiating event frequencies and the intermediate event probabilities along with a brief description of the basis for the values. There are two entries for all human error probabilities (HEPs) related to maintenance:
• The first is the HEP without fatigue, and
• The second is the HEP with fatigue
In the right hand columns of the last page it can be seen that the event sequence frequencies and risks are calculated for both the non-fatigued and fatigued conditions. There are also columns that present the ratio of the fatigued and non-fatigued frequencies and risks for each event sequence.
The event tree calculations are based on the multiplying the values in the intermediate rows. Each row corresponds to one event sequence as illustrated in an event tree. The last row (on the last page of each spreadsheet), contains a summation of the frequency and risk for all event sequences on the spreadsheet.

M-2

M-3
Table M1: EXAMPLE - Thrust Reverser Door Replacement
Table M3.1-1: Thrust Reverser Door Risk Spreadsheet - The AME/ATs misinterpret data on job card during planning of Thrust Reverser Door Replacement, Page 1
Event Tree Initiator AME Notices Error Thrust Reverser Door does not Deploy During Take-off or Flight
Task Frequency (per 100,000 flight hours)
Basis for Task Frequency Initiating Human Error HEP without fatigue
HEP with fatigue
Initiating error
frequency without fatigue
Initiating error
frequency with fatigue
HEP without fatigue
HEP with fatigue
Basis for HEP Null Probability that Thrust Reverser Door Spuriously
Opens
Basis for probability
20 Once per 5000 flight hours The AME/ATs misinterpret data on job card during planning of Thrust Reverser Door Replacement - Incorrect thrust reverser door replaced
0.0216 0.1092 0.432 2.184 0.04116 0.13608 SUM of HEPs for: 1. AME misses critical error made by AT or Appentice 2. AME forgets to check work of AT or Appentice
1 0.000001 It is assumed that if the thrust reverser door is not
maintained when required that there is a 0.0001% chance that the thrust reverser door will spuriously open during take-off or flight before the next maintenance interval
0.432 2.184 0.95884 0.86392 1 1
0.432 2.184 0.04116 0.13608 1 0.999999
0.432 2.184 0.04116 0.13608 1 0.999999
0.432
2.184 0.04116 0.13608 1 0.999999
0.432 2.184 0.04116 0.13608 1 0.000001

M-4
Table M3.1-2: Thrust Reverser Door Risk Spreadsheet - The AME/ATs misinterpret data on job card during planning of Thrust Reverser Door Replacement, Page 2
Thrust Reverser Door Does not Jam Open on Landing
Pilot has sufficient skill to Keep Plane Level on Runway with Thrust Reverser Door Jammed
Open
Consequences Event Sequence Frequencies Fatigue Contribution
Event Sequence Risk Fatigue Contribution
Probability that Thrust Reverser Door Jams Open during Landing
Basis for Probability Probability that pilot does not have
sufficient skill or is unable to keep plane
level on runway
Basis for Probability Description of event sequence outcome
Consequence expressed in units
of equivalent fatalities (Eqf) (5 injuries = 1
fatality)
Frequency without AME /
AT fatigue (events per
100,000 flight hours)
Frequency with AME / AT
fatigue (events per
100,000 flight hours)
Ratio of frequency with fatigue to
frequency without fatigue
Risk without AME / AT
fatigue (Eqf per
100,000 flight hours)
Risk with AME / AT fatigue
(Eqf per 100,000 flight
hours)
Ratio of risk with fatigue to risk without fatigue
0.0001 It is assumed that if the thrust reverser door is not maintained when required
that there is a 0.01% chance that the thrust
reverser door will jan open on landing before the next
maintenance interval
0.2 It is assumed that the plane may be difficult to control
and keep level on the runway if the thrust reverser door jams open or one wing while its is retracted on the
other wing
1 1 Aircraft returned to maintenance - 0 casualties
0 0.41421888 1.88680128 4.555082762 0 0
0.9999 1 Aircraft Lands Safely 0 0.017779324 0.297168703 16.71428571 0 0
0.9999 0.8 Aircraft Lands Safely 0 0.014223459 0.237734962 16.71428571 0 0
0.0001 0.2 Pilot crashes plane on landing - 10 fatalities, 50 injuries
20 3.55622E-07 5.94397E-06 16.71428571 7.11244E-06 0.000118879 16.71428571
1 1 Crash - 135 fatalities 135 1.77811E-08 2.97199E-07 16.71428571 2.40045E-06 4.01218E-05 16.71428571
Total Risk 0.446222037 2.421711186 5.427143858 9.51289E-06 0.000159001 16.71428571