fatigue of metals copper alloys - clic meeting home page
TRANSCRIPT

• Fatigue of Metals• Copper Alloys
Samuli Heikkinen 26.6.2003

Temperature Profile of HDS Structure
∆T ≈ 70°C

Stress Profile of HDS Structure
Stress amplitude ≈ 220 MPa
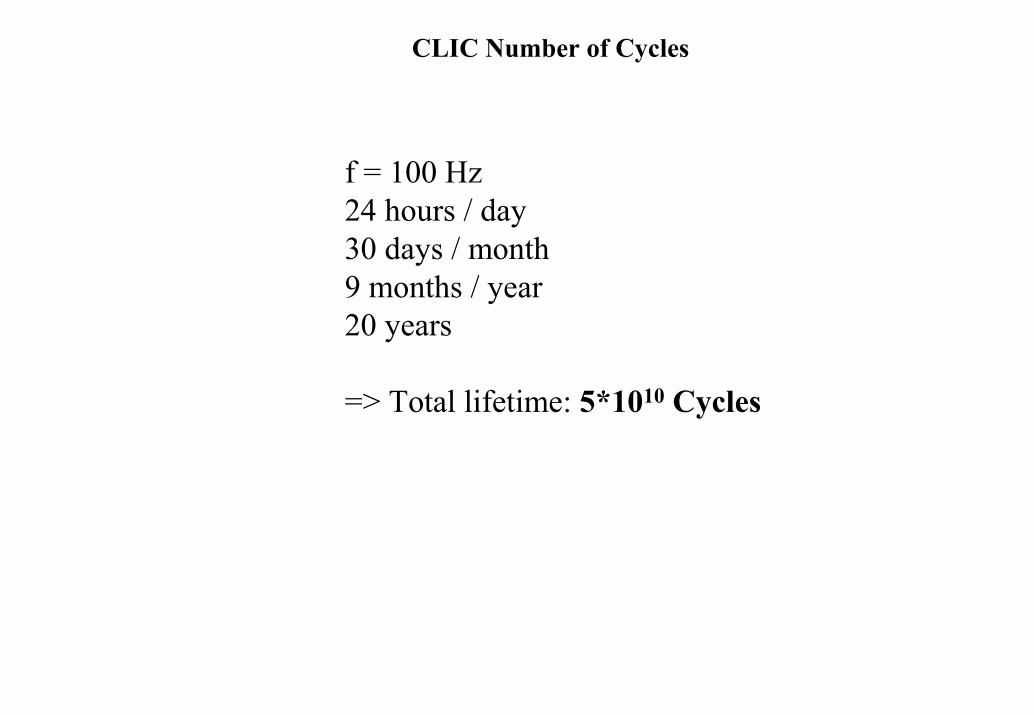
CLIC Number of Cycles
f = 100 Hz24 hours / day30 days / month9 months / year20 years
=> Total lifetime: 5*1010 Cycles
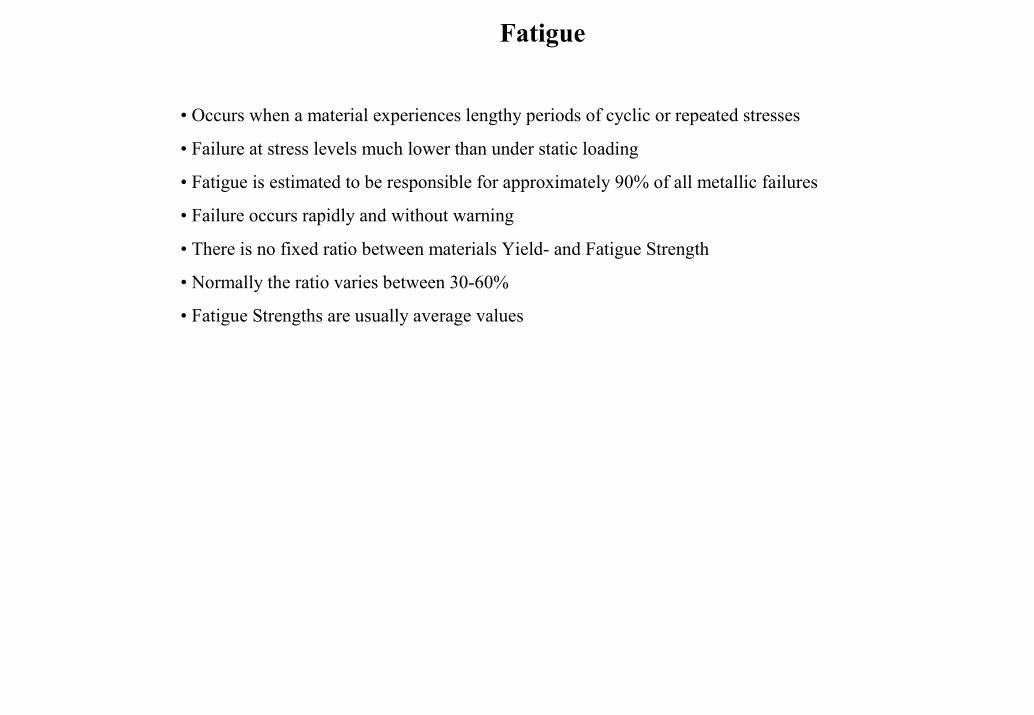
Fatigue
• Occurs when a material experiences lengthy periods of cyclic or repeated stresses
• Failure at stress levels much lower than under static loading
• Fatigue is estimated to be responsible for approximately 90% of all metallic failures
• Failure occurs rapidly and without warning
• There is no fixed ratio between materials Yield- and Fatigue Strength
• Normally the ratio varies between 30-60%
• Fatigue Strengths are usually average values

S-N Curve
Normally data from the fatigue tests are plotted at S-N curve. As stress S versus the logarithm of the number of cycles to failure, N.
When the curve becomes horizontal, the specimen has reached its fatigue (endurance) limit, ferrous and titanium alloys.
This value is the maximum stress which can be applied over an infinite number of cycles.
The fatigue limit for steel is typically 35 to 60% of the tensile strength of the material.
Fatigue strength is a term applied for nonferrous metals and alloys (Al, Cu, Mg) which do not have a fatigue limit.
The fatigue strength is the stress level the material will fail at after a specified number of cycles (e.g. 107 cycles). In these cases, the S-N curve does not flatten out.
Fatigue life Nf, is the number of cycles that will cause failure at a constant stress level.
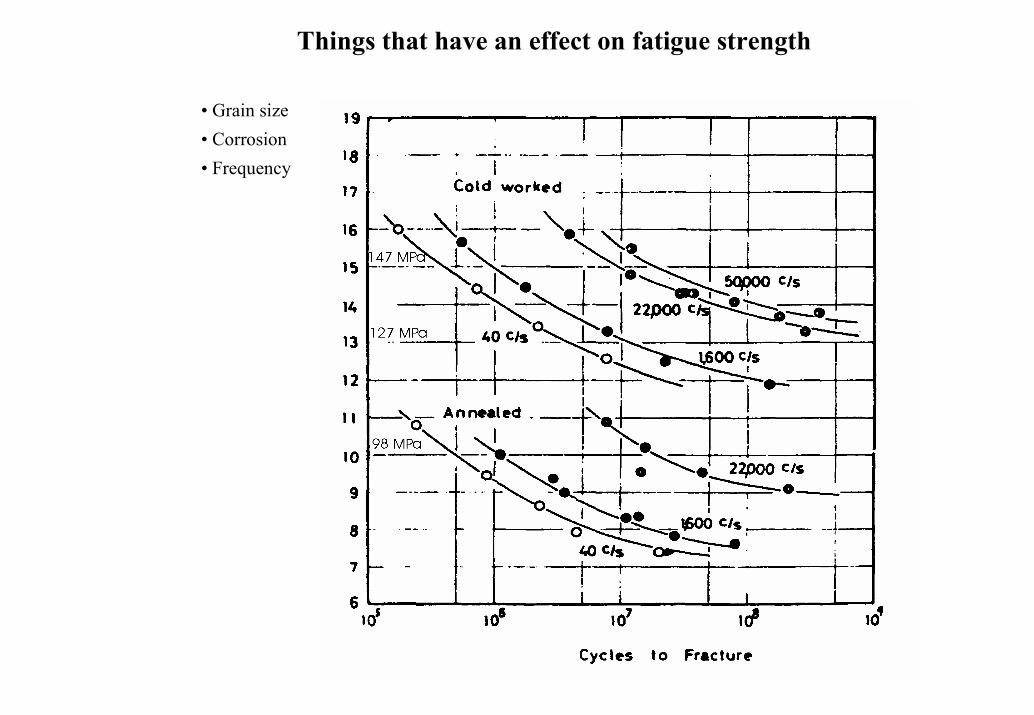
Things that have an effect on fatigue strength
• Grain size• Corrosion• Frequency
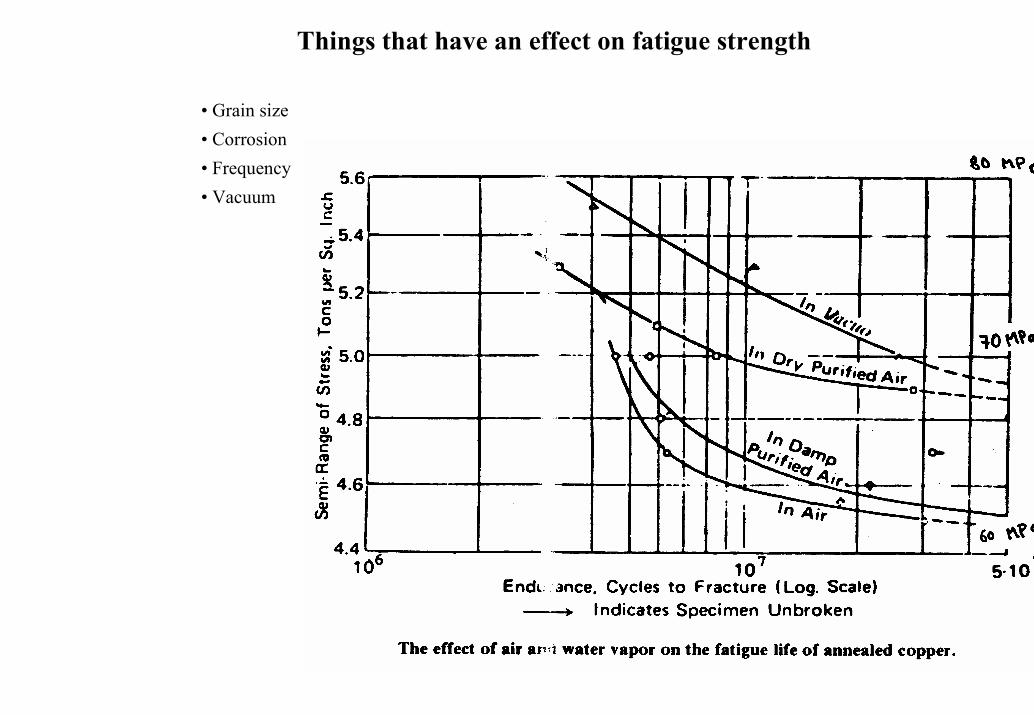
Things that have an effect on fatigue strength
• Grain size• Corrosion• Frequency• Vacuum
Things that have an effect on fatigue strength
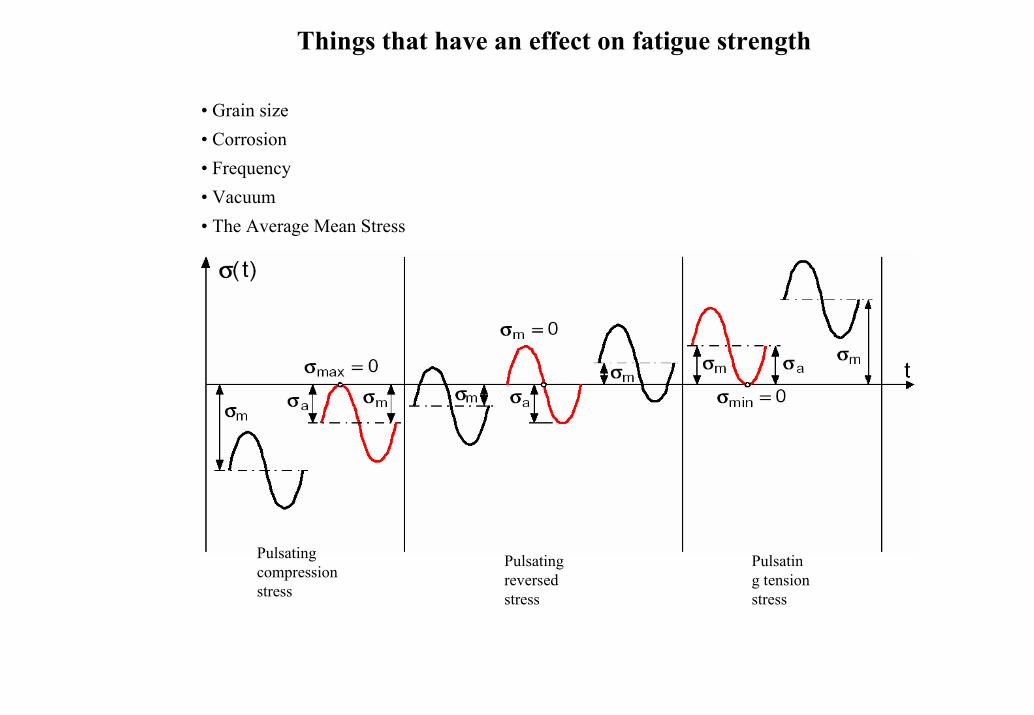
• Grain size• Corrosion• Frequency• Vacuum• The Average Mean Stress
Pulsating compression stress
Pulsating reversed stress
Pulsating tension stress
Things that have an effect on fatigue strength
• Grain size• Corrosion• Frequency• Vacuum• The Average Mean Stress
• Ductility (at small values of N)
• Surface finish (Notch effect)
• Microstructure (‘Notch effect’)
• Temperature (Strength decreases increasing the temperature. Exception confirms the rule…)
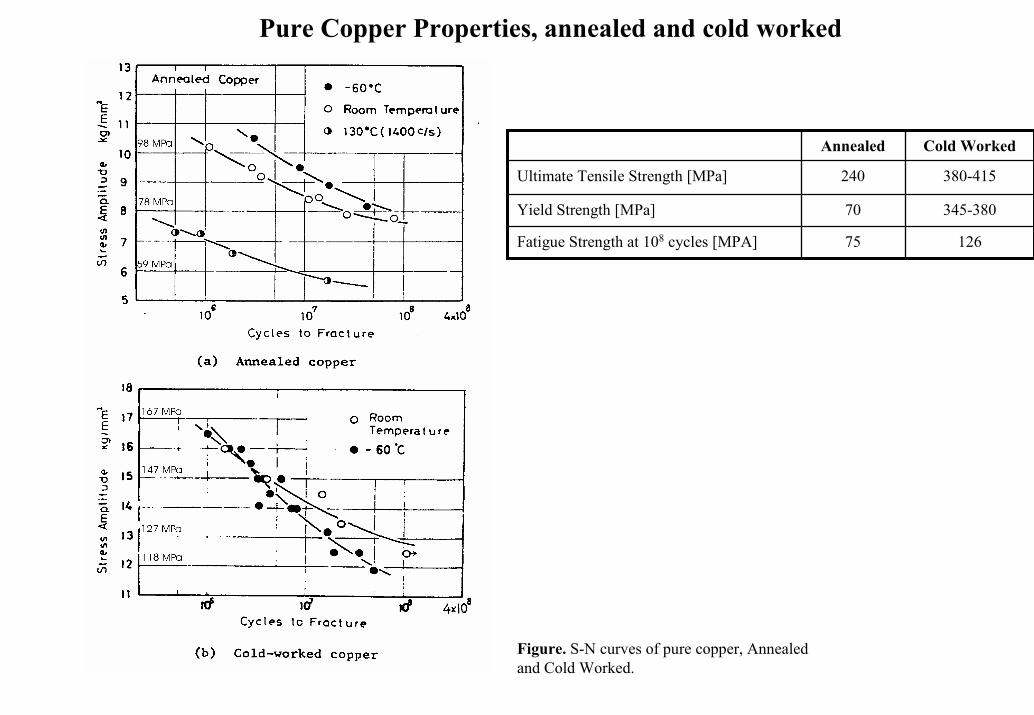
Pure Copper Properties, annealed and cold worked
345-38070Yield Strength [MPa]
12675Fatigue Strength at 108 cycles [MPA]
380-415240Ultimate Tensile Strength [MPa]
Cold WorkedAnnealed
Figure. S-N curves of pure copper, Annealed and Cold Worked.
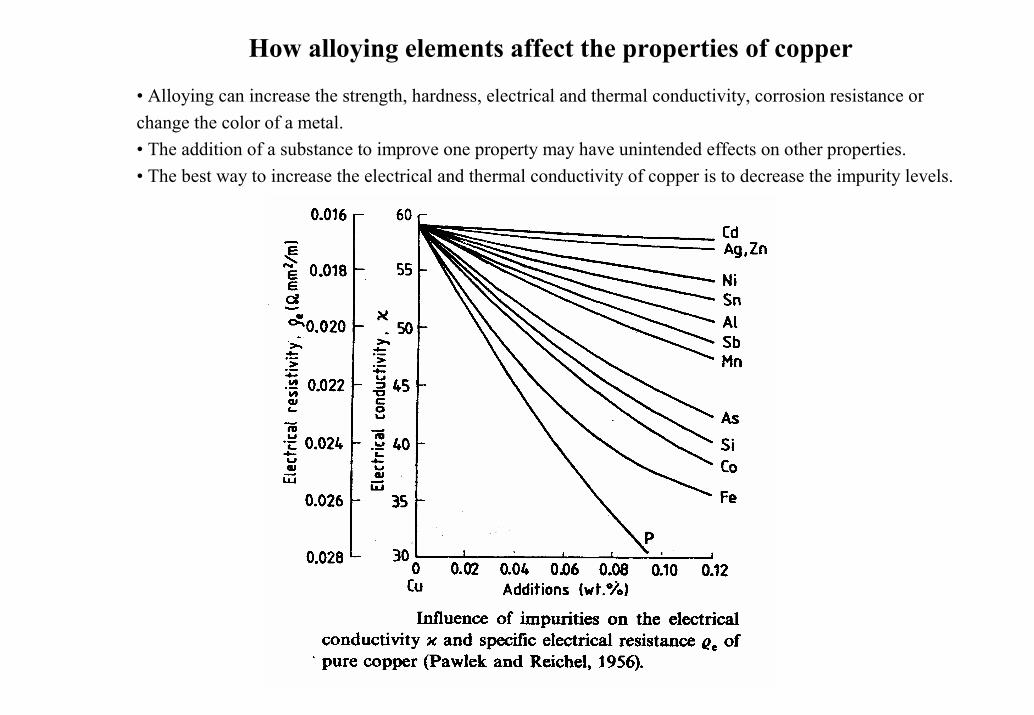
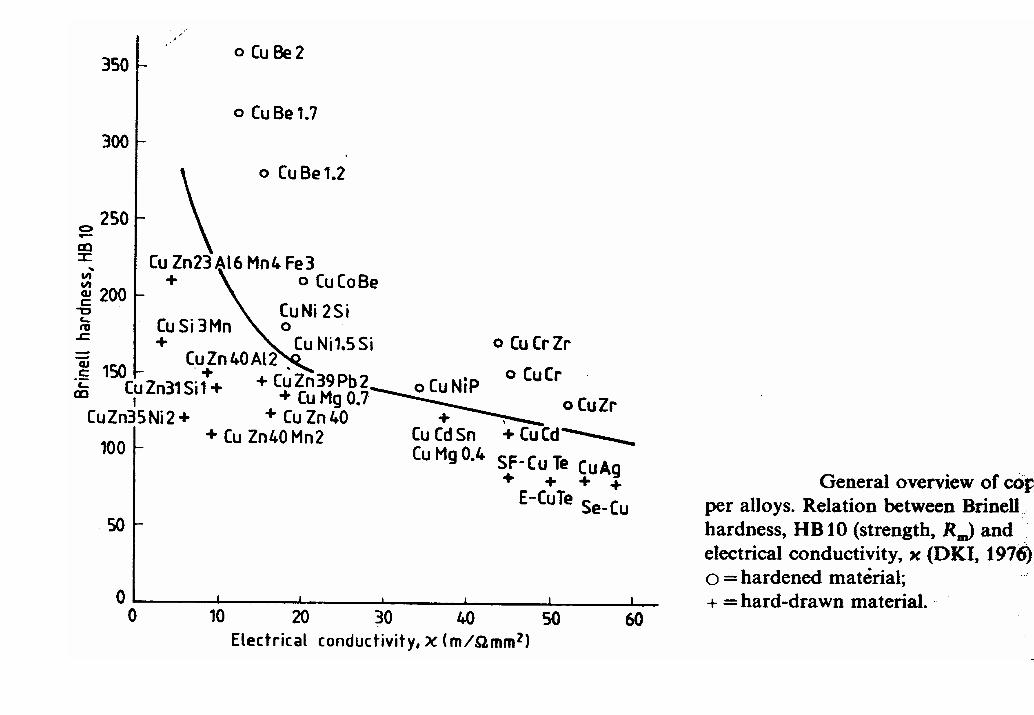
How alloying elements affect the properties of copper
• Alloying can increase the strength, hardness, electrical and thermal conductivity, corrosion resistance or change the color of a metal.• The addition of a substance to improve one property may have unintended effects on other properties.• The best way to increase the electrical and thermal conductivity of copper is to decrease the impurity levels.

Effect of temperature on the softening of copper alloys
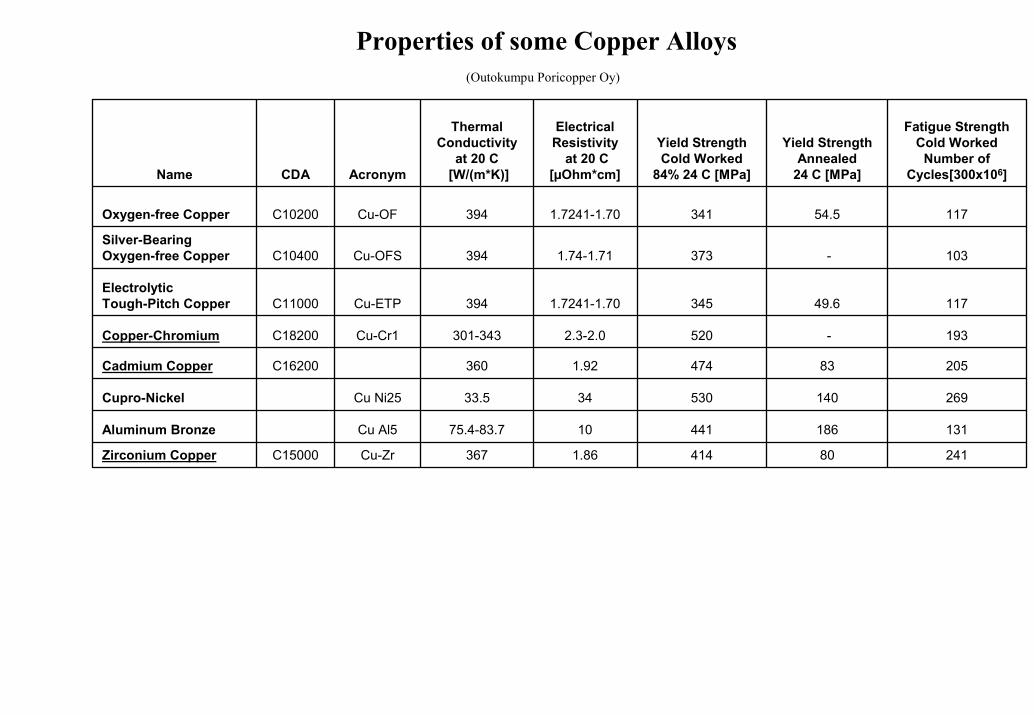
Properties of some Copper Alloys(Outokumpu Poricopper Oy)
241804141.86367Cu-ZrC15000Zirconium Copper
1311864411075.4-83.7Cu Al5Aluminum Bronze
2691405303433.5Cu Ni25Cupro-Nickel
205834741.92360C16200Cadmium Copper
193-5202.3-2.0301-343Cu-Cr1C18200Copper-Chromium
11749.63451.7241-1.70394Cu-ETPC11000Electrolytic Tough-Pitch Copper
103-3731.74-1.71394Cu-OFSC10400Silver-Bearing Oxygen-free Copper
11754.53411.7241-1.70394Cu-OFC10200Oxygen-free Copper
Fatigue StrengthCold Worked
Number ofCycles[300x106]
Yield StrengthAnnealed
24 C [MPa]
Yield StrengthCold Worked
84% 24 C [MPa]
ElectricalResistivity
at 20 C [µOhm*cm]
ThermalConductivity
at 20 C[W/(m*K)]AcronymCDAName

Comparison of Potential Copper Alloys
1.091.191.582σThermal / σFatigue
241205193117σFatigue (Fatigue Strength at 108 cycles) [MPa]
263244305234σThermal (Thermal Stress of HDS Structure) [MPa]
77808871∆T [°C] (HDS Structure)
Cu ZrCu CdCu CrCu OFEAlloy name
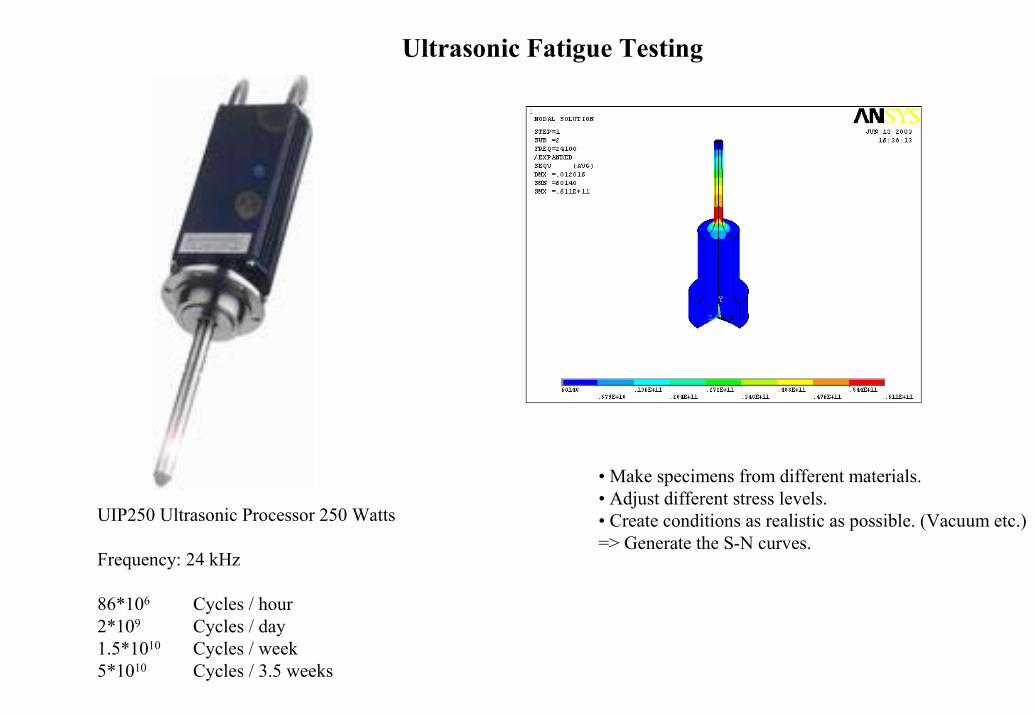
Ultrasonic Fatigue Testing
• Make specimens from different materials.• Adjust different stress levels.• Create conditions as realistic as possible. (Vacuum etc.)=> Generate the S-N curves.
UIP250 Ultrasonic Processor 250 Watts
Frequency: 24 kHz
86*106 Cycles / hour2*109 Cycles / day1.5*1010 Cycles / week5*1010 Cycles / 3.5 weeks