fatigue'. in: encyclopedia of polymer science and …icheh.com/files/posts/portal1/fatigue...
TRANSCRIPT

FATIGUE
Introduction
Polymers and polymer-based composites are increasingly displacing more tradi-tional materials in a wide variety of engineering applications, and estimates bythe National Institute of Standards and Technology place the total annual loss ofengineering components due to fracture at more than $110 billion. Failure mayoccur for a variety of reasons. Most notably, failure can occur if the applied stressexceeds the strength limits of the material. Failure may also be attributed to mate-rial property deficiencies resulting from improper processing conditions that leadto defects (eg, gas or shrinkage pores, inclusions, and weld-and-flow-line defects).Surface defects can result from mechanical processing or handling. These includescratches, gouges, and other markings that introduce stress concentrations. Fi-nally, defects can nucleate and grow in a material during service as a result ofrepeated loading at stress levels below the nominal yield strength, even when thematerial has satisfactory properties and contains no adventitious defects. Whenthese failures occur as a consequence of a hygrothermal or mechanically inducedcyclic loading condition, they are referred to as fatigue failures.
In general, a variety of mechanisms may contribute to the failure of ac-tual components in service. These may include chemical degradation or oxidation:a chemical mechanism that may induce cross-linking and chain-scission. Alter-nately, other physical processes may alter the state of the polymer (eg, surfaceactive agents in the presence of stress may induce crazes due to local diffusion ofthe agents near defects). These aspects are not discussed in this article.
Failure of a component due to fatigue generally occurs through a two-stepprocess. The first step involves the initiation of microcracks or other damage atinhomogeneities or defects in the material. This damage can initiate and evolve
197Encyclopedia of Polymer Science and Technology. Copyright John Wiley & Sons, Inc. All rights reserved.
198 FATIGUE Vol. 6
at nominal stress levels far below the yield or tensile strength of the material.This step is commonly referred to at the initiation stage. The second step involvesthe growth of damage through the coalescence of microcracks and the subcriticalpropagation of these small cracks to form large cracks and ultimately cause com-ponent failure. This step in the failure process is referred to as the propagationstage. For most polymeric materials, the initiation time can be orders of magni-tude greater than the propagation time. The initiation of such microcracks andtheir subsequent propagation form the subject of this article. This article placesemphasis on the fatigue behavior, and not necessarily on aspects of fatigue crackpropagation (FCP), which is considered to be a topical subset of the fracture behav-ior of polymers and is out of the scope of this article (see FRACTURE). Nevertheless,some aspects of FCP and fracture are discussed as they relate to specific cumula-tive damage theories and lifetime prediction methods. Earlier reviews in polymerfatigue and FCP have appeared (1–7).
General Terminology
A common aspect to all fatigue failures is that they occur as a consequence of animposed cyclic hygrothermal and/or mechanical loading process. In general, anycyclic loading condition can be imposed on any specimen geometry. However, themost common loading conditions for mechanically induced fatigue involve uni-axial (tension and/or compression) or flexural loading conditions. Although thestress state changes with specimen geometry and loading condition, the com-mon approach is to describe the fatigue behavior in terms of the magnitude ofsome imposed cyclic stress. Two common specimen geometries used for fatiguestudies include the dogbone-shaped tensile bars (ASTM D638) (8) for tension–tension fatigue experiments or flexure specimens (ASTM D671-71) (9) for tension–compression fatigue studies. These two specimen geometries are schematicallyshown in Figure 1. The flexural fatigue specimen in Figure 1 is tapered alongits gage length to produce a nominal stress distribution that is constant alongthe gage length of the specimen. The flexure geometry is tested in a cantileverbeam configuration. This configuration produces a bending moment across thespecimen thickness that is linearly distributed along the beam length. By linearlyaltering the beam bending moment of inertia (via the tapered width), the stressesalong the specimen gage length become constant. For polymer-based composites,flexural fatigue using the geometries illustrated in Figure 1, are quite common.Thus, both the tensile and flexure fatigue geometries produce stress distributionsthat are nominally constant along their gage lengths and are below those imposedat the grips. These attributes are critical for accurate measures of fatigue resis-tance of a material to ensure that specimen geometry does not alter the result bypromoting premature failure at the grip locations.
It should be noted that there are subtle differences when comparing datagenerated in uniaxial tension and flexural fatigue tests. A uniaxially applied loadnominally imposes a uniform normal stress throughout the cross section of thespecimen, with a plane strain condition occurring at the specimen’s center. Incontrast, the normal stresses in a flexure test are linearly distributed across thespecimen, with the maximum occurring at the outer surfaces of the specimen, and

Vol. 6 FATIGUE 199
Gagearea
(a) (b)
Gagearea
Fig. 1. Schematic of common specimen geometries used in fatigue testing of polymericmaterials. (a) Tensile test specimen. (b) Flexural test specimen.
are zero at specimen’s neutral axis (typically at the center for most specimens).Consequently, flexural fatigue tests are more affected by surface flaws while uni-axial tests are more affected by flaws within the specimen’s interior. Also, becauseof the high internal damping and low thermal conductivity characteristic of mostpolymers, hysteretic heating and the associated effects are more prevalent in uni-axial tests than in flexure tests.
In mechanically induced fatigue tests, the stress or strain is oscillated aboutsome mean stress (strain). If the peak or maximum stress is defined by σ 0 and theminimum stress by σ u, then the stress ratio is often defined by R where
R= σ0
σu(1)
The type of cyclic is typically a sinusoidal, triangular, or square wave withthe amplitude, mean stress, and frequency all adjustable parameters to consider.Some of these parameters are shown in Figure 2.
Numerous studies have shown that the cyclic lifetime of a test bar or com-ponent varies inversely with the magnitude of the applied cyclic stress, strain,or deflection. As a consequence, various test procedures have been developed toobtain mechanical property information useful in fatigue design analysis. Longago, Wohler (10) developed a procedure wherein a notched or unnotched specimenis subjected to a cyclic stress (σ ) and the number of loading cycles (N) to causefailure is recorded. This procedure is repeated for a range of stress levels, and thedata are presented in the form of a σ–N curve (11,12). Examples of σ–N fatiguecurves are shown in Figure 3 (12).

200 FATIGUE Vol. 6
Stress cycle
Stressamplitude
Mean stress
t0
CompressionTension/compression
Tension
Time
Stress(strain)
u
σ
σ
σ 0
Fig. 2. Important parameters for fatigue experiments.
17 min 2.8 h 28 h 12 days 115 days
Fatigue life (10 Hz)
10
20
30
40
50
60
SAN
POMPA-6,6
PA-6
ASA
PC
Number of cycles
Fle
xura
l str
ess
ampl
itude
, MP
a
104 106 107 108105
Fig. 3. Wohler curves for different thermoplastics, generated via flexural fatigue loadingat 10 Hz (12). To convert MPa to psi, multiply by 145.
The cyclic lifetime of a given polymer decreases with increasing applied stressconsistent with greater damage accumulation per cycle at higher stress. Someof the plots in Figure 3 exhibit a relatively well-defined plateau, suggesting anendurance limit for a particular polymer below which fatigue damage does notsignificantly accumulate. By contrast, other engineering plastics reveal a steadilydecreasing allowable cyclic stress with increasing number of loading cycles. Stresscyclic lifetime curves are used to define the permissible operating stress (or strain)in order to preclude fatigue failure for an anticipated number of cyclic excursions.For example, if it is desired that a component withstand at least N1 loading cyclesin a given lifetime, the part should be designed so that the applied cyclic stress isless than σ 1.

Vol. 6 FATIGUE 201
Fatigue tests are both costly and time consuming because of the numberof samples that must be tested in an expensive test machine for days or weeksuntil fracture. Also, since fracture is a stochastic process by nature, repeated testsshould be conducted at each stress level considered. Finally, the number of cycles tofailure, NI, gives no clear indication of the fatigue limits for a given application ofa polymeric material because in many cases, the definition of failure is ambiguous.For example, failure may be defined as a decrease in specimen stiffness or otherirreversible changes rather than actual specimen fracture.
Fatigue Behavior
In general, fatigue failure occurs by one of two possible modes: a mechanically dom-inated mechanism or a thermally dominated mechanism. A mechanically domi-nated process involves the nucleation of damage and its subsequent growth in theform of crazes, microcracks, and ultimately large cracks that are responsible forspecimen failure. This process occurs at relatively lower stresses and frequenciesand results in a higher fatigue life. This regime is commonly referred to as the highcycle regime and the failure mode of the polymeric material is quite often brittlein nature (13–16). This regime is also referred to as the true fatigue response ofthe material.
At relatively higher stresses and frequencies, hysteretic heating affects thephysical and mechanical properties of the polymer. This effect is a combined con-sequence of the fact that most polymers demonstrate high internal damping andlow thermal conductivity. In this process, heat generated from mechanical fa-tigue cannot be dissipated to the surroundings and the polymer temperature risesthroughout the test. Failures usually occur rather quickly and the failure mode isusually ductile (13–16). This regime is referred to as the low cycle regime and isnot considered to be an intrinsic response of the material to fatigue loading con-ditions. If one polymer exhibits a greater tendency than another for hystereticheating under cyclic loading conditions, the relative ranking of the two poly-mers may differ greatly when the tests are conducted at both high and low cyclicfrequencies.
Identifying whether a particular set of fatigue conditions is mechanicallyor thermally dominated can be observed in the evolution of the hysteresis loops.This is shown characteristically for the case of polyacetal in Figure 4 (13). In thelow cycle region, hysteresis loops show a progressive increase in compliance andirreversible work as the material is fatigued. In contrast, the high cycle hysteresisloops show that the material initially becomes slightly stiffer and less viscoelastic(as evidenced by the decrease in irreversible work) as the cycles increase. This isfatigue-induced embrittlement and occurs prior to craze initiation and subsequentcrack growth. A Wohler plot of polyacetal showing the thermally and mechanicallydominated regions is shown in Figure 5 (13). Note that a discontinuity occurs in theσ–N at the stress level where the transition occurs. This is critically important torecognize since data in the thermally dominated regime suggest that an endurancelimit has been reached. However, as the stress level is reduced, a transition in thefailure mode occurs from ductile to brittle, and failure is measured at a finitecycle number below the apparent endurance limit. Hence, extreme care should

202 FATIGUE Vol. 6
Polyacetal Fatigue Behavior
0
20
40
60
80
Cycles
Thermally dominated region
Mechanically dominated region
Str
ess,
MP
a
60
45
30
15
00.02 0.04 0.06
10 100 1000 10,000 100,000
1,000,000
Strain, cm/cm
Mechanically Dominated Region
Str
ess,
MP
a
0
15
30
45
6010 50 100 200 300
Strain, cm/cm
Thermally Dominated Region
Str
ess,
MP
a
0.00 0.04 0.08 0.12
101 102 103 104 105 106 107 108
Fig. 4. Plots of hysteresis loops for polyacetal fatigued in the low cycle (thermally dom-inated) and high cycle (mechanically dominated) regions. The numbers located by eachhysteresis loop indicate the cycle number (13). To convert MPa to psi, multiply by 145.
be exercised when using fatigue data for design considerations to ensure that theproper failure mode is observed from the accelerated tests.
Hysteretic Heating and the Low Cycle Regime. At relatively high fre-quencies and stress levels, many polymers may become overheated as a result ofthe accumulation of hysteretic energy generated during the loading cycles. Suchenergy dissipation produces a significant temperature rise within the specimen,which, in turn, causes the elastic modulus of the material to decrease. As a result,large specimen deflections contribute to even greater hysteretic energy losses withfurther cycling. In the limit, an autoaccelerating tendency for rapid specimen heat-ing and increased compliance is experienced. Such thermal failure corresponds tothe number of loading cycles at a given applied stress range that bring aboutan apparent modulus decay to 70% of the original modulus of the specimen (10–13). Extreme care should be taken in ranking the fatigue resistance of polymericmaterials since the test conditions may effect the measurement of the true orthe intrinsic fatigue resistance of the material. In general, results like those pre-sented in Figure 3 should only be used to rank materials once it is assured thatthe tests are run properly to ensure the appropriate failure mechanisms. Thesetest results can be applied in design only when all design factors including mag-nitude and state of the stress, part size and shape, temperature, heat transfer

Vol. 6 FATIGUE 203
PolyacetalThermally dominated region
Mechanically dominated region
Str
ess,
MP
a
80
60
40
20
0
Cycles
108107106105104103102101
Fig. 5. Plot of fatigue σ–N curve for polyacetal resin, illustrating both thermally dom-inated and mechanically dominated regions. Note in the thermally dominated region anapparent endurance limit appears (13). To convert MPa to psi, multiply by 145.
conditions, cyclic frequency, and environmental conditions are comparable to thetest conditions.
Studies (17–19) have shown that the energy dissipation rate under cyclicloading conditions varies directly with the test frequency, the loss complianceof the material, and the square of the applied stress. Neglecting heat losses tosurrounding environment the temperature rise in the sample per unit time canbe calculated as
�.
T = π f J′′( f ,T)σ 2
ρcp
(2)
where �.
T is the temperature change/unit time, f the frequency, J′′ the loss com-pliance, σ the peak stress, ρ the density, and cp the specific heat. Previous studies(15,16,20) have shown that for all stress levels above the endurance limit, the poly-mer heats to the point of melting at failure. The temperature rise is stabilized at amaximum below the point of thermal failure. It should be noted that for conditionsassociated with thermal failure, cyclic lives can be enhanced by intermittent restperiods during the cyclic history of the sample (20–22). Temperature rise resultingfrom adiabatic heating can thus be dissipated periodically. Therefore, componentlife can be enhanced via cooling in thermally dominated fatigue applications (23).
The transition from thermal to mechanical failure has been described interms of a changeover stress level, which depends on test frequency, mean stress,cyclic waveform, and specimen surface area-to-volume ratio (24). An empiricalrelationship between the uniaxial changeover stress and test frequency is shownin Figure 6 (24) and is given by

204 FATIGUE Vol. 6
Uni
axia
l the
rmal
fatig
ue c
hang
eove
r st
ress
, MP
a
0
5
10
15
20
25
30
35
40
Frequency, Hz
= 0.63 mm−1
= 0.4 mm−1
= 0.4 mm−1
1 10 100
β
β
β
Fig. 6. Changeover stress from mechanical to thermal failure as a function of specimensurface area-to-volume ratio β and test frequency (24). To convert MPa to psi, multiply by145.
σc =√
A/V(C1 − C2 log10 f ) (3)
where σ c is the changeover stress, A the specimen surface area, V the specimenvolume, and f the cyclic frequency. C1 and C2 are empirical constants and relatedto the heat capacity of the polymer and properties of the environment that thepolymer is fatigued in. A similar methodology is also presented in Reference 16.
High Cycle Fatigue and Polymer Embrittlement. In the high cycle re-gion (ie, at stress levels and frequencies low enough such that hysteretic heatingis stabilized), failure of the material occurs through the nucleation of damage andsubsequent propagation of cracks. In general, the total fatigue life of a specimenis a combination of an initiation (Ni) and a propagation (Np) stage. The initia-tion stage is associated with the cycles required to initiate damage and developa defect (crack) of a size such that the threshold stress intensity is reached. Thepropagation stage is associated with the number of cycles required to propagatethe crack under subcritical conditions from the threshold size to the critical size(such that failure is imminent). Thus far, all discussions have associated withthe total cycles (N) and
N= Ni + Np (4)

Vol. 6 FATIGUE 205
Fig. 7. Fracture surface in polyacetal resin specimen subjected to tensile fatigue. Thepenny-shaped crack initiated at a void or other inhomogeniety at its center (25).
If a defect is present in a component at the outset of its service life, N corre-sponds largely to the propagation stage of crack extension. Depending on the sizeand shape of the defect, Ni represents either a small or a large fraction of N.Depending on the polymer and processing conditions, damage may nucleate rel-atively early and the total life is dominated by the subcritical fracture resistanceof the polymer. Figure 7 (12) illustrates such a case for poly(methyl methacrylate)(PMMA), where the time for craze initiation is relatively short compared to thetotal life of the specimen. In other cases (more typical of engineering thermoplas-tics with controlled processing conditions), the initiation stage governs the totalfatigue life. Table 1 (13) shows a comparison between the initiation and propaga-tion life for two engineering thermoplastics: polyacetal and nylon-6,6 exposed to asinusoidally applied maximum cyclic stress of 30 MPa at 2 Hz. When comparingthe cycles for initiation and propagation in Table 1, it is clear that the early stagesof damage development involve mechanisms and kinetics not well described byprocesses that govern the subcritical fatigue crack growth (discussed in a latersection).
Table 1. Comparison between Fatigue Initiation and Propagation Lifetimes forPolyacetal and Nylon-6,6a
Material Kth, MPa·m1/2 KIc, MPa·m1/2 A m Np Nf Ni
Nylon-6,6 2.0 6.0 5.4 × 10− 9 6.8 9000 2 × 10⁷ ∼2 × 10⁷
Polyacetal 2.5 3.1 1.3 × 10− 17 20.0 186000 5 × 10⁶ ∼4.8 × 10⁶
aRef. 13.

206 FATIGUE Vol. 6
It is generally well accepted that damage initiates at preexisting defectsor other inhomogeneities within the material. This is typically illustrated inFigure 7 for a polyacetel resin specimen (25). Figure 7 shows the fracture sur-face from an injection molded ASTM D638 tensile bar subjected to a tensile cyclicfatigue. The initiation of the penny-shaped crack occurred at a void or other in-homogeniety and propagated subcritically under cyclic fatigue to a critical lengthprior to sudden failure. The specimen was subjected to approximately 5 × 10⁶
cycles to cause failure and the number of cycles required to propagate the penny-shaped crack to the critical size is of the order of 2 × 10⁵ cycles. Thus, the initiationof the penny-shaped crack at the defect site governed the total life of the polymer.
If the preexisting defects in the material are well below the threshold size ofthe polymer, the initiation process may involve a variety of morphological and mi-crostructural changes. One phenomenon observed in some polymers involves theprocess of mechanically induced embrittlement. In this process, the polymer be-comes slightly stiffer and less viscoelastic as evidenced by the hysteretic responseof the material (13). This is illustrated for the case of polyacetal in Figure 4. Noticethat the hysteresis loops in the high cycle region become slightly stiffer and thecorresponding irreversible work decreases as the material is continually fatigues.This occurs while damage in the form of crazes, cavitation, and microcracks wouldall decrease the stiffness of the material. This suggests that additional morpho-logical changes may occur during the fatigue of a polymer. Potential mechanismsof this process are discussed in a later section.
Classical Modeling Studies
Wohler (10) curves are commonly used to rank polymers and identify endurancelimits (see Fig. 3) for particular applications. However, they are of little use beyondthis without the implementation of a theory that allows for the prediction of fatiguelife under more arbitrary loading histories. Predictive methodologies that allowfor lifetime estimates have been developed to address this issue. These theoriesare generally referred to as cumulative damage theories and may or may notincorporate aspects from fracture mechanics or physical characteristics of thematerials. Some early theories developed originally for metals (26,27) recognizethat total fatigue life is dominated by the initiation stage (see eq. 4) and thereforedo not consider the propagation stage in lifetime estimates.
One of the earliest, and most popular, cumulative damage theory was intro-duced by Minor (26), and is now referred to as Minor’s Law. Minor proposed thatif a material would last a 100 cycles at a particular stress level, then 1/100 of itslife is consumed in every cycle at that stress level. This basic postulate providesa framework whereby the σ–N curve (eg, Figs. 3 and 5) can be used to estimatethe fatigue life of a material subjected to an arbitrary loading history. Considerthat an arbitrary loading history can be fractionated into m blocks of cycles, eachunder constant fatigue conditions. Then, Minor’s law can be written as
m∑j = 1
nj
Nj= 1 (5)

Vol. 6 FATIGUE 207
In equation 5, nj is the number of cycles within a block applied at stress level σ jand Nj is the total number of cycles to failure at that stress level (obtained fromthe σ–N curve). If validated for a particular material, equation 5 can be used forany arbitrary loading condition. In this way, the fatigue data generated in thelaboratory is referred to as an accelerated test and equation 5 is used much in thesame way that time–temperature superposition is used to predict the viscoelasticdeformation of a material. Note, however, that any predictive methodology likethat presented in equation 5 must be validated before it is employed for lifetimeestimates. In the case of Minor’s law, the sequence of the loading history shouldhave no effect on the total lifetime. That is, if one specimen is loaded for a selectedportion of its life at stress level σ 1 and the remaining part of its life at σ 2, thenthe same total life would be achieved if the specimen is first loaded at stress levelσ 2 followed by σ 1.
Another common theory was proposed by Manson (27) and is referred toas the universal slopes equation. In this model, the plastic strain or permanentdeformation, is considered as a measure of the damage imposed in the material.On this basis, the true plastic strain amplitude can be used as a measure of thefatigue behavior. Moreover, the fatigue curve can be predicted in terms of themonotonic stress–strain curve. This empirical approach was initially statisticallycorrelated with many metals and takes the following form:
�ε =(
ND
)− 0.6
+ 3.5(
σu
E
)N− 0.12 (6)
where �ε is the total strain, D is the ductility, E is the elastic modulus, and σ u isthe ultimate tensile strength. The ductility term D is calculated by
D= ln(
A0
A
)(7)
In equation 7, A0 is the original cross-sectional area and A is the final cross-sectional area at specimen failure. The coefficients 3.5, −0.6, and −0.12 in equa-tion 6 are based on a statistical fit of over 29 metals. In that sense equation 6universally predicts the fatigue behavior of a wide range of metals by using dataobtained from a monotonic tensile test.
Opp and co-workers (14) attempted to extend the universal slopes equa-tion to predict the behavior of polymer fatigue. However, in their attempts theyshowed that a form of equation 6 was not useful for predicting polymer behaviorand instead developed a model to predict the low cycle fatigue behavior basedon hysteretic heating. And in this sense is consistent with those presented inequation 3 and References 15–17.
Other classical methods to predict the fatigue behavior in complex or ran-dom load patterns involve the so-called rainflow and Markov methods (28). Thesemethods utilize any form of a cumulative damage theory to predict the lifetime inrandom loading situations.
McKenna and Penn (29) developed a model for predicting the fatigue lifeof polymers and applied it to an amorphous glass, PMMA, and polyethylene. Themodel is characterized within the framework of a cumulative damage model. They

208 FATIGUE Vol. 6
show that the mean failure times in constant rate of stress experiments can besuccessfully predicted from a model using a time to fail function obtained fromconstant stress experiments. In this manner they were able to bridge the gapbetween creep and fatigue loading conditions. In their model, the time to fail, tb,is related to the stress history σ (ξ ) by the following equation:
∫ tb
0
dξ
τb[(ξ )]= 1 (8)
where τ b(σ ) is the mean time to failure in constant stress experiments. Thus, eachincrement of time dξ , during which the load is σ (ξ ), is weighted inversely as thelifetime τ b(σ ), which the specimen would have had under a constant stress σ .
Once τ b(σ ) is determined from creep (constant load experiments), equation 8can be used to predict the failure under any stress history. The form of τ b(σ ) thatwas found to describe the data in Reference 29 is
τb(σ ) = Ae−Bσ (9)
where A and B are constants. Equation 9 uses the form that is derived from molec-ular considerations by Tobolsky and Eyring (30), Coleman (31,32), and Zhurkov(33). Given the form for time to failure under constant stress in Equation 9, anexplicit expression for a constant rate of stress can be explicitly obtained by inte-grating equation 8. The final expression takes the following form:
tb = ln(AB.σ +1)
B.σ
(10)
In equation 10, tb becomes the time to failure at a constant stress rate.σ . Similarly,
for a sinusoidal stress history
σ (t) = p+ q sin(ωt) (11)
the time to failure becomes
tb = tb(p)I0(Bq)
(12)
In equation 12, I0 is the zero-order Bessel function, B is the constant fromequation 9, and tb(p) is the time to fail at a constant stress p.
Using equation 12, data from creep tests can be used to predict the failurein sample subjected to a sinusoidal load history. Figure 8 presents a comparisonbetween experimental results and theoretical predictions (29) for PMMA by us-ing equation 12. In this case the prediction underestimates the lifetime in somecases by nearly an order of magnitude but is generally very good. In the case ofpolyethylene (not shown) the model overestimates the experimentally observedfatigue life. Another practical limitation to the methodology presented in equa-tions 8, 9, 10, 11, 12 is that creep failure data is needed to predict the fatigue

Vol. 6 FATIGUE 209
Dead load
Peak stress, MPa
Tim
e to
bre
ak, s
Fatigue data
Fatigue prediction fromadditivity of damage
50 60 70 80 90100
101
102
103
105
104
Fig. 8. Comparison of failure times obtained in zero-tension sinusoidal fatigue exper-iments with those predicted by equation 9 for PMMA at 0.164 Hz, T = 297 K (29). Toconvert MPa to psi, multiply by 145.
lifetime. Experimentally, creep experiments take considerably longer to conductthan fatigue experiments to failure.
Other approaches have been suggested to more formally define the form ofdamage that occurs during fatigue (34–37). These methods model damage as anarray of microcracks (34,35) that inevitably require a tensoral definition of damage(36,37). These methodologies allow for multiaxial stress states to be considered.Thus far, these theories have had only limited applications in polymeric materials.One difficulty that arises from such a framework is the necessity to sum over anarray of damage using Green’s functions and hence linearity in the constitutivebehavior of the material is required. Nonetheless, these approaches may be usefulin applications where the nonlinearity imposed from the damage array dominatesthe material response.
Fatigue Damage Initiation
Physical and Morphological Changes. Some studies have discussedthe microstructural and morphological changes that occur in polymers as a conse-quence of fatigue loads. These effects may occur before the formation of noticeable

210 FATIGUE Vol. 6
damage in the form of voids or microcracks occur. These changes may be criticalto understanding the nucleation of damage as well as its growth kinetics. Bouda(38) found that the effects of fatigue on glassy polymers can manifest either asa strain hardening or softening, depending, among other things, on the partic-ular material being investigated. Changes in the dynamic viscoelastic behaviorwere also reported as well. Similarly, Takahara and co-workers in numerous in-vestigations (39–41) measured changes in the viscoelastic response of a varietyof different polymer systems. Both changes in the storage and loss moduli wereobserved during fatigue. More recently, Sakurai and co-workers (42) conducteda comprehensive investigation of changes induced in polyurethanes subjected tofatigue. They presented dramatic evidence of microstructural changes occurringafter a fatigue load was applied. These changes were attributed to changes incrystallinity in addition to dissociation of the hard-segment microdomains.
A recent paper (13) presents results from in situ measurements of both thedynamic viscoelastic properties and energetics (ie, potential energy, strain energy,and irreversible work) of nylon-6,6 and polyacetal specimens subjected to fatigue.The measurements of dynamic viscoelastic behavior illustrate how the bulk ma-terial properties may be changing during fatigue. Measurements of the strainenergy, potential energy, and irreversible work also indicate material changes butcan also be more directly used in calculating energy release rates for crack growth.Thus, the evolution of energy release rates may also be an indicator of when crack(damage) growth occurs in the specimen. A plot of the dynamic viscoelastic be-havior is shown in Figure 9 and the corresponding evolution of the energetics isgiven in Figure 10.
The transition from the low cycle to high cycle fatigue occurs between 48 and50 MPa at a frequency of 2 Hz for polyacetal and this transition is clearly evidentin both graphs. In the low cycle regime, the materials become softer and more vis-coelastic as evidenced by the dramatic drop in storage modulus and correspondingincrease in tan δ. Also, both the potential energy and irreversible work increaseconsiderably in the low cycle regime. All of these results are consistent with thesoftening of the material due to hysteretic heating.
In the high cycle regime, the polyacetal becomes more compliant (seeFigs. 9 and 10) as well, but the amount is more subtle than in the low cycle regime.More interesting, the material also becomes less viscoelastic as evidenced by thedrop in tan δ and irreversible work. This is in contrast to low cycle regime andsuggests that other morphological changes are occurring in addition to damage.Subsequent studies (13) also showed that the crystallinity increased slightly inboth nylon-6,6 and polyacetal.
A similar study on polycarbonate showed that cyclic stress induced physicalaging on polycarbonate (43). In this work it was noted that both the Young’s moduliincreases while the loss modulus decreases. This related phenomenon is referredto as fatigue aging. In contrast, thermophysical aging is the process of the spon-taneous approach of the glassy state toward thermodynamic equilibrium. Thisphenomenon has been reviewed extensively by Struik (44) (see AGING PHYSICAL).This spontaneous change is accelerated perceptibly when the temperature of theglass is increased toward the glass transition. Physical aging causes an increasein density, relaxation modulus, and other properties. Physical aging alters therelative kinetics of crazing and shear banding processes, so that a normally tough

Vol. 6 FATIGUE 211
PolyacetalDynamic Viscoelastic Behavior
E ′
750
500
1000
1250
1500
Cycles
101 102 103 104 105 106
Cycles
E ′′
50
0
100
150
200
101 102 103 104 105 106
Cycles
tan
0.05
0.00
0.10
0.15
0.20
101 102 103 104 105 106
tan
δ
δ
Mod
ulus
, MP
aM
odul
us, M
Pa
Fig. 9. Plots of dynamic viscoelastic response during fatigue of polyacetal over a rangeof maximum stress levels. All tests were conducted at a frequency of 2 Hz at room tem-perature (13). 56 MPa; —– 54 MPa; - - - - - 52 MPa; — - 50 MPa; — - - 48 MPa;— – 45 MPa. To convert MPa to psi, multiply by 145.
polymer becomes very brittle upon aging (45,46) apparently because the shearyielding process becomes retarded.
A common method employed to detect physical aging in glassy polymersinvolves the use of differential scanning calorimetry. Careful studies of the ther-mograms show an enthalpic overshoot as the polymer is heated through the glass-transition region. This overshoot occurs both with thermophysical aging and fa-tigue aging but the peak temperature of the endotherm is slightly increased for thefatigue aged samples (43). Figure 11 shows how the endothermic overshoots areaffected by the stress amplitude for polycarbonate samples exposed to different

212 FATIGUE Vol. 6
2500
2000
1500
1000
500101 102 103 104 105 106
Ene
rgy,
kJ/
m3
Cycles
2500
2000
1500
1000
500101 102 103 104 105 106
Ene
rgy,
kJ/
m3
Cycles
Potential Energy
PolyacetalEnergy Density Evolution
Strain Energy
101 102 103 104 105 106
Ene
rgy,
kJ/
m3
Cycles
Irreversible Work500
400
300
200
100
0
Fig. 10. Plots presenting the energy density evolution for polyacetal over a range of stresslevels. All tests were conducted at a frequency of 2 Hz at room temperature (13).56 MPa; —– 54 MPa; - - - - - 52 MPa; — - 50 MPa; — - - 48 MPa; — – 45 MPa. To convertMPa to psi, multiply by 145.
thermal histories before loading. In all cases, the fatigue tests were stopped after8000 cycles. For samples exposed to low or moderate annealing prior to fatiguing,an increase in the enthalpic overshoot appeared and was relatively insensitiveto the amplitude of stress. For the highly annealed material, the fatigue actuallyreduced the endothermic overshoot (ie, reversed the physical aging). SimilarlyFigure 12 shows how the enthalpic overshoot evolves during the early stages offatigue.

Vol. 6 FATIGUE 213
Crazing zone
Incubation zone
Stress amplitude of fatigue, MPa
Ent
halp
y ov
ersh
oot b
y ds
c, J
/g
1.25
1.50
1.75
2.00
2.25
2.50
0 10 20 30 40
Fig. 11. Differential Scanning Calorimetry enthalpy overshoot of samples of differentprevious physical aging histories plotted as a function of cyclic stress amplitude for a fixed8000 cycles (43). � aged at 130◦C for 24 h; aged at 130◦C for 12 h; aged at 130◦C for6 h. To convert MPa to psi, multiply by 145.
Early Stages of Damage Formation. A variety of studies have indicatedthat void formation, cavitation, or incipient nano-sized cracks occur in the polymerduring the early stages of fatigue. The nucleated voids then continue to growand coalesce while the fatigue process continues. The subcritical crack growthkinetics has been measured over a wide range of polymers (discussed in the nextsection). Once the flaws reach a threshold flaw size (of the order of 10− 3 m for manypolymers), the subcritical crack growth kinetics are generally well described formany polymers. However, the sizes of these flaws that nucleate and grow duringa large portion of the fatigue life are quite often below the threshold flaw sizefor subcritical crack growth kinetics to govern. This section discusses researchdevoted to damage at this length scale.
Studies by Zhurkov (33,47) introduced the idea that breakage of primarychemical bonds plays a major role in the fracture of polymers. He found that thetime to failure under a resistant uniaxial stress of PMMA and polystyrene belowtheir glass-transition temperature could be expressed in terms of a thermallyactivated process involving three kinetic parameters:
tb = t0e(U0 − γ σ0)/RT (13)

214 FATIGUE Vol. 6
Number of cycles of fatigue
Ent
halp
y ov
ersh
oot b
y ds
c, J
/g
2.0
2.1
2.2
2.3
2.4
2.5
2.6
2.7
2.8 0.200
0.175
0.150
0.125
0.100
0.075
0.050
0.025
0.0000 5000 10,000 15,000 20,000 25,000 30,000
Fig. 12. Differential Scanning Calorimetry enthalpy overshoot as a function of cycle num-ber at a given stress amplitude. Note the different scales in the data (43). aged at 130◦Cfor 40 h and fatigued at 20 MPa; quenched from 165◦C and fatigued at 31 MPa. To convertMPa to psi, multiply by 145.
In equation 13, tb is the time to failure, U0 is interpreted as the activation en-ergy for chain scission, t0 is interpreted as the inverse of the molecular oscillationfrequency, and γ is a structure-sensitive parameter. Experimentally he (47) ob-served the formation of platelet-shaped nanoscopic voids, which he referred to asincipient cracks, that form very early in the polymer once a tensile load is ap-plied. Both the incipient cracks and their number density were measured fromsmall-angle x-ray scattering studies on samples that had tensile loads applied tothem. The characteristic sizes and number densities of the incipient cracks areincluded in Table 2. Zhurkov showed that the incipient cracks formed at the veryearly stages and the remaining life was associated with the coalescence of theseincipient cracks to ultimately cause failure.
LeGrand and co-workers (48) conducted positional small-angle x-ray scat-tering studies on high impact polystyrene exposed to fatigue loading conditions.Their results clearly indicated that flaws of some type are nucleated and grow as aresult of increasing fatigue. They also suggested that the nucleation and growth offlaws appears to follow a simple exponential law. However, the results regarding

Vol. 6 FATIGUE 215
Table 2. Characteristics of Incipient Cracks in Polymersa
Microcrack Diameterlongitudinal, transverse, Density �p/p
Polymer nm nm Ncr, cm− 3 calculated measured
Polyethylene 15 17 6 × 10¹⁵ — —Polypropylene 20 32–35 7 × 10¹⁴ — —Poly(vinyl chloride) — 60 8 × 10¹⁴ — —Poly(vinyl butyral) — 50 3 × 10¹⁴ — —Poly(methyl 80 170 4 × 10¹² 0.4 × 10− 2 0.3 × 10− 2
methacrylate)Polycaproamide 5 9–25 5 × 10¹⁶ 1.8 × 10− 2 2.0 × 10− 2
aRef. 47.
how material properties or loading conditions affect the growth rates were clearlyinconclusive in this study.
Positron annihilation lifetime spectroscopy studies (49) polycarbonate sam-ples subjected to fatigue. Positron annihilation lifetime spectroscopy was used toprobe structural changes in terms of the hole volume and number density of fa-tigued samples. The ortho-positronium (o-Ps) pickoff annihilation lifetime τ 3, aswell as intensity I3, were measured as a function of cyclic stress. It was found thatτ 3, the longest of the three lifetime components, increases with fatigue cycles. Theholes where the o-Ps can localize become larger upon fatigue aging. Commensu-rate with increasing hole size was an indication of hole coalescence from the o-Psannihilation intensity. It was suggested that this process was the precursor tocrazing. Complimentary transmission electron microscopy indicated that isolatedvoids of the order of 100 nm could be seen (50).
Tensile dilatometry (51–54), which is commonly used to monitor cavitationin rubber-modified glassy polymers, was extended to fatigue application to moni-tor the volume changes that occur during fatigue loading conditions (55). In thismethod, axial and transverse strain gages are attached to the sample during auniaxial fatigue test. From the axial and transverse strain measurements thetotal volume change (�V
V )T can be calculated from
(�VV
)T
= (1 + εa)(1 + εt)2 − 1 (14)
where εa is the axial strain and εt is the transverse strain. The volume change canthen be further decomposed into an elastic part and an irreversible part denotedby the subscripts e and i respectively in equation 15 below:
(�VV
)T
=(
�VV
)e+
(�VV
)i
(15)
The total volume change can be measured at the peak load during the fa-tigue test and the irreversible part can be measured at the unloaded portion ofthe cycle. In this way the evolution of both the elastic and inelastic volume changecan be monitored during a fatigue test. Figure 13 shows how the irreversible

216 FATIGUE Vol. 6
Fig. 13. Irreversible volume change evolution for polyacetal samples fatigued over a rangeof stress levels (55). σ = 56 MPa, Nf = 102 cycles; σ = 54 MPa, Nf = 3 × 10² cycles;σ = 48 MPa, Nf = 3 × 10⁵ cycles; σ = 45 MPa, Nf = 106 cycles. To convert MPa to psi,multiply by 145.
volume change evolves as a polyacetal specimen is fatigued over a range of stresslevels. The results show that the irreversible volume increased as the samplewas fatigued over a broad range of stress levels. Further, the Poisson’s ratio (seeFig. 14) increases in the low cycle regime but decreases in the high cycle regime.The decrease in Poisson’s ratio is characteristic of an increase in porosity in thematerial.
Recent studies on PMMA have shown that craze initiation appears at a rel-atively early stage in the fatigue life of the material (12). The total fatigue lifeis compared to the onset of craze initiation in Figure 15. In this particular casethe lifetime is governed primarily by the growth of crazes until a defect (crack)approaches the threshold size.
More direct morphological studies were conducted on isotactic polypropylene(iPP) to isolate the mechanisms of fatigue damage and their kinetics (56). Thedamage imposed to samples fatigued in the high cycle regime occurs in the formof crazes. These are shown typically in Figure 16 for the case of iPP subjected to6 × 106 cycles.
Figure 17 shows a sequence of optical micrographs illustrating the evolutionof damage. During fatigue, small crazes initiate and grow homogenously throughthe material. However, as the fatigue test continues, small crazes coalesce andthe arrangement of crazes becomes neither even nor randomly distributed. Thisbecomes especially evident in the samples with a high level of fatigue damage.Clear patterns arise in the form of cascades of crazes (see high magnification inFig. 17) that are clear evidence of craze–craze interactions where the stress in-tensity at one craze tip is shielded by the formation of another craze. Also, careful

Vol. 6 FATIGUE 217
Fig. 14. Poisson’s ratio evolution for polyacetal samples fatigued over a range of stresslevels (55). σ = 56 MPa, Nf = 102 cycles; σ = 54 MPa, Nf = 3 × 10² cycles; σ = 48MPa, Nf = 3 × 10⁵ cycles; σ = 45 MPa, Nf = 106 cycles. To convert MPa to psi, multiplyby 145.
inspection of mature crazes indicates that as the crazes mature, much smallercrazes initiate and grow around each main craze in the form of a process zone,much like that which has been observed in crack propagation in polymers. Ulti-mately the sample becomes saturated with crazes that resemble a planar array ofdamage that is evidently completely dominated by the craze–craze interactions.
50 s 8.3 min 1.4 h 14 h
Fatigue life (2 Hz)
Craze initiation
Str
ess
ampl
itude
, MP
a
Fracture
Crack propagation
Number of cycles
PMMA
10
20
30
40
102 103 104 105
Fig. 15. Plot comparing total fatigue life and time for craze initiation for PMMA (12). Toconvert MPa to psi, multiply by 145.

218 FATIGUE Vol. 6
Fig. 16. Scanning electron micrograph of fatigue-damaged iPP. The arrows denote thedirection of applied load (56).
Eventually, of the crazes approaches the threshold size and subcritical crack prop-agation ensues until failure.
The fatigue damage described in Figure 16 has also been quantitatively de-scribed and the energetics of craze growth has been evaluated (56). This analysisinvolved first approximating the stress intensity of a single craze by treating thecraze as a microcrack of equivalent size with the craze fibrils replaced by a closurestress (traction) across the microcrack face. If a single craze is considered in aninfinite plate, the stress intensity factor Ktot for the craze can be written as (56)
Ktot = Kσ∞ + Kσc = (σ∞ − σc)√
π� (16)
where σ∞ is the remotely applied stress, σ c is the closure traction produced bythe craze fibrils, and � is the craze radius. By substituting an expression for theeffective stress across the craze face as σ = σ∞ −σ c, the stress intensity due toa single craze takes the same form as that of a single crack. Hence, the potentialenergy change of a body containing a single craze would be given by
�
b= 2
∫ �
0Gd� = 2
E0
∫ �
0K2
totd� = πσ 2�2
E0(17)
In equation 17, � denotes the potential energy change in the specimen, b is thespecimen thickness, G is the energy release rate, and E0 is the storage modulusof the undamaged iPP.
In accordance with a Griffith-type criterion for the growth of a craze(G − 2γ = 0 for the necessary condition for craze growth), the following expressionfor the specific energy γ to form a craze is given by

Vol. 6 FATIGUE 219
Fig. 17. Optical micrographs of fatigue damage in iPP tensile base, showing the progres-sion of damage with increasing cycle number (56).
G = 2γ
K2tot
E0= σ 2π�
E0= 2γ
(18)
Rearranging terms in equations 18 yields the following relationship:
σ 2
E0= 2γ
�(19)
Thus far, the relationships apply to an isolated craze embedded in a specimen. Toevaluate the energy release associated with an ensemble of crazes, the interactionof the crazes must be considered. In Reference 56, a damage parameter, similarin fashion to that introduced by Bristow (57), for a two-dimensional case wasconsidered:

220 FATIGUE Vol. 6
ρ = 1A
n∑i = 1
�2i ≈ n�2 (20)
In equation 20, A is some representative area and n becomes the number densityof crazes of radius �. The representative area A is related to the representativevolume V by V = bA. Figure 18a describes how the number density of crazes andmean craze radii (from Fig. 17) change with fatigue life, while Figure 18b showshow the damage density ρ, as defined by equation 20, evolves. Note from thegraphs in Figure 18 that the number density of crazes decreases with increasing
Fig. 18. Graphs describing the evolution of damage between 105 and 106 cycles. (a) Crazenumber density (circles and short dashes) and average craze radius (squares and longdashes) vs cycle number. (b) Damage density (eq. 20) vs number of cycles (56).

Vol. 6 FATIGUE 221
cycle number while the craze length continually increases. This indicates thatcoalescence is a dominating process during the stage of the fatigue process. Also,the damage density ρ continually increases as the fatigue process continues.
For a dilute suspension of cracks (crazes), Bristow (57) showed that the ef-fective modulus E is linearly affected by the damage density in accordance withthe following relationship:
EE0
= 1 − πρ = 1 − nπ�2 (21)
In 1993, Kachanov (58) showed that the following nonlinear approximation(eq. 22) actually remains highly accurate at high crack (craze) densities, providedthe crazes are homogeneously distributed.
EE0
= 11 + πρ
= 1
1 + nπ�2(22)
Kachanov showed that equation 22 holds at high crack (craze) densities sincethe competing interactions of shielding and amplification result in the followingexpression. In Reference 56, an expression for the change in the potential energydensity (potential energy change per representative volume) associated with crazegrowth can be derived by combining equations 16, 17, 18, 19, 20, 21, 22:
�
V= n
(2∫ �
0Gd�
)= n
(2∫ �
0
K2tot
Ed�
)
�
V= σ 2π
E0
(n�2 + 1
2πn2�4
)
�
V= γ (2n� + πn2�3)
(23)
The latter expression in equations 23 describes the specific energy for craze growthin terms of changes in the potential energy density during the fatigue test. Usingequations 23 along with measured information regarding the number densityof crazes and craze radii (Fig. 17), the specific energy for craze growth, γ , wasevaluated for iPP. The results indicated that the energy required to grow a crazeis of the order of 13 J/m2 and was generally constant over the decade of cyclesmeasured.
Fatigue Crack Propagation
Background and Overall Considerations. Many aspects of FCP includ-ing both experimental approach and theory evolve from concepts well establishedin the area of fracture mechanics. Many treatments dealing with both the theory(59–63) as well as associated treatments to polymeric materials (2,5,64,65) havebeen published. The basic tenent of fracture mechanics is that the strength ofmost real solids is governed by the presence of flaws. Many theories have been

222 FATIGUE Vol. 6
developed mathematically to describe the stresses in the presence of a crack aswell as the energy released during crack propagation. Griffith (59) introduced acriterion based on an energy principle and argued that when the change in theelastic potential of a brittle glass equals or exceeds the energy required to createnew crack surface area, the crack will propagate uncontrollably. It has been shown(60–63) that the Griffith criterion can be related to the elastic energy release rateand stress intensity factor for an elastic body. Thus, two parallel criteria arose todescribe the critical conditions for the failure of a body containing a crack (defect).These criteria are written as follows:
GI ≥ GIc
KI ≥ KIc
(24)
In equations 24, whenever the energy release rate GI becomes greater than orequal to the critical energy release rate GIc, the fracture (failure) occurs. Similarly,when the stress intensity factor KI exceeds the fracture toughness KIc, the fractureoccurs. It should be noted that the subscript I in equations 24 refer to mode I failure(opening mode), and similar criteria can be written for modes II (shearing mode)and III (tearing mode). The criteria in equations 24 are conceptually different butare mathematically identical for a linear elastic body since the energy release rateand stress intensity factor are related by
GI = K2I
E ′ (25)
where E′ = E under plane stress conditions and E′ = E/(1 − ν2) under plane strainconditions. Both the energy release rate and stress intensity factor are a function ofthe specimen global geometry, applied stress level, and crack length. Consequently,the stress intensity (and/or energy release rate) will increase even if the stress levelremains constant when the crack length increases. Thus, specimens with largerflaws have a lower nominal strength than specimens in which the flaw sizes aresmaller. This type of approach is commonplace in many engineering applicationstoday and has proven successful to describe the fracture behavior of a wide rangeof materials.
For a given stress level, if the flaw (crack) size is large enough such that thecritical condition(s) expressed in equation(s) 24 is reached, then immediate failureis expected. If however, the stress level or flaw size is reduced, then immediatefailure is postponed but subcritical crack growth may occur. Subcritical crackgrowth refers to the slow progressive growth of a crack prior to reaching a criticalcondition. One of the most common processes to accelerate this process is to applya fatigue load to the body. Consequently, the associated study of subcritical crackgrowth under fatigue load is referred to as fatigue crack propagation (FCP). Manystudies and texts have been devoted to measuring FCP kinetics of polymers andan excellent summary is provided in Reference 2.
One of the earliest attempts to describe the fatigue behavior of materials ingeneral is referred to as the Paris Law (66–68). The Paris Law is an empiricalrelationship that exists between the crack growth rate d�/dN and the change

Vol. 6 FATIGUE 223
in stress intensity factor by
d�
dN= A(�KI)
m (26)
In equation 26, �KI = KImax − KImin, and KImax relates to the stress intensityfactor associated with the maximum stress level in a given cycle and KImin is thecorresponding stress intensity factor associated with the minimum stress in agiven cycle. The coefficients A and m in equation 26 are considered material con-stants. Paris Law (eq. 26) and variations therein have been widely used to describethe crack growth kinetics of a broad range of materials (eg, Ref. 1). However, theapplication of equation 26 has shown to be applicable only over a certain range ofstress intensities (which relates to a certain range of crack sizes).
Many studies have verified the log–log linear relationship between d�/dNand �K, as predicted by equation 26, but others have shown sigmoidally shapedFCP plots. Crack growth rates almost always decrease to vanishingly low valuesas �K approaches a limiting threshold value �Kth and increase markedly atvery high �K when KImax approaches KIc. The asymptote at low �K conditionsdescribes FCP rates that diminish rapidly. As such, a limiting stress intensityfactor range �Kth is defined and represents a service operating limit below whichfatigue damage does not obey the Paris Law.
Figure 19 illustrates a typical sigmoidal-shaped crack growth behavior asillustrated by regions I, II, and III. In region I, a crack is below the threshold sizeand thus does not follow the growth kinetics as described by equation 26. Thus,region I is many times referred to as the nucleation stage. In region II, equation26 applies. Region II is associated with subcritical crack growth and equation 26
Region Inucleationstage
10−2
10−3
10−4
10−5
10−6
0.1 1 10
Region IIsubcriticalcrackgrowth
Region IIIrapid fracture
Fat
igue
cra
ck g
row
th r
ate,
mm
/cyc
le
Cyclic stress intensity factor ∆K, MPa�m1/2
∆Kcrit
∆Kth
Fig. 19. Illustration of typical sigmoidal curve in d�/dN vs �K plot of FCP data. Threeregions are identified: region I associated with damage nucleation; region II associatedwith subcritical crack growth; and region III associated with unstable, rapid failure.

224 FATIGUE Vol. 6
806040201086421.00.80.60.40.2
10 6
10 5
10 4
10 3
10 2
10 1
K, MPa m1/2
B
C
A
D
E F
GH
IL M
N
K
J
d/d
N, m
m/c
ycle
Fig. 20. FCP rates vs �K for several engineering plastics and metal alloys (39). A, LDPE;B, epoxy; C, PMMA; D, polysulfone; E, polystyrene; F, PVC; G, poly(phenylene oxide); H,polycarbonate; I, nylon-6,6; J, HI-nylon-6,6; K, poly(vinylidene fluoride); L, acetal resins;M, 2219-T851 aluminum alloy; N, 300M steel alloy.
can be integrated to predict remaining life of a body containing a crack in thisregion. Region III is associated with unstable, rapid fracture once the flaw hasgrown to a critical size.
Characteristic plots of the FCP data are shown in Figure 20 for severalengineering plastics and metal alloys (69). The samples A–L are polymeric ma-terials (both amorphous and semicrystalline) while M and N are metal alloys.Figure 20 demonstrates the universality of equation 26 to describe the subcriticalcrack growth kinetics of a wide range of materials. The data also generally suggestvalues for the threshold flaw size and critical stress intensity factor for each mate-rial. Notice that some semicrystalline materials show resistance to crack growthapproaching that of metals.
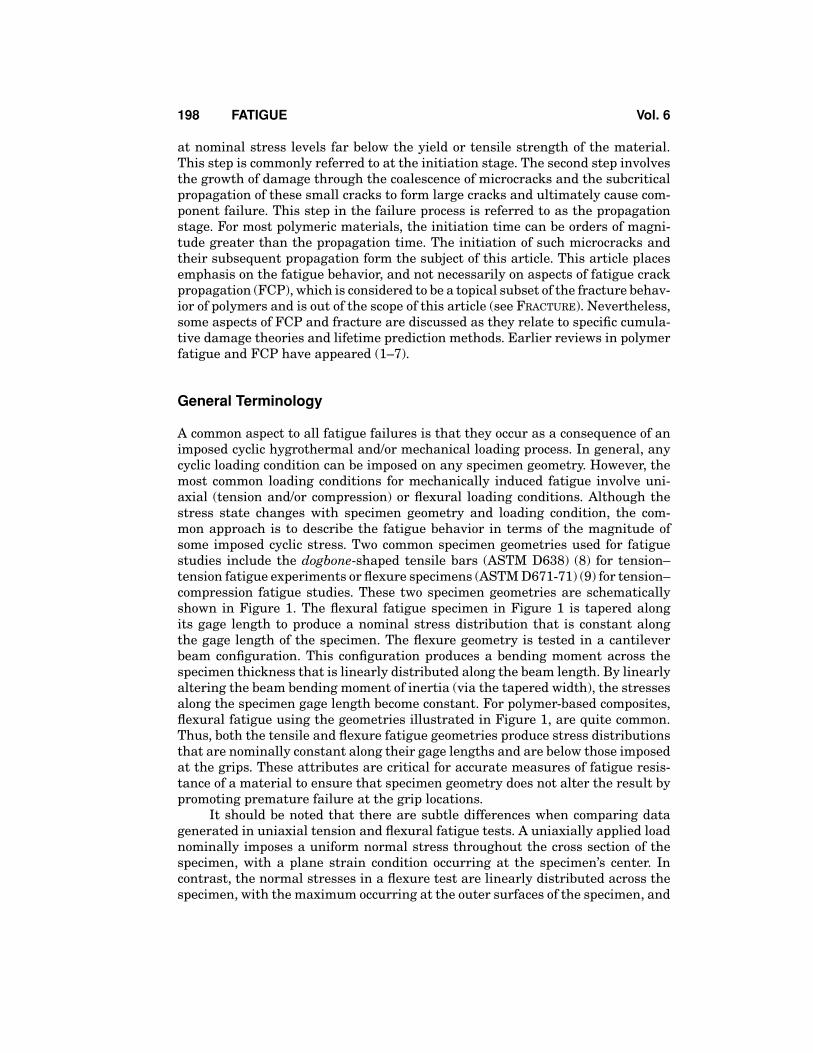
Several studies have determined the threshold stress intensity for engineer-ing plastics, eg, polycarbonate (5). The d�/dN values are in excellent agreementfor growth rates > 10− 5 mm/cycle but differ significantly for lower values. Addi-tional threshold data have been reported for PMMA as a function of stress ratio R,where R = Kmin/Kmax (70). Other studies have been conducted to characterize thenear threshold crack propagation behavior (12,71). Figure 21 (12) shows a σ–Ncurve for polyethersulfone, including data at the near threshold level. Similarly
Vol. 6 FATIGUE 225
10−2
10−3
10−4
10−5
10−6
0.1 1 10
Polyethersulfone
Fatig
ue c
rack
gro
wth
rat
e, m
m/c
ycle
Cyclic stress intensity factor ∆K, MPa�m1/2
Fig. 21. Fatigue crack growth data for polyethersulfone, including data in the near thresh-old regime (12).
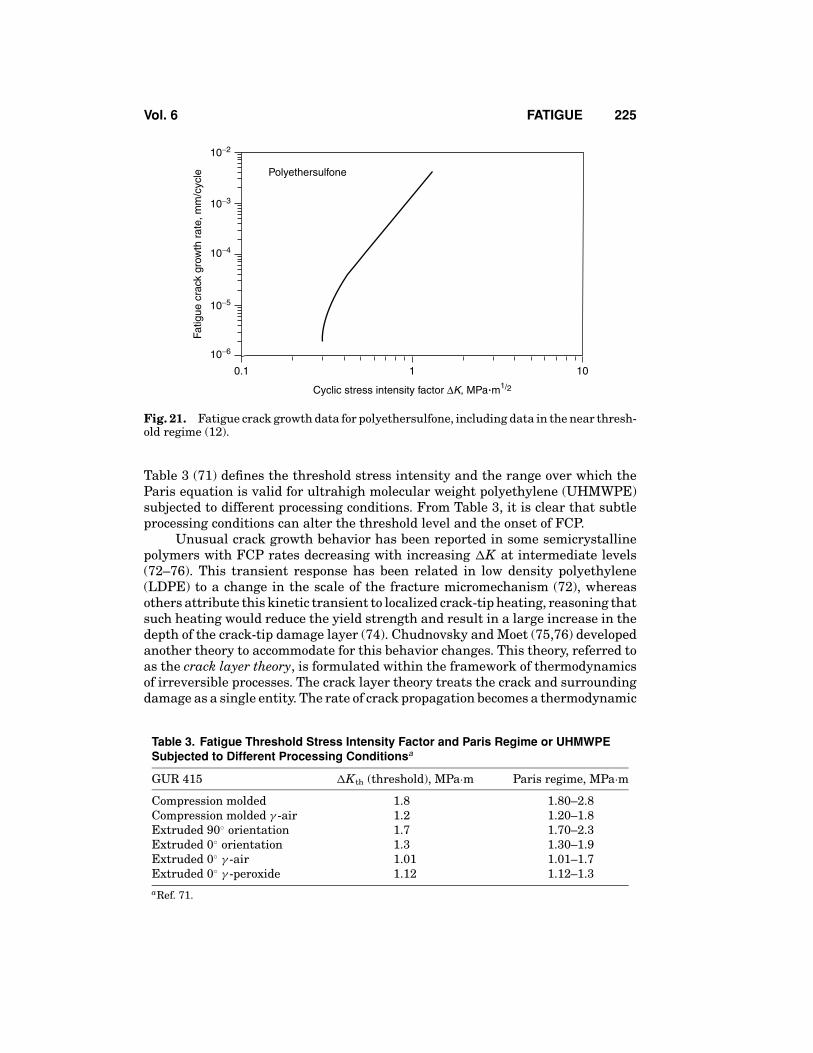
Table 3 (71) defines the threshold stress intensity and the range over which theParis equation is valid for ultrahigh molecular weight polyethylene (UHMWPE)subjected to different processing conditions. From Table 3, it is clear that subtleprocessing conditions can alter the threshold level and the onset of FCP.
Unusual crack growth behavior has been reported in some semicrystallinepolymers with FCP rates decreasing with increasing �K at intermediate levels(72–76). This transient response has been related in low density polyethylene(LDPE) to a change in the scale of the fracture micromechanism (72), whereasothers attribute this kinetic transient to localized crack-tip heating, reasoning thatsuch heating would reduce the yield strength and result in a large increase in thedepth of the crack-tip damage layer (74). Chudnovsky and Moet (75,76) developedanother theory to accommodate for this behavior changes. This theory, referred toas the crack layer theory, is formulated within the framework of thermodynamicsof irreversible processes. The crack layer theory treats the crack and surroundingdamage as a single entity. The rate of crack propagation becomes a thermodynamic
Table 3. Fatigue Threshold Stress Intensity Factor and Paris Regime or UHMWPESubjected to Different Processing Conditionsa
GUR 415 �Kth (threshold), MPa·m Paris regime, MPa·mCompression molded 1.8 1.80–2.8Compression molded γ -air 1.2 1.20–1.8Extruded 90◦ orientation 1.7 1.70–2.3Extruded 0◦ orientation 1.3 1.30–1.9Extruded 0◦ γ -air 1.01 1.01–1.7Extruded 0◦ γ -peroxide 1.12 1.12–1.3aRef. 71.

226 FATIGUE Vol. 6
flux within the theory, with complimentary thermodynamic forces being describedthrough the energy release rate. This theory is capable of predicting the stick-slipcharacter observed in some growth rates.
In the crack layer theory (75,76) the movement of the crack and surround-ing damage is decomposed into elementary movements: translation, rotation,isotropic expansion, and distortion. In this way, the damage surrounding the tipcan evolve in a general sense. These elementary movements become thermody-namic fluxes. The reciprocal forces contain an active part (energy release ratesassociated with each movement) Ai, and a resistive part (an energy barrier) Ri.Within the context of classical irreversible thermodynamics, the entropy of thesystem, Si, can be expressed in terms of a bilinear form of forces and fluxes shownin equation 27.
T.
S =n∑
i = I
(Ai − γ Ri).νi (27)
In equation 27, (Ai − γ Ri) represent the thermodynamic forces for each elementarymovement and νi are the corresponding reciprocal fluxes. The active parts corre-spond to the energy release associated with each movement. The resistive partsconstitute the materials resistance to these movements and contain the intrinsicmaterial property, γ , the specific enthalpy of damage (eg, crazing). The ability ofthis formalism to account for size and shape changes in the process zone duringcrack propagation produces changes in the translational crack propagation rate.Thus, non-Paris FCP can be modeled using this approach.
Effect of Test and Process Conditions. Many studies have evaluatedthe effects of test frequency on the FCP rates in polymers. Although hystereticheating explains a decrease in fatigue resistance with increasing cyclic frequencyin unnotched polymer test samples (eg, eq. 3, Fig. 6, Ref. 24), the fatigue resis-tance of notched polymers is exceedingly complex. FCP rates can decrease, re-main unchanged, or increase with increasing test frequency (77–79). Figure 22illustrates the effect that cyclic frequency has on the FCP rate of poly(vinyl chlo-ride) (PVC). In the case of PVC, the crack speed decreases with increasing fre-quency, but the threshold stress intensity Kth and the fracture toughness KIcremain unchanged. Also notice from the similarity of slopes in the FCP datain Figure 22 that the material coefficient m as defined in the Paris equation(Eq. 26) is insensitive to test frequency. Similar studies (78,79) on polycarbonateshowed that cyclic frequency had virtually no effect on its FCP kinetics. In con-trast, the FCP kinetics in nylon-6,6 over a range of frequencies shows that highercrack speeds occur at higher frequencies. Consequently, no universal behavior isevident.
As expected, test temperature will have a dramatic effect on the FCP kineticsof polymers owing considerably to their temperature-dependent viscoelastic na-ture. Indeed, studies of polystyrene and acrylonitrile–butadiene–styrene (ABS)have shown that FCP rates for given �K level generally decrease with decreas-ing test temperature (80). By contrast, a minimum FCP resistance was notedin polycarbonate and polysulfone at intermediate test temperatures (81,82). Acomplex test-temperature response was also noted in studies on the influence

Vol. 6 FATIGUE 227
10−5
10−4
10−3
10−6
10−5
1 Hz
10 Hz
100 Hz
d�/d
N, m
m/c
ycle
d�/d
N, i
n./c
ycle
0.2 0.4 0.6 0.8 1 2
0.2 0.5 1
∆K, ksi�in.1/2
∆K, MPa�m1/2
Fig. 22. Effect of cyclic frequency on the FCP rate in PVC (77–79).
of test temperature and absorbed water on FCP in nylon-6,6 (83). Of particularinterest was the possibility to normalize the data (83) through empirical use oftime–temperature superposition principles.
The effect of thermal history and process conditions can affect both the un-notched fatigue behavior (43) through physical aging (44) or through changes inthe crystal morphology. Similarly the FCP behavior of semicrystalline polymerscan also be affected through differences in thermal history (84–88). Some studiessuggest that resistance to crack propagation increases with decreasing spherulitesize (84,85), while others claim spherulite size has no effect (86,87). A recent re-port (88) showed that annealed specimens to have a lower resistance to crackinitiation and subsequent propagation. Although the same fracture mechanism,in which the brittle crack gradually becomes more ductile, prevailed in both cases,the annealed material proved to be weaker. This was attributed to differences inthe failure mechanisms at the root of the crack. The annealed sample showed avoided and fibrillated crack tip while the quenched sample showed a nonfibrillatedstructure.
Effect of Molecular Architecture, Morphology, and Microstructure.Striking effects of molecular weight on FCP rates in notched PMMA (89) and PVC(90) have been noted (91,92), and similar strong effects have been reported for

228 FATIGUE Vol. 6
0
1
2
3
1/M × 106
log
d�/d
N (
+5)
0 5 10 15 20
Fig. 23. Functional relationship between FCP rates in PMMA and PVC and reciprocal ofmolecular weight at 10 Hz for �K = 0.6 MPa·m1/2 (89). Data for PVC displaced to the rightby a factor of 2.
polycarbonate (93) and polystyrene (94). In general, the Paris law is followed overa wide range of �K. It was found (94,95) that this data followed the followingempirical relationship:
d�
dN= A
′eB
′/Mw(�K)n (28)
where A′, B′, and n are constants depending on the material and test conditions.Thus, even though values of static toughness may change relatively little over agiven range of molecular weight, small increases in the molecular weight Mw mayresult in up to several orders of magnitude decrease in crack growth rate. Also, theeffect is greater at lower molecular weights. This is shown for the case of PMMAand PVC in Figure 23 (89).
It has also been found (92) that the addition of small amounts of high ormedium molecular weight to PMMA results in greater resistance to both fatigueand static loading, whereas the addition of low molecular weight has a deleteri-ous effect. Since the FCP response can be correlated semiquantitatively with theproportion of high Mw species estimated by gel-permeation chromatography (96),it has been suggested that resistance to cyclic disentanglement is favored by highMw species. While the short time scale of static fracture tests permits relativelylittle disentanglement, the longer time scale involved in fatigue allows the fractureprocess to reflect more strongly the energy dissipation concerned in breakdownof the entanglement network (2). In this sense, the fatigue process resembles the

Vol. 6 FATIGUE 229
longtime relaxation processes in time-to-failure tests (97,98) in which strong ef-fects of molecular weight are also seen. Hence it is likely that during cycling,the entanglements in craze fibrils involving low Mw species are progressivelybroken down, but the longer molecules permit considerable strain hardening tooccur in the fibrils (2,4,99). This conclusion is supported by fractographic evi-dence obtained for specimens of PMMA containing high and low molecular weights(100).
The FCP resistance in semicrystalline polymers is typically higher at highermolecular weight. Examples include high density and ultrahigh molecular weightpolyethylene (101–103), acetal resin (104,105), nylon-6,6 (104), and polypropylene(103). The effect of molecular weight on the FCP rates for these polymers is shownin a comparative plot in Figure 24. In general, however, the sensitivity of the crack
10−6
10−5
10−4
10−3
10−2
d�/d
N, m
m/c
ycle
0.4 0.6 0.8 1 2 3 4 5 6
E
D
C
BA
FH
G
∆K, MPa�m1/2
Fig. 24. Effect of molecular weight on fatigue crack growth rates in high density polyethy-lene (solid line): Mw = 45,000 (A), 70,000 (B), 200,000 (C) (101,102); nylon-6,6 (dashed line):Mn = 17,000 (D), 34,000 (E) (104); and acetal resins (dotted-dashed line): Mn = 30,000 (F),40,000 (G), 70,000 (H) (105).

230 FATIGUE Vol. 6
growth rate to molecular weight is less than that in amorphous polymers. Thismay be due to the effect of the crystal structure stabilizing the polymer throughtie chains and the like.
Some attempts have been made to develop quantitative theories to rational-ize the effects of molecular weight and have met with some success, at least withPMMA, PVC, and polystyrene (94,95,106). Thus it has been proposed that theFCP rate can be expressed as the product of two functions, one involving �K andthe other characteristic of the relaxation process in the plastic zone (95):
d�
dN= f (�K) × 1
τf(29)
where f (�K) reflects the effect of applied stress and τ f, the relaxation time, re-flects the resistance to chain disentanglement. Increased FCP resistance has beencorrelated with increased characteristic stress-relaxation times in PVC (107) anda rubber–polystyrene interpenetrating polymer network (108). Considering thatthe relaxation time follows a Zhurkov-type rate process (33), the following may beexpected:
τf = A′exp
( −Vσ
RT
)(30)
where A′ is a constant and V is the activation volume. Assuming that the stressinvolved is a localized average mean stress in the plastic zone, the following equa-tion can be derived:
d�
dN= f (�K) exp
(σm,yV∞
RT�(M)
)(31)
In equation 31, σm,y = σ y (1 + R)/2, where σ y is the yield stress and R is theload ratio. V∞ is the activation volume for infinite molecular weight M, and ψ(M)reflects the fraction of molecules that can form a mechanically effective entangle-ment network. In terms of molecular weight, ψ(M) is defined as ψ(M) = (V∞/V) =(W − W∗)/(1 − W∗), where W is the weight fraction of molecules when M > M0; M0is the minimum value of M required for a stable network; and W∗ is the minimumweight fraction of those molecules required to form a stable craze. The value of(1 − W∗) is consistent with the void volume of mature crazes in PMMA and PVC(95).
The model applies to PMMA and PVC and gives values of V that agree fairlywell with values for static fracture. Thus a combination of rate process theorywith fracture mechanics can usefully relate molecular and continuum ideas inrationalizing fatigue fracture. Vertical shifting of FCP curves gives master curvesrelative to a very high molecular weight specimen (ψ ∼= 1) as long as �Kth isindependent of M, ie, when M is greater than some limiting value. This is shownin Figure 25 for the case of polystyrene (94). The shift factor av is related to V andψ(M):

Vol. 6 FATIGUE 231
−7
−6
−5
−4
−3
−2
log
d�/d
N, m
m/c
ycle
0.1 1 3
Log ∆K ∗
Fig. 25. Master curve for FCP in polystyrene (10 Hz, sine wave) as a function of stressintensity factor (94). Curve includes data for 12 specimens varying greatly in molecularweight and its distribution, and encompasses both the threshold of crack growth and theapproach to catastrophic fracture.
av = exp(Vσm,y)exp(V∞σm,y)
(32)
An alternative, simpler approach has been proposed in which crack growthis essentially considered the reverse of crack healing (105). In effect, disentangle-ment is taken to be the reverse of interdiffusion of molecules at the surfaces of twoplanes in close contact. Thus, assuming scaling laws for characterizing molecularreptation hold, it has been suggested that d�/dN is proportional to the quotient ofthe distance of interpenetration x to t∞, the time required for complete moleculardiffusion and interpenetration. Since x ∝ M1/2 and t∞ ∝ M3, then
d�
dN∝ M− 2.5 (33)
Both equations 32 and 33 give a good agreement when applied to data inReference 105.
A few controlled studies on the effects that cross-linking has on the FCP resis-tance have been done. When irradiation was used to increase Mw in polystyrene,keeping Mn constant, the fatigue life was affected very little by the total doseapplied. In fact, the FCP behavior did not alter significantly even up to the gelpoint and beyond. The FCP resistance of cross-linked polystyrene is lower than

232 FATIGUE Vol. 6
0.7:11.1:1
1.4:1
1.2:1
0.8:1
1.0:1
1.6:1
1.8:1
2.0:1
10−4
10−3
d�/d
N, m
m/c
ycle
0.4 0.6 0.8 1.0
∆K, MPa�m1/2
Fig. 26. FCP behavior in Epon 828/MDA epoxy as a function of amine/epoxy ratio (num-bers labeling curves) at 10 Hz (113). Dotted line represents other data (110).
that of polystyrene or rubber-modified polystyrene (109). A typical epoxy resin ismuch less resistant to FCP than thermoplastic polymers (2,110). This observa-tion is generally consistent with the ability of cross-linking to inhibit segmentalmobility, crazing, and consequent energy dissipation.
Most systematic studies of cross-linked polymers confirm the above hypoth-esis, but one study reveals an interesting exception. As the percentage of a mul-tifunctional acrylate cross-linking agent in PMMA increased from 0 to 11, theFCP rates increased by over 2 orders of magnitude (at �K = 0.5 MPa·m1/2); theslopes of the d�/dN curves also increased (111). Similar deleterious effects of cross-linking are described in a study of static and fatigue performance in bisphenolA epoxies cured with methylenedianiline (112). These results are presented inFigure 26. Note that as the amine/epoxy ratio decreased from 2:1 to 1:1 (i.e., froma nearly linear to a densely cross-linked resin) KIc decreased and FCP rates in-creased by over an order of magnitude at a given �K. While an excess of amineincreased FCP resistance, an excess of epoxy had the opposite effect. This differ-ence can be explained by considering that the epoxy is difunctional and the curingagent is tetrafunctional. When an excess of di-epoxy exists, the resulting networkhas an effective increase in molecular weight between cross-links, approachingthat of a rubbery network. However, when an excess of curing agent exists, the

Vol. 6 FATIGUE 233
molecular weight between cross-links is not necessarily increased and many ter-minal uncross-linked ends are produced. Thus, the results reflect this differencein network architecture. Note, however, that it would be interesting to compare fa-tigue results at similar temperatures relative to their glass transition rather thanat one temperature since the glass transition is inversely related to the molecularweight between cross-links.
Fractography. The fatigue-fracture-surface micromorphology of engineer-ing plastics is complex. In general, the surface may reveal a range of roughness,and this roughness is usually associated with either a change in stress intensityfactor or stress states. In the interior of a specimen, the stress state is more confin-ing than near the edges, and careful inspection of fracture surfaces usually revealsthis effect. For example, the surface shown in Figure 7 (25) illustrates greater tex-ture near the initiation site where the nucleation and growth process below thethreshold level occurs. Once subcritical crack growth is established, the fracturesurface produces a smoother and uniform texture. At the critical size, rapid frac-ture occurs and the crack speed approaches the stress wave speed in the material.A clear distinction appears at the critical radius in Figure 7, denoting this suddenchange in crack speed. Note in this case, that the surface beyond the critical sizeis notably rougher than the other part of the surface (see also FRACTOGRAPHY).
Figure 27 illustrates a fracture surface on another semicrystalline poly-mer, an aliphatic polyketone terpolymer (114). When comparing Figure 7 withFigure 27, some generic features are noticed, but there are also some contrastingdifferences. Much like that observed in Figure 7, Figure 27 contains a clear penny-shaped crack whose center locates the nucleation site. However, in stark contrastto that observed in Figure 7, Figure 27 shows a distinctly more textured fracturesurface up to the critical radius (see A in Fig. 27). Just at the regime where thecrack reached a critical size, the fracture surface becomes remarkably smoother,followed by a more textured region, and ultimately a very textured region nearthe edge (C in Fig. 27). The region near the edge (Fig. 27C) illustrates how theboundary condition near the free edge affects the texture and indicated a tearingof the last ligaments during the last stage of failure.
In many polymers, fatigue striations can be observed at relatively high �Klevels. These striations correspond to the successive location of the advancingcrack front after each loading cycle or local crack jump. There is a clear distinctionbetween macroscopically observed clamshell markings, which represent periods of
Fig. 27. Scanning electron composite micrograph of fatigue-induced fracture surface inaliphatic polyketone terpolymer: (A) initiation site and subcritical crack growth, (B) criticalradius, and (C) texture associated with remaining ligaments (114).

234 FATIGUE Vol. 6
growth during which hundreds or thousands of loading cycles may have occurred,and fatigue striations, which represent the extent of crack-front advance duringone load excursion. Each fatigue clamshell marking may, therefore, represent theextent of crack advance corresponding to thousands or tens of thousands of indi-vidual load or strain excursions. The microscopic measurement of the FCP rate, ie,striation width, is in excellent agreement with macroscopically determined crackgrowth rates (115). This strong correlation between macroscopic and microscopicgrowth rates in polymeric solids reflects the fact that 100% of the fracture surfacein this �K regime is striated—an observation not typically found in metal alloysystems. In the latter instance, other fracture mechanisms such as cleavage, mi-crovoid coalescence, and intergranular failure are observed in various locationson the fracture surface.
It is common for significant damage to evolve under the crack surface aswell. This occurs because the high stress in the vicinity of the crack tip promotesthe formation of damage. This damage consumes significant energy and is largelyresponsible for the high apparent toughness that many polymers exhibit. Thedamage in the vicinity of the tip can take many different forms and is largelyassociated with the polymer. Common features include crazing in most semicrys-talline polymers and some glassy polymers (eg, polystyrene). Glassy polymerswith higher cohesive energy densities promote shear banding. Stress state willalso play a role in this process. An excellent treatise describing these morpholog-ical features can be found in Reference 65. The damage that occurred below thesurface shown in Figure 27 is illustrated in Figure 28 (114). The damage in thispolymer occurs as an array of crazes, with the highest density near the surfaceof the main craze. As the distance from the fracture surface is increased, the sizeand density of crazes reduce. Earlier stages of this same process are illustratedfor iPP in close-up micrograph in Figure 17 (56).
Fig. 28. Scanning electron micrograph of damage occurring below crack surface in analiphatic polyketone polymer (Ref. 114). Note that the highest density of crazes occursnear the crack surface.
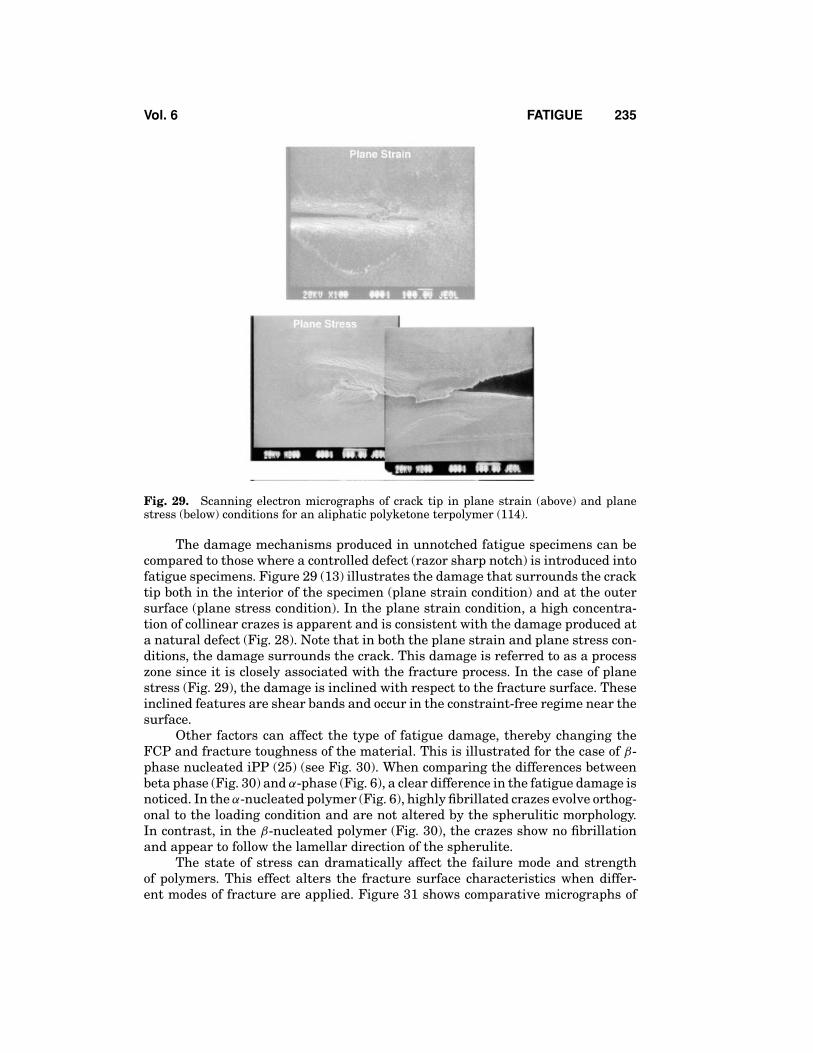
Vol. 6 FATIGUE 235
Fig. 29. Scanning electron micrographs of crack tip in plane strain (above) and planestress (below) conditions for an aliphatic polyketone terpolymer (114).
The damage mechanisms produced in unnotched fatigue specimens can becompared to those where a controlled defect (razor sharp notch) is introduced intofatigue specimens. Figure 29 (13) illustrates the damage that surrounds the cracktip both in the interior of the specimen (plane strain condition) and at the outersurface (plane stress condition). In the plane strain condition, a high concentra-tion of collinear crazes is apparent and is consistent with the damage produced ata natural defect (Fig. 28). Note that in both the plane strain and plane stress con-ditions, the damage surrounds the crack. This damage is referred to as a processzone since it is closely associated with the fracture process. In the case of planestress (Fig. 29), the damage is inclined with respect to the fracture surface. Theseinclined features are shear bands and occur in the constraint-free regime near thesurface.
Other factors can affect the type of fatigue damage, thereby changing theFCP and fracture toughness of the material. This is illustrated for the case of β-phase nucleated iPP (25) (see Fig. 30). When comparing the differences betweenbeta phase (Fig. 30) and α-phase (Fig. 6), a clear difference in the fatigue damage isnoticed. In the α-nucleated polymer (Fig. 6), highly fibrillated crazes evolve orthog-onal to the loading condition and are not altered by the spherulitic morphology.In contrast, in the β-nucleated polymer (Fig. 30), the crazes show no fibrillationand appear to follow the lamellar direction of the spherulite.
The state of stress can dramatically affect the failure mode and strengthof polymers. This effect alters the fracture surface characteristics when differ-ent modes of fracture are applied. Figure 31 shows comparative micrographs of

236 FATIGUE Vol. 6
Fig. 30. Scanning electron micrograph of β-nucleated iPP subjected to 106 cycles (25).
fracture surfaces in carbon fiber epoxy resin composites tested in mode I (openingmode) and mode II (shear mode) loading conditions. Notice that the mode I fracturesurface appears relatively smooth while the mode II surface has a characteristichackled surface. Also, the fracture energy for the mode II sample is greater thanthat of the mode I sample.
Other Factors Affecting Total Fatigue Life
Effects of Chemistry in Homogeneous Polymers. Without knowingthe relative importance of initiation and propagation stages of fatigue damageaccumulation, it is many times difficult to identify the role of material character-istics such as molecular weight and impact modifier content on these two stagesof fatigue damage process. Some preliminary experiments have been reported toidentify the extent of the fatigue crack initiation process as influenced by molec-ular weight, impact modifier level (116), and stress level (6,117). Figure 32 showsa three-dimensional plot illustrating the interactive effects of Mw and rubber con-tent (%) on fatigue crack initiation (FCI) lifetime (Ni) in impact-modified PVC. Therubber phase is methacrylate–butadiene–styrene (MBS) polymer. Ni is defined asthe number of loading cycles necessary to nucleate a crack 0.25 in length from asemicircular surface notch with a radius of 1.59 mm. FCI lifetimes increase withincreasing molecular weight for all rubbery phase contents. Conversely, in highMw PVC blends, rubber modification lowers FCI resistance although the additionof MBS in low Mw PVC slightly improves FCI resistance. The addition of a rub-bery phase to epoxy resin and nylon-6,6 also reduces FCI lifetimes and hastensthermal fatigue, respectively.
In addition to the FCP behavior, the molecular weight and distribution pro-foundly affect both thermal and mechanical properties of polymers (118–120).Thus tensile strength of many polymers is very low or negligible when the aver-age M is low (<104 to 105), but increases rapidly above M0, a characteristic valueof molecular weight, and then levels off (119–124). When M > M0, the relationshipbetween strength and molecular weight may often be expressed by an empiricalequation of the form

Vol. 6 FATIGUE 237
Fig. 31. Scanning electron micrographs of unidirectional carbon fiber epoxy resin com-posites tested in modes I and II test conditions (25).
σB = A− B/Mx (34)
where σB is tensile strength, A and B are constants, and Mx is an average molec-ular weight. Often the number-average molecular weight Mn, which strongly re-flects the presence of chain ends as defects, is appropriate (121,122). Other phys-ical properties vary in a similar fashion (125–128); a sigmoidal shape over thewhole range of M may sometimes be discerned on a log–log plot. The initiationand propagation of fatigue damage also depends strongly on molecular weight.Indeed both static and fatigue fracture are controlled by similar viscoelastic pro-cesses, although the balance of processes and intensity of expression in failurerates differ significantly (2). Energies and volumes of activation tend to be simi-lar for molecular flow and fatigue processes (108,109), and the fatigue resistanceof many polymers correlates well with fracture toughness (2). Thus an earlierproposal (124) that the nature of entanglement networks controls M0 and frac-ture generally has been confirmed and amplified. Much evidence suggests thatonly molecules longer than the average length spanning a craze can form a duc-tile network that can effectively resist crack propagation (113,125,126,129–132).Equation 34 has been derived on this basis, with A = σB for infinite M (132), andthe role of lc, the contour length between entanglements, has been shown to control

238 FATIGUE Vol. 6
Notch stress = 50 MPa14
10
6
2
10
20
30
5 6 7 8
Initi
atio
n lif
e ×
10−3
cyc
les
MW × 10−5
Phr M
BS
Fig. 32. Three-dimensional plot revealing interactive effects of Mw and rubber content(MBS) % on FCI lifetime in PVC (116).
the maximum elongation possible for a polymer (133,134). In addition, high andlow values of the ratio of lc to the rms end-to-end distance between entanglementstend to be associated with crazing and shear yielding, respectively. Experimentalevidence clearly shows that dense, stable crazes can develop only when M > M0(113,135). Although molecular weight may or may not affect the crazing stress(135–137), a direct correlation exists between higher M values and greater abilityto resist propagation of a crack through a craze.
The fatigue resistance depends strongly, and often dramatically, on molecu-lar weight and its distribution (2,4). As Mw increases from 1.6 × 10⁵ to 2 × 10⁶ inthree polystyrenes with narrow molecular weight distributions, the S–N (stress–fatigue life) curves (obtained under conditions yielding negligible hysteretic heat-ing) shift upwards and to the right, and the fatigue endurance limit increasesfrom ∼1/14 to 1/2 of the breaking stress (4,138) (see Fig. 33). Similar improve-ments in fatigue life with increasing molecular weight have also been noted inpulsed compression tests on polystyrene (104). Tensile strength increases by 25%over the range of molecular weight, whereas fatigue strength increases by 100%(4,138–140). Equation 34 holds for tensile strength, but a different dependence isseen for fatigue strength; the ratio of the former to the latter varies from 0.1 to 0.3.The σ–N curve for a polydisperse polystyrene (Mw = 2.7 × 10⁵) was not parallelto the others in Figure 33, and yielded an endurance limit higher than predictedon the basis of the other specimens (4,138,140). This finding is similar to that inwhich the addition of only 1% of high molecular weight species (Mw = 7 × 10⁵)

Vol. 6 FATIGUE 239
0
5
10
15
20
25A B C D
Fatigue life, N
Str
ess,
MP
a
103 104 105 106 107
Fig. 33. Effect of molecular weight on fatigue life in polystyrene. Mw = 1.6 × 10⁵ (A), 3.3× 10⁵ (B), 8.6 × 10⁵ (C), 2.0 × 10⁶ (D). Specimen B has a broader distribution of molecularweight than the others (4). To convert MPa to psi, multiply by 145.
was able to induce craze stability in a brittle, low molecular weight polystyrene(Mw = 104) (113). These results have been attributed to increased entanglementdensity, and hence, orientation hardening of crazed fibrils, and decreased concen-tration of defects in the form of chain ends in long molecules (4,122). At the sametime, increases in fatigue life are not noted when molecular weight is increasedby irradiation, so that polydispersity is essentially constant (140). Under suchconditions, even below the gel point, the benefits of increased molecular weightare clearly overwhelmed by the flaws introduced by chain ends.
Effect of Diluents and Plasticizers. Diluents, plasticizers (qv), resid-ual solvents or monomers, or absorbed environmental agents greatly affect theviscoelastic response of a polymer and related properties such as damping, modu-lus, glass-transition temperature Tg, and yield strength. This resultant changes inproperties can therefore affect fatigue behavior whether the diluents are disperseduniformly in the bulk or only at the surface. The effects of lower stiffness differdepending on whether testing is conducted under constant stress or constant de-flection conditions. In the first case, fatigue behavior may deteriorate becauseof the increase in strain experienced by more compliant specimen. In the lattercase, the more compliant specimens (which experience lower stresses) may exhibitsuperior performance. The increase in compliance may also increase the fatiguelife of a specimen by plasticizing the crack tip and blunting an otherwise brittlefailure. Conversely, it may reduce the fatigue life by reducing the strength of thematerial in the presence of the crack or craze tip.
The σ–N behavior in tension–compression at 7 Hz of plasticized PVC con-taining 10 phr of dioctyl adipate exhibits several features characteristic of otherpolymers (141). Under conditions of high strain amplitude, high ambient temper-ature, and specimen cooling by natural convection, thermal failures are observed:

240 FATIGUE Vol. 6
a steady increase in damping (tan δ) and a decrease in modulus was observed asfailure was approached. In contrast, brittle failure along with crack temperatures,and an increase in storage modulus and a decrease in tan δ prior to failure. How-ever, when thermal failure conditions are coupled with forced-air cooling, brittlefracture is also typical. Also, the criterion (142) for thermal failure is valid (141).
In PVC plasticized with dioctyl phthalate (DOP), FCP rates reportedly in-creased as the DOP concentration increased from 0 to 10–20% (143), suggestingthat lower yield stress and modulus, and resultant tendency toward creep, mayplay an important role. Quite different results were obtained in a later study ata higher frequency, which may have hindered such creep (90). In this case, FCPrates were relatively unchanged by the presence of DOP, although KIc values weresomewhat reduced, especially at the lowest concentration, 6%. Evidently the an-tiplasticizing embrittling effect of DOP at low concentrations was manifested morein the static than in the fatigue response. It is believed that PVC can form an ef-fective entanglement network and stable crazes in the presence of much DOP, andthe long time scale loading characteristic of fatigue may permit extensive cyclicdisentanglement.
With internally plasticized PMMA, i.e., a copolymer with butyl acrylate, stillother effects have been seen (89). As the concentration of butyl acrylate increasesto mole fractions of 0.1 and then 0.2, FCP rates increase dramatically and KIcvalues decrease, presumably because increased ductility is associated with lowerstrength and modulus. However, with a mole fraction of 0.3 butyl acrylate, local-ized crack-tip heating and blunting develop from an increase in damping, and FCPrates decrease, so that the overall behavior, with respect to FCP only, resemblesthat of a commercial PMMA. Hence it appears that a plasticizing comonomer ina chain significantly facilitates the detailed local viscoelastic response and weak-ens craze fibrils, whereas a semimiscible external plasticizer may not necessarilyinhibit the ability to form strong craze fibrils.
The plasticizing influence of absorbed water on the FCP response ofpolyamides has also been studied (144–150). Earlier data were difficult to in-terpret because various experiments employed different test frequencies, meanstress levels, amounts of imbibed water (0–8.5%), and different specimen configu-rations. According to the principles of linear elastic fracture mechanics, specimenconfiguration should have no bearing on material fatigue response, since the prop-agation of fatigue crack is assumed to be controlled entirely by the stress field nearthe crack tip and therefore to be a function of �K only. However, for the case ofengineering plastics that exhibit significant viscoelastic heating at the prevailingtest conditions, variations in specimen configuration have been shown to alterFCP resistance as a result of changes in overall stress range (�σ ) acting on thespecimen (150,151). For example, crack growth rates determined with the center-cracked (CCT) specimens exceed those using wedge-opening load (WOL) samples(151). In addition, greater hysteretic heating occurs in the CCT samples whencompared with those measured in WOL samples. These results are readily under-stood in terms of the expression for the stress intensity factor range, which takesinto account the different geometries.
�K = Y(�σ )√
� (35)

Vol. 6 FATIGUE 241
In equation 35, the function Y accounts for the different specimen geometries(64). Since Y is much smaller for the CCT specimen than for the WOL specimen(64), it follows that �σCCT is much larger than �σWOL; the latter difference in far-field stress distribution alters the hysteretic heat generation capability and therelative stiffness of these samples. Simply stated, the far-field stresses must be in-creased in the CCT specimen to achieve the same change in stress intensity as theWOL specimen. These higher far-field stresses, in turn, produce more hystereticheating.
Nylon–water interactions and their associated influence on mechanical re-sponse are of considerable engineering importance since the absorption of mois-ture occurs readily when the nylon component is in service. Roughly 2.5 wt% wa-ter is imbibed after equilibration at 50% rh. Depending on the property and theamount of water absorbed, effects may be beneficial or deleterious. For example,RT modulus increases marginally with the addition of 2.2% water in nylon-6,6 butis significantly reduced with 8.5% water (152). Such differences in elastic modulushave been traced to the manner by which the water molecules are incorporatedin the nylon. At low absorbed moisture, the polar H2O molecules interrupt thehydrogen bonds between amide groups in neighboring chain segments and createwater bridges between these groups. This tightly bound state is believed to per-sist until all of the hydrogen atoms bond in the amorphous fraction group ratioof 1/2 (153,154). At higher concentrations, weakly bound water is imbibed andessentially serves as a diluent.
Fatigue tests on unnotched samples have demonstrated that the fatiguestrength (the stress corresponding to failure at a given number of cycles) is reducedby as much as 30% when nylon-6,6 is equilibrated at 50% rh (152) (see Fig. 34). Inmarked contrast, it has been found that fatigue growth rates in nylon-6,6 exhibita pronounced minimum at an absorbed moisture content of 2.6 wt% water, and
100
200
300
400
500
102 103 104 105 106 107
1000
2000
3000
4000
5000
6000
Dry, as molded
50% rh
Cycles to failure, Nf
Str
ess,
1b(
wt)
/in.2
Str
ess,
kg(
wt)
/cm
2
Fig. 34. Unnotched fatigue life in nylon-6,6 as a molded and equilibrated at 50% rh (155).The test specimen is 0.775 cm thick.

242 FATIGUE Vol. 6
crack growth rates are higher in saturated material (8.5 wt% water) than in thedry polymer (149,156). The decrease in crack growth rates with increasing watercontent at low moisture can be attributed to enhanced chain mobility and an at-tendant increase in crack-tip blunting associated with localized crack-tip heating.In addition, fatigue resistance is believed to increase with the slight increase inelastic modulus that accompanies the addition of up to 2.5 wt% water. Conversely,the marked increase in crack growth rates at moisture >2.5 wt% is believed toresult from the pronounced reduction of elastic modulus which accompanies highamounts of loosely bound absorbed water (152,154).
The complex influence of absorbed water on FCP resistance in nylon-6,6 andin nylon-6 (149) reflects a competition between the beneficial influence of crack-tip blunting and the deleterious effect of modulus degradation. This competitiveinteraction is reflected in the fatigue-mechanism transition discussed below. Theblunting mechanism dominates the fatigue response at low moisture levels andthe decrease in modulus overshadows crack blunting at higher water contents. Thesame deformation processes occur in fatigue tests on unnotched samples; however,overall global stress levels in these samples are much larger than for the case ofprecracked specimens. As a result, the greater amount of hysteretic heating innylon-6,6 samples equilibrated at 50% rh reduces specimen stiffness resulting inmore damage per cycle than that experienced inferior fatigue properties in theσ–N test.
The influence of absorbed water on FCP resistance is expected to be moresignificant for high impact nylon-6,6 (HI-N66) since this blend exhibits greateramounts of hysteretic heating than neat nylon-6,6 (157). In general, the effect ofwater content on relative ranking in FCP resistance for various nylon-6,6 blendsis related to specimen temperature. At low water contents and low values of �K,heating is beneficial, and blends with more rubber show the best FCP resistance.For these conditions, heating is localized and contributes to crack-tip blunting,which lowers the effective �K. With increasing water content, and/or �K, greaterspecimen heating occurs which is detrimental to fatigue resistance. Since rubberyadditions and extensive hysteretic heating bring about a substantial reduction inE′, the principal cause for reduced FCP resistance in the rich blends containingwater, it is interesting to note that when �K is normalized with respect to theelastic modulus, the richer blends exhibit greater resistance to cyclic strain (157).In general, variations in FCP behavior of HI-N66 depend strongly on changesin the dynamic storage and loss moduli resulting from hysteretic heating. Heat-induced changes in modulus are more important than the absolute temperatureincrease of the sample.
The absorption of water by PMMA also influences fatigue resistance in thisamorphous polymer (158). There is significant reduction in fatigue lifetime withup to 1% water content for extruded PMMA (Mw = 79,300) tested at 27.6 MPa and2 Hz (see Fig. 35). This is related to plasticization and reduction in resistance tocraze initiation and subsequent breakdown. At higher water content, no furtherdeterioration takes place even though the water molecules tend to cluster andaggregate.
Surface Finish and Modification. Previous examples involve essentiallyhomogeneous polymer–diluent systems. Interesting effects with practical conse-quences also occur when unnotched samples are exposed to various environmental

Vol. 6 FATIGUE 243
102
103
104
0 0.5 1.0 1.5
Water content, %
Fatig
ue li
fe, c
ycle
s
2.0 2.5 3.0
Fig. 35. Fatigue life vs water content in extruded PMMA (Mw = 79,300) tested at 27.6MPa and 2 Hz (158).
media (4,159). Because fatigue failure in many cases usually involves initiationat the surface, such effects are to be expected.
Deleterious effects of atmospheric exposure on mechanical properties arewell known. Surface oxidation in rubbers results in embrittlement, surface crack-ing, enhanced fatigue propagation, and reduced fatigue life. Even in a ductileplastic, the formation of brittle surface layers and cracks invariably facilitates theonset of crack propagation under static (51,160) or fatigue loading. For example,when exposed to natural weathering (qv), the fatigue strengths of polystyrene,ABS and acetal resin decrease both in an absolute sense and in a relative sensewith respect to tensile and blending strength.
The role of surface oxidation in the fatigue of polystyrene has been clearlydemonstrated (159). While control samples exhibit an average fatigue life of 25,000cycles in air, lifetimes increase ∼90% by coating with a ductile metal (aluminumor gold, 200 nm thick), and ∼100% by testing in nitrogen. Coating with flexi-ble, rubber polymers or with a low molecular weight oligomer of polystyrene alsoincreases fatigue life in polystyrene (159,161). The relative effect is greater forunpolished specimens; interestingly, the coatings themselves are more effectivethan polishing. It seems likely that these coatings reduce stress concentrationsat surface flaws. Even though the natural rubbers used are susceptible to oxida-tion, the polishing effect is dominant. On the other hand, coating high molecularweight brittle polystyrene layer results in a decrease in fatigue life (4); the propen-sity for facile initiation of craze cracks evidently overcomes any protective effect.Of course, oxidation is favored by stress.
Although liquid environments often induce environmental-stress crazingor crazing in glassy plastics, not all liquids are deleterious to fatigue perfor-mance, and some are beneficial. Typical liquids, eg, heptanes, esters, and alcohols,

244 FATIGUE Vol. 6
decrease the fatigue life of polystyrene (162); the decrease is greater when sol-ubility parameter is closer to that of polystyrene. The increased solubility andplasticization lowers the crazing stress and hence facilitates crack development.In contrast, with liquids known to increase crazing stresses in polystyrene, eg,water, ethylene glycol, or glycerol, fatigue lifetimes increase ∼3×, 4×, and 9×,respectively. This effect is attributed to enhanced hydrogen bonding, to filling ofsurface voids and flaws, or to surface tension changes.
Increase in fatigue life for nylon-6,6 exposed to petroleum ether, water, andalcohols has been reported (163), and the effects of various liquids on fatigueof polycarbonate have been described (164). Various vapors can be beneficial tofatigue life in polystyrene (4,44).
Thermal History. This is an important parameter in determining vis-coelastic and mechanical behavior (165). For example, in amorphous polymers,quenching from temperature above Tg increases the free volume and enthalpy, in-creases yield stress, and decreases fracture toughness (see also AGING). With crys-talline polymers, the morphology (qv) depends very much on the balance betweennucleation and growth corresponding to the rate and pattern of cooling from melt.
Although the fatigue behavior of semicrystalline polymers can be signifi-cantly altered by varying the thermal history, effects of such history on fatigue inamorphous polymers are not well documented. Even though sub-Tg annealing ofpolycarbonate reduces the static fracture toughness, relatively little effect on FCPresponse is noted (165). Similarly, only modest and difficult-to-reproduce FCP ef-fects of quenching and annealing on FCP behavior have been reported for PVC(166,167). Although repetitive cycling can condition the state of a polymer, at leastunder some conditions (168), the fact that yielding occurs within the plastic zoneimplies the attainment of a state of mobility equivalent to a temperature highenough to erase some or all of the effects of the applied history.
Semicrystalline Polymers. As a class, semicrystalline polymers (qv) tendto exhibit superior fatigue resistance, relative to that of amorphous polymers (qv),both in terms of σ–N behavior and FCP rates (2,4,169), as long as tests are con-ducted at frequencies low enough to minimize excessive hysteretic heating. Thisis so, even allowing for variations, due to molecular weight. Indeed even thoughperformance in a standard S–N test at 30 Hz may be relatively poor, many suchpolymers behave very well under service conditions involving lower frequenciesand strains. Thus polypropylene is an excellent material for integral hinges.
Such inherently superior fatigue resistance is not fortuitous. Semicrystallinepolymers having adequate intercrystalline linkages can not only dissipate consid-erable energy when the crystallites are deformed but also form a new and strongcrystalline morphology (170,171). Crystallization developed during straining ofamorphous polymers is responsible for the superior fatigue resistance of strain-crystallizing rubbers (172,173).
Confirmation of the general fatigue superiority of semicrystalline polymersis implicit in studies of σ–N behavior at frequencies low enough to minimize tem-perature rises (169). While the ratios of the endurance limit to tensile strength fortypical amorphous polymers (polystyrene, PMMA, and cellulose acetate) are ap-proximately 0.2, values for nylon-6,6, acetal resin, and polyterafluoroethylene are0.3, 0.5, and 0.5, respectively. At a low frequency, polyethylene (Mw > 50,000) ex-hibits no failure after 5 × 10⁶ cycles, even at the relatively high alternating stress

Vol. 6 FATIGUE 245
of 21 MPa (300 psi) (169). Curves for polymers such as nylon-6,6, poly(vinylidenefluoride), and acetal resin appear to the right of the curve and data for nylon-12also fall in this region.
Polymer Alloys, Blends, and Composites. The fatigue behavior ofmulticomponent polymers can be complex. On one hand, the addition of inho-mogeneities produces stress concentrations that can reduce the fatigue life of astructure dramatically. On the other hand, the heterogeneities may provide mech-anisms of reinforcement, enhanced energy dissipation, or other features that maydramatically improve the overall fatigue life of a material (see POLYMER BLENDS).
With regard to particulate-filled or rubber-modified systems, the polymermatrix must provide the load bearing capability. The geometry and elastic prop-erties of the discrete phase, together with quality of the interface, can all affectthe stress concentration developed by the introduction of the particle. One canconsider that at nominally low cyclic stresses the matrix material in the vicinityof the particles may be effectively cycling at much higher stresses. This, in turn,may shift the apparent high cycle/low cycle fatigue transition (eg, see Figs. 4 and5) to lower stress levels or cycles. Also, the initiation time for damage may beeffectively reduced by the introduction of the stress concentration. However, oncethe damage initiates, these same mechanisms may reduce the subcritical crackgrowth kinetics significantly by dramatically increasing the size of the processzone and increasing the energy dissipated within the process zone. For example,cavitation of a rubber particle can change the failure mode of the matrix poly-mer from a brittle mechanism (crazing or microcracking) to a ductile mechanism(shear banding), thereby increasing the fracture toughness of the material by asmuch as an order of magnitude (51).
The effect of a rubbery phase on the fatigue behavior is an example of suchcomplex behavior. As with an unmodified polymer, high stresses or frequenciesmay generate enough hysteretic heating to induce failure by softening the matrixwhile at lower stresses and/or frequencies a nominally brittle failure can occur.This is shown for the case of ABS in Figure 36 (174). Although hysteretic heatingis common without the introduction of a second phase, the rubbery phase cancause several specific effects. First, a significant decrease in the yield stress andmodulus are typical along with an increase in the creep response. Moreover, thereduction in ultimate elongation associated with cyclic softening may be greaterin rubber-modified polymers (175).
In another more recent study (176), FCP studies were conducted on rubber-toughened polycarbonate. The results indicated that over all ranges of �K, thecrack growth rate was roughly a factor of 20 lower than that for unmodified poly-carbonate. This was found over a range of mean stress levels. However, the thresh-old stress intensity factor �Kth dropped significantly in the modified system ascompared to the unmodified system, indicating that the rubber-toughened systemmay have a shorter initiation time since smaller defects may start to propagateas cracks.
The behavior of polymer alloys and immiscible blends have gener-ally the same complex behavior as rubber-modified systems. In the case ofpolystyrene/polyethylene blends (177), the crack growth rates of the blendswere as much as 20 times lower than that of unmodified polystyrene. How-ever, like the results in Reference 176, the results in Reference 177 show that

246 FATIGUE Vol. 6
16
20
24
28
32
36
40103 104 105
Number of cycles to failure, Nf
Ductile
Brittle
Fatigue
Creep
Duration of tensile loading at fracture, s
10 102 103 104
Str
ess
± σ,
MP
a
Fig. 36. Comparison of σ–N curve under a square-wave loading with creep-rupture datafor a typical ABS polymer (175). Note that the creep-rupture time scale is equivalent tothat of the fatigue cycle scale in terms of time under tensile load. To convert MPa to psi,multiply by 145.
the threshold stress intensity of the blend is lower than that of the modifiedsystem.
In some cases, the heterogeneity may provide an effective reinforcement forthe matrix material (eg, chopped fiber composite). In this type of material, theload is transferred to the fiber from the matrix through shear and the mode IIfracture strength of most polymers is much greater than the mode I strength(eg, Fig. 31). Thus, transmitting the load from the matrix to the reinforcementvia shear is an efficient approach. Once the load is transferred, the fiber mayprovide the necessary strength and long-term durability. In order to realize thistype of reinforcement, adequate fiber lengths and high interface strength arenecessary.
BIBLIOGRAPHY
“Fatigue” in “Fracture and Fatigue” in EPSE 2nd ed., Vol. 7, pp. 378–453, by R. W. Hertzbergand J. A. Manson, Lehigh University.
1. J. A. Manson and R. W. Hertzberg, Crit. Rev. Macromol. Sci. 1, 433 (1973).2. R. W. Hertzberg and J. A. Manson, Fatigue of Engineering Plastics, Academic Press,
Inc., Orlando, Fla., 1980.3. J. C. Radon, Int. J. Fract. 16, 533 (1980).4. J. A. Sauer and G. C. Richardson, Int. J. Fract. 16, 499 (1980).5. M. T. Takemori, Annu. Rev. Mater. Sci. 14, 171 (1984).6. J. A. Sauer and C. C. Chen, Adv. Polym. Sci. 52/53, 169 (1983).

Vol. 6 FATIGUE 247
7. J. M. Schultz, in J. M. Schultz, ed., Treatise on Materials Science and Technology,Part B, Academic Press, Inc., Orlando, Fla., 1977, p. 599.
8. ASTM D638, Standard for Uniaxial Tensile Testing, Vol. 08.01, American Society forTesting and Materials, Philadelphia, Pa., 1985, p. 277.
9. ASTM D671, Standard for Metric Practice, Vol. 08.01, American Society for Testingand Materials, Philadelphia, Pa., 1985, p. 277.
10. A. Wohler, Engl. Abstr. Eng. 2, 199 (1971).11. M. N. Riddell, Plast. Eng. 30(4), 71 (1974).12. J. Kallrath and co-workers, Polym. Testing 18, 11 (1999).13. A. J. Lesser, J. Appl. Polym. Sci. 58, 869 (1995).14. D. A. Opp, D. W. Skinner, and R. J. Wiktorek, Polym. Eng. Sci. 9(2), 121 (1970).15. I. Constable, L. E. Culver, and J. G. Williams, Int. J. Fract. Mech. 6, 279 (1970).16. J. L. Weaver and C. L. Beatty, Polym. Eng. Sci. 12, 1117 (1978).17. S. B. Ratner and V. I. Korobov, Mekh. Polim. 1(3), 93 (1965).18. A. X. Schmidt and C. A. Marlies, Principles of High Polymer Theory and Practice,
McGraw-Hill Book Co., New York, 1948, p. 578.19. J. D. Ferry, Viscoelastic Properties of Polymers, 3rd ed., John Wiley & Sons, Inc., New
York, 1980.20. M. N. Riddell, G. P. Koo, and J. L. O’Toole, Polym. Eng. Sci. 9, 339 (1966).21. L. J. Broutman and S. K. Gaggar, Int. J. Polym. Mater. 1, 295 (1972).22. K. Oberbach, Kunstoffe 55, 356 (1965).23. H. Hachmann and E. Strickle, in Soviet Plastics and Engineering Annual Technology
Conference, Vol. 26, 1968, p. 512.24. R. J. Crawford and P. P. Benham, Polymer 16, 980 (1975).25. A. J. Lesser, Unpublished results, 1998.26. M. A. Minor, J. Appl. Mech. 67, A159 (1945).27. S. S. Manson, Avoidance, Control, and Repair of Fatigue Damage, Metal Fatigue
Damage-Mechanism Detection, Avoidance and Repair, ASTM STP495, American So-ciety for Testing and Materials, Philadelphia, Pa., 1970, p. 254.
28. M. Frendahl and I. Rychlik, Int. J. Fatigue 15, 265–272 (1993).29. G. B. McKenna and R. W. Penn, Polymer 21, 213–220 (1980).30. A. Tobolsky and H. J. Eyring, Chem. Phys. 11, 125 (1943).31. B. D. Coleman, J. Polym. Sci. 20, 447 (1956).32. B. D. Coleman, J. Appl. Phys. 29, 527 (1958).33. S. N. Zhurkov, Int. J. Fract. Mech. 1, 311 (1965).34. L. M. Kachanov, Int. J. Sol. Struct. 23(1), 23 (1987).35. A. I. Kunin, in E. Kroner, ed., Mechanics of Generalized Continua, Springer-Verlag,
Heidelberg, Germany, 1968.36. Z. P. Bazant, J. Eng. Mech. 117, 1070 (1991).37. C. L. Chow and Y. Wei, Int. J. Fracture 50, 301 (1991).38. V. Bouda, J. Polym. Sci., Polym. Phys. 14, 2313 (1976).39. A. Takahara and co-workers, J. Appl. Polym. Sci. 25, 597 (1980).40. N. Kaiya, A. Takahara, and T. Kajiyama, Polymer 22, 859 (1990).41. T. Kajiyama and A. Takahara, Memoirs Fac. Eng. 51(3), 163 (1991).42. S. Sakurai and co-workers, Polymer 35, 532 (1994).43. L. B. Liu, A. F. Yee, and D. W. Gidley, J. Polym. Sci., Polym. Phys. 30, 221 (1992).44. L. C. E. Struik, Physical Aging in Amorphous Polymers and Other Materials, Elsevier
Science, New York, 1978.45. D. G. LeGrand, J. Appl. Polym. Sci. 13, 2129 (1969).46. R. A. Bubeck, S. E. Bales, and H. D. Lee, Polym. Eng. Sci. 24, 1142 (1984).47. S. N. Zhurkov and co-workers, J. Polym. Sci. 10, 1509 (1972).48. D. E. LeGrand and co-workers, Polym. Eng. Sci. 22, 929 (1982).

248 FATIGUE Vol. 6
49. L. B. Liu, D. Gidley, and A. F. Yee, J. Polym. Sci., Polym. Phys. 30, 231 (1992).50. H. A. Hristov, A. F. Yee, and D. Gidley, Polymer 30, 3604 (1994).51. C. B. Bucknall, Toughened Plastics, Applied Science, Publishers, London, 1977.52. H. J. Sue and A. F. Yee, J. Mater Sci. 24, 1447 (1989).53. U. Yilmazer and R. J. Farris, J. Appl. Polym. Sci. 28, 3369 (1983).54. M. L. Shiaao and co-workers, Polymer 35, 306 (1994).55. A. J. Lesser, Polym. Eng. Sci. 36, 2366 (1996).56. N. A. Jones and A. J. Lesser, J. Polym. Sci., Polym. Phys. 36, 2751 (1998).57. J. R. Bristow, J. Appl. Phys. 11, 81 (1960).58. M. Kachanov, in J. Hutchinson and T. Wu, eds., Advances in Applied Mechanics,
Academic Press, Inc., New York, 1993, p. 259.59. A. A. Griffith, Trans. R. Soc. London A 221, 163 (1920).60. H. M. Westergaard, Trans. ASME J. Appl. Mech. 61, 49 (1939).61. G. R. Irwin, Trans. ASME J. Appl. Mech. 24, 361 (1957).62. G. R. Irwin, Handb. Phys. 7, 551 (1958).63. G. R. Irwin, Trans. ASME Ser. D 82, 417 (1960).64. J. G. Williams, Fracture Mechanics of Polymers, Ellis Horwood Ltd., London, 1984.65. A. J. Kinloch and R. J. Young, Fracture Behavior of Polymers, Elsevier Applied Science
Publishers, Ltd., Barking, U.K., 1983.66. P. C. Paris and F. Erdogan, J. Basic Engg. 85, 528 (1963).67. P. C. Paris, in Proceedings of the 10th Sagamore Army Materials Research Conference,
Syracuse University Press, Syracuse, Italy, 1964, p. 107.68. P. C. Paris, M. P. Gomez, and W. E. Anderson, Trends Engg. 13, 9 (1961).69. J. A. Manson, R. W. Hertzberg, and P. E. Bretz, in S. R. Valuri, D. M. R. Taplin, R.
RamaRao, J. F. Knott, and R. Dubey, eds., Advances in Fracture Research, Proceedingsof the 5th International Conference on Fracture, Vol. 1, Pergamon Press, Oxford, U.K.,1982, p. 443.
70. L. Jilken and C. G. Gustsfson, in Backlund, A. Blom, and C. J. Beevers, eds., FatigueThresholds, Fundamental and Engineering Applications, EMAS, Warley, U.K., 1981,p. 715.
71. L. Pruitt and L. Bailey, Polymer 39, 1545 (1998).72. E. H. Andrews and B. J. Walker, Proc. R. Soc. London, Ser. A 325, 57 (1971).73. P. E. Bretz, R. W. Hertzberg, and J. A. Manson, Polymer 20, 575 (1981).74. T. A. Morelli and M. T. Takemori, J. Mater. Sci. 19, 385 (1984).75. A. Chudnovsky and A. Moet, Org. Coat. Plast. Chem. 45, 607 (1981).76. A. Chudnovsky and A. Moet, Polym. Eng. Sci. 22, 922 (1982).77. M. D. Skibo, Ph.D. dissertation, Lehigh University, 1977.78. R. W. Hertzberg, J. A. Manson, and M. D. Skibo, Polym. Eng. Sci. 15, 252 (1975).79. R. W. Hertzberg, M. D. Skibo, and J. A. Manson, ASTM STP700, Standard for Metric
Practice, American Society of Testing and Materials, Philadelphia, Pa., 1980, p. 490.80. Y. W. Mai and J. G. Williams, J. Mater. Sci. 14, 1933 (1979).81. G. C. Martin and W. W. Gerberich, J. Mater. Sci. 11, 231 (1976).82. R. J. Wann, G. C. Martin, and W. W. Gerberich, Polym. Eng. Sci. 16, 645 (1976).83. M. T. Hahn and co-workers, Polymer 27, 1017 (1986).84. J. Runt and M. Jacq, J. Mater. Sci. 24, 1421 (1989).85. R. A. Bubeck and H. M. Baker, Polymer 23, 1680 (1982).86. J. T. Yeh and J. Runt, J. Polym. Sci., Polym. Phys. 29, 371 (1991).87. K. Karger-Kocsis, Composites 21, 243 (1990).88. J. J. Strebel and A. Moet, J. Polym. Sci., Polym. Phys. 33, 1969 (1995).89. S. L. Kim and co-workers, Polym. Eng. Sci. 17, 194 (1977).90. M. D. Skibo, J. A. Manson, and R. W. Hertzberg, J. Macromol. Sci., Part B: Phys. 14,
525 (1977).

Vol. 6 FATIGUE 249
91. C. M. Rimnac and co-workers, J. Macromol. Sci. Phys. 19, 351 (1981).92. S. C. Kim and co-workers, Polym. Eng. Sci. 18, 1093 (1978).93. G. Pitman and I. M. Ward, J. Mater. Sci. 15, 635 (1980).94. J. C. Michel, J. A. Manson, and R. W. Hertzberg, Polym. Prepr. (Am. Chem. Soc., Div.
Polym. Chem.) 26(2), 141 (1985).95. J. C. Michel, J. A. Manson, and R. W. Hertzberg, Polymer 25, 1657 (1981).96. R. E. Robertson, in R. D. Deanin and A. M. Crugnola, eds., Toughness and Brittle-
ness of Plastics (Advances in Chemistry Series No. 154), American Chemical Society,Washington, D.C., 1976, p. 89.
97. J. F. Rudd, Polym. Lett. 1, 1 (1963).98. D. M. Bigg, R. T. Leininger, and C. S. Lee, Polymer 22, 539 (1981).99. R. W. Hertzberg, M. D. Skibo, and J. A. Manson, ASTM STP675, American Society
for Testing and Materials, Philadelphia, Pa., 1979, p. 471.100. J. Janiszewski, R. W. Hertzberg, and J. A. Manson, ASTM STP743, Standard for
Metric Practice, American Society for Testing and Materials, Philadelphia, Pa., 1981,p. 125.
101. F. X. de Charentenay, F. Laghouati, and J. Dewas, Deformation, Yield and Fractureof Polymers, Plastics and Rubber Institute, London, 1979, p. 6.1.
102. G. M. Connelly and co-workers, J. Orthoped. Res. 2, 119 (1984).103. C. Sheu and R. D. Goolsby, Org. Coat. Appl. Polym. Sci. Proc. 48, 833 (1983).104. P. E. Bretz, J. A. Manson, and R. W. Hertzberg, J. Appl. Polym. Sci. 27, 1707
(1982).105. R. W. Hertzberg, M. D. Skibo, and J. A. Manson, J. Mater. Sci. 13, 1038 (1978).106. R. P. Wool, Polym. Prepr. (Am. Chem. Soc., Div. Polym. Chem.) 23(2), 62 (1982).107. C. Su, M.S. Report, Lehigh University, 1984.108. S. Qureshi, J. A. Manson, J. C. Michel, R. W. Hertzberg, and L. H. Sperling, in S. S.
Labana and R. A. Dickie, eds., Characterization of Highly Cross-Linked Polymers (ACSSymposium Series No. 243), American Chemical Society, Washington, D.C., 1984, p.109.
109. R. W. Hertzberg, J. A. Manson, and W. C. Wu, ASTM STP536, American Society forTesting and Materials, Philadelphia, Pa., 1973, p. 391.
110. S. A. Sutton, Eng. Fract. Mech. 6, 587 (1974).111. S. Qureshi, in Ref. 2, p. 122.112. S. L. Kim and co-workers, Polym. Eng. Sci. 18, 1093 (1978).113. S. Wellinghoff and E. Baer, J. Macromol Sci., Part B: Phys. 11, 367 (1975).114. N. A. Jones and A. J. Lesser, J. Polym. Sci., Polym. Phys. 37, 3246 (1999).115. P. B. Lindley and A. Stevenson, in F. Sherratt and J. B. Sturgeon, eds., Materials,
Experimentation and Design in Fatigue, Westbury House Publishers, Ltd., Surrey,U.K., 1981, p. 181.
116. J. T. Turkanis (Brennock), R. W. Hertzberg, and J. A. Manson, Deformation, Yield andFracture of Polymers, Plastics and Rubber Institute, London, U.K., 1985, Paper 54.
117. J. F. Mandell and J. P. F. Chevaillier, Polym. Eng. Sci. 25, 170 (1985).118. H. H. Kausch, Polymers Properties and Applications, Vol. 2, Springer-Verlag, New
York, 1978.119. H. W. McCormick, F. M. Brower, and L. Kim, J. Polym. Sci. 39, 87 (1959).120. J. R. Marin, J. F. Johnson, and A. R. Cooper, J. Macromol. Sci., Part C: Rev. Macromol.
Chem. 8, 57 (1972).121. P. I. Vincent, Polymer 1, 425 (1960).122. J. A. Sauer, Polymer 19, 859 (1978).123. J. H. Golden, B. L. Hammant, and E. A. Hazell, J. Polym. Sci., Part A 2, 4787
(1964).124. A. N. Gent and A. G. Thomas, J. Polym. Sci., Part A-2 10, 571 (1972).

250 FATIGUE Vol. 6
125. R. P. Kusy and D. T. Turner, Polymer 17, 161 (1976).126. R. P. Kusy and M. J. Katz, J. Mater. Sci. 19, 1475 (1984).127. J. P. Berry, J. Polym. Sci., Part A 2, 4069 (1964).128. G. L. Pitman and I. M. Ward, Polymer 20, 895 (1979).129. R. P. Kambour, J. Polym. Sci., Macromol. Rev. 7, 1 (1973).130. H. H. Kausch, Kunstoffe 65, 1 (1976).131. G. W. Weidmann and W. Doll, Colloid Polym. Sci. 254, 205 (1976).132. D. J. Turner, Polymer 23, 626 (1982).133. A. M. Donald and E. J. Kramer, J. Polym. Sci., Polym. Phys. Ed. 20, 899 (1982).134. A. M. Donald and E. J. Kramer, Polymer 23, 457 (1982).135. D. L. G. Lainchbury and M. Bevis, J. Mater. Sci. 19, 2222 (1984).136. J. F. Fellers and B. F. Kee, J. Appl. Polym. Sci. 18, 2355 (1974).137. J. A. Sauer and C. C. Chen, Toughening of Plastics, Plastics and Rubber Institute,
London, 1985, Paper 26.138. J. A. Sauer, E. Foden, and D. R. Morrow, Polym. Eng. Sci. 17, 246 (1977).139. C. L. Beatty and J. L. Weaver, Bull. Am. Phys. Soc. 24, 378 (1979).140. S. Warty, J. A. Sauer, and A. Charlesby, Eur. Polym. J. 15, 445 (1979).141. A. Takahara and co-workers, J. Appl. Polym. Sci. 25, 597 (1980).142. I. Constable, J. G. Williams, and D. J. Burns, J. Mech. Eng. Sci. 12, 20 (1970).143. K. Suzuki and co-workers, Kobunshi Kagaku 28, 920 (1971).144. P. E. Bretz, R. W. Hertzberg, J. A. Manson, and A. Ramirez, in S. P. Rowland, ed.,
Water in Polymers (ACS Symposium Series No. 127), American Chemical Society,Washington, D.C., 1980, p. 32.
145. S. Arad, J. C. Radon, and L. E. Culver, J. Appl. Polym. Sci. 17, 1467 (1973).146. S. Arad, J. C. Radon, and L. E. Culver, Eng. Fract. Mech. 4, 511 (1972).147. H. A. El-Hakeem and L. E. Culver, Int. J. Fract. 1, 133 (1979).148. R. W. Hertzberg and co-workers, Polymer 39, 1754 (1998).149. P. E. Bretz, R. W. Hertzberg, and J. A. Manson, J. Mater. Sci. 16, 2061 (1981).150. M. T. Hahn and co-workers, Polymer 23, 1675 (1982).151. R. W. Lang and co-workers, J. Mater. Sci. Lett. 3, 224 (1924).152. Zytel Design Handbook, E. I. du Pont de Nemours & Co., Wilmington, Del., 1972.153. N. G. McCrum, B. F. Read, and G. Williams, Anelastic and Dielectric Effects in Poly-
meric Solids, John Wiley & Sons, Inc., New York, 1967.154. R. Puffr and J. Sabeda, J. Polym. Sci., Part C 5, 79 (1967).155. M. I. Kohan, Nylon Plastics, John Wiley & Sons, Inc., New York, 1973.156. P. E. Bretz, R. W. Hertzberg, and J. A. Manson, Polymer 39, 2482 (1998).157. M. T. Hahn, R. W. Hertzberg, and J. A. Manson, J. Mater. Sci. 21, 31 (1986).158. C. C. Chen, J. Shen, and J. A. Sauer, Polymer 26, 89 (1985).159. J. A. Sauer, S. Warty, and S. Kaka, in Ref. 137, Paper 28.160. C. C. Chen, N. Chheda, and J. A. Sauer, in Ref. 102,109.161. S. Warty, J. A. Sauer, and D. R. Morrow, Polymer 19 1465 (1978).162. S. B. Ratner and N. L. Barasch, Mekh. Polim. 1(1), 124 (1965).163. J. Miltz, A. T. DiBenedetto, and S. Petrie, J. Appl. Polym. Sci. 28, 2037 (1983).164. N. Chheda, C. Chen, and S. Kaka, cited in J. A. Sauer in Ref. 4.165. J. A. Manson, R. W. Hertzberg, S. L. Kim, and W. C. Wu, in Ref. 96, p. 146.166. S. Webler, Ph.D. dissertation, Lehigh University, 1983.167. C. M. Rimnac, Ph.D. dissertation, Lehigh University, 1983.168. T. C. Ho, Ph.D. dissertation, Rensslaer Polytechnic Institute, Troy, N.Y., 1973.169. J. A. Sauer and K. D. Pae, in H. J. Kaufman and J. J. Falcetta, eds., Introduction to
Polymer Science, John Wiley & Sons, Inc., New York, 1977, Chapt. “7”.170. G. P. Koo and L. G. Roldan, J. Polym. Sci., Polym. Lett. Ed. 10, 1145 (1972).171. G. Meinel and A. Peterlin, J. Polym. Sci., Polym. Lett. Ed. 9, 67 (1971).

Vol. 6 FERROELECTRIC LIQUID CRYSTALLINE ELASTOMERS 251
172. E. H. Andrews, Fracture of Polymers, Elsevier Science Publishing Co., New York,1968.
173. E. H. Andrews, J. Appl. Phys. 32, 542 (1961).174. C. B. Bucknall and W. W. Stevens, Toughening of Plastics, Plastics and Rubber Insti-
tute, London, 1978, Paper 24.175. G. Menges and E. Weigand, in Proceeding of the 21st Annual Technical Conference of
the Society of Plastics Engineers, 1975, p. 465.176. E. J. Moscala, J. Appl. Polym. Sci. 49, 53 (1994).177. M. N. Bureau, J. I. Dickson, and J. Denault, J. Mater. Sci. 33, 1405 (1998).
ALAN J. LESSER
University of Massachusetts