fatigue behavior of an epoxy polymer subjected to cyclic shear loading
TRANSCRIPT

A
popos©
K
1
draapirrt[aowpttamfda
0d
Materials Science and Engineering A 486 (2008) 38–44
Fatigue behavior of an epoxy polymer subjected to cyclic shear loading
Gang Tao, Zihui Xia ∗Department of Mechanical Engineering, University of Alberta, Edmonton, Alberta T6G 2G8, Canada
Received 21 June 2007; received in revised form 17 August 2007; accepted 21 August 2007
bstract
Strain-range-controlled fully reversed cyclic shearing fatigue tests have been performed on thin-walled tubular specimens made of an epoxyolymer. The engineering shear strain was measured by a non-contact real-time strain measurement and control system recently developed inur lab. The synchronized stress–strain data were recorded by the system for full lives of the specimens. Therefore evolutions of mechanical
roperties of the epoxy polymer during fatigue process could be analyzed based on the retrieved stress–strain data. It was found that life dataf the shearing fatigue tests were well correlated with the uniaxial fatigue test data of the material by using the suggested stress-, strain- ortrain-energy-density-based multiaxial fatigue criteria. 2007 Elsevier B.V. All rights reserved.tassi c
otrmifsocepaits
2
n
eywords: Epoxy polymer; Cyclic shear; Multiaxial fatigue; Viscoelasticity; S
. Introduction
Uniaxial fatigue behavior of a bisphenol A/non-methyleneianiline (MDA) polyamine epoxy has been investigatedecently [1–3], among which the effects of mean stress/strainnd ratcheting strain were studied by strain-range-controllednd stress-controlled uniaxial fatigue tests, respectively. In mostractical applications, the structures can be under multiax-al loading conditions. Therefore, multiaxial fatigue tests areequired to investigate multiaxial fatigue behavior of the mate-ials. As a typical multiaxial fatigue test, cyclic shear fatigueest has been extensively adopted in investigations for metals4–6] and for composites [7–9] (the pure shear is equivalent tobiaxial principal stress state having the same amplitude but
pposite signs in the two principal directions). Some researchork has been reported on the uniaxial fatigue behavior of epoxyolymers. However, there have been still few data on their mul-iaxial fatigue behavior [10]. One reason could be attributedo the lack of effective strain measurement devices in multi-xial fatigue tests of such soft materials. Traditional contacteasurement devices, such as extensometers, are not suitable
or fatigue tests of polymers, because its knives could intro-uce stress concentration on the surface of the specimen andccelerate the damage. Moreover, synchronized measurement
∗ Corresponding author. Tel.: +1 780 492 3870; fax: +1 780 492 2200.E-mail address: [email protected] (Z. Xia).
mi2iwet
921-5093/$ – see front matter © 2007 Elsevier B.V. All rights reserved.oi:10.1016/j.msea.2007.08.044
riterion; Non-contact real-time strain measurement
f normal and shear strains in multiaxial fatigue tests increaseshe complexity. With the help of a new developed non-contacteal-time strain measurement system [11], more precise straineasurement can be conducted for full fatigue lives of the spec-
mens and thus allowing an in-depth investigation on multiaxialatigue behavior of the epoxy polymer. In this paper, results ofhearing fatigue tests of an epoxy polymer are presented. Basedn the retrieved stress–strain data the evolution of mechani-al properties, such as shear modulus, stress range and strainnergy densities were analyzed. Fatigue life predictions wereerformed based on stress approach, strain approach and energypproach, respectively. It was found that life data of the shear-ng fatigue tests were well correlated with the uniaxial fatigueest data of the material by using the suggested stress-, strain- ortrain-energy-density-based multiaxial fatigue criteria.
. Specimen and test system
Epon 826 Resin and Epi-Cure Curing Agent 9551 (a bisphe-ol A/non-MDA (methylene dianiline) polyamine system) wereixed in the weight ratio of 100:36. Then the mixing was cast
nto the moulds and cured in an oven for 2 h at 50 ◦C and then.5 h at 120 ◦C. The castings were cooled to room temperature
n the oven. Afterwards, the tubular specimens shown in Fig. 1,ere machined by a CNC lathe. To avoid the surface roughnessffect, the inner and outer surfaces of each specimen were fur-her polished by fine abrasive paper and alumina powder (size of

G. Tao, Z. Xia / Materials Science and Engineering A 486 (2008) 38–44 39
5twppopw4gmeslhtCaeca
Ft
datcsmbrsiil
3
TS
N
SSSSSSSSSS
Fig. 1. A schematic drawing and a photo of the specimen.
�m) to reach an average surface roughness Ra ≤ 0.3 �m withhe maximum surface roughness Rmax ≤ 0.2 �m. Each specimenas heat-treated at 80 ◦C for 12 h and then cooled to room tem-erature in the oven 1 day before the test in order to avoid anyossible aging effect. More stable and repeatable test data werebserved by such “thermal recovery treatment” on this epoxyolymer material [12]. End tabs made of 6061-T6 Aluminumere glued to both ends of the specimen with the 3-M Type DP-60 Epoxy Adhesive so that the specimen can be inserted into theripping system of the test machine. And both ends of the speci-en were inserted about 20 mm deep into the end tabs to ensure
nough bonded area and no relative movement between thepecimen and the aluminum end tabs at high shear stress/strainevel. All the torsional fatigue tests were performed by a servo-ydraulic triaxial test system described in [13]. The setup ofhe test system is shown in Fig. 2. A Matrox Meteor-II/Multi-hannel frame grabber was installed in a personal computernd connected with a Sony XC-HR70 Monochrome CCD cam-
ra (8 bit 1024 × 768) for image capturing. A data acquisitionard installed in the computer was dedicated to data acquisitionnd system control.tlc
able 1ummary of test parameters and results
o. γa (%) τa (MPa) �Wda
1 5.61 38.7 524.02 5.37 38.2 455.83 5.17 36.9 413.54 4.21 31.3 261.55 3.60 27.7 175.46 3.47 26.9 171.27 3.16 25.3 145.48 2.83 24.2 95.19 2.56 22.2 81.010 2.23 20.9 51.2
ig. 2. Setup of the non-contact real-time strain measurement and control sys-em.
Two tiny marks spaced about 18 mm apart along the longitu-inal direction were painted on the outer surface of the specimens shown in Fig. 1(b). During test process, the displacements ofhese two marks were tracked by a program where digital imageorrelation method (DICM) [14,15] was implemented. Sheartrain was then calculated by derivation of the relative displace-ent between these two marks. More details of this system have
een elaborated in Ref. [11]. Either stress-controlled or strain-ange-controlled tests can be performed by this system. In thetrain-range-controlled fatigue test, the strain value was retrievedn real-time and compared with predefined maximum and min-mum limits continuously. If the strain exceeded the predefinedimits, the load direction was reversed.
. Experimental procedure and results
Totally 10 tests were carried out under fully reversed cyclicorsional load. The test parameters and fatigue life results wereisted in Table 1. Since our previous uniaxial fatigue tests wereonducted at a loading rate of 10 MPa/s, in order to compare
vg (kJ/m3) �Weavg (kJ/m3) Nf (cycles)
996.3 137961.6 158876.2 407602.4 816463.3 1,341430.9 6,843367.2 11,361324.1 22,936266.4 192,605223.1 >1,000,000

40 G. Tao, Z. Xia / Materials Science and Engineering A 486 (2008) 38–44
curdufwscMwllisaplwb
3
tlftstrTwfdibtoTSo
Fs
aomfttGsr(w
3
fdieobserved in the semi-log scale graphics. The rate of decreaseof shear stress range becomes higher with the increase of strainamplitude. As explained in [1], the evolution of stress range dur-ing cyclic loading is due to the competence between modulus
Fig. 3. Evolution of stress–strain loop of fatigue test S2.
urrent test results with them, specimens S1–S8 were testednder strain-range-controlled mode with an equivalent loadingate of 6.19 MPa/s determined by Stassi criterion which will beescribed later in this paper. Specimens S9 and S10 were testednder stress-controlled mode with a loading rate of 61.9 MPa/sor the purpose of reducing the test time. As the material responseas dominantly elastic in the two later tests with smaller
train/stress amplitudes, the difference between strain-range-ontrolled and stress-controlled modes became insignificant.oreover, no distinct time-dependent viscoelastic deformationill occur at such low strain levels. All the fatigue tests were
asted until structural failure. Fig. 3 shows typical stress–strainoops of the first, mid and last cycle of test S2. With increas-ng cycles, decrease in the modulus and the non-linearity of thetress–strain relation can be observed. Such similar trends werelso observed in previous uniaxial fatigue tests of this epoxyolymer [1]. Evolutions of mechanical parameters (shear modu-us, shear stress range and strain energy densities) of tests S1–S8ere retrieved from the stress–strain data and they are shown aselow.
.1. Shear modulus
For each test, the shear modulus was calculated as the slope ofhe best fitting line of the stress–strain curve at the initial part ofoading stage in each cycle. The evolution of the shear modulusor individual test is shown in Fig. 4. It is worth to be mentionedhat the shear modulus was calculated based on around only 30tress–strain sample points at the very beginning of loading stageo minimize the non-linear stress–strain effect and therefore itesulted in the noise in the shear modulus data as seen in Fig. 4.he noise can be depressed by further improvement of the hard-are of the computer system to obtain higher data acquisition
requency. A precipitous drop of the shear modulus can be seenuring the initial two cycles for all tests. As the number of cyclesncreases, the rate of modulus drop slows down. The reason maye explained as that the molecular bonds easy to be broken tendo break in the first cycle rather than the rest cycles. The break
f the molecular bonds will be reflected in the modulus drop.herefore, it resulted in the phenomenon as described above.table levels of shear modulus could be achieved in the rest lifef tests with low strain amplitudes. While for the high strainFs
ig. 4. Evolutions of shear modulus during the entire fatigue life periods oftrain-range-controlled fully reversed cyclic torsional fatigue tests.
mplitude tests, no stable stages can be observed. It can also bebserved that with the increase of the strain amplitude, the shearodulus drop becomes more severe. All these observations are
ound in consistency with the modulus drop phenomenon inhe uniaxial fatigue tests of this epoxy polymer [1]. Accordingo the elasticity theory, the shear modulus can be calculated as
= 0.5E/(1 + υ), where E is the elastic modulus and υ is the Pois-on’s ratio. Taking E = 2900 MPa and υ = 0.42 from our previousesults [1,16], the shear modulus of the specimen at virgin stagefirst cycle) was calculated as 1021 MPa, which is consistentith current test results as shown in Fig. 4.
.2. Shear stress range
The evolution of shear stress range of each test was retrievedrom the stress–strain data and is plotted in Fig. 5. A trend ofecrease with increasing cycles is observed for all these tests,ndicating a cyclic softening phenomenon. In addition, a lin-ar relationship of stress range with number of cycles can be
ig. 5. Evolutions of shear stress ranges during the entire fatigue life periods oftrain-range-controlled fully reversed cyclic torsional fatigue tests.

G. Tao, Z. Xia / Materials Science and Engineering A 486 (2008) 38–44 41
dIlilos
3
sclptap
twt
Fl
Fff
DadE
�
wimdσ
cw
�
Fig. 6. Illustration of the strain energy density parameters.
rop and decrease of non-linearity of the stress–strain relation.n a strain-range-controlled cyclic fatigue test, the former wouldead to a stress range decrease whereas the latter would resultn a stress range increase. In these tests, the effect of modu-us drop is more severe than that of decrease of non-linearityf stress–strain relation, resulting in the phenomenon of cyclicoftening.
.3. Strain energy densities
As an important parameter to evaluate fatigue damage of thepecimens, dissipated strain energy density (DSED), �Wd, wasalculated from the area enclosed by the stress–strain hysteresisoop as shown in Fig. 6. The evolution of �Wd of each test islotted in Fig. 7. At high strain amplitude level, an increasingrend can be observed in the semi-log scale, whereas at low strainmplitude level, �Wd keeps almost constant through the fatigue
rocess. �Wdavg, the average value of �Wd of all cycles in each
est, which is comparable to the value of �Wd at mid-life cycle,as chosen as the parameter of DSED in the later discussion of
his paper.
ig. 7. Evolutions of dissipated strain energy densities during the entire fatigueife periods of strain-range-controlled fully reversed cyclic torsional fatigue tests.
wawwTSrr
4
utsrMdd
ig. 8. Evolutions of elastic strain energy density amplitudes during the entireatigue life periods of strain-range-controlled fully reversed cyclic torsionalatigue tests.
To consider the hydrostatic pressure effect, in addition toSED, elastic strain energy density amplitude (ESEDA) was
lso considered to contribute to the damage in the specimenuring cyclic loading [2,3]. In the case of pure shear loading,SEDA can be expressed as
We =∫ σmax
1
σm1
σ1 dεe1 +
∫ σmax2
σm2
σ2 dεe2 (1)
here σ1, σ2, εe1 and εe
2 are stress and elastic strain componentsn the principle directions. Superscript “max” and “m” indicate
aximum stress and mean stress, respectively. In the principleirections, σ1 = τ, σ1 = −τ, ε1 = γ/2, ε2 = −γ/2, σm
1 = σm2 = τm,
max1 = τmax and σmax
2 = −τmin. In the case of fully reversedyclic shearing test, τmax = −τmin. Therefore, Eq. (1) can beritten as
We =∫ τmax
τmτ d
γe
2+
∫ τmax
τm(−τ)d
(−γe
2
)=
∫ τmax
τmτ dγe
(2)
hich is represented by the area indicated in Fig. 6. �We ofll tests are plotted in Fig. 8. It can be seen that it decreasesith increasing cycles in the tests with larger strain amplitudes,hile it is almost stable in the tests with lower strain amplitudes.his can be attributed to the cyclic softening of this material.imilarly, �We
avg, the average value of �We, which is compa-able to the value of �We at mid-life cycle, is chosen as theepresentative parameter of ESEDA in the subsequent analysis.
. Fatigue life predictions
Equivalent stress/strain concepts were usually adopted tonify the multiaxial fatigue theories with the uniaxial fatigueheories [17]. Therefore, selecting an appropriate equivalenttress/strain is the most important step to obtain a good cor-
elation of the multiaxial fatigue data with the uniaxial one.oreover, as in our previous studies [2,3], the total strain energyensity is also chosen as a damage parameter in fatigue life pre-iction. Comparisons are made between current shearing fatigue
4 ce and Engineering A 486 (2008) 38–44
rcs
4
d(soeTeMpmse
σ
Is
σ
Tii
R
wMitc
σ
NTaw
σ
Flaps
σ
FM
F8
ra
σ
wdtttbdTtt0stlittle better than 2.98 MPa from the von Mises equivalent stressamplitude approach.
2 G. Tao, Z. Xia / Materials Scien
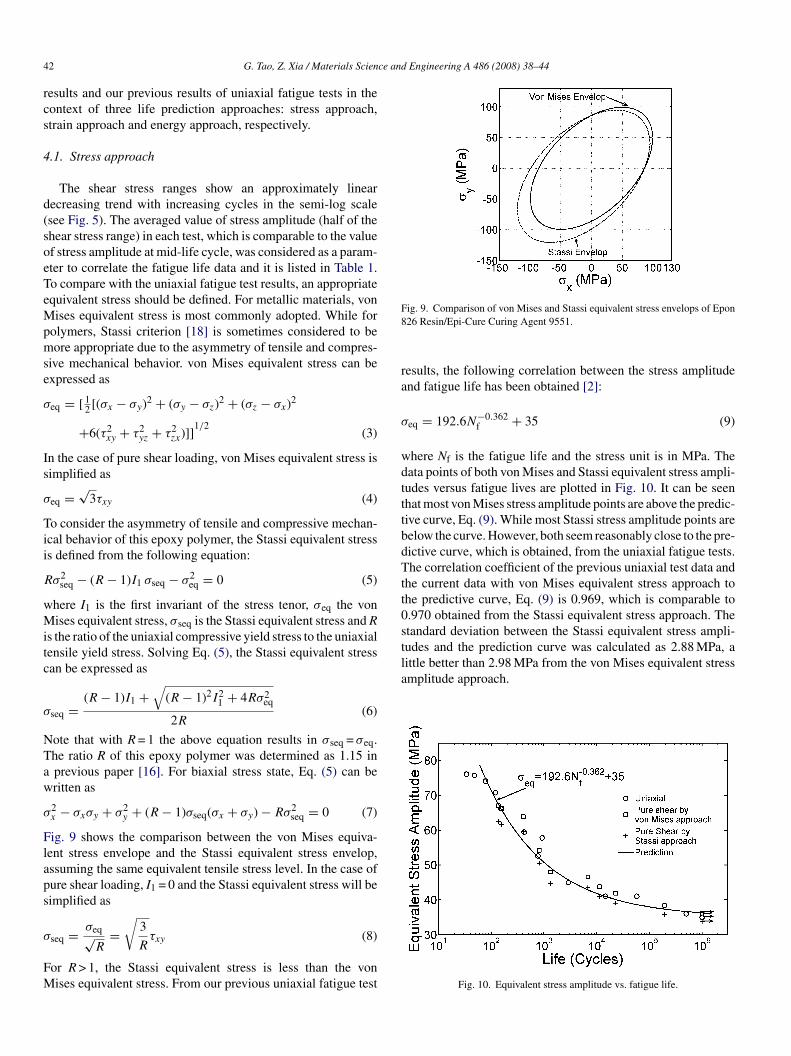
esults and our previous results of uniaxial fatigue tests in theontext of three life prediction approaches: stress approach,train approach and energy approach, respectively.
.1. Stress approach
The shear stress ranges show an approximately linearecreasing trend with increasing cycles in the semi-log scalesee Fig. 5). The averaged value of stress amplitude (half of thehear stress range) in each test, which is comparable to the valuef stress amplitude at mid-life cycle, was considered as a param-ter to correlate the fatigue life data and it is listed in Table 1.o compare with the uniaxial fatigue test results, an appropriatequivalent stress should be defined. For metallic materials, vonises equivalent stress is most commonly adopted. While for
olymers, Stassi criterion [18] is sometimes considered to beore appropriate due to the asymmetry of tensile and compres-
ive mechanical behavior. von Mises equivalent stress can bexpressed as
eq = [ 12 [(σx − σy)2 + (σy − σz)2 + (σz − σx)2
+6(τ2xy + τ2
yz + τ2zx)]]
1/2(3)
n the case of pure shear loading, von Mises equivalent stress isimplified as
eq =√
3τxy (4)
o consider the asymmetry of tensile and compressive mechan-cal behavior of this epoxy polymer, the Stassi equivalent stresss defined from the following equation:
σ2seq − (R − 1)I1 σseq − σ2
eq = 0 (5)
here I1 is the first invariant of the stress tenor, σeq the vonises equivalent stress, σseq is the Stassi equivalent stress and R
s the ratio of the uniaxial compressive yield stress to the uniaxialensile yield stress. Solving Eq. (5), the Stassi equivalent stressan be expressed as
seq =(R − 1)I1 +
√(R − 1)2I2
1 + 4Rσ2eq
2R(6)
ote that with R = 1 the above equation results in σseq = σeq.he ratio R of this epoxy polymer was determined as 1.15 inprevious paper [16]. For biaxial stress state, Eq. (5) can beritten as
2x − σxσy + σ2
y + (R − 1)σseq(σx + σy) − Rσ2seq = 0 (7)
ig. 9 shows the comparison between the von Mises equiva-ent stress envelope and the Stassi equivalent stress envelop,ssuming the same equivalent tensile stress level. In the case ofure shear loading, I1 = 0 and the Stassi equivalent stress will beimplified as √
seq = σeq√R= 3
Rτxy (8)
or R > 1, the Stassi equivalent stress is less than the vonises equivalent stress. From our previous uniaxial fatigue test
ig. 9. Comparison of von Mises and Stassi equivalent stress envelops of Epon26 Resin/Epi-Cure Curing Agent 9551.
esults, the following correlation between the stress amplitudend fatigue life has been obtained [2]:
eq = 192.6N−0.362f + 35 (9)
here Nf is the fatigue life and the stress unit is in MPa. Theata points of both von Mises and Stassi equivalent stress ampli-udes versus fatigue lives are plotted in Fig. 10. It can be seenhat most von Mises stress amplitude points are above the predic-ive curve, Eq. (9). While most Stassi stress amplitude points areelow the curve. However, both seem reasonably close to the pre-ictive curve, which is obtained, from the uniaxial fatigue tests.he correlation coefficient of the previous uniaxial test data and
he current data with von Mises equivalent stress approach tohe predictive curve, Eq. (9) is 0.969, which is comparable to.970 obtained from the Stassi equivalent stress approach. Thetandard deviation between the Stassi equivalent stress ampli-udes and the prediction curve was calculated as 2.88 MPa, a
Fig. 10. Equivalent stress amplitude vs. fatigue life.

and Engineering A 486 (2008) 38–44 43
4
f
ε
wlw
ε
wv
ε
S(etlc
e
ε
wvaFcaaM
tap
4
mpsdupmpeT
G. Tao, Z. Xia / Materials Science
.2. Strain approach
The strain amplitude versus fatigue life function was obtainedrom our previous uniaxial fatigue test results [1] as
eq = 0.1N−0.347f + 1.3% (10)
here εeq is the equivalent strain amplitude and Nf is the fatigueife. Similar to the stress approach, von Mises equivalent strainas adopted firstly:
eq = 1
1 + υ
[1
2[(εx − εy)2 + (εy − εz)2 + (εz − εx)2
+3
2(γ2
xy + γ2yz + γ2
zx)]
]1/2
(11)
here υ is the Poisson’s ratio. In the case of pure shear loading,on Mises equivalent strain is simplified as
eq =√
3
2(1 + υ)γxy (12)
ubstituting shear strain amplitudes of the current tests into Eq.12) and taking υ = 0.42 from previous result [16], the von Misesquivalent strain amplitudes were obtained. Then the experimen-al data of von Mises equivalent strain amplitudes versus fatigueives were plotted against the predictive curve in Fig. 11. Theorrelation coefficient is 0.972.
Similarly to the Stassi equivalent stress, an alternate Stassiquivalent strain is defined as
seq = εeq√R
(13)
here εseq represents the Stassi equivalent strain and εeq is theon Mises equivalent strain. The data points of Stassi equiv-lent strain amplitude versus fatigue life are also plotted inig. 11 for a comparison. The correlation coefficient of this
ase is 0.983. The standard deviation between the Stassi equiv-lent strain amplitudes and the prediction curve was calculateds 0.16%, which is much better than 0.30% from the vonises equivalent strain amplitude approach. It can be seenFig. 11. Equivalent strain amplitude vs. fatigue life.
us
dp
�
wkrct0
5
mcnn
Fig. 12. Total strain energy density vs. fatigue life.
hat Stassi criterion seems to be more appropriate to evalu-te the equivalent strain in multiaxial fatigue of this epoxyolymer.
.3. Energy approach
Under the premise that the damage occurred in the speci-en is related to the input mechanical energy during fatigue
rocess, strain energy density-based damage parameter demon-trated good correlation with a wide range of experimentalata in fatigue tests of metals [17]. Due to the advantage ofnifying both macroscopic and microscopic aspects of fatiguerocess, strain energy density approach also showed well perfor-ance in fatigue life prediction in uniaxial fatigue of this epoxy
olymer [2,3]. Moreover, stress–strain relationship is inher-ntly included in strain energy density-based damage parameter.herefore, strain energy density approach was also adopted tonify the multiaxial and uniaxial fatigue test results in currenttudy.
For fully reversed uniaxial fatigue tests, the total strain energyensity versus fatigue life function was obtained in our previousaper [2]:
W t = �Wdavg + �We
avg = 12557N−0.484f + 285 (14)
here ΔW t is called total strain energy density in the unit ofJ/m3. Fairly good agreement can be seen between current testesults and previous uniaxial fatigue test results in Fig. 12. Theorrelation coefficient of the previous uniaxial data points andhe current shear data points to the predictive curve, Eq. (14) is.984.
. Conclusions
Strain-range-controlled fatigue tests of tubular specimens
ade of an epoxy polymer were conducted under fully reversedyclic shear loading with various strain amplitude levels. Engi-eering shear strain was measured by a recently developedon-contact real-time strain measurement and control system.

4 ce and
Qastfbtfsififa
A
tmag
R
[[[[
[
4 G. Tao, Z. Xia / Materials Scien
uantitative results of various mechanical parameters, suchs shear modulus, shear stress range and strain energy den-ities were retrieved from the recorded stress–strain data forhe entire fatigue process. Fatigue life prediction was per-ormed with the stress-, strain- and energy-based approachesy comparing with previous uniaxial fatigue test results. Inhe stress and strain approaches, Stassi criteria seems to per-orm better than von Mises criteria in evaluating equivalenttress/strain for this epoxy polymer which exhibits asymmetryn tensile and compressive mechanical behavior. Good uni-cation between pure shear fatigue test results and uniaxialatigue test results was also achieved by the strain energypproach.
cknowledgements
The work presented here is part of a general investigation of
he mechanical properties and damage of advanced compositeaterials. The research is supported by the Natural Sciencesnd Engineering Research Council of Canada (NSERC) throughrant to Z. Xia.
[[[
[
Engineering A 486 (2008) 38–44
eferences
[1] G. Tao, Z. Xia, Polym. Eng. Sci. 47 (2007) 780–788.[2] G. Tao, Z. Xia, Int. J. Fatigue, in press. doi:10.1016/j.ijfatigue.2006.12.009.[3] G. Tao, Z. Xia, Polym. Test. 26 (2007) 451–460.[4] H. Mayer, Int. J. Fatigue 28 (2006) 1446–1455.[5] X. Chen, J. Song, K.S. Kim, Int. J. Fatigue 28 (2006) 767–776.[6] G. Marquis, D. Socie, Fatigue Fract. Eng. Mater. Struct. 23 (2000) 293–
300.[7] D. Lee, J. Kim, H. Hwang, J. Comp. Mater. 38 (2004) 737–756.[8] Y. Li, K. Zhang, B. Zhang, Key Eng. Mater. 243 (2) (2003) 63–68.[9] K. Lease, R. Stephens, Y. Jiang, P. Kurath, Fatigue Fract. Eng. Mater. Struct.
19 (1996) 1031–1043.10] A.I. Isayev, D. Katz, Y. Smooha, Polym. Eng. Sci. 21 (1981) 566–570.11] G. Tao, Z. Xia, Polym. Test. 24 (2005) 844–855.12] X. Shen, Z. Xia, F. Ellyin, Polym. Eng. Sci. 44 (2004) 2240–2246.13] F. Ellyin, J.D. Wolodko, Proceedings of the 1995 Symposium on Multiaxial
Fatigue and Deformation Testing Techniques, SAE STP 1280, Denver, CO,1997, pp. 7–24.
14] W.H. Peters, W.F. Ranson, Opt. Eng. 21 (1982) 427–431.
15] I. Yamaguchi, J. Phys. E: Sci. Instrum. 14 (1981) 1270–1273.16] Z. Xia, Y. Hu, F. Ellyin, Polym. Eng. Sci. 43 (2003) 734–748.17] F. Ellyin, Fatigue Damage, Crack Growth, and Life Prediction, Chapmanand Hall, London, UK, 1997.18] F. Stassi-D’Alia, Meccanica 3 (1967) 178–195.