fate of phosphorus in the recovery cycle of the kraft pulping ......standardized lime analysis...
TRANSCRIPT

Phosphorus (P) exists as phosphate in green and white liquors [1]. When lime is added to the green liquor, phosphate ions in the green liquor can react
with the calcium in the lime. The resulting P compound in the lime mud has low solubility in green and white liquors, so P will build up in lime over time as it picks up phosphate from the green liquor [1,2]. As a result, the part of the lime that is bound to phosphorus becomes unreactive in the slaking reaction and reduces the availability of lime [1,2]. Ulmgren and Rådeström claimed that concentrations of 1 wt% phosphorus in the lime can decrease the available cal-cium oxide (CaO) in lime by 5 wt% [1]. The fate of phos-phorus in the lime cycle is of special interest, particularly as mills look at introducing biofuels to the lime kiln.
Previous studies have shown that hydroxyapatite (Ca5(PO4)3(OH)), also known as HAP, can form when cal-cium (Ca) is added to alkaline solutions containing phos-phate, but not carbonate [3,4]. However, if sodium ion (Na+) and carbonate (CO3
2-) are present in the alkaline solution (such as in green and white liquors), these ions can par-tially replace calcium and phosphate in the HAP structure and form a compound containing Na+ and CO3
2- ions, which is referred to as CAP [5-7].
Ulmgren and Rådeström studied the hydroxyapatite composition of Ca/P precipitates in green and white liquors to determine the mechanisms involved in calcium phos-phate precipitates from green and white liquors, and to investigate the possibility of lowering calcium phosphate concentration in the alkaline solutions of the recovery cycle [1,2]. They reported that if the total molar ratio of Ca/P in the solution is less than 0.5 mol/mol, the precipitates main-
ly consist of HAP, but when the total molar ratio of Ca/P is increased to 1.7 mol/mol, CAP becomes the main compo-nent in the precipitates from green and white liquors [2]:
Ca9±0.5 Na1±0.5 (CO3)1±0.5 (OH) 2±0.5 (PO4)5±0.5 if Ca/P (molar ratio) 0.5
Ca8.5±0.5 Na1.5±0.5 (CO3)2±0.5 (OH) 2.5±0.5 (PO4)4±0.5 if Ca/P (molar ratio) 1.7
In practice, the Ca/P mole ratio will always be much high-er than 1.7 mol/mol. Another important conclusion of their study was that they stated that sodium (Na) in the CAP is part of the crystal structure and is not washable [2].
There are some mass balance studies for phosphorus in the literature [8,9]. Salmenoja et al. [9] performed an overall mass balance (inputs and outputs) for phosphorus for five Finnish kraft pulp mills (only the complete results for one mill was shown); they found that the primary in-puts of P into the recovery cycle are wood and biosludge combusted in the recovery boiler and that the main out-put of P is in the lime cycle via slaker grits [9]. Another P mass balance was done by Taylor and McGuffie [8] for a Canadian kraft pulp mill; they found the main inputs of P are the wood and fuel oil in the lime kiln, and the main purge points are the precipitator catch to the sewer and slaker grits.
In this project, P was loaded into lime by successive re-causticizing cycles in the lab. The form of P in this lime was determined by X-ray diffraction (XRD). As a part of this work, a complete phosphorus mass balance was done for
Fate of phosphorus in the recovery cycle of the kraft pulping process
MARYAM SADEGH MOUSAVI and NIKOLAI DEMARTINI
MARCH 2020 | VOL. 19 NO. 3 | TAPPI JOURNAL 139
RECOVERY CYCLEPEER-REVIEWED
ABSTRACT: The accumulation of nonprocess elements in the recovery cycle is a common problem for kraft pulp mills trying to reduce their water closure or to utilize biofuels in their lime kiln. Nonprocess elements such as magne-sium (Mg), manganese (Mn), silicon (Si), aluminum (Al), and phosphorus (P) enter the recovery cycle via wood, make-up chemicals, lime rock, biofuels, and process water. The main purge point for these elements is green liquor dregs and lime mud. If not purged, these elements can cause operational problems for the mill.
Phosphorus reacts with calcium oxide (CaO) in the lime during slaking; as a result, part of the lime is unavailable for slaking reactions. The first part of this project, through laboratory work, identified rhenanite (NaCa(PO4)) as the form of P in the lime cycle and showed the negative effect of P on the availability of the lime. The second part of this project involved field studies and performing a mass balance for P at a Canadian kraft pulp mill.
Application: This paper provides mills with an overview of phosphorus (P) in one mill, as well as some new experimental data, to help understand the P distribution in kraft pulp mills. This can be useful for mills evaluating P inputs and purges.

RECOVERY CYCLE
140 TAPPI JOURNAL | VOL. 19 NO. 3 | MARCH 2020
a Canadian kraft pulp, and the concentration of soluble and insoluble P in the recaust streams was determined.
METHODOLOGYLaboratory experiments
Six slaking/calcining cycles were carried out with a mill green liquor doped with 30000 mg/L sodium phosphate (equivalent to P concentration of 5672 mg/L). The high sodium phosphate addition ensured that the lime could take up sufficiently high amounts of phosphorus in less than 10 slaking cycles and be analyzed using XRD. All slaking/causticizing reactions were done in a 500 ml high-density polyethylene (HDPE) bottle with a magnetic stirrer at 95°C ± 2°C. Lime mud produced after each cycle was washed using 2 to 3 stages with the amount of water equiv-alent to the amount of green liquor used for slaking. Then, it was calcined at 1200°C ± 20°C to regenerate lime. This lime was then added to a fresh batch of the doped green liquor. Figure 1 shows a schematic of the experimental setup.
Lime availability after each cycle was measured using a standardized lime analysis method (TAPPI Standard Test Method T 617 cm-84 “Analysis of lime”). Samples were analyzed using inductively coupled plasma optical emission spectrometry (ICP-OES) to determine the P/Ca ratio and the sodium content. After each cycle, lime and lime mud were analyzed by XRD to determine the phosphorus com-pounds. Furthermore, thermogravimetric analysis (TGA) was done on lime and lime mud to find the thermal stabil-ity of the phosphorus compound formed.
Effect of lime mud washing on phase identification
In order to confirm that the sodium in lime was due to rhe-nanite rather than entrained sodium compounds, a series of washing experiments were done on a lime mud sample. In this experiment, the first slaking/calcining cycle was re-peated. Lime mud was washed with deionized water in
multiple stages as before, but this time with more stages (5 instead of 3) and more water in each washing stage (in total, more than the equivalent to the amount of green liquor used in the slaking/causticizing cycle: 250 ml green liquor [GL] for slaking and 350 ml wash water). The lime mud and washed solutions were analyzed by ICP-OES to find sodium levels after each washing stage.
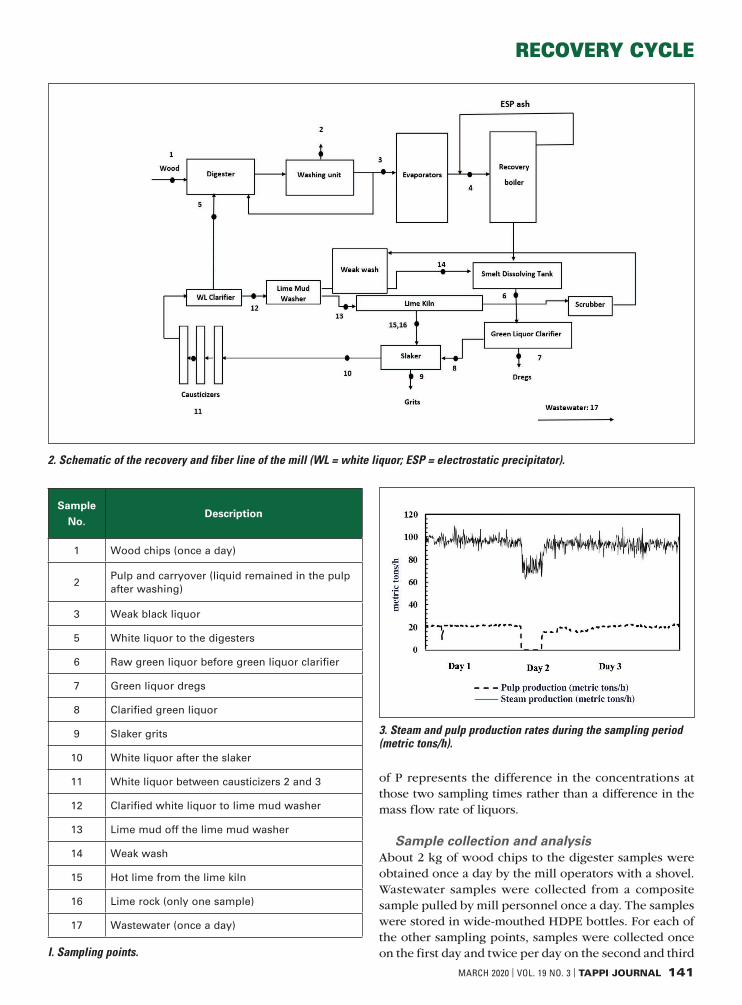
Mill studiesA sampling campaign was carried out at a Canadian pulp mill. The mill uses softwood (equal mix of spruce and pine) for pulping. The annual pulp production rate is 182500 a.d. metric tons/year. The sampling campaign contained 17 sampling points, which are shown in Fig. 2 and listed in Table I.
Figure 3 shows the recovery boiler steam production and the mill’s pulp production rate during the three days of sampling. These parameters are used to determine the variability of process conditions during the sampling cam-paign. The digesters went down for about 5 h at the begin-ning of day 2, so the rate of black liquor combustion was slowed down during this period, but not stopped. The recovery cycle kept running, and the data for that 5 h was not used for mass balance calculations. In all other times, the mill operations were reasonably steady during the sam-pling campaign, with no significant fluctuations in tank volumes. Flow rates of process streams were taken from the mill’s data acquisition historian. The average flow rates of almost 17 h were used for the balance calculations for each day, except for the second day when 12 h of data were used for the flows around the digester because of the rea-son discussed previously. Clarified green liquor flow rate was adjusted to balance the sodium mass flow in green and white liquors. Also, weak black liquor flow rate was adjusted to balance the black liquor flow rate on a dry solid basis. The average flow rate for each day was used in the balance of the two separate sample rounds. So, for day 2, with two separate sample rounds, the difference in flows
1. Schematic of the experimental apparatus (HDPE = high-density polyethylene).
RECOVERY CYCLE
MARCH 2020 | VOL. 19 NO. 3 | TAPPI JOURNAL 141
of P represents the difference in the concentrations at those two sampling times rather than a difference in the mass flow rate of liquors.
Sample collection and analysisAbout 2 kg of wood chips to the digester samples were obtained once a day by the mill operators with a shovel. Wastewater samples were collected from a composite sample pulled by mill personnel once a day. The samples were stored in wide-mouthed HDPE bottles. For each of the other sampling points, samples were collected once on the first day and twice per day on the second and third
2. Schematic of the recovery and fiber line of the mill (WL = white liquor; ESP = electrostatic precipitator).
Sample
No.Description
1 Wood chips (once a day)
2Pulp and carryover (liquid remained in the pulp after washing)
3 Weak black liquor
5 White liquor to the digesters
6 Raw green liquor before green liquor clarifier
7 Green liquor dregs
8 Clarified green liquor
9 Slaker grits
10 White liquor after the slaker
11 White liquor between causticizers 2 and 3
12 Clarified white liquor to lime mud washer
13 Lime mud off the lime mud washer
14 Weak wash
15 Hot lime from the lime kiln
16 Lime rock (only one sample)
17 Wastewater (once a day)
I. Sampling points.
3. Steam and pulp production rates during the sampling period (metric tons/h).

RECOVERY CYCLE
142 TAPPI JOURNAL | VOL. 19 NO. 3 | MARCH 2020
days. Weak black liquor and ash-fired black liquor sam-ples were collected using a wide-mouthed HDPE bottle. Ash-fired black liquor samples were collected by the mill operators and stored in a wide-mouthed HDPE bottle. For as-fired black liquor, a weighed amount of deionized (DI) water was added to the bottle prior to pulling the black liquor sample so that the black liquor was diluted. Pulp samples were collected from the washers using a shovel. They were pressed to get samples of the pulp carryover. The pulp carryover samples were collected in wide-mouthed HDPE bottles and pulp samples were stored in the sealed 3 L plastic bags. All bottles were immediately sealed. Once the wood chips, pulp, and black liquor sam-ples were received at the University of Toronto, they were stored at 4°C.
Hot lime samples were obtained directly from the lime kiln and cooled down before storing in the wide-mouthed HDPE bottles. Grits samples were taken using a shovel from the grits storage and stored in sealed 3 L plastic bags. All other liquid samples from the recausticizing plant were taken using a 1 L thermos. The thermos was rinsed with the sample solution at least twice before sample collection. Part of the samples was directly put into analysis vials to determine the total P concentration for the mass balance. The rest of the sample in the thermos was then immedi-ately filtered while still hot using a 1-L filtration flask and cellulose filter paper to get the concentration of soluble P. A portion of this filtered sample was put into vials to later be digested for analysis by ICP-OES. At the mill, the filtered solids were washed with deionized water and dried in an oven at 105°C; afterwards, samples were separated from the mill solutions and stored in 3-L plastic bags.
All liquid and solid samples (except dregs and grits) were digested with 70% nitric acid (HNO3) at 95°C for 2 h and analyzed by ICP-OES. Prior to digestion, wood samples were air dried and ashed at 540°C. Pulp samples were ashed at 540°C. Dregs and grits samples were ashed at 540°C and prepared using fusion with lithium tetraboride and then analyzed with ICP-OES.
RESULTSEffect of phosphorus on lime availability
Experiments were carried out to load lime with phosphorus through multiple slaking/causticizing cycles in order to de-termine the form of the calcium-phosphorus compound and to measure the change in lime availability with P up-take. At each slaking/calcining cycle, lime was added to the green liquor at a liming ratio of 1 ± 0.05. Then, the pro-duced lime was filtered from the produced white liquor, washed, calcined and used in the next cycle. This process was repeated for 6 cycles. After the 6th cycle, the lime avail-ability was too low to continue. The P/Ca molar ratio in the washed lime after each slaking/causticizing cycle was mea-sured using ICP-OES in all cycles and found to increase linearly (Fig. 4).
As a result of phosphate uptake by the lime, the amount of lime available for the slaking reaction decreased lin-early. The availability of the produced lime after each cycle was experimentally analyzed using TAPPI Standard Test Method T 617 cm-84. The initial lime availability and P (wt%) before the first cycle were 92% ± 2% and 0.18% ± 0.1%, respectively, based on six replicate analyses. The experimental results for lime availability are shown in Fig. 5. As shown in Fig. 5, the amount of available lime de-creases almost linearly with increasing P (wt%) in the lime. Based on the slope of the trendline for the data in Fig. 5, as the P content in the lime increases by 1 wt%, the avail-ability of the lime decreases by around 5.3 (wt%). The lime availability was also theoretically calculated based on the P (wt%) in the lime and assuming lime only consists of CaO and rhenanite. The theoretical relationship would be a 5.1% reduction in availability for every 1 wt% of P in the lime mud. The reason the measured relationship is slight-ly higher than the theoretical lime availability might be due to partial blocking of reactive lime by rhenanite or to recarbonation of lime mud immediately following calcina-tion in the experimental conditions.
4. Phosphorus/calcium (P/Ca) mole ratio in lime after each slaking/calcining cycle.
5. Effect of phosphorus (P) content on lime availability. Error bars represent 1 standard deviation based on 6 replicate analyses.

RECOVERY CYCLE
MARCH 2020 | VOL. 19 NO. 3 | TAPPI JOURNAL 143
Identification of phosphorus compounds (XRD profiles)
Solid samples after each cycle were analyzed with XRD to identify the Ca-P compounds in the lime and lime mud. The XRD results showed that the Ca-P compound formed in lime and lime mud is rhenanite (NaCa(PO4)). The XRD profiles of the last slaking/calcining cycles are shown in Fig. 6 and Fig. 7. This finding is in contrast to the conclusion of Ulmgren and Rådeström that HAP and CAP could be formed [1,2]. It was not clear how the presence of HAP and CAP were determined in these earlier studies, so it is difficult to compare our results with their conclusions. While the phosphate content in the doped green liquor is much higher than in indus-trial liquors, it is not phosphate-rich relative to carbon-ate and hydroxide. The phosphate-to-carbonate molar ratio is only 0.145 and the phosphate-to-hydroxide ratio is 0.408, so it seems unlikely that the high phosphate content of the doped green liquor prohibited the forma-tion of HAP and CAP, and these results would tend to indicate that the form is rhenanite.
Thermal stability of phosphorus compounds (TGA profiles)
Lime and lime mud samples were analyzed by thermo-gravimetry and differential scanning calorimeter (TGA/DSC) to find the thermal stability of the calcium-phos-phorus compounds formed. The TGA profiles for lime and lime mud after the last cycle are shown in Fig. 8 and Fig. 9. A typical thermal profile of lime shows a weight loss between 350°C and 450°C, which corresponds to the decomposition of calcium hydroxide (Ca(OH)2) into CaO and water (H2O). The theoretical weight loss of H2O from pure Ca(OH)2 is 24%.
Ca(OH)2(s) → CaO(s) +H2O
A typical thermal profile of lime mud shows two weight losses: first, a weight loss at 350°C–450°C that was de-scribed previously; and second, a weight loss between 620°C and 830°C that corresponds to the decomposition of calcium carbonate (CaCO3) into CaO and carbon diox-ide (CO2), and the theoretical weight loss of CO2 from pure CaCO3 is 44%.
6. X-ray diffraction (XRD) of lime mud after the 6th slaking/calcining cycle. P/Ca molar ratio = 0.59.
8. Thermal profile of lime mud after the last cycle. This shows the transformation of α-rhenanite to β-rhenanite between 600°C and 640°C in lime mud (heat loss showing this transformation is circled on the curve).
7. XRD of lime after the 6th slaking/calcining cycle. P/Ca molar ratio = 0.59.
9. Thermal profile of lime after the last cycle. This shows the transformation of α-rhenanite to β-rhenanite between 600°C and 640°C in lime (heat loss showing this transformation is circled on the curve).

RECOVERY CYCLE
144 TAPPI JOURNAL | VOL. 19 NO. 3 | MARCH 2020
CaCO3(s) → CaO(s) + CO2(g)
In addition to the typical peaks expected for lime and lime mud, respectively, the TGA results with high phos-phorus contents show an endothermic reaction (with no weight loss) between 600°C and 640°C that was consis-tent with a crystal structure change of α-rhenanite to β-rhenanite [10].
Effect of lime mud washing on phase identification
Figure 10 shows the effect of washing on sodium concen-tration in the lime mud. As can be seen in Fig. 10, the so-dium level in the lime mud decreased from stage 1 to stage 4, after which it became constant. Also, after the fourth cycle, little to no Na was washed from the lime mud. Be-sides Na, the P concentration in the washed solution was analyzed as well. The results showed no P was washed out in any of the washing stages. This suggests that the washed Na was not from the rhenanite structure. It could be the Na in residual green liquor. Thus, all the remaining Na in the lime mud after washing is bound to P in the rhenanite structure. Figure 10 also shows the molar ratio of Na and P in the lime mud after the 4th washing stage becomes con-stant and is very close to 1, which is the molar ratio of Na and P in the rhenanite (NaCa(PO4)).This result is in good agreement with the results of a previous study that found Na in the CAP structure is not part of its crystal structure and it is not washable [2].
Mass balance resultsThe mass balance results of five sampling periods are shown in Fig. 11 and Table II. Results are given on g P/metric tons of a.d. pulp (g P/a.d. metric tons) basis.
As shown in Fig. 11, the main input of P to the recovery cycle is the wood used in pulping. Almost all of the P in
10. Remaining sodium (Na) content in the lime mud after multiple washing stages (primary y-axis) and sodium/phosphorus (Na/P) mole ratio in lime mud after multiple washing stages (secondary y-axis).
11. The average P flows in the recovery cycle (WL = white liquor; ESP = electrostatic precipitator; LM = lime mud). Units are g P/a.d. metric ton.

RECOVERY CYCLE
MARCH 2020 | VOL. 19 NO. 3 | TAPPI JOURNAL 145
the wood is solubilized during pulping and enters the re-covery cycle with the black liquor. Almost half of the P of weak black liquor appears to be volatilized during evapo-ration and ends up in the evaporator condensates. The possible explanation would be that the organic P-contain-ing compounds of the wood are degrading during pulping to form molecules with a lower molecular weight that are volatilized during evaporation. Unfortunately, the contam-inated condensate sample from the evaporator was not collected at the time of the sampling campaign to experi-mentally prove this hypothesis. However, we did sample the water to the wastewater treatment plant. The evapora-tor condensates and digester blow gases go to wastewater treatment and the P flows with the wastewater are close to the observed drop in the P in the evaporators.
Karlemo [11] measured P in weak and as-fired black liquor from six kraft pulp mills in Finland. In that work, the author found that P in the as-fired black liquor is high-er on a dry solids black liquor than for the weak black li-quor. One explanation is that biosludge is added to those liquors; however, the flow of biosludge and P content of
the biosludge in those mills was not given, so it is not pos-sible to draw final conclusions about the differences be-tween those results and our study.
Black liquor after evaporation is mixed with electro-static precipitator ash and then it is burned in the recovery boiler. It appears that perhaps as much as a third of the P in the as-fired black liquor is released during combustion in the recovery boiler. Unfortunately, the electrostatic pre-cipitator ash sample was not collected during the sampling campaign. Assuming that 8% of the Na is volatilized, that there is enough sulfur (S) to balance Na, and that the pre-cipitator ash is only sodium sulfate (Na2SO4), the theoreti-cal concentration of P in the precipitator ash would be about 60 mg/kg. An electrostatic precipitator ash sample was received later from the mill and was analyzed for P. The concentration of P in that sample is 16 mg/kg, which is lower than the theoretical value. Karlemo [11] measured P in electrostatic precipitator ash, and she found values between 40 mg/kg and 50 mg/kg [11]. Finnish mills usu-ally operate their recovery boilers at a higher temperatures and solids contents when compared to Canadian mills, so
Sample No.
DescriptionP Average,
g P/a.d. metric tons of pulp
P Range, g P/a.d. metric tons
of pulp
1 Wood chips 126 118–133
2Pulp and carryover (liquid remained in the pulp after
washing)
Pulp: 9
Carryover: 0.17
Pulp: 8–10
Carryover: 0.08–0.25
3 Weak black liquor 220 157–295
4 As-fired black liquor 116 91–142
5 White liquor to the digesters 68 56–79
6 Raw green liquor before green liquor clarifier 94 75–122
7 Green liquor dregs 4 2–8
8 Clarified green liquor 76 58–100
9 Slaker grits 0 0
10 White liquor after the slakerWhite liquor: 87
Lime mud: 497
White liquor: 50–124
Lime mud: 391–594
11 White liquor between causticizers 2 and 3White liquor: 93
Lime mud: 539
White liquor: 67–134
Lime mud: 486–652
12 Clarified white liquor to lime mud washerWhite liquor: 12
Lime mud: 586
White liquor: 8.5–16
Lime mud: 455–762
13 Lime mud off the lime mud washer 623 560–675
14 Weak wash 7 4–12
15 Hot lime from the lime kiln 563 403–747
16 Lime rock 565 –
17 Wastewater 97 82–115
II. Phosphorus (P) content of samples collected at various sampling points.

RECOVERY CYCLE
146 TAPPI JOURNAL | VOL. 19 NO. 3 | MARCH 2020
it is acceptable that those values are higher than the mea-sured P concentration in the sample received from the Ca-nadian mill, which fires at a lower dry solids. More work is needed to better understand the fate of P during evapo-ration and combustion.
The remaining two-thirds of the P in the black liquor after combustion exit the recovery boiler with the smelt and are dissolved in the weak wash to form green liquor in the recausticizing plant. In the recausticizing plant, about 20% to 25% of the phosphorus was picked up by the lime dur-ing slaking and recausticizing, whereas the rest ends up in the digester with the white liquor. This will be discussed further in the following sections.
Figure 11 shows the P flows when the mill is on 100% lime mud. If the mill goes to lime rock, the lime rock is added to the kiln instead of to the lime mud. Based on the mill data for the 6 h that they were on 100% lime rock on the night between the first and second sampling periods, the P flow from the addition of lime rock to the lime kiln is 565 g P/metric ton of pulp.
Besides total P in the raw and clarified green liquors, the soluble fraction was also measured to differentiate be-tween soluble and insoluble P. The results are shown in Fig. 12.
Based on Fig. 12, about 80% to 95% of the P in the raw green liquor exiting the dissolving tank is soluble, while about 15% to 20% is insoluble. The insoluble fraction is removed with the dregs and the remaining P goes with the green liquor to the slaker. Based on the mass balance re-sults, a little amount of P is purged with scrubber water and green liquor dregs. There was virtually no phosphorus being purged by the slaker grits, which is in contrast with other studies [8,9]. This is likely due to the fact that at this mill the P concentration in the green liquor is quite low, so there is almost no reaction between phosphate ions in the green liquor to the slaker and the lime added to the slaker. Furthermore, the concentration of P in the lime is low. It is the P-containing lime that is unreactive and might
form grits in mills with higher levels of P in the lime. The fate of P in the recausticizing plant is of special in-
terest. Fig. 13 and Fig. 14 show the variability of P con-centration in the liquid and solid samples of the recausti-cizing process, respectively. Between 20% and 25% of the P was picked up by the lime during slaking and recausti-cizing, Thus, most of the phosphorus entering the slaker with clarified green liquor continued with white liquor to pulping. Uptakes of green liquor P by lime mud has been found to be as high as 70% to 75% of the green liquor P when the concentration of P in the green liquor is around 25 to 65 mg/L [1], but much lower when the concentration is around 20 to 25 mg/L [11]. This difference between our findings and earlier findings may be because the initial P concentration of the green liquor at this mill is low, being only 20 to 30 mg/L. The other reason might be that the lime mud is already at equilibrium, so it did not pick up much P from the green liquor during slaking and causti-
12. Total and soluble P in raw green liquor (RGL) and clarified green liquor (CGL). Error bars represent 1 standard deviation of 6 replicate analyses of the samples.
13. Total P concentration in liquid samples of the recausticizing plant at each sampling period (RGL = raw green liquor; CGL = clarified green liquor, CWL = clarified white liquor). Error bars represent 1 standard deviation of 6 replicate analyses of the samples.
14. Phosphorus concentration in solid samples of the recausticizing plant at each sampling period (LMS = lime mud after slaker; LMC2C3 = lime mud between causticizers 2 and 3; LMC = lime mud after the clarifier). Error bars represent 1 standard deviation of 6 replicate analyses of the samples.

RECOVERY CYCLE
MARCH 2020 | VOL. 19 NO. 3 | TAPPI JOURNAL 147
cizing. More work is needed to better understand under what conditions phosphorus is removed from the green liquor by the lime.
The measured total input of P with the wood is 126 g P/a.d. metric ton pulp, and total output from dregs, grits, pulp, and wastewater is 110 g P/a.d. metric ton pulp, with the majority found in the wastewater. Therefore, there is an approximate 13% difference between the total input and output. The electrostatic precipitator in this mill was working highly inefficiently during the sampling cam-paign, so there might have been some P being released with particulate in the flue gas, but we could not quantify this, as mentioned before. The mass balance results in this mill show very little to no P accumulation because the P level in this mill is quite low in the green liquor, so there is little pick-up by the lime during slaking and causticizing. In other mills with higher P content, the accumulation would most likely happen in the lime mud [2,11].
CONCLUSIONSThe laboratory experiments in this work showed the form of phosphorus in the lime cycle is rhenanite. Additional
work will be carried out to better clarify this. Based on the mass balance results, the primary source of P entering the pulp mill comes from wood, and almost all of this P is sol-ubilized during digestion and ends up in the black liquor. Mass balance results suggest that after evaporation, about half of the black liquor P remains in the black liquor and the remainder seems to be volatilized during evaporation
ABOUT THIS PAPER
Cite this article as: Mousavi, M.S. and DeMartini, N., TAPPI J. 19(3): 139(2020). https://doi.org/10.32964/TJ19.3.139.
DOI: https://doi.org/10.32964/TJ19.3.139
ISSN: 0734-1415
Publisher: TAPPI Press
Copyright: ©TAPPI Press 2020
About this journal
ABOUT THE AUTHORSWe chose this research topic because the build-up of phosphorous (P) in the lime cycle is one concern for utilization of biofuels in the lime kiln. As mills look to replace fossil fuels with biomass derived fuels, the choice of fuel and technology depends, in part, on the fate of nonprocess elements introduced with the fuel, particularly phosphorous.
This research was complementary to the work of Ulmgren and Rådeström, who studied the form of P in green and white liquor precipitates. The form is important in order to understand and model the dis-tribution between the solid phase and liquid phase during slaking and causticizing. We found a different form for phosphorous lime and lime mud from what they identified.
The most difficult aspect of this work was the low concentration of P in lime and lime mud, making analysis of the form problematic. We addressed this problem by conducting multiple slaking/causticizing/calcining cycles with mill lime and mill green liquor doped with sodium phosphate. This allowed for in-creased P concentration, making X-Ray diffraction analyses possible.
This research is going to be used as the first step towards building a thermodynamic database that can be used in modeling the distribution of P be-tween the liquid and solid phases. We learned sever-al new things from this work: there appears to be a minimum P concentration in green liquor beyond which the pick up by lime is low; the reaction be-tween P in the green liquor and lime appears to hap-
pen later in the slaking/causticiz-ing cycle; and significant amounts of P may be volatilized in black liquor evaporation. We will be conducting more work to follow up on these observations.
The most interesting finding was that the form of phosphorus in the lime and lime mud is rhe-nanite, which differs from the conclusions of Ulmgren and Rådeström. This work can help mills understand the form of P and its distribution around the recovery cycle. This is particular-ly useful for mills considering use of biofuels in the lime kiln.
This paper provides mills with an overview of phosphorous in one mill, as well as some new experimental data to help under-stand P distribution during slak-ing and causticizing.
The next step is investigating the effects of TTA, sulfidity, and green liquor’s P content on the reaction between phosphate in green liquor and the lime during slak-ing/causticizing.
Mousavi is a research assistant and DeMartini is assistant professor at the University of Toronto, Toronto, Canada. Email Mousavi at [email protected].
DeMartini
Mousavi

RECOVERY CYCLE
148 TAPPI JOURNAL | VOL. 19 NO. 3 | MARCH 2020
and ends up in the evaporator condensates. Unfortunately, this assumption was not experimentally verified because an evaporator condensate sample was not collected. After black liquor combustion in the recovery boiler, about 70% of the black liquor P is retained in the smelt and the remain-der is believed to be in the electrostatic precipitator ash. The P in smelt is nearly completely soluble in green liquor. It partially reacts with Ca that comes with the lime during slaking and causticizing to form rhenanite, which reduces the lime availability by 5.3 wt% for every 1 wt% of P. The mill balance indicates that the distribution between soluble phosphorus and phosphorus bound to the lime during slak-ing and recausticizing is likely a function of P concentration in the green liquor and lime. The remainder of the P enters the digester with the white liquor and ultimately ends up back in the black liquor. TJ
ACKNOWLEDGEMENTSThis work is part of the industrial research consortium project “Effective Energy and Chemical Recovery in Pulp and Paper Mills – II” at the University of Toronto support-ed by Andritz, Arauco, Babcock & Wilcox, Canadian Kraft Paper, Cenibra, Clyde Ergemann, CMPC, ERCO World-wide, FITNIR, FPinnovations, Georgia Pacific, Interna-tional Paper, IRVING, KFS, Klabin, Meadowlake, Mercer, NORAM, Rayonier, Resolute, Sappi, Södra, Stora Enso, Suzano, Valmet, and WestRock.
We would also like to acknowledge the support of the Natural Sciences and Engineering Research Council of Can-ada (NSERC), and Cette Recherche a été Financée par le Conseil de Recherches en Sciences Naturelles et en Génie du Canada (CRSNG), [IRCPJ 517715 -16]. We would also like to extend our gratitude to Brodie O’Rourke, Steven Reimer, Jody Bertholet, Darlene Simonite, Karl Sasek, Kaushik Patel, Himanshu Patel, Komal Patel, and Neilly Coulter of Canadian Kraft Paper mill for their help and support dur-ing the sampling campaign for the mass balance.
LITERATURE CITED1. Ulmgren, P. and Rådeström, R., J. Pulp Pap. Sci. 73(2): 52(1997).
2. Ulmgren, P. and Rådeström, R., Nord. Pulp Pap. Res. J. 12(3): 167(1997). https://doi.org/10.3183/npprj-1997-12-03-p167-174.
3. Sillén, L.G., Martell, A.E., Bjerrum, J., et al., Stability Constants of Metal-Ion Complexes, 2nd Edn., (Special Publication 17), The Chemical Society, London, 1964.
4. Högfeldt, E., Stability Constants of Metal-Ion Complexes, Part A: Inorganic Ligands, IUPAC Chemical Series No. 21, Pergamon Press, New York, 1981.
5. De Maeyer, E. and Verbeeck, R., Bull. Soc. Chim. Belg. 102(9): 601(1993). https://doi.org/10.1002/bscb.19931020907.
6. Vignoles, M., Bonel, G., Holcomb, D.W., et al., Calcif. Tissue Int. 43: 33(1988). https://doi.org/10.1007/BF02555165.
7. Legeros, R.Z., Trautz, O.R., Legeros, J.F., et al., Science 155(3768): 1409(1967). https://doi.org/10.1126/science.155.3768.1409.
8. Ulmgren, P. and Rådeström, R., J. Pulp Pap. Sci. 23(2): 52(1997).
9. Salmenoja, K., Kivilinna, V.A., Backman, R.V., et al., “Chemical balance of nonprocess elements in five Finnish pulp mills,” Int. Chem. Recovery Conf., TAPPI Press, Peachtree Corners, GA, USA, 2004.
10. Höland, W., Rheinberger, V., Apel, E., et al., J. Mater. Sci.: Mater Med. 17: 1037(2006). https://doi.org/10.1007/s10856-006-0441-y.
11. Karlemo, C., “Nonprocess elements in the recovery cycle of six Finnish kraft pulp mills,” Master’s thesis, Åbo Akademi University, Turku, Finland, 2019.