fast qrs detection with an optimized knowledge-based
TRANSCRIPT

Fast QRS detection with an optimized knowledge-based
method: evaluation on 11 standard ECG databases
Mohamed ElgendiComputing Science Department, University of Alberta, Canada
September 16, 2013
Abstract
The current state-of-the-art in automatic QRS detection methods show highrobustness and almost negligible error rates. In return, the methods are usu-ally based on machine-learning approaches that require sufficient computational re-sources. However, simple-fast methods can also achieve high detection rates. Thereis a need to develop numerically efficient algorithms to accommodate the new trendtowards battery-driven ECG devices and to analyze long-term recorded signals in atime-efficient manner. A typical QRS detection method has been reduced to a basicapproach consisting of two moving averages that are calibrated by a knowledge baseusing only two parameters. In contrast to high-accuracy methods, the proposedmethod can be easily implemented in a digital filter design.
1 Introduction
According to the World Health Organization, cardiovascular diseases are the numberone cause of death worldwide [1]. An estimated 17.3 million people died from cardio-vascular diseases in 2008, representing 30% of all global deaths [1]. Thus, recently,medical researchers have placed significant importance on cardiac health research. Thishas produced a strong focus on preventative, medicinal, and technological advances.One such research pathway is leading researchers toward improving the conventionalcardiovascular-diagnosis technologies used in hospitals, clinics and the home.
The most common clinical cardiac test is electrocardiogram (ECG) analysis. It rep-resents a useful screening tool for various cardiac abnormalities because it is simple,risk-free, and inexpensive [2]. Therefore, the analysis of ECG signals has been exten-sively investigated over the past two decades. Many attempts have been made to find asatisfying universal solution for QRS complex detection, including the Pan and Tompkinsalgorithm [3], which has been used extensively in the literature for beat detection. Thecurrent advances in battery-driven devices such as smartphones and tablet computershave made these technologies invariably part of daily life, even in developing countries[4]. The advances have also increased the possibility of implementing more sophisti-cated algorithms such as the Pan and Tompkins method [3] in smartphones. However,
1

there is a significant trade-off as there will always be a power-consumption limitation inprocessing ECG signals on battery-operated devices.
Analyzing real-time ECG signals collected by a battery-driven device needs to befast and feasible in real-time, despite the existing limitations in terms of memory andprocessor capability. The same holds for the ability to analyze large ECG recordingscollected over one or more days. Therefore, the main goal of this study is to producea fast robust QRS detector that suits battery-driven applications and continuous 24/7ECG monitoring, with theoretical justification for its parameters choice, tested over11 large-standard datasets with different sampling frequencies, recording lengths, andnoise. This study seeks to compare the various QRS detection methods against thedeveloped QRS detection on standard databases. Furthermore, the theoretical basis ofthe well-known Pan and Tompkins algorithm [3] will be analyzed and evaluated againstthe proposed algorithm. The failures will be discussed, and the processing time of theproposed algorithm will be elaborated on.
2 Materials and Methods
2.1 Data Used
Several established ECG databases are available for evaluating QRS detection algorithmsfor ECG signals. As a sufficiently broad test scenario, 11 representative datasets pub-lished on PhysioNet [18] served for analyzing and comparing the proposed algorithm.These sets represent different subject groups and recording conditions, such as samplingrates (between 128 Hz and 1 kHz) and interferences. Lead I of every record is usedwithout any exclusion. The corresponding reference R markers provided in the datasetsacted as the benchmark.
2.1.1 Training Set
The MIT-BIH Arrhythmia Database [5] is widely used to evaluate QRS detection algo-rithms. However, in this study, the database used for training as it includes differentshapes of arrhythmic QRS complexes and noise. Most prominent were power-line in-terferences (60 Hz and its harmonics, see Fig. 1 (a)), which are known to be a majordisturbance [6]. In addition, the design considered high-frequency noise, mostly origi-nating from muscle activation (see Fig. 1 (b)), as well as low-frequency baseline fluctu-ations (see Fig. 1 (c, d, e)). Among the representative physiological events present inthe datasets, special attention was paid to missing P waves (e.g., in junctional escapebeats [7]; Fig. 1 (e)) and inverted (e.g., premature ventricular contractions, Fig. 1 (f)),notched (left bundle branch block, Fig. 1 (g)), as well as biphasic QRS complexes (rightbundle branch block, Fig. 1 (h)). Finally, pacing-related phenomena were taken intoaccount (see Fig. 1 (i, j)).
2

2.1.2 Testing Set
Ten datasets were used for testing: the meta-dataset QT Database with 111,301 beats [8];the T-Wave Alternans database with 19,003 beats, selected for its wide range of patho-logical conditions [9]; the Intracardiac Atrial Fibrillation database with 6,705 beats [10];the ST Change database with 76,181 beats featuring stress ECGs [11]; the Supraventric-ular Arrhythmia database with 184,744 beats [12]; the Atrial Fibrillation Terminationdatabase with 7,618 beats [13]; the Fantasia database with 278,996 beats from relaxedhealthy subjects [14]; the Noise Stress Test database with 26,370 beats recorded undernoise conditions typical for clinical environments [15]; the St. Petersburg Institute ofCardiological Technics Arrhythmia database with 175,918 beats [7]; and the NormalSinus Rhythm database with 183,092 beats [7]. In the Fantasia database, one record(‘f2y02’) was corrupted and was accordingly excluded. These benchmark datasets wereselected for testing because of their representative character regarding pathological andtypical ECG artifacts. Consequently, these were taken into account in testing the ro-bustness of the proposed method.
2.2 Methodology
In this section, a new, knowledge-based, numerically efficient, and robust algorithm isproposed to detect QRS complexes in ECG signals based on two event-related moving-average filters. The structure of the proposed algorithm is shown in Figure 2. It is clearthat the knowledge base supports the decision making of both stages: generating blocksof interest and thresholding. It is expected that developing a detector that depends onprior knowledge of the ECG features will improve the overall performance and detectionaccuracy. Clifford et al. [16] provided a mini knowledge-base of the normal limits for themain events within the EGG, for a healthy male adult at 60 beats per minute (bpm),shown in Table 1.
The prior knowledge of the duration of the main events of the ECG signals can assistthe feature extraction and support the decision making of the algorithm. For example, inthis work, knowing that the QRS duration in a normal healthy subject varies from 29 to43 samples, for a sampling frequency (SF) of 360 Hz, determines W1 in generating blocksof interest and thresholding (cf. Figure 2). Similarly, the average heartbeat durationdetermines W2 in generating blocks of interest. The average value for heartbeat durationis one second in healthy subjects, which means 360 samples (for a sampling frequencyof 360 Hz). At this stage, W1 and W2 can be initialized by the prior knowledge that hasbeen mentioned above. However, these durations vary from person to person. Therefore,the exact value for W1 (QRS duration) and W2 (one beat duration) will be determinedafter a brute force search, which will be discussed later in the parameter optimizationsection.
3

2.2.1 Band-pass Filter
Morphologies of normal and abnormal QRS complexes differ widely. The ECG signalis often corrupted by noise from many sources, which has been discussed. Therefore,band-pass filtering is an essential first step for nearly all QRS detection algorithms. Thepurpose of band-pass filtering is to remove the baseline wander and high frequencies thatdo not contribute to detecting QRS complexes. A band-pass filter is used, typically abidirectional Butterworth implementation [17]. It offers good transition-band charac-teristics at low coefficient orders, which makes it efficient to implement [17]. Thakor etal. [18] and Chen and Chen [19] scored high accuracy using a third-order Butterworthfilter with a passband of F1–F2 Hz to remove baseline wander and high frequencies, andto suppress the P and T waves and maximize the QRS area, where F1 is the startingfrequency and F2 is the stopping frequency. The effect of the Butterworth filter canbe seen in Figure 3 (b). However, rigorous optimization over the passband, to find theoptimal frequency band, will be discussed in the parameter optimization section.
Squaring Function
The signal is squared point by point, to enhance large values and boost high-frequencycomponents, using the following equation:
y[n] = (x[n])2. (1)
The impact of the squaring is shown in Figure 3 (c).
Generating Blocks of Interest
Blocks of interest are generated using two event-related moving averages. The firstmoving average MAQRS is used to extract the QRS features while the second-movingaverage MAbeat extracts the QRSs beat. Then, an event-related threshold is appliedto the generated blocks to distinguish the blocks that contain R peaks from the blocksthat include noise. The purpose of the QRS moving (MAQRS) average is to smoothout multiple peaks corresponding to QRS complex intervals in order to emphasize andextract the QRS area:
MAQRS[n] =1
W1(y[n− (W1 − 1)/2] + . . .+ y[n] + . . .+ y[n+ (W1 − 1)/2]), (2)
where W1 is the approximate duration of the QRS complex, rounded to the nearestodd integer, and n is the number of data points. Based on the knowledge-base analysissection, the QRS duration W1 varies from 29 to 43 samples (for a sampling frequencyof 360 Hz). Therefore, rigorous optimization to find the optimal W1 will be discussed inthe parameter optimization section.
The purpose of the one-beat moving average (MAbeat) is similar to MAQRS but em-phasizes the QRSs beat to be used as a threshold for the first moving average (MAQRS):
4

MAbeat[n] =1
W2(y[n− (W2 − 1)/2] + . . .+ y[n] + . . .+ y[n+ (W2 − 1)/2]), (3)
where W2 is the approximate duration of a heartbeat, rounded to the nearest odd integer,and n is the number of data points. Based on the knowledge-base analysis section,heartbeat duration W2 is about 360 samples (for a sampling frequency of 360 Hz);however, it varies from person to person. Rigorous optimization to find the optimalW1 will be discussed in the parameter optimization section. The blocks of interestare generated based on the two moving averages discussed. In other words, applyingthe second-moving average MAbeat as a threshold to the first-moving average MAQRS
produces blocks of interest, as shown in Figure 3 (d). However, the use of MAbeat
without an added offset reduces the detection accuracy because of its sensitivity to alow signal-to-noise ratio (SNR). The SNR defined the ratio of the mean signal of a regionof interest to its standard deviation [20], which means if the statistical mean of the signalincreases, the SNR increases. This leads to introducing an offset based on the statisticalmean of the signal as
α = βz̄, (4)
where β is the fraction of the z̄ signal that needs to be removed, z̄ is the statisticalmean of the squared ECG signal z, as illustrated in Figure 4, and α is an offset for thethreshold MAbeat signal. Thus, α refers to the offset, while β refers to the offset fraction.
In short, to increase the accuracy of detecting QRS complexes in noisy ECG signals,the dynamic threshold value THR1 is calculated by offsetting the MAbeat signal with α,as follows:
THR1 = MAbeat[n] + α. (5)
The blocks of interest are then generated by comparing the MAQRS signal with THR1.If a block is higher than THR1, it is classified as a block of interest containing ECGfeatures (P, QRS, or T) and noise; otherwise, as shown in lines 10–16 in Figure 5. Bythis stage, blocks of interest have been generated, Blocks[n]. Therefore, the next stepis to reject the blocks that result from noise. The rejection should be related to theanticipated block width.
Thresholding
Here, the undesired blocks are rejected by using the new THR2 threshold to reject theblocks that contain P and T waves and noise. By applying the THR2 threshold, theaccepted blocks contain only QRS complexes:
THR2 = W1. (6)
As discussed, the threshold THR2 equals W1, which corresponds to the anticipatedhealthy QRS width. If the block width equals the window size W1, then the blockcontains a QRS complex. However, the QRS duration varies in arrhythmia ECG signal
5

durations. Therefore, the condition is set to capture both average (healthy beats) andwide (arrhythmia beats) QRS complex durations. Therefore, if a block width is greaterthan or equal to W1, it is classified as a QRS complex. If not, the block is classified asa P wave, T wave or noise.
Detecting R Peaks
The last stage is finding the maximum absolute value within each block, the R peak.
Parameters Optimization
The function of the QRS detector, which is presented in Figure 5, has five inputs: thefrequency band (F1–F2), event-related durations W1 and W2, and the offset fraction(β). Any change in these parameters affects the overall performance of the proposedalgorithm. These parameters are interrelated and cannot be optimized in isolation. Arigorous optimization, brute-force search based on the knowledge-base information, overall parameters, is conducted, as shown in Figure 6. It is time-consuming, as the complex-ity of the algorithm is ((MaxF1-F1) (MaxF2-F2) (MaxW1-W1) (MaxW2-W2) Maxβ),but it is required before making any claims. The MIT-BIH Arrhythmia Database wasused for training and optimization.
3 Results
The QRS detection algorithm is typically run using two statistical measures: sensi-tivity (SE) and positive predictivity (+P); whereas SE = TP/(TP + FN) and +P =TP/(TP + FP). Here, TP is the number of true positives (QRS complexes detected asQRS complexes), FN is the number of false negatives (QRS complexes have not been de-tected as QRS complexes), and FP is the number of false positives (non-QRS complexesdetected as QRS complexes). The SE reports the percentage of true beats that werecorrectly detected by the algorithm. The +P reports the percentage of beat detectionsthat were true beats.
3.1 Training Results
Figure 6 shows that the optimizations of the beat detector’s spectral window for lowerfrequency varied from 1–10 Hz, with the higher frequency up to 26 Hz. All combinationsof the frequency band 1–26 Hz have been explored to include all frequency bands thathave been recommended in the literature such as 8–20 Hz [21], 5–15 Hz [18, 19], and5–11 Hz [3]. The window size of the MAQRS (W1) ranged from 55 to 111 ms, whereasthe window size of the MAbeat (W2) changed from 555 ms to 694 ms as discussed in theknowledge-base analysis section. However, the offset was tested over the range 0–10% ofthe mean value of the squared filtered ECG signal. The database used in the optimizationprocess is the MIT-BIH Arrhythmia Database because it contains abnormal rhythms,different QRS morphologies, and low SNR signals, as described in the Challenges in
6

the ECG section. The total number of beats in the MIT-BIH Arrhythmia Databaseis 109,984, and there are 48 records. As discussed, several publications have listed theuse of all files in the database, excluding just the paced patients, segments, and certainbeats. However, in the optimization process all records have been used without excludingany beat. After the rigorous optimization, all parameter combinations were sorted indescending order according to the overall accuracy, as shown in Table 2; thus, the firstcombination provides the optimal solution. The highest overall-accuracy score is 99.83%(cf. Table 2); therefore, the optimal frequency range for QRS detection in the MIT-BIHArrhythmia Database is 8–20 Hz, as proposed by Benitez et al. [21]. Moreover, theoptimal values for the moving averages and offset are W1 = 97 ms (35 samples for SF= 360 Hz) and W2 = 611 ms (220 samples for SF = 360 Hz), and β = 8. (Investigatorsdo not have to think about the optimization as it is already done here for them; all theyneed to do is simply implement the proposed algorithm with these optimal parameters.)
3.2 Testing Results
Now, an optimal QRS detector is accomplished over the MIT-BIH Arrhythmia Database.Then, we can test this detector on other datasets straight out of the box without anytuning. In other words, the algorithm’s parameters (F1, F2, W1, W2, and β) do not needto be trained in real-world application for every subject. The parameters are optimizedon a large training set (MIT-BIH data set); thus, the robustness of the algorithm can beexamined against different databases with different sampling frequencies and the ECGsignals collected by different doctors in dissimilar conditions. Table 3 shows the perfor-mance of the QRS detection algorithm on 11 databases. In addition, the performancesare summarized across these databases and compared to other reported results. Becausethe algorithm has not been re-tuned over any databases, the results are promising, andthe algorithm can detect R peaks over different databases, sampling frequencies, typesof arrhythmias, and types of noise. The number of beats used to calculate these perfor-mance parameters is indicated in the second column in Table 3. Hamilton and Tompkinsimplemented their QRS detection algorithm in 1986. They scored 99.69% SE and 99.77%+P over 109,267 beats from the MIT-BIH Database (cf. Table 3). When Arzeno et al.[21] applied the Hamilton-Tompkins algorithm over a slightly larger number of beats,109,504 beats, the detector performance decreased slightly, scoring a SE of 99.68% anda +P of 99.63%.
Li et al. [34] scored higher performance, a sensitivity of 99.89% and a specificity of99.94%, than the proposed algorithm. This is because Li et al. excluded files 214 and215 from the MIT-BIH Database, and therefore, the algorithm is not superior in termsof performance. However, their algorithm was based on wavelets feature extraction andsingularity for classification, which is considered numerically inefficient. Moreover, thealgorithm developed by Ghaffari et al. [25] scored a sensitivity of 99.91% and a speci-ficity of 99.72% over 109,837 beats (not all beats); their algorithm was based on waveletsfeature extraction and thresholds for classification, which is also considered numericallyinefficient. Conversely, the proposed knowledge-based algorithm presents a clear ad-vantage over the previously reported algorithms in terms of performance (large number
7

of databases) and numerical efficiency. This was clear with the MIT-BIH ArrhythmiaDatabase, as discussed above. In addition, the QTDB where the detector scored anSE of 99.67% and a +P of 100%, over 111,193 beats, without excluding any beats asMartinez et al. [30] and Aristotle [30] did. Furthermore, the overall performance of thedetector on the NSTDB was higher than Benitez et al. [36], with clear mentioning ofthe number of beats used, specifically 26,370 beats.
4 Discussion
After the description of the detector and its results on different datasets, perhaps fur-ther elaboration on the detectors performance is required. However, comparing theperformance of the proposed algorithm with previously published algorithms is difficult.This is because the algorithms are not tested on the same data, in particular the samebeats. By excluding the number of beats and/or certain records, the performance of anydetector will score higher detection rates. Here are a few examples to clarify the idea:
• Xue et al. [37] reported sensitivities of 99.84% and 99.09% and positive predictivityof 99.61% and 98.59% based on just two records, 105 and 108 from the MIT-BIHArrhythmia Database.
• Wavelet transforms were used for QRS detection by Li et al. [34]. They reported0.15% false detections based on 46 files from the MIT-BIH Arrhythmia Database,excluding files 214 and 215.
• Moraes et al. [38] logically combined two different algorithms working in parallel,the first adopted from the work of Englese and Zeelenberg [39], the second basedon Pan and Tompkins [3] and Ligtenberg and Kunt [40]. Moraes et al. reportedsensitivity of 99.22% and specificity of 99.73% after having excluded records ofpatients with pacemakers. However, they also excluded recordings 108, 200, 201,and 203, from the MIT-BIH Arrhythmia Database.
• Continuous spline wavelet transform using local maxima of the continuous wavelettransform at different scales have been used by Alvarado et al. [41]. They reportedsensitivity of 99.87% and positive predictivity of 99.82% after using just nine filesout of 48 files from MIT-BIH Arrhythmia Database.
• Zhang et al. [42] used the continuous wavelet transform, followed by fixed thresh-olds. They reported accuracy of 99.5% after using just eight files out of 48 filesfrom MIT-BIH Arrhythmia Database.
Most of the proposed algorithms were tested on one dataset, the MIT-BIH ArrhythmiaDatabase. The authors exclude some records from the database to improve the overallaccuracy. Here is an example based on the proposed detector: If records 108 and 207 areexcluded from this study, the proposed detector scores SE of 99.9% and +P of 99.95%,which does not reflect the real performance of the algorithm. Therefore, the author urges
8

readers, researchers, and biomedical-signal-analysis community of using the standarddatabases with excluding any record or beat. Now, after the misleading conclusions basedon data elimination have been discussed, the performance of the proposed detector canbe discussed technically. The main technical aspects of any QRS detector are frequency-band choice, window-size and threshold choices, failure, and processing time.
4.1 Implementation Steps
In general, the Pan and Tompkins algorithm is more complex compared to the proposedalgorithm, and thus has more implementation steps, as shown in Table 4. The Panand Tompkins algorithm requires a resampling step for any ECG signal not sampledat 200 Hz. Its filters are designed for 200 Hz, so performance will be degraded atother sampling frequencies. Moreover, as the Pan and Tompkins algorithm is amplitudedependent, subtraction of the statistical mean of the ECG signals is also required. Italso imposes a differentiation step to emphasize the QRS complex slope information.Furthermore, the thresholding step is complicated (really this word, not just a phrasethat contains it) compared to that of the proposed algorithm. The thresholding code ofthe Pan and Tompkins algorithm is taken from DigiScope software [43].
4.2 Frequency-Band Choice
In the literature, the QRS frequency band has been used without actually identifyingthe optimum QRS frequency range for the detection of the QRS complexes. Differentresearchers used different passbands; for example, Thakor et al. [18] proposed an esti-mate of QRS complex spectra and suggested that the passband that maximizes the QRSenergy is approximately 5–15 Hz. Pan and Tompkins [3] used cascaded low-pass andhigh-pass filters to achieve a passband of about 5–11 Hz. Li et al. [34] used a quadraticspline wavelet with compact support and one vanishing moment. They concluded thatmost QRS complex energies are at the scale of 24; that is, the Fourier transform fre-quency range lies between 4 and the 13.5 Hz. Sahambi et al. [44] used the first derivativeof a Gaussian smoothing wavelet and found that most QRS complex energies are at thescales of 23 and 24, with corresponding frequency ranges between 4.1 Hz and 33.1 Hz.Benitez et al. [36] developed a QRS detection algorithm using the properties of theHilbert transform with band stop frequencies at 8 and 20 Hz in order to remove mus-cular noise and maximize the QRS complex, respectively. Moraes et al. [38] combinedtwo improved QRS detectors using a band-pass filter between 9 and 30 Hz. Chen andChen [19] introduced a QRS detection algorithm based on real-time moving averagesand assumed the QRS frequencies were concentrated at approximately 5–15 Hz. Mah-moodabadi et al. [45] used Daubechies2 to detect QRS complex using scales of 23–25,which covers the frequency range 2.2–33.3 Hz.
Most of these authors evaluated their algorithms using the MIT-BIH ArrhythmiaDatabase and determined the frequency bands experimentally, without justifying theirchoice. Thus, an optimal frequency band for detecting QRS complexes is proposed basedon rigorous brute-force optimization, which is 8–20 Hz, as elaborated in the parameter
9
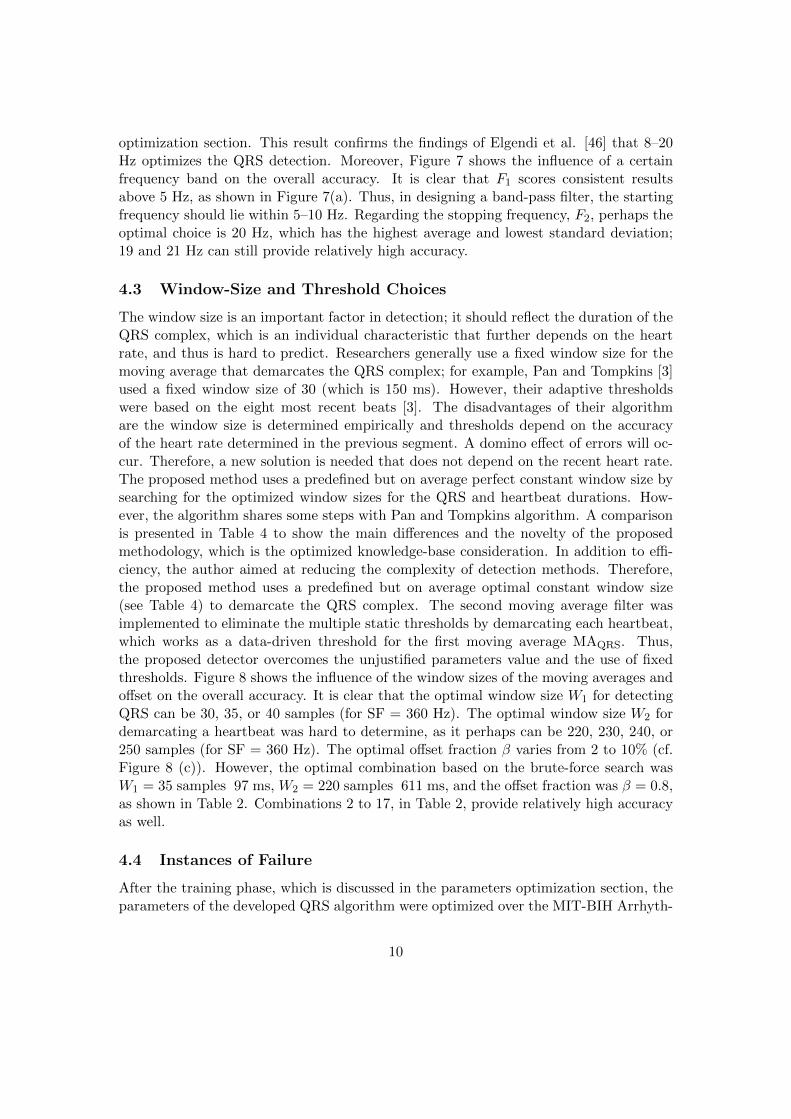
optimization section. This result confirms the findings of Elgendi et al. [46] that 8–20Hz optimizes the QRS detection. Moreover, Figure 7 shows the influence of a certainfrequency band on the overall accuracy. It is clear that F1 scores consistent resultsabove 5 Hz, as shown in Figure 7(a). Thus, in designing a band-pass filter, the startingfrequency should lie within 5–10 Hz. Regarding the stopping frequency, F2, perhaps theoptimal choice is 20 Hz, which has the highest average and lowest standard deviation;19 and 21 Hz can still provide relatively high accuracy.
4.3 Window-Size and Threshold Choices
The window size is an important factor in detection; it should reflect the duration of theQRS complex, which is an individual characteristic that further depends on the heartrate, and thus is hard to predict. Researchers generally use a fixed window size for themoving average that demarcates the QRS complex; for example, Pan and Tompkins [3]used a fixed window size of 30 (which is 150 ms). However, their adaptive thresholdswere based on the eight most recent beats [3]. The disadvantages of their algorithmare the window size is determined empirically and thresholds depend on the accuracyof the heart rate determined in the previous segment. A domino effect of errors will oc-cur. Therefore, a new solution is needed that does not depend on the recent heart rate.The proposed method uses a predefined but on average perfect constant window size bysearching for the optimized window sizes for the QRS and heartbeat durations. How-ever, the algorithm shares some steps with Pan and Tompkins algorithm. A comparisonis presented in Table 4 to show the main differences and the novelty of the proposedmethodology, which is the optimized knowledge-base consideration. In addition to effi-ciency, the author aimed at reducing the complexity of detection methods. Therefore,the proposed method uses a predefined but on average optimal constant window size(see Table 4) to demarcate the QRS complex. The second moving average filter wasimplemented to eliminate the multiple static thresholds by demarcating each heartbeat,which works as a data-driven threshold for the first moving average MAQRS. Thus,the proposed detector overcomes the unjustified parameters value and the use of fixedthresholds. Figure 8 shows the influence of the window sizes of the moving averages andoffset on the overall accuracy. It is clear that the optimal window size W1 for detectingQRS can be 30, 35, or 40 samples (for SF = 360 Hz). The optimal window size W2 fordemarcating a heartbeat was hard to determine, as it perhaps can be 220, 230, 240, or250 samples (for SF = 360 Hz). The optimal offset fraction β varies from 2 to 10% (cf.Figure 8 (c)). However, the optimal combination based on the brute-force search wasW1 = 35 samples 97 ms, W2 = 220 samples 611 ms, and the offset fraction was β = 0.8,as shown in Table 2. Combinations 2 to 17, in Table 2, provide relatively high accuracyas well.
4.4 Instances of Failure
After the training phase, which is discussed in the parameters optimization section, theparameters of the developed QRS algorithm were optimized over the MIT-BIH Arrhyth-
10

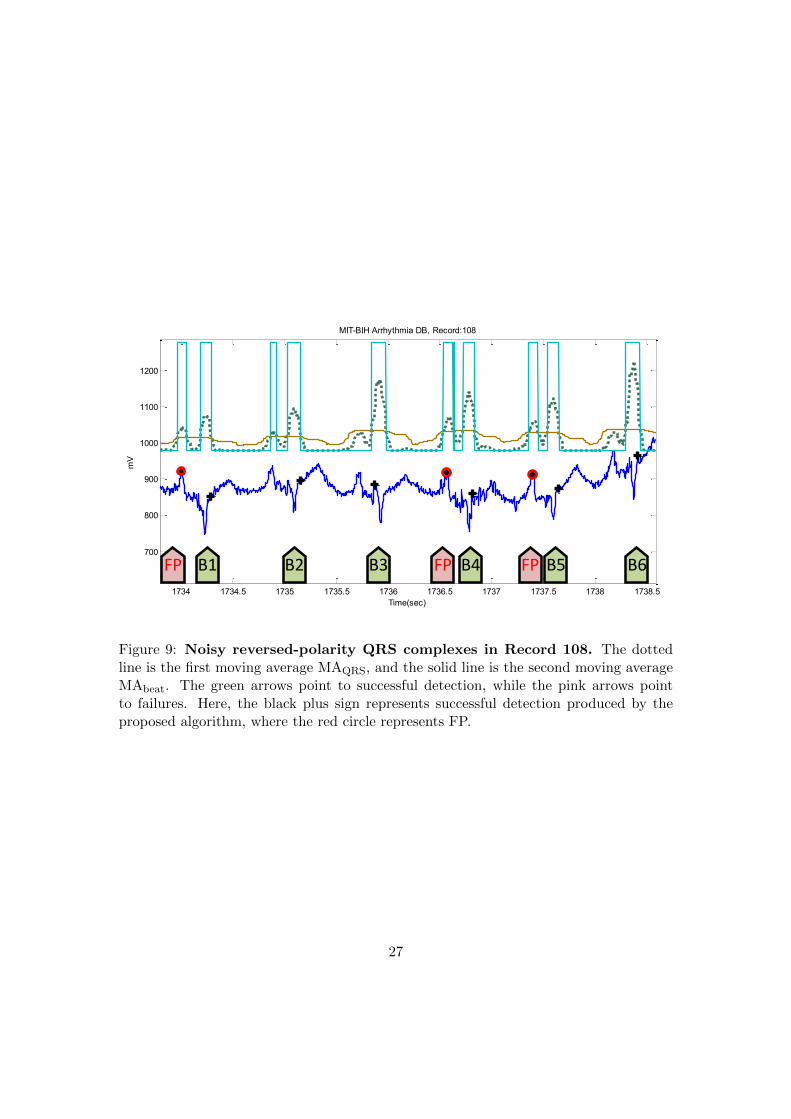
mia Database. The optimized algorithm will be tested on all other databases withoutany tuning. The algorithm has been used straight out of the box and has not beenre-tuned over any databases. In the testing phase, usually algorithms fail at specificinstances within the ECG recordings, which are considered either false positives (FPs)or false negatives (FNs). These instances of failure will be discussed over all databases,including the database used in training. The proposed algorithm incurred a total of 124FPs and a total of 247 FNs over the MIT-BIH Arrhythmia Database. The noisy reversedQRS polarities caused the highest number of FPs in Record 108, as shown in Figure 9,while Record 207 scored the highest number of FNs, precisely 198 FNs, because of theventricular flutters (cf. Figure 10). In Figure 9, the two moving averages succeeded ingenerating blocks of interest that demarcated all QRS complexes, but also demarcatedthe wide P waves, causing FPs before B1, B4, and B5 shown in Figure 9; and thresholdTHR2 could not help in rejecting them. On the other hand, the moving averages couldnot generate blocks of interest due to the fast rhythm as B3, B5 and B7 show in Figure10.
For the INCART database, the algorithm incurred a total of 5197 FPs and 1995 FNs.Because of the very noisy signals, Record 53 had 428 FPs and 104 FNs (cf. Figure 11).The annotations of this database may need revision as the position of the R peaks isvery hard to determine, as shown in Figure 11. However, the algorithm runs over thedatabase without any adjustments to the annotated R peaks. FPs and FNs were 315and 50 when the algorithm was applied on the Fantasia database. The highest FP valueswere in record f1o09, where the ECG signals contain wide U waves, as shown in Figure12. Likewise, Record 16272 (in the NSR database) had the most number of FPs, 49instances out of 63 FPs, because of the existence of U waves. The algorithm incurred atotal of 5197 FPs and 1995 FNs on INCART database. Because of the very noisy signals,Record 53 had 428 FPs, and 104 FNs (cf. Figure 11). The annotations of this databaseperhaps needs revision as the position of the R peaks is very hard to determine, as shownin Figure 11. However, the algorithm runs over the database without any adjustmentsto the annotated R peaks.
Using the AFTDB database, the detector achieved a low number of FPs, and FNs,17 and 34, correspondingly. Due to the fast rhythm of the atrial fibrillation, the numberof FNs was higher than that of the FPs, which is similar to the detectors performance onthe MIT-BIH Arrhythmia Database; Figure 10 may clarify the idea of the occurrence ofFNs in a fast rhythm. It was expected that SVDBs performance would have more FNsthan FPs, as it contains supraventricular arrhythmias. However, the highest number ofFNs was registered from Record 848-SVDB due to the rapid heart rhythm. The numberof FPs also increased because of the noisy reversed-polarity QRS beats, as in Record 886,which had the highest number of FPs, exactly 99 of a total of 356. Figure 13 shows howthe isolated QRS-like artifacts caused FNs in Record iaf7 afw from the IAF database,scoring the highest number of FNs, 80 FNs out of a total of 83. On the other hand, thenumber of FPs was the highest, 250 out of a total 419 FPs, in Record iaf5 afw, whichcontains wide U waves similar to the example presented in Figure 12.
It can be seen in Figure 14, because of the T wave alternans and low-amplitude
11

QRS complexes, that detecting R peaks is challenging. The performance of the detectoron the TWA database incurred 156 FPs and 230 FNs. The first FN (at left) occurredbecause the moving average could not generate blocks of interest; however, the secondFN (at right) happened since it has been demarcated (cf. Figure 14). The duration ofthe block (second FN at right) is below the optimized duration of QRS complex W1, andis thus rejected causing FN, while the FP arises due to the existence of noisy T wavealternans.
Analyzing the performance of NSTDB is quite confusing, perhaps because the an-notations are not completely correct and certainly need modification. However, thedetector ran over the dataset as it is and incurred 2,844 FPs and 1,199 FNs overall.Regarding the ST database, the FPs and FNs were 131 and 33 in total, respectively.The highest number of FPs occurred in Record 305-STDB due to large T waves, whilethe inverted polarity of QRS complexes caused the large number of FNs. On the otherhand, the detectors obtained a total of 305 FPs and 3 FNs over the QT database. TheFPs are mainly caused by the steeply upward-sloping T waves (cf. Figure 15).
4.5 Processing Time
In this study, the proposed detector was implemented in MATLAB 2010b (The Math-Works, Inc., Natick, MA, USA) on IntelTM i5 CPU 2.27 GHz. Perhaps it is misleadingto suggest that mentioning the average speed of the proposed detector, over a certaintime length of ECG signal, would provide a comparative result. This is because theprocessing time depends on the number of beats within each ECG recording, not on therecord length. As the 11 databases contain different recording lengths, a categorizationby recording length is needed to evaluate the speed of the Pan and Tompkins algo-rithm and the proposed detector fairly on the same computer. It can be seen in Figure16 that the proposed algorithm was faster and steadier across all recoding-length cate-gories compared to Pan and Tompkins algorithm. The speed measured in seconds, whilethe recording-length category was in minutes. The number of beats of the 30-minuterecordings category was relatively consistent—with a mean ± SD, number of beats 2291± 448—over all records of this category. The same holds for 1-minute and 15-minuterecording categories. On the contrary, the 130-minute beat average was 10,171 with anSD of 2,600 beats; thus, the processing time depends on the number of beats rather thanthe recording length. For example, Record 16272-NSRDB contains 7,988 beats, and theproposed detector took 1.5 seconds to process it, while it took 3.5 seconds to process14,875 beats in Record 19830-NSRDB. In general, without taking the number of beatsinto consideration, the speed of the proposed detector is fast. The suggested detectorhandles 15-minute recordings in about 0.15 seconds, while it takes about 2.2 seconds tohandle 130-minute ECG recordings.
12

5 Limitations of Study and Future Work
One of the next steps regarding the result of this study is to detect arrhythmic ECGbeats, using the RR interval as the main feature. In addition, the detection of P and Twaves based on the accurate detection of R peaks need to be examined.
Optimization was performed over the MIT-BIH Arrhythmia Database as a whole. Forbetter comparability, the whole data set could have been separated into a training anda test set in which the training set is used for optimizing and the test set for evaluatingthe performance. Perhaps the leave-one-out cross validation suits this optimization step.
In this investigation, the processing time of the Pan and Tompkins algorithm andthe proposed algorithm is carried out using MATLAB for batch processing of ECG files.MATLAB does only high precision floating point arithmetic. Perhaps, the implementa-tion of the proposed algorithm in C-language is required to compare the performanceover fixed point integer arithmetic (i.e., it doesn’t need a high performance computerwith a multi-precision floating point processor to run).
It is important to note that the largest ECG recording used in this study is 130minutes. Larger recordings (e.g., 24 hours) with different noise levels are needed inorder to generalize the findings of this study.
Technically, exploring the event-related moving average methodology for detectingevents in ECG signals is promising in terms of computational complexity and efficiency.This can be further improved by investigating other band-pass filters, with differentorders, and also by developing fast-moving average techniques for real-time analysis andmobile phone applications.
6 Conclusion
A new approach for detecting QRS in ECG signals is presented. It contains two parts:the optimization, which was more complex, and the algorithm itself, which is tunednow and can be implemented and used with relative easiness. The performance ofthe optimized knowledge-based detector is promising. It has been tested on differentdatabases that contain unusual noise, QRS, T, and U waves morphologies. The extensiveuse of the MIT-BIH Database as a testing database can hide overtuning of the detectorparameters to fit this particular database. Consequently, the validation of the samedetector on a second dataset without any later parameter tuning can help to obtainmore reliable performance results. After the algorithm was applied on other databases,high detection rates were obtained on the QT database, NSR, TWA, IAF, ST, SV, AFT,FANTASIA, NST and ICART databases. Interestingly, the detector’s speed over 130-minute recordings is about 2.2 seconds; thus, the proposed detector is an auspicioustool for processing large-recorded ECG signals. Furthermore, its simplicity makes it anideal algorithm for mobile-phone applications and battery-driven ECG signal devices.Moreover, such a fast robust algorithm could have several interesting applications inan online analysis of cardiac data collected by the smallest long-term recording devicesthat have been studied in the form of necklaces and smart electrodes. The assessment
13
of the QRS detector has been reliably conducted over the existing standard databases.Moreover, the number of annotated beats used in testing the new algorithm is consideredsufficient as it is tested on a good representation of the possible morphologies found inECG signals.
7 Acknowledgments
Mohamed Elgendi appreciates the support of Prof. Friso De Boer, and acknowledges Dr.Gari Clifford for helpful discussions. The author also would like to thank Prof. WillisTompkins for his great help with implementing the Pan and Tompkins algorithm.
References
[1] Alwan A (2011) Global status report on noncommunicable disaeses 2010. WorldHealth Organization .
[2] Dilaveris PE, Gialafos EJ, Sideris SK, Theopistou AM, Andrikopoulos GK, et al.(1998) Simple electrocardiographic markers for the prediction of paroxysmal idio-pathic atrial fibrillation. American Heart Journal 135: 733–738.
[3] Pan J, Tompkins W (1985) A real-time QRS detection algorithm. IEEE TransBiomed Eng 32: 230–236.
[4] Silva I, Moody GB, Celi L (2011) Improving the quality of ECGs collected us-ing mobile phones: The Physionet/Computing in Cardiology Challenge 2011. In:Proc. IEEE Computing in Cardiology. pp. 273–276.
[5] Moody GB, Mark RG (2001) The impact of the MIT-BIH arrhythmia database.IEEE Engineering in Medicine and Biology Magazine 20: 45–50.
[6] Friesen G, Jannett T, Jadallah M, Yates S, Quint S, et al. (1990) A comparison ofthe noise sensitivity of nine QRS detection algorithms. IEEE Trans on Biomed Eng37: 85–98.
[7] Braunwald E, Zipes D, Libby P, Bonow R (2004) Braunwald’s Heart Disease: ATextbook of Cardiovascular Medicine, volume Single Volume. Philadelphia: Saun-ders, 7th edition edition.
[8] Laguna P, Mark R, Goldberg A, Moody G (1997) A database for evalua-tion of algorithms for measurement of QT and other waveform intervals in theECG. In: Proc. IEEE Computers in Cardiology 1997. pp. 673–676. doi:10.1109/CIC.1997.648140.
[9] Moody GB (2008) The Physionet/Computers in Cardiology challenge 2008: T-wavealternans. In: Proc. IEEE Computers in Cardiology. pp. 505–508.
14

[10] Goldberger AL, Amaral LAN, Glass L, Hausdorff JM, Ivanov PC, et al. (2000)PhysioBank, PhysioToolkit, and PhysioNet: Components of a new research resourcefor complex physiologic signals. Circulation 101: e215–e220.
[11] Albrecht P (1983) S-T segment characterization for long-term automated ECGanalysis. M.S. thesis, MIT Dept. of Electrical Engineering and Computer Science,Boston, MA, USA.
[12] Greenwald S (1990) Improved detection and classification of arrhythmias in noise-corrupted electrocardiograms using contextual information. Ph.D. thesis, Harvard-MIT Division of Health Sciences and Technology, Boston, MA, USA.
[13] Moody G (2004) Spontaneous termination of atrial fibrillation: a challenge fromPhysionet and Computers in Cardiology 2004. In: Proc. IEEE Computers in Car-diology. pp. 101–104. doi:10.1109/CIC.2004.1442881.
[14] Iyengar N, Peng CK, Morin R, Goldberger AL, Lipsitz LA (1996) Age-related al-terations in the fractal scaling of cardiac interbeat interval dynamics. AmericanJournal of Physiology - Regulatory, Integrative and Comparative Physiology 271:R1078–R1084.
[15] Moody GB, Muldrow W, Mark R (1984) A noise stress test for arrhythmia detectors.In: Proc. IEEE Computers in Cardiology. pp. 381–384.
[16] Clifford GD, Azuaje F, McSharry P (2006) Advanced Methods And Tools for ECGData Analysis. Norwood, MA, USA: Artech House, Inc.
[17] Oppenheim A, Shafer R (1989) Discrete-time Signal Processing. NJ: Prentice Hall.
[18] Thakor NV, Webster JG, Tompkins WJ (1983) Optimal QRS detector. Medicaland Biological Engineering 21: 343–50.
[19] Chen H, Chen S (2003) A moving average based filtering system with its applicationto real-time QRS detection. In: Proc. IEEE Computers in Cardiology. pp. 585–588.doi:10.1109/CIC.2003.1291223.
[20] Firbank M, Coulthard A, Harrison R, Williams E (1999) A comparison of twomethods for measuring the signal to noise ratio on MR images. Physics in Medicineand Biology 44: 261–264.
[21] Arzeno N, Deng Z, Poon C (2008) Analysis of first-derivative based QRS detectionalgorithms. IEEE Trans on Biomed Eng 55: 478–484.
[22] Elgendi M, Mahalingam S, Jonkman M, De Boer F (2008) A robust QRS complexdetection algorithm using dynamic thresholds. In: Proc. IEEE Int. Symp. ComputerScience and its Applications (CSA’08), Hobart, Tasmania, Australia, pp. 153–158.
15

[23] Elgendi M, Jonkman M, De Boer F (2009) Improved QRS detection algorithmusing dynamic thresholds. International Journal of Hybrid Information Technology(IJHT) 2: 56–80.
[24] Adnane M, Jiang Z, Choi S (2009) Development of QRS detection algorithm de-signed for wearable cardiorespiratory system. Computer Methods and Programs inBiomedicine 93: 20–31.
[25] Ghaffari A, Golbayani H, Ghasemi M (2008) A new mathematical based QRS de-tector using continuous wavelet transform. Computers & Electrical Engineering 34:81–91.
[26] Zheng H, Wu J (2008) Real-time QRS detection method. In: Proc. IEEE10th Int. Conf. Real-time QRS detection method, e-health Networking, Ap-plications and Services (HealthCom 2008), Singapore, pp. 169–170. doi:10.1109/HEALTH.2008.4600130.
[27] Fard P, Moradi M, Tajvidi M (2007) A novel approach in R peak detection usinghybrid complex wavelet (HCW). International Journal of Cardiology 124: 250–253.
[28] Darrington J (2006) Towards real time QRS detection: a fast method using minimalpre-processing. Biomedical Signal Processing and Control 1: 169–176.
[29] Chen SW, Chen HC, Chan HL (2006) A real-time QRS detection method based onmoving-averaging incorporating with wavelet denoising. Computer Methods andPrograms in Biomedicine 82: 187–195.
[30] Martinez JP, Almeida R, Olmos S, Rocha AP, Laguna P (2004) A wavelet-basedECG delineator: evaluation on standard databases. IEEE Transactions on Biomed-ical Engineering 51: 570–581.
[31] Hamilton P (2002) Open source ECG analysis. In: Proc. IEEE Computers inCardiology. pp. 101–104. doi:10.1109/CIC.2002.1166717.
[32] Lee J, Jeong K, Yoon J, Lee JH (1996) A simple real-time QRS detection algo-rithm. In: Proc. 18th Annual International Conference of the IEEE Engineering inMedicine and Biology Society, 1996. Bridging Disciplines for Biomedicine. volume 4,pp. 1396–1398. doi:10.1109/IEMBS.1996.647473.
[33] Afonso VX, Tompkins WJ, Nguyen TQ, Luo S (1996) Filter bank-based ECG beatdetection. In: Proc. 18th Annual Int. Conf. IEEE Engineering in Medicine andBiology Society; Bridging Disciplines for Biomedicine, Amsterdam, Netherlands,Vol. 3, 1037-1038. doi:10.1109/IEMBS.1996.652698.
[34] Li C, Zheng C, Tai C (1995) Detection of ECG characteristic points using wavelettransforms. IEEE Trans on Biomed Eng 42: 21–28.
16

[35] Hamilton PS, Tompkins WJ (1986) Quantitative Investigation of QRS DetectionRules Using the MIT/BIH Arrhythmia Database. IEEE Trans on Biomed EngBME-33: 1157–1165.
[36] Benitez DS, Gaydecki PA, Zaidi A, Fitzpatrick AP (2000) A new QRS detectionalgorithm based on the Hilbert transform. In: Proc. IEEE Computers in Cardiology.pp. 379–382.
[37] Xue Q, Hu Y, Tompkins W (1992) Neural-network-based adaptive matched filteringfor QRS detection. IEEE Trans on Biomed Eng 39: 317–329.
[38] Moraes JCTB, Freitas MM, Vilani FN, Costa EV (2002) A QRS complex detectionalgorithm using electrocardiogram leads. In: Proc. IEEE Computers in Cardiology.pp. 205–208. doi:10.1109/CIC.2002.1166743.
[39] Englese WAH, Zeelenberg C (1979) A single scan algorithm for QRS detection andfeature extraction. In: Proc. IEEE Computers in Cardiology. pp. 37–42.
[40] Ligtenberg A, Kunt M (1983) A robust-digital QRS detection algorithm for arrhyth-mia monitoring. Computers and Biomed Res 16: 273–286.
[41] Alvarado C, Arregui J, Ramos J, Pallas-Areny R (2005) Automatic detection ofECG ventricular activity waves using continuous spline wavelet transform. In: Proc.2nd International Conference on Electrical and Electronics Engineering. pp. 189–192. doi:10.1109/ICEEE.2005.1529605.
[42] Zhang F, Lian Y (2007) Novel QRS detection by CWT for ECG sensor. In:Proc. IEEE Biomedical Circuits and Systems Conference. pp. 211–214. doi:10.1109/BIOCAS.2007.4463346.
[43] Tompkins W (2012). DigiScope, https://courses.moodle.wisc.edu/prod/course/view.php?id=115.
[44] Sahambi JS, Tandon S, Bhatt RKP (1997) Using wavelet transforms for ECGcharacterization. An on-line digital signal processing system. IEEE Engineeringin Medicine and Biology Magazine 16: 77–83.
[45] Mahmoodabadi SZ, Ahmadian A, Abolhasani MD (2005) ECG feature extractionusing Daubechies wavelets. In: Proc. Fifth IASTED International Conference. pp.343–348.
[46] Elgendi M, Jonkman M, De Boer F (2010) Frequency bands effects on QRS detec-tion. In: Proc. International Joint Conference on Biomedical Engineering Systemsand Technologies, BIOSIGNALS 2010, Valencia, Spain. pp. 428–431.
17

Figure Legends
18

641 641.5 642 642.5 643
980
1000
1020
1040
1060
1080
1100
1120
1140
0 20 40 60 80 100 120 140 160 1800
200
400
600
800
1000
1200
Frequency/[Hz]
Vol
ts2 /H
z
0 0.5 1 1.5 2 2.5
x 104
-0.6
-0.4
-0.2
0
0.2
0.4
0.6
0.8
6.28 6.3 6.32 6.34 6.36 6.38 6.4 6.42 6.44
x 104
-3
-2.5
-2
-1.5
-1
-0.5
0
0.5
1
1.5
2
914.6 914.8 915 915.2 915.4 915.6 915.8 916 916.2
700
800
900
1000
1100
1200
1300
1400
1500
(a) (b)
(c) (d)
500 1000 1500 2000
-2
-1.5
-1
-0.5
0
0.5
1
(e) (f)
9.2 9.4 9.6 9.8 10 10.2 10.4 10.6 10.8
850
900
950
1000
1050
1100
1150
3.5 4 4.5 5 5.5
650
700
750
800
850
900
950
1000
1050
1100
(g) (h)
PVC PVC PVC
1.2 1.4 1.6 1.8 2 2.2 2.4 2.6 2.8 3
950
1000
1050
1100
1150
1200
(i)
197.5 198 198.5 199 199.5
950
1000
1050
1100
1150
1200
(j)
Figure 1: Challenges in detecting QRS in ECG signals. (a) Mains electricitynoise: the spectrum illustrates peaks at the fundamental frequency of 60 Hz as well asthe second and third harmonics at 120 Hz and 180 Hz, caused by stray magnetic fieldscausing the enclosure and accessories to vibrate. (b) High frequency noise caused bycoughing. (c) Large movement of the chest. (d) Isolated QRS-like artifacts. (e) Nodal(junctional) escape beats affected by baseline wandering. (f) Premature ventricularcontractions. (g) Left bundle branch block. (h) Right bundle branch block. (i) Pacedbeat. (j) Fusion of paced and normal beat.
19

Indices for
R peaks
ECG
Knowledgebase
BandpassFilter
Squaring ThresholdingGenerateblocks ofinterest
x[n] y[n]
W1W1W2
,
Figure 2: Flowchart of the knowledge-based QRS detection algorithm. Thealgorithm consists of three stages: pre-processing (bandpass filter and squaring), featureextraction (generating blocks of interest based on prior knowledge), and thresholding(based on prior knowledge).
20

Block of Interest
Figure 3: Demonstrating the effectiveness of using two moving averages todetect the QRS complex. (a) One beat ECG signal, (b) filtered one-beat ECG signalwith Butterworth band-pass filter, (c) squaring the filtered signal, and (d) generatinga block of interest after using two event-related moving averages: The dotted red lineis the MAQRS, and the solid green line is the MAbeat. The R peak within the block ofinterest is then detected after the event-related threshold is applied.
21

0.1 0.2 0.3 0.4 0.5 0.6 0.7 0.8
1
2
3
4
5
6
7
8
9
10
11
x 10-3
mV
α
Time (s)
Figure 4: Demonstrating the statistical threshold. The squared one-beat ECGsignal (Z), which is shown in Figure 3 (c), where the dashed line represents the offsetcaused by α.
22
Algorithm 1 QRS Detector
h[]>.fkwxhghhh[h]h>h.hfhkhwhx[g[h[[[][>[.[f[k
Create function QRS_DetectorMFhmF[mWhmW[mβA
Filtered = BandpassMECGm Fh+F[ASq_Filtered = SquareMFilteredMAQRS = MAMSq_Filteredm WhAMAbeat = MAMSq_Filteredm W[Az =nmeanMSq_FilteredAα = βz MAbeatTHRh = MAbeat α
for n = hntonlengthMMAQRSA doif MAQRS[n]>THRh Then
BlocksOfInterest[n]= gThElse
BlocksOfInterest[n]= gEnd if
END forBlocks ← onsetnandnoffsetnfrom BlocksOfInterestSet THR[ = Whfor j = hntonnumbernofnblocks do
if widthMBlocks[j]A>= THR[ ThenR_Peak ← maxnvaluenwithnthisnblock
ElseIgnorenthisnblock
End ifEND for
End function
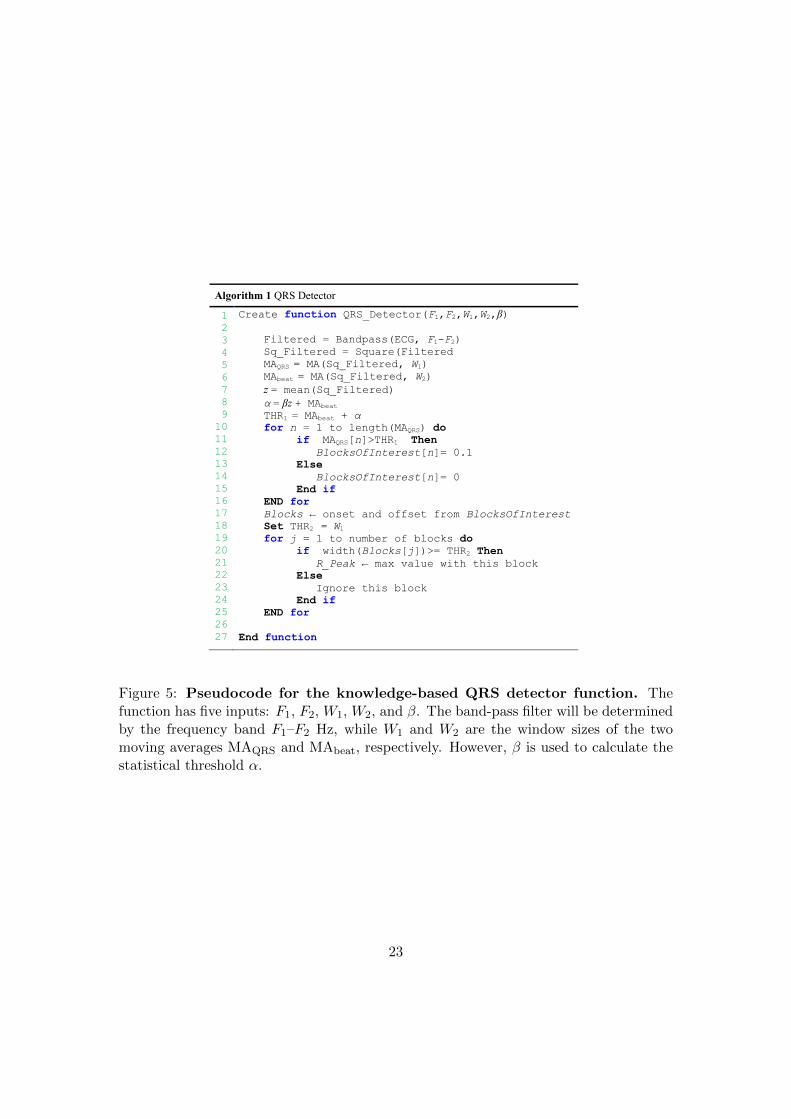
Figure 5: Pseudocode for the knowledge-based QRS detector function. Thefunction has five inputs: F1, F2, W1, W2, and β. The band-pass filter will be determinedby the frequency band F1–F2 Hz, while W1 and W2 are the window sizes of the twomoving averages MAQRS and MAbeat, respectively. However, β is used to calculate thestatistical threshold α.
23

Algorithm 2 Detector Optimizer
12345678910111213
Initialize MaxF1 = 10, MaxF2 = 25, MaxW1 = 40, MaxW2 = 250, Maxβ = 0.1for F1 = 1)to MaxF1 with step = 1 do
for F2 = F1+10)to MaxF2 with step = 1 dofor W1 = 20)to MaxW1 with step = 5 do
for W2 = 200)to MaxW2 with step = 10 dofor β = 0)to Maxβ with step = 0.01 doR_Peaks = QRS_Detector(F1,F2,W1,W2,β)Calculate)SE,+PEND for
END forEND for
END forEND for
Figure 6: Pseudocode for the brute-force optimizer. The optimizer is initializedwith MaxF1 = 10 Hz, MaxF2 = 25 Hz, MaxW1 = 40 samples, MaxW2 = 250 sam-ples, and Maxβ = 0.1. Systematically, this exhaustive search enumerates all possiblecombinations for the solution and checks whether each combination provides an optimaldetector based on SE and +P.
24

1 2 3 4 5 6 7 8 9 1075
80
85
90
95
100
F1(Hz)
Acc(%)
11 12 13 14 15 16 17 18 19 20 21 22 23 24 2584
86
88
90
92
94
96
98
100
102
104
F2(Hz)
Acc(%)
(a)
(b)
Figure 7: Influence of frequency bands on the overall accuracy based on brute-force optimization. (a) Frequency band starts at value within 1–10 Hz. (b) Frequencyband stops at value within 11–25 Hz, where the circle is the statistical mean, and thebar is the standard deviation.
25

20 25 30 35 4075
80
85
90
95
100
105
MA1(samples)
Acc(%)
200 210 220 230 240 25086
88
90
92
94
96
98
100
102
104
MA2(samples)
Acc(%)
0 1 2 3 4 5 6 7 8 9 1088
90
92
94
96
98
100
102
104
OFFSET(%)
Acc(%)
(a)
(b)
(c)
Figure 8: Influence of window sizes and offset on the overall accuracy basedon brute-force optimization. (a) The window size of the MAQRS varies from 20 to40 samples, for SF = 360 Hz. (b) The window size of the MAbeat varies from 200 to250 samples for SF = 360 Hz. (c) The offset fraction β varies from 0 to 10%, where thecircle is the statistical mean, and the bar is the standard deviation.
26
1734 1734.5 1735 1735.5 1736 1736.5 1737 1737.5 1738 1738.5
700
800
900
1000
1100
1200
Time(sec)
mV
MIT-BIHaArrhythmiaaDB,aRecord:108
FP B2 B3 FP B6B4FP B5B1
Figure 9: Noisy reversed-polarity QRS complexes in Record 108. The dottedline is the first moving average MAQRS, and the solid line is the second moving averageMAbeat. The green arrows point to successful detection, while the pink arrows pointto failures. Here, the black plus sign represents successful detection produced by theproposed algorithm, where the red circle represents FP.
27

1635 1635.5 1636 1636.5 1637 1637.5
800
850
900
950
1000
1050
1100
1150
1200
1250
Time(sec)
mV
MIT-BIHDArrhythmiaDDB,DRecord:207
B1 B2 FN B4 B6 B8FN FN
Figure 10: Ventricular flutters in Record 207-MITDB. The dotted line is the firstmoving average MAQRS, and the solid line is the second moving average MAbeat. Thegreen arrows point to successful detection, while the pink arrows point to failures. Here,the black plus sign represents successful detection produced by the proposed algorithm,where the red circle represents FN.
28

1695 1695.5 1696 1696.5 1697 1697.5
-1000
-500
0
500
1000
Time(sec)
mV
incartdb database, Record:53
FP FPFNFN
Figure 11: Noisy ECG signals in Record 53-INCARTDB. The dotted line is thefirst moving average, MAQRS, and the solid line is the second moving average MAbeat.The arrows point to FNs and FPs. Here, the black plus sign represents successfuldetection produced by the proposed algorithm, where the red circle represents FP, andthe green star represents FN.
29

1596.5 1597 1597.5 1598 1598.5 1599 1599.51.4
1.5
1.6
1.7
1.8
1.9
2
2.1
2.2
2.3
2.4xr10
4
Time(sec)
mV
fantasiardatabase,rRecord:f1o09
FP FP
Figure 12: Wide U waves in Record f1o09-FANTASIADB. The dotted line is thefirst moving average MAQRS, and the solid line is the second moving average MAbeat.The arrows point to FPs. Here, the black plus sign represents successful detectionproduced by the proposed algorithm, where the red circle represents FP.
30

624 624.5 625 625.5 626 626.5 627
-4000
-3000
-2000
-1000
0
1000
2000
3000
4000
5000
Time(sec)
mV
iafdbwdatabase,wRecord:iaf7_afw
FNFN
Figure 13: Isolated QRS-like artifacts in Record iaf7 afw-IAFDB. The dottedline is the first moving average MAQRS, and the solid line is the second moving averageMAbeat. The arrows point to FNs. Here, the black plus sign represents successfuldetection produced by the proposed algorithm, where the green star represents FN.
31

79.5 80 80.5 81 81.5 82 82.5
-10000
-8000
-6000
-4000
-2000
0
2000
4000
6000
8000
Time(sec)
mV
Record:twadb_twa89
FPFN FN
Figure 14: Low-amplitude QRS complexes lie between T wave alternans inRecord twa89-TWADB. The dotted line is the first moving average MAQRS, and thesolid line is the second moving average MAbeat. The arrows point to FNs and FP. Here,the black plus sign represents successful detection produced by the proposed algorithm,and the red circle represents FP, while the green star represents FN.
32

425.5 426 426.5 427 427.5 428 428.5 429 429.5 430
550
600
650
700
750
Time(sec)
mV
Record:sele0111
FP FP
Figure 15: Steeply upward-sloping T waves in Record sele0111-QTDB. Thedotted line is the first moving average MAQRS, and the solid line is the second movingaverage MAbeat. The arrows point to FPs. Here, the black plus sign represents successfuldetection produced by the proposed algorithm, and the red circle represents FP.
33

1 20 30 120 130
0
5
10
15
20
25
30
Record length (min)
Tim
e(se
c)
Figure 16: Processing time for ECG recordings. The average speed of the Panand Tompkins algorithm is represented with a solid black line, while the dotted blue linerepresents the average speed of the proposed detector. The proposed detector processesthe one-minute ECG record in 8.9 milliseconds and the 130-minute recording in 2.2seconds. This result shows the superiority of the proposed detector over the Pan andTompkins algorithm in terms of processing time.
34

Tables
Table 1: ECG features and their normal values in sinus rhythm. The ECGfeatures (P, QRS, and T waves) measured from a healthy male adult at a heart rate of60 beats per minute (bpm). It is critical for the new developed algorithms to have anestimate for the event duration before processing the ECG signal. These durations playa role in determining the window size of the moving averages and threshold values.
Feature NormalQValue NormalQLimitNormalQdurationQforQsamplingQfrequencyQofQ360QHz
PQwidth 110 ms ±20ms 33−47 samplesPQ/PRQinterval 160 ms ±40ms 43−72 samplesQRSQwidth 100 ms ±20ms 29−43 samples
Table 2: A rigorous optimization of all parameters of the algorithm: frequencyband, W1, W2, and the offset fraction β. All possible combinations of parameters(37,950 iterations) have been investigated and sorted into descending order according totheir overall accuracy. The database used is the MIT-BIH Arrhythmia Database. Theoverall accuracy is the average value of SE and +P.
CombinationFrequencyP
BandW1
(samples)W2
(samples)Offset(%)
SEP(%)
+PP(%)
OverallAccuracy
(%)1 8-20 Hz 35 220 8 99.78 99.87 99.832 8-19 Hz 40 220 10 99.76 99.89 99.833 9-19 Hz 40 220 9 99.77 99.89 99.834 8-20 Hz 40 220 8 99.79 99.87 99.835 8-20 Hz 35 220 9 99.77 99.89 99.836 8-19 Hz 35 220 9 99.76 99.89 99.837 8-21 Hz 40 220 8 99.79 99.87 99.838 8-21 Hz 40 230 9 99.77 99.89 99.839 9-19 Hz 35 230 9 99.76 99.89 99.83
10 8-21 Hz 35 220 9 99.77 99.88 99.8211 8-21 Hz 35 210 9 99.78 99.87 99.8212 8-18 Hz 40 220 10 99.75 99.90 99.8213 8-21 Hz 40 220 9 99.77 99.88 99.8214 8-18 Hz 35 220 9 99.76 99.89 99.8215 8-21 Hz 35 220 8 99.78 99.86 99.8216 8-22 Hz 35 220 9 99.77 99.88 99.8217 8-22 Hz 35 220 10 99.75 99.89 99.82
. . . . . . . .
. . . . . . . .37947 1-26 Hz 20 200 7 33.713 93.869 63.79137948 1-26 Hz 20 200 8 33.263 93.907 63.58537949 1-26 Hz 20 200 9 32.803 93.962 63.38337950 1-26 Hz 20 200 10 32.371 94.127 63.249
35
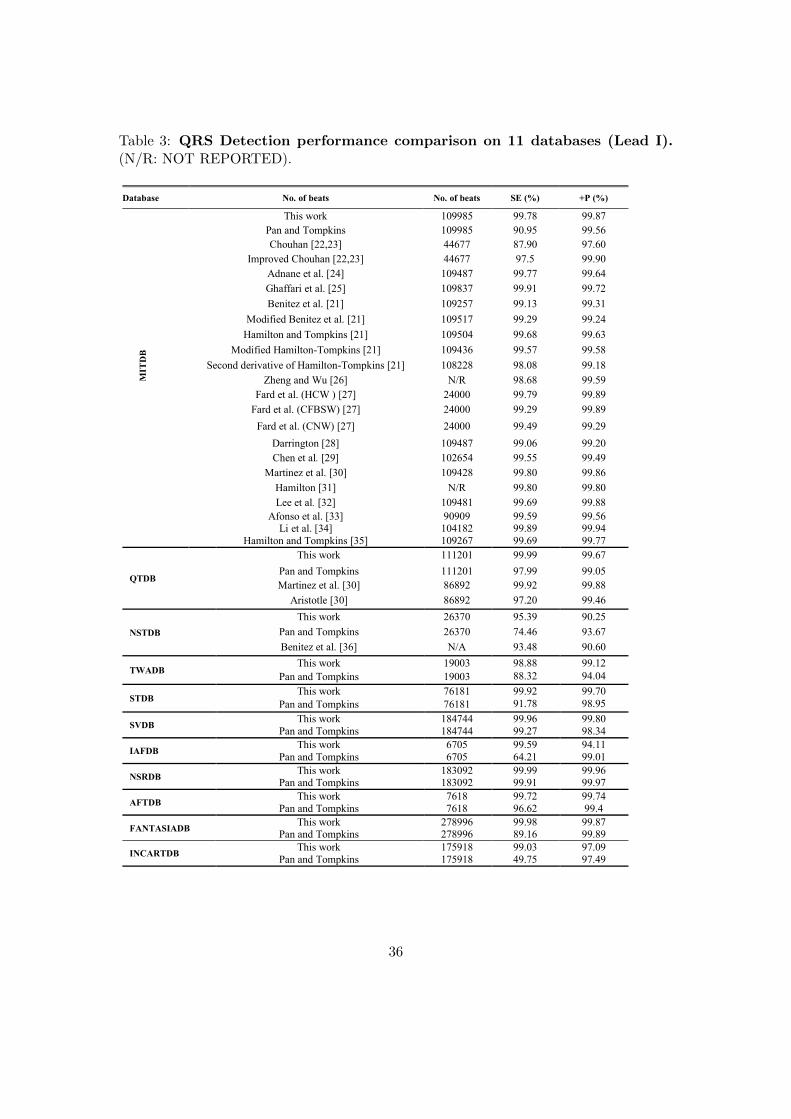
Table 3: QRS Detection performance comparison on 11 databases (Lead I).(N/R: NOT REPORTED).
Database No. of beats No. of beats SE (%) +P (%)
MIT
DB
ThisIwork WgLLDF LLc)D LLcD)PanIandITompkins WgLLDF LgcLF LLcF(ChouhanI[NN-N/] RR()) D)cLg L)c(g
ImprovedIChouhanI[NN-N/] RR()) L)cF LLcLgAdnaneIetIalc [NR] WgLRD) LLc)) LLc(R
GhaffariIetIalc [NF] WgLD/) LLcLW LLc)N
BenitezIetIalc [NW] WgLNF) LLcW/ LLc/W
ModifiedIBenitezIetIalc [NW] WgLFW) LLcNL LLcNR
HamiltonIandITompkinsI[NW] WgLFgR LLc(D LLc(/
ModifiedIHamiltonSTompkinsI[NW] WgLR/( LLcF) LLcFD
SecondIderivativeIofIHamiltonSTompkinsI[NW] WgDNND LDcgD LLcWD
Zheng andIWu [N(] NZR LDc(D LLcFLFardIetIalcIBHCWIzI[N)] NRggg LLc)L LLcDL
FardIetIalcIBCFBSWzI[N)] NRggg LLcNL LLcDL
FardIetIalcIBCNWzI[N)] NRggg LLcRL LLcNL
DarringtonI[ND] WgLRD) LLcg( LLcNgChenIetIal. [NL] WgN(FR LLcFF LLcRL
MartinezIetIalcI[/g] WgLRND LLcDg LLcD(
HamiltonI[/W] NZR LLcDg LLcDg
LeeIetIal. [/N] WgLRDW LLc(L LLcDDAfonsoIetIalc [//] LgLgL LLcFL LLcF(
Li etIalc [/R] WgRWDN LLcDL LLcLRHamiltonIandITompkinsI[/F] WgLN() LLc(L LLc))
QTDB
ThisIwork WWWNgW LLcLL LLc()
PanIandITompkins WWWNgW L)cLL LLcgFMartinezIetIalcI[/g] D(DLN LLcLN LLcDD
AristotleI[/g] D(DLN L)cNg LLcR(
NSTDB
ThisIwork N(/)g LFc/L LgcNF
PanIandITompkins N(/)g )RcR( L/c()
BenitezIetIalc [/(] NZA L/cRD Lgc(g
TWADBThisIwork WLgg/ LDcDD LLcWN
PanIandITompkins WLgg/ DDc/N LRcgR
STDBThisIwork )(WDW LLcLN LLc)g
PanIandITompkins )(WDW LWc)D LDcLF
SVDBThisIwork WDR)RR LLcL( LLcDg
PanIandITompkins WDR)RR LLcN) LDc/R
IAFDBThisIwork ()gF LLcFL LRcWW
PanIandITompkins ()gF (RcNW LLcgW
NSRDBThisIwork WD/gLN LLcLL LLcL(
PanIandITompkins WD/gLN LLcLW LLcL)
AFTDBThisIwork )(WD LLc)N LLc)R
PanIandITompkins )(WD L(c(N LLcR
FANTASIADBThisIwork N)DLL( LLcLD LLcD)
PanIandITompkins N)DLL( DLcW( LLcDL
INCARTDBThisIwork W)FLWD LLcg/ L)cgL
PanIandITompkins W)FLWD RLc)F L)cRL
36

Table 4: Comparison between the proposed QRS detector and the Pan andTompkins algorithm. Here, N/A means NOT APPLIED.
Step Proposed Detector Pan and Tompkins [3]
Resampling N/A Resample ECG to 200 Hz
Mean Subtraction N/A ECG = ECG−mean(ECG)
Frequency Band x = bandpass(ECG, 8–20 Hz) x = bandpass(ECG, 5–15 Hz)
DifferentiationN/A q[n] = 1
8(−x[n− 2]− 2x[n− 1]+2x[n+ 1] + x[n+ 2])
Squaring y[n] = (x[n])2 y[n] = (q[n])2
IntegrationMAQRS[n] = 1
W1(y[n− (W1 − 1)/2] + . . . MA[n] = 1
W (y[n− (W − 1)] + y[n] + . . .
+y[n+ (W1 − 1)/2]), +y[n− (W − 2)] + . . .+ y[n]),where W1 = 97 ms where W = 150 ms
Thresholds
MAbeat[n] = 1W2
(y[n− (W2 − 1)/2] + . . . SPKI = 0.125 PEAKI + 0.875 SPKI
+y[n+ (W2 − 1)/2]), NPKI = 0.125 PEAKI + 0.875 NPKIwhere W2 = 611 ms THR I1 = NPKI + 0.25 (SPKI−NPKI)THR1 = MAbeat + α THR I2 = 0.5 THRESHOLD I1THR2 = W1 SPKI = 0.25 PEAKI + 0.75 SPKI
SPKF = 0.125 PEAKF + 0.875 SPKFNPKF = 0.125 PEAKF + 0.875 NPKFTHR F1 = NPKF + 0.25 (SPKF−NPKF)THR F2 = 0.5 THR F1SPKF = 0.25 PEAKF + 0.75 SPKF
Adjusting thresholds
THR I1← 0.5 THR I1THR F1← 0.5 THR F1RRAVG1 = 0.125 (RRn−7 +RRn−6 + . . .+RRn)
RRAVG2 = 0.125 (RR′n−7 +RR
′n−6 + . . .+RR
′n)
N/A RRLowLimit = 0.92 (RRAVG1)RRHighLimit = 1.16 (RRAVG2)RRMissedLimit = 1.66 (RRAVG2)RRAVG2 ← RRAVG1
37