fast deployable system for consequence management: the
TRANSCRIPT
Fast Deployable System for Consequence Management: The Emergency Evacuation Component 1
Fast Deployable System for Consequence Management: The Emergency Evacuation Component by Oscar Franzese1 and John Sorensen2 Abstract. In 1995, Presidential Decision Directive (PDD) 39 introduced the nation to the term Consequence Management which meant to establish how the effects of a terrorist attack employing weapons of mass destruction and/or other means would be managed. The importance of Consequence Management became more apparent after 9/11 as we realized that is impossible to harden the infrastructure to avoid losses in a range of damage scenarios. If damage occurs, the goal is to minimize those loses by an effective response and to achieve a rapid recovery. With this goal in mind, the Oak Ridge National Laboratory (ORNL), which over the years has conducted applied research and assisted in the development of emergency planning capabilities for a variety of agencies including the U.S. Department of Energy, the Federal Emergency Management Agency, the Department of the Army, the U.S. Environmental Protection Agency, the Army Corps of Engineers, the U.S. Nuclear Regulatory Commission, and the National Weather Service, set out to develop an Intelligent Consequence Management (ICM) System. The main objective of this project was to develop a prototype system to demonstrate the feasibility of intelligent consequence management. Such a system would utilize state of the art sensor technology and wireless communications coupled to faster-than-real-time simulation and decision-support models that would greatly enhance management of crises in rapidly unfolding events. A critical component of any ICM system is the analysis of the feasibility of large-scale emergency evacuations. Phase I of the prototype development consisted in integrating several models developed at ORNL to make this feasibility assessment as fast as possible. In this paper, we describe the integration of these models, which include a traffic simulation model for emergency evacuations, a dynamic traffic assignment model, and a demographic model, combined with a nationwide GIS database. We then present a case study that demonstrates the integration of these models for a large scale emergency evacuation. Finally, the paper describes the next steps to make this subsystem operational, which include gathering of real-time traffic data through portable sensors and the dissemination of information to the public. Keywords: Consequence Management; Large-Scale Vehicular Evacuations; Traffic Simulation Models. Introduction The 1995 Presidential Decision Directive (PDD) 39 introduced the nation to the term Consequence Management which meant to establish how the effects of a terrorist attack employing weapons of mass destruction and/or other means would be managed. In contrast to Crisis Response, defined in the PDD-39 as actions to be taken when a potential attack has been discovered and before any damage could be inflicted to the infrastructure and/or the population, Consequence Management encompasses those measures aimed at alleviating the physical, socio-economic, and psychological effects of a biological, chemical or other type of attack. Those measures include any preliminary actions to be taken in preparation for a potential crisis, as well as any strategy to be deployed if the incident develops. For example, in the case of a sport event where large attendance is expected, the preliminary actions may include surveys of the venue and its surroundings, determination of the availability and ability of local and regional hospitals to treat and/or decontaminate victims, and the assessment of the location and condition of various antidotes. The post-incident actions, in the same example, may include plans for the treatment of the victims, their decontamination (if necessary), evacuation, and cleanup. The importance of Consequence Management became more apparent after 9/11 as we realized that is impossible to harden the infrastructure to avoid losses in a range of damage scenarios. If damage occurs, the goal is to minimize those loses by an effective response and to achieve a rapid recovery. The nation's new awareness of the need for enhanced security measures makes a compelling case for establishing a consequence management simulation capability on a scale that is commensurate with national needs. 1 Corresponding author. National Transportation Research Center, Oak Ridge National Laboratory, 2360 Cherahala Blvd, Knoxville, TN 37932. Ph. (865) 946-1304, FAX: (865) 946-1314, e-mail: [email protected]. 2 Oak Ridge National Laboratory, 1 Bethel Valley Road, Bldg. 4500N, H-24, Oak Ridge, TN 37831-6206. Ph. (865) 576-2716, FAX: (865) 574-5938, e-mail: [email protected].

Fast Deployable System for Consequence Management: The Emergency Evacuation Component 2
At the present time, Consequence Management Information Systems (CMIS) are being developed to integrate available technology in conjunction with a secure internet portal to allow multiple users with different protocols, different systems, and different means of network connectivity to access the latest information and communicate directly with each other in real time. While these systems offer real-time communications, they lack access to real-time analytical capabilities. That is, they are capable of generating large amounts of data and information, but having to sort through these huge databases to discover critical information may defeat the goal of rapid response to an emergency. Furthermore, these systems lack links to decision-support systems; they can predict consequences but are not intelligent. As a result they are little use to decision-makers to plan for and respond to events. These systems; however, could be made more robust by enhancing them with real-time consequence management and decision-making capabilities. With these objectives in mind, ORNL is currently developing a prototype of an intelligent consequence management (ICM) decision-support system. The proposed system takes advantage of the opportunities made possible through the information-technology revolution. Those include the ability to have access to real-time data, to develop large databases, to use networks to make information more widely available, to enhance modeling and simulation capabilities, and to use advanced technology for response, training, and educational purposes. The ORNL ICM system would utilize state of the art sensor technology and wireless communications coupled to real-time simulation and decision-support models that will greatly enhance management of crises in unpredicted and rapidly unfolding events. In this paper we present those components of this prototype system that are directly related to transportation issues, specifically emergency evacuations. The next section discusses the basic ICM system. Following that, we concentrate on describing the traffic simulation models that are being integrated into the ICM. The next section presents a discussion of a high resolution demographic model included in the system, and the one that follows describes a probabilistic model used to generate the attributes of the transportation network. A case study, showing the integration of all these models is presented next. Finally, we discuss the next steps which are aimed at adding real-time traffic information to the emergency evacuation component of the ICM system. The ORNL ICM System We established three basic criteria in developing the intelligent consequence management system. First, the system did not exist. Second, it posed interesting challenges to the science behind the system. Third, it had to be a proof-of-concept to linking sensors, simulation, and decision-support systems. We chose a specific infrastructure assurance problem: a terrorist attack against a train shipment of radioactive waste or toxic gases in an urban area anywhere in the U.S. as a proof of concept of the system. Such an event will not produce the potential fatalities as an attack against a nuclear reactor, but will require intelligent response to minimize the enormous economic and social disruption the event is likely to generate. People and property will need to be protected against contamination. Contaminated areas and property will need to be identified. Damage assessments will need to be conducted. Economic consequences should be estimated in order to mitigate their negative impacts. The information concerning such event decision makers and emergency managers would require in a rapid manner include the location of the release, the time/space distribution of released materials and nature of the contaminants, the time/space distribution of population and property at risk, the actions to protect people and property, the assessment of damages to people and property, and the short and long term economic, social, and environmental consequences. The overall architecture of the proposed system is shown in Figure 1. The ICM system would be activated when sensors tracking the train indicate a problem. Based on the characteristics of the shipment, a worst-case scenario would be chosen from the accident library. The plume-dispersion model would be run to select a case from the dispersion library. Simultaneously, an evacuation and sheltering model would be activated to determine the effectiveness of each protective action. As real-time traffic data is streamed

Fast Deployable System for Consequence Management: The Emergency Evacuation Component 3
from the field, the evacuation model would update the simulation results. The protective action expert system would be used to choose an optimum protective action plan. In addition, it should be noted that other parts of consequence management shown in Figure 1 are important, such as clean-up of contamination, but do not require real-time data and simulation.
Figure 1. The ICM System Architecture.
The Emergency Evacuation Component During an event such as the one described here, there are two possible protective actions alternatives: sheltering in place and evacuation. The former is defined as seeking an indoor location and taking steps to reduce the hazard once inside the shelter. This can be accomplished by reducing the infiltration rate to avoid exposure to vapors and aerosols, and by shielding against radioactive materials. The latter, when feasible, is the most preferred alternative and because of that the emergency evacuation model is a critical component of the ICM system. Emergency evacuation planning and operations is a very complex and multidimensional problem, with transportation being one of its most important facets. Successful implementation and operation of traffic management strategies during an emergency evacuation depend on many considerations including plan development and update, transportation and demographic data gathering, and traffic operations and management. Sponsored by the Federal Emergency Management Agency and the U.S. Army under the Chemical Stockpile Emergency Preparedness Program (CSEPP), ORNL developed the Oak Ridge Evacuation Modeling System (OREMS), a sophisticated regional emergency evacuation traffic simulation system. OREMS is a vehicular evacuation software system—based on the Federal Highway Administration's (FHWA) TRAF family of simulation models—that can be utilized to estimate evacuation time and to develop evacuation plans for different events (or scenarios) and user-defined spatial boundaries.

Fast Deployable System for Consequence Management: The Emergency Evacuation Component 4
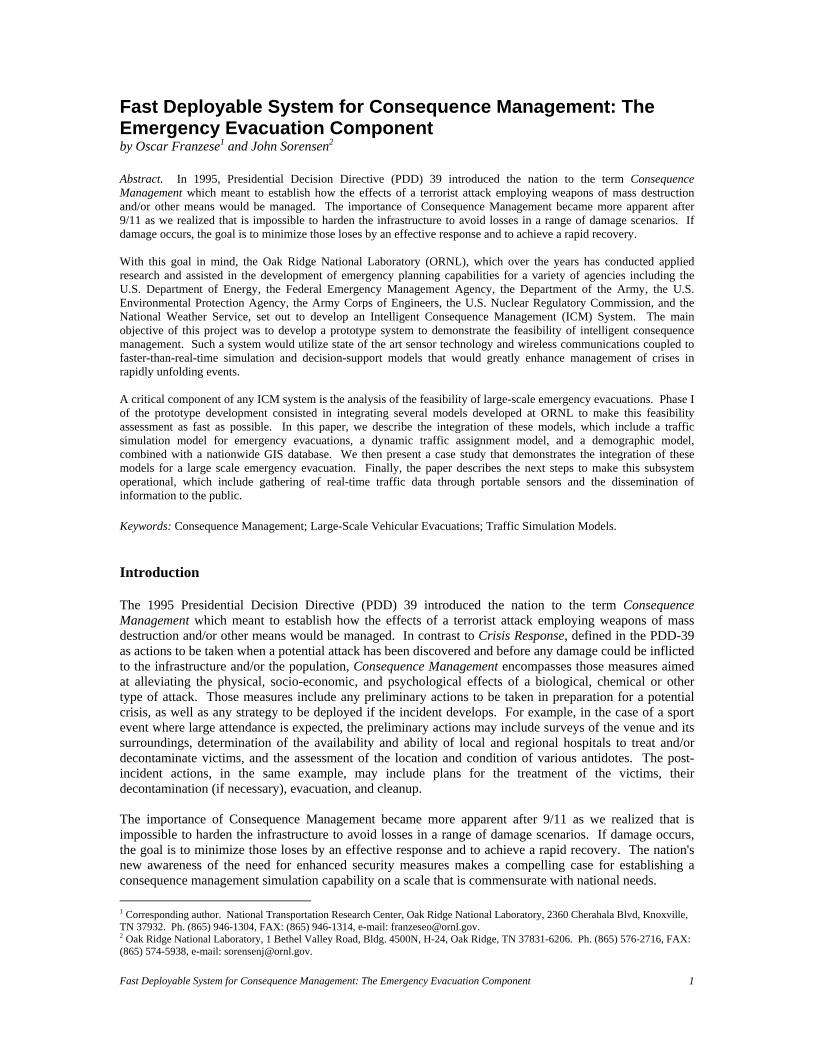
OREMS, which serves as the basis for the evacuation model of the ICM system, allows experimentation with alternate routes, destinations, traffic-control and traffic-management strategies, and evacuee response rates. As an example of the capabilities of OREMS, Figures 2 and 3 below show estimated evacuation times of an area affected by an event without any traffic management strategy (i.e., “do-nothing” alternative with an estimated evacuation time of 5 hrs 44 min) and with a reverse-lane strategy deployed (estimated evacuation time of 3 hrs 26 min, or a reduction of almost 40% in evacuation time), respectively. Figure 2 also shows traffic congestion (speed as function of time) on an arterial during the emergency evacuation.
Figure 2. Estimated Evacuation Time without any Traffic Management Strategy Deployed Lower Inset: Average Speed on a Segment of Arterial during the Evacuation.
The version of OREMS developed for the CSEPP program uses a static traffic assignment model and assumes that the conditions of the network at the beginning of the simulation prevail throughout the evacuation. A better representation of the problem of determining the optimal a priori evacuation paths is a dynamic network flow model, in which the state of the system changes over time. In particular, as vehicles move through the network over time, the traversal times determine how long each unit of flow spends traversing the link while the link’s capacity restrict the rate of flow on that segment of roadway. As the flow moves out of the link, capacities along it are recaptured. Dynamic traffic assignment also provides a better linkage between the traffic assignment and simulation models so the dynamics of traffic flow —namely the route selection process— is more accurately modeled than in the existing static model. Moreover, dynamic traffic assignment is a pre-requisite in the development of a real-time evacuation model since it will allow adding real-time traffic conditions information to the simulation model to better estimate evacuation times. For these reasons, we incorporated into OREMS a dynamic assignment model that was developed at ORNL, effectively merging emergency evacuation traffic simulation with dynamic traffic assignment.
Fast Deployable System for Consequence Management: The Emergency Evacuation Component 5
Figure 3. Estimated Evacuation Time with a Reverse-lane Strategy Deployed.
The Demographic Model A critical piece of information in assessing the feasibility of an emergency evacuation is the determination of traffic demand estimates; that is, the number of evacuees and evacuating vehicles by location. This information, necessary to determine evacuation times, is obtained from demographic data. During the nighttime (i.e., late evening to early morning hours), the vast majority of an area's population could be assumed to be at its place of residence. Therefore, the primary source of data on the study area's nighttime population is, in general, census information. The spatial location of the daytime population is a far more difficult problem to solve, with no standardized procedures for generating estimates of at-work daytime populations. The level of confidence in determining the location and number of the daytime population is, therefore, much lower than that of the nighttime population. These uncertainties could have a great impact in the evacuation evaluation and analysis tasks since evacuation time estimates, and the strategies to minimize those times, are very sensitive to the spatial distribution of the population at risk. In order to minimize these demographic uncertainties, ORNL is developing a very high resolution (90m) population distribution dataset for the entire United States, named LandScan USA, as part of the ORNL LandScan global population project sponsored by the Department of Defense. LandScan USA is more spatially refined than the census block-level resolution, and includes spatial distributions for “residential nighttime population” as well as for “daytime population”, for every hour of the day. In Figure 4, which shows the distribution of nighttime and daytime populations for Beaumont (TX), it is easy to appreciate how traffic demand (and in consequence network congestion and evacuation times) would change if the downtown area close to the river were to be evacuated during the night as opposed to a daytime evacuation. The LandScan USA model has been incorporated into the ICM system and serves as the basis for its demographic model for any area in the nation.

Fast Deployable System for Consequence Management: The Emergency Evacuation Component 6
(a)
(b)
Figure 4. High Resolution (90m) LandScan USA Nighttime (a) and Daytime (b) Population Distributions for Beaumont, TX. (TIGER Roads are Overlaid on the Population Distribution Data.)
The Network Attribute Model There are many instances in which it is possible to plan ahead for an emergency evacuation. Examples include a radiological accident at a nuclear plant or an explosion at a chemical processing facility. For those cases, which fall under the Crisis Response category, if an accident (or an attack) were to happen, then the best evacuation plan for the prevailing network and weather conditions would be deployed, and traffic conditions, collected in real-time, would give feed-back information to the control center to assess if operations are proceeding as planned or if changes are needed to assure the safety of the evacuating public. In other instances —for example, consequence management of the derailment of a train transporting hazardous materials—, there may not be any previously developed plan to be implemented and decisions must be made ad-hoc on if and how to proceed with an emergency evacuation. Those cases, which constitute the main tier of the ORNL ICM system, pose the challenge of generating impromptu all the inputs for the simulation model before the evacuation alternative can be assessed. While the system will be prepared to make use of any existing databases (e.g., the GIS database of the local jurisdiction on which the event happened), it has to be able to generate all the necessary inputs for those cases where no relevant information is readily available. Because of the nature of the events with which Consequence Management deals, we expect the latter to be the norm and not the exception. Gathering the necessary data to assess the feasibility of an emergency evacuation as a protective action alternative involves identifying the areas at risk, the distribution of the population in these areas, and the characteristics of the transportation network that would be used in case of an evacuation (i.e., topology and geometry of the evacuation routes and feeders to those routes from the population centers to be evacuated, traffic control settings, and other traffic parameters). Models included within the ICM system (e.g., plume dispersion models) provide information that allows the system to identify the areas at risk. Within those areas, the LandScan USA database supplies all the necessary information to create the demographic model and related traffic demand that the affected transportation network would sustain in the case of an evacuation. Two sources of information are used to determine the topology and geometric characteristics of the transportation network within the areas at risk. The first one is a national GIS database —the North American Inter-modal Freight Network Model— created at ORNL as part of the Bureau of Transportation Statistics (US DOT) Commodity Flow Survey. The second source, which complement this database, is a probabilistic model that assigns attributes to segments of roadways (such as for example, speed limit, number of lanes, and others) where this information is not available.

Fast Deployable System for Consequence Management: The Emergency Evacuation Component 7
The probabilistic model was developed using information contained in the FHWA Highway Performance Monitoring System (HPMS) database. This is a national level highway database that includes use, performance, and operating characteristics information on all public roads. For each state and each roadway class within that state it is possible to build a probability distribution of traffic parameters characteristics, which can then be used in conjunction with Monte Carlo simulation techniques to generate those network attributes that are not contained in other databases. Integrated System There are two possible approaches to integrate all these models. The first one is the "modeling-within approach" in which the evacuation and shelter models are built within a Geographic Information System (GIS) environment. The other one is the "linked-model approach" in which those models are linked to the GIS. We selected the latter because the independent operations of the evacuation and shelter models allow a more complex and efficient spatial and temporal simulation of the alternatives being evaluated. In addition, the linking approach enables the choice of a suitable evacuation and shelter models for a specific problem to be addressed, providing not only more flexibility but also minimizing model maintenance and upgrade problems. For the ICM system we use a GIS environment which was built at ORNL based on ESRI (Environmental Systems Research Institute, Inc.) MapObjects. The GIS environment is used primarily for input and display of large volumes of data and results, but also has components that help build the topology and attributes of the transportation network for those cases in which this information cannot be extracted from existing databases. These and other capabilities of the integrated system are demonstrated in the following case study.
Figure 5. Study Area.
Fast Deployable System for Consequence Management: The Emergency Evacuation Component 8
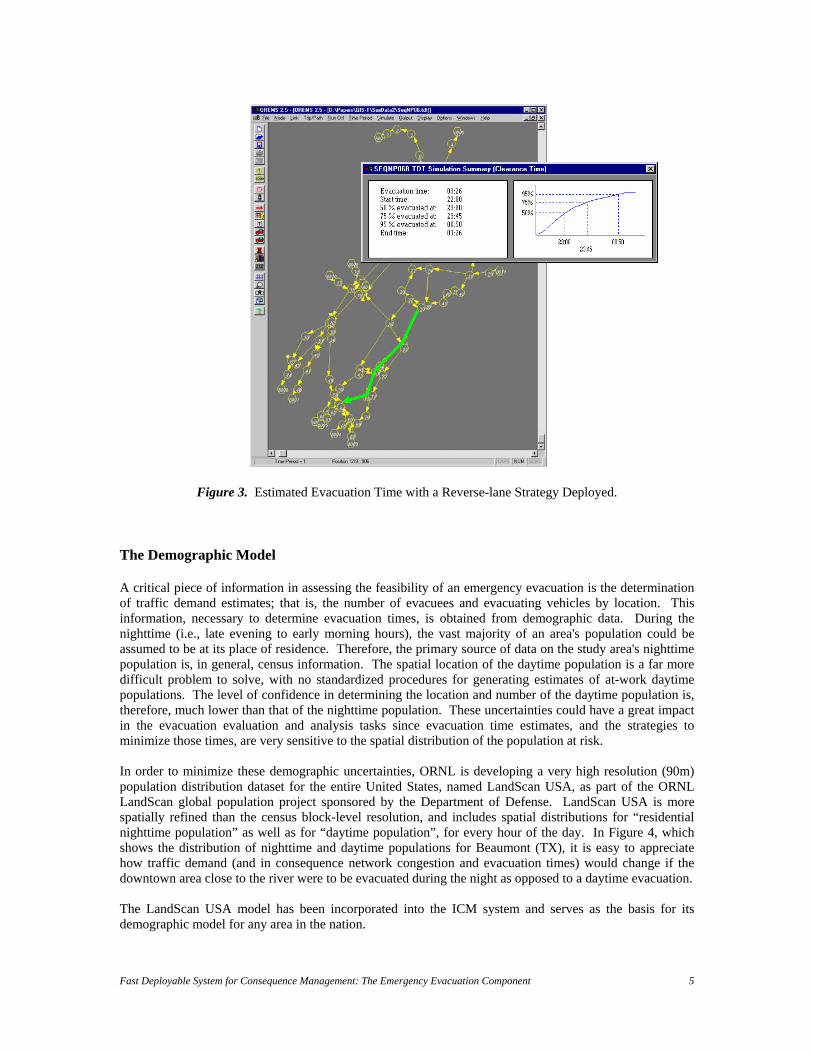
Figure 5 shows a map of an area covering approximately 1,600 sq miles in the vicinity of Richmond and Berea, KY, subject to a hypothetical toxic gas release scenario. The figure shows the boundaries of the Immediate Response Zone (IRZ, inner polygon showing the area that would need to be evacuated) and the Protective Action Zone (PAZ, outer polygon, showing the area that may or may not need to be evacuated, depending on the weather conditions). The boundaries of the IRZ and PAZ areas are delineated with models that predict how the toxic gases would mix and interact with air and the distance that they may travel until becoming innocuous. It is assumed that when reaching the boundary of the PAZ, the evacuating population is no longer at risk; therefore, the PAZ delimits the transportation network that needs to be considered when assessing evacuation as a protective action alternative. Once the IRZ and PAZ have been established, the GIS component of the ICM system extracts the topology, as well as geometric and traffic attributes of the transportation network (either from existing local GIS databases or from the models included in the system) that serve as input to OREMS. The topology of the network for the case study is shown in Figure 6. All the road classes in the area are shown in that figure. While the traffic simulation model uses as inputs only the higher classes (i.e., freeways, major and minor arterials), all the roads are used to determine the access points to the network of the traffic demand.
Figure 6. Transportation Network Topology.
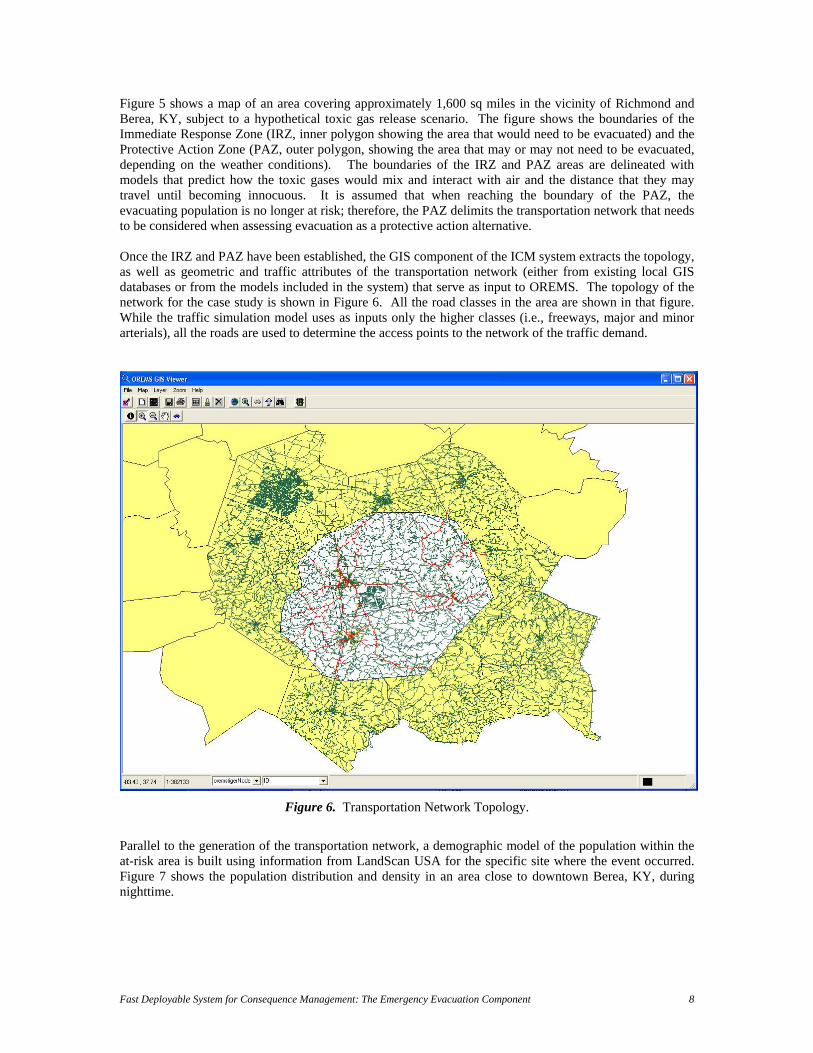
Parallel to the generation of the transportation network, a demographic model of the population within the at-risk area is built using information from LandScan USA for the specific site where the event occurred. Figure 7 shows the population distribution and density in an area close to downtown Berea, KY, during nighttime.
Fast Deployable System for Consequence Management: The Emergency Evacuation Component 9
Figure 7. Population Distribution and Density.
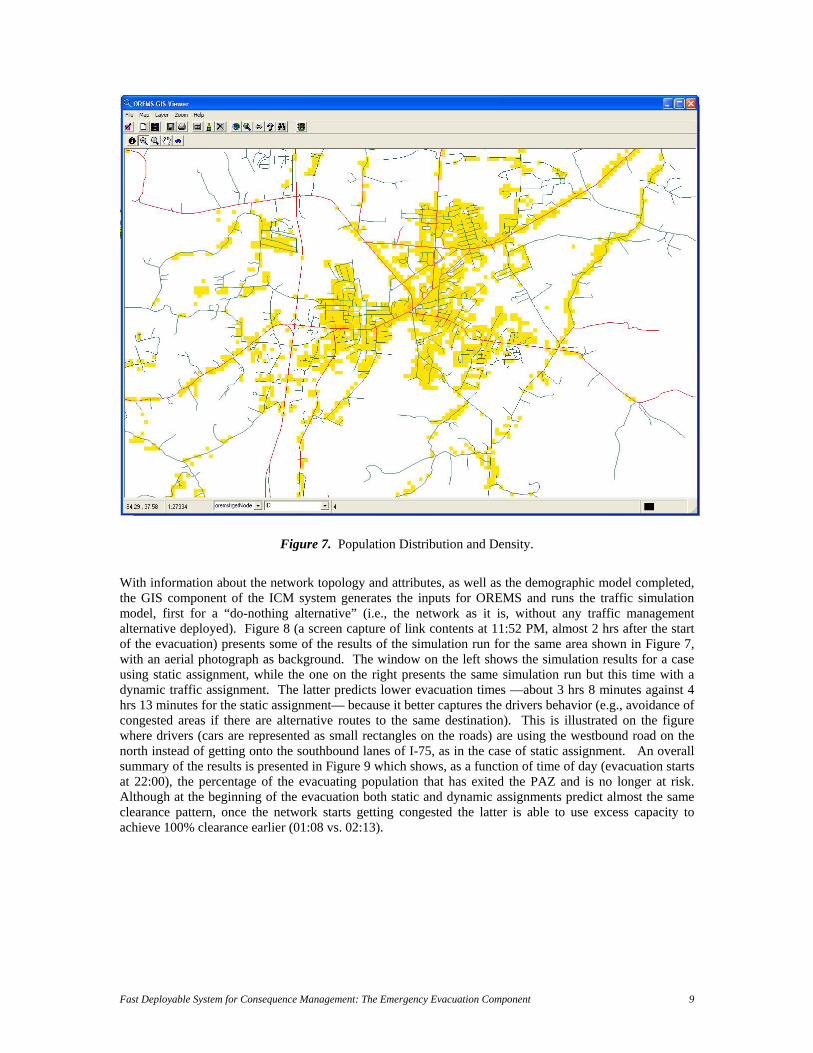
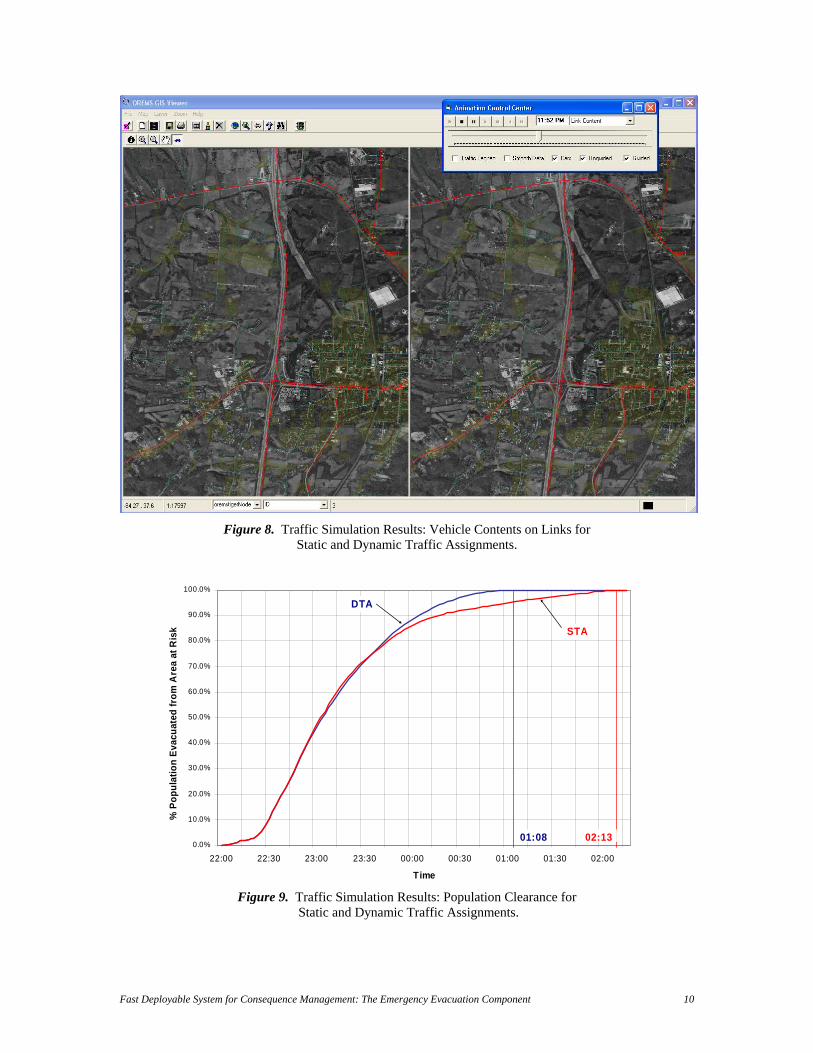
With information about the network topology and attributes, as well as the demographic model completed, the GIS component of the ICM system generates the inputs for OREMS and runs the traffic simulation model, first for a “do-nothing alternative” (i.e., the network as it is, without any traffic management alternative deployed). Figure 8 (a screen capture of link contents at 11:52 PM, almost 2 hrs after the start of the evacuation) presents some of the results of the simulation run for the same area shown in Figure 7, with an aerial photograph as background. The window on the left shows the simulation results for a case using static assignment, while the one on the right presents the same simulation run but this time with a dynamic traffic assignment. The latter predicts lower evacuation times —about 3 hrs 8 minutes against 4 hrs 13 minutes for the static assignment— because it better captures the drivers behavior (e.g., avoidance of congested areas if there are alternative routes to the same destination). This is illustrated on the figure where drivers (cars are represented as small rectangles on the roads) are using the westbound road on the north instead of getting onto the southbound lanes of I-75, as in the case of static assignment. An overall summary of the results is presented in Figure 9 which shows, as a function of time of day (evacuation starts at 22:00), the percentage of the evacuating population that has exited the PAZ and is no longer at risk. Although at the beginning of the evacuation both static and dynamic assignments predict almost the same clearance pattern, once the network starts getting congested the latter is able to use excess capacity to achieve 100% clearance earlier (01:08 vs. 02:13).
Fast Deployable System for Consequence Management: The Emergency Evacuation Component 10
Figure 8. Traffic Simulation Results: Vehicle Contents on Links for
Static and Dynamic Traffic Assignments.
Figure 9. Traffic Simulation Results: Population Clearance for Static and Dynamic Traffic Assignments.
0.0%
10.0%
20.0%
30.0%
40.0%
50.0%
60.0%
70.0%
80.0%
90.0%
100.0%
22:00 22:30 23:00 23:30 00:00 00:30 01:00 01:30 02:00
Time
% P
opul
atio
n Ev
acua
ted
from
Are
a at
Ris
k
DTA
STA
01:08 02:13

Fast Deployable System for Consequence Management: The Emergency Evacuation Component 11
Once the evacuation time for the “do-nothing” alternative has been determined, the next step in the evaluation is to determine its feasibility. The evacuation time thresholds that define whether it is feasible or not to evacuate depend mostly, but not completely, on the type of disaster that is being analyzed. When the predicted evacuation time is above the threshold, there is still a possibility of decreasing the expected evacuation time to values below that threshold by deploying some traffic management strategy (e.g., a reverse-lane strategy, a traffic control strategy). In this case, the proposed traffic management strategies are modeled and evaluated using OREMS, determining their expected evacuation times and assessing their feasibility. Some traffic management strategies, such as for example a reverse-lane strategy, can be identified and evaluated by the system automatically. Other strategies may require human intervention in defining and modeling them. If no strategy is found that can reduce the evacuation time below the pre-established threshold, then the evacuation alternative is deemed not feasible, and other type of protective action alternative must be deployed (e.g. sheltering in place). Real-Time Traffic Information When evaluating the feasibility of vehicular evacuation, if the “do-nothing” alternative or an option that calls for the deployment of a traffic management strategy is determined to be viable for the conditions analyzed, a plan that implements the selected alternative must be deployed. In that case, it is paramount to collect real-time traffic and road condition information to support the emergency evacuation operations decision-making process and to keep informed the evacuating population. This is necessary not only to determine if the evacuation is proceeding as planned, but also to detect losses of road capacity (due to incidents, for example) as early as possible. If these bottlenecks are identified, re-routing strategies must be determined in real-time and deployed in the field to help dissipate the congestion and increase the efficiency of the evacuation. Intelligent Transportation Systems (ITS) are capable of delivering such real-time traffic information, but up to now the deployment of these systems has been sparse, at best, and concentrated only on major urban areas. Emergency evacuation of areas outside these instrumented regions (i.e., most of the country) will have to proceed without real-time traffic information or using field staff reports produced by hand-held traffic counters, which, in general cannot provide complete and/or accurate coverage of the entire system. Where available, the ORNL ICM system will take advantage of the information provided by existing ITS sensors, but we are evaluating other technologies that can provide traffic conditions in places where no ITS is deployed. Specifically, we are studying the feasibility of rapidly deploying a real-time traffic data collection system to monitor traffic operations within the area to be evacuated. The National Transportation Research Center at ORNL is currently conducting a demonstration project in Knoxville, TN, that seeks to prove how new and emerging technologies, made available through public-private partnerships, can significantly reduce the cost of ITS deployments and expand the areas covered by those services. In this demonstration project, real-time traffic flow data collection and incident detection is provided by non-intrusive methodologies and algorithms that take advantage of location-based information extracted from operating cell phones aboard traveling vehicles. To confirm incidents the project uses fixed digital cameras (which can provide images covering 180 degrees) connected to the traffic management center through a wireless communication network. In a future project, that wireless network will also serve as the backbone to display real-time traffic information to the traveling public. The information will be posted on existing roadside advertising boards that will take advantage of new digital display technologies. All these technologies can be easily and efficiently deployed, on both urban and rural areas for highways and arterials. ORNL is also partnering with a Knoxville company that produces advanced vehicle detectors and sensors for both permanent and temporary installations. Those detectors are capable of identifying particular vehicles, which when traversing another detector on the network become de facto probe-vehicles. The proposed system will be composed of detectors developed by this company that can be rapidly deployed at

Fast Deployable System for Consequence Management: The Emergency Evacuation Component 12
key points in the field by taping them to the roadway (the temporary detectors are self-contained, wireless, and battery-powered). These detectors would transmit through satellite links, or other robust communication means, real-time traffic information to a command and control center, including travel time and traffic volumes on each instrumented segment of roadway, as well as origin-destination information within the cordoned area. Whether the real-time traffic information is obtained from existing ITS sensors within the area to be evacuated, or from sensors purposely deployed for the evacuation, the final step will be to link the real-time information with the dynamic evacuation model. The dynamic evacuation model will use the sensor data to periodically rectify traffic route assignments and to evaluate alternative routes around roadway segments affected by incidents or other capacity losses. This will allow improving public safety during a large-scale emergency evacuation by decreasing the evacuation time, and therefore the exposure of the traveling population to whatever hazard triggered the evacuation. Conclusions This paper discussed the current efforts at ORNL to develop a prototype to demonstrate the feasibility of a fast-deployable intelligent consequence management system. Many obstacles have to be overcome in the development of such a system, including integrating physical, economic and behavioral science models; integrating models that address different scales and different time frames; developing dynamic optimization routines to take advantage of real-time data; and making sense of the inter-applicability issues associated with developing a robust set of infrastructure simulation and analysis tools. The proposed ICM system is a very complex one composed of may subsystems that must work together to supply information to decision makers on what course of actions to take in case of an unforeseen event that may put many lives at risk. Once a decision has been made on how to proceed, the system also needs to provide real-time information during the implementation of the selected alternative. Here we presented one of these subsystems aimed at evaluating the feasibility of emergency evacuation, which is, perhaps, the most important protective action that can be taken in response to catastrophic events. We faced two main challenges in developing this component of the system. The first one was to fulfill its requirement of assessing the emergency evacuation alternative anywhere in the nation and for different sizes of the affected area. We have made progress in this regard, creating a traffic simulation tool that can be deployed anywhere. The different components of this tool, which have been discussed in this paper, are currently being tested. Once this phase is completed, it should be possible to analyze the feasibility of emergency evacuation for any selected area in the U.S. The second challenge is to provide information (i.e., real-time traffic conditions) during the evacuation to the simulation models and to the decision makers. This is a more difficult problem, especially when considering the first requirement of universal deployability. Even in areas where there is ITS infrastructure in place, this task is complex since many interoperability issues will need to be resolved before the system can make use the real-time traffic information. In areas with no ITS, the problem is amplified by the need to rapidly deploy some sort of infrastructure to assess traffic conditions in real time. ORNL is currently assessing the feasibility of using cell-phone information to assess traffic conditions and we are also proposing the evaluation of other technologies to determine how well they perform in providing the real-time traffic information needed during an emergency evacuation. Acknowledgements The authors gratefully acknowledge the support of the Laboratory Directed Research and Development program at Oak Ridge National Laboratory which funded this research activity. The views presented here are the authors', however, and should not be taken to represent those of Oak Ridge National Laboratory.

Fast Deployable System for Consequence Management: The Emergency Evacuation Component 13
References Adamus, C. L. and Bergman, M. J., 1995. “Estimating Non-Point Source Pollution Loads with a GIS Screening Model,” Water Resources Bulletin, Vol. 31, p. 647-655. Barrett, B., Ran B. and Pillai, R., 2000. “Developing a Dynamic Traffic Management Modeling Framework for Hurricane Evacuation,” Transportation Research Record, No. 1733, 2000, pp. 115-121. Franzese, O. et al., OREMS 2.6 User's Guide, Oak Ridge National Laboratory, 2003. Franzese, O. and S. Joshi, 2002. "Traffic Simulation Application to Plan Real-Time Distribution Routes," Proceedings of the 2002 Winter Simulation Conference, E. Yücesan, C.-H. Chen, J. L. Snowdon, and J. M. Charnes, Editors. San Diego, CA, December 8-11, 2002. Franzese, O. and L. Han, 2002. "Using Traffic Simulation for Emergency and Disaster Evacuation Planning," Presented at the 81st Annual Meeting of the Transportation Research Board, Washington, January 2002. Franzese, O. and L. Han, 2001, "A Methodology for the Assessment of Traffic Management Strategies for Large-Scale Emergency Evacuations", Proceedings of the 11th Annual Meeting of ITS America, Miami, Sp. 2001. Franzese, O. and L. Han, “Traffic Modeling Framework for Hurricane Evacuation,” Oak Ridge National Laboratory, 2000. Glickman. T., and A. Ujihara, 1990. “Deciding between In-Place-Protection and Evacuation in Toxic Vapor Cloud Emergencies,” Journal of Hazardous Materials 23, 57-72. Janson, B. and F. Southworth 1992. “Estimating Departure Times from Traffic Counts using Dynamic Assignment,” Transportation Research 26b, 3-16. National Research Council. 2002. Making the Nation Safer: The Role of Science and Technology in Countering Terrorism. Washington, DC: National Academy Press Southworth, F., B. Janson, and M. Venigalla. 1992. "DYMOD: Toward Real Time Dynamic Traffic Routing during Mass Evacuation," Managing Risk with Computer Simulation, San Diego, CA: Computer Simulation Society. List of Figures Figure 1. The ICM System Architecture. ...................................................................................................... 3 Figure 2. Estimated Evacuation Time without any Traffic Management Strategy Deployed Lower Inset:
Average Speed on a Segment of Arterial during the Evacuation. ................................................. 4 Figure 3. Estimated Evacuation Time with a Reverse-lane Strategy Deployed............................................ 5 Figure 4. High Resolution (90m) LandScan USA Nighttime (a) and Daytime (b) Population Distributions
for Beaumont, TX. (TIGER Roads are Overlaid on the Population Distribution Data.) .............. 6 Figure 5. Study Area. .................................................................................................................................... 7 Figure 6. Transportation Network Topology. ............................................................................................... 8 Figure 7. Population Distribution and Density.............................................................................................. 9 Figure 8. Traffic Simulation Results: Vehicle Contents on Links for Static and Dynamic Traffic
Assignments. ............................................................................................................................... 10 Figure 9. Traffic Simulation Results: Population Clearance for Static and Dynamic Traffic Assignments.
..................................................................................................................................................... 10