fasset sector skills plan - lmip.org.za sector... · fasset sector skills plan 2005 – 2010 update...
TRANSCRIPT


Fasset Sector Skills Plan 2005 to 2010
Update for the 2009/2010
Financial Year
Final 11 August 2008

Fasset Sector Skills Plan 2005 – 2010 Update for the 2009/2010 Financial Year
Final 11 August 2008 i
CONTENTS 1 SECTOR PROFILE ................................................................................................................. 1
1.1 INTRODUCTION ............................................................................................................. 1
1.2 INDUSTRIAL COVERAGE .............................................................................................. 1
1.3 ENTERPRISES ............................................................................................................... 2
1.3.1 Subsector .................................................................................................................... 2
1.3.2 Size ............................................................................................................................. 3
1.3.3 Geographical distribution ............................................................................................. 4
1.4 WORKER PROFILE ........................................................................................................ 4
1.4.1 Total employment ........................................................................................................ 4
1.4.2 Occupations................................................................................................................. 5
1.4.3 Gender ........................................................................................................................ 5
1.4.4 Population group ......................................................................................................... 6
1.4.5 Age .............................................................................................................................. 6
1.4.6 Disability ...................................................................................................................... 7
1.5 CONCLUSIONS .............................................................................................................. 8
1.6 BEE AND CO-OPERATIVES ........................................................................................... 8
1.7 PROFESSIONAL ASSOCIATIONS ................................................................................. 8
1.8 TRADE UNIONS ............................................................................................................. 9
1.9 CROSS-SECTORAL INVOLVEMENT IN SKILLS DEVELOPMENT ................................ 9
1.10 DRIVERS OF CHANGE ................................................................................................ 10
1.10.7 Policy and legislation ............................................................................................. 10
1.10.8 Economic factors ................................................................................................... 16
1.10.9 Social factors ......................................................................................................... 18
1.10.10 Technological factors ............................................................................................. 19
1.10.11 Environmental factors ............................................................................................ 20
1.11 Conclusions ................................................................................................................... 20
2 THE DEMAND FOR SKILLS ................................................................................................ 22
2.1 INTRODUCTION ........................................................................................................... 22
2.2 CURRENT EMPLOYMENT ........................................................................................... 22
2.2.1 Current employment composition .............................................................................. 22
2.2.2 Skills of the current workforce .................................................................................... 23
2.3 FUTURE GROWTH ....................................................................................................... 23
2.3.1 Employment trends .................................................................................................... 23
2.4 STAFF TURNOVER ...................................................................................................... 24
2.5 EMPLOYERS’ GROWTH EXPECTATIONS .................................................................. 25
2.6 FORECASTING OF FUTURE DEMAND ....................................................................... 25
2.6.2 Baseline employment ................................................................................................ 26

Fasset Sector Skills Plan 2005 – 2010 Update for the 2009/2010 Financial Year
Final 11 August 2008 ii
2.6.3 Assumptions used in the model ................................................................................. 26
2.6.4 Results of the demand projection model .................................................................... 27
2.7 CONCLUSION .............................................................................................................. 28
3 THE SUPPLY OF SKILLS ................................................................................................... 29
3.1 INTRODUCTION ........................................................................................................... 29
3.2 CURRENT EMPLOYMENT ........................................................................................... 29
3.3 AVAILABILITY OF FINANCIAL SKILLS IN THE ECONOMY ......................................... 30
3.4 THE FORMATION OF NEW SKILLS FOR THE SECTOR ............................................. 34
3.4.1 Entry routes into the sector ........................................................................................ 34
3.4.2 Providers of education and training ............................................................................ 35
3.5 DEVELOPMENT OF SKILLS OF THE EXISTING WORKFORCE ................................. 42
3.6 CONCLUSIONS ............................................................................................................ 42
4 SCARCE AND CRITICAL SKILLS IDENTIFICATION .......................................................... 44
4.1 INTRODUCTION ........................................................................................................... 44
4.2 GROWTH IN DEMAND ................................................................................................. 44
4.3 GROWTH IN SUPPLY................................................................................................... 45
4.4 SCARCE SKILLS .......................................................................................................... 46
4.5 CRITICAL SKILLS IN DEMAND .................................................................................... 48
4.6 CONCLUSIONS ............................................................................................................ 49
5 SMALL BUSINESS, ENTREPRENEURIAL OPPORTUNITIES AND OTHER NSDS
OBJECTIVES ............................................................................................................................ 51
5.1 INTRODUCTION ........................................................................................................... 51
5.2 SMALL BUSINESS OPPORTUNITIES .......................................................................... 51
5.3 SUPPORT TO SMALL ORGANISATIONS .................................................................... 51
5.4 ADULT BASIC EDUCATION AND TRAINING ............................................................... 52
5.5 NATIONAL STANDARD OF GOOD PRACTICE............................................................ 52
5.6 STAKEHOLDER CAPACITY BUILDING ....................................................................... 52
5.7 CONCLUSIONS ............................................................................................................ 52

Fasset Sector Skills Plan 2005 – 2010 Update for the 2009/2010 Financial Year
Final 11 August 2008 iii
LIST OF TABLES Table 1-1 Industrial coverage and subsectoral demarcation ........................................................... 1
Table 1-2 Distribution of organisations and employees according to sub-sector4 ........................... 2
Table 1-3 Organisation size per sub-sector .................................................................................... 3
Table 1-4 Geographical distribution of organisations and employees ............................................. 4
Table 1-5 Gender distribution by occupational category .................................................................. 5
Table 1-6 Population group distribution by occupation ................................................................... 6
Table 1-7 Average age by occupation group ................................................................................... 7
Table 1-8 Professional body membership ....................................................................................... 9
Table 1-9 Economic growth in South Africa and in the Financial Intermediation, Insurance, Real
Estate and Business Service Sector: 1994 to 2007 ................................................................ 17
Table 1-10 Immigration and emigration of accountants and related professionals: 1990 to 2003 .. 19
Table 2-1 Changes in employment 2005 to 2007 per sub-sector .................................................. 24
Table 2-2 Reasons for staff turnover in the sector for the period 1 April 2006 to 31 March 2007 ... 24
Table 2-3 Staff turnover by organisation size ................................................................................ 24
Table 2-4 Employment growth expectations (2007 – 2012) by subsector ...................................... 25
Table 2-5 Summary of assumptions used in labour-demand projection model ............................. 27
Table 2-6 Labour-demand projections: 2007 to 2012 ................................................................... 28
Table 3-1 The economically active workforce with post-Grade 12 qualifications in business,
commerce and management studies 2003 - 2007 .................................................................. 30
Table 3-2 Qualifications awarded by public HET sector in the study field Accounting according to
NQF level: 1995-2004 ............................................................................................................ 38
Table 3-3 Qualifications awarded by the public HET sector in the study field Commerce and
Business Management and Business Administration according to NQF level: 1995-2004 ...... 39
Table 3-4 Learnerships completed from 2000 to 2007 .................................................................. 41
Table 3-5 Beneficiaries of training: 2004/2005 according to occupational category ....................... 42
Table 4-1 Occupations in which skills shortages are experienced ................................................ 47
Table 4-2 Critical skills by occupational category and area of training ........................................... 48
LIST OF FIGURES Figure 1-1 Distribution of organisations and employees according to organisation size ................. 3
Figure 1-2 Employment distribution according to sub-sector .......................................................... 5
Figure 1-3 Age distribution of employees ....................................................................................... 7
Figure 2-1 Occupational distribution of workers in the sector ....................................................... 23
Figure 3-1 Educational qualifications of employees ...................................................................... 29
Figure 3-2 Number of public HET graduates who majored in accounting by highest level of
education ................................................................................................................................ 31
Figure 3-3 Number of public HET graduates in commerce, business management and business
administration by highest level of education............................................................................ 32

Fasset Sector Skills Plan 2005 – 2010 Update for the 2009/2010 Financial Year
Final 11 August 2008 iv
Figure 3-4 HET accounting graduates by population group: 1994 - 2004 ..................................... 32
Figure 3-5 HET graduates in commerce, business management and business administration by
population group (excluding accounting):1994 - 2004 ............................................................. 33
Figure 3-6 HET graduates in accounting by gender: 1994 - 2004 ................................................ 33
Figure 3-7 HET graduates in commerce, business management and business administration by
gender (excluding accounting): 1994 – 2004 .......................................................................... 34
Figure 3-8 Senior Certificate passes: 2006 .................................................................................. 36
Figure 3-9 Senior Certificate passes in mathematics: 1999 - 2006 ............................................... 36
Figure 3-10 Senior Certificate passes in accounting: 1999 - 2006 ................................................ 37
Figure 3-11 Qualifications awarded by the public HET sector in business, commerce and
management sciences according to NQF level: 1995-2004 .................................................... 38
Figure 3-12 Actual and projected entry-level qualifications in business, commerce and
management sciences from the public HET sector ................................................................. 40
Figure 4-1 New learnerships registered and learnerships completed 2002 to 2007 ...................... 46
ANNEXURES
ANNEXURE A FASSET SCARCE SKILLS LIST .......................................................................... 55
ANNEXURE B NQF LEVELS ....................................................................................................... 64

Fasset Sector Skills Plan 2005 – 2010 Update for the 2009/2010 Financial Year
Final 11 August 2008 v
ACRONYMS AND ABBREVIATIONS AAT Associate Accounting Technician
ABASA Association for the Advancement of Black Accountants
ABET Adult Basic Education and Training
ACCA Association of Chartered Certified Accountants
ADRA Association of Debt Recovery Agents
AETA Association for the Education and Training of Accountants
AFP Associate Financial Planner
AGA(SA) Associate General Accountant
AIMR Association for Investment Management and Research
AsgiSA Accelerated and Shared Growth Initiative for South Africa
ATO Approved Training Office
ATR Annual Training Report
BBBEE Broad-Based Black Economic Empowerment
BEE Black Economic Empowerment
BER Bureau for Economic Research
CA Chartered Accountant
CAT Certified Accounting Technician
CBET Competency Based Education and Training
CFA Certified Financial Accountant
CFA Chartered Financial Analyst
CFA(SA) Institute of Commercial and Financial Accountants of Southern Africa
CFP Certified Financial Planner
CIA Certified Internal Auditor
CIBM Chartered Institute of Business Management
CICB Certificate of Membership of the Institute of Certified Bookkeepers
CIMA Chartered Institute of Management Accountants
CTA Certificate in the Theory of Accounting
DoL Department of Labour
DTI Department of Trade and Industry
EEA Employment Equity Act
ETQA Education and Training Quality Authority
FAIS The Financial Advisory and Intermediary Services Act, No. 37 of 2002
Fasset Sector Education and Training Authority for Finance, Accounting, Management Consulting and other Financial Services
FCCA Fellow of the Chartered Certified Accountants
FET Further Education and Training
FPI Financial Planning Institute
FSB Financial Services Board
GAAP Generally Accepted Accounting Practice
GAP Global Accounting Proficiency
GDS Growth and Development Summit
GIA General Internal Auditor
GRAP Generally Recognised Accounting Practice
HEMIS Higher Education and Management Information System
HET Higher Education and Training
HSRC Human Sciences Research Council
IAC Institute of Administration and Commerce
IAB International Association of Bookkeepers

Fasset Sector Skills Plan 2005 – 2010 Update for the 2009/2010 Financial Year
Final 11 August 2008 vi
IBS Institute of Business Studies
ICB Institute of Certified Bookkeepers
ICMCI International Council of Management Consulting Institutes
ICSA Institute of Chartered Secretaries and Administrators
IDC Industrial Development Corporation
IFA Institute of Financial Accountants
IFAC International Federation of Accountants
IFRS International Financial Reporting Standards
IIA-SA Institute of Internal Auditors South Africa
IIP Investors in People
IMCSA Institute of Management Consultants of South Africa
IPFA Institute of Public Finance Accountants
IRBA Independent Regulatory Board for Auditors
JIPSA Joint Initiative for Priority Skills Acquisition
LFS Labour Force Survey
LL Lifelong Learning
MBA Master in Business Administration
MIAC Member of the Institute of Administration and Commerce
NLRD National Learners’ Records Database
NQF National Qualifications Framework
NSA National Skills Authority
NSDS National Skills Development Strategy
NSF National Skills Fund
PDI Previously Disadvantaged Individuals
PE Professional Evaluation
PFMA Public Finance Management Act
RAU Rand Afrikaans University
RBA Regulatory Board for Auditors
RCA Representative Council for Accountants
RFP Registered Financial Planner
RGA Registered Government Auditor
RTO Registered Training Office
SAICA South African Institute of Chartered Accountants
SAIFM South African Institute for Financial Markets
SAIGA Southern African Institute of Government Auditors
SAIPA South African Institute for Professional Accountants
SAQA South African Qualifications Authority
SARB South African Reserve Bank
SARS South African Revenue Service
SCG Strategic Cash Grant
SDA Skills Development Act
SDF Skills Development Facilitator
SDL Skills Development Levy
Seta Sector Education and Training Authority
SIC Standard Industrial Classification
SMME Small, Medium, Micro Enterprise
SSP Sector Skills Plan
StatsSA Statistics South Africa
TIPP Training Inside Public Practice
TOPP Training Outside Public Practice

Fasset Sector Skills Plan 2005 – 2010 Update for the 2009/2010 Financial Year
Final 11 August 2008 vii
UCT University of Cape Town
UNISA University of South Africa
WSP Workplace Skills Plan

Fasset Sector Skills Plan 2005 – 2010 Update for the 2009/2010 Financial Year
Final 11 August 2008 viii
EXECUTIVE SUMMARY
SECTOR PROFILE Overview of the sector In 2007 the Financial and Accounting Services Sector consisted of 6 212 levy-paying organisations that employed approximately 117 356 people. Most of the organisations (63.0%) were accounting, bookkeeping, auditing and tax firms. Ten per cent of organisations in the sector were involved in stockbroking and financial markets and another 10% were in the sub-sector of investment entities, trusts and company secretary services. The accounting, bookkeeping, auditing and tax sub-sector was the largest employer in the sector and accounted for 49.7% of all employees.
The sector mainly comprised a large number of very small organisations and a small number of very large ones. The majority (96.0%) of the organisations had fewer than 50 employees. In fact, 62.2% of these were micro organisations that employed five or fewer employees while 18.1% employed between six and ten employees. The large organisations varied between 150 and 15 000 employees and employed 52.9% of the workforce. The small organisations (fewer than 50 employees) employed 35.1% of the people in the sector.
Half (50.2%) of the employees were based in Gauteng, 21.0% in the Western Cape, and 13.4% in KwaZulu-Natal. The remaining 15.4% were thinly spread across the other six provinces.
In 2007 more than half (53.6%) of the employees in the sector were women. A third (34.0%) of the managers and 48.0% of the professionals were women. The largest occupational group, clerical and administrative workers, consisted of 77.0% women.
The majority of workers in the sector were white (53.2%), followed by African workers (31.4%), Indians (7.8%), and Coloureds (7.6%). If the population-group composition of the respective occupational groups is considered, it is clear that transformation is lagging behind in the managerial and professional categories – 72.3% of all managers and 62.1% of professionals were white.
More than half (57.2%) of the employees were 35 or younger and the average age of all employees was 36. Black employees were on average five years younger than their white counterparts. Black managers were on average four years younger than whites and black professionals were five years younger.
Factors that influence change in the sector Change in the sector is driven by a myriad of factors. Changes in policies and legislation include black economic empowerment (BEE) legislation and sector charters, legislation that governs financial practices and reporting, and legislation that governs the professions in the sector. The sector is also influenced by international legislation and accounting and governance practices. Economic factors that influence the sector include globalisation, which increases market opportunities and market competition, changes in the exchange rate, which impact on the competitiveness of South African companies, and the high unemployment rate and its associated social problems, which affect business confidence. As a service industry, the sector is also directly influenced by the growth of the rest of the economy, especially growth in the number of small and medium-size enterprises.
A social factor that affects the sector is the erosion of trust between the public and financial service professionals, which in turn has increased the demand for professional accountability and the risk associated with public practice. The loss of skilled professionals to the international market is another factor. The HIV/AIDS pandemic will affect all sectors of society, but the impact on the Financial and Accounting Services Sector’s workforce is not expected to be dramatic because of the relatively high skills levels in the sector. However, the decrease in productivity of companies, the decrease in disposable income and the resultant decrease in spending may negatively influence economic activity and will erode the client base of financial services organisations.

Fasset Sector Skills Plan 2005 – 2010 Update for the 2009/2010 Financial Year
Final 11 August 2008 ix
Most of the factors that influence change in the sector tend to increase the demand for financial services and thus the growth of the sector. One exception is technological changes. Many functions that were previously performed by people are now carried out by computer software. In some respects, technology is replacing labour and slowing down the rate at which labour is absorbed into the economy. At the same time, technological changes necessitate the constant upgrading of the skills of the workforce in the sector. Because of the competitive nature of the sector and increased globalisation, the sector has to continuously adapt to new technology. Another exception is the proposed changes to the Companies’ Act (No. 61 of 1973) – specifically the proposal that small companies should be exempted from auditing requirements. This may impact on the demand for labour in the sector and it may influence the supply of professionals, as auditing firms may reduce the number of learnership positions in their organisations.
A particular challenge facing the sector is increasing the participation of black people1 in the sector, especially at managerial level and in terms of equity ownership of firms. These changes are prompted by legislation and policy as well as by economic realities such as the need to extend the capacity of the sector beyond the current limited pool of professionals. Another challenge facing the sector is retaining financial skills that are being lost to the international market.
THE DEMAND FOR SKILLS More than half (55%) of the employees in the sector are employed in managerial, professional and semi-professional positions. The professional people in the sector are mainly accountants and auditors, financial and management consultants, and investment professionals. The semi-professional and associated professional category consists largely of trainee accountants and auditors. The clerical and administrative staff consists of general administrators and clerks, secretaries and personal assistants, bookkeepers, and accounting clerks and receptionists.
The occupational profile of the sector reveals that the sector needs highly skilled workers with post-school qualifications. The current educational profile shows that 94% of the workforce hold qualifications at NQF Level 4 and above.
Woman and African workers are underrepresented in the managerial and professional categories, and the future demand for skills will be met only if these imbalances are corrected.
Three skills priorities for employers in the sector are specialised financial skills, basic computer skills and marketing skills. The continuous upgrading of specialised financial skills is driven by the numerous legislative and regulatory changes that impact on the work of organisations in the sector. The need for computer skills flows from the continuous technological advancements in accounting and other software, while marketing skills are crucial for general business development and expansion.
Employment trends
Information on employment trends was obtained from a survey of employers conducted by Fasset in 2007. Results from the survey showed that a relatively large percentage (14.8%) of people was classified as managers. Professionals constituted 37.8% of the employees and clerical and administrative workers 34.3%. The other occupational groups were very small.
The survey revealed that growth in employment had occurred since 2005. Eighteen per cent of the organisations in the sector indicated that their employment had increased since 2005, 73% had stayed the same, and 6% had decreased in employment numbers.
The percentage changes indicated by the individual organisations were used in combination with their current employment figures to determine employment growth in the sector between 2005 and 2007. The results indicate that the total number of people employed in the sector increased by approximately 6.4% per year from 103 654 employees in 2005 to 117 356 employees in 2007. Growth in business was the main contributor to growth in employment.
In the period 1 April 2006 to 31 March 2007, 14 285 employees left the service of their employers. This constitutes a staff turnover rate of 12.4%.
Nearly a quarter of organisations (23.5%) expected increases in professionals, 5.3% in administrative staff, 4.2% in technical/associated professionals, and 3.6% in senior managers.
1 “black” is used throughout this document to refer to African, coloured and Indian people.
Fasset Sector Skills Plan 2005 – 2010 Update for the 2009/2010 Financial Year
Final 11 August 2008 x
Expected increases in employment of specific occupational groups such as accountants, bookkeepers and trainee accountants were mainly attributed to growth in business. Forecasted demand
The growth of the sector is, in part, a result of the growth of the South African economy. As the number of enterprises increases and existing businesses expand, the need for financial services also increases. However, there are also other factors that drive the growth of the sector; for example, the increasing complexity of the business world and the current emphasis on good corporate governance and risk management result in an increased reliance on the specialised financial expertise offered by organisations in this sector.
On the basis of the demand-forecasting model developed for the Financial and Accounting Services Sector, it is estimated that the number of positions available in the sector will increase by 3.2% each year from 121 841 in 2007 to 142 320 in 2012. A total of 3 844 new positions would be created in the sector in 2008. This would increase to 4 355 positions by 2012. The replacement demand in the sector in 2008 would be 10 184, which would increase to 11 551 by 2012. This growth depends on the economic growth of the country and of this particular sector. It also depends on the availability of skills. The very nature of the work of this sector determines that its growth is closely related to the availability of skilled staff – especially professionals.
Replacement demand is estimated at approximately 8% of total employment. The replacement demand in the occupational category accountants, auditors and company secretaries is higher than in other categories because of the high emigration estimates for professionals and because of the large number of learners who leave the sector after completion of their learnerships.
THE SUPPLY OF SKILLS The availability of financial skills in the economy Information on the availability of people with financial skills was obtained from two national sources. The first was the Labour Force Surveys (LFSs) conducted by Statistics South Africa (StatsSA). The March 2007 survey indicated 517 129 potential workers2 with post-school qualifications in the field of business, commerce and management studies existed, 56 849 (11%) of whom were unemployed at the time of the survey. The unemployment rate differs for people at different qualification levels. The unemployment rate for those with highest qualification on NQF Level 4 and 5 was 14%, 10% for those with qualifications on NQF Level 6 and only 5% for those on NQF Level 7 and above. The circumstances of African graduates differ from those of members of the other three population groups and at all levels their unemployment rate was higher compared to the overall unemployment rate.
A more detailed analysis of the availability of public Higher Education and Training (HET) graduates with qualifications in the financial field, and more specifically in accounting, was made possible by the National Learner Records Database (NLRD), which is maintained by the South African Qualifications Authority (SAQA). The analysis shows that in 2004, the total number of graduates with qualifications in accounting and in commerce, business management and business administration was 297 000. However, of these, only 23% (67 000) had majored in accounting. In the accounting field, the number of graduates increased annually by 8.5% from 29 590 graduates in 1994 to 67 052 graduates in 2004. The annual average growth in graduates in commerce, business management and business administration was 9.1% from 96 521 graduates in 1994 to 229 975 graduates in 2004.
Formation of new skills for the sector The sector is served by a well-established and diversified education and training system that spans all the components of the public and private education sectors, professional bodies and employers.
2 According to the official definition of unemployment a person must satisfy the following three conditions: The person 1) did not work
during the seven days prior to the survey interview and does not have any job attachment; 2) wants to work and is available to start to work within 2 weeks; and 3) has taken active steps to look for work or to start own business in the 4 weeks prior to the interview.

Fasset Sector Skills Plan 2005 – 2010 Update for the 2009/2010 Financial Year
Final 11 August 2008 xi
The qualifications available to the sector range from National Qualifications Framework (NQF) Level 3 to Level 8 – with learnerships registered at each level.
Despite the relatively low percentage of matric exemptions and the limited numbers of learners who pass matric with mathematics as a subject, the output of public HET institutions in the fields of accounting, and commerce, business management and business administration has grown consistently over the 10-year period from 1995 to 2004. A steady increase has occurred in qualifications awarded in business, commerce and management sciences – the total number of qualifications awarded by public HET institutions from 1995 to 2004 rose on average by 8.4% a year. NLRD data showed that people tend to stay longer in the HET system while the number of people with postgraduate qualifications is increasing. NQF level 7 qualifications, which included four- year first degrees i.e. BTech degrees and honours degrees, showed the highest average growth over the review period. The average growth rate of NQF level 8 and above (post graduate) qualifications was higher than NQF level 6 (three year first degree, national diploma) qualifications.
Professional bodies play a key role in the preparation of new entrants to the sector. The main functions performed by these institutions are the setting of educational standards, the development of curricula for the qualifications they award, the provision of training, the accreditation of training institutions that wish to offer their courses and qualifications, the setting of examinations, the administration of examinations and the awarding of qualifications.
The provision of education and training to the sector is comprehensive and of a high standard. In fact, the education and training offered in South Africa is of world-class standard – hence the fact that South African professionals are sought after in the international market.
Despite the generally positive picture of education and training, the sector is faced with the reality of too few learners from the previously disadvantaged groups moving up to the higher professional qualification levels. The challenge is accordingly to remove all unnecessary obstacles and to maximise support for these individuals in order to address the problem in the short to medium term.
Development of the skills of the existing workforce The development of the skills of the workforce beyond entry-level skills is a prerequisite for the successful functioning of organisations and individuals in the sector. The main providers of this training are employers themselves, private training institutions and training consultants, professional bodies, and universities and universities of technology. The extent to which employers engage in the training and development of their workers (either directly through their own training divisions and programmes or indirectly through outsourced training opportunities) is reflected in the annual training reports submitted to Fasset. In the 2006/2007 ATRs employers reported that almost 40 000 of their employees had received training in that year. The people who were trained constituted 70% of all employees.
The technicians and associated professionals occupational category benefited most from the training. This was to be expected as most of the trainees in the sector fall in this occupational group, for example trainee accountants and auditors.
SCARCE SKILLS AND CRITICAL SKILLS IDENTIFICATION Scarce skills in the sector are mainly in the professionals, and technicians and associated professionals occupations. Although these occupational categories are experiencing above average growth, the shortages are often related to very special skills sought by employers.
The lack of qualified black people, especially in the higher level occupations and professional designations, is considered a serious problem. Many (especially large) employers find it difficult to meet their employment equity targets because of the unavailability of suitably qualified black staff.
The scarce skills in the sector are mainly in the following occupational categories:
Accountants, Auditors and Company Secretaries
Information and Communication Technology (ICT) Managers
Human Resource and Training Professionals
Information and Organisation Professionals
Business and Systems Analysts and Programmers

Fasset Sector Skills Plan 2005 – 2010 Update for the 2009/2010 Financial Year
Final 11 August 2008 xii
Accounting Clerks and Bookkeepers. Critical skills or skills gaps are generally the result of insufficient training prior to entry into
the labour market, technological changes, and legislative and policy changes to which the sector is exposed on an ongoing basis. Critical skills listed by employers are specialist financial skills, basic computer skills, administrative and support skills, and management and leadership skills. Specialist financial skills are the most important critical skills in the sector as these skills are required across all occupational groups.
SMALL BUSINESS, ENTREPRENEURIAL OPPORTUNITIES AND OTHER NATIONAL SKILLS DEVELOPMENT STRATEGY (NSDS) PRIORITIES
Fasset supports initiatives that lead to the development of new employment opportunities in the labour market and that provide new entrants with the skills needed for self-employment. These initiatives include learnerships, social development projects funded by Fasset and Fasset’s own strategy for supporting new BEE firms.
Various support structures for small businesses in the sector are already in place. Small levy payers and non levy payers benefit from free training offered nationally throughout the year (such as lifelong learning and skills development facilitator (SDF) training).
Small and medium businesses can also claim grants if they employ learners who are black and/or with a disability. Fasset views Adult Basic Education and Training (ABET) as a strategic priority and currently funds a complete ABET programme for eligible employees in the sector.

Fasset Sector Skills Plan 2005 – 2010 Update for the 2009/2010 Financial Year
Final 11 August 2008 xiii
INTRODUCTION According to the Skills Development Act (SDA) section 10(1)(a), each Sector Education and Training Authority (Seta) must develop a Sector Skills Plan (SSP) within the framework of the National Skills Development Strategy (NSDS). Each Seta must also submit annual strategic plans and reports on the implementation of the Seta SSP to the Director-General of the Department of Labour (DoL).
On 3 March 2005, the Minister of Labour announced the new NSDS 2005-2010 targets. This national strategy sets priorities for skills development that address the scarcity of skills and lack of capacity in the current labour force – skills needed to meet the challenges posed by economic growth and to alleviate poverty. In accordance with the DoL requirements and in service of the NSDS, the Fasset five-year SSP was submitted to the DoL in August 2004. This SSP identified the skills needs (skills shortages and gaps) in the sector and set out the Seta implementation plan in relation to NSDS objectives.
In early 2006 the Government announced its Accelerated and Shared Growth Initiative for South Africa (AsgiSA) and the formation of a new institution to look at skills development - the Joint Initiative for Priority Skills Acquisition (JIPSA). The SSP and annual updates prepared by Fasset are aimed at identifying the sector’s skills needs and describing the constraints on the effective development of skills. The SSP therefore supports the work undertaken by JIPSA and incorporate the economic growth targets set by AsgiSA.
The SSP and the updates indicate to education and training providers and communities the skills that are currently needed or will be needed in the future. The annual updates also afford Fasset the opportunity to update information in respect of changes that may have occurred in the sector since the first submission of the SSP. These changes are considered by the Fasset Management Board in its annual strategic planning processes.
This SSP annual update draws extensively on information collected through various research projects commissioned by Fasset. These projects include a comprehensive sector study on the views of stakeholder groups such as employers, professional institutes, learners and educational institutions which was conducted in 2007; a study on the need for learnerships in the sector based on employer and stakeholder views; and analyses of the grant applications submitted to Fasset in the first seven years of the implementation of the skills development legislation (these applications reflect the information collected from the employers who participated in the Fasset grant system, i.e. claimed grants back from Fasset on the basis of grant application forms.)
In addition to these surveys, data from other sources were also analysed in order to identify skills trends influencing the sector. These sources include the National Learners Records Database (NLRD) operated by the South African Qualifications Authority (SAQA), economic data published by Statistics South Africa, various surveys conducted by Statistics South Africa (StatsSA), and the sector brief for the Financial and Accounting Services Sector commissioned by the DoL.
The SSP was prepared according to guidelines provided by the DoL. Chapter 1 of the document describes the sector in terms of its industrial coverage, the enterprises in the sector and the sector’s occupational composition. The chapter also analyses the main factors driving change in the sector. The second chapter analyses the demand for skills in the sector, and the third chapter the supply of skills to the sector. Chapter 4 deals with scarce and critical skills. The final chapter highlights issues related to the NSDS indicators not directly covered in the chapter on scarce and critical skills.
Fasset Sector Skills Plan 2005 – 2010 Update for the 2009/2010 Financial Year
Final 11 August 2008 1
1 SECTOR PROFILE 1.1 INTRODUCTION
The nature and composition of any sector are critical factors in the assessment of skills needs and in the development of skills strategies. This chapter gives a brief profile of the Financial and Accounting Services Sector.3 The profile includes the industrial coverage of the sector, an overview of the organisations and employment in the sector, the occupational profile of employees and the professional bodies associated with the sector.
The chapter also describes the factors that influence change in employment and in skills needs. These factors include policy and legislation, economic factors, and social, technological and environmental issues.
1.2 INDUSTRIAL COVERAGE
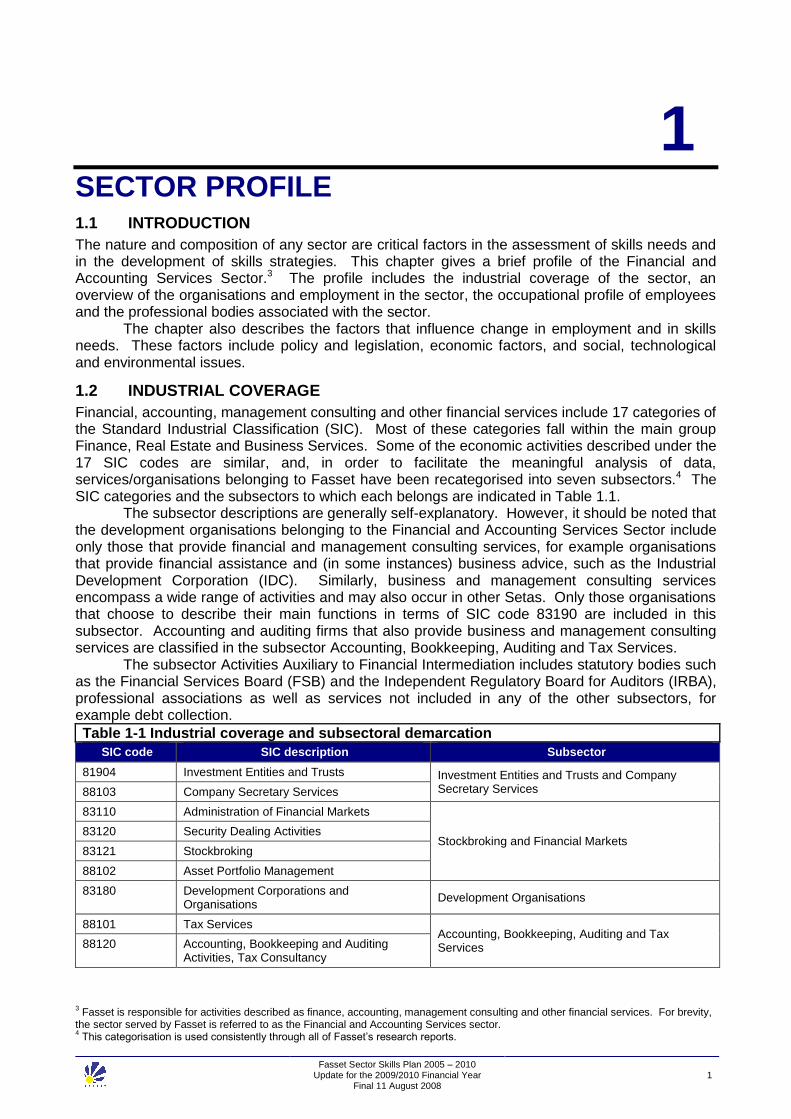
Financial, accounting, management consulting and other financial services include 17 categories of the Standard Industrial Classification (SIC). Most of these categories fall within the main group Finance, Real Estate and Business Services. Some of the economic activities described under the 17 SIC codes are similar, and, in order to facilitate the meaningful analysis of data, services/organisations belonging to Fasset have been recategorised into seven subsectors.4 The SIC categories and the subsectors to which each belongs are indicated in Table 1.1.
The subsector descriptions are generally self-explanatory. However, it should be noted that the development organisations belonging to the Financial and Accounting Services Sector include only those that provide financial and management consulting services, for example organisations that provide financial assistance and (in some instances) business advice, such as the Industrial Development Corporation (IDC). Similarly, business and management consulting services encompass a wide range of activities and may also occur in other Setas. Only those organisations that choose to describe their main functions in terms of SIC code 83190 are included in this subsector. Accounting and auditing firms that also provide business and management consulting services are classified in the subsector Accounting, Bookkeeping, Auditing and Tax Services.
The subsector Activities Auxiliary to Financial Intermediation includes statutory bodies such as the Financial Services Board (FSB) and the Independent Regulatory Board for Auditors (IRBA), professional associations as well as services not included in any of the other subsectors, for example debt collection.
Table 1-1 Industrial coverage and subsectoral demarcation
SIC code SIC description Subsector
81904 Investment Entities and Trusts Investment Entities and Trusts and Company Secretary Services 88103 Company Secretary Services
83110 Administration of Financial Markets
Stockbroking and Financial Markets 83120 Security Dealing Activities
83121 Stockbroking
88102 Asset Portfolio Management
83180 Development Corporations and Organisations
Development Organisations
88101 Tax Services Accounting, Bookkeeping, Auditing and Tax Services 88120 Accounting, Bookkeeping and Auditing
Activities, Tax Consultancy
3 Fasset is responsible for activities described as finance, accounting, management consulting and other financial services. For brevity,
the sector served by Fasset is referred to as the Financial and Accounting Services sector. 4 This categorisation is used consistently through all of Fasset’s research reports.

Fasset Sector Skills Plan 2005 – 2010 Update for the 2009/2010 Financial Year
Final 11 August 2008 2
Table 1-1 Industrial coverage and subsectoral demarcation
SIC code SIC description Subsector
88121 Activities of Accountants and Auditors Registered in Terms of the Public Accountants and Auditors Act
88122 Activities of Cost and Management Accountants
88123 Bookkeeping Activities, including Relevant Data Processing and Tabulating Activities
83190 Activities Auxiliary to Financial Intermediation Activities Auxiliary to Financial Intermediation
88140 Business and Management Consulting Services Business and Management Consulting Services
88112 Project Financial Management
91108 South African Revenue Service (SARS)
SARS and Government Departments 9110E National Treasury Provincial Treasuries
1.3 ENTERPRISES
The SETA for Finance, Accounting, Management Consulting and other Financial Services (Fasset) has developed a labour market analysis and monitoring system that consists of comprehensive sector surveys every five years, the annual analyses of grant applications submitted to the SETA, and various ad hoc research projects. The first comprehensive sector study was conducted in 2002 and included surveys of employers, professional bodies, education and training providers, and learners in the sector. This study was repeated in 2007 and the findings of the 2007 study are presented in this SSP.
1.3.1 Subsector
Based on the survey information it is estimated that 6 212 organisations were active in the Financial and Accounting Services Sector in 2007. This estimate of the number of organisations is an estimate of the actual physical entities in the sector. Most of the organisations (63.0%) were accounting, bookkeeping, auditing and tax firms (Table 1-2). Ten per cent of organisations in the sector were involved in stockbroking and financial markets and another 10% were in the sub-sector of investment entities, trusts and company secretary services.
The accounting, bookkeeping, auditing and tax sub-sector was the largest employer in the sector and accounted for 49.7% of all employees. The public sector, i.e. government departments and SARS, was the second-largest employer and provided employment to 14.5% of the workers in the sector.
Table 1-2 Distribution of organisations and employees according to sub-sector
Subsector Organisations Employees
N % N %
Investment Entities, Trusts and Company Secretary Services 619 10.0 6 565 5.6
Stockbroking and Financial Markets 626 10.1 10 328 8.8
Development Organisations 284 4.6 3 339 2.8
Accounting, Bookkeeping, Auditing and Tax Services 3 911 63.0 57 481 49.0
Business and Management Consulting Services 416 6.7 13 494 11.5
Activities Auxiliary to Financial Intermediation 350 5.6 9 423 8.0
SARS and Government Departments 6 0.1 16 726 14.3
Total 6 212 100.0 117 356 100.0
Source: Fasset Sector Study, 2007

Fasset Sector Skills Plan 2005 – 2010 Update for the 2009/2010 Financial Year
Final 11 August 2008 3
1.3.2 Size
The sector mainly comprised a large number of very small organisations and a small number of very large ones (Figure 1-1). A high 96.0% of the organisations had fewer than 50 employees. In fact, 62.2% of these were micro organisations that employed five or fewer employees while 18.1% employed between six and ten employees.
The large organisations varied between 150 and 15 000 employees and employed 52.9% of the workforce (Figure 1-1). The small organisations (fewer than 50 employees) employed 35.1% of the people in the sector. Although a large number of organisations in the sector could be considered as micro organisations (with five or fewer employees), these organisations employed only 9.9% of the sector’s workforce.
Figure 1-1 Distribution of organisations and employees according to organisation size
Organisations Employees
21- 49
employees
5.5%
50- 149
employees
2.7%
11- 20
employees
10.2%
6- 10
employees
18.1%
1- 5
employees
62.2%
150+
employees
1.3%
150+
employees
52.9%
50- 149
employees
12.0%
21- 49
employees
9.3%
11- 20
employees
8.3%
6- 10
employees
7.6%
1- 5
employees
9.9%
Source: Fasset Sector Study, 2007 The organisation size composition of the different sub-sectors can be seen in Table 2-2. With the exception of the sub-sector of activities auxiliary to financial intermediation (which includes debt collection), more than half the organisations in the other sub-sectors were micro organisations, which employed five or fewer employees. In contrast, the public sector (SARS and government departments) consisted of mainly large organisations.
Table 1-3 Organisation size per sub-sector
Organisation size (number of employees)
150+ 50- 149 21- 49 11- 20 6- 10 1- 5 Total
N % N % N % N % N % N % N %
Investment Entities, Trusts and Company Secretary Services
7 1.1 16 2.6 38 6.1 38 6.1 102 16.5 417 67.4 619 100
Stockbroking and Financial Markets
12 1.9 21 3.4 28 4.5 33 5.3 77 12.3 456 72.8 626 100
Development Organisations
2 0.7 10 3.5 21 7.4 53 18.7 49 17.3 148 52.1 284 100
Accounting, Bookkeeping, Auditing and Tax Services
27 0.7 97 2.5 213 5.4 438 11.2 814 20.8 2 322 59.4 3 911 100
Business and Management Consulting Services
17 4.1 16 3.8 10 2.4 38 9.1 44 10.6 290 69.7 416 100

Fasset Sector Skills Plan 2005 – 2010 Update for the 2009/2010 Financial Year
Final 11 August 2008 4
Table 1-3 Organisation size per sub-sector
Organisation size (number of employees)
150+ 50- 149 21- 49 11- 20 6- 10 1- 5 Total
N % N % N % N % N % N % N %
Activities Auxiliary to Financial Intermediation
230 65.8 38 10.8 33 9.4 31 8.8 8 2.3 10 2.8 351 100
SARS and Government Departments
6 100.0 6
Total 80 1.3 169 2.7 341 5.5 633 10.2 1 125 18.1 3 864 62.2 6 212 100
Source: Fasset Sector Study, 2007
1.3.3 Geographical distribution
The geographical distribution of organisations and employees in the sector can be seen in Table 1-4. Columns B and C show the number and percentage of organisations that were located or that had branches in the respective provinces. Gauteng and the Western Cape had more than 2 000 organisations each. Columns D and E show the number and percentage of employees based in each of the provinces. Half (50.2%) of the employees were based in Gauteng, 21.0% in the Western Cape, and 13.4% in KwaZulu-Natal. The remaining 15.4% were thinly spread across the other six provinces.
Table 1-4 Geographical distribution of organisations and employees
A B C D E
Province
Number of organisations
with employees in province
% of organisations
with employees in province
Employees % of
Employees
Eastern Cape 504 8.1 6 402 5.5
Free State 165 2.7 2 826 2.4
Gauteng 2 271 36.6 58 875 50.2
KwaZulu-Natal 973 15.7 15 752 13.4
Limpopo 85 1.4 2 003 1.7
Mpumalanga 140 2.3 2 245 1.9
North West 138 2.2 3 287 2.8
Northern Cape 90 1.4 1 282 1.1
Western Cape 2 102 33.8 24 684 21.0
Total 117 356 100.0
Source: Fasset Sector Study, 2007
1.4 WORKER PROFILE
1.4.1 Total employment
Total employment in the sector in 2007 was 117 356. The employment distribution across sub-sectors can be seen in Figure 1-2. Accounting, bookkeeping, auditing and tax services was by far the largest employer in the financial sector, with 49.0% of employees employed in this sub-sector. The second-largest employer was the sub-sector SARS and government departments, which employed 14.3% of the workers in the sector, and business and management consulting was the third largest, employing 11.5% of the sector’s workforce.

Fasset Sector Skills Plan 2005 – 2010 Update for the 2009/2010 Financial Year
Final 11 August 2008 5
Figure 1-2 Employment distribution according to sub-sector
5.6
8.8
2.8
49.0
11.5
8.0
14.3
0.0
10.0
20.0
30.0
40.0
50.0
60.0
Investment
Entities, Trusts
and Company
Secretary
Services
Stockbroking
and Financial
Markets
Development
Organisations
Accounting,
Bookkeeping,
Auditing and
Tax Services
Business and
Management
Consulting
Services
Activities
Auxiliary to
Financial
Intermediation
SARS and
Government
Departments
Perc
en
tag
e e
mp
loyees
Source: Fasset Sector Study, 2007
1.4.2 Occupations
The services provided by the Financial and Accounting Services Sector are mostly of a professional nature. This is reflected in the occupational composition of the sector, which indicates that 55% of the staff is employed in managerial, professional and semi-professional occupations. The occupational distribution of employees in the sector is discussed in more detail in Chapter 2, section 2.2.1 (Current employment composition).
1.4.3 Gender
In 2007 more than half (53.6%) of the employees in the sector were women. A third (34.0%) of the managers and 48.0% of the professionals were women. The largest occupational group, clerical and administrative workers, consisted of 77.0% women (Table 1-5).
Table 1-5 Gender distribution by occupational category
Occupational group Male Female Total
N % N % N %
Managers 11 484 66.0 5 921 34.0 17 404 100.0
Professionals 23 042 52.0 21 265 48.0 44 307 100.0
Technicians and Trades Workers 1 840 71.0 750 29.0 2 590 100.0
Community and Personal Service Workers 1 839 55.2 1 493 44.8 3 332 100.0
Clerical and Administrative Workers 9 234 23.0 30 976 77.0 40 210 100.0
Sales Workers 398 36.6 689 63.4 1 086 100.0
Machinery Operators and Drivers 3 726 99.9 4 0.1 3 730 100.0

Fasset Sector Skills Plan 2005 – 2010 Update for the 2009/2010 Financial Year
Final 11 August 2008 6
Table 1-5 Gender distribution by occupational category
Occupational group Male Female Total
N % N % N %
Elementary Workers 2 892 61.6 1 804 38.4 4 696 100.0
Total 54 455 46.4 62 901 53.6 117 356 100.0
Source: Fasset Sector Study, 2007
1.4.4 Population group
The majority of workers in the sector were white (53.2%), followed by African workers (31.4%), Indians (7.8%), and Coloureds (7.6%). If the population-group composition of the respective occupational groups is considered, it is clear that transformation is lagging behind in the managerial and professional categories – 72.3% of all managers and 62.1% of professionals were white (Table 1-6). The table displays the population group and gender distribution of the workforce in the respective occupational groups. In 2007 black women constituted 8.4% of all the managers in the sector and black men 19.4%. White women formed 25.7% of the managers, while white men still constituted the largest group of managers (46.6%). Black women were much better represented in the professional category (19.0%). Black men also formed 19.0% of professionals while 33.0% of professionals were white men and 29.0% were white women. Of the clerical and administrative workers 40.4% were white women and 36.6% were black women. Table 1-6 Population group distribution by occupation
Occupational category
African Coloured Indian White Total
N % N % N % N % N %
Managers 3 247 18.7 469 2.7 1 112 6.4 12 576 72.3 17 404 100.0
Professionals 9 319 21.0 2 590 5.8 4 895 11.0 27 503 62.1 44 307 100.0
Technicians and Trades Workers
744 28.7 160 6.2 141 5.4 1 546 59.7 2 590 100.0
Community and Personal Service Workers
3 002 90.1 86 2.6 8 0.2 236 7.1 3 332 100.0
Clerical and Administrative Workers
12 627 31.4 5 289 13.2 2 916 7.3 19 378 48.2 40 210 100.0
Sales Workers
759 69.9 59 5.5 24 2.2 244 22.5 1 086 100.0
Machinery Operators and Drivers
2 890 77.5 72 1.9 1 0.0 767 20.6 3 730 100.0
Elementary Workers
4 317 91.9 209 4.4 22 0.5 148 3.2 4 696 100.0
Total 36 906 31.4 8 933 7.6 9 120 7.8 62 398 53.2 117 356 100.0
Source: Fasset Sector Study, 2007
1.4.5 Age
The age distribution of employees is shown in Figure 1-3 and the average ages of employees in the respective occupational and population groups are shown in Table 1-7`. More than half

Fasset Sector Skills Plan 2005 – 2010 Update for the 2009/2010 Financial Year
Final 11 August 2008 7
(57.2%) of the employees were 35 or younger and the average age of all employees was 36. Black employees were on average five years younger than their white counterparts. Black managers were on average four years younger than whites and black professionals were five years younger. Black clerical and administrative workers were six years younger than whites in the same occupational category.
Figure 1-3 Age distribution of employees
15.6
41.6
25.4
12.4
4.5
0.6
0.0
5.0
10.0
15.0
20.0
25.0
30.0
35.0
40.0
45.0
<=25 26 - 35 36 - 45 46 - 55 56 - 65 66+
Age category
Pe
rce
nta
ge
em
plo
ye
es
Source: Fasset Sector Study, 2007
Table 1-7 Average age by occupation group
Occupational group Black White Total
Managers 36 40 39
Professionals 30 35 32
Technicians and Trades Workers 35 42 41
Community and Personal Service Workers 40 41 41
Clerical and Administrative Workers 35 41 37
Sales Workers 40 39 40
Machinery Operators and Drivers 44 39 42
Elementary Workers 45 46 45
Total 33 38 36
Source: Fasset Sector Study, 2007
1.4.6 Disability
Many of the employers did not indicate the disability status of their employees. Of the individual employee records that were received only two thirds had the person’s disability status indicated.
Fasset Sector Skills Plan 2005 – 2010 Update for the 2009/2010 Financial Year
Final 11 August 2008 8
The total number of employees who were identified as people with disabilities constituted only 0.8% of total employment in the sector.
1.5 CONCLUSIONS
The Financial and Accounting Services Sector consists of a diverse group of organisations, most of which are small (fewer than 50 employees) and many of which are micro enterprises employing five or fewer people. In contrast, the few very large organisations employ thousands of people each and house the majority of the workforce. The sector also has a very large public sector component.
The vast differences in organisation size pose challenges to Fasset. The most important of these is probably to involve the large number of very small organisations in the sector in skills development activities in a meaningful way and to balance the needs and interests of small and large organisations.
Geographically the sector is concentrated in Gauteng, the Western Cape and KwaZulu-Natal. The concentration of organisations in these, mostly urban, areas facilitates contact with the organisations and the provision of training and development services to them. The occupational and educational profiles of the sector reflect the type of skills required. The sector employs mainly skilled and highly skilled people (with educational qualifications at NQF level 4 and higher) in professional and in clerical and administrative positions. Inevitably, training and development initiatives would focus on these levels.
The race and gender profile of the sector still shows the need for accelerated transformation. Employees in the managerial and professional occupational groups are still predominantly white. At the professional level, employment of black women is on a par with that of black men but black women are lagging behind in the managerial category.
The sector employs only a very small number of people with disabilities. The type of work performed in the sector lends itself to the training of larger numbers of people with physical disabilities and, therefore, more focused attention on the creation of employment for these people should be considered.
1.6 BEE AND CO-OPERATIVES
In 2008 5,6% of the levy-paying firms in the sector could be classified as black economic empowerment (BEE) firms. These firms are supported by Fasset through the provision of free lifelong learning (LL) and the learnership grant for black learners or learners with a disability.
Establishing BEE co-operatives is not considered an imperative for organisations in the sector as co-operatives are more beneficial to farming organisations and consumer groups.
1.7 PROFESSIONAL ASSOCIATIONS
A large portion of the workers in the Financial and Accounting Services Sector are members of professional bodies that represent the interests of the various professions and occupations in the sector. As such, the professional bodies are major role-players in this economic sector and contribute to the skills development and the professionalising of the sector. The majority of bodies actively promote sound corporate governance, codes of conduct and professional standards to serve broad public interests. Accounting bodies often perform regulatory and professional functions to uphold practice standards and strengthen public and investor confidence in the economy. Several organisations play an active role in setting standards for education and training, some confer qualifications, and many cooperate closely with SETAs to support a range of skills development initiatives within and outside the Financial and Accounting Services Sector.
Furthermore, qualifications, professional designations and membership of professional associations are interlinked, and most of the professional bodies confer upon their members qualifications that have been registered on the NQF. Most of these qualifications require workplace experience in addition to institutional training. The total set of qualifications used in the sector forms an intricate combination of qualifications conferred by the public and private higher education institutions and those conferred by the professional associations themselves.
The professional bodies not only play a pivotal role in skills development in the financial services field, they are also represented on Fasset’s management board and are closely involved in the activities of Fasset and its substructures. Several of the learnerships registered with Fasset

Fasset Sector Skills Plan 2005 – 2010 Update for the 2009/2010 Financial Year
Final 11 August 2008 9
provide access to membership of professional bodies and to the professional designations guarded by the professional bodies. As a result of these linkages, as well as their pre-existing experience and capacity, some of the professional bodies act as quality assurance partners for the learnerships registered with Fasset.
The professional bodies associated with Fasset are listed in Table 1.8 below, which also indicates their current total membership. Total membership of those bodies that provide individual or corporate membership is approximately 68 747. In some instances, linkage of individual professionals to the professional bodies is through corporate or institutional membership.
Table 1-8 Professional body membership
Professional body Acronym Membership*
Association for the Advancement of Black Accountants ABASA 2 500*
Association of Chartered Certified Accountants ACCA 1 800
Association of Debt Recovery Agents ADRA 224 firms**
Chartered Institute of Management Accountants CIMA 4 300
South African Institute of Professional Accountants SAIPA 7 500
Institute of Administration and Commerce IAC 1 080
Institute of Certified Bookkeepers ICB 3 000+***
Institute of Internal Auditors of South Africa IIA-SA 5 000
Institute of Public Finance Accountants IPFA 419
South African Institute of Chartered Accountants SAICA 37 868****
Chartered Secretaries Southern Africa Division of ICSA 2 600
South African Institute of Financial Markets SAIFM 506
Southern African Institute of Government Auditors SAIGA 1 950*****
Total 68 747
*Figures were obtained from the professional bodies in 2007. The figures have been rounded to the nearest 100. All figures include all levels of individual membership as well as learner members and trainees. The figures also include individuals who belong to more than one professional body. ** Employing 8 000 to 11 000 people. ***2006: 321 full members; 526 student members. **** Including ± 6 100 absentee members. ***** Including 1 500 corporate members.
1.8 TRADE UNIONS
A small proportion of the employees in the sector are unionised. In a survey undertaken by Fasset, only 1,7% of the 600 employers who participated indicated that some of their employees belonged to a trade union. These employees constitute less than 1% of the workers in the sector.5 6
1.9 CROSS-SECTORAL INVOLVEMENT IN SKILLS DEVELOPMENT
An important feature of the Financial and Accounting Services Sector is its involvement in the development of financial skills for the total economy. Many of the firms, especially those in the Accounting, Bookkeeping, Auditing and Tax Services subsector, take on learners far beyond their own needs. On completion of the learnership contracts, the young professionals may either stay in the Financial and Accounting Services Sector or move into other sectors. Over time, this training responsibility of the sector has become institutionalised and is mutually beneficial. Learners benefit from the mentorship and practical experience they receive and the specialised expertise that resides in the sector. At the same time, they form an important component of the service-rendering capacity of the sector. For the rest of the economy, the Financial and Accounting Services Sector serves as an “incubator” for financial skills.
Another aspect of Fasset’s cross-sectoral responsibilities in skills development evolved through its association with professional bodies whose membership extends beyond this particular sector. In fact, some of the professions for which learnerships are registered with Fasset are more
5 Fasset, Trade Union Survey, 2004.
6 It should be noted that SARS did not respond to the survey. A larger percentage of their workers may belong to trade unions.

Fasset Sector Skills Plan 2005 – 2010 Update for the 2009/2010 Financial Year
Final 11 August 2008 10
often found outside the sector than within it. One such example is the internal audit function, which is encountered throughout all sectors of the economy.
The implication of this cross-sectoral involvement is that Fasset cannot base its planning on developments in its sector alone but has to take cognisance of developments in financial services in both the public and private sectors in the country.
1.10 DRIVERS OF CHANGE
Over the past number of years, major changes have impacted on the sector and will continue to do so in the foreseeable future. They include legislation, draft legislation, charters and changes in accepted practices. The Financial and Accounting Services Sector also does not stand divorced from social and economic changes in the country. The main factors that play a role in change in the sector, and more specifically in the need for skills in the sector, are discussed under the following headings: policy and legislation, economic influences, social factors, technological changes and environmental factors.
1.10.7 Policy and legislation
Numerous policy and legislative changes impact on the sector – only a few of the most pertinent of these are included in this discussion.
a) Employment equity and black economic empowerment The need to correct racial and gender imbalances and to increase the participation of all population groups in the mainstream economic activities of South Africa is widely accepted, and measures to attain these objectives have been entrenched in legislation such as the Employment Equity Act (EEA),7 the Preferential Procurement Framework Act8 and the more recent Broad-Based Black Economic Empowerment (BBBEE) Act,9 as well as in policy documents such as the Code of Good Practice in Black Economic Empowerment in Public Private Partnerships. All the developments cited above were followed by the development and publication in 2006 of the Codes of Good Practice that apply to all businesses and that were published by the Department of Trade and Industry. The Codes provide a standard framework for the measurement of broad-based BEE across all sectors of the economy10.
These developments, as well as the economic imperatives to draw more black people into skilled occupations, will affect all sectors over the next few years and exacerbate the effect on individual sectors. For example, the need for black financial professionals will increase dramatically, and the Financial and Accounting Services Sector will have to compete for resources from a limited pool. This shortage of skilled resources is expected to become an important driving force in skills development in the period covered by this SSP.
b) Industry and professional charters BEE legislation has led to the development of several sector charters that will steer human resources practices as well as business activities for the foreseeable future. Although all the charters will exert an indirect influence on the total economy (e.g. through procurement and service policies), the Financial Services Charter will directly affect components of the Financial and Accounting Services Sector.
The Financial Services Charter, which was approved in October 2003, is a voluntary charter in which the participants have set a framework for black economic empowerment in the Financial Services Sector.11 The charter aims to increase the participation of black people
7 Employment Equity Act, No. 55 of 1998.
8 Preferential Procurement Framework Act, No. 5 of 2000.
9 Broad-Based Black Economic Empowerment Act, No. 53 of 2003.
10 Department of Trade and Industry, Broad-Based Black Economic Empowerment Act – Interpretative Guide to The Codes of Good
Practice, Pretoria, 2007. 11
The Financial Services Sector, which is bound by the charter, includes banks, long-term insurers, short-term insurers, managers of formal collective investment schemes in securities, investment managers and other entities that manage funds on behalf of the public, including retirement funds and members of any exchange licensed to trade equities or financial instruments in this country, and entities listed as part of the financial index of a licensed exchange. Any other institution in the Financial and Accounting Services sector may opt in (Financial Services Charter, 2003:3).
Fasset Sector Skills Plan 2005 – 2010 Update for the 2009/2010 Financial Year
Final 11 August 2008 11
(especially women) and the disabled in the sector while further unlocking the sector’s potential, promoting its global competitiveness and enhancing its world-class status.
The charter encompasses various issues such as human resources development, procurement policies, enterprise development, access to financial services, empowerment financing, ownership and control in the Financial Services Sector, shareholder activism and corporate social responsibility. Firms that are bound by the charter will be rated in each category of activity according to a scorecard. These ratings will be used not only to monitor progress but will also be considered by the private and public sectors when procuring financial services.
The charter applies directly to only a small component of the Financial and Accounting Services Sector, namely the licensed exchanges, fund managers and organisations that operate in the financial markets. However, the charter will certainly exert indirect pressure on the Financial and Accounting Services Sector. Two aspects of the charter are especially important: the short-term targets set in terms of the employment of black people (especially women) in managerial positions and the procurement targets that specify the desired percentage of procurement from BEE-accredited companies. In the former case, financial institutions will be competing more vigorously for black professionals in the financial field, and, in the latter case, financial services will be procured from BEE-accredited companies – thus compelling organisations in the rest of the Financial and Accounting Services Sector to change their ownership and management structures if their client bases are situated in the Financial Services Sector as defined for the purpose of the charter.
Another charter that will have a profound impact on the sector is the Chartered Accountancy Profession Charter. After four years of development, the Charter was finalised and signed in November 2007. The scope of the Charter is broad-based black economic empowerment (B-BBEE) for the Chartered Accountancy (CA) profession and sector. In particular, this Charter focuses on the CA sector (CAs and Registered Auditors (RAs)), SAICA, TOPP and accredited education institutions that together constitute the CA profession. The Charter includes a scorecard against which firms will report to a Charter Council. The scorecard encompasses various aspects of the functioning of firms including ownership, management control, employment equity, skills development, preferential procurement, enterprise development and socio-economic development.12 Organisations in the sector will be bound to transformation in all these areas.
c) Legislation that governs corporate structures and governance The basic requirements for corporate governance as well as the statutory duties of auditors are prescribed in the Companies Act13 and the subsequent amendments to this Act. However, as part of a comprehensive process to revise corporate legislation, the draft Companies Bill was approved by the cabinet in May 2008. The purpose of the Bill is to modernise the Companies Act of 1972 and to align corporate governance practices in South Africa with international practices.
One of the main changes proposed in the Bill14 is the distinction between widely and privately held companies and the introduction of the concept of public interest companies. While privately held companies are exempted from previous audit requirements, financial reporting requirements for widely held companies are clearly described and may, for some companies, become more onerous. In terms of financial reporting, a widely held company is required to comply with Financial Reporting Standards (FRS) in all financial information published. It also becomes a legal offence to issue financial information that is materially misstated. A Financial Reporting Standards Council will set standards consistent with the International Financial Reporting Standards (IFRS) for widely held companies. Similarly, public interest companies will be subject to stringent reporting requirements. Potential users of financial statements have been extended to include prospective shareholders, creditors, and government agencies. Legal action may be instituted against individuals and companies in cases where it is found that misleading financial information has been issued.
12
http://www.cacharter.co.za/default.asp 13
Companies Act, No. 61 of 1973. 14
Government of South Africa, Companies’ Bill, May 2008.

Fasset Sector Skills Plan 2005 – 2010 Update for the 2009/2010 Financial Year
Final 11 August 2008 12
On the one hand the new company legislation could negatively impact on the demand for the services of small audit firms. On the other hand it could increase the demand for highly skilled financial professionals in widely held and public interest companies. d) The King Reports The major forces influencing corporate governance reform in South Africa have been the markets and the requirements they have set. Market discipline instituted after falling equity prices has caused radical changes in corporate structures. The return of foreign investors to South Africa after 1994 has been accompanied by their criticism of corporate governance and performance in this country. The First King Commission on Corporate Governance in South Africa was established under the aegis of the Institute of Directors in 1994. The committee aimed at, and has been successful in, raising public awareness of corporate governance. Nevertheless, compliance with the commission’s recommendations remained voluntary, even for companies listed on the JSE Securities Exchange.15 In 2000, however, the JSE required as part of its listing requirements that companies report the extent to which they do not meet the stipulations of the King Report. Following representations, the King Code was updated in 2002 by the Second King Committee Report on Corporate Governance. The report looked at the boards and directors of companies, their composition, independence, remuneration and how meetings should be conducted. The resultant code provides for board committees and how they and the board itself should be evaluated.16 The increased requirements placed on listed companies have contributed to a number of companies de-listing from the JSE.
The issue of risk management received special attention in the Second King Report. The importance of the role and independence of the internal audit and the audit committee was reconfirmed as was the need for organisational integrity and a code of ethics. These recommendations have increased the demand for professional company secretarial services and, as a result, have highlighted the significance of the internal audit and its role in the internal control system. Audit firms are becoming increasingly involved in internal audit and risk management/assessment activities on a consultation basis.
e) Tax legislation and policy Tax legislation, tax policy and tax requirements are revised on a regular basis. Keeping up to date with these changes is central to the work of almost all components of the Financial and Accounting Services Sector. Taxation will consequently always be a component of the skills development needs of the sector.
In the 2002 budget the Minister of Finance announced that SARS would initiate discussions on the regulation of tax consultants and advisors to promote better compliance and to ensure that taxpayers would receive advice consistent with tax legislation. A discussion document entitled Regulating Tax Practitioners was released for public comment in November 2002. SAICA17., raised concerns about the possible exclusion of certain professionals from the legislation that would provide certain sectors with an unfair advantage by not requiring them to register.
A number of refinements to the document were then made, including its introduction in two phases. The first phase, which was completed in June 2005, involved the registration of over 17 000 tax practitioners with SARS. The second phase included the establishment of an independent regulatory board for tax practitioners in terms of a separate Bill. The draft Regulation of Tax Practitioners Bill18 and consequential amendments to Acts administered by the Commissioner for SARS was released for public comment early in 2007. SARS received a number of comments from practitioners, professional bodies and other interested parties in respect of the Draft Bill on the Regulation of Practitioners, on the basis on which a revised version of the Draft Bill has been published for comment. 19.
15
Malherbe, Segal, Corporate governance in South Africa, 2001. 16
Institute of Directors, The King Report on Corporate Governance, 2002. 17
SAICA’s National Tax Committee 2004 Proposed Regulation of Tax Practitioners. Discussion document <https://www.saica.co.za/Documents/Proposed_legislation_of_tax_practitioners.pdf > Accessed 17 July 2007. 18
<ww.sars.gov.za/legislation/Policy/2007/Draft%20Regulation%20of%20Tax%20Practitioners%20Bill.pdf > Accessed 17 July 2007. 19
< www.sars.gov.za/home.asp?pid=168#Regulation >Accessed 10 June 2008.

Fasset Sector Skills Plan 2005 – 2010 Update for the 2009/2010 Financial Year
Final 11 August 2008 13
f) Public Finance Management Act With the promulgation of the Public Finance Management Act (PFMA) in 1999, the effective, efficient and economical use of public resources was emphasised. Strict requirements have been placed on the accounting officers of government departments with regard to financial management, internal control and corporate governance. A chapter of the Act is also dedicated to the functions and responsibilities of treasuries, national as well as provincial (Chapter 2).20
The different treasuries, of which there are a number in the Financial and Accounting Services Sector, will have an ongoing training and roll-out responsibility in respect of the PFMA. The PFMA also prescribed the establishment of the Accounting Standards Board. This board lays down the generally recognised accounting practice (GRAP) standards applicable to the public sector and is in the process of developing a framework for the preparation and presentation of financial statements for the public sector. These frameworks and the GRAP standards will influence the public sector members of the Financial and Accounting Services Sector as well as private audit firms used by the Office of the Auditor-General for public sector audits as they will require knowledge of the standards to be able to audit the financial statements.
g) The Auditing Profession Act, 2005
After almost of decade of debating new legislation to regulate the auditing profession, the Auditing Profession Act (Act 26 of 2005) was signed into legislation in January 2006. The act repeals the Public Accountants' and Auditors' Act, (Act 80 of 1991) and aims to
a) introduce a more comprehensive and modern legislative framework for regulating the auditing profession;
b) improve the integrity of South Africa’s financial sector and financial reporting; c) introduce measures to ensure that potential conflicts of interest between auditors and their
clients are minimised and that swift and appropriate actions can be taken to rectify a situation where the independence of an auditor is at stake.21
The Act establishes an Independent Regulatory Board for Auditors (IRBA) to register auditors and hold them accountable for their professional conduct, and to implement auditing standards comparable to international standards. The IRBA replaces the Public Accountants and Auditors Board (PAAB). The new act also creates Standards-Setting Boards for Auditor Ethics and for Auditing itself. Proposed amendments to the Companies Act, 61 of 1973 will ensure that only financial professionals who are registered as auditors with IRBA may be appointed as the auditor of a company and that all audits of company accounts will be subject to the controls and safeguards of the Act. The Act furthermore provides for more stringent requirements with regard to financial disclosure by auditors of irregularities and criminal and fraudulent financial practices.
An important aspect of the new act is that it requires individual auditors as well as auditing firms to register with the Board and to subject themselves to the oversight of the Board. (Auditing Profession Act, 2005) Concerns have been raised that the requirements of registration at the firm level as well as the individual auditors’ level may be too onerous for small auditing firms and sole proprietors. The new regulatory requirements are also expected to increase the cost of auditing services by a substantial margin.22
The new legislation will impact not only on the public component of the Financial and Accounting Services Sector as the Office of the Auditor-General also uses private audit firms when it requires additional capacity. The utilisation cost of using private audit firms amounted to R137 million in 2002.23 The proposed legislation could further influence the amount of work contracted to private audit firms in the future, with the resultant capacity implications.
20
The Public Finance Management Act, No. 1 of 1999 as amended. 21
Moores Rowland, Public comment on the draft Auditing Profession Bill, 2004 (February 2005). 22
Temkin, S, Auditors generally welcome new law despite concerns about education roles. Business Day, 7 April 2006 23
Gloeck, J.D. Advancing or retreating in the quest to improve public accountability and government auditing. South African Journal of Accountability and Auditing Research.

Fasset Sector Skills Plan 2005 – 2010 Update for the 2009/2010 Financial Year
Final 11 August 2008 14
h) Debt Collectors Act Debt collections forms part of the subsector Services Auxiliary to Financial Intermediation and several of the major debt collecting firms are registered with Fasset (although debt collection firms are also registered with several other Setas).
The regulation of debt collectors was introduced with the promulgation of the Debt Collectors Act (No. 114 of 1998). This Act makes provision for the establishment of a Debt Collectors Council and for the registration of debt collectors. At this stage, no competency requirements are attached to the registration of debt collectors partly because before 2004 there were no qualifications available for this category of workers. However, during 2004 Fasset supported the development of such a qualification and in December 2004 the Further Education and Training Certificate in Debt Collection was registered under the Education and Training Quality Authority (ETQA) scope of Fasset. Currently Fasset is developing a learnership that leads to this qualification. These measures will contribute to the professionalism of this component of the sector, which in turn may increase the demand for its services. i) The National Credit Act
The National Credit Act (Act 34 of 2005) was signed into legislation in March 2005. This Act aims to
promote a fair and non-discriminatory marketplace for access to consumer credit and for that purpose to provide for the general regulation of consumer credit and improved standards of consumer information;
promote black economic empowerment and ownership within the consumer credit industry;
prohibit certain unfair credit and credit-marketing practices;
promote responsible credit granting and use and for that purpose to prohibit reckless credit granting;
provide for debt re-organisation in cases of over-indebtedness;
regulate credit information;
provide for registration of credit bureaux, credit providers and debt counselling services;
establish national norms and standards relating to consumer credit;
promote a consistent enforcement framework relating to consumer credit;
establish the National Credit Regulator and the National Consumer Tribunal.24 Knowledge of this Act is not only imperative for various components of the Financial and Accounting Services Sector, for example for accounting practices and the debt collection industry, but the Act will also influence the way in which certain functions are performed. One of the specific requirements of the Act, namely the provision of debt counselling services to consumers will probably lead to the development of a new occupation i.e. debt counsellors.
j) Financial Advisory and Intermediary Services Act The Financial Advisory and Intermediary Services Act, No. 37 of 2002 (FAIS Act), impacts specifically on the financial planning profession, some of whose members are employed in this sector. The Act requires all service providers to be licensed as such. In order to be licensed, a financial services provider has to satisfy the registrar that he/she complies with the requirements for fit and proper financial services providers or categories of providers, which are determined by the Registrar by notice in the Government Gazette. These requirements are formulated in respect of
personal character qualities of honesty and integrity;
the competence and operational ability of the applicant to fulfil the responsibilities imposed by the Act;
the applicant's financial soundness.
24
National Credit Act, Act 34 of 2005.

Fasset Sector Skills Plan 2005 – 2010 Update for the 2009/2010 Financial Year
Final 11 August 2008 15
At this stage, most of the work related to the evaluation, comparison and mapping of qualifications relevant to the assessment of competence of financial services providers is undertaken by the Insurance Seta. Individual professionals employed in the Financial and Accounting Services Sector also have to comply with the legislation.
k) The Financial Intelligence Centre Act The Financial Intelligence Centre Act, No. 38 of 200125 is aimed at curbing money laundering activities in South Africa and requires financial service providers, many of whom are in the Fasset Sector, to establish the identity of their clients, to keep certain records and to provide certain information to the authorities. Knowledge of and compliance with this Act are important for organisations in the sector. l) Educational and skills development legislation and policy Over the past few years, educational and skills development legislation and policy have become major forces in driving and steering skills development in the sector. Most of the qualifications used in the sector have been registered on the NQF, and in many instances the qualifications were re-examined before they were presented for registration. Numerous education and training providers have also applied for accreditation with the relevant ETQAs.
Participation in the levy-grant system has increased dramatically since its inception in 2000/2001. Of the 7 200 organisations that paid levies to Fasset in 2000/2001, approximately 5% submitted workplace skills plans (WSPs). In 2005/2006 the participation rate in the WSP grants had increased to 34% and in 2006/2007 it had increased further to almost 40%.
m) International legislation and accounting standards The Financial and Accounting Services Sector is not controlled only by South African legislation and financial practices. The legislation and practices that apply in the countries with which South Africa trades, and from which multinational client organisations originate, have become equally important. Financial services organisations that are themselves multinationals are affected by changes in international legislation and practices in several ways: their human resources practices are affected by international practices while their employees must keep abreast of changes in legislation and financial practices in order to retain the international marketability of their firms. Similarly, local financial services organisations that market their services internationally operate within the legislative and policy frameworks of the countries in which their clients are based. These organisations are directly affected by changes in the international environment.
One example of international legislation that affects the Financial and Accounting Services Sector is the United States of America’s Sarbanes-Oxley Act that was enacted in July 2002 largely in response to a number of major corporate and accounting scandals involving some of the most prominent companies in the USA. The Sarbanes-Oxley Act and the events that preceded it have brought the issues of transparency, disclosure and independence to the fore not only in the USA but in many other countries and have contributed to a migration towards a common global platform for corporate reporting.26
Another example of a time-critical change to the accounting profession is the transition from South African Generally Accepted Accounting Practice (GAAP) to International Financial Reporting Standards (IFRS), taking effect from 2005. This change will have an impact on measurement principles and recognition, and the financial results of organisations.
25
Financial Intelligence Act, Act 38 of 2001 26
Brown, F. & Ooi, E., Implications of Sarbanes-Oxley, http://www.pwcglobal.co/extweb/manisseu

Fasset Sector Skills Plan 2005 – 2010 Update for the 2009/2010 Financial Year
Final 11 August 2008 16
1.10.8 Economic factors
a) Globalisation “Faster methods of transportation, together with instantaneous information, have allowed the world to become one giant marketplace.”27 This observation also applies to the market for financial services. Information and communication technology has made it possible to outsource financial services to any part of the world and to draw financial expertise from a global professional market. For the South African Financial and Accounting Services Sector, the disappearance of international boundaries has brought about intensified international competition in the market for its services and in the labour market. Increased market competition places renewed focus on customer satisfaction, while competition in the labour market can result in the loss of important professional skills.
Globalisation (coupled with technological changes) increases the pace of change in the business world, shortens product life cycles and competitive advantages, and increases the need for better, quicker and more decisive actions by the management of organisations. Globalisation also leads to increasingly complex business transactions, increased uncertainty and the explicit recognition of risk.28 These changes have a profound effect on the nature of services required from firms operating in the financial services field and on the skills required at all levels of staff. Traditional accounting services are, for example, giving way to services related to the interpretation of information and to strategic consultation services.
Globalisation has also brought about new opportunities for market expansion. Call centre operations (such as debt collection) are an example of financial services in which South African firms already render a service to the international market. b) The exchange rate Expansion into international markets depends on the relative price at which local services can be rendered. This, in turn, makes local firms that are venturing into foreign markets vulnerable to the fluctuations in the exchange rate that have become characteristic of the local currency. Similarly, firms that are largely dependent on exports (e.g. the corporate divisions of mining companies that are registered with Fasset), as well as those involved in the financial markets, are exposed to changes in the exchange rate. c) Unemployment The very high level of unemployment in South Africa is a national concern. Although it is not directly related to change in the Financial and Accounting Services Sector, unemployment threatens social stability in the country and has an indirect impact on business prospects. It is therefore an issue that warrants the ongoing attention of government, business, labour movements and civil society; it also cannot be ignored in the skills planning processes of any of the Setas. In fact, the upgrading of the skills base of the country is one of the key components of the South African government’s strategy to reduce unemployment. Another important factor in combating unemployment is the stimulation of labour intensive economic activities such as those agreed upon in the Growth and Development Summit Agreement of June 2003.29
d) Economic growth Since the need for financial services is linked to the level of economic activity in the country, the sector is sensitive to economic changes. However, the Financial Intermediation, Insurance, Real
27
Albrecht, S.W. & Sack, R.J. 2000. Accounting Education: Charting the Course through a Perilous Future, American Accounting Association, Accounting Education Series, Vol. 16. 28
Ibid 29
The Growth and Development Summit Agreement emanated from the summit held by the constituencies represented in NEDLAC: government, business, labour and the community, on 7 June 2003.

Fasset Sector Skills Plan 2005 – 2010 Update for the 2009/2010 Financial Year
Final 11 August 2008 17
Estate and Business Service sector,30 in which most of the Financial and Accounting Services Sector resides, has been able to sustain an average annual growth rate of 4% over the 35-year period from 1969 to 2005. In the late 1990s, the sector outperformed the rest of the economy by a substantial margin and became a significant contributor to total economic growth (Figure 1-4). This performance of the subsector is the result of an increase in the demand for financial services, which in turn stems from a myriad of factors including growth in the level of sophistication of the economy, growth in the number of SMMEs, the tendency of organisations to outsource non-core functions such as financial services to specialist service providers, and legislative changes that require businesses to use professional financial services. At the time of writing this SSP update all indications were that economic growth would slow down in the next year or two due to energy constraints, rising inflation and subsequent measures to curb inflation etcetera.
e) Accelerated and Shared Growth Initiative for South Africa (AsgiSA) AsgiSA has been mentioned in the introduction to this SSP update. This initiative consists essentially of a set of projects and other government initiatives that aim to halve poverty and unemployment in South Africa by 2014. Not all of the projects that form part of this initiative have direct relevance to the Financial and Accounting Services Sector, but, if the growth targets mentioned earlier are attained, the growth of this sector may also be accelerated.
30
This sector description is used in the national accounts data reported by StatsSA and the SARB. The sector includes SIC codes 81100 to 88999. It is much larger than The Financial and Accounting Services Sector and includes various other activities, such as banking, insurance and real estate. Most of the private sector activities included in The Financial and Accounting Services Sector description occur within this broader sector.
0.0
1.0
2.0
3.0
4.0
5.0
6.0
7.0
8.0
9.0
10.0
1994 1995 1996 1997 1998 1999 2000 2001 2002 2003 2004 2005 2006 2007
% C
ha
ng
e
Total GDP Financial Services Sector
Table 1-9 Economic growth in South Africa and in the Financial Intermediation, Insurance, Real Estate and Business Service Sector: 1994 to 2007
Source: Statistics South Africa, PO441, March 2008
Fasset Sector Skills Plan 2005 – 2010 Update for the 2009/2010 Financial Year
Final 11 August 2008 18
One of the AsgiSA focus areas that has a more direct bearing on the sector, is the preparation of sector strategies aimed at promoting private-sector investment. In this context, two sectors have been identified for special priority attention: business process outsourcing (BPO) (which is relevant to organisations in the sector) and tourism. BPO refers to the trend of business worldwide, especially in countries where labour is costly, to locate back-office activities such as accounts or claims processing or front office activities like call centres in cheaper centres. According to AsgiSA South Africa has attracted about 5 000 of such jobs from the rest of the world so far. The sector has the potential for 100 000 additional direct and indirect jobs by 2009. Government and business have a joint project, supported by the Business Trust, led by the Minister of Trade and Industry and the Chair of Standard Bank to remove obstacles and refine incentives to achieve this goal.31
The BPO strategy may provide organisations in the Financial and Accounting Services Sector, for example debt collecting and accounting firms, with opportunities for business expansion. This will have to be supported by appropriate skills development initiatives.
f) Joint Initiative for Priority Skills Acquisition (JIPSA) AsgiSA mentioned above, uses mainly existing structures and institutions to attain its objectives. The exception is a new institution, the Joint Initiative for Priority Skills Acquisition (JIPSA). This institution is led by a committee of the Deputy President, key ministers, business leaders, trade unionists and education and training providers or experts. Its job is to identify urgent skills needs (especially skills needed for the successful implementation of the AsgiSA projects) and quick and effective solutions to these skills needs. Solutions may include special training programmes, bringing back retirees or South Africans and Africans working out of Africa, and drawing in new immigrants where necessary. It may also include mentoring and overseas placement of trainees to fast-track their development. JIPSA will have an initial timetable of 18 months, starting in March 2006, after which its future will be reviewed.32
It is obvious that JIPSA will co-operate closely with the Setas and that the work of the Setas will have to support JIPSA.
1.10.9 Social factors
Recent international and local corporate failures and scandals referred to earlier (e.g. Enron, Leisurenet and Regal) have to some extent eroded the public trust that financial professionals previously enjoyed. At the same time, insistence has grown from the public on professional accountability and a trend has emerged to seek recourse in litigation if professionals fail in their public duty. These changes have increased the risk associated with professional work in public practice and may have contributed to the migration of financial professionals not only out of the Financial and Accounting Services Sector but also out of the financial service professions.33 a) Loss of skilled professionals The internationalisation of the professional labour market was mentioned earlier in this document. Unfortunately, South Africa is not benefiting from this phenomenon. Since 1994, a sharp increase has occurred in the loss of skilled professionals in the Financial and Accounting Services Sector due to emigration. This loss of skilled professionals may offset any growth in labour supply in the highly qualified and scarce skills categories in particular. Official figures published by Statistics South Africa show that the emigration of accountants and related professionals soared to more than 500 a year in 2001 and 2002. In 2003 over 700 financial professionals left the country (Figure 1-5). The unofficial figure could, however, be much higher as many professionals leave the country temporarily or do not declare their permanent emigration. At the end of January 2007, 5 863 chartered accountants registered with SAICA were working abroad34 (approximately 23% of all
31
Government of South Africa, Accelerated and Shared Growth Initiative for South Africa, http://www.info.gov.za/asgisa/asgisa.htm 32
Ibid. 33
Members of Fasset’s Skills Planning Working Committee (2004). 34
SAICA’s membership statistics published on http:www.saica.co.za, March 2007.

Fasset Sector Skills Plan 2005 – 2010 Update for the 2009/2010 Financial Year
Final 11 August 2008 19
chartered accountants). At the same time, immigration of these professionals has declined since 1991 and is currently negligible.
0
100
200
300
400
500
600
700
800
1990 1991 1992 1993 1994 1995 1996 1997 1998 1999 2000 2001 2002 2003
Immigration Emigration
Table 1-10 Immigration and emigration of accountants and related professionals: 1990 to 200335
Source: Statistics South Africa, Tourism and Migration, Data Series PO351.
b) HIV/AIDS South Africa’s MRC (Medical Research Council) 2001 report indicated that nearly five million people in South Africa are living with HIV/AIDS. Without effective intervention, the report estimates that by 2010, 66% of deaths in South Africa will be AIDS-related and that life expectancy will fall to 41 years. Current estimates suggest that 95% of the HIV infections in Sub-Saharan Africa are attributable to unsafe sex. The disease will affect a large percentage of the workforce including decision-makers. The potential for economic growth could be reduced by up to 2% as the disease depletes the labour force, especially when the skilled labour force is affected. The Bureau for Economic Research (BER) indicates that gross domestic product GDP may be 5,7% lower by 2015 as a result of AIDS.
According to population-based surveys in Sub-Saharan Africa, infection levels in women are higher than in men. Studies conducted in nine African countries suggest that for every 10 African men infected, between 12 and 13 African women are infected.
Statistics show that nationally in South Africa, the “high-risk” age groups are 18-40 years of age for females and 22-50 years of age for males. The majority of the workforce in the Financial and Accounting Services Sector is between the ages of 20 and 55 and hence fall into the most vulnerable age group. The prevalence of HIV/AIDS in the sector itself is, however, most probably lower than in other sectors because of the higher educational qualification levels of the workforce. The Human Sciences Research Council (HSRC) study revealed that HIV infection rates are much lower for people with tertiary education (6,5%) than for the total adult population.36
1.10.10 Technological factors
The sector is affected in several ways by technological developments, especially by developments in electronic financial systems. Many functions that were previously performed by people are now done by computer software. Thus, in some respects, technology is replacing labour and is slowing down the rate at which labour is absorbed in the economy. The effect of technological changes on
35
In 2004 Statistics South Africa stopped collecting and publishing emigration figures. Emigration trends can therefore not be traced beyond 2003. 36
Ibid.

Fasset Sector Skills Plan 2005 – 2010 Update for the 2009/2010 Financial Year
Final 11 August 2008 20
organisations in the financial markets was mentioned earlier. Another example is the electronic systems acquired by SARS that enable small businesses to submit tax returns and to pay their taxes electronically. This is causing a decline in the demand for the services of smaller accounting firms and tax service providers in the sector.37
Technological changes also necessitate constant upgrading of the skills of the workforce in the sector. As a result of the highly competitive nature of the sector and increased globalisation, the sector is required to adapt to new technology continuously. For instance, audit firms have to stay abreast of the software used by their clients, and some firms have to keep up with their international partners, which requires constant training and skills improvement.38
In terms of the public sector, the current accounting systems will have difficulty in coping with the move to accrual accounting in government departments. This will necessitate a new integrated accounting system with related skills and training needs for the subsector.39
1.10.11 Environmental factors
The King Report on Corporate Governance for South Africa (2002) states that companies should move from single to “triple-bottom-line” reporting,40 which covers the economic, environmental and social aspects of a company’s activities. The King Report (2002) further states, “The environmental aspects include the effect on the environment of the product or services produced by the company”. Thus, it has become increasingly important to disclose environmental impact and its effect on the financial position of a company.
Costing systems can be used to determine the environmental costs while management accounting techniques can be used to assist decision makers in making informed decisions on environmental issues.41 However, this is a new subfield in accounting and economics. The research available on this subfield is still limited, and educational institutions are only now beginning to include environmental accounting in their curricula. Environmental accounting will probably become increasingly important in the future and will gain a more prominent position in education and training in the sector.
1.11 CONCLUSIONS
The sector served by Fasset is relatively small and consists mainly of micro- and small organisations, many of which are professional practices. However, almost half of the employees in the sector work in the small number of large and medium size organisations. Fasset is thus left with the challenge of balancing the needs and interests of SMMEs as well as large organisations. The organisations belonging to the sector are concentrated in the metropolitan areas of Gauteng, the Western Cape and KwaZulu-Natal.
The services rendered by organisations in the sector are mainly of a specialised and professional nature; consequently, the sector tends to employ professionals, and technicians and associated professionals. These workers are supported by clerical and administrative workers, who also constitute a substantial proportion of the employees in the sector.
A special feature of the sector is the presence and influence of a number of professional associations whose roles have become ingrained in the sector’s qualification structure, in the organisation of education and training, and in the professional designations used in the sector.
The sector is also a highly regulated environment. Many of the functions performed by the organisations in the sector are regulated by legislation and by government policy. Similarly, most of the skilled workers in the sector are regulated through professional rules. The new legislation passed in the course of the past few years has tended to increase control over the functions of the sector and has thus contributed to the need for greater accountability in and the further professionalisation of the sector.
Most of the factors that influence change in the sector tend to increase the demand for financial services and thus the growth of the sector. One exception is technological changes, which generally have an adverse effect on the demand for labour but at the same time increase the
37
Ibid. 37
Department of Labour, Fasset Sector Brief, 2002. 38
Gerrits, E., Partner, PricewaterhouseCoopers, Telephonic interview, January 2004. 39
Cassim, Z., Institute of Public Finance and Auditing, Interview, January 2004. 40
Dekker, C. King Report on Corporate Governance for South Africa, 2002. 41
Van Rensburg, A.M., Management Accounting as an existing decision making tool, 2003.

Fasset Sector Skills Plan 2005 – 2010 Update for the 2009/2010 Financial Year
Final 11 August 2008 21
need for technological skills in the workforce. A second exception is the proposed changes to the Companies’ Act which may have a profound effect on the demand for accounting and auditing services. The way in which these changes may affect the need for accounting and auditing services will to some extent depend on other aspects of corporate regulation, for example the tax reporting requirements that will still be imposed on small firms. It is imperative that the effect of these changes on the demand as well as the supply side of the financial services labour market should be monitored very closely over the next couple of years.
A particular challenge facing the sector is to increase the participation of black people in the sector – especially at managerial level and in terms of equity ownership of firms. These changes are prompted by legislation and policy as well as by economic realities such as the need to extend the capacity of the sector beyond the current limited pool of professionals. Another challenge facing the sector is to retain financial skills that are currently being lost rapidly to the international market.
All the changes mentioned in this chapter boil down to an increased need for highly skilled financial professionals as well as the continuous development of the skills of workers who are already active in the labour market. The current profile of workers confirms the need for greater equity in the sector. This implies the need to increase the representation of black people in all categories and women in managerial positions. The employment of more disabled people also requires attention.

Fasset Sector Skills Plan 2005 – 2010 Update for the 2009/2010 Financial Year
Final 11 August 2008 22
2 THE DEMAND FOR SKILLS
2.1 INTRODUCTION
This chapter begins with a summary of employment in the sector and the attributes of the current workforce, which was described in some detail in Chapter 1 of this report. These attributes reflect the kinds of skills that are used in the sector, and they give an indication of the racial and gender equity attained in the sector, and thus of the extent to which further transformation is required. This is followed by an assessment of the number of workers that will be needed in the sector over the period 2005 to 2009 and the occupations in which growth is likely to occur. The Financial and Accounting Services Sector does not correspond with any of the sectors used by agencies that produce labour market statistics in South Africa; consequently, little historical information is available on the sector. Although the grant applications received by Fasset are useful sources of information on the labour market in the sector, the levy-grant system is still too new to allow the discernment of any trends. This chapter therefore focuses mainly on expected trends based on the cross-sectional survey information gathered since Fasset’s inception. The quantitative assessment of demand presented in this chapter was derived from a labour demand model that was developed as part of the Fasset Sector Study, conducted in 2007.
2.2 CURRENT EMPLOYMENT
2.2.1 Current employment composition
The services provided by the Financial and Accounting Services Sector are mostly of a professional nature. This is reflected in the occupational composition of the sector, which indicates that 55% of the staff is employed in managerial, professional and semi-professional occupational categories (Figure 2.1). A relatively large percentage (14.8%) of people was classified as managers. This major group includes the owners of or partners in small firms and practices – hence the large percentage.
Professionals constituted 37.8% of the employees and clerical and administrative workers 34.3%. The other occupational groups were very small. The minor occupational group Accountants, Auditors and Company Secretaries constituted 73.4% of professionals and almost 30% of all the employees in the sector. This group includes general accountants, trainee accountants, taxation accountants, external auditors and internal auditors.
The second largest group of professionals (8.9%) was Information and Organisation Professionals which includes management consultants, organisation and methods analysts, economists, statisticians and actuaries. This was followed by Financial Brokers and Dealers, and Investment Advisors (6.6%).
Among the clerical and administrative positions the largest occupational groups were general clerks (33.3% of all clerical and administrative positions) followed by accounting clerks and bookkeepers (15.6%).
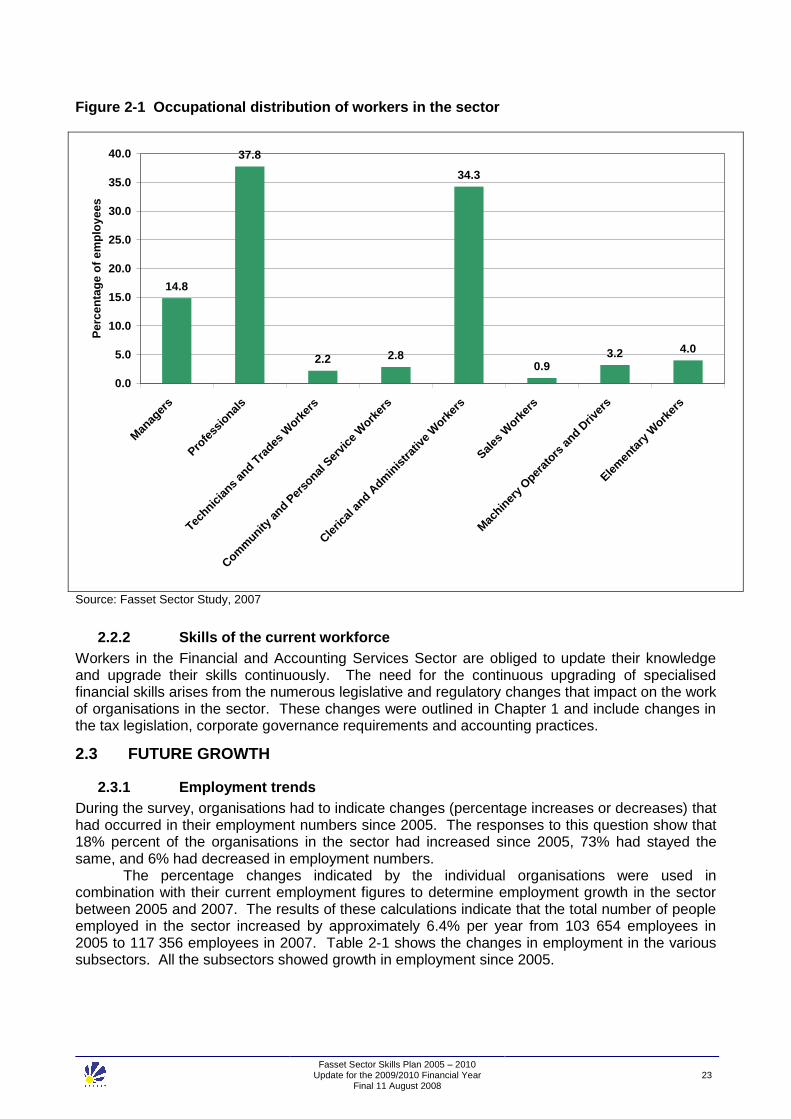
Fasset Sector Skills Plan 2005 – 2010 Update for the 2009/2010 Financial Year
Final 11 August 2008 23
Figure 2-1 Occupational distribution of workers in the sector
14.8
37.8
2.2 2.8
34.3
0.93.2 4.0
0.0
5.0
10.0
15.0
20.0
25.0
30.0
35.0
40.0
Man
ager
s
Pro
fess
ional
s
Technic
ians
and T
rades
Work
ers
Com
munity
and P
erso
nal S
ervi
ce W
orker
s
Cle
rical
and A
dmin
istrat
ive
Work
ers
Sal
es W
orker
s
Mac
hiner
y Oper
ators
and D
rive
rs
Ele
men
tary
Work
ers
Pe
rce
nta
ge
of
em
plo
ye
es
Source: Fasset Sector Study, 2007
2.2.2 Skills of the current workforce
Workers in the Financial and Accounting Services Sector are obliged to update their knowledge and upgrade their skills continuously. The need for the continuous upgrading of specialised financial skills arises from the numerous legislative and regulatory changes that impact on the work of organisations in the sector. These changes were outlined in Chapter 1 and include changes in the tax legislation, corporate governance requirements and accounting practices.
2.3 FUTURE GROWTH
2.3.1 Employment trends
During the survey, organisations had to indicate changes (percentage increases or decreases) that had occurred in their employment numbers since 2005. The responses to this question show that 18% percent of the organisations in the sector had increased since 2005, 73% had stayed the same, and 6% had decreased in employment numbers.
The percentage changes indicated by the individual organisations were used in combination with their current employment figures to determine employment growth in the sector between 2005 and 2007. The results of these calculations indicate that the total number of people employed in the sector increased by approximately 6.4% per year from 103 654 employees in 2005 to 117 356 employees in 2007. Table 2-1 shows the changes in employment in the various subsectors. All the subsectors showed growth in employment since 2005.

Fasset Sector Skills Plan 2005 – 2010 Update for the 2009/2010 Financial Year
Final 11 August 2008 24
Table 2-1 Changes in employment 2005 to 2007 per sub-sector
Subsector Total
employment 2005
Total employment
2007
% change per year
Investment Entities, Trusts and Company Secretary Services 6 235 6 565 2.6
Stockbroking and Financial Markets 9 135 10 328 6.3
Development Organisations 2 930 3 339 6.8
Accounting, Bookkeeping, Auditing and Tax Services 52 081 57 481 5.1
Business and Management Consulting Services 12 439 13 494 4.2
Activities Auxiliary to Financial Intermediation 5 816 9 423 27.3
SARS and Government Departments 15 018 16 726 5.5
Total 103 654 117 356 6.4
Source: Fasset Sector Study, 2007
Growth in business was the main contributor to growth in employment. Business problems (decrease in business); difficulties in finding appropriately experienced and skilled people; and restructuring through, for example mergers or acquisitions, were the main reasons for some organisations experiencing decreases in employment over the two-year period.
2.4 STAFF TURNOVER
In the period 1 April 2006 to 31 March 2007, 14 285 employees left the service of their employers. This constitutes a staff turnover rate of 12.4%. Table 2-2 shows that most (77.9%) of the employees who left resigned from their positions, while 5.5% were dismissed and 2.3% retired. Approximately a tenth of the employees who left their employers were learners who left after they had completed learnerships. Table 2-2 Reasons for staff turnover in the sector for the period 1 April 2006 to 31 March 2007
Reason N %
Resigned 11 129 77.9
Left because of completion of learnerships 1 508 10.6
Dismissed 780 5.5
Retired 335 2.3
Passed away 300 2.1
Retrenched 233 1.6
Total 14 285 100.0 Source: Fasset Sector Study, 2007
The labour turnover rate for the sector for the period 1 April 2006 to 31 March 2007 was 13.5%. It differed slightly for the different size organisations – for organisations that employed 1 – 49 people the staff turnover rate was 13.6%, for those that employed 50 – 149 employees it was 10.9% and for the large organisations that employed 150 and more people the rate was 14.0% (Table 2-3). One of the reasons for the higher staff turnover in the large organisations may be their higher intake of learners who leave the organisations after completion of their training contracts. Table 2-3 Staff turnover by organisation size
Organisation size % of organisations that lost employees
Staff turnover rate
1 – 49 employees 40.6 13.6
50 – 149 employees 79.9 10.9
150+ employees 90.1 14.0
Total 42.3 13.5 Source: Fasset Sector Study, 2007

Fasset Sector Skills Plan 2005 – 2010 Update for the 2009/2010 Financial Year
Final 11 August 2008 25
2.5 EMPLOYERS’ GROWTH EXPECTATIONS
The labour turnover rate for the sector for the period 1 April 2006 to 31 March 2007 was 13.5%. It differed slightly for the different size organisations – for organisations that employed 1 – 49 people the staff turnover rate was 13.6%, for those that employed 50 – 149 employees it was 10.9% and for the large organisations that employed 150 and more people the rate was 14.0% (2.1% expected a decrease, and 38.3% indicated that they expected the number of employees to remain the same. Of the organisations that indicated employment growth since 2005, 86% expected further growth in the next five years (Table 2-4).
Table 2-4 Employment growth expectations (2007 – 2012) by subsector
Subsector Increase Same Decrease Total
Percentage of organisations
Investment Entities, Trusts and Company Secretary Services
40.9 51.1 8.0 100.0
Stockbroking and Financial Markets 62.4 35.8 1.7 100.0
Development Organisations 67.9 32.1 100.0
Accounting, Bookkeeping, Auditing and Tax Services 59.7 39.1 1.2 100.0
Debt collection 66.1 29.0 4.8 100.0
Business and Management Consulting Services 71.4 25.5 3.1 100.0
Activities Auxiliary to Financial Intermediation 48.5 44.7 6.8 100.0
SARS and Government Departments 100.0 100.0
Total 59.6 38.3 2.1 100.0 Source: Fasset Sector Study, 2007
Organisations also had to indicate which occupational categories they expected would increase or decrease and the reasons for these employment changes. Nearly a quarter of organisations (23.5%) expected increases in professionals, 5.3% in administrative staff, 4.2% in technical/associated professionals, and 3.6% in senior managers. Expected increases in employment of specific occupational groups were mainly attributed to growth in business. Decreases in employment were linked to unbundling and decreased business. Some organisations also indicated that they expected changes to the corporate legislation and auditing requirements to lead to a decrease in the amount of audit work. As a result they would switch to alternative business areas and decrease their intake of trainee accountants.
Organisations had to indicate if there were occupations in their work environment where, in future, the number of employees would specifically increase or decrease more than other occupations. Seven organisations indicated a decrease in professional and or administrative staff as a result of restructuring or legislation.
Increases in accountants (5.0% of organisations in the sector), bookkeepers (2.7%), and trainee accountants (2.5%) were expected. Two per cent of organisations indicated that general administrative clerks would be needed more than other occupations. Expected increases were mainly related to increased workloads and/or business growth.
2.6 FORECASTING OF FUTURE DEMAND
The demand for labour in a sector is defined as the total number of people expected to be employed in the sector in a specific year. Of particular importance for skills development is the number of people that need to be recruited into or trained for the sector. The positions that need to be filled emanate from: the expansion of the sector because of a growth in the demand for its services or a growth in the output of the sector (new demand); and the attrition of staff through retirement, movement of people into other sectors or out of the labour market, emigration, and mortality (replacement demand).
The demand model for the Financial and Accounting Services Sector was developed at the detailed occupational level; i.e. demand was forecast for each occupation using the OFO categorisation of occupations.

Fasset Sector Skills Plan 2005 – 2010 Update for the 2009/2010 Financial Year
Final 11 August 2008 26
2.6.2 Baseline employment
The development of the model started with an estimate of the total number of positions available in the sector in 2007. The total number of positions available was taken as the sum of people employed plus reported vacancies. On the basis of the findings of the employer survey the total number of people employed in the sector was estimated at 117 356. The number of vacancies that existed over a prolonged period of time was estimated for each occupation, based on the information provided by employers in the employer survey. Based on the number of people that left their places of work during the year preceding the employer survey, another 1% was added to the existing positions to account for short-term vacancies. The total number of positions in the sector in 2007 was taken as 121 840. The positions were distributed across 232 different occupations (classified at the most detailed level of the OFO).
2.6.3 Assumptions used in the model
Economic growth
The Finance, Real Estate and Business Services Sector (as defined in the National Accounts), which includes most components of the Financial and Accounting Services Sector, grew annually by 6.4% over the period 2002 to 2006. In the first demand scenario – the pessimistic scenario – it is assumed that the sector will not be able to sustain this level of growth and that the average annual growth will slow down to 4.0% per year. In the second scenario, the optimistic scenario, it is assumed that the average annual growth will increase to 7.5% per year.
Employment coefficient
The employment coefficient or the elasticity of employment demand is an estimate of the responsiveness of employment to economic growth. If average annual growth in output of the Finance, Real Estate and Business Services Sector over the period 2002 to 2006 is compared with the employment growth seen over the same period, an employment coefficient of 0.69 is obtained. That means that for every 1% economic growth employment increased by 0.69%. However, the component of the sector that is served by Fasset is labour intensive relative to other components of the sector such as banking. Furthermore, in the employer survey respondents clearly indicated that they expected the number of professionals to increase more than employment of people in other occupational groups. For this reason two employment coefficients were used in the demand-projection model: 0.75 for non-professional occupations and 0.85 for professional occupations.
Mortality
Mortality seems to play a very small role in replacement demand in this sector. In the employer survey a mortality rate of only 0.2% was reported. In the model the mortality rate was taken as 0.5% per year.
Retirement
The workforce of the Financial and Accounting Services Sectors is relatively young. In the model the number of people who were expected to retire was based on the age distribution of workers in the different occupational groups observed in the employer survey. It was assumed that people will retire at the age of 60.
Emigration
Since 1994, a sharp increase has occurred in the loss of skilled professionals in the Financial and Accounting Services Sector as a result of emigration. Official figures published by Statistics South Africa show that the emigration of accountants and related professionals soared to more than 500 a year in 2001 and 2002. In 2003 over 700 financial professionals left the country.42 The
42
Statistics South Africa stopped the collection of emigration data in 2003. Therefore, more recent data are not available.

Fasset Sector Skills Plan 2005 – 2010 Update for the 2009/2010 Financial Year
Final 11 August 2008 27
unofficial figure could, however, be much higher as many professionals leave the country temporarily or do not declare their permanent emigration. At the end of January 2007, 5 863 chartered accountants who were registered with SAICA were working abroad43 (approximately 23% of all chartered accountants).
On the basis of this information, the emigration of professionals was taken as 2% per year. For the other occupational groups it was taken as 0.5% per year.
People leaving the sector
People leaving the sector to find employment in other sectors of the economy or who stop working altogether (to become homemakers, for example) is the greatest factor contributing to replacement demand. However, there is no statistical information available about the magnitude of this form of skills attrition from the sector. In the absence of any reliable data a speculative figure of 5% was used for all occupations, with the exception of accounting trainees. Most accounting trainees change employment after completion of their learnership contracts. As most of the learnerships are three-year programmes it was assumed that a third will complete their learnerships every year. It was furthermore assumed that approximately half of the learners who qualify each year (i.e. 15% of all learners) will leave the sector and find employment elsewhere in the economy.
2.6.4 Results of the demand projection model
The assumptions used in the labour-demand model are summarised in Table 2-5 below. The only variable that was changed in order to create Scenarios A and B was economic growth.
Table 2-5 Summary of assumptions used in labour-demand projection model Assumptions Scenario A Scenario B
Annual economic growth 4.00% 7.50%
Employment coefficient (all occupations) 0.75 0.75
Employment coefficient (professionals) 0.85 0.85
Mortality rate 0.50% 0.50%
Percentage leaving the sector (all occupations) 5.00% 5.00%
Percentage leaving the sector (accounting trainees) 15.00% 15.00%
Retirement
Managers 0.85% 0.85%
Professionals 0.46% 0.46%
Technicians and Trades Workers 1.66% 1.66%
Community and Personal Service Workers 0.09% 0.09%
Clerical and Administrative Workers 0.95% 0.95%
Sales Workers 0.31% 0.31%
Machinery Operators and Drivers 0.45% 0.45%
Elementary Workers 1.70% 1.70%
Emigration
Emigration per year (non-professionals) 0.50% 0.50%
Emigration per year (professionals) 2.00% 2.00%
The results of the labour-demand projections (Table 2-6) show that under Scenario A a total of 3 844 new positions would be created in the sector in 2008. This would increase to 4 355 positions by 2012. The replacement demand in the sector in 2008 would be 10 184, which would increase to 11 551 by 2012.
43
SAICA’s membership statistics published on http:www.saica.co.za, March 2007.

Fasset Sector Skills Plan 2005 – 2010 Update for the 2009/2010 Financial Year
Final 11 August 2008 28
Under Scenario B, which assumes that the sector’s output would increase by 7.5% per year, it is expected that 7 208 new positions would be created in 2008 and that this number would increase to 9 080 by 2012.
Table 2-6 Labour-demand projections: 2007 to 2012
Scenario A 2007 2008 2009 2010 2011 2012
Total number of positions 121 841 125 685 129 651 133 743 137 965 142 320
New positions to be filled 3 844 3 966 4 092 4 221 4 355
Positions that need replacement 10 184 10 510 10 846 11 193 11 551
Total positions to be filled 14 028 14 476 14 938 15 415 15 907
Percentage growth in positions to be filled
3.2 3.2 3.2 3.2
Scenario B 2007 2008 2009 2010 2011 2012
Total number of positions 121 841 129 049 136 685 144 776 153 346 162 426
New positions to be filled 7 208 7 636 8 090 8 571 9 080
Positions that need replacement 10 184 10 795 11 443 12 129 12 858
Total positions to be filled 17 392 18 431 19 533 20 700 21 938
Percentage growth in positions to be filled
6.0 6.0 6.0 6.0
The demand for specialised financial skills is of particular importance to Fasset, which is the ETQA for many specialised financial qualifications and which is responsible for learnerships in the sector. The number of new positions that will be created for accountants, auditors and company secretaries is expected to be 1 190 in 2008 and it will increase to 1 360 by 2012 (Scenario A). Under Scenario B the corresponding figures are 2 231 (2008) and 2 857 (2012). If the need to replace professionals that leave the sector is also considered, then the total number of accountants, auditors and company secretaries that will have to be trained for the sector and/or recruited into it in 2008 will vary between 5 303 (Scenario A) and 6 344 (Scenario B).
2.7 CONCLUSION
The information presented in this chapter clearly shows that the Financial and Accounting Services Sector has grown substantially over the last five years and that it is expected to continue on this growth path over the next five years. The growth of the sector is, in part, a result of the growth of the South African economy. As the number of enterprises increases and existing businesses expand, the need for financial services also increases. However, there are also other factors that drive the growth of the sector; for example, the increasing complexity of the business world and the current emphasis on good corporate governance and risk management result in an increased reliance on the specialised financial expertise offered by organisations in this sector.
On the basis of the demand-forecasting model developed for the Financial and Accounting Services Sector, it is estimated that the number of positions available in the sector will increase by 3.2% each year. This growth depends on the economic growth of the country and of this particular sector. It also depends on the availability of skills. The very nature of the work of this sector determines that its growth is closely related to the availability of skilled staff – especially professionals. The supply of skills to the sector is discussed in the next chapter.
Replacement demand is estimated at approximately 8% of total employment. The replacement demand in the occupational category accountants, auditors and company secretaries is higher than in other categories because of the high emigration estimates for professionals and because of the large number of learners who leave the sector after completion of their learnerships.

Fasset Sector Skills Plan 2005 – 2010 Update for the 2009/2010 Financial Year
Final 11 August 2008 29
3 THE SUPPLY OF SKILLS
3.1 INTRODUCTION
The supply of skills to the sector is analysed from different perspectives. First of all, the focus falls on the availability of people with skills in the study fields relevant to the sector and unemployment among the potential workforce of the sector. High unemployment rates are an indication of an oversupply of skills, while very low unemployment rates may indicate the inability of the educational sector to meet increased labour market needs.
The second part of this chapter deals with the formation of new skills for the sector – more specifically, the role of the higher education institutions and professional associations and learnerships in this regard.
The last part of the chapter deals with skills development in the workplace.
3.2 CURRENT EMPLOYMENT
Educational levels are expressed in terms of the levels of the National Qualifications Framework (NQF). The highest qualifications of employees reported by employers were roughly converted to NQF levels.
Qualifications at NQF level 4 (grade 12 or matric and equivalent) and NQF level 5 were grouped together because it was not possible to accurately determine the levels of certificates – some could have been at NQF level 4 and some at NQF level 5.
Figure 3-1 clearly shows that the Financial and Accounting Services Sector employed mainly highly skilled workers. The vast majority (94.2%) of employees held qualifications at NQF level 4 and above. As many as 60.9% had qualifications at NQF level 6 and above.
Figure 3-1 Educational qualifications of employees
2.12.8
0.9
33.3
27.8 27.2
5.9
0.0
5.0
10.0
15.0
20.0
25.0
30.0
35.0
Level 1 and
below
Level 2 Level 3 Levels 4
and 5
Level 6 Level 7 Level 8 and
above
Pe
rce
nta
ge
of
em
plo
ye
es
Source: Fasset Sector Study, 2007

Fasset Sector Skills Plan 2005 – 2010 Update for the 2009/2010 Financial Year
Final 11 August 2008 30
3.3 AVAILABILITY OF FINANCIAL SKILLS IN THE ECONOMY
The LFSs conducted by StatsSA provide information on the qualification levels and economic status of the South African workforce. According to the March 2007 survey, there are approximately 2,1 million economically active44 people in South Africa with post-matric qualifications. Of these, 517 129 (24%) have qualifications in the field of business, commerce and management studies. More than half (58%) of the people qualified in this field of study have qualifications on NQF Level 4 and 5, 19% on NQF Level 6 and 23% on NQF Level 7 and above.
Of the 517 129 potential workers in this field, 56 849 (11%) were unemployed at the time of the survey. The unemployment rate differs for people at different qualification levels. The unemployment rate for those with highest qualification on NQF Level 4 and 5 was 14%, 10% for those with qualifications on NQF Level 6 and only 5% for those on NQF Level 7 and above. (Table 3.1).
The circumstances of African graduates differ from those of members of the other three population groups. At NQF Level 4 and 5, their unemployment rate (22%) is higher compared to the overall unemployment rate in this educational category of 14%. African graduates with a NQF Level 6 qualification have an unemployment rate of 13% compared to a 10% overall unemployment rate. Table 3-1 The economically active workforce with post-Grade 12 qualifications in business, commerce and management studies 2003 - 2007
Highest qualification 2003 2004 2005 2006 2007
% % % % %
NQF level 4 and 5 Employed 77.5 83.4 82.9 84.1 86.2
Unemployed 22.5 16.6 17.1 15.9 13.8
NQF level 6 Employed 89.1 95.5 94.5 91.6 90.5
Unemployed 10.9 4.5 5.5 8.4 9.5
NQF level 7 and above Employed 96.0 97.0 99.6 98.2 95.0
Unemployed 4.0 3.0 0.4 1.8 5.0 Source: Calculated from StatsSA’s Labour Force Surveys 2003 - 2007.
These figures show that there is spare capacity of people who are already educated to some level and who could be available for work in the Financial and Accounting Services sector. Unfortunately, a macro-analysis such as this one does not reveal detail about the exact qualifications available and the quality of these skills from the perspective of employers.
Information on the total number of higher education graduates in South Africa with qualifications in the financial field, and more specifically in accounting, was obtained from the National Learners’ Records Database (NLRD), which is maintained by the South African Qualifications Authority (SAQA). Unlike before data were not broken down into university and technikon graduates due to the restructuring of the higher education system which took place in recent years.45
The figures below give an indication of the stock of graduates available in the labour market. We could distinguish between the number of graduates with qualifications in accounting and those in the more general field of commerce, business management and business
44
According to the official definition of unemployment a person must satisfy the following three conditions: The person 1) did not work during the seven days prior to the survey interview and does not have any job attachment; 2) wants to work and is available to start to work within 2 weeks; and 3) has taken active steps to look for work or to start own business in the 4 weeks prior to the interview. 45
The transformation and restructuring of the higher education system was officially launched in May 2001 to solve amongst other things, problems of duplication, the lack of access to higher education in certain areas and to improve the quality of educational programmes on offer. The number of higher educational institutions was reduced from 36 to 24 through institutional mergers. In some instances universities and technikons were transformed into “comprehensive institutions” which offer programmes previously offered by technikons as well as a range of university programmes. For example the former Rand Afrikaans University has merged with Wits Technikon in Gauteng to form the University of Johannesburg. As a result changes occurred in the way in which SAQA reports on graduation trends in South Africa. Thus, for the first time the analysis presented in the SSP update does not distinguish between university and technikon graduates. The analysis also uses NQF levels in stead of qualification types.

Fasset Sector Skills Plan 2005 – 2010 Update for the 2009/2010 Financial Year
Final 11 August 2008 31
administration. Unfortunately, the NLRD does not provide information on the employment status of graduates.46
The analysis shows that in 2004, 297 000 graduates had qualifications in either accounting or in commerce, business management and business administration. However, of these, only 22.6% (67 000) had majored in accounting.
Figures 3.2 and 3.3 provide information on the availability47 of people according to their highest NQF level of education. (See Annexure D for an explanation of NQF levels.) Qualifications achieved on NQF level 6 include national diplomas and three-year first degrees. NQF level 7 qualifications consist of national higher or post-graduate diplomas, four-year first degrees (including BTech degrees) and honours degrees, while masters degrees are on NQF level 8 and doctoral degrees and Laureatus diplomas above NQF level 8. The figures also show how the number of graduates changed in the period 1994 to 2004.
A first observation that can be made from the figures is that many learners who have qualifications in accounting continued with postgraduate studies. The number of graduates with NQF level 7 qualifications exceeds the number with only NQF level 6 qualifications. This is largely because postgraduate diplomas (including the Certificate in the Theory of Accounting (CTA)) or Honours degrees are requirements for entry into the professional cadres, for example entry into the qualifying examination of the IRBA and SAICA’s qualifying examination. In contrast, most of the graduates in the field of commerce, business management and business administration have only first (three year) degrees. However, In 2004 10.3% of the pool of graduates with highest qualifications in commerce, business management and business administration had masters and doctoral degrees (qualifications on NQF level 8 and above) while only 0.4% of graduates in accounting had qualifications at this level.
Figure 3-2 Number 48 of public HET graduates who majored in accounting by highest level of education
0
5 000
10 000
15 000
20 000
25 000
30 000
35 000
40 000
1994 9 810 19 681 92 7
1999 19 476 28 275 166 10
2004 30 405 36 359 266 23
Level 6 Level 7 Level 8 Above Level 8
46
The analysis that follows in the rest of the section is based on information obtained from the NLRD. The NLRD does not contain information on technikon qualifications obtained before 1999. The NLRD data were accordingly augmented with information from the Department of Education’s SAPSE system. The analysis of the SAPSE data was commissioned by SAQA. All information is published with their permission. 47
The NLRD contains information on individuals with all their educational achievements. Availability was determined by considering each individual’s highest qualification in the particular field of study. Individuals were consequently not counted more than once. 48
The numbers of graduates reflected in Figures 3.2 to 3.9 refer to the total number of individuals under the age of 65 who had obtained a degree or diploma at a public higher education institution in South Africa prior to or during 2004. The NLRD does not contain up-to-date information on emigration, mortality or labour market participation. The numbers therefore do not refer to the actual number of people who are available for work.

Fasset Sector Skills Plan 2005 – 2010 Update for the 2009/2010 Financial Year
Final 11 August 2008 32
Figure 3-3 Number of public HET graduates in commerce, business management and business administration by highest level of education
0
20 000
40 000
60 000
80 000
100 000
120 000
140 000
160 000
1 994 67 078 18 384 10 302 757
1 999 109 939 32 780 15 063 894
2 004 151 615 54 777 22 570 1 013
Level 6 Level 7 Level 8 Above Level 8
Figures 3.4 and 3.5 illustrate the total growth in the number of graduates in accounting and in commerce, business management and business administration. In the accounting field, the total number of graduates increased by 8.5% per year from 29 590 graduates in 1994 to 67 052 graduates in 2004. Over the same decade, the growth in graduates in commerce, business management and business administration was 9.1% per year and the total pool of graduates increased from 96 521 in 1994 to 229 975 in 2004.
The figures also show the pace at which the population group distribution of graduates had been changing. In 1994, 85% of all graduates who had majored in accounting were white and only 3% were African, 2% were coloured and 7% were Indian. By 1999, African graduates had increased their share to 11%, coloureds to 4% and Indians to 10%. In 2004 62% of the pool of accounting graduates was white, while the proportion of Africans increased to 22%. In the more general field of commerce, business management and business administration, the pace of change has been somewhat slower, although from a higher basis than accounting, with the proportion of African graduates increasing from 7% of graduates in 1994 to 24% in 2004.
Figure 3-4 HET accounting graduates by population group: 1994 - 2004
1994 1999 2004
White
85%
Coloured
2%
Indian
7%
Unknown
3%
African
3%
White
73%
Indian
10%
Coloured
4%
African
11%
Unknown
2%
White
63%
Indian
10%
Coloured
4%
African
22%
Unknown
1%
African 1 003 5 452 14 723
Coloured 635 1 760 2 925
Indian 2 217 4 767 6 817
White 24 923 35 027 41 665
Unknown 812 920 922
Total 29 590 47 926 67 052

Fasset Sector Skills Plan 2005 – 2010 Update for the 2009/2010 Financial Year
Final 11 August 2008 33
Figure 3-5 HET graduates in commerce, business management and business administration by population group (excluding accounting):1994 - 2004
1994 1999 2004
White
80%
Unknown
6%
African
7%Coloured
3%
Indian
4%
White
70%
Indian
6%
Coloured
4%
African
16%Unknown
4%
White
62%Indian
7%
Coloured
4%
African
24%
Unknown
3%
African 6 282 25 122 54 490
Coloured 2 462 5 565 9 617
Indian 4 139 9 146 16 938
White 77 904 112 147 142 079
Unknown 5 734 6 696 6 851
Total 96 521 158 676 229 975
Figures 3.6 and 3.7 illustrate the pace at which the gender distribution of graduates had been changing. In 1994, only 20% of all graduates who majored in accounting were female. By 1999, female graduates had increased their share to 30% and in 2004 38% of the pool of accounting graduates was female.
In the field of commerce, business management and business administration, the female graduates’ share increased from 20% in 1994 to 38% in 2004.
Figure 3-6 HET graduates in accounting by gender: 1994 - 2004
38%
30%
20%
62%
70%
80%
0
5000
10000
15000
20000
25000
30000
35000
40000
45000
1994 1999 2004
Female 5 962 14 527 25 193
Male 23 627 33 399 41 859
Total 29 589 47 925 67 051

Fasset Sector Skills Plan 2005 – 2010 Update for the 2009/2010 Financial Year
Final 11 August 2008 34
Figure 3-7 HET graduates in commerce, business management and business administration by gender (excluding accounting): 1994 – 2004
41%
36%
31%
59%
64%
69%
0
20000
40000
60000
80000
100000
120000
140000
160000
1994 1999 2004
Female 29 554 57 568 93 943
Male 66 966 101 107 136 031
Total 96 520 158 675 229 974
3.4 THE FORMATION OF NEW SKILLS FOR THE SECTOR
This section describes the various routes through which learners can enter the sector and the providers of education and training including a detailed description of the professional bodies that are active in the sector.
3.4.1 Entry routes into the sector
The formation of new skills for the sector takes many forms, and several routes are available to those who want to work permanently in the sector. The routes that can be followed are as follows: a) Direct entry from school into the labour market A relatively small proportion of the workers in the sector enter the labour market after school without any further education or training. The educational profile of the sector shows that very few workers have qualifications lower than Grade 12 or matric. These workers are employed mainly in elementary occupations. Workers with Grade 12 are employed largely in clerical or administrative positions. b) Entry after school via learnerships Various learnerships in the sector have Grade 12 or matric as an entry-level requirement. These learnerships prepare workers for clerical and administrative positions or as technicians and associated professionals. c) Entry via the higher education system with national qualifications Many workers enter the sector after completion of a degree or diploma at a public or private higher education institution. The qualifications gained along this route are the standard higher education qualifications (typically diplomas and degrees).

Fasset Sector Skills Plan 2005 – 2010 Update for the 2009/2010 Financial Year
Final 11 August 2008 35
d) Entry via the higher education system with professional qualifications Several of the professional associations offer professional qualifications, some of which are internationally recognised. Preparatory education for the qualifying examinations is offered by some of the public as well as private higher education institutions while the qualifying examinations are generally set by the professional bodies. e) Entry via the higher education system with national qualifications, followed by a
learnership and a professional qualification Some of the higher level professional qualifications can be obtained only after acquiring a national qualification or qualifications (e.g. a B.Com. (Honours) degree), after the completion of a learnership and after passing a qualifying examination set by the professional body. This route is the one followed by specialised professionals such as chartered accountants and professional accountants.
3.4.2 Providers of education and training
The main groups of providers of education and training at entry level are the formal school system, universities, technikons, private FET and HET institutions, professional bodies and employers. The roles that each of these groups play, and the most important qualifications offered by them, are discussed below.
a) Schools49 The number and academic ability of new entrants into the labour market and into the higher education system are determined by the Senior Certificate examination results. Of particular importance to this sector are the pass rates in mathematics as this subject is a prerequisite for most of the study fields relevant to the sector. In 2006 (2005)50, a total of 528 525 (508 636) learners sat the Senior Certificate examination. Of the full-time candidates with six or more subjects, 66.6% (68.3%) passed the examination – 16.3% (17.0%) with matriculation exemption and 50.3% (51.3%) without exemption (Figure 3.8)
49 Information for this section was obtained from the following publications :
Department of Education. 2008. Education Statistics in South Africa 2006 Department of Education. 2006. Education Statistics in South Africa at a Glance in 2005 Department of Education. 2005. Education Statistics in South Africa at a Glance in 2004 Department of Education. 2005. Education Statistics in South Africa at a Glance in 2003 Department of Education. 2004. Education Statistics in South Africa at a Glance in 2002 Department of Education. 2003. Education Statistics in South Africa at a Glance in 2001 Department of Education. 2002. Education Statistics in South Africa at a Glance in 2000 (http://www.education.gov.za/emis 50
2005 results in brackets

Fasset Sector Skills Plan 2005 – 2010 Update for the 2009/2010 Financial Year
Final 11 August 2008 36
Figure 3-8 Senior Certificate passes: 2006
Failed 34%
Passed with
exemption 16%
Passed without
exemption 50%
Source: Department of Education, Education Statistics in South Africa at a 2006
Of all the candidates who wrote the examination, 317 642 (303 152) wrote mathematics, with only 7.9% (8.7%) of all the learners passing it at the higher grade and 34.8% (37.0%) passing at the standard grade. The low number of mathematics passes severely limits the pool of candidates for study in accounting and related fields. Figure 3.9 shows that the percentage of learners that passed mathematics on higher grade did not change much since 1999.
Figure 3-9 Senior Certificate passes in mathematics: 1999 - 2006
0.0
5.0
10.0
15.0
20.0
25.0
30.0
35.0
40.0
45.0
Percentage of passes in
mathematics HG
7.1 6.9 7.4 7.9 9.1 8.7 8.7 7.9
Percentage of passes in
mathematics SG
28.3 30.3 29.6 38.8 40.5 39.7 37.0 34.8
1999 2000 2001 2002 2003 2004 2005 2006
Source: Department of Education, Education Statistics in South Africa at a Glance in 2000, 2001, 2002, 2003, 2004, 2005,2006

Fasset Sector Skills Plan 2005 – 2010 Update for the 2009/2010 Financial Year
Final 11 August 2008 37
Although accounting at school level is not necessarily a requirement for entry into the accounting field, the Senior Certificate passes in accounting give an indication of learners’ interest in the subject and of the general achievement in a field that requires a high level of numeracy. Bookkeepers can also come from learners with grade 12 accounting. The number of learners who wrote accounting was much lower than the number who wrote mathematics, but pass rates in this subject were higher. In 2006, a total of 165 081 (162 856) learners wrote accounting; 14.8% (16.0%) passed at the higher grade and 59.4% (61.2%) at the standard grade. Figure 3.10 shows that, similar to mathematics, the percentage of learners that passed accounting did not change much since 1999.
Figure 3-10 Senior Certificate passes in accounting: 1999 - 2006
0.0
10.0
20.0
30.0
40.0
50.0
60.0
70.0
Percentage of passes in
accounting HG
16.5 16.4 16.3 16.1 17.7 17.3 16.0 14.8
Percentage of passes in
accounting SG
39.6 48.1 58.5 58.1 65.4 62.3 61.2 59.4
1999 2000 2001 2002 2003 2004 2005 2006
Source: Department of Education, Education Statistics in South Africa at a Glance in 2000, 2001, 2002, 2003, 2004, 2005, 2006 The flow of learners through the higher education system and the entry of Grade 12’s into the labour market are also affected by the English language proficiency developed at school level. A general problem experienced by higher education institutions is that non-English speaking learners do not have the language skills needed to master the academic content. Similarly, many employers state that learners do not have the language skills required in the labour market. 51
b) Public FET and HET Institutions Universities All the universities, except Medunsa, provide training in the broad area of business, commerce and management sciences. The fields of study most relevant to the sector are accounting, cost and management accounting, financial accounting, business and financial management, auditing, financial information systems and taxation. Business schools based at some of the universities offer postgraduate programmes in business administration.
Figure 3.11 shows the qualifications awarded by public higher education institutions in business, commerce and management sciences according to NQF level from 1995 to 2004. The
51
Human Sciences Research Council, Skills Development in the Financial and Accounting Sector, Fasset, Johannesburg, October 2002.

Fasset Sector Skills Plan 2005 – 2010 Update for the 2009/2010 Financial Year
Final 11 August 2008 38
number of graduates in this field increased on average by 8.4% a year. The data show that people tend to stay longer in the HET system while the number of people with postgraduate qualifications is increasing. For example, NQF level 7 qualifications, which included four year first degrees e.g. BTech degrees and honours degrees, showed the highest average growth over the review period. The average growth rate of NQF level 8 and above qualifications was higher than that of NQF level 6 qualifications.
Figure 3-11 Qualifications awarded by the public HET sector in business, commerce and management sciences according to NQF level: 1995-2004
0
5000
10000
15000
20000
25000
30000
NQF level 6 9745 10624 11081 12819 13259 13092 14321 15998 17299 18745
NQF level 7 3637 4114 5944 5816 5682 6167 6955 7883 8338 8957
NQF level 8 944 687 1001 1234 1335 1526 1679 1773 1867 1921
Above NQF level 8 38 41 44 56 34 31 31 51 80 79
Total 14363 15466 18070 19925 20310 20816 22986 25705 27584 29702
1995 1996 1997 1998 1999 2000 2001 2002 2003 2004
Source: Calculated from NLRD database, SAQA
Tables 3.2 and 3.3 show the number of qualifications that was awarded in the study fields of accounting and commerce, business management and business administration from 1995 to 2004. Over the ten-year period, the annual number of accounting graduates who completed their degrees was lower than the number of graduates in commerce, business management and business administration but the average annual growth rate in accounting (11%) over the period was higher than in commerce, business management and business administration (7%).
In accounting, the highest average growth in qualifications awarded since 1995 occurred at NQF levels 6 and 7. These levels include qualifications such as three and four year first degrees, national diplomas and honours degrees.
Table 3-2 Qualifications awarded by public HET sector in the study field Accounting according to NQF level: 1995-2004
NQF level 1995 1996 1997 1998 1999 2000 2001 2002 2003 2004
Average annual growth
rate (%)*
NQF level 6 1418 2094 2256 2081 2406 1989 2507 2575 3008 4009 12
NQF level 7 1095 1394 2231 2094 1910 1959 1821 1846 2201 2754 11
NQF level 8 911 658 924 1140 1206 1419 1580 1668 1763 1823 8
Above NQF level 8 38 41 44 51 24 27 21 47 62 62 6
Total 3461 4186 5456 5366 5546 5394 5929 6136 7034 8648 11
Source: Calculated from NLRD database, SAQA

Fasset Sector Skills Plan 2005 – 2010 Update for the 2009/2010 Financial Year
Final 11 August 2008 39
In the study field commerce, business management and business administration the highest average growth in qualifications awarded occurred at NQF level 7. Level 7 qualifications include four year first degrees, national higher diplomas and honours degrees. Table 3-3 Qualifications awarded by the public HET sector in the study field Commerce and Business Management and Business Administration according to NQF level: 1995-2004
NQF level 1995 1996 1997 1998 1999 2000 2001 2002 2003 2004
Ave annual growth
(%)*
NQF level 6 7375 8459 8724 10553 8874 9113 9547 10973 11970 12103 8
NQF level 7 2113 2515 3259 3349 3272 3764 4663 5410 5514 5312 11
NQF level 8 911 658 924 1140 1206 1419 1580 1668 1763 1823 8
Above NQF level 8 38 41 44 51 24 27 21 47 62 62 6
Total 10437 11673 12950 15093 13376 14323 15811 18098 19309 19300 7
Source: Calculated from NLRD database, SAQA
Projection of new entrants from the public HET sector Figure 3.12 shows the number of new graduates who qualified between 1995 and 2004, and the number that will qualify per annum if the average annual growth rate is sustained. The HET sector could produce as many as 283 700 new graduates in the fifteen-year period 1995 to 2010. This projection however depends on a number of factors, these include; the capacity of the HET sector to sustain this level of growth and the Department of Education’s (DoE) subsidisation of the HET sector.

Fasset Sector Skills Plan 2005 – 2010 Update for the 2009/2010 Financial Year
Final 11 August 2008 40
Figure 3-12 Actual and projected entry-level qualifications in business, commerce and management sciences from the public HET sector
0
2000
4000
6000
8000
10000
12000
14000
16000
18000
20000
Year
Nu
mb
er
of
can
did
ate
s
National diploma 3589 4667 4567 5632 3826 3773 4183 4498 4715 5560 5837 6128 6434 6754 7091 7445 7816
Three year first degree 5204 5886 6413 7003 7454 7329 7871 9050 10263 10552 11414 12347 13356 14447 15627 16904 18286
Four year first degree (incl BTech) 510 986 1193 1085 1117 1266 1505 1607 1776 2228 2624 3091 3642 4290 5053 5952 7011
1995 1996 1997 1998 1999 2000 2001 2002 2003 2004 2005* 2006* 2007* 2008* 2009* 2010* 2011*
Sources: Calculated from NLRD database, SAQA and own projections from 2005 to 2011.
*Figures projected, using the average annual growth rate observed for the period 1995 to 2004
c) Private FET and HET institutions
Private institutions offering higher education must register with the DoE in accordance with the Higher Education Act ,1997 (Act No 101 of 1997). On 1 March 200752, 79 private higher education and training institutions were registered with the Department of Education. A further 16 institutions were provisionally registered i.e. they had not fulfilled all the requirements for registration but the registrar believed that they would be able to fulfil the requirements within the period stipulated. These institutions offer mainly certificates and diplomas that fall within Levels 5 and 6 on the NQF. Nineteen of the currently registered private institutions provide training relevant to the Financial and Accounting Services sector. Further Education and Training (FET) refers to education and training provided from Grades 10 to 12 (NQF level 2 to 4). Private institutions offering FET programmes must also register with the DoE in accordance with the FET Education and Training Act ,1998 (Act No 98 of 1988). There were 72 private higher education institutions registered with the Department of Education as at 20 September 2007, while 14 enjoyed provisional registration and were afforded stipulated time periods within which to meet all the regulatory requirements.53 d) Professional bodies
The roles that professional bodies play in the provision of education and training to the sector differ from organisation to organisation. The most common functions performed by these bodies are the setting of educational standards, the development of curricula for the qualifications they award, the provision of training, the accreditation of training institutions that wish to offer their courses and qualifications, the setting of examinations, the administration of examinations and the awarding of qualifications.
52
Department of Education 2007. Register of Private Higher Education Institutions Last update 1 March 2007. <http://www.education.gov.za/dynamic/dynamic.aspx?pageid=3268&dind=47> 53
Register of Private Higher Institutions at www.education.gov.za

Fasset Sector Skills Plan 2005 – 2010 Update for the 2009/2010 Financial Year
Final 11 August 2008 41
e) Employers
Employers play a crucial role in the formation of entry-level skills in the sector. As indicated above, most of the professional qualifications are attained through learnerships, and most of those that are not currently linked to learnerships require a certain amount of workplace experience. Employers’ roles are therefore to provide the workplace exposure and mentorship needed by new entrants to the sector.
By June 2008, 21 learnerships had been registered by Fasset with the Department of Labour. Table 3-4 shows the number of people who have completed learnerships since the inception of the learnership system in 2000 until June 2007. The total number of learnerships completed was 11 926. Almost all (99.4%) of these learnerships were at NQF level 7, and most of them led to the qualification Chartered Accountant: Auditing.
Table 3-4 Learnerships completed from 2000 to 2007
Learnership Name
Completed
N %
Chartered Accountant: Auditing (Level 7) 11 286
Chartered Accountant: Financial Management Specialism (Level 7) 414
Professional Qualification: Chartered Certified Accountant (Level 7) 6
Professional Qualification: Chartered Management Accountant (Level 7) 4
Postgraduate Diploma: Professional Accountant in Practice (Level 7) 146
Total Level 7 11 856 99.4
National Certificate: Business Accounting (Level 5) 2
Diploma: Public Sector Accounting (Level 5) 11
National Diploma: Technical Financial Accounting (Level 5) 2
Total Level 5 15 0.1
Certificate: Public Sector Accounting (Level 4) 49
National Certificate: Small Business Financial Management (Level 4) 2
Certificate for Registered Bookkeeper (Level 4) 2
Total Level 4 53 0.4
Certificate for Registered Accounting Clerk (Level 3) 2
Total Level 3 2 0.02
TOTAL 11 926 100.0 * Figures include only learners registered in Fasset’s sector. It should, however, be noted that some of the learnerships registered with Fasset are specifically designed for the development of skills in government and in commerce and industry. These learners will be registered mainly in other sectors. Source: Fasset Sector Study, 2007.
A critical element in the successful implementation of learnerships is employers’ readiness to take on learners. This, in turn, is a function of various factors including employers’ knowledge of learnerships in general and the availability of specific learnerships; their knowledge of and perspectives on the possible benefits associated with learnerships; their perceptions of the administrative processes involved in learnerships; and their perceptions of the inputs that they, as role players, would have to contribute.
Fasset’s research on the need for strategic learnerships in the sector revealed that organisations differ vastly in their readiness for learnerships. At the one end of the spectrum are organisations that are well informed about the concept, that are already involved with learnerships and that are ready to become involved in new and “non-traditional” learnerships. At the other end, are organisations that are totally unfamiliar with the concept or that are vaguely familiar with it but are uninformed about the benefits such as tax concessions and learnership grants. A particular challenge to the sector is to get more small firms involved in learnerships, especially the newly registered learnerships.
Another way in which employers contribute to skills development in the sector is by making bursaries available. In 2003/2004, over 1 500 black learners or learners with disabilities had received some sort of financial assistance for their studies from employers. Financial assistance for these candidates was offered from one year to as many as four years depending on the length of the course. Some of the recipients of these bursaries would find employment in the organisation

Fasset Sector Skills Plan 2005 – 2010 Update for the 2009/2010 Financial Year
Final 11 August 2008 42
after graduation while others benefited from the work experience, which equipped them for future employment opportunities.54
3.5 DEVELOPMENT OF SKILLS OF THE EXISTING WORKFORCE
Continuous education and training of the workforce in the sector is essential because of the ongoing changes in the legislative and policy environment as well as the changes in financial practices and in computer technology. Chapter 2 covered the relatively high turnover and the need to replace people who have left the sector. The development of the skills of the workforce beyond entry-level skills is consequently a prerequisite for the successful functioning of organisations and individuals in the sector.
The main providers of this training are employers themselves, private training institutions and training consultants, professional bodies, and universities and technikons. The extent to which employers engage in the training and development of their workers (either directly through their own training divisions and programmes or indirectly through outsourced training opportunities) is reflected in the annual training reports submitted to Fasset.
In the 2006/2007 ATRs employers reported that almost 40 000 of their employees had received training in that year. The people who were trained constituted 70% of all employees.
Table 3-5 Beneficiaries of training: 2006/2007 according to occupational category
Occupational Group Total
employed Total
trained %
% of employed
trained
Legislators, Senior Officials, Managers & Owner Managers
8 319 4 952 12 60
Professionals 10 980 7 910 20 72
Technicians & Associate Professionals
16 256 13 951 34 86
Clerical & Administrative Workers 16 754 11 656 29 70
Service & Sales Workers 2 259 886 2 39
Skilled Workers, Craft & Related Trades
440 98 0 22
Plant & Machine Operators and Assemblers
429 213 1 50
Labourers & Elementary Occupations 1 517 77770 2 51
Total 56 954 39 666 100 70
Source: Fasset, Analysis of Grant Submissions 2006/2007
3.6 CONCLUSIONS
The analysis presented in this chapter indicates that the sector is served by a well-established and diversified education and training system that spans all the components of the public and private education sectors, professional bodies and employers. The qualifications available to the sector range from NQF Level 3 to Level 8 – with learnerships registered at each level.
Despite the relatively low percentage of matric exemptions and the limited numbers of learners who pass matric with mathematics as a subject, the output of universities in the fields of accounting and commerce, business management and business administration has grown consistently over the past decade.
The overall impression gained from the surveys that preceded the SSP development is that the provision of education and training to the sector is comprehensive and generally of a high standard. In fact, the education and training available in South Africa is of world-class standard; hence the fact that South African professionals are sought after in the international market. The role that the professional bodies play in maintaining these standards should not be underestimated.
54 Fasset, Analysis of Grant applications Year 4 (2003/4).

Fasset Sector Skills Plan 2005 – 2010 Update for the 2009/2010 Financial Year
Final 11 August 2008 43
Despite an overall positive picture of education and training, the sector is faced with the realities of too few learners from the previously disadvantaged groups moving up to the higher professional qualification levels. The challenge is accordingly to remove all unnecessary obstacles and to maximise support for these individuals in order to alleviate the problem in the short to medium term.
Fasset Sector Skills Plan 2005 – 2010 Update for the 2009/2010 Financial Year
Final 11 August 2008 44
4 SCARCE SKILLS AND CRITICAL SKILLS IDENTIFICATION
4.1 INTRODUCTION
This chapter looks at skills needs in the sector with specific reference to scarce and critical skills. The concept of scarce skills refers to a shortage of people with the required attributes to fill positions available in the labour market. The attributes that employers are seeking when they try to fill positions in their organisations are specifically important. These may be qualifications, specific skills and experience, a specific race or gender, or a combination of these attributes.
The term “critical skills” refers to particular skills required for a particular occupation,55 or the qualitative deficiencies that may exist or develop in the skills apparatus of the existing workforce. Critical skills needs may exist because of insufficient education and training before people enter the labour market or they may develop as a result of external factors such as changes in legislation, changes in the business environment, or technological changes. Critical skills can be grouped into key or “generic” skills and “top up” skills. The chapter starts with a summary of certain of the demand and supply issues that have a direct influence on the scarcity of skills. This is followed by a discussion of scarce skills and then of critical skills in the sector.
4.2 GROWTH IN DEMAND
The legislative and policy changes that have a bearing on corporate governance and financial and accounting practices in the public and private sectors mostly tend to stimulate the demand for the financial services offered by the Financial and Accounting Services Sector. An important exception is the proposed changes to the Companies’ Act that will impact on small organisations’ need for accounting and auditing services. This, in turn, may slow down the growth in the demand for accounting and auditing services and consequently the demand for labour in this sector. The effect of these changes will probably start to impact on the sector in the next year or two.
The demand for financial services is also driven by the positive economic growth experienced in South Africa over the last number of years. The demand model developed for the sector indicates that new employment opportunities can be expected to increase by between 3 800 and 4 500 annually until 2013. These opportunities will occur in all employment categories, but the largest growth will be in the professionals and technicians categories.
A particular challenge for the sector is to replace people who have moved out of the sector. One occupational group with a very high replacement demand is the accounting profession – more specifically trainee accountants. This replacement demand is a result of the occupational structure that has developed over time and the specific roles played by trainee accountants in the sector. The professional learnerships in accounting are relatively long (approximately three years) and the trainees who enter these learnerships are graduates – many already have honours degrees. Thus, in many accounting firms the bulk of the para-professional work is done by trainee accountants and the learnership positions have become a permanent component of the occupational structure of the sector. In some of the accounting and auditing firms learners constitute as much as twenty percent or more of the total workforce. However, it is widely accepted that most learners will leave the firms in which they trained after completion of their learnerships to find employment elsewhere. In the firms they are replaced by new learners. Many learners leave the sector altogether to become financial professionals and managers elsewhere in the economy. This leaves the
55
Department of Labour, Framework for Identifying and Monitoring Scarce Skills, 2005.
Fasset Sector Skills Plan 2005 – 2010 Update for the 2009/2010 Financial Year
Final 11 August 2008 45
Financial and Accounting Services Sector with the responsibility to train more learners than only those needed for the sector’s own professional positions.
The loss of skilled personnel is not limited to the local labour market – permanent emigration and temporary employment abroad are causing a substantial drain of people with financial skills. The demand for financial professionals from historically disadvantaged groups is also high if the population group distribution across occupations in Chapter 1 is considered.
4.3 GROWTH IN SUPPLY
If one looks at the output of the higher education sector, it seems as if the supply of skills is growing at a sufficient pace to keep up with the growth in demand. However, the Financial and Accounting Services Sector is by no means the only sector that is drawing from this skills pool. At this stage, little information is available on the demand for financial skills in the total economy. A direct comparison cannot therefore be made between demand and supply. Another key question is whether the higher education system will be able to sustain its growth, especially in the midst of the current restructuring of the sector and the changed subsidy formulas applied by the Department of Education.
The increase in the numbers of black graduates in the general fields of commerce, business management and business administration should to some extent ease the pressure on the sector to change its racial profile. However, the change in the specialised field of accounting is slower and requires more focused attention. As this problem has its roots in the school system, especially in the number and quality of matric passes in mathematics, it should be addressed from this level and upwards.
Professional qualifications are highly valued and sought after in the Financial and Accounting Services Sector. For certain functions (e.g. the audit function), professional qualifications are a prerequisite. The pace at which professionals qualify is therefore a critical issue in the supply side of the market.
At this stage, Fasset has registered 21 learnerships many of which link up with the professional qualification structure. The registered learnership contracts are, however, largely limited to the chartered accountant learnership. Although the training of these professionals is crucial, the number of learners in all the learnerships has to be increased.
Figure 4.1 shows the number of new learnership registrations and the number of learners who qualified over the six-year period from 2002/2003 to 2006/2007. The number of new learnership registrations increased substantially in the 2005/2006 financial year, but most of these learners will only qualify in three years’ time. The change in the racial profile of learners is also relatively slow. In 2001/2002, 29% of the learners registered with Fasset were black, and, by June 2007, this figure had increased to 45%.

Fasset Sector Skills Plan 2005 – 2010 Update for the 2009/2010 Financial Year
Final 11 August 2008 46
Figure 4-1 New learnerships registered and learnerships completed 2002 to 2007
0
500
1 000
1 500
2 000
2 500
3 000
3 500
4 000
4 500
5 000
2001/2002 2002/2003 2003/2004 2004/2005 2005/2006 2006/2007*
New learnerships registered Learnerships completed
Source: Fasset learnership registration system
*Total figures not available at the time of submitting this SSP update
4.4 SCARCE SKILLS
In the assessment of scarce skills it is important to consider different labour market signals. The most obvious signals that are indicative of shortages in a particular occupation are:
Difficulties experienced by employers to retain employees in the occupation due to external demand and competition among employers to attract scarce skills;
Difficulties experienced by employers to recruit people into positions, which results in vacancies that remain unfilled over a prolonged period of time;
Upward pressure on remuneration; and
No spare capacity in the form of unemployed people who can fill positions in the particular occupations.
The issue of scarce skills was explored in great depth in the Fasset Sector Study conducted in 2007. In this study a short list of scarce skills was compiled by looking at a combination of labour market signals. In the end the factor that determined the inclusion of an occupation in the list was a long-term vacancy rate of 5% or higher. The occupations identified as ones experiencing skills shortages and the signals indicating shortages are summarised in Table 4-1. The table shows the OFO Codes, the occupation names, estimated employment in each occupation in 2007, whether retention problems were reported by employers, the vacancy rates, and whether employers reported that there was upward pressure on salaries (i.e. people were demanding more than employers could afford to pay). The combination of signals gives an indication of the validity of the claim that there is a shortage of people suitable for certain occupations and of the magnitude of the problem. The table shows that shortages exist in four broad areas: accounting, human resources management and development, information technology, and economics and statistics. Shortages of accounting skills exist at all levels – from bookkeeper to registered auditor.

Fasset Sector Skills Plan 2005 – 2010 Update for the 2009/2010 Financial Year
Final 11 August 2008 47
Table 4-1 Occupations in which skills shortages are experienced
OFO Code Occupation Employment
2007* Retention problems
Vacancy Rates**
Upward pressure
on salaries
MANAGERS
135 Information and Communication Technology (ICT) Managers
135102 ICT Project Manager 190 √ 5.9
PROFESSIONALS
221 Accountants, Auditors and Company Secretaries
221100 Trainee Accountant 13 910 √ 6.1 √
221101 Accountant (General) 13 300 √ 6.1 √
221203 External Auditor 2 880 √ 15.9 √
221204 Internal Auditor 580 8.3
223 Human Resource and Training Professionals
223101 Human Resource Advisor 110 7.3
223301 Training and Development Professional
260 5.9
224 Information and Organisation Professionals
224103 Statistician 30 20.9
224301 Economist 40 √ 60.7 √
261 Business and Systems Analysts, and Programmers
261102 Systems Analyst 470 √ 31.1
261303 Software Engineer 160 6.3
CLERICAL AND ADMINISTRATIVE WORKERS
551 Accounting Clerks and Bookkeepers
551101 Accounting Clerk 730 √ 6.7
551201 Bookkeeper 4 230 √ 6.5 √
591103 Purchasing Officer 120 14.0
SALES WORKERS
611201 Insurance Agent 110 6.4
*Estimated on the basis of the employee information provided by employers who participated in the survey, rounded to the nearest 10 **Long-term vacancies reported by employers as a percentage of estimated employment Source: Fasset Sector Survey, 2007
It must be noted that the first four professional occupations – trainee accountant, accountant, external auditor, and internal auditor – are closely related and that people who were counted as accountants might have been registered auditors as well. Therefore, the total employment figures should actually be considered together. Furthermore, these four occupations draw from the same pool of people and from all the evidence obtained in the sector survey it is clear that the pool is not sufficient to satisfy the market demand.
General accountants include all accountants at a professional level and these positions can be filled by people with BCom Accounting degrees and honours degrees or by people who are full members of the professional bodies such as ACCA, CIMA, SAICA or SAIPA. The qualitative information provided by employers showed that in this occupation shortages are experienced across all levels but are more acute at the high end of the occupational spectrum – i.e. among professionally qualified accountants (chartered accountants, specifically). Only chartered accountants can act as external auditors and, therefore, the high vacancy rate in that occupation also confirms the shortage of chartered accountants. One of the respondents who represented a large auditing firm summarised the situation by saying “there is currently a war in the market for qualified chartered accountants”.
The identification of skills shortages at the level of bookkeeper and accounting clerk – occupations that are typically filled with people with qualifications at NQF levels 4 and 5 – is

Fasset Sector Skills Plan 2005 – 2010 Update for the 2009/2010 Financial Year
Final 11 August 2008 48
relatively new to the Financial and Accounting Services Sector. Previous research did not provide clear indications of shortages at this level. It might seem unlikely that these shortages may exist, if the high unemployment rates among matriculants in South Africa are considered. However, employers reported shortages in this occupation and the professional bodies and training providers who participated in the survey confirmed these. Matriculants are clearly not fully equipped to fill these positions but need to develop more specialised accounting skills.
In Annexure A a more comprehensive list of scarce skills is provided as required by the DoL. That list includes all the occupations that employers identified as occupations in which they had vacancies that they could not fill.
4.5 CRITICAL SKILLS IN DEMAND
The people working in the Financial and Accounting Services Sector, especially professionals have a constant need for skills development and therefore critical skills (as currently defined by the DoL) will probably always exist among a large proportion of the employees in the sector. These needs emanate from some of the factors discussed in Chapter 1 of this SSP. For example, it is imperative for many of the professionals to stay abreast of changes in the tax legislation and other changes in the tax regime, changes in financial reporting practices and requirements and new computer software. Some of the critical skills also stem from insufficient training prior to entering the labour market.
Organisations that participated in the Fasset Sector Study were asked to indicate if their staff experienced any critical skills needs. Only 18.4% of the small organisations (those employing fewer than 50 people) were of the opinion that there were critical skills needs in their organisations. A slightly higher percentage (29.6%) of the organisations that employed between 50 and 149 employees identified critical skills needs, and 61.7% of the large organisations did so. A total of 15 557 employees (13.3% of the existing workforce) in the sector need training (Table 4-2). Of these 2 949 are managers and 7 850 professionals, constituting respectively 16.9% of managers and 17.7% of professionals in the sector. Almost a tenth of clerical and administrative workers need additional training. Typical areas in which skills in all or most of the occupational categories are lacking are information technology, legislation and problem solving. Table 4-2 Critical skills by occupational category and area of training
Employees who need training
Area of training
Occupational category
N
Man
ag
em
en
t
Lead
ers
hip
Clien
t S
erv
ice
Fin
an
ce (
sp
ecia
list
level)
Info
rmati
on
Tech
no
log
y
Su
pp
ort
an
d
Ad
min
istr
ati
on
Leg
isla
tio
n (
ch
an
ges)
Co
mm
un
icati
on
Team
wo
rk
Pro
ble
m S
olv
ing
Mark
eti
ng
Managers 2 949
Professionals 7 850
Technicians and Trades workers
554
Clerical and Administrative workers
3 713
Sales workers 99
Elementary workers
392
Total 15 557 Source: Fasset Sector Survey, 2007

Fasset Sector Skills Plan 2005 – 2010 Update for the 2009/2010 Financial Year
Final 11 August 2008 49
Respondents from the professional bodies and training providers were of the opinion that young people (even though they might be professionally qualified) enter the labour market without the required level of work readiness. In other words, critical skills already exist at the point of entry. A few of the bodies remarked that, in general, accountancy training is very narrow in focus and covers mainly technical aspects. However, new entrants to the labour market require a wide range of skills in order to adapt to and progress in their respective careers. The critical skills needs of new entrants to the labour market fall into different categories:
The need to understand and apply the fundamental technical skills in the correct context;
Assertiveness and personal confidence to access employment opportunities and network and market themselves;
Personal and life skills to handle work pressures and manage their personal affairs;
Professional behaviour and office etiquette in order to establish professional interaction with superiors, subordinates and clients; and
Computer skills and information management skills.
Short-course providers and HET institutions emphasised the fact that the public sector had significant finance and accounting skills needs because sub-developed numeracy and language skills were carried over into the workplace from the FET and HET levels. One provider of accounting training for employed adults that regularly conducts pre-course tests on accounting clerks in the public sector to determine the point of departure for each course found that the accounting clerks generally have the numeracy skills of grade 4 learners. Many respondents recommended that skills development interventions in the public sector should include skills for administration clerks, accounting clerks, and officers at lower-operational levels. Specific training is required in public sector accounting standards and accounting practice, especially for people entering the public sector for the first time.
4.6 CONCLUSIONS
The Financial and Accounting Services Sector has to ensure a sufficient number of new entrants into the labour market, address skills shortages and prevent skills gaps from occurring. Interventions to address skills shortages or scarce skills have to be aimed at three levels: a) School level The provision of a sufficient number of new entrants into the labour market starts at school level. Schools have to produce enough matriculants with endorsements and with mathematics and accounting as subjects.
b) Tertiary education level At the tertiary education level, access to the higher education system has to be ensured and unnecessary institutional constraints have to be reduced so as to provide a sufficiently large pool of graduates (especially in the specialised field of accounting) who can take up professional and technical positions in the financial services field.
c) Professional level
At a third level, it is also essential to increase the number of people in learnerships who can obtain the professional qualifications and designations required in the sector.
Critical skills gaps are generally the result of insufficient training prior to entry into the
labour market, technological changes, and legislative and policy changes to which the sector is exposed on an ongoing basis. Skills gaps can occur across the whole spectrum of functions performed in the sector and can affect all levels and categories of workers. However, typical areas

Fasset Sector Skills Plan 2005 – 2010 Update for the 2009/2010 Financial Year
Final 11 August 2008 50
in which skills in all or most of the occupational categories are lacking are information technology, legislation and problem solving.

Fasset Sector Skills Plan 2005 – 2010 Update for the 2009/2010 Financial Year
Final 11 August 2008 51
5 SMALL BUSINESS, ENTREPRENEURIAL OPPORTUNITIES AND OTHER NSDS PRIORITIES
5.1 INTRODUCTION
This section covers those issues related to the NSDS indicators for 2005 to 2010 that do not directly concern scarce or critical skills in the sector, namely, small business opportunities, support for small levy-paying and non-levy-paying firms, ABET, the National Standard of Good Practice and stakeholder capacity building.
5.2 SMALL BUSINESS OPPORTUNITIES
It is the NSDS objective to assist new entrants to the labour market, create self-employment and develop entrepreneurs. Fasset has to identify specific opportunities in the sector for small businesses that can lead to job creation and poverty alleviation.
As part of its implementation plan, Fasset supports strategic interventions that lead to new employment opportunities in the labour market and that provide new entrants with the skills for self-employment. These operations include learnerships, social development projects funded by Fasset and Fasset’s strategy for supporting new BEE firms.
On completion of Fasset learnerships (specifically those offered through SAICA and SAIPA), learners can open their own firms and practise as registered professionals. For example, once learners have completed their qualification through SAICA, they are registered as SAICA members with the designation CA (SA) and obtain a professional licence from IRBA. With this specific designation and professional practicing licence, graduates can establish their own accountancy practices in the sector. Many of these learnerships such as the Chartered Accountant: Audit Specialism and the Commercial and Financial Accountant: Public Practice offer modules on practical management and business management skills for business owners.
Fasset also funds initiatives to promote the entry of new entrants into the labour market. For example, the Guarantee Trust Holdings Unemployed Tertiary Accounting Graduate Support Programme aims to:
increase the number of previously disadvantaged individuals on registered learnerships; increase the level of success of these learners on the learnerships; support skills development in small businesses. The intensive skills development programme comprises five months’ full-time and part-time
training including an internship at an accounting practice in the sector. Course material includes rules of professional conduct, communication skills, accounting practice orientation, computer literacy, office orientation and formulas for business success. The programme thus allows the sector to integrate (sometimes re-integrate) learners that have already made some progress towards gaining the skills required by the sector. The programme also assists firms with their transformation efforts by providing them with appropriately skilled staff and by equipping learners with entrepreneurial and business skills.
Finally, Fasset supports the establishment of BEE ventures through the strategic cash grant (SCG) for 2007/8. Large and medium-size employers may qualify for SCGs if they assist PDIs in creating new ventures in the sector. The focus is not only on placement within existing enterprises but also on the individual persons’ ability to create self-employment through new ventures.
5.3 SUPPORT TO SMALL ORGANISATIONS
As indicated in Chapter 1 of this SSP most of the organisations in this sector are small. Fasset has various support structures for small businesses in the sector in place. These include free lifelong learning and SDF training opportunities, free assistance and advice with the completion of grant

Fasset Sector Skills Plan 2005 – 2010 Update for the 2009/2010 Financial Year
Final 11 August 2008 52
applications and access to the learnership cash grant (available to employers who employ learners who are black or with a disability). Many of the social projects funded by Fasset also benefit small companies.
Fasset will continue its support for small levy-paying and non-levy paying companies during this planning period. The form and extent of this support will be reviewed and decided by the Fasset Management Board on an annual basis.
5.4 ADULT BASIC EDUCATION AND TRAINING
The Fasset sector consists largely of skilled employees, with only 3% of employees at or below ABET Level 4. Fasset regards ABET as a priority area and is committed to developing learners in need of training. In August 2004, Fasset began implementing an ABET programme to assist adult learners in the sector to improve their literacy and numeracy skills and to further their path on the National Qualifications Framework (NQF). The programme delivers ABET Levels 1-4 and consists of the following:
ABET level basic (Pre-ABET) ABET Level 1 (equivalent to Standard 1 or Grade 3) ABET Level 2 (equivalent to Standard 3 or Grade 5) ABET Level 3 (equivalent to Standard 5 or Grade 7) ABET Level 4 – NQF Level 1 (equivalent to Standard 7 or Grade 9)
5.5 NATIONAL STANDARD OF GOOD PRACTICE
The NSDS aims to accelerate the quality of training in the workplace by promoting the achievement of a national standard of good practice in skills development. No specific standard has yet been identified by DoL. As of 31 March 2007, 22 organisations were committed to the Investors in People (IIP) standard, and seven organisations had achieved the standard.
5.6 STAKEHOLDER CAPACITY BUILDING
Stakeholder groupings in the sector include Fasset management board members, Fasset committee members and Fasset members. All board members are annually inducted into their roles as board members. They are given a detailed overview of the sector, are advised on their role and obligations as members and are informed about Fasset corporate governance structures. Committee members are regularly updated on Fasset developments via the quarterly committee meetings. Members are invited to all SDF and LL training interventions and are updated and briefed regularly on all developments and other changes to legislation that affect the sector.
5.7 CONCLUSIONS
Current initiatives such as learnerships, social development projects and Fasset’s BEE strategy provide support in areas of skills needs (many of which are critical and scarce).
Various support structures for small businesses in the sector are already in place. Levy-paying small businesses can benefit from free LL and SDF training as well as free assistance and advice on the completion of their grant applications. Small and medium-size businesses can also claim grants from Fasset if they employ black learners or learners with disabilities. Fasset considers ABET a strategic priority and funds a complete ABET programme for ABET employees in the sector.
Fasset Sector Skills Plan 2005 – 2010 Update for the 2009/2010 Financial Year
Final 11 August 2008 53
REFERENCES Albrecht, S.W. & Sack, R.J. Accounting Education: Charting the Course through a Perilous
Future, American Accounting Association, Accounting Education Series, Vol. 16, 2000.
Brown, F. & Ooi, E., Implications of Sarbanes-Oxley, http://www.pwcglobal.com/extweb/manisseu.
Bureau of Market Research, A Projection of the South African Population, 1996 to 2021, University of South Africa, Pretoria, 1999.
Cassim, Z. Institute of Public Finance and Auditing, Interview, January 2004.
Cliffe Dekker, King Report on Corporate Governance for South Africa, 2002.
Department of Education. 2008. Education Statistics in South Africa 2006.
Department of Education. 2006. Education Statistics in South Africa at a Glance in 2005.
Department of Education. 2005. Education Statistics in South Africa at a Glance in 2004.
Department of Education. 2005. Education Statistics in South Africa at a Glance in 2003.
Department of Education. 2004. Education Statistics in South Africa at a Glance in 2002.
Department of Education. 2003. Education Statistics in South Africa at a Glance in 2001.
Department of Education. 2002. Education Statistics in South Africa at a Glance in 2000.
Department of Labour, Fasset Sector Brief, 2002.
Fasset, Analysis of Grant Submissions Year 1, April 2002.
Fasset, Analysis of Grant Submissions Year 2, November 2002.
Fasset, Analysis of Grant Submissions Year 3, June 2004.
Fasset, Analysis of Grant Submissions Year 4, September 2005.
Fasset, Analysis of Grant Submissions Year 5, July 2006.
Fasset, Analysis of Grant Submissions Year 6, June 2007.
Fasset, Analysis of Grant Submissions Year 7, In progress.
Fasset, Survey of the Financial and Accounting Services Sector, 2007.
Fasset, The Need for Strategic Learnerships in Finance, Accounting, Management Consulting and Other Financial Services, Johannesburg, 2003.
Financial Services Charter, 2003
Gerrits, E. Partner, PricewaterhouseCoopers, Telephonic interview, January 2004.
Gloeck, J.D. Advancing or retreating in the quest to improve public accountability and government auditing. South African Journal of Accountability and Auditing Research. Vol. 4:2003, pp.1-13.
Growth and Development Summit Agreement, 7 June 2003.
Government of South Africa, Accelerated and Shared Growth Initiative for South Africa, http://www.info.gov.za/asgisa/asgisa.htm, 2006.
Human Sciences Research Council, Nelson Mandela/HSRC Study of HIV/AIDS, Pretoria, 2002.
Human Sciences Research Council, Skills Development in the Financial and Accounting Sector, Fasset, Johannesburg, October 2002. (Fasset Sector Study)
Institute of Directors, The King Report on Corporate Governance, 2002,www.iodsa.co.za
Institute of Internal Auditors, IIA advisor, December 2003.
Lawless, A. 2005. Numbers and Needs. Addressing the imbalance in the civil engineering profession. SACI: Halfway House.
Mulberry Leaf Consulting, Trainee Chartered Accountants in South Africa: Supply and Demand. A report prepared for SAICA, May 2007.

Fasset Sector Skills Plan 2005 – 2010 Update for the 2009/2010 Financial Year
Final 11 August 2008 54
Malherbe, Segal, Corporate governance in South Africa, 2001. Discussed at Policy Dialogue Meeting on Corporate Governance and emerging Economies, OECD, 23 April 2001.
Manual, T., 2002 Budget Speech, http://www.finance.gov.za
Ministerial Panel for the Review of the Draft Accountancy Professions Bill, Short summary of recommendations, 2003, www://finance.gov.za
Republic of South Africa, Auditing Profession Act, No. 26 of 2005.
Republic of South Africa, Broad-Based Black Economic Empowerment Act, No. 53 of 2003.
Republic of South Africa, Companies Act, No. 61 of 1973.
Republic of South Africa, Draft Accountancy Profession Bill, 2001, http://www.finance.gov.za
Republic of South Africa, Draft Public Audit Bill, 2003, www.finance.gov.za
Republic of South Africa, Employment Equity Act, No. 55 of 1998.
Republic of South Africa, Financial Intelligence Centre Act, No. 38 of 2001.
Republic of South Africa, National Credit Act, No 34 of 2005.
Republic of South Africa, Preferential Procurement Framework Act, No. 5 of 2000.
Republic of South Africa, Skills Development Act, No. 97 of 1998.
Republic of South Africa, South African Debt Collectors’ Act, No. 114 of 1998.
Republic of South Africa, The Public Finance Management Act, No. 1 of 1999 as amended.
Rothchild, G. Manager of Marketing, JSE Securities Exchange SA, Interview, January 2004.
SAICA, Proposed legislation for tax practitioners, <http://www.saica.co.za>Accessed 17 July 2007.
SARS. Draft Bill on the Regulation of Practitioners (Revised) < www.sars.gov.za/home.asp?pid=168#Regulation >Accessed 10 June 2008.
Statistics South Africa, Labour Force Survey, February 2003.
Statistics South Africa, Labour Force Survey, March 2004.
Statistics South Africa, Labour Force Survey, March 2005.
Statistics South Africa, Labour Force Survey, March 2006.
Statistics South Africa, Labour Force Survey, March 2007.
Statistics South Africa, PO441, March 2008.
Statistics South Africa, Tourism and Migration, Data Series PO351.
Van Rensburg, A.M., Management Accounting as an existing decision making tool, Unpublished Paper, 2003.
World Health Organisation, Weekly Epidemiological Record, December 2003.

Fasset Sector Skills Plan 2005 – 2010 Update for the 2009/2010 Financial Year
Final 11 August 2008 55
ANNEXURE A FASSET SCARCE SKILLS LIST
This list includes all the occupations identified by employers in the Fasset Sector Study (2007) as occupations in which there is a shortage of skills. The figures presented in the second last column under the heading “need” refers to the number of positions that will have to be filled in the year 2009. These figures were derived in the labour demand model and include new positions that will be created as well as replacement demand that will occur as a result of people retiring, mortality, emigration and people leaving the sector to take up employment elsewhere in the economy. The figures were derived from Scenario A (the more pessimistic scenario where a economic growth rate of 4% for the Financial Services Sector is expected.).
OCCUPATION
leve
l
ss
Sp
ec
ialis
ati
on
/Jo
b
Cri
tic
al S
kills
Inte
rven
tio
n
NQ
F L
evels
NQ
F
Ne
ed
Co
mm
en
ts
Aligned Period Y N 2009
1 MANAGERS
11 Chief Executives, General Managers and Legislators
111 Chief Executives, General Managers, Legislators and Senior Government Officials
1111 Chief Executives and Managing Directors (Enterprises / Organisations)
111101
Chief Executive Officer / Managing Director (Enterprise / Organisation)
1 √ Ed 5-6 √
111201
Corporate General Manager
1 √ √ Ed 5-6 √ 517
111402
General Manager Public Service
1 √ √ Ed 5-6 √ 220

Fasset Sector Skills Plan 2005 – 2010 Update for the 2009/2010 Financial Year
Final 11 August 2008 56
OCCUPATION
leve
l
ss
Sp
ec
ialis
ati
on
/Jo
b
Cri
tic
al S
kills
Inte
rven
tio
n
NQ
F L
evels
NQ
F
Ne
ed
Co
mm
en
ts
Aligned Period Y N 2009
13 Specialist Managers
131 Advertising, Marketing and Sales Managers
1311 Advertising, Marketing and Sales Managers
131102 Sales and Marketing Manager
1 √ Ed 5-6 √
132 Business Administration Managers
1321 Corporate (Administration & Business) Services Managers
132101 Corporate (Administration & Business) Services Manager
1 √ Ed 5-6 √
1322 Finance Managers
132201 Finance Manager
1 √ √ Ed, Ls 5-7 √ 114
1323 Human Resource Managers
132301 Personnel / Human Resource Manager
1 √ Ed 5-6 √
133 Construction, Distribution and Production / Operations Managers
1336 Supply and Distribution Managers
133601 Supply and 1 √ Ed 7 √

Fasset Sector Skills Plan 2005 – 2010 Update for the 2009/2010 Financial Year
Final 11 August 2008 57
OCCUPATION
leve
l
ss
Sp
ec
ialis
ati
on
/Jo
b
Cri
tic
al S
kills
Inte
rven
tio
n
NQ
F L
evels
NQ
F
Ne
ed
Co
mm
en
ts
Aligned Period Y N 2009
Distribution Manager
135 Information and Communication Technology (ICT) Managers
1351 Information and Communication Technology (ICT) Managers
135102
ICT Project Manager
1 √ √ Ed, SC
5-6 √ 19
136 Small Business, Office, Programme and Project Managers
1361 Small Business, Office, Programme an Project Managers
136102
Programme or Project Manager
1 √ √ Ed 5-6 √ 28
1363 Office, Unit or Practice Managers
136301
Office or Unit Manager
1 √ Ed 5-6 √ 22
1492
Call or Contact Centre and Customer Service Managers
149201
Call or Contact Centre Manager
2 √ Ed 5-6 √
149202
Customer Service Manager
2 √ Ed 5-6 √ 28
2 PROFESSIONALS
22 Business, Human Resource and Marketing Professionals
221 Accountants, Auditors and Company
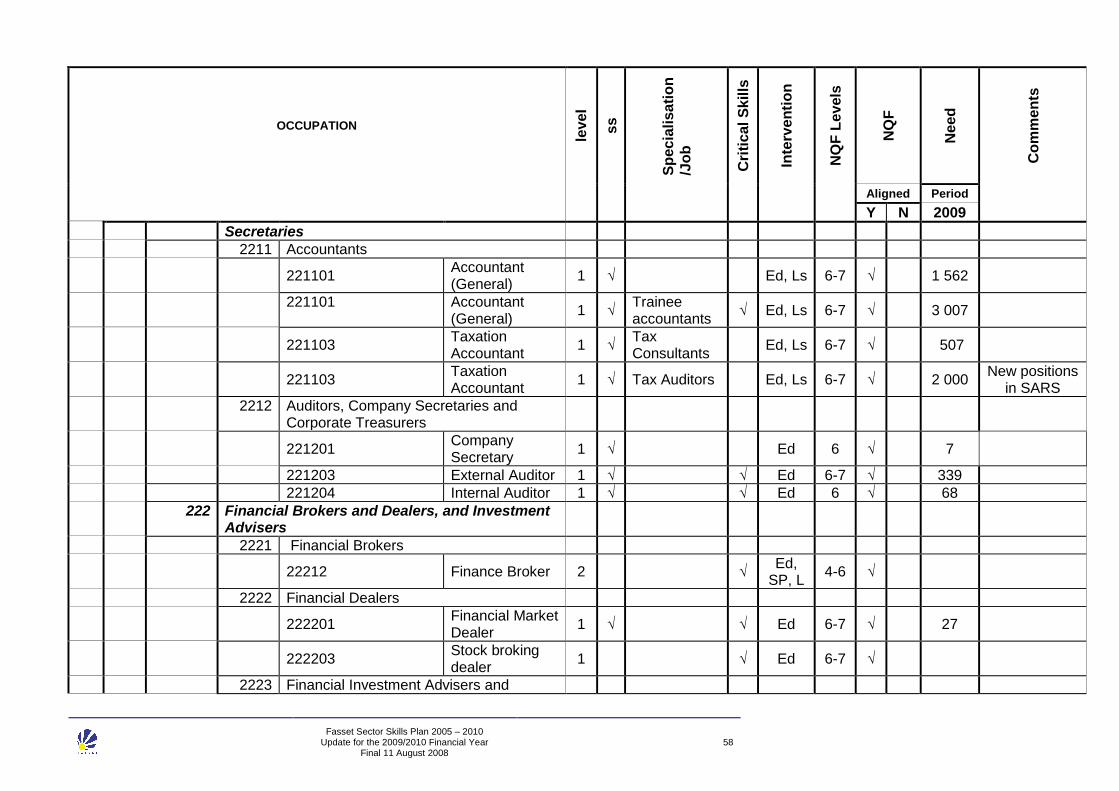
Fasset Sector Skills Plan 2005 – 2010 Update for the 2009/2010 Financial Year
Final 11 August 2008 58
OCCUPATION
leve
l
ss
Sp
ec
ialis
ati
on
/Jo
b
Cri
tic
al S
kills
Inte
rven
tio
n
NQ
F L
evels
NQ
F
Ne
ed
Co
mm
en
ts
Aligned Period Y N 2009
Secretaries
2211 Accountants
221101
Accountant (General)
1 √ Ed, Ls 6-7 √ 1 562
221101 Accountant (General)
1 √ Trainee accountants
√ Ed, Ls 6-7 √ 3 007
221103
Taxation Accountant
1 √ Tax Consultants
Ed, Ls 6-7 √ 507
221103
Taxation Accountant
1 √ Tax Auditors Ed, Ls 6-7 √ 2 000 New positions
in SARS
2212 Auditors, Company Secretaries and Corporate Treasurers
221201
Company Secretary
1 √ Ed 6 √ 7
221203 External Auditor 1 √ √ Ed 6-7 √ 339
221204 Internal Auditor 1 √ √ Ed 6 √ 68
222 Financial Brokers and Dealers, and Investment Advisers
2221 Financial Brokers
22212 Finance Broker 2 √
Ed, SP, L
4-6 √
2222 Financial Dealers
222201
Financial Market Dealer
1 √ √ Ed 6-7 √ 27
222203
Stock broking dealer
1 √ Ed 6-7 √
2223 Financial Investment Advisers and

Fasset Sector Skills Plan 2005 – 2010 Update for the 2009/2010 Financial Year
Final 11 August 2008 59
OCCUPATION
leve
l
ss
Sp
ec
ialis
ati
on
/Jo
b
Cri
tic
al S
kills
Inte
rven
tio
n
NQ
F L
evels
NQ
F
Ne
ed
Co
mm
en
ts
Aligned Period Y N 2009
Managers
222301
Financial Investment Adviser
1 √ √ Ed, L 6-7 √ 199
222302 Financial Investment Manager
1 √ Ed 6-7 √ 2
223 Human Resource and Training Professionals
2233 Training and Development Professionals
223101
Human Resource Advisor
1 √ √ Ed 5-7 √ 13
223301
Training and Development Professional
1 √ Ed 5-7 √ 30
224 Information and Organisation Professionals
2241 Actuaries, Mathematicians and Statisticians
224103 Statistician 1 √ Ed 7-8 √ 4
2243 Economists
224301 Economist 1 √ √ Ed 7-8 √ 5
2247 Management and Organisation Analysts
224701
Management Consultant
1 √ √ Ed 6-8 √ 460
26 ICT Professionals
261 Business and Systems Analysts, and Programmers
2611 ICT Business and Systems Analysts

Fasset Sector Skills Plan 2005 – 2010 Update for the 2009/2010 Financial Year
Final 11 August 2008 60
OCCUPATION
leve
l
ss
Sp
ec
ialis
ati
on
/Jo
b
Cri
tic
al S
kills
Inte
rven
tio
n
NQ
F L
evels
NQ
F
Ne
ed
Co
mm
en
ts
Aligned Period Y N 2009
261101
ICT Business Analyst
1 √ √ Ed 5-6 √ 41
261102
Systems Analyst
1 √ Ed 5-6 √ 55
2613 Software and Applications Programmers
261302
Developer Programmer
1 √ √ Ed 5-6 √ 45
261303
Software Engineer
1 √ Ed 5-7 √ 19
27 Legal, Social and Welfare Professionals
271 Legal Professionals
2713 Solicitors
271302 Associate Legal Professional
1 √ Ed 6-7 √
5 CLERICAL AND ADMINISTRATIVE WORKERS
51 Office Managers and Program Administrators
511 Contract, Program and Project Administrators
5111 Contract, Program and Project Administrators
511102
Contract, Program and Project Administrators
2 √ √ WE, SC
4-6 √ 52
5112 Office Administrators 2 √
WE, SC
4-6 √
52 Personal Assistants and Secretaries

Fasset Sector Skills Plan 2005 – 2010 Update for the 2009/2010 Financial Year
Final 11 August 2008 61
OCCUPATION
leve
l
ss
Sp
ec
ialis
ati
on
/Jo
b
Cri
tic
al S
kills
Inte
rven
tio
n
NQ
F L
evels
NQ
F
Ne
ed
Co
mm
en
ts
Aligned Period Y N 2009
521 Personal Assistants and Secretaries
5211 Personal Assistants
521101
Personal Assistant
3 √ √ WE, SC
4-5 √ 443
53 General Clerical Workers
531 General Clerks
5311 General Clerks
531101 General Clerk 4 √ √
WE, SC
4-5 √ 1 028
532 Keyboard Operators
5321 Keyboard Operators
532101
Data Entry Operator
4 √ SC 4 √ 29
532103 Word Processing Operator
4 √ WE, SC
4 √ 4
54 Inquiry Clerks and Receptionists
542 Receptionists
5421 Receptionists
542101 Receptionist (General)
4 √ √ WE, SC
4 √ 169
55 Numerical Clerks
551 Accounting Clerks and Bookkeepers
5511 Accounting Clerks
551101 Accounts Clerk 4 √ √
Ed, Ls,
4-5 √ 75

Fasset Sector Skills Plan 2005 – 2010 Update for the 2009/2010 Financial Year
Final 11 August 2008 62
OCCUPATION
leve
l
ss
Sp
ec
ialis
ati
on
/Jo
b
Cri
tic
al S
kills
Inte
rven
tio
n
NQ
F L
evels
NQ
F
Ne
ed
Co
mm
en
ts
Aligned Period Y N 2009
SC
5512 Bookkeepers
551201 Bookkeeper 4 √ √
Ed, Ls, SC
4-5 √ 434
5513 Payroll Clerks
551301 Payroll Clerk 4 √
Ed, Ls, SC
4-5 √
552 Financial and Insurance Clerks
5522 Credit and Loans Officers
552201
Credit or Loans Officer
4 √ √ WE, SC
4-5 √ 59
5523
Insurance, Money Market and Statistical Clerks
552302
Insurance Consultant
4 √ √ WE, SC
4-6 √ 10
552304 Statistical Clerk 4 √
WE, SC
4-5 C 8
59 Other Clerical and Administrative Workers
591
Purchasing, Supply, Transport and Despatch Administrative Workers
5911 Purchasing and Supply Logistics Clerks
591103
Purchasing Officer
4 √ WE, SC
4-5 √ 12
599 Miscellaneous Clerical and Administrative Workers

Fasset Sector Skills Plan 2005 – 2010 Update for the 2009/2010 Financial Year
Final 11 August 2008 63
OCCUPATION
leve
l
ss
Sp
ec
ialis
ati
on
/Jo
b
Cri
tic
al S
kills
Inte
rven
tio
n
NQ
F L
evels
NQ
F
Ne
ed
Co
mm
en
ts
Aligned Period Y N 2009
5993 Debt Collectors
599301 Debt Collector 4 √
WE, LS
4 √
5994 Human Resource Clerks
599401
Human Resources Clerk
4 √ WE 4 √ 18
6 SALES WORKERS
61 Sales Representatives and Agents
611 Insurance Agents and Sales Representatives
6112 Insurance Agents
611201 Insurance Agent 3 √ √ Ed 4-6 √ 10
6113 Sales representatives
611302 Sales Representative (Business Services)
4 √ WS, SC
4 √
89 ELEMENTARY WORKERS
891 Other Elementary workers
899 Miscellaneous Workers
8993 Handypersons
899301 Handyperson 5 √ √ SC 3-4 √ 66
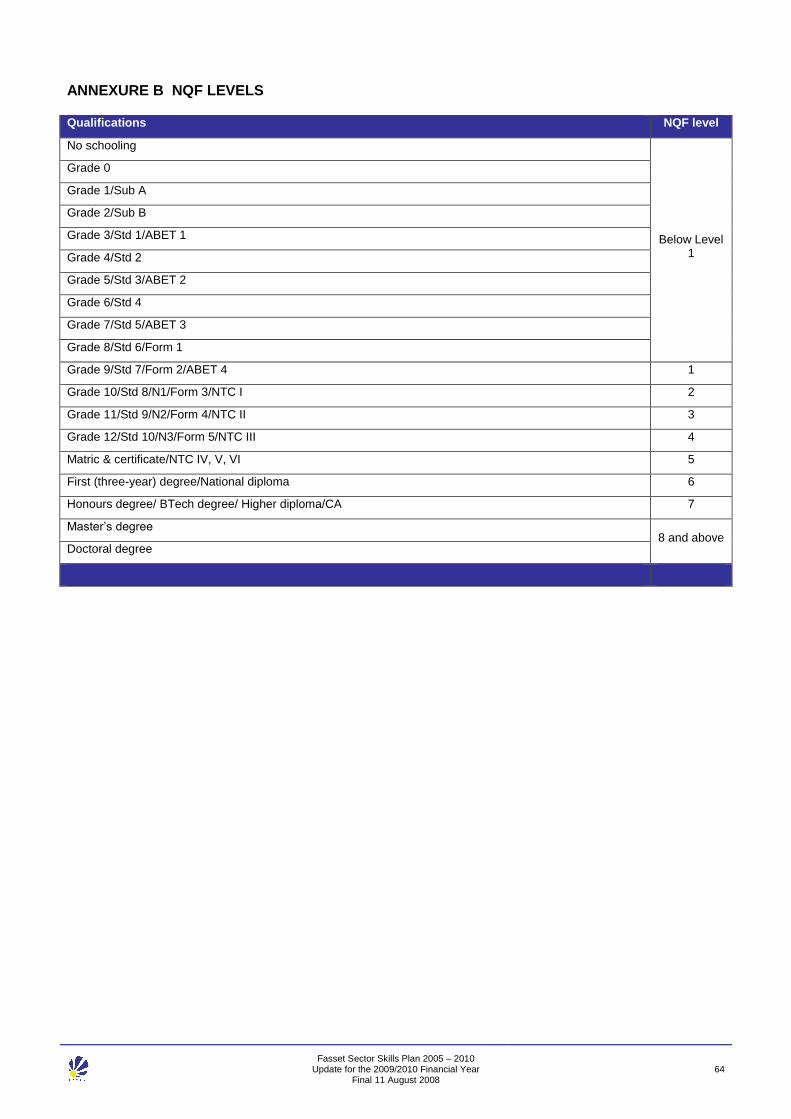
Fasset Sector Skills Plan 2005 – 2010 Update for the 2009/2010 Financial Year
Final 11 August 2008 64
ANNEXURE B NQF LEVELS
Qualifications NQF level
No schooling
Below Level 1
Grade 0
Grade 1/Sub A
Grade 2/Sub B
Grade 3/Std 1/ABET 1
Grade 4/Std 2
Grade 5/Std 3/ABET 2
Grade 6/Std 4
Grade 7/Std 5/ABET 3
Grade 8/Std 6/Form 1
Grade 9/Std 7/Form 2/ABET 4 1
Grade 10/Std 8/N1/Form 3/NTC I 2
Grade 11/Std 9/N2/Form 4/NTC II 3
Grade 12/Std 10/N3/Form 5/NTC III 4
Matric & certificate/NTC IV, V, VI 5
First (three-year) degree/National diploma 6
Honours degree/ BTech degree/ Higher diploma/CA 7
Master’s degree 8 and above
Doctoral degree