farmers’ willingness to pay for climate information ...oar.icrisat.org/10526/1/farmers’...
TRANSCRIPT

sustainability
Article
Farmers’ Willingness to Pay for Climate InformationServices: Evidence from Cowpea and SesameProducers in Northern Burkina Faso
Mathieu Ouédraogo 1,2,* ID , Silamana Barry 2 ID , Robert B. Zougmoré 1, Samuel Tetteh Partey 1 ID ,Leopold Somé 2 and Gregoire Baki 3
1 The CGIAR Research Program on Climate Change, Agriculture and Food Security (CCAFS),International Crops Research Institute for the Semi-Arid Tropics (ICRISAT), West & Central Africa RegionalOffice, BP 320 Bamako, Mali; [email protected] (R.B.Z.); [email protected] (S.T.P.)
2 Institut de l’Environnement et de Recherches Agricoles (INERA), 04 BP 8645 Ouagadougou 04, Burkina Faso;[email protected] (S.B.); [email protected] (L.S.)
3 Direction Générale de la Météorologie (DGM), 01 BP 576 Ouagadougou 01, Burkina Faso; [email protected]* Correspondence: [email protected]; Tel.: +223-2070-9200
Received: 30 December 2017; Accepted: 21 February 2018; Published: 27 February 2018
Abstract: Climate information is recognized as a powerful tool to reduce the effect of climaterisk and uncertainty on crop production and increase the resilience and the adaptive capacity offarmers in semi-arid zones. This paper estimates farmers’ willingness to pay (WTP) for climateinformation within cowpea and sesame value chains in Northern Burkina Faso. The study used thecontingent valuation method for a monetary valuation of farmers’ preferences for climate information.Data were collected using a structured questionnaire from 170 farmers. The study found that63% of respondents were willing to pay for climate information services (CIS) such as seasonalclimate forecast (SCF), decadal climate information (10-DCI), daily climate information (1-DCI) andagro-advisories. The predicted value for the WTP was XOF 3496 for SCF, XOF 1066 for 10-DCI, XOF1985 for 1-DCI and XOF 1628 for agro-advisories. The study also showed that several socioeconomicand motivation factors have greater influence on farmers’ WTP for CIS. These included the gender, age,education of the farm head and the awareness of farm head to climate information. The outcomes ofthis paper should support policy makers to better design an efficient mechanism for the disseminationof climate information to improve the adaptive capacity of farmers to climate risks in Burkina Faso.
Keywords: climate risk management; adaptation; agriculture; West Africa
1. Introduction
In West Africa, the rainfall regime is characterized by a strong spatial and temporal variability [1,2].The inter-annual rainfall variability differs between the north and the south of the region with adecrease of the mean annual rainfall from south to north [1] and a shift in the seasonal cycle froma two-season regime in the south to a single rainy season in the north [3]. The year-to-year rainfallvariability ranges from 10 to 20 percent in the coastal areas to over 40 percent in the northern Sahel [4].The variability of West Africa climate is also marked by recurrent droughts balanced out by a fewnumber of heavy rainfall years (above the average rainfall years) [5]. The rainfall variability has been,and continues to be, one of the principal sources of fluctuations in food production in West Africa ingeneral and in the Sahel region in particular. Given that agriculture in West Africa is mostly rain-fed,its performance depends heavily on seasonal characteristics of rainfall. Rainfall unpredictability posesenormous threats to food security with deficits leading to localized food crises every year. Intra-season
Sustainability 2018, 10, 611; doi:10.3390/su10030611 www.mdpi.com/journal/sustainability

Sustainability 2018, 10, 611 2 of 16
drought may lead to harvest losses and crop failure even in years where the total rainfall would allowa normal harvest.
To cope with climate variability and risks, local communities have relied on indigenous climateforecasting methods to plan agricultural activities [6]. The traditional seasonal climate forecast is asystem of knowledge that people of a particular geographical area use to predict the weather andthe climate. It is embedded in the art, history and culture of the people concerned and transmittedfrom one generation to another [7]. It is often based on generations of experience and includes bothbiophysical and mystical indicators [6]. With the increase in rainfall variability and climate extremeevents (such as droughts, floods and strong winds) as consequences of climate change in the Sahel [8],the endogenous forecasts, are becoming less reliable [7]. This means that climate change is bringingand increasing risk and uncertainty on agricultural production. The impacts of climate change arealready constraining the achievement of productive and secure livelihoods among the most vulnerablepeople in the region [9]. However, climate change uncertainties can be understood, managed and usedto inform decision-making in agriculture. The ability to understand, monitor and predict climaticvariability, provides an opportunity for farmers to put historical experiences into perspective andto evaluate alternative management strategies for informed decision-making. This may help themto take advantage of good years and minimize the losses during poor years. Climate informationreduces uncertainty and can help farmers make better use of inputs and technologies. Moreover,climate information has the potential to improve the resilience of agriculture to climatic shocks. It canbe used to help manage current climate risks and build resilience to future climate. For example,farmers can use information on the onset of the next rainy season to make decisions about whichcrops to plant and when to plant them. Roudier [10] showed that seasonal forecasts can help improvefarmers’ incomes and lower the risks of poor harvests in West Africa. The provision of climateinformation services (CIS) is one of the main ways in which farmers can deal with climate change andvariability in order to improve decision-making in agriculture. Climate services can be understoodas activities that deal with generating and providing climate information to a wide range of users inorder to support climate resilient development. Climate services involve the production, translation,transfer, and use of climate knowledge and information in climate-informed decision making andclimate-smart policy and planning. Climate information prepares the users for the weather theyactually experience. It is therefore imperative for climate and weather services to operate in closetandem, so as to be seamless to the end-user. In agriculture, climate and weather data are combinedwith non-meteorological data, such as agricultural information to produce agro-met-advisories. In thisstudy, CIS is used in a border sense including climate services (seasonal forecast), weather services(daily and decadal weather forecasts) and agro-met advisories (use of agricultural options based onclimate and weather information).
In Burkina Faso, cowpea and sesame are widely produced by small-scale farmers under rain-fedsystem. They are usually grown in intercropping systems with cereals such as millet and sorghum.However, mono-crop cultivation systems are now common in market-focused areas of the country.For the past ten years, cowpea and sesame have increased tremendously. Cowpea production increasedfrom 253,190 tons in 2007 to 554,286 tons in 2016 [11,12]. Similarly, the production of sesame rosefrom 18,802 tons in 2007 to 163,920 tons in 2016 [11,12]. Cowpea has recently transitioned from a foodsecurity to a cash crop status, providing income for many small scale cowpea growers. Sesame alsobecame the third exported commodity from Burkina Faso after gold and cotton. The annual exportswere estimated at XOF 96.9 billion in 2015 [13]. Both crops are promising value chain crops promotedby the government through several development projects. Cowpea is predominantly a woman’s cropfrom production to processing while women represent about 43% of sesame producers in BurkinaFaso. Both crops benefit from many opportunities including existence of an increasing demand atboth local and international markets with higher prices for sesame oil. This notwithstanding, erraticrainfalls and increased droughts exacerbate the already existing constraining factors of cowpea andsesame production such as poor soil fertility.

Sustainability 2018, 10, 611 3 of 16
Since 2011, the CGIAR research program on Climate Change, Agriculture and Food Security(CCAFS) has been piloting how the dissemination of climate information services (CIS) at itsintervention sites (called climate-smart villages (CSV)) in Burkina Faso could be an important tool toreducing the effects of climate risk and uncertainty on cowpea and sesame production and increasingthe resilience and adaptive capacity of farmers. Climate information was disseminated to cowpea andsesame growers through face to face meetings and radio broadcasts under the auspices of CCAFS.As the CCAFS project prepares to end, it is viewed that among other factors, the continued use of CISwill depend on the continued demand for CIS by farmers and farmers’ willingness to pay for CIS.This study is therefore novel and aimed to assess the willingness of cowpea and sesame farmers to payfor CIS as an entry point to bringing CIS to scale and sustaining its use by farmers in Burkina Faso.
2. Materials and Methods
2.1. Study Area Description
The study was conducted in Yatenga in the Northern region which is one of the CSV sites ofCCAFS in Burkina Faso. It is a 30 km× 30 km block consisting of 51 villages (Figure 1). Geographically,the Northern region of Burkina Faso covers 16,130 km2, representing 5.9% of the country. In 2015,the region had a population of 1,502,527 inhabitants (representing 8.5% of the total population ofthe country) with an average annual growth rate of 2.2% between 1996 and 2006. The population isyoung with 57.5% of the people under 20 years old. The region is the poorest in the country witha 68.1% poverty incidence [14]. The region’s economy is based on activities of the primary sector,focusing mainly on agro-sylvo-pastoral production, of which farming is by far the most dominant.However, both artisanal and industrial mining occupy an important place in the economy of theregion. Agriculture in the region is mostly rain-fed subsistence systems that are characterized bysmall family farms. Sorghum and millet are the major staple crops. Cowpea, sesame, groundnut andvegetables are the main cash crops. Major agricultural constraints include the highly variable spatialand temporal distribution of rainfall and the inherently low fertility of the soils. The climate of theregion is a Sub-sahelian type, characterized by the alternation of two seasons, a long dry season ranginggenerally from October to May and a short rainy season from June to September [15]. The annualrainfall ranges between 403 mm (in 1990) to 968 mm (in 2012) mm with an average of 672 recordedin the period: 1985–2014. For the past 30 years, about 50% of annual rainfalls have fallen below the1985–2014 average.
In order to reduce its vulnerability to droughts and water shortages, Burkina Faso has built manydams to collect water for irrigation of vegetable crops during the dry season, contributing to thecountry’s agricultural diversity. Diverse soil and water conservation technologies (including stonesbunds, zaï, half-moon, earth bunds, and grass strips) are used to cope with the adverse effects of highclimatic risks, especially in the central and northern parts of the country [16]. Despite these initiatives,climate risk is still a recurrent problem in Northern Burkina Faso. This is why CCAFS piloted thedissemination of climate information services to farmers in this region. Four types of CIS have beencommunicated to farmers since 2011: (i) downscaled seasonal forecasts; (ii) 10-day forecasts; (iii) dailyclimate information and; (iv) agro-met-advisories. Prior to the agricultural season (normally in June),a one-day workshop is usually organized to present the seasonal forecasts to farmers and discuss withthem about which adaptation strategies to implement. The information shared consists of the nature ofthe rainy season (normal, below or above the normal), the beginning and end dates of the rainy season,and spell drought periods during the rainy season. A second workshop takes place in July (every year)to communicate updated climate forecasts for the period of July to September. The 10-day forecasts ofweather (mainly rainfall, spell drought periods) as well as daily climate information (mainly rainfall,wind) were disseminated through radio shows. A rural radio station (Voice of Farmers, Ouahigouya)was contracted for climate information broadcasting. Farmers were also reached through agriculturalextension officers from the cowpea and sesame value chain development initiative Projet d’appui aux

Sustainability 2018, 10, 611 4 of 16
filières agricoles (PROFIL). All the above climate information were accompanied by agro-advisoriesbased on the climate and weather information received.
Sustainability 2018, 9, x FOR PEER REVIEW 4 of 16
information were accompanied by agro-advisories based on the climate and weather information received.
Figure 1. The Yatenga site of CCAFS in Northern Burkina Faso with cluster of villages.
2.2. Data Collection and Analysis
Seventeen (17) villages were randomly chosen within the Yatenga 900 km2 block. Ten farmers within each of the selected villages were randomly selected from a complete list of farmers generated within the villages. A total number of 170 farmers were interviewed in 2014 for this study. Respondents were farmers involved in cowpea and sesame production. A structured questionnaire was administered to each farmer by trained enumerators to collect information on household and farm characteristics (demography, livelihoods, farm practices, farm assets, access to credit and inputs subsidies, access to training and climate information services, etc.) and farmer’s willingness to pay (WTP) for climate information services using the contingent valuation method. Enumerators received comprehensive training in order to perform the contingent valuation surveys. The data were collected through in-person interviews with open-ended question method to elicit farmers’ WTP for CIS. Farmers were first asked whether or not they would like to purchase the CIS for agricultural production. Those with positive responses were then asked a series of follow up questions to know what types of CIS are most preferred, and how much they would like to pay for CIS. The questions were stated as follows: (i) Are you ready to pay for CIS for agricultural production (Yes or No)?; (ii) If yes, what types of CIS are you willing to pay for (Seasonal climate forecast, decadal weather information, daily weather information and agro-met advisories)?; (iii) How much are you willing to pay to get this type of CIS (XOF)? In relation to the CVM, farmers were also asked about their knowledge of climate and weather information and the usefulness of this information. This was relevant to minimize any biases that may result from the CVM. The questions were: (i) have you ever heard of climate and weather information (Yes, No)?; (ii) do you think this information is useful for your agricultural production (Yes or No)? and (iii) have you ever used climate and weather information for your agricultural production (Yes or No)? Farmers’ WTP were collected. Data was registered in Excel and transferred to Stata software for analysis using descriptive statistics and econometric modeling procedures where applicable. Average and median empirical WTP were calculated. The WTP is analyzed according to the main characteristics of the sample through descriptive statistics and econometric modeling. The Tobit model was used with regard to the importance of zero values (more than 5%).
Figure 1. The Yatenga site of CCAFS in Northern Burkina Faso with cluster of villages.
2.2. Data Collection and Analysis
Seventeen (17) villages were randomly chosen within the Yatenga 900 km2 block. Ten farmerswithin each of the selected villages were randomly selected from a complete list of farmers generatedwithin the villages. A total number of 170 farmers were interviewed in 2014 for this study. Respondentswere farmers involved in cowpea and sesame production. A structured questionnaire was administeredto each farmer by trained enumerators to collect information on household and farm characteristics(demography, livelihoods, farm practices, farm assets, access to credit and inputs subsidies, accessto training and climate information services, etc.) and farmer’s willingness to pay (WTP) for climateinformation services using the contingent valuation method. Enumerators received comprehensivetraining in order to perform the contingent valuation surveys. The data were collected throughin-person interviews with open-ended question method to elicit farmers’ WTP for CIS. Farmers werefirst asked whether or not they would like to purchase the CIS for agricultural production. Thosewith positive responses were then asked a series of follow up questions to know what types of CIS aremost preferred, and how much they would like to pay for CIS. The questions were stated as follows:(i) Are you ready to pay for CIS for agricultural production (Yes or No)?; (ii) If yes, what types ofCIS are you willing to pay for (Seasonal climate forecast, decadal weather information, daily weatherinformation and agro-met advisories)?; (iii) How much are you willing to pay to get this type of CIS(XOF)? In relation to the CVM, farmers were also asked about their knowledge of climate and weatherinformation and the usefulness of this information. This was relevant to minimize any biases that mayresult from the CVM. The questions were: (i) have you ever heard of climate and weather information(Yes, No)?; (ii) do you think this information is useful for your agricultural production (Yes or No)?and (iii) have you ever used climate and weather information for your agricultural production (Yes orNo)? Farmers’ WTP were collected. Data was registered in Excel and transferred to Stata software foranalysis using descriptive statistics and econometric modeling procedures where applicable. Averageand median empirical WTP were calculated. The WTP is analyzed according to the main characteristics

Sustainability 2018, 10, 611 5 of 16
of the sample through descriptive statistics and econometric modeling. The Tobit model was usedwith regard to the importance of zero values (more than 5%).
2.3. Conceptual and Theoretical Framework
Values for non-market goods (e.g., climate information services that are not typically paid for bythe public in an established market) can be estimated using contingent valuation method (CVM) [17].This method is an economic valuation which refers to the assignment of monetary values of changes inenvironmental services and functions and to stocks of environmental assets [18]. It involves the use offield surveys to elicit information on the value people assign to non-market goods. Several studieshave assessed WTP for climate services in agriculture using CVM. For example, Mabe et al. [19] usedthe CVM to elicit the amount farmers were willing to pay for accessing unpriced weather forecastinformation in the Savelugu-Nanton Municipality of the Northern Region of Ghana. Zongo et al. [7]used the same method to assess farmers’ WTP for climate information in Burkina Faso. Other authorsused the CVM to assess the WTP for improved weather forecasts in Benin, Zimbabwe and Italy [20–22].The CVM is underpinned on the theory of consumer behavior and the theory of the maximizationof utility. The principal assumption upon which the theory of consumer behavior is built is that aconsumer is rational and attempts to allocate his/her limited money or income among available goodsand services in order to maximize his/her utility (satisfaction). In other words, an individual seeks tomaximize utility of a good (in this case climate information services) subject to a given constraint. It isassumed that every farmer pursues the objective of maximizing utility, but each farmer has his/herown perception of utility and constraints and makes willingness to pay decisions based on the uniqueattributes of his/her own situation [23]. Thus, the WTP for climate information services is assumed todepend upon the set of attribute values that apply to the particular household.
The econometric analysis for the WTP depends on the type of elicitation method, the type ofquestion and the structures of the responses. In cases where the dependent variable has a zero valuefor a significant fraction of the observations, a Tobit model is required [24] because standard OrdinaryLeast Square technique results in biased and inconsistent parameter estimates i.e., they are biased evenasymptotically [25].
The Tobit model can be defined as [26]:
WTP∗i = β′Xi + µi
WTPi =
{WTP∗i i f WTP∗i > 0
0 i f WTP∗i ≤ 0
where, WTP∗i is latent or unobserved willingness to pay for CIS; WTP∗i is farmer’s willingness topay for CIS in a year; Xi is a vector of independent variables that are hypothesized to influence theWTP; β is unknown parameter vector to be estimated; εi is an error term which are assumed to benormally distributed with mean zero and constant variance. The model parameters are estimated bymaximizing the Tobit likelihood function of the following form.
L = ∏WTP∗>0
1σ
f ln(
WTPi − βXσ
)∏
WTP∗≤0
1σ
F(−βX
σ
)where, f and F are the density probability function and cumulative distribution function of WTP∗irespectively.
Given that the Tobit coefficients do not directly give the marginal effects of the associatedindependent variables on the dependent variable, McDonald and Moffit [27] proposed techniquesto decompose the effects of explanatory variables into the probability of WTP and intensity of WTPeffects as follows [23]:

Sustainability 2018, 10, 611 6 of 16
1. The effects of a given explanatory variable on the probability of WTP is:
∂F(Z)∂Xi
= f (z)βiσ
2. The marginal effect of an explanatory variable on the expected value of the dependent variable is:
∂E(WTPi)
∂Xi= F(z)βi
3. The change in the amount a respondent is willing to pay with respect to a change in explanatoryvariable among individuals who are willing to pay is:
∂E(WTPi/WTP∗i > 0
)∂Xi
= βi
[1− Z
f (z)F(z)
−(
f (z)F(z)
)2]
where, βi Xiσ is denoted by z, following Madala [28].
Whereas: F (z) is the cumulative normal distribution of Z, (z) is the value of the derivative of thenormal curve at a given point (i.e., unit normal density), Z is the z-score for the area under normalcurve, β is a vector of Tobit maximum likelihood estimates and σ is the standard error of the error term.
The marginal effect of an explanatory variable on the expected value of the dependent variablewas considered in this study.
2.4. Empirical Model
We used a Tobit model to analyze the determinants of WTP for each type of CISincluding the seasonal climate forecast, the decadal climate information, daily climate informationand agro-advisories.
2.4.1. Dependent Variable
In the Tobit model, the dependent variable represents the amount of money the farmer is willingto pay for each climate information service.
2.4.2. Independent Variables
As mentioned above, farmers’ willingness to pay for CIS is assumed to depend on the set ofattribute values that apply to the particular farm. This includes farmers’ socioeconomic characteristics,farm-specific characteristics, and farmers’ attitudes towards experiments and risks. In this study, weconsidered the following independent variables: gender, education, age, household size, farm size,use of indigenous forecast, exposure to climate information, use of stone line, use of organic manure,secondary activity (e.g., livestock) and production orientation.
Age of farm head: It is a continuous variable defined as the age of the head of farm at the time ofinterview measured in years. Older farmers are less reliant on information, and therefore do not get intouch with innovations as early as their younger colleagues. Therefore, in this study it is hypothesizedthat young farmers are more likely to purchase CIS than elders.
Sex of farm head: It is a dummy variable taking the value of 1 for male-headed farm and 0 ifotherwise. The sex of the farm head was included to differentiate between male and female farm headsin their participation in making a decision on income distribution. In this study, it is hypothesizedthat male head farms are likely to purchase CIS than female head farms. The expected effect on thewillingness to pay for CIS is positive.
Household size: It is a continuous variable measured as the number of people living under one roof.Higher family size is accompanied by high labor potential for farming activities. In addition, more

Sustainability 2018, 10, 611 7 of 16
family members require more funds to cover their basic needs which eventually reduces the overallpurchasing power of the household. This could have negative effect on the willingness to pay for CIS.
Education of farm head: It is a dummy variable taking 1 if the respondent received a formaleducation and 0 if the respondent is illiterate. More educated respondents are expected to takescientific oriented decisions. Therefore, it is hypothesized to have a positive influence on farmers’willingness to pay for CIS.
Farm size: It is a continuous variable measured as the number of hectare (ha) of land of the farm.Increasing farm size is one of the strategies usually undertaken by farmers to maintain their totalproduction when their farm productivity per ha is reducing [29]. This means that the farm size isexpected to have negative effect on the willingness to pay for CIS.
Use of indigenous forecast: It is a dummy variable taking a value of 1 if a farmer is using anindigenous indicator for climate forecasts and 0 if otherwise. To cope with climate variability and risks,many local communities have for years relied on indigenous climate forecasting methods for planningagricultural activities [6]. The reliability of the technique will affect the WTP for climate informationservices. So the expected effect of this variable on the WTP could be positive or negative depending onthe reliability of the indigenous forecast used by farmers.
Exposure to climate information services: It is a dummy variable taking a value of 1 if farmer isexposed to CIS from any source and 0 if otherwise. For farmers to adopt a practice, they must firstknow about it. Being exposed to or experiencing CIS plays a key role in adopting CIS. In this study,it is expected to have positive effect on the WTP for CIS.
Use of stone bunds and use of organic manure: Both variables are dummy variables taking a value of1 if a farmer is using stone bunds and organic manure and 0 if otherwise. Stone bunds and organicmanure are considered as adaptation strategies to climate variability [28]. If a farmer perceived CISas an option to perform in stones bunds and organic manure use, the expected effect will be positive.On the other hand, if a farmer thinks that the investment in stone bunds and organic manure is enoughto cope with climate variability, he won’t be willing to pay for CIS. In that case, the expected effect willbe negative. The expected effects from the two variables are undetermined.
Secondary activity–livestock: It is a dummy variable taking 1 if the respondent has livestock as amain secondary activity and 0 if otherwise. It is expected to influence the willingness to pay for CISeither positively or negatively. In fact the income from livestock could have positive influence onoverall household income and subsequently on the willingness to pay for CIS. On the other hand,it may have negative impact if farmers are content with livestock as the best climate risk managementstrategy and do not need more adaptation options.
Market-oriented: It is a dummy variable taking 1 if the respondent produces cowpea and/orsesame for sale and 0 if otherwise. It is expected to influence the willingness to pay for CIS positively.This is because of the fact that the income from sale of crop product has positive influence on incomeand in turn income has positive influence on WTP for CIS.
3. Results
3.1. Socio-Economic Characteristics of Farmers
Table 1 shows the descriptive statistics of respondents’ characteristics. The results showed that67% of farms were male-headed. The age of respondents ranged from 18 to 77 years with an average of44 years. Most farm heads were married (96%) with 52% receiving no formal education. The householdsizes were relatively big with an average of 16 people including 9 active people per farm. Most farmerswere indigenous (88%). The main secondary activities of farmers were livestock, gold mining andsmall commerce which were engaged by 46%, 20% and 16% of farmers respectively. Most farmers(52%) were registered with farmers’ organizations including cowpea producers’ organization (18%),sesame producers’ organization (18%).

Sustainability 2018, 10, 611 8 of 16
Farmers interviewed had more experience in cowpea (8 years) production than sesame (5 years).Cowpea and sesame were mostly planted as monocrops with more focus on commercial gains. In termsof farm size, Table 1 shows the area owned by farmers ranged from 0.5 to 60 hectares (ha) with anaverage size of 4.4 ha. The cropped areas ranged from 0.5 to 16 ha with an average of 3.3 ha. The meancropped areas were 0.16 ha for sesame and 0.13 ha for cowpea.
Table 1. Descriptive statistics on the characteristics of respondents.
Variables Categories Frequency Percent
GenderMan 113 66.86
Woman 56 33.14
Marital statusMarried 162 95.86Single 6 3.55
Widow/divorced 1 0.59
Education levelNon educated 88 52.07
Literate 46 27.22Formal education 35 20.71
Origin of farm head Indigenous 149 88.17Migrant 20 11.83
Main secondary activity
Livestock 77 45.56Gold mining 34 20.12Commerce 27 15.98Gardening 17 10.06
Other 14 8.27
Member of farmers organization
None 81 47.93Cowpea producers association 30 17.75Sesame producers association 31 18.34
SWC techniques 20 11.83Cowpea and sesame association 5 2.96Gardening producers association 2 1.18
Objective for cowpea production Only consumption 29 17.16Consumption and selling 59 34.91
Objective for sesame productionOnly consumption 2 1.18
Only selling 50 29.59Consumption and selling 32 18.93
Cowpea production system Associated 12 7.10Pure 77 45.56
Sesame production system Associated 10 5.92Pure 74 43.79
Source: Field surveys (2014). Number of observations = 169.
3.2. Access to Climate Information Services
3.2.1. Traditional Climate Forecasts
The surveys showed that 51% of the farmers interviewed use traditional climate knowledge toadapt to inter-annual climate variability. They predict the coming rainy season using various naturalindicators: the state of stars, trees, insects, birds, wind or temperature. Ant migration from low landsto plateaus or good production of shea trees are for instance signs for a good rainy season, whereasbirds nesting in low branches of the trees or fall of non-mature fruits are bad signs.
3.2.2. Modern Climate Forecasts
The study showed that 79% of farmers had had climate information during the survey year.This comprised seasonal climate forecast (to know the length, start and end of the rainy season),decadal weather forecast (to identify drought spells, flood periods, and farms operations such asweeding, fertilizer and pesticide applications) and daily weather information. They got these climateinformation from rural radios as well as during dissemination workshops (Table 2). However, dailyclimate information were mainly delivered through rural radios (according to 74% of farmers).

Sustainability 2018, 10, 611 9 of 16
Table 2. Access to climate information by dissemination channels.
Type of Information PercentChannel of Climate Information Services
Workshop Rural Radio NationalRadio
ExtensionService Agent
From OtherFarmers
Nature of the rainy season 73.96 27.81 44.97 5.26 0.59 0.59Length of rainy season 65.68 18.34 46.15 5.26 0.59 0.59
Start of the rainy season 53.25 14.20 37.87 5.26 0.59 0.59End of the rainy season 53.85 10.06 42.01 5.27 0.59 0.59Drought spells periods 68.64 14.79 52.66 5.25 0.59 0.00
Floods 50.89 4.14 46.75 0.00 0.00 0.00Daily rainfall information 75.74 1.17 73.99 5.19 0.58 0.00
Source: Field surveys (2014); Number of observations = 169.
3.2.3. Appropriate Sources for Climate Information Dissemination
Table 3 shows that radio was by far the most appropriate channel by which climate informationcould reach more people. Only 4% and 2% of farmers thought that television and cell phonesrespectively could be the most appropriate channel to reach more farmers.
Table 3. Appropriate channels for climate information dissemination.
Channel of Information Frequency Percent Cumulative Frequency
Radio 116 68.64 68.64Television 6 3.55 72.19
Workshops (face to face meetings) 2 1.18 73.37Mobile phone 3 1.78 75.15
Extension agent 4 2.37 77.51Farmer’ organisation 1 0.59 78.11
No response 37 21.89 100.00Total 169 100
Source: Field survey (2014).
3.3. Willingness-to-Pay for Climate Information Services
About 63% of farmers were ready to pay for at least one type of CIS. About 53% of farmerswere willing to pay for the seasonal forecast and the daily climate information. About 33% and39% were willing to pay for decadal climate information and agro-advisories respectively. The mainreasons for which some farmers were not willing to pay for CIS were the lack of money (confirmedby 28% of farmers) and the need for evidence on the profitability of the use of CIS (confirmed by 11%of respondents).
The results indicated that the average annual willingness-to-pay was about XOF 3706 for seasonalclimate forecast, XOF 1113 for decadal climate information, XOF 1923 for daily climate informationand XOF 1674 for agro-advisories. Table 4 shows the observed willingness to buy (WTB) and pay(WTP) for climate information within the study sample.
Table 4. Descriptive statistics for the willingness of farmers to accept and pay for climate informationin Yatenga, Burkina Faso.
Statistics Seasonal ClimateForecast
Decadal ClimateInformation
Daily ClimateInformation Agro-Advisories
N 169 169 169 169Mean 3706 1113 1923 1674
Median 300 0 100 0Standard deviation 6723 3930 4749 4526
Minimum 0 0 0 0Maximum 25,000 25,000 25,000 25,000WTB (%) 53 33 53 39
Source: Field survey (2014).

Sustainability 2018, 10, 611 10 of 16
Table 5 shows the descriptive statistics of WTP according to farmers’ characteristics. The WTP washigher for men than for women for each of the CIS. Younger farmers (less than 40 years) had higherWTP for any CIS than the old farmers. Farmers with farm sizes between 4 and 6 ha had a higher WTPfor each CIS than those who had less than 4 ha or more than 6 ha. Farmers with a household size of 6to 10 people had higher WTP for seasonal climate forecast (SCF) and daily climate information, whilefarmers with less than 6 members had a higher WTP for decadal climate information. Those with morethan 10 members had higher WTP for agro-advisories. Farmers who use endogenous forecast hadhigher WTP for SCF, decadal climate information and agro-advisories. Farmers who use soil and waterconservation techniques had lower WTP for each CIS. Farmers who use organic manure had higherWTP for all CIS. The educated farmers as well as non-market-oriented farmers had higher WTP foreach CIS. Farmers practicing livestock as main secondary activity also had a higher WTP for seasonalforecast, decadal and daily climate information.
Table 5. WTP (XOF*) for climate information services according to farmers’ characteristics.
Variables N Seasonal ClimateForecast
Decadal ClimateInformation
Daily ClimateInformation Agro-Advisories
Gender
Men 113 4145 1252 2339 1916Women 56 2820 831 1084 1184
Age
Less than 40 66 4521 1852 2600 202240 to 60 years 87 3125 628 1490 1575
More than 60 years 16 3500 703 1488 772
Cropping area
Less than 4 ha 104 3490 1180 1871 17564 to 6 ha 43 4792 1251 2365 1866
More than 6 ha 22 2600 523 1307 907
Active population
Less than 6 person 59 3413 1377 1569 11416 to 10 person 69 3870 1010 2377 1942
More than 10 person 41 3851 905 1668 1989
Endogenous forecast
Don’t use indigenous indicator 81 3415 1065 2035 1288Use indigenous indicator 88 3973 1157 1820 2029
Awareness to CI
Not exposed 61 1748 348 875 925Exposed 108 4812 1545 2515 2097
Soil and water conservation(SWC) technique
Not adopted SWC techniques 118 4158 1328 2276 2161Adopted SWC techniques 51 2658 614 1107 547
Education
Not educated 134 3360 1053 1872 1620Educated 35 5029 1343 2120 1880
Use of organic manure
Not adopted organic manure 69 2598 1030 1362 829Adopted organic manure 100 4470 1170 2310 2257
Livestock
No livestock 92 3359 850 1841 1768Practice livestock 77 4119 1427 2021 1561
Market orientation
Non market oriented 119 3792 1320 1925 1858Market oriented 50 3501 620 1919 1235
Total 169 3706 1113 1923 1674
Source: Field survey (2014); * 1 EUR = 655.957 XOF.
Sustainability 2018, 10, 611 11 of 16
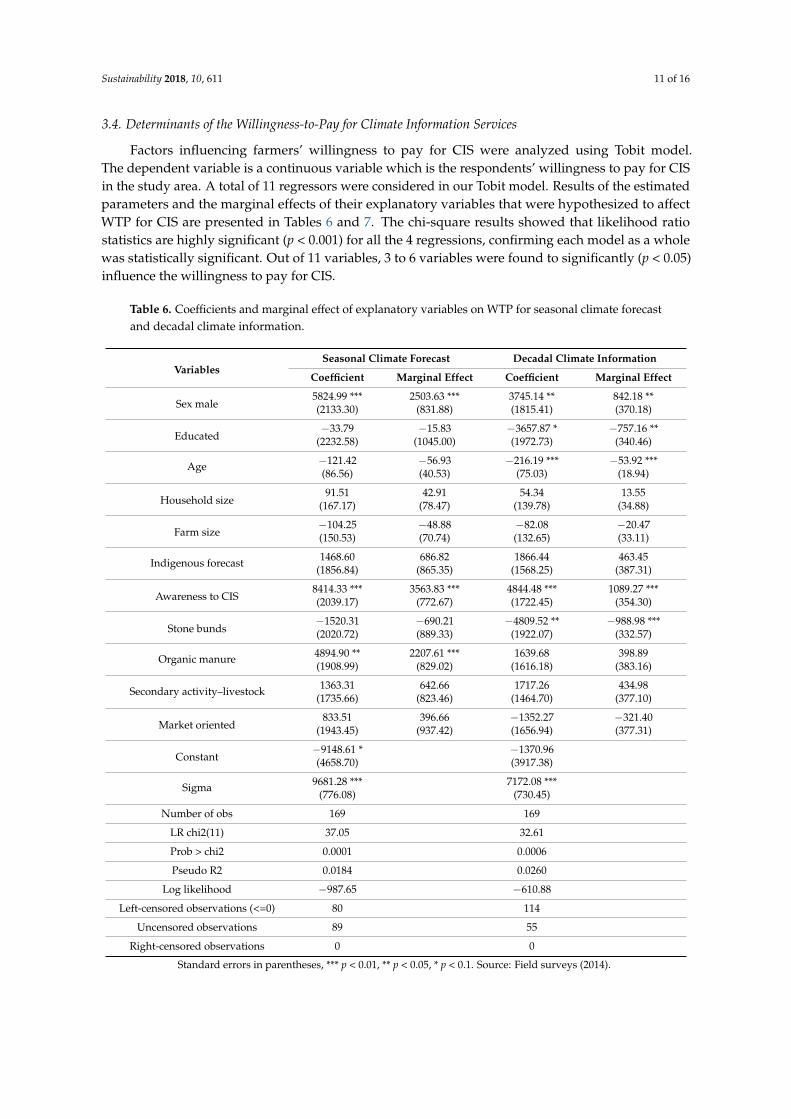
3.4. Determinants of the Willingness-to-Pay for Climate Information Services
Factors influencing farmers’ willingness to pay for CIS were analyzed using Tobit model.The dependent variable is a continuous variable which is the respondents’ willingness to pay for CISin the study area. A total of 11 regressors were considered in our Tobit model. Results of the estimatedparameters and the marginal effects of their explanatory variables that were hypothesized to affectWTP for CIS are presented in Tables 6 and 7. The chi-square results showed that likelihood ratiostatistics are highly significant (p < 0.001) for all the 4 regressions, confirming each model as a wholewas statistically significant. Out of 11 variables, 3 to 6 variables were found to significantly (p < 0.05)influence the willingness to pay for CIS.
Table 6. Coefficients and marginal effect of explanatory variables on WTP for seasonal climate forecastand decadal climate information.
VariablesSeasonal Climate Forecast Decadal Climate Information
Coefficient Marginal Effect Coefficient Marginal Effect
Sex male5824.99 *** 2503.63 *** 3745.14 ** 842.18 **(2133.30) (831.88) (1815.41) (370.18)
Educated−33.79 −15.83 −3657.87 * −757.16 **
(2232.58) (1045.00) (1972.73) (340.46)
Age −121.42 −56.93 −216.19 *** −53.92 ***(86.56) (40.53) (75.03) (18.94)
Household size91.51 42.91 54.34 13.55
(167.17) (78.47) (139.78) (34.88)
Farm size−104.25 −48.88 −82.08 −20.47(150.53) (70.74) (132.65) (33.11)
Indigenous forecast 1468.60 686.82 1866.44 463.45(1856.84) (865.35) (1568.25) (387.31)
Awareness to CIS8414.33 *** 3563.83 *** 4844.48 *** 1089.27 ***(2039.17) (772.67) (1722.45) (354.30)
Stone bunds−1520.31 −690.21 −4809.52 ** −988.98 ***(2020.72) (889.33) (1922.07) (332.57)
Organic manure 4894.90 ** 2207.61 *** 1639.68 398.89(1908.99) (829.02) (1616.18) (383.16)
Secondary activity–livestock 1363.31 642.66 1717.26 434.98(1735.66) (823.46) (1464.70) (377.10)
Market oriented833.51 396.66 −1352.27 −321.40
(1943.45) (937.42) (1656.94) (377.31)
Constant−9148.61 * −1370.96(4658.70) (3917.38)
Sigma 9681.28 *** 7172.08 ***(776.08) (730.45)
Number of obs 169 169
LR chi2(11) 37.05 32.61
Prob > chi2 0.0001 0.0006
Pseudo R2 0.0184 0.0260
Log likelihood −987.65 −610.88
Left-censored observations (<=0) 80 114
Uncensored observations 89 55
Right-censored observations 0 0
Standard errors in parentheses, *** p < 0.01, ** p < 0.05, * p < 0.1. Source: Field surveys (2014).

Sustainability 2018, 10, 611 12 of 16
Table 7. Coefficients and marginal effect of explanatory variables on WTP for daily climate informationand agro-met advisories.
VariablesDaily Climate Information Agro-Met Advisories
Coefficient Marginal Effect Coefficient Marginal Effect
Sex male5471.56 *** 2023.92 *** 4469.12 ** 1305.66 ***(1474.08) (481.72) (1845.78) (487.20)
Educated−2953.05 * −1094.42 ** −1902.28 −568.35(1542.95) (500.75) (1952.48) (536.76)
Age −178.94 *** −75.34 *** −114.23 −36.99(59.38) (25.13) (75.87) (24.61)
Household size42.36 17.83 153.70 49.78
(112.42) (47.35) (141.65) (45.82)
Farm size−48.78 −20.54 −270.14 −87.49(100.85) (42.50) (172.71) (55.67)
Indigenous forecast 141.22 59.43 2610.37 840.90(1238.55) (520.91) (1590.74) (509.70)
Awareness to CIS5745.50 *** 2167.75 *** 4696.45 *** 1394.19 ***(1389.97) (467.56) (1701.12) (464.40)
Stone bunds−1072.17 −434.91 −2417.99 −720.70(1370.20) (536.11) (1774.13) (488.09)
Organic manure 3074.98 ** 1245.08 ** 4449.98 *** 1368.42 ***(1290.98) (503.29) (1648.35) (485.29)
Secondary activity–livestock 862.08 364.99 359.84 116.81(1178.38) (500.97) (1488.09) (483.99)
Market oriented1095.09 475.99 −955.06 −300.77
(1301.84) (582.17) (1675.67) (514.12)
Constant −2622.36 −7481.36 *(3138.12) (4090.67)
Sigma 6463.43 *** 7700.16 ***(501.84) (719.24)
Number of obs 169 169
LR chi2(11) 42.19 30.92
Prob > chi2 0.0000 0.0011
Pseudo R2 0.0216 0.0207
Log likelihood = −957.15 −731.52
Left-censored observations (<=0) 79 103
Uncensored observations 90 66
Right-censored observations 0 0
Standard errors in parentheses, *** p < 0.01, ** p < 0.05, * p < 0.1. Source: Field surveys (2014).
In relation to seasonal climate forecast, the results showed that gender (male), awareness ofclimate information and the use of SWC techniques such stone bunds had positive effect on thewillingness to pay for SCF (Table 6). The WTP for seasonal climate forecast was increased by XOF 2503when farmers were men and by XOF 2563 when they were exposed to climate information. In addition,it is increased by XOF 2208 when farmers are using organic manure as climate-smart agriculture (CSA)technologies. Similarly, Table 6 shows that gender (male) and awareness of climate information had apositive effect on the willingness to pay for decadal climate information while the education and ageof respondents had a negative effect on it. Being a man and exposed to climate information increasedthe WTP for decadal weather information by XOF 842 and XOF 1089 respectively. Being educated andold decreased the WTP for decadal weather information by XOF 757 and XOF 54 respectively.
Moreover, the results revealed that gender (male), awareness of CIS and use of organic manurehad a positive effect on the willingness to pay for daily climate information (Table 7). Conversely,

Sustainability 2018, 10, 611 13 of 16
education and age had a negative effect on the WTP of daily climate information. Being a man, exposedto climate information and using organic manure increased the WTP for daily climate information byXOF 2023, XOF 2168 and XOF 1245 respectively. Being educated and old decreased the WTP for dailyclimate information by XOF 1094 and XOF 75 respectively.
Furthermore, the results showed that gender (male), awareness of climate information and the useof organic manure and stone bunds had a positive effect on the willingness to pay for agro-advisories(Table 7). Being a man, exposed to climate information and using organic manure increased the WTPfor agro-advisories by XOF 1306, XOF 1394 and XOF 1368 respectively.
3.5. Predicted WTP and Estimation of Consumer Surplus of Climate Information Services
The predicted value of the WTP per year was used as a measure of aggregate value of CIS in thisstudy. The predicted WTP for CIS was XOF 3496 per farmer per year for seasonal climate forecasts,XOF 1066 for decadal climate information, 1985 XOF for daily climate information and 1628 XOFfor agro-advisories. As indicated in Table 8 the aggregate WTP was calculated by multiplying thepredicted WTP by the total number of households expected to have a valid response in the study area.Following this, the aggregate WTP for CIS was estimated as XOF 23,312,723 for the seasonal climateforecasts, XOF 4,394,357 for the decadal climate information, XOF 13,388,368 for the daily climateinformation and XOF 8,050,094 for the agro-advisories.
Table 8. Value for climate information services at the CCAFS CSV site of Yatenga in 2014.
CISTotal
Households atthe CSV Site
% HouseholdsWilling to Pay
for CIS
Expected Number ofHouseholds Willing
to Pay CIS
PredictedValue of the
WTP Per Year
AggregatedValue (XOF) *
Seasonalforecast 12,662 52.66 6668 3496 23,312,723
Decadalinformation 12,662 32.54 4121 1066 4,394,357
Dailyinformation 12,662 53.25 6743 1985 13,388,368
Agro-advisories 12,662 39.05 4945 1628 8,050,094
Source: Field surveys (2014); * 1 EUR = 655.957 XOF.
4. Discussion
The study showed that there is a high demand for CIS (63%) in the Yatenga province which isconsistent with the results of the few studies conducted in the region (e.g., Zongo et al. [7]). The highdemand for CIS can also be related to the high variability of climatic parameters experienced byfarmers in the region. Zongo et al. [7] found that 64% of farmers from four provinces in BurkinaFaso including Yatenga were willing to pay XOF 546 for CIS. This amount is lower compared to whatwas found from our study. However, Mabe et al. [19] found that farmers in Northern Ghana werewilling to pay an amount of GH¢41.20 (about XOF 5500) annually for weather forecast information.This is greater than what we found in this study. This means that the WTP for climate informationservices depend on many factors including physical environment of farmers and their socio-economiccharacteristics. Meza et al. [30] argued that the value of seasonal forecasts for agriculture depends onmany factors including farmers’ risk attitudes, insurance, policy environment and scale of adoption.
The study revealed that farmers’ WTP for CIS depends on the type of CIS. The most requestedCIS were the seasonal climate forecast and the daily weather information for which 53% of farmerswere willing to buy. Agro-advisories and the decadal climate information come next with 39% and33% of farmers willing to buy respectively. The value of predicted WTP follows the same trend as theobserved WTP with XOF 3496 for seasonal climate forecast, XOF 1985 for daily climate information,XOF 1689 for agro-advisories and XOF 1066 for decadal climate information. The importance accordedto the seasonal climate information can be explained by the fact that farmers use it to make strategicand tactical decisions such as selection of crops and varieties to grow, choice of location (more humid
Sustainability 2018, 10, 611 14 of 16
low lands or plain) and size of plots [9]. On the other hand, daily climate information was used for theday-to-day crop management such as choosing the date of land preparation, plowing, sowing/planting,fertilizing, hoeing, weeding, pest control, harvesting and threshing [9].
The study showed that factors such as gender, age, education, awareness of climate information,use of SWC techniques and organic manure significantly influenced farmers’ WTP for CIS. Farmerswilling to pay for all climate information and services tended to be younger people or non-educated.This contradicts the results of other authors [7–19] who reported that age has a positive effect onthe WTP for climate information demand in Ghana and Burkina Faso. Zongo et al. [7] showed thateducation of farmers positively influences the demand for CIS. This study also showed that awarenessof climate information had a higher positive effect on farmers’ WTP. This means that farmers will needto experiment CIS before they can be willing to pay for the service. The results also showed farmersusing stone bunds were unlikely to pay for the decadal information perhaps because of its ability toimprove farmers’ adaptation to climate variability [31].
The study showed that the total WTP for seasonal forecast was about XOF 23 million for 53% offarmers. If this percentage increases to 58%, the total WTP will cover the cost of the pilot project forthe dissemination of CIS in the study area which was XOF 25 million for year 2014. This means thatthere is a potential market for CIS in the study region if the number of people who want to buy the CIScan be increased by at least 5%. To do this, we have to convince 11% of farmers who still need moreevidence of the profitability of climate information use to adopt the service. We also have to support28% of farmers who are not willing to buy CIS for lack of money. In any of these instances, a deep andholistic economic assessment is needed to assess the potential for the development of a viable businessmodel on CIS in the study area. This assessment may take into account all the steps for CIS includingproduction, translation, transfer, and use of climate knowledge and information by farmers.
5. Conclusions
We used the contingent valuation method to empirically assess farmers’ preferences for climateinformation services at the CCAFS CSV site of Yatenga in Burkina Faso. The study assessed farmers’willingness-to-pay (WTP) for CIS and analyzed its determinants. While there was a general increaseddemand for climate information, the magnitude of such demand depended on the type of climateinformation. Seasonal climate forecasts and daily weather information were most demanded (53%).The WTP for climate information also depended on farmers’ characteristics. In the context of this study,factors such as gender, age, education, awareness of climate information, use of SWC techniques andorganic manure were particularly more influential in determining farmers’ WTP for CIS. The results ofthis study provided information on the type of CIS to prioritize in the study area, most appropriatedissemination channels and the cost implications that must be mainstreamed into future scaling up toachieve large-scale adoption by farmers.
Acknowledgments: This work was implemented as part of the CGIAR Research Program on Climate Change,Agriculture and Food Security (CCAFS), a strategic partnership of CGIAR and Future Earth, led by theInternational Center for Tropical Agriculture (CIAT). We acknowledge the CGIAR Fund Council, Australia(ACIAR), European Union, International Fund for Agricultural Development (IFAD), Ireland, New Zealand,Netherlands, Switzerland, USAID, UK and Thailand for funding to CCAFS.
Author Contributions: Mathieu Ouédraogo, and Robert B. Zougmoré conceived and designed the study;Silamana Barry, Gregoire Baki and Leopold Somé performed the data collection (surveys); Mathieu Ouédraogoand Silamana Barry analyzed the data; Mathieu Ouédraogo, Silamana Barry, Samuel Tettey Partey andRobert B. Zougmoré wrote the paper. All authors read, amended the earlier drafts, and approved thefinal manuscript.
Conflicts of Interest: The authors declare no conflict of interest.
References
1. Lebel, T.; Diedhiou, A.; Laurent, H. Seasonal cycle and interannual variability of the Sahelian rainfall athydrological scales. J. Geophys. Res. 2003, 108, 1–11. [CrossRef]

Sustainability 2018, 10, 611 15 of 16
2. Le Barbe, L.; Lebel, T.; Taps, D. Rainfall Variability in West Africa during the Years 1950–90. J. Clim. 2002, 15,187–202. [CrossRef]
3. Onibon, H.; Lebel, T.; Afouda, A. Space-time rainfall variability in West Africa derived from observationsand GCMs. In Proceedings of the International Conference on FRIEND (Flow Regimes from InternationalNetwork Data), Cape Town, South Africa, 18–22 March 2002; Volume 274, pp. 483–490.
4. Jalloh, A.; Nelson, G.C.; Thomas, T.S.; Zougmoré, R.; Roy-Macauley, H. (Eds.) West African Agriculture andClimate Change: A Comprehensive Analysis; IFPRI Books and Research Monographs; International Food PolicyResearch Institute (IFPRI): Washington, DC, USA, 2013; 408p, ISBN 978-0-89629-204-8. [CrossRef]
5. Diba, I.; Camara, M.; Sarr, A.B. Impacts of the Sahel-Sahara Interface Reforestation on West African Climate:Intraseasonal Variability and Extreme Precipitation Events. Adv. Meteorol. 2016, 2016, 1–20. [CrossRef]
6. Ziervogel, G.; Opere, A. Integrating meteorological and indigenous knowledge-based seasonal climateforecasts in the agricultural sector: Lessons from participatory action research in sub-Saharan Africa.Clim. Chang. Adapt. Afr. Learn. Pap. Ser. 2010, 1, 1–24.
7. Zongo, B.; Diarra, A.; Barbier, B.; Zorom, M.; Yacouba, H.; Dogot, T. Farmers’ perception and willingness topay for climate information in Burkina Faso. J. Agric. Sci. 2016, 8, 175–187. [CrossRef]
8. Debaeke, P.; Pellerin, S.; Scopel, E. Climate-smart cropping systems for temperate and tropical agriculture:Mitigation, adaptation and trade-offs. Cah. Agric. 2017, 26, 1–12. [CrossRef]
9. Ouédraogo, M.; Zougmoré, R.; Barry, S.; Somé, L.; Baki, G. The value and benefits of using seasonal climateforecasts in agriculture: Evidence from cowpea and sesame sectors in climate-smart villages of Burkina Faso.CCAFS Info Note 2015, 1–4. [CrossRef]
10. Roudier, P. Climat et agriculture en Afrique de l’Ouest: Quantification de L’impact du ChangementClimatique sur les Rendements et Evaluation de L’utilité des Prévisions Saisonnières. Thèse de Doctorat,Ecole des Hautes Etudes en Sciences Sociales, Paris France, 2012; 189p. Available online: http://www2.centre-cired.fr/IMG/pdf/roudier_these_2012.pdf (accessed on 20 December 2016).
11. MAHRH. Situation alimentaire et Nutritionnelle Résultats Définitifs de la Campagne Agricole 2014/2015 etPerspectives de la Situation Alimentaire et Nutritionnelle; MAHRH: Ouagadougou, Burkina Faso, 2008; p. 95.
12. MAAH. Rapport Général des Résultats Définitifs de la Campagne Agricole 2016/2017 et des perspectives de lasituation Alimentaire et Nutritionnelle; MAAH: Ouagadougou, Burkina Faso, 2017; p. 95.
13. APEX-Burkina. Offre Exportable du Burkina Faso: Cas du Sésame; APEX-Burkina: Ouagadougou, BurkinaFaso, 2016. Available online: http://apexb.bf/wp-content/uploads/Telecharger-fiche-sesame-burkina.pdf.(accessed on 15 December, 2017).
14. Scadd-Burkina Faso. Stratégie de Croissance Accélérée et de Développement Durable 2011—2015; Gouvernementdu Burkina Faso: Ouagadougou, Burkina Faso, 2011; 116p.
15. Sanou, J.; Bationo, A.B.; Barry, S.; Nabie, D.L.; Bayala, J.; Zougmore, R. Combining soil fertilization, croppingsystems and improved varieties to minimize climate risks on farming productivity in northern region ofBurkina Faso. Agric. Food Secur. 2016, 5, 20. [CrossRef]
16. Zougmore, R.; Ouattara, K.; Mando, A.; Ouattara, B. Rôle des nutriments dans le succès des techniques deconservation des eaux et des sols (cordons pierreux, bandes enherbées, zaï et demi-lune) au Burkina Faso.Sécheresse 2004, 15, 41–48.
17. Freebairn, J.W.; Zillman, J.W. Economic benefits of meteorological services. Meteorol. Appl. 2002, 9, 33–44.[CrossRef]
18. Pearce, D.; Turner, R.K. Economics of Natural Resources and the Environment; The Johns Hopkins Universitypress: Baltimore, MD, USA, 1990; 378p.
19. Mabe, F.N.; Nketiah, P.; Darko, D. Farmers’ willingness to pay for weather forecast information insavelugu-nanton municipality of the northern region. RJOAS 2014, 13. [CrossRef]
20. Amegnaglo, J.C.; Anaman, A.K.; Mensah-Bonsu, A.; Onumah, E.E.; Gero, A.F. Contingent valuation study ofthe benefits of seasonal climate forecasts for maize farmers in the Republic of Benin, West Africa. Clim. Serv.2017, 6, 1–11. [CrossRef]
21. Makaudze, M.E. Do Seasonal Climate Forecasts and Crop Insurance Matter for Smallholder Farmersin Zimbabwe? Using Contingent Valuation Method and Remote Sensing Applications. Ph.D. Thesis,The Ohio State University, Columbus, OH, USA, 2005. Available online: https://etd.ohiolink.edu/rws_etd/document/get/osu1110389049/inline (accessed on 15 December 2017).
Sustainability 2018, 10, 611 16 of 16
22. Predicatori, F.; Giacomazzi, F.; Frontero, P.; Bellodi, M. Agriculture and Climate Change: An Evaluation of theWillingness to Pay for Improved Weather Forecasts; FORALPS Technical Report, 12; Università degli Studi diTrento, Dipartimento di Ingegneria Civile e Ambientale: Trento, Italy, 2008; 36p. Available online: http://www.ing.unitn.it/dica/tools/download/Quaderni/Foralps_TR_12.pdf (accessed on 15 December 2017).
23. Gebremariam, G.G.; Edriss, K.A.; Maganga, M.A.; Terefe, T.A. Labor as a Payment Vehicle for Valuing SoilConservation Practices in a Subsistence Economy: Case of Adwa Woreda in Ethiopia. Am. J. Econ. 2013, 3,283–290. [CrossRef]
24. Terra, S. Guide de bonnes pratiques pour la mise en oeure de la méthode d’évaluation contingente.DoSerie Méthode 2004, 05-MO4, 74.
25. Maddala, G.S. Limited-Dependent and Qualitative Variables in Economics; Cambridge University Press:New York, NY, USA, 1983; 401p, ISBN 0521-3382-55.
26. Tobin, J. Estimation of relationship for Limited dependent variables. Econometrica 1958, 26, 24–36. [CrossRef]27. McDonald, J.F.; Moffit, R.A. The Use of Tobit Analysis. Rev. Econ. Stat. 1980, 62, 318–320. [CrossRef]28. Madala, G.S. Limited Dependent and Qualitative Variables in Econometrics; Cambridge University Press:
New York, NY, USA, 1997.29. Ouédraogo, M.; Zougmoré, R.; Moussa, S.A.; Partey, T.S.; Thornton, K.P.; Kristjanson, P.; Ndour, B.Y.N.;
Somé, L.; Naab, J.; Boureima, M.; et al. Markets and climate are driving rapid change in farming practices inSavannah West Africa. Reg. Environ. Chang. 2017, 17, 437–449. [CrossRef]
30. Meza, F.; Hansen, J.; Osgood, D. Economic Value of Seasonal Climate Forecasts for Agriculture: Reviewof Ex-Ante Assessments and Recommendations for Future Research. J. Appl. Meteorol. Climatol. 2008, 47,1269–1286. [CrossRef]
31. Zougmoré, R.; Jalloh, A.; Tioro, A. Climate-smart soil water and nutrient management options in semiaridWest Africa: A review of evidence and analysis of stone bunds and zaï techniques. Agric. Food Secur. 2014,3, 16. [CrossRef]
© 2018 by the authors. Licensee MDPI, Basel, Switzerland. This article is an open accessarticle distributed under the terms and conditions of the Creative Commons Attribution(CC BY) license (http://creativecommons.org/licenses/by/4.0/).