farmers’ perception and willingness to pay for climate
TRANSCRIPT
Journal of Agricultural Science; Vol. 8, No. 1; 2016 ISSN 1916-9752 E-ISSN 1916-9760
Published by Canadian Center of Science and Education
175
Farmers’ Perception and Willingness to Pay for Climate Information in Burkina Faso
Beteo Zongo1,2, Abdoulaye Diarra1, Bruno Barbier3, Malicki Zorom1, Hamma Yacouba1 & Thomas Dogot2 1 International Institute for Water and Environmental Engineering, Ouagadougou, Burkina Faso 2 University of Liege, Gembloux Agro-Bio Tech, Economy and Rural Development Unit, Belgium 3 Centre de Coopération Internationale en Recherche Agronomique pour le Développement, Dakar, Senegal
Correspondence: Beteo Zongo, International Institute for Water and Environmental Engineering, P.O.Box 594 Ouagadougou, Burkina Faso. E-mail: [email protected]
Received: April 29, 2015 Accepted: June 2, 2015 Online Published: December 15, 2015
doi:10.5539/jas.v8n1p175 URL: http://dx.doi.org/10.5539/jas.v8n1p175
Abstract This study highlights the perception and the option value of climate information in the sahelian and sudano-sahelian agro-climatic zones of Burkina Faso. From the sampled farmers only 21.78% have access to climate information, while 93% of them need climate information to guide through their decision in planning agricultural activities. Option value shows the interest granted by farmers using climate information. About 64% of the farmers are willing to pay an average of Francs CFA 546.34 to obtain climate information. The willingness to pay is determined by the the farmers’ ability to predict the climate, to use radio as a means of information, farmers’ awareness of previous forecasts and early onset of rainy season. While farmers considered benefits from the use of climate information, it is clear that its contribution to farm income remains a field of research to explore. Thus it is necessary to experiment with individual farms and to evaluate the contribution of climate information to the value added in different crops and farmers’ income. Keywords: farmers, rainy season, climate information, willingness to pay
1. Introduction The use of seasonal climate forecasts based on indigenous knowledge is a traditional strategy of West African farmers to reduce climate risks on their crop yields (Roncoli, 2006; Nyong, Adesina, & Osman, 2007). This traditional seasonal climate forecast, operating as an endogenous system of climate information, guides farmers to make choices on plots to cultivate, types of crop varieties and planting date. The main indicators of these endogenous seasonal climate forecasts are environmental (moon, cloud, wind), biological (animals, plants), magic and religious (Phillips, Deane, Unganai, & Chimeli, 2002). They are transmitted from one generation to another by oral tradition.
Despite their importance, these endogenous forecasts are becoming less reliable because of climate change over the past two decades (Ingram, Roncoli, & Kirshen, 2002; Roncoli et al., 2008). The length of rainy season is varying, with the number of rainy days changing from one year to the other (Sultan & Janicot, 2003; Traore, Corbeels, Van-Wijk, Rufino, & Giller, 2013). Seasonal rainfall amount, intra-seasonal rain-fall distribution and its onset and ending dates influence crop yields and determine the agricultural calendar (Marteau et al., 2011). Distortions in indicators transmission from one generation to the other question also the reliability of these forecasts (Roncoli et al., 2008).Therefore, farmers are looking for new strategies for seasonal climate forecasts to better plan seasonal crops production (Ingram et al., 2002).
Climate information is one of possible ways to mitigate the adverse effects of climate change on agriculture productivity (Hansen, 2002; Challinor, 2009). It consists of publishing seasonal forecasts from climate models to farmers (Klopper, Vogel, & Landman, 2006). These seasonal predictions usually provide information on the probability of the starting and ending dates of the rainy season, the length of the season, the number of rainy days, the annual cumulative rainfall, the average and maximum duration of dry spells during the rainy season (Traore et al., 2014; Goddard et al., 2010). Various studies showed that climate information are integrated in farmers' decisions especially in the United States (Carberry et al., 2002), Mexico (Adams et al., 2003), Argentina (Podesta et al., 2002), Lesotho (Ziervogel, Bithell, & Washington, 2005), Australia (Hammer et al., 2001),
www.ccsen
Zimbabwestudies arehas been pTall, 2011Dembelé, informatio
The purpolandlockedWe formuprobative afor climate
2. Materia2.1 Study A
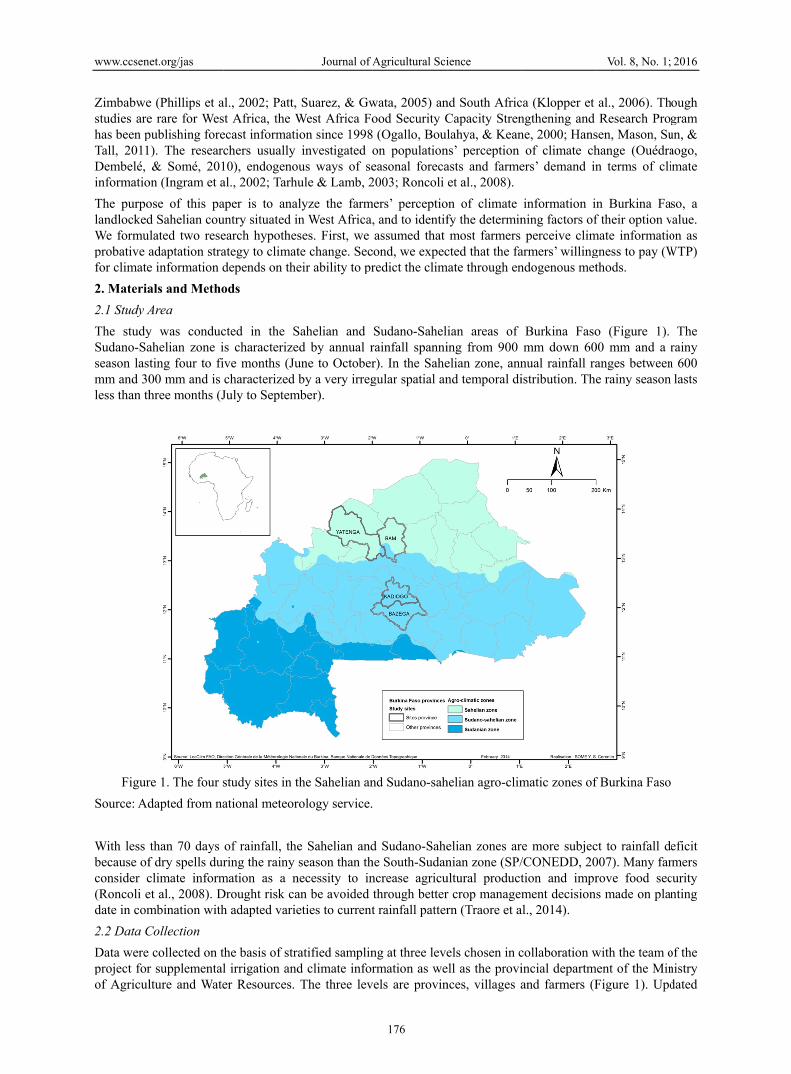
The studySudano-Saseason lasmm and 30less than th
Figur
Source: Ad
With less because ofconsider c(Roncoli edate in com
2.2 Data C
Data were project forof Agricul
net.org/jas
e (Phillips et ae rare for Wespublishing fore). The researc& Somé, 201
on (Ingram et a
ose of this pad Sahelian cou
ulated two reseadaptation strae information d
als and MethoArea
y was conducahelian zone iting four to fi00 mm and is hree months (J
re 1. The four s
dapted from na
than 70 days f dry spells durclimate informet al., 2008). Dmbination with
Collection
collected on tr supplementallture and Wate
al., 2002; Patt, st Africa, the Wecast informatichers usually 10), endogenoal., 2002; Tarhu
aper is to analuntry situated inearch hypothesategy to climatdepends on the
ods
cted in the Sis characterizeive months (Jucharacterized July to Septem
study sites in t
ational meteor
of rainfall, thering the rainy
mation as a nDrought risk cah adapted varie
the basis of stral irrigation ander Resources.
Journal of A
Suarez, & GwWest Africa Foion since 1998investigated ous ways of seule & Lamb, 2
lyze the farmn West Africa,ses. First, we te change. Seceir ability to pr
Sahelian anded by annual rune to Octoberby a very irreg
mber).
the Sahelian an
rology service.
e Sahelian andseason than th
necessity to inan be avoided eties to current
atified samplind climate inforThe three lev
Agricultural Sci
176
wata, 2005) anood Security C (Ogallo, Boulon populationeasonal foreca2003; Roncoli
mers’ perceptio, and to identifassumed that
cond, we expecredict the clim
Sudano-Sahelrainfall spannir). In the Sahegular spatial an
nd Sudano-sah
d Sudano-Sahehe South-Sudanncrease agricuthrough bettert rainfall patter
ng at three levermation as we
vels are provin
ience
nd South AfricCapacity Strenlahya, & Kean
ns’ perception asts and farmeet al., 2008).
on of climate fy the determinmost farmers
cted that the famate through en
ian areas ofing from 900 elian zone, annnd temporal di
helian agro-clim
elian zones arnian zone (SP/ultural productr crop managemrn (Traore et a
els chosen in cell as the provinces, villages a
ca (Klopper et ngthening and ne, 2000; Hans
of climate chers’ demand in
information inning factors ofperceive clim
armers’ willingndogenous met
Burkina Fasomm down 60
nual rainfall raistribution. The
matic zones of
e more subjec/CONEDD, 20tion and imprment decision
al., 2014).
collaboration wincial departmand farmers (F
Vol. 8, No. 1;
al., 2006). ThResearch Pro
sen, Mason, Suhange (Ouédran terms of cli
n Burkina Faf their option v
mate informatiogness to pay (Wthods.
o (Figure 1).00 mm and a anges betweene rainy season
f Burkina Faso
ct to rainfall d007). Many farrove food secs made on plan
with the team oment of the Min
Figure 1). Upd
2016
ough gram un, & aogo, imate
so, a value. on as
WTP)
The rainy
n 600 lasts
eficit rmers curity nting
of the nistry dated
www.ccsenet.org/jas Journal of Agricultural Science Vol. 8, No. 1; 2016
177
data on the number of farmers per village were obtained from the permanent agricultural survey of the Ministry of Agriculture and Water Resources. According to this data base, 629 farmers located in 11 villages were surveyed from January to February 2014 in the provinces of Yatenga, Bam, Kadiogo and Bazega. In each village, a third of the farmers were randomly selected for the survey.
Data were collected using a structured questionnaire referring to farmers’ socio-economic characteristics and planted crop (Table 1). The data collection was also related to farmers’ endogenous seasonal forecasts, their perception of climate information and WTP it.
2.3 Data Analysis
The chi-square test was used to compare farmers’ perception of seasonal climate forecasts and potential users’ socioeconomic characteristics at significance level p = 5%. Analysis of variance and the Kruskal-Wallis test were used respectively to compare the average and median income in grain production and farmers’ WTP threshold of significance p = 5%. Average and median WTP were calculated excluding the true zeros.
Estimated true zeros are given WTP nulls by farmers because their agricultural productivity will not be improved even if they benefit from climate information. On the contrary, false zeros are WTP nulls per farmers when they need climate information to guide their decision making in planning agricultural production. According to Terra (2005), when the proportion of sample true zeros is small (10% threshold), the appropriate model for the analysis of the determinants of WTP is the Heckman (1979) model. Otherwise Tobin (1958) model is indicated. It analyzes the positive valuations (WTP > 0 and true zeros) excluding false zeros.
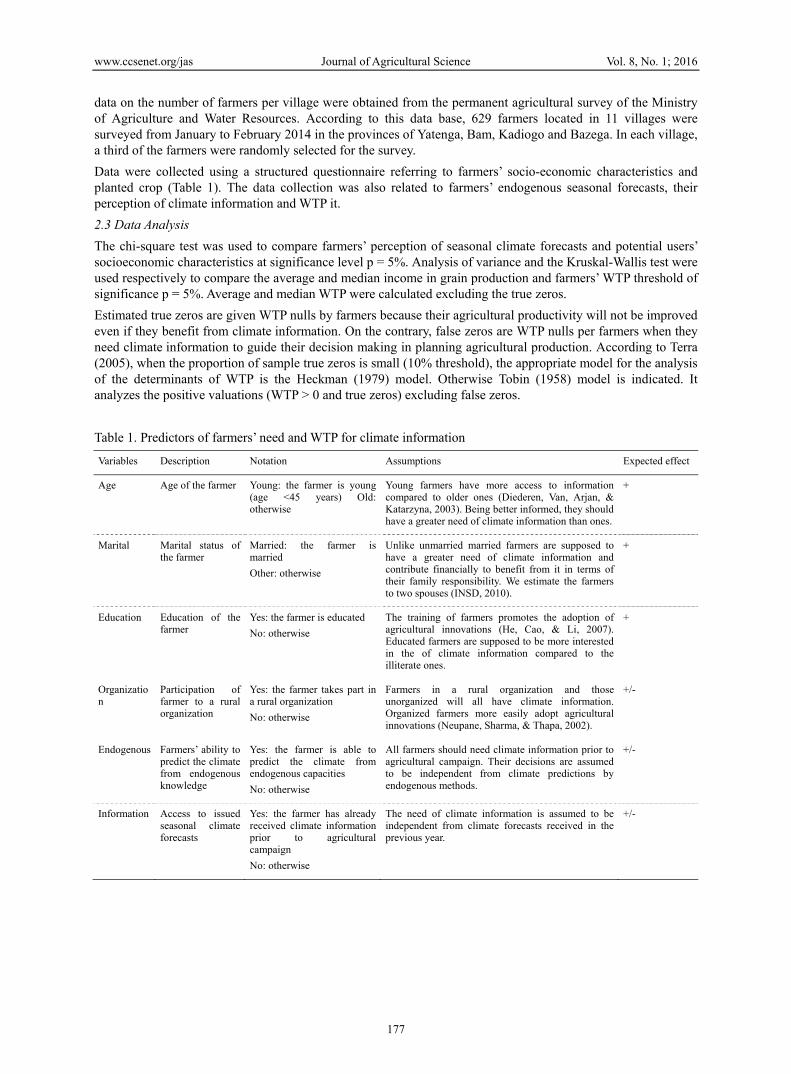
Table 1. Predictors of farmers’ need and WTP for climate information
Variables Description Notation Assumptions Expected effect
Age Age of the farmer Young: the farmer is young (age <45 years) Old: otherwise
Young farmers have more access to information compared to older ones (Diederen, Van, Arjan, & Katarzyna, 2003). Being better informed, they should have a greater need of climate information than ones.
+
Marital Marital status of the farmer
Married: the farmer is married
Other: otherwise
Unlike unmarried married farmers are supposed to have a greater need of climate information and contribute financially to benefit from it in terms of their family responsibility. We estimate the farmers to two spouses (INSD, 2010).
+
Education Education of the farmer
Yes: the farmer is educated
No: otherwise
The training of farmers promotes the adoption of agricultural innovations (He, Cao, & Li, 2007). Educated farmers are supposed to be more interested in the of climate information compared to the illiterate ones.
+
Organization
Participation of farmer to a rural organization
Yes: the farmer takes part in a rural organization
No: otherwise
Farmers in a rural organization and those unorganized will all have climate information. Organized farmers more easily adopt agricultural innovations (Neupane, Sharma, & Thapa, 2002).
+/-
Endogenous Farmers’ ability to predict the climate from endogenous knowledge
Yes: the farmer is able to predict the climate from endogenous capacities
No: otherwise
All farmers should need climate information prior to agricultural campaign. Their decisions are assumed to be independent from climate predictions by endogenous methods.
+/-
Information Access to issued seasonal climate forecasts
Yes: the farmer has already received climate information prior to agricultural campaign
No: otherwise
The need of climate information is assumed to be independent from climate forecasts received in the previous year.
+/-
www.ccsenet.org/jas Journal of Agricultural Science Vol. 8, No. 1; 2016
178
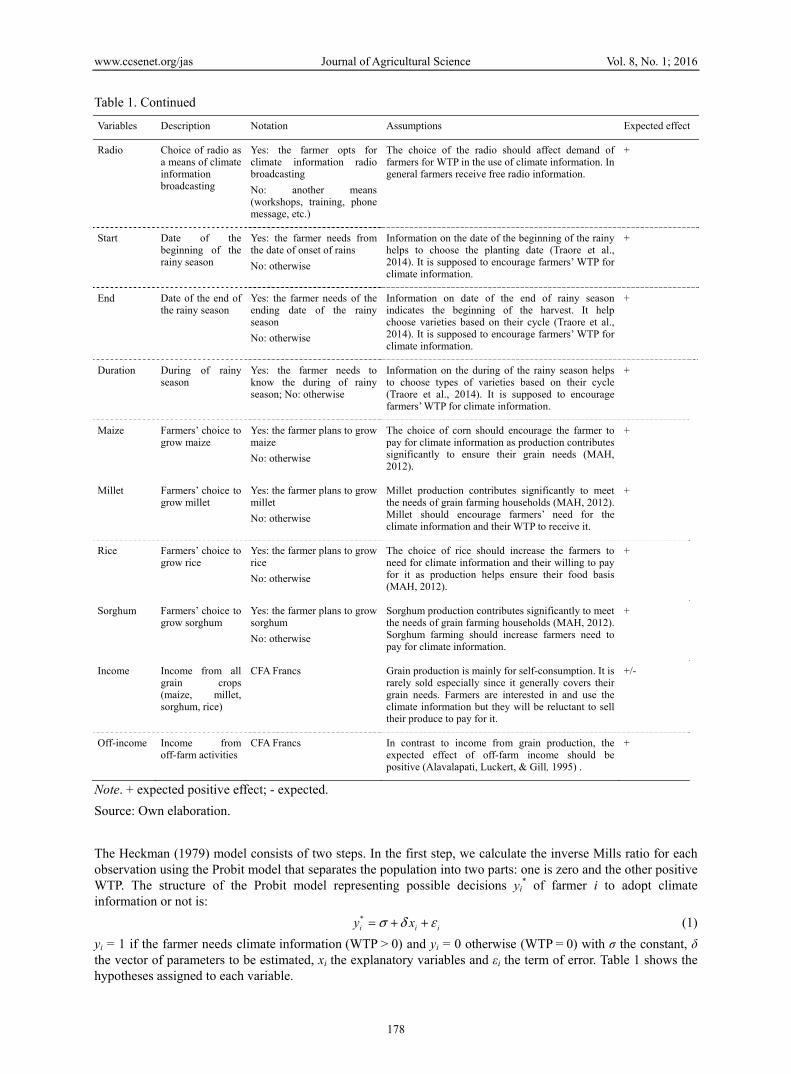
Table 1. Continued
Variables Description Notation Assumptions Expected effect
Radio Choice of radio as a means of climate information broadcasting
Yes: the farmer opts for climate information radio broadcasting
No: another means (workshops, training, phone message, etc.)
The choice of the radio should affect demand of farmers for WTP in the use of climate information. In general farmers receive free radio information.
+
Start Date of the beginning of the rainy season
Yes: the farmer needs from the date of onset of rains
No: otherwise
Information on the date of the beginning of the rainy helps to choose the planting date (Traore et al., 2014). It is supposed to encourage farmers’ WTP for climate information.
+
End Date of the end of the rainy season
Yes: the farmer needs of the ending date of the rainy season
No: otherwise
Information on date of the end of rainy season indicates the beginning of the harvest. It help choose varieties based on their cycle (Traore et al., 2014). It is supposed to encourage farmers’ WTP for climate information.
+
Duration During of rainy season
Yes: the farmer needs to know the during of rainy season; No: otherwise
Information on the during of the rainy season helps to choose types of varieties based on their cycle (Traore et al., 2014). It is supposed to encourage farmers’ WTP for climate information.
+
Maize Farmers’ choice to grow maize
Yes: the farmer plans to grow maize
No: otherwise
The choice of corn should encourage the farmer to pay for climate information as production contributes significantly to ensure their grain needs (MAH, 2012).
+
Millet Farmers’ choice to grow millet
Yes: the farmer plans to grow millet
No: otherwise
Millet production contributes significantly to meet the needs of grain farming households (MAH, 2012). Millet should encourage farmers’ need for the climate information and their WTP to receive it.
+
Rice Farmers’ choice to grow rice
Yes: the farmer plans to grow rice
No: otherwise
The choice of rice should increase the farmers to need for climate information and their willing to pay for it as production helps ensure their food basis (MAH, 2012).
+
Sorghum Farmers’ choice to grow sorghum
Yes: the farmer plans to grow sorghum
No: otherwise
Sorghum production contributes significantly to meet the needs of grain farming households (MAH, 2012). Sorghum farming should increase farmers need to pay for climate information.
+
Income Income from all grain crops (maize, millet, sorghum, rice)
CFA Francs Grain production is mainly for self-consumption. It is rarely sold especially since it generally covers their grain needs. Farmers are interested in and use the climate information but they will be reluctant to sell their produce to pay for it.
+/-
Off-income Income from off-farm activities
CFA Francs In contrast to income from grain production, the expected effect of off-farm income should be positive (Alavalapati, Luckert, & Gill, 1995) .
+
Note. + expected positive effect; - expected.
Source: Own elaboration.
The Heckman (1979) model consists of two steps. In the first step, we calculate the inverse Mills ratio for each observation using the Probit model that separates the population into two parts: one is zero and the other positive WTP. The structure of the Probit model representing possible decisions yi
* of farmer i to adopt climate information or not is:
*i i iy x (1)
yi = 1 if the farmer needs climate information (WTP > 0) and yi = 0 otherwise (WTP = 0) with σ the constant, δ the vector of parameters to be estimated, xi the explanatory variables and εi the term of error. Table 1 shows the hypotheses assigned to each variable.
www.ccsenet.org/jas Journal of Agricultural Science Vol. 8, No. 1; 2016
179
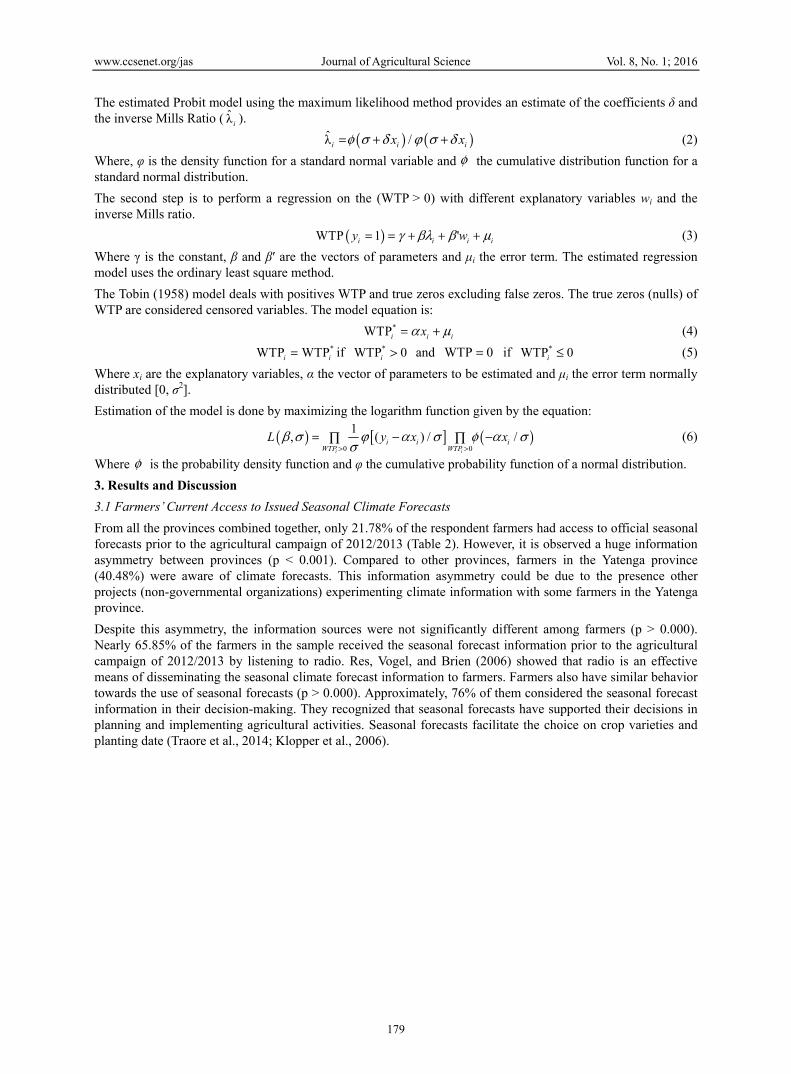
The estimated Probit model using the maximum likelihood method provides an estimate of the coefficients δ and the inverse Mills Ratio ( λ̂ i ).
λ̂ /i i ix x (2)
Where, φ is the density function for a standard normal variable and the cumulative distribution function for a standard normal distribution.
The second step is to perform a regression on the (WTP > 0) with different explanatory variables wi and the inverse Mills ratio.
WTP 1 'i i i iy w (3)
Where γ is the constant, β and β′ are the vectors of parameters and μi the error term. The estimated regression model uses the ordinary least square method.
The Tobin (1958) model deals with positives WTP and true zeros excluding false zeros. The true zeros (nulls) of WTP are considered censored variables. The model equation is:
*WTPi i ix (4) *WTP WTPi i if *WTP 0i and WTP 0 if *WTP 0i (5)
Where xi are the explanatory variables, α the vector of parameters to be estimated and μi the error term normally distributed [0, σ2].
Estimation of the model is done by maximizing the logarithm function given by the equation:
0 0
1, ( ) / /
i i
i i iWTP WTP
L y x x
(6)
Where is the probability density function and φ the cumulative probability function of a normal distribution.
3. Results and Discussion 3.1 Farmers’ Current Access to Issued Seasonal Climate Forecasts
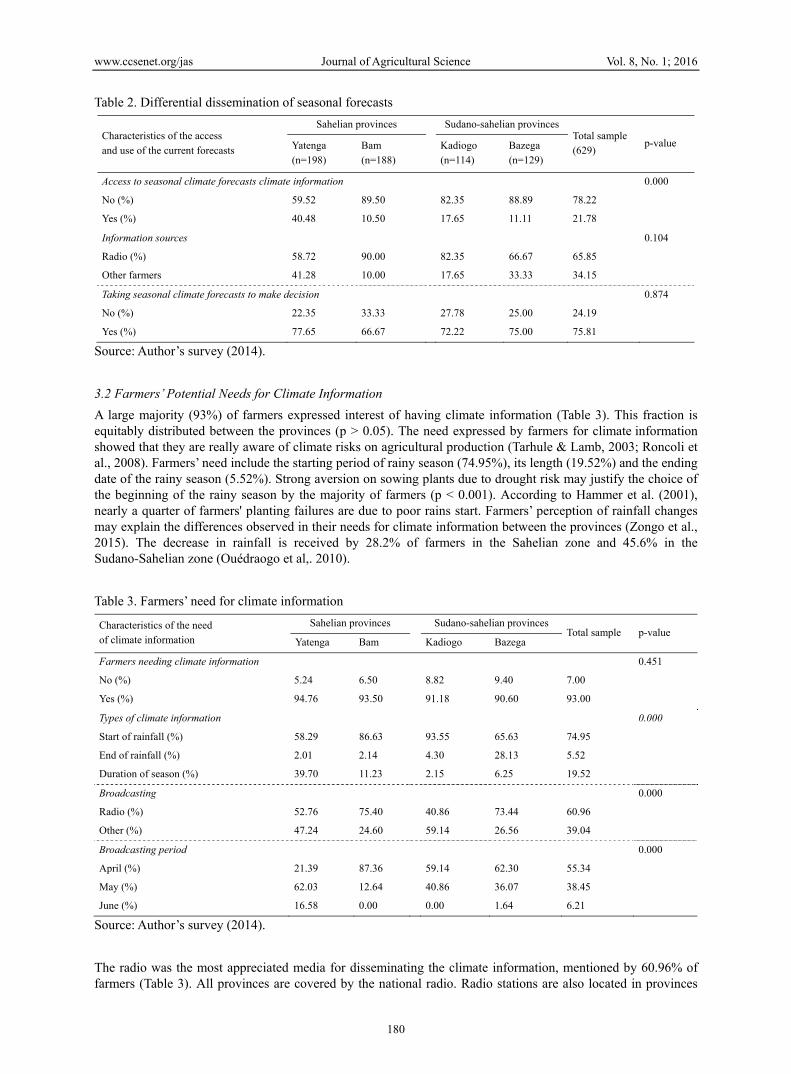
From all the provinces combined together, only 21.78% of the respondent farmers had access to official seasonal forecasts prior to the agricultural campaign of 2012/2013 (Table 2). However, it is observed a huge information asymmetry between provinces (p < 0.001). Compared to other provinces, farmers in the Yatenga province (40.48%) were aware of climate forecasts. This information asymmetry could be due to the presence other projects (non-governmental organizations) experimenting climate information with some farmers in the Yatenga province.
Despite this asymmetry, the information sources were not significantly different among farmers (p > 0.000). Nearly 65.85% of the farmers in the sample received the seasonal forecast information prior to the agricultural campaign of 2012/2013 by listening to radio. Res, Vogel, and Brien (2006) showed that radio is an effective means of disseminating the seasonal climate forecast information to farmers. Farmers also have similar behavior towards the use of seasonal forecasts (p > 0.000). Approximately, 76% of them considered the seasonal forecast information in their decision-making. They recognized that seasonal forecasts have supported their decisions in planning and implementing agricultural activities. Seasonal forecasts facilitate the choice on crop varieties and planting date (Traore et al., 2014; Klopper et al., 2006).
www.ccsenet.org/jas Journal of Agricultural Science Vol. 8, No. 1; 2016
180
Table 2. Differential dissemination of seasonal forecasts
Characteristics of the access and use of the current forecasts
Sahelian provinces Sudano-sahelian provincesTotal sample (629)
p-value Yatenga (n=198)
Bam (n=188)
Kadiogo (n=114)
Bazega (n=129)
Access to seasonal climate forecasts climate information 0.000
No (%) 59.52 89.50 82.35 88.89 78.22
Yes (%) 40.48 10.50 17.65 11.11 21.78
Information sources 0.104
Radio (%) 58.72 90.00 82.35 66.67 65.85
Other farmers 41.28 10.00 17.65 33.33 34.15
Taking seasonal climate forecasts to make decision 0.874
No (%) 22.35 33.33 27.78 25.00 24.19
Yes (%) 77.65 66.67 72.22 75.00 75.81
Source: Author’s survey (2014).
3.2 Farmers’ Potential Needs for Climate Information
A large majority (93%) of farmers expressed interest of having climate information (Table 3). This fraction is equitably distributed between the provinces (p > 0.05). The need expressed by farmers for climate information showed that they are really aware of climate risks on agricultural production (Tarhule & Lamb, 2003; Roncoli et al., 2008). Farmers’ need include the starting period of rainy season (74.95%), its length (19.52%) and the ending date of the rainy season (5.52%). Strong aversion on sowing plants due to drought risk may justify the choice of the beginning of the rainy season by the majority of farmers (p < 0.001). According to Hammer et al. (2001), nearly a quarter of farmers' planting failures are due to poor rains start. Farmers’ perception of rainfall changes may explain the differences observed in their needs for climate information between the provinces (Zongo et al., 2015). The decrease in rainfall is received by 28.2% of farmers in the Sahelian zone and 45.6% in the Sudano-Sahelian zone (Ouédraogo et al,. 2010).
Table 3. Farmers’ need for climate information
Characteristics of the need of climate information
Sahelian provinces Sudano-sahelian provinces Total sample p-value
Yatenga Bam Kadiogo Bazega
Farmers needing climate information 0.451
No (%) 5.24 6.50 8.82 9.40 7.00
Yes (%) 94.76 93.50 91.18 90.60 93.00
Types of climate information 0.000
Start of rainfall (%) 58.29 86.63 93.55 65.63 74.95
End of rainfall (%) 2.01 2.14 4.30 28.13 5.52
Duration of season (%) 39.70 11.23 2.15 6.25 19.52
Broadcasting 0.000
Radio (%) 52.76 75.40 40.86 73.44 60.96
Other (%) 47.24 24.60 59.14 26.56 39.04
Broadcasting period 0.000
April (%) 21.39 87.36 59.14 62.30 55.34
May (%) 62.03 12.64 40.86 36.07 38.45
June (%) 16.58 0.00 0.00 1.64 6.21
Source: Author’s survey (2014).
The radio was the most appreciated media for disseminating the climate information, mentioned by 60.96% of farmers (Table 3). All provinces are covered by the national radio. Radio stations are also located in provinces
www.ccsenet.org/jas Journal of Agricultural Science Vol. 8, No. 1; 2016
181
(Bam and Yatenga). Differentiated choice of radio (p < 0.000) as a means of information on climate information between provinces is related to the rate of possession of radios by farmers and their financial power to purchase rechargeable batteries (Roncoli et al., 2008).
Concerning the best period for getting climate information, 55.54% of the surveyed farmers chose April. This month is the start of agricultural activities: zaï, bunds, application of organic manure in the fields. The heterogeneity choices of broadcasting periods (p < 0.001) derives from farmers’ agricultural practices and the beginning of the rainy season of the previous campaign between the provinces (Ingram et al., 2002).
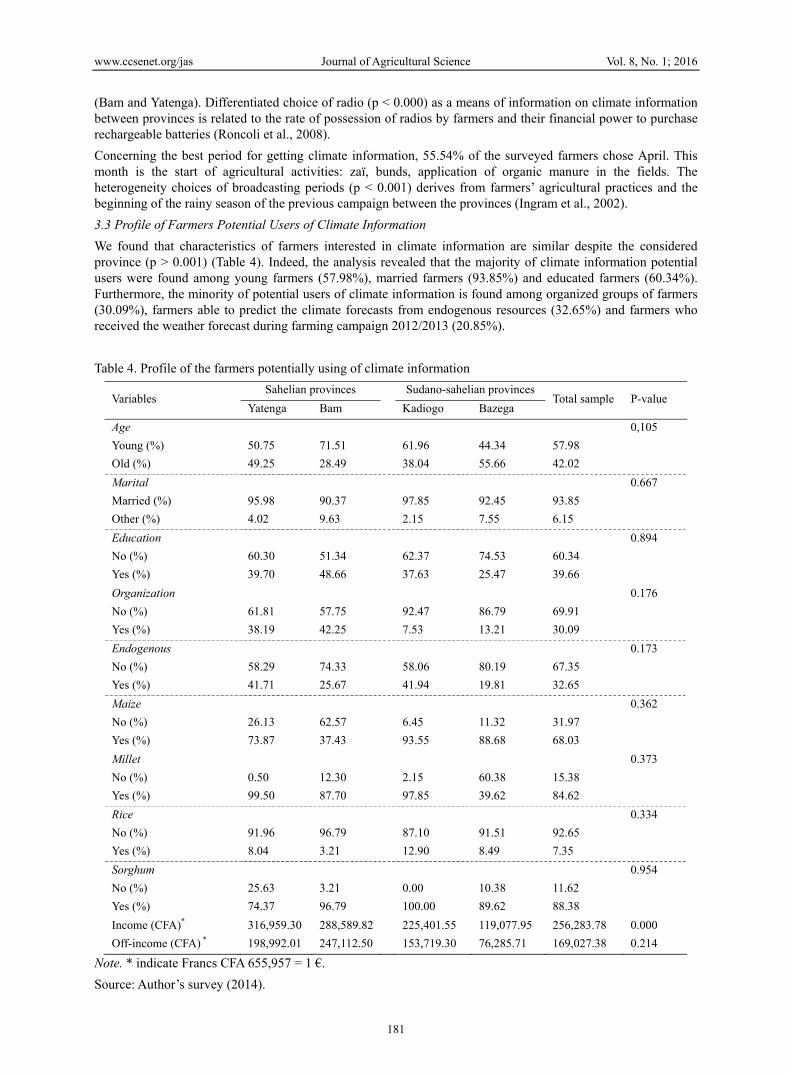
3.3 Profile of Farmers Potential Users of Climate Information
We found that characteristics of farmers interested in climate information are similar despite the considered province (p > 0.001) (Table 4). Indeed, the analysis revealed that the majority of climate information potential users were found among young farmers (57.98%), married farmers (93.85%) and educated farmers (60.34%). Furthermore, the minority of potential users of climate information is found among organized groups of farmers (30.09%), farmers able to predict the climate forecasts from endogenous resources (32.65%) and farmers who received the weather forecast during farming campaign 2012/2013 (20.85%).
Table 4. Profile of the farmers potentially using of climate information
Variables Sahelian provinces Sudano-sahelian provinces
Total sample P-value Yatenga Bam Kadiogo Bazega
Age 0,105
Young (%) 50.75 71.51 61.96 44.34 57.98
Old (%) 49.25 28.49 38.04 55.66 42.02
Marital 0.667
Married (%) 95.98 90.37 97.85 92.45 93.85
Other (%) 4.02 9.63 2.15 7.55 6.15
Education 0.894
No (%) 60.30 51.34 62.37 74.53 60.34
Yes (%) 39.70 48.66 37.63 25.47 39.66
Organization 0.176
No (%) 61.81 57.75 92.47 86.79 69.91
Yes (%) 38.19 42.25 7.53 13.21 30.09
Endogenous 0.173
No (%) 58.29 74.33 58.06 80.19 67.35
Yes (%) 41.71 25.67 41.94 19.81 32.65
Maize 0.362
No (%) 26.13 62.57 6.45 11.32 31.97
Yes (%) 73.87 37.43 93.55 88.68 68.03
Millet 0.373
No (%) 0.50 12.30 2.15 60.38 15.38
Yes (%) 99.50 87.70 97.85 39.62 84.62
Rice 0.334
No (%) 91.96 96.79 87.10 91.51 92.65
Yes (%) 8.04 3.21 12.90 8.49 7.35
Sorghum 0.954
No (%) 25.63 3.21 0.00 10.38 11.62
Yes (%) 74.37 96.79 100.00 89.62 88.38
Income (CFA)* 316,959.30 288,589.82 225,401.55 119,077.95 256,283.78 0.000
Off-income (CFA) * 198,992.01 247,112.50 153,719.30 76,285.71 169,027.38 0.214
Note. * indicate Francs CFA 655,957 = 1 €.
Source: Author’s survey (2014).
www.ccsenet.org/jas Journal of Agricultural Science Vol. 8, No. 1; 2016
182
Sorghum (88.38%), millet (84.62%) and maize (68.03%) were the main crops grown on their farmlands during the agricultural year 2012 /2013. The production of these crops is only the staple food of the rural populations (Janin, 2010). Rice is rarely cultivated (7.35%) because soils are not favorable.
The average of off-farm income is estimated at Francs CFA 169,027.38 per farmer. The average income of grain production (maize, millet, sorghum, rice) is estimated at Francs CFA 9,842.12 per farmer. Unlike previous features, the Kruskal-Wallis test shows that the income from the grain production is significantly different within and between agro-climatic zones (p < 0.001). This difference could be related not only to the irregular distribution of rainfall (Balme, Galle, & Thierry, 2005) but also to crop management techniques adopted by farmers (Ouédraogo et al., 2010).
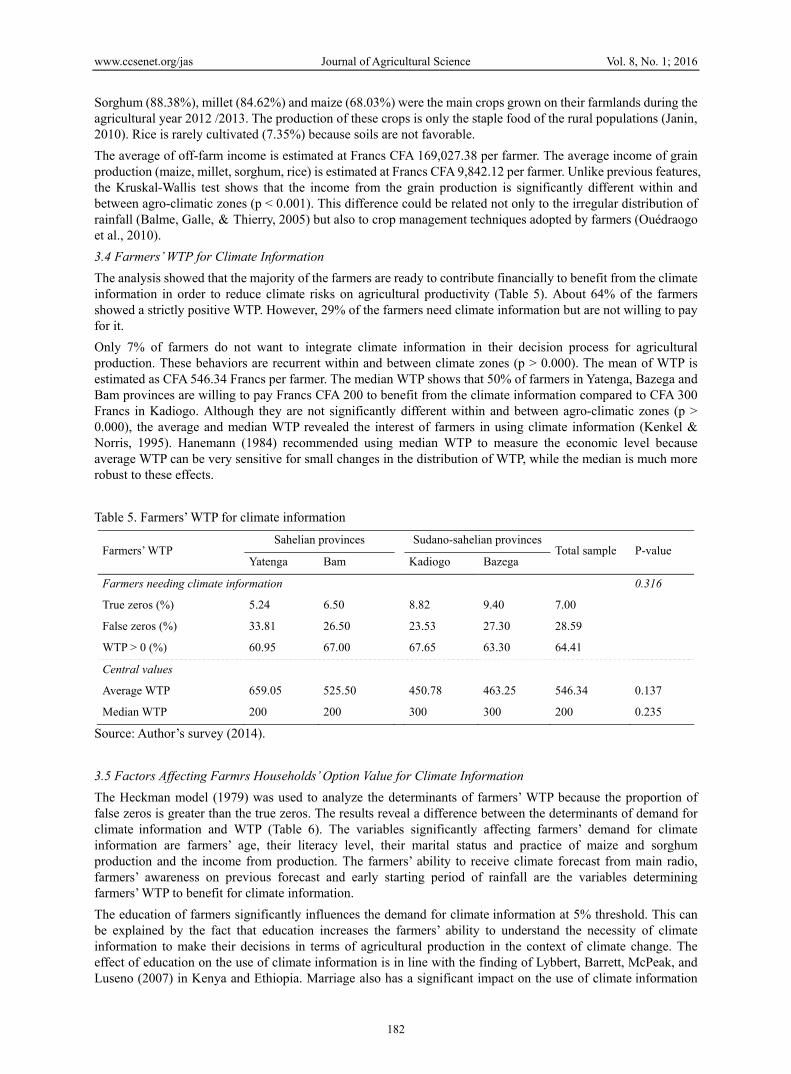
3.4 Farmers’ WTP for Climate Information
The analysis showed that the majority of the farmers are ready to contribute financially to benefit from the climate information in order to reduce climate risks on agricultural productivity (Table 5). About 64% of the farmers showed a strictly positive WTP. However, 29% of the farmers need climate information but are not willing to pay for it.
Only 7% of farmers do not want to integrate climate information in their decision process for agricultural production. These behaviors are recurrent within and between climate zones (p > 0.000). The mean of WTP is estimated as CFA 546.34 Francs per farmer. The median WTP shows that 50% of farmers in Yatenga, Bazega and Bam provinces are willing to pay Francs CFA 200 to benefit from the climate information compared to CFA 300 Francs in Kadiogo. Although they are not significantly different within and between agro-climatic zones (p > 0.000), the average and median WTP revealed the interest of farmers in using climate information (Kenkel & Norris, 1995). Hanemann (1984) recommended using median WTP to measure the economic level because average WTP can be very sensitive for small changes in the distribution of WTP, while the median is much more robust to these effects.
Table 5. Farmers’ WTP for climate information
Farmers’ WTP Sahelian provinces Sudano-sahelian provinces
Total sample P-value Yatenga Bam Kadiogo Bazega
Farmers needing climate information 0.316
True zeros (%) 5.24 6.50 8.82 9.40 7.00
False zeros (%) 33.81 26.50 23.53 27.30 28.59
WTP > 0 (%) 60.95 67.00 67.65 63.30 64.41
Central values
Average WTP 659.05 525.50 450.78 463.25 546.34 0.137
Median WTP 200 200 300 300 200 0.235
Source: Author’s survey (2014).
3.5 Factors Affecting Farmrs Households’ Option Value for Climate Information
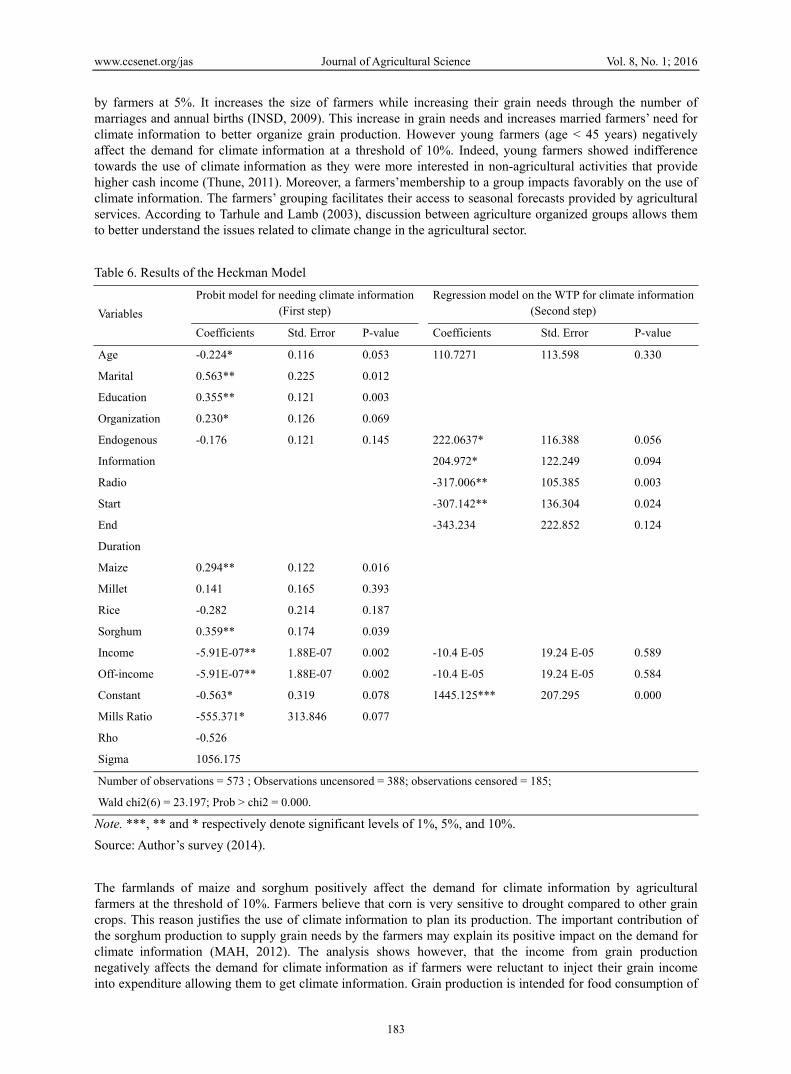
The Heckman model (1979) was used to analyze the determinants of farmers’ WTP because the proportion of false zeros is greater than the true zeros. The results reveal a difference between the determinants of demand for climate information and WTP (Table 6). The variables significantly affecting farmers’ demand for climate information are farmers’ age, their literacy level, their marital status and practice of maize and sorghum production and the income from production. The farmers’ ability to receive climate forecast from main radio, farmers’ awareness on previous forecast and early starting period of rainfall are the variables determining farmers’ WTP to benefit for climate information.
The education of farmers significantly influences the demand for climate information at 5% threshold. This can be explained by the fact that education increases the farmers’ ability to understand the necessity of climate information to make their decisions in terms of agricultural production in the context of climate change. The effect of education on the use of climate information is in line with the finding of Lybbert, Barrett, McPeak, and Luseno (2007) in Kenya and Ethiopia. Marriage also has a significant impact on the use of climate information
www.ccsenet.org/jas Journal of Agricultural Science Vol. 8, No. 1; 2016
183
by farmers at 5%. It increases the size of farmers while increasing their grain needs through the number of marriages and annual births (INSD, 2009). This increase in grain needs and increases married farmers’ need for climate information to better organize grain production. However young farmers (age < 45 years) negatively affect the demand for climate information at a threshold of 10%. Indeed, young farmers showed indifference towards the use of climate information as they were more interested in non-agricultural activities that provide higher cash income (Thune, 2011). Moreover, a farmers’membership to a group impacts favorably on the use of climate information. The farmers’ grouping facilitates their access to seasonal forecasts provided by agricultural services. According to Tarhule and Lamb (2003), discussion between agriculture organized groups allows them to better understand the issues related to climate change in the agricultural sector.
Table 6. Results of the Heckman Model
Variables
Probit model for needing climate information(First step)
Regression model on the WTP for climate information(Second step)
Coefficients Std. Error P-value Coefficients Std. Error P-value
Age -0.224* 0.116 0.053 110.7271 113.598 0.330
Marital 0.563** 0.225 0.012
Education 0.355** 0.121 0.003
Organization 0.230* 0.126 0.069
Endogenous -0.176 0.121 0.145 222.0637* 116.388 0.056
Information 204.972* 122.249 0.094
Radio -317.006** 105.385 0.003
Start -307.142** 136.304 0.024
End -343.234 222.852 0.124
Duration
Maize 0.294** 0.122 0.016
Millet 0.141 0.165 0.393
Rice -0.282 0.214 0.187
Sorghum 0.359** 0.174 0.039
Income -5.91E-07** 1.88E-07 0.002 -10.4 E-05 19.24 E-05 0.589
Off-income -5.91E-07** 1.88E-07 0.002 -10.4 E-05 19.24 E-05 0.584
Constant -0.563* 0.319 0.078 1445.125*** 207.295 0.000
Mills Ratio -555.371* 313.846 0.077
Rho -0.526
Sigma 1056.175
Number of observations = 573 ; Observations uncensored = 388; observations censored = 185;
Wald chi2(6) = 23.197; Prob > chi2 = 0.000.
Note. ***, ** and * respectively denote significant levels of 1%, 5%, and 10%.
Source: Author’s survey (2014).
The farmlands of maize and sorghum positively affect the demand for climate information by agricultural farmers at the threshold of 10%. Farmers believe that corn is very sensitive to drought compared to other grain crops. This reason justifies the use of climate information to plan its production. The important contribution of the sorghum production to supply grain needs by the farmers may explain its positive impact on the demand for climate information (MAH, 2012). The analysis shows however, that the income from grain production negatively affects the demand for climate information as if farmers were reluctant to inject their grain income into expenditure allowing them to get climate information. Grain production is intended for food consumption of
www.ccsenet.org/jas Journal of Agricultural Science Vol. 8, No. 1; 2016
184
farmers. Farmers rarely sell grain production as they usually cover their food needs (Janin, 2010). Unlike grain revenue, off-farm income positively affects the demand for climate information of farmers. Farmers consider paying for the benefit of climate information from incomes generated by activities such as gold mining, trade, masonry.
Broadcasting of climate forecasts during the rainy season of 2012/2013 has a positive impact on the value of WTP for climate information. Producers believe that the expectations have guided their decisions during the planning of agricultural activities. These reasons justify the value placed on the climate information through their WTP. The use of radio as a means to be informed about climate information affects the value of farmers’ WTP. Indeed farmers believe that climate information should be free if they are broadcasted by radio channel (Lybbert et al., 2007). Therefore, they are not willing to pay for climate information. They prefer to pay if climate information is issued by other means of communication such as telephone and agricultural services. Broadcasting forecasts on the starting dates of rainfall affected farmers’ WTP for climate information at the threshold of 10%. Indeed predicting the rainfall starting dates allows farmers to plan the sowing date (Klopper et al., 2006). However, they are not willing to pay for only the dates of rainfall. Rather they want to pay for a package of climate information constituted by starting dates of rainfall, length of the season and its end.
4. Conclusions and Recommendations This study analyzed the perception and the option value of climate information in the sahelian and sudano-sahelian agro-climatic zones of Burkina Faso. It showed that the climate information is asymmetrically distributed to a minority (21.78%) of the sampled farmers. The analysis revealed that the majority (93%) of the farmers need climate information to guide their decision in planning agricultural activities. The determining factors of the demand for climate information are the farmers’ age, their literacy level, marital status, their maize and sorghum production and also the added value of grain production. Option value shows the interest granted by farmers using climate information. About 64% of the farmers willing to pay would pay an average of CFA 546.34 Francs to obtain climate information. The WTP is determined by the farmers’ability to predict the climate, to use radio as a means of information, farmers’awareness on the previous forecast and early onset of the rainy season. While farmers considered benefit from the use of climate information, it is clear that its contribution to farming income remains a field of research to explore. Thus it is necessary to experiment with individual’s farmlands and to evaluate the contribution of climate information to the added value of different crops and farmers’ income.
Acknowledgements This research was supported the project “supplemental irrigation and climate information: from research to building institutional and community adaptation capacities in the Sahel” financed by the International Development Research Centre (IDRC). The authors truly appreciate the enormous amount of time that Prof. Salvatore Di Falco (University of Geneva, Switzerland), Dr. Calvin Atewamba (United Nations University, Ghana) and the anonymous reviewer spent on helping us to clarify the confusion and improve this paper. We would like to express our deepest gratitude to the several trainees who helped during data collection and the farmers in Yatenga, Bazega, Kadiogo and Bam provinces, who represent the key parts of the study.
References Adams, R. M., Houston, L. L., Mccarl, B. A., Mario, T. L., Jaime, M. G., & Rodney, F. W. (2003). The benefits
to Mexican agriculture of an El Niño southern oscillation (ENSO) early warning system. Agricultural and Forest Meteorology, 115, 183-194. http://dx.doi.org/10.1016/S0168-1923(02)00201-0
Alavalapati, J. R. R., Luckert, M. K., & Gill, D. S. (1995). Adoption of agroforestry practices: A case study from Andhra Pradesh, India. Agroforestry Systems, 32(1), 1-14. http://dx.doi.org/10.1007/BF00713844
Ami, D., & Desaigues, B. (2000). Le traitement des réponses égales à zéro dans l’évaluation contingente. Économie et Prévision, 143-144, 227-236. http://dx.doi.org/10.3406/ecop.2000.6105
Balme, M., Galle, S., & Thierry, L. (2005). Démarrage de la saison des pluies au Sahel: Variabilité aux échelles hydrologique et agronomique, analysée à partir des données EPSAT-Niger. Sécheresse, 16(1), 15-22.
Carberry, P. S., Hochman, Z., McCown, R. L., Dalgliesh, N .P., Foale, M. A., Poulton, P. L., & Robertson, M. J. (2002). The FARMSCAPE approach to decision support: Farmers, advisers, researchers, monitoring, simulation, communication and performance evaluation. Agricultural Systems, 74(1), 141-177. http://dx.doi.org/10.1016/S0308-521X(02)00025-2
www.ccsenet.org/jas Journal of Agricultural Science Vol. 8, No. 1; 2016
185
Challinor, A. (2009). Towards the development of adaptation options using climate and crop yield forecasting at seasonal to multi-decadal timescales. Environmental Science and Policy, 12(4), 453-465. http://dx.doi.org/10.1016/j.envsci.2008.09.008
Chang, L. B., Yanda, P. Z., & Ngana, J. (2010). Indigenous knowledge in seasonal rainfall prediction in Tanzania: A case of the South-western Highland of Tanzania. Journal of Geography and Regional Planning, 3(4), 66-72.
Diederen, P., Van, M. H., Arjan, W., & Katarzyna, B. (2003). Innovation adoption in agriculture; innovators, early adopters and laggards. Cahiers d’Économie et Sociologie Rurales, 67, 50-30.
Gadgil, S., Rao, R. S. P., & Rao, N. K. (2002). Use of climate information for farm level decision making: rainfed groundnut in southern India. Agricultural Systems, 73(3), 431-457. http://dx.doi.org/10.1016/S0308-521X(02)00049-5
Goddard, L., Aitchellouche, Y., Baethgen, W., Dettinger, M., Graham, R., Hayman, P., & Meinke, H. (2010). Providing seasonal to interannual climate information for risk management and decision-making. Procedia Environmental Sciences, 1, 81-101. http://dx.doi.org/10.1016/j.proenv.2010.09.007
Hammer, G. L., Hansen, J. W., Phillips, J. G., Mjelde, J. W., Hill, H., Love, A., & Potgieter, A. (2001). Advances in application of climate prediction in agriculture. Agricultural Systems, 70, 515-553. http://dx.doi.org/10.1016/S0308-521X(01)00058-0
Hanemann, W. (1984). Welfare Evaluations in Contingent Valuation Experiments with Discrete Responses. American Journal of Agricultural Econometrics, 67(3), 332-341. http://dx.doi.org/10.2307/1240800
Hansen, J. W. (2002). Realizing the potential benefits of climate prediction to agriculture: Issues, approaches, challenges, Agricultural Systems, 74(3), 309-330. http://dx.doi.org/10.1016/S0308-521X(02)00043-4
Hansen, J. W., Mason, S. J., Sun, L., & Tall, A. (2011). Review of Seasonal Climate Forecasting for Agriculture in Sub-Saharan Africa. Experimental Agriculture, 47, 205-240. http://dx.doi.org/10.1017/S0014479710000876
He, X. F., Cao, H., & Li, M. F. (2007). Econometric analysis of the determinants of adoption of rainwater harvesting and supplementary irrigation technology in the semi-arid loess plateau of China. Agricultural Water Management, 89(3), 243-250. http://dx.doi.org/10.1016/j.agwat.2007.01.006
Heckman, J. J. (1979). Sample Selection Bias as a Specification Error. Econometrica, 47(1), 153-161. http://dx.doi.org/10.2307/1912352
Ingram, K. T., Roncoli, M. C., & Kirshen, P. H. (2002). Opportunities and constraints for farmers of west Africa to use seasonal precipitation forecasts with Burkina Faso as a case study. Agricultural Systems, 74(3), 331-349. http://dx.doi.org/10.1016/S0308-521X(02)00044-6
INSD. (2009). Annuaires statistiques (p. 412). Institut national de la statistique et de la démographie, Burkina Faso.
Janin, P. (2010). Sécurité alimentaire et changement climatique: une lecture géopolitique des crises africaines et de leurs conséquences. Géopolitiques, 4, 1-11.
Kenkel, P. L., & Norris, P. E. (1995). Agricultural producers’ willingness to pay for real time mesoscale weather information. Journal of Agricultural and Resource Economics, 20(2), 356-372.
Klopper, E., Vogel C. H., & Landman, W. A. (2006). Seasonal climate forecasts potential agricultural risk management tools? Climatic Change, 76, 73-90. http://dx.doi.org/10.1007/s10584-005-9019-9
Kpad, P. C., & Rom E. (2013). Facteurs d’adoption de la lutte étagée ciblée au Nord-Bénin, Economie Rurale, 338, 77-91. http://dx.doi.org/10.4000/economierurale.4174
Lybbert, T. J., Barrett, C. B., McPeak, J. G., & Luseno, W. K. (2007). Bayesian Herders: Updating of Rainfall Beliefs in Response to External Forecasts. World Development, 35(3), 480-497. http://dx.doi.org/10.1016/j.worlddev.2006.04.004
MAH. (2012). Resultats definitifs de la campagne agricole et de la situation alimentaire et nutritionnelle 2011/2012 (p. 59). Ministère de l’Agriculture et de l’Hydraulique, Burkina Faso.
Marteau, R., Sultan, B., Moron, V., Alhassane, A., Baron, C., & Traoré, S. B. (2011). The onset of the rainy season and farmers’ sowing strategy for pearl millet cultivation in Southwest Niger. Agricultural and Forest Meteorology, 151(10), 1356-1369. http://dx.doi.org/10.1016/j.agrformet.2011.05.018
www.ccsenet.org/jas Journal of Agricultural Science Vol. 8, No. 1; 2016
186
Neupane, R. P., Sharma, R. K., & Thapa, B. G. (2002). Adoption of agroforestry in the Hills of Nepal: A logistic regression analysis. Agricultural Systems, 72(3), 177-196. http://dx.doi.org/10.1016/S0308-521X(01)00066-X
Nyong, A., Adesina, F., & Osman, E. B. (2007). The value of indigenous knowledge in climate change mitigation and adaptation strategies in the African Sahel. Mitigation and Adaptation Strategies for Global Change, 12(5), 787-797. http://dx.doi.org/10.1007/s11027-007-9099-0
Ogallo, L. A., Boulahya, M. S., & Keane, T. (2000). Applications of seasonal to interannual climate prediction in agricultural planning and operations. Agricultural and Forest Meteorology, 103, 159-166. http://dx.doi.org/10.1016/S0168-1923(00)00109-X
Ouédraogo, M., Dembelé, Y., & Somé, L. (2010). Perceptions et strategies d’adaptation aux changements des précipitations: Cas des paysans du Burkina Faso. Sécheresse, 21(2), 87-96.
Patt, A., Suarez, P., & Gwata, C. (2005). Effects of seasonal climate forecasts and participatory workshops among subsistence farmers in Zimbabwe. Proceedings of the National Academy of Sciences of the United States of America, 102(35), 12623-12628. http://dx.doi.org/10.1073/pnas.0506125102
Pearce, D., & Turner, R. K. (1990). Economics of natural resources and the environment (p. 378). The Johns Hopkins University Press.
Phillips, J., Deane, D., Unganai, L., & Chimeli, A. (2002). Implications of farm level response to seasonal climate forecasts for aggregate grain production in Zimbabwe. Agricultural Systems, 74(3), 351-369. http://dx.doi.org/10.1016/S0308-521X(02)00045-8
Podesta, G., Letson, D., Messina, C. F., Andre, R., Hansen, J., Llovet, I., & Brien J. O. (2002). Use of ENSO related climate information in agricultural decision making in Argentina: A pilot experience. Agricultural Systems, 74, 371-392. http://dx.doi.org/10.1016/S0308-521X(02)00046-X
Randall, A., Berry, I., & Eastman, C. (1974). Bidding games for valuation of aesthetic environmental. Journal of Environmental Economics and Management, 1, 132-149. http://dx.doi.org/10.1016/0095-0696(74)90010-2
Res, C., Vogel, C., & Brien, K. O. (2006). Who can eat information? Examining the effectiveness of seasonal climate forecasts and regional climate-risk management strategies. Climat Research, 33, 111-122. http://dx.doi.org/10.3354/cr033111
Roncoli, C. (2006). Ethnographic and participatory approaches to research on farmers’ responses to climate predictions. Climate Reshearch, 33, 81-99. http://dx.doi.org/10.3354/cr033081
Roncoli, C., Jost, C., Kirshen, P., Sanon, M., Ingram, K. T., Woodin, M., & Hoogenboom, G. (2008). From accessing to assessing forecasts: An end to end study of participatory climate forecast dissemination in Burkina Faso (West Africa). Climatic Change, 92, 433-460. http://dx.doi.org/10.1007/s10584-008-9445-6
SP/CONEDD. (2007). Programme d’action national d’adaptation à la variabilité et aux changements climatiques (p. 69). Ministère de l'Environnement, des Eaux et Forêts, Burkina Faso.
Sultan, B., & Janicot, S. (2003). The West African Monsoon Dynamics . Part II: The preonset and onset of the summer monsoon. American Meteorological Society, 16, 3407-3427. http://dx.doi.org/10.1175/1520-0442(2003)016<3407:twamdp>2.0.co;2
Tarhule, A., & Lamb, P. J. (2003). Climate research and seasonal forecasting for West Africans: perceptions, dissemination, and use? Bulletin of the American Meteorological Society, 84(12), 1741-1759. http://dx.doi.org/10.1175/BAMS-84-12-1741
Terra, S. (2005). Guide de bonnes pratiques pour la mise en oeuvre de l’évaluation contengente (p. 83). Ministère de l’Ecologie et du Développement durable, France.
Thune, M. (2011). L’industrialisation de l’exploitation de l’or à Kalsaka, Burkina Faso: Une chance pour une population rurale pauvre? EchoGéo, 17.
Tobin, J. (1958). Estimation of relationship for limited dependent variables. Econometrica, 26(1), 24-36. http://dx.doi.org/10.2307/1907382
Traore, B., Corbeels, M., Van-Wijk, M. T., Rufino M. C., & Giller, K. E. (2013). Effects of climate variability and climate change on crop production in southern Mali. European Journal of Agronomy, 49, 115-125. http://dx.doi.org/10.1016/j.eja.2013.04.004
www.ccsenet.org/jas Journal of Agricultural Science Vol. 8, No. 1; 2016
187
Traore, B., Van-Wijk, M. T., Descheemaeker, K., Corbeels, M., Rufino, M. C., & Giller K. E. (2014). Evaluation of climate adaptation options for Sudano-Sahelian cropping systems. Field Crops Research, 156, 63-75. http://dx.doi.org/10.1016/j.fcr.2013.10.014
Ziervogel, G., Bithell, M., & Washington, R. (2005). Agent based social simulation: A method for assessing the impact of seasonal climate forecast applications among smallholder farmers. Agricultural Systems, 83, 1-26. http://dx.doi.org/10.1016/j.agsy.2004.02.009
Zongo, B., Diarra, A., Barbier, B., Zorom, M., Yacouba, H., & Dogot, T. (2015). Farmers’ practices and willingness to adopt supplemental irrigation in Burkina Faso. International Journal of Food and Agricultural Economics, 3(1), 101-117.
Copyrights Copyright for this article is retained by the author(s), with first publication rights granted to the journal.
This is an open-access article distributed under the terms and conditions of the Creative Commons Attribution license (http://creativecommons.org/licenses/by/3.0/).