farmer-based extension for slm in africa 1 sara j. scherr, claire rhodes, louise buck, cosmas...
TRANSCRIPT

Farmer-Based Extension for SLM in Africa
1
Sara J. Scherr, Claire Rhodes, Louise Buck, Cosmas Ochieng, Robin Marsh, and Jenny Nelson Ecoagriculture Partners
Produced with support from the Bill and Melinda Gates Foundation and TerrAfrica
April 2008
Contents
2
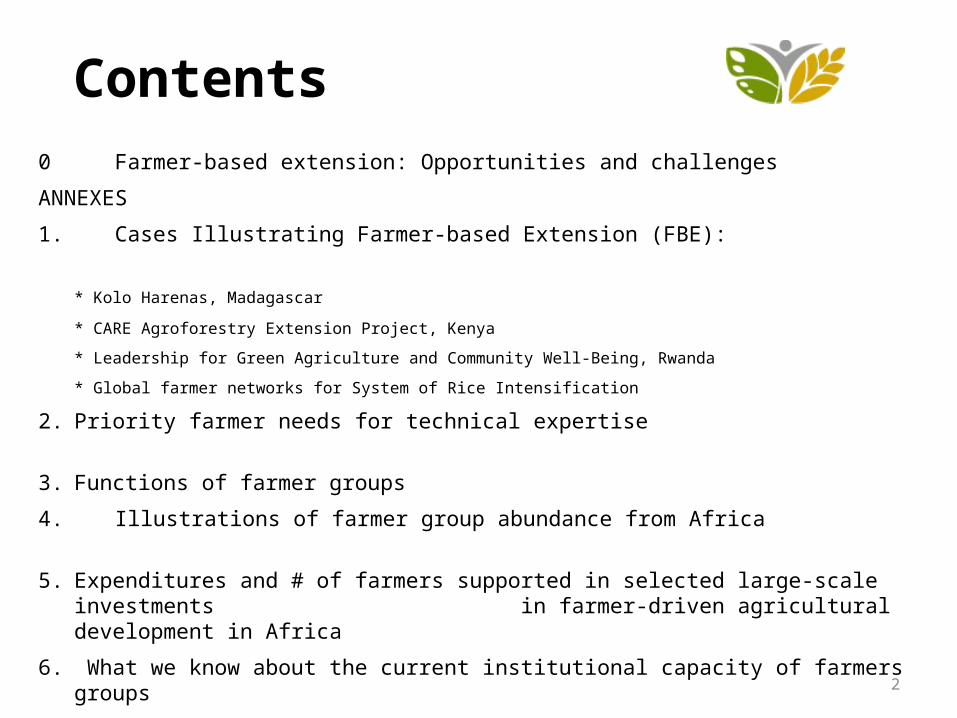
0 Farmer-based extension: Opportunities and challenges
ANNEXES
1. Cases Illustrating Farmer-based Extension (FBE):
* Kolo Harenas, Madagascar
* CARE Agroforestry Extension Project, Kenya
* Leadership for Green Agriculture and Community Well-Being, Rwanda
* Global farmer networks for System of Rice Intensification
2. Priority farmer needs for technical expertise
3. Functions of farmer groups
4. Illustrations of farmer group abundance from Africa
5. Expenditures and # of farmers supported in selected large-scale investments in farmer-driven agricultural development in Africa
6. What we know about the current institutional capacity of farmers groups
7. What we know about the farmer-led agricultural extension
8. Factors affecting performance of Networked Farmer Groups
9. Ensuring gender equity in FBE- Lessons learned

Farmer-Based Extension Systems (FBE):
Opportunities and Challenges
3

4
Problem Statement Summary
Current extension systems are failing to: Link supply with demand Co-ordinate service provision to meet diverse farmer needs for information, technology & support services Enable farmers to articulate their needs Recognize and build upon farmers’ knowledge Support farmer innovation Invest in farmers groups as proactive leaders and service providers, not beneficiaries Recognize the role of farmer-farmer networks in accelerating knowledge flows Invest in locally-adapted and owned information and knowledge services Capitalize on efficiencies of scale through collective action
Increased capacity of
farmers
Improved capacity of extension
systems
Farmers’ capacity to articulate
demand and integrate new
knowledge and practices
DEMAND
SUPPLY
Extension systems’
capacity to deliver
appropriate tech, info and
services

Defining Farmer-Based Extension Systems (FBE)Indicators of farmer-drivenness
(Ref. Neuchatel Initiative) Farmers:
- Have access to a choice of diverse advisory services, supplied via diverse information channels- Have increased capacity to formulate & articulate demand, individually & through organizations- Are offered a balance between facilitation and technical services- Contribute to advisory service costs - Play a key role in quality assurance / performance appraisals for service provision- Have enhanced motivation to demand, use and apply services
Diverse service providers:- Are competent at responding to farmer demand- Co-ordinate a range of service options in response to demand, drawing on different roles & strengths - Offer information and resources through a range of communication & knowledge sharing tools - Balance the need to achieve concrete results (technical change achieved) with investing time in listening to farmers, learning about complex situations & supporting unanticipated initiatives- Are directly accountable to service users
Policies and Donor Investments: - Earmark funding for subsidizing service provision costs- Channel a significant % of public extension funding through local user groups - Invest in capacity building and backstopping institutions/organizations for farmers and advisors- Invest in processes & institutions that support co-ordination and joint action between multiple actors / service providers- Support the emergence of locally-driven extension & knowledge-sharing processes
5

Reach of community & district farmer groups Illustrative estimates from selected African countries
% farming households reached by farmer groups
Kenya: >8000 community-based farmers groups, >140 district-farmers groups reaching ~1 million farming hh’s
Tanzania: >1000 community-based farmer groups, >120 district-level farmers groups reaching >600,000 farming hh’s
Uganda: >32,000 community-based farmer groups, district-level farmers groups reaching >800,000 farming hh's
Burkina Faso: >62% of rural/farming households members of a community-based farmer group
Senegal: >67% of rural/farming households are members of a community-based farmer group

Reach of Regional Farmer Federations & Networks in Africa
Network No of Farmer Groups In Africa Number of Farming Households Involved (Africa-wide)
International Federation of Agricultural Producers-Africa network
25 national associations >2 million
Farmer Field School network in Africa 12 countries, since 1995 (2000 in Kenya alone)
>500,000
African Network of Cotton Producers 10 countries Majority of African cotton producers
APESS: Association for the Promotion of Livestock Breeding in the Savanna region and in the Sahel)
10 countries in the Sahel region > 6,000
Landcare Africa District groups in Kenya, Uganda, Tanzania, Rwanda, South Africa
>500,000
EAFF: East African Farmers Federation Regional network of national farmer federations in Kenya, Tanzania, Uganda, Rwanda, Eastern Congo
> 2 million
ROPPA : West Africa Rural Producers Organization Regional network of farmer federations in 10 countries
> 4 million
SACAU: Southern Africa Confederation of Agricultural Unions
Regional umbrella of ~10 national farmer federations and commodity organizations
> 4 million
Africa FairTrade Producers Network 164 Fairtrade Certified Producer Organizations across 24 countries of Africa
>20,000
Organic movements in Africa National organizations in 9 countries >35,000
Community-based Natural Resources Management Networks
Numerous multi-country networks of farmer organizations working on watershed, rangeland and forest management
> 5 million
7
Illustrative estimates from selected African countries

8
FBE: Current Challenges, Gaps and Barriers
Sustainable Institutions that support farmer-driven agricultural innovation at the district- & community-level are limited.
Farmer needs for diverse, integrated solutions to support agricultural innovation require agricultural service providers to be co-ordinated & responsive.
Reach, costs & Impacts of FBE:
Inadequate monitoring & assessment of long-term costs & impacts of FBE at scale
Poor documentation of existing capacity, services and reach of farmers groups & networks at community-, district- and national-levels.
Lack of disaggregated data on relative impacts of FBE on socially marginalized, including women & rural poor.
Major Barriers prevent farmers receiving the diverse support they need to enhance agricultural productivity & incomes
Relevance:
Limited comparative data on relative effectiveness of different extension & knowledge-sharing tools within pluralistic extension systems.
Lack of long-term assessment on costs, impacts and effectiveness of district- and community-level information & service provision models, relative to national extension programs.
Knowledge gaps on existing capacity and impacts of FBE limit further investment
I. Limited capacity of farmer groups to reach and represent smallholder farmers:
Limited abundance of self-sustaining community-farmer groups with the institutional capacity to support farmers with the services they need.
Weak linkages (federation) between farmer groups at the community-, district- and national-levels.
Limited capacity of community-farmer groups to reach and equitably represent farming households within their community.
II. Weak interface between supply & demand for agricultural information, knowledge & technology
Lack of infrastructure & incentives to coordinate agricultural extension service provision by multiple actors.
Weak capacity of farmers groups to demand services & negotiate relationships with service providers.
Inadequate support for farmers to trail new agricultural technologies, innovate or share their knowledge.
Limited recognition of role farmer-farmer knowledge and information networks play in enhancing dissemination and adoption of agricultural knowledge & technologies.
Effective agricultural extension requires information & interventions to be locally contextualized, owned and adapted
Farmers learn from diverse sources of information and knowledge, and place high value on knowledge acquired from their peers.
Challenges

9
Solution 2: District-level Farmer Innovation Platforms provide an coordinated interface between demand and supply

Multi-stakeholder, district-levelfarmer innovation platform
10
- Share knowledge- Conduct cross-visits- Set district priorities- Extension materials- Coordinate activities- Identify and fill gaps- Invest jointly- Conduct joint training
District farmer assoc.Regional research institute
Agribusiness buyerDistrict gov’t
Ministry of Ag extension service
NGO extension(local, national and international)
Farmer groups
Soil, water, natural resourceconservation service
Farmer LandcareNetwork
Farmer groups

11
Strengthen capacities community-based farmer organizations
Support services to develop skills in :-Facilitating farmer needs assessments-Leadership -Facilitation-Negotiation support & conflict resolution -Business planning & financial management-(Multi-institutional) governance processes
Facilitate knowledge flows between farmers
Peer-peer learning exchanges Study toursFarmer field schoolsFarm Demonstration sites Locally-based facilitatorsSelf-help associations Community knowledge centersFarmer-led research & monitoring
Support farmer innovation & experiential learning
Technical training and support services to develop skills in : -On-farm agricultural practices*-Landscape restoration & management*-Enterprise and market development*
Innovation funds to support: - Farmer trials of new technologies- Farmer demonstration sites- Farm & community-level business planning- Enterprise & product development
Locally-adapted Information services provided through diverse ICTs:
Mobile phones Farm & community radioVideo documentation of farmer knowledge Printed materials
Improve inputs
Improved locally-appropriate seed varietiesLocal seed banksSeedling nurseriesFertilizers (organic, inorganic)
Codify/document
experience andinnovation
Generate practices,
ideas
Reflect collectively on concepts, context,
and observations
Learn and adapt by
doing
Farmer Innovation Cycle: Services & Investments required
from a Platform
*For further details on farmer priorities for technical support services, see Annex 2

Reach of existing farmer innovation platforms Illustrative examples from selected African countries
% of districts within the country with a platform(Estimated)
Cost (USD)/hh/year
High degree of external investment in platform establishment.
Platforms established by local farmers groups to meet needs. Low external investment
A diverse range of district- and village-level platforms exist within Africa. Key variables include reach; single-vs. multi-commodity focus; relative contribution of external financing & membership fees to platform establishment and operational costs.
Burkina Faso: 47.4 million USD invested over 6 years through World BankGuinea: Investment of >100 million USD over 5 years (2000-2005) from European Union, World Bank and IFADKenya: Established and run primarily on farmer membership fees (~2500USD/platform/year). Minimal external investment. Tanzania: Diverse financing based: International NGOs (incl. Agriterra); European Commission; Individual membership fees (See example) Uganda: 8 million USD over 5 years through NAADs.

13
Example: MVIWAMO farmer innovation platform, Tanzania
Platform function
Activities
Priority-setting & coordination, based on farmer-demand
Mapping of capacities & reach of existing agricultural service providers
16 key actors identified. Key actors represented on Steering Committee include: Community- and district- farmers groups;District network of agricultural-focused NGOs (Monduli District NGO network); District and National Government agencies – incl. public sector research and extension; Local politicians; Private sector actors
Steering Committee operational support
Farmer-needs assessment Participatory needs assessment undertaken by community- and district-level farmer groups in collaboration with the local university (Cooperative College of Moshi)
Investment in collaborative planning by multiple platform actors
Collaborative planningFormal cooperation agreements between local farmer networks and platform membersContracting of public extension services by district-farmer groups
ICT & information systems to support platform services
Unknown
Coordinated service provision , responsive to farmer demand
Institutional strengthening of community farmer-groups
Business development skills, including farm-level book- and record-keeping; contractual engagement of service providers; advocacy.
Processes to support knowledge-flows between local users
Demonstration-sites/study-tours;Exchange visits; Trade-fairs; Farmer-farmer information-sharing networks, facilitated by locally-based facilitator.
Improved inputs
Information provision Community radio
Support for innovation & Experiential learning
Specifically tailored trainings on production interventions (crops, vegetables, livestock, apiculture)
Implementer: MVIWAMO – Moduli District Farmers Association, Tanzania
Supported by: MVIWATA-Tanzanian National Farmers Organization, European Commission, private donations and local membership fees.
Dates: Ongoing since 2004
Reach: 2,500 farm hh’s within District (>70% of farming households), through 75 community-level farming groups

Annex 1: Cases illustrating Farmer-Based Extension
14
Case 1: Networked farmer groups in multistakeholder coalition for agricultural intensification - Kolo Harenas, Madagascar
Case 2: Networked Community-based Farmer Groups - CARE Agroforesty Extension Project, Kenya
Case 3: Community-farmer group support program - Leadership for Green Agriculture and Community Well-Being in Rwanda
Case 4: Global networks of diverse actors rely on farmer-to-farmer extension to promote System of Rice Intensification
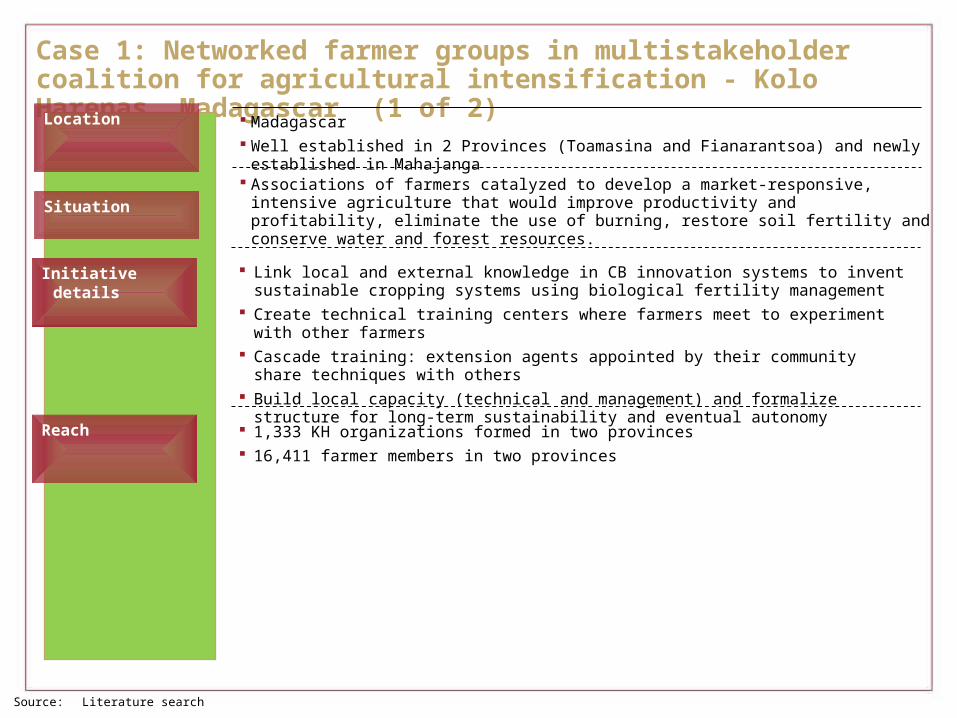
Case 1: Networked farmer groups in multistakeholder coalition for agricultural intensification - Kolo Harenas, Madagascar (1 of 2)Location
Situation
Associations of farmers catalyzed to develop a market-responsive, intensive agriculture that would improve productivity and profitability, eliminate the use of burning, restore soil fertility and conserve water and forest resources.
Initiative details Link local and external knowledge in CB innovation systems to invent sustainable cropping systems using biological fertility management
Create technical training centers where farmers meet to experiment with other farmers Cascade training: extension agents appointed by their community share techniques with others Build local capacity (technical and management) and formalize structure for long-term sustainability
and eventual autonomy
Reach
Source: Literature search
Madagascar Well established in 2 Provinces (Toamasina and Fianarantsoa) and newly established in Mahajanga
1,333 KH organizations formed in two provinces 16,411 farmer members in two provinces

Case 1: Networked farmer groups in multistakeholder coalition for agricultural intensification - Kolo Harenas, Madagascar (2 of 2)
Cost
Agricultural benefits
Source: Literature search
Co-benefits
47% increase in staple crop (rice) production in 2 years; 28% increase in manioc (cassava) 14% continued increase of staple food crops (rice, cassava, maize) in 2007 New rice technology yields 2-4 fold higher than traditional methodologies in 2007 10% increase in KH revenues 2005-2006 34% increase in KH revenues 2006-2007 Food security significantly increased: food insecure weeks dropped from 24 to 19 from 2004 to 2007 Expanded production of cash crops led to rapid productivity gains and market development need CB producer groups led to eco-enterprise development through access to investment capital,
management training and market information Avg 61% and 25% adoption of new rice production techniques in respective provinces (2005-2007)
Mainly USAID funded 25% funds (~$200,000 per province) invested in on-ground projects: 40% to expand commodity
streams (e.g., coffee, rice, jatropha) and 20% to increase rural institutional capacity building (e.g., KH can hire professional agricultural technicians and pay farmer outreach/extension workers)
$10-25/hh/year
Rural capacity building through trained farmer extension and outreach agents who are paid by KHs Reduced deforestation in provinces Kolo Harena organizations mobilized by government environmental programs to develop
ecoregional development and conservation plans Partnership with state agency created a trained Malagasy workforce that fills NRM extension role KH access to micro-credit increasing: 49% (Toamasina) and 28% (Fianarantsoa) borrowed in 2007
Case 2. Networked Community-based Farmer Groups: CARE Agroforesty Extension Project (1 of 2)
Location
Situation Women’s group based innovation in western Kenya, initiated by CARE and the Kenya Forest Department
in collaboration with the Ministry of Agriculture in 1984 to help poor farmers overcome soil fertility degradation in subsistence farming systems and woodfuel and fodder shortages
Evolved into food security project 1991-99Initiative details Menu-based approach to agroforestry choice, emphasis on native species
Participatory technology generation approach to local adaptation linked with agroforestry research community
Dual level extension teams included pairs of external advisors from Ministries of Agriculture and Environment, and mixed gender pairs of local facilitators selected by their communities
Intensive training in participatory agroforestry design included country-wide visits to innovators Widely dispersed nursery hubs for farming system diagnosis and design, social learning,
demonstration, farmer experimentation Research support from Kenya Forestry Research Insititute Focus of intervention on women’s groups, to create and manage multi-purpose tree nursery
enterprises, and on schools to educate youth and create productive assets
Reach
Source: Literature search
Western Kenya: Siaya and South Nyanza districts
10,000 subsistence farmers in 520 groups

Case 2. Networked Community-based Farmer Groups: CARE Agroforesty Extension Project (2 of 2)
Agricultural benefits
Source: Literature search
Co-benefits
Investment of $5.7 M by CARE International for total project (of which ~ half for extension, thus $38/household/year)
Funded by CIDA High unspecified co-financing by community groups
Cost
Yields of major food crops (maize, sorghum, kale, pulses, oil seeds) doubled – average increase per farm = 474 kgs, yet fell short of meeting year-round food security needs
Products, farm inputs and cash income from 800,000-1,000,000 trees planted per year from 1992-1999 contributed to food security increases
Hundreds of women’s groups raised cash income through collectively managed tree nurseries
Community-based extension methodology and system instituted. Major increase in tree cover in project districts Reduced pressure on natural forests by creating on-farm fuel, pole and fodder resources Conservation of indigenous tree species on farms

Case 3. Community-farmer group support program: Leadership for Green Agriculture and Community Well-Being in Rwanda (1 of 2)
Location Rwandese Health Environment Project Initiative (2004-2008), Kabarore, Kagitumba, Kabuga and Gako
Districts, Eastern Province. Kayonza and Gatsibo Districts, Southern Province (formerly Gitarama).
SituationCyclical famines due to food insecurity, high poverty level, malnutrition in children, very low ag technology knowledge level, severe soil erosion, labor shortage due to war and HIV/AIDs.
Initiative details Trained farmer leaders (at least 50% women) who multiply adoption to neighbor farmers. Established formal training center (Gitarama, Southern Province) and farm/home based
demonstration and training sites (Kagitumba/Eastern Province). Promoted package of new technologies (kitchen gardens , organic fertilizers/dung, improved stoves,
zero grazing, terracing, agroforestry, gravity-based rain harvesting) Built capacity in “leadership for green agriculture”, focus on conflict management, collective action
and gender sensitivity. Training and extension evolved from core technologies to meet diverse demand-driven rural priorities
(marketing, schools/school gardens, micro-finance). Women farmers (most of whom are widows) empowered through leadership role in training,
technology adoption, school committees, and collective action.
Source: Literature search
Reach 40,000 farmers (2004-2008): 1,000 contact farmers trained per year x 10 neighbor farmer leaders = 10,000 farmer families per year
Expanding to new districts in 2008

Case 3. Community-farmer group support program: Leadership for Green Agriculture and Community Well-Being in Rwanda (2 of 2)
Agricultural benefits 100% of target farmers learned to grow new crops, esp vegetables, reducing famine and illness
90% of target farmers use organic fertilizers, dung, and mulch, resulting in improved soil fertility and yields.
80% of target farmers use improved seed provided by research centers partnering with RHEPI 25% of target farmers use simple micro-irrigation for vegetables 50% of farmers use zero tillage Reduced soil erosion on hilly farms. Poverty and food insecurity cycle turned into virtuous cycle of restored natural resources (soil,
water), improved maize/bean/sorghum and vegetable yields, and milk production, for year-round supply of food for family.
Source: Literature search
Co-benefits
Fuel cook stoves adopted by 90% reduced respiratory disease in women and children. Malnutrition in children reduced by 70% in target areas. Conflict among genocide victims and perpetrators reduced as neighbors are trained in collaboration
and lead collective action in their communities. Recovery of watershed functions through collective tree planting.
CostTraining -- $125/farmer leaderStaff follow up visits = $10/farmer/dayStudy visits/field days = $98/farmerImproved stoves = $55/familyTree seeds = $20/100 seedlings/farmerWater tank = $350/tank of 2500 ltsBiogas digester = $1,650/farmer leader
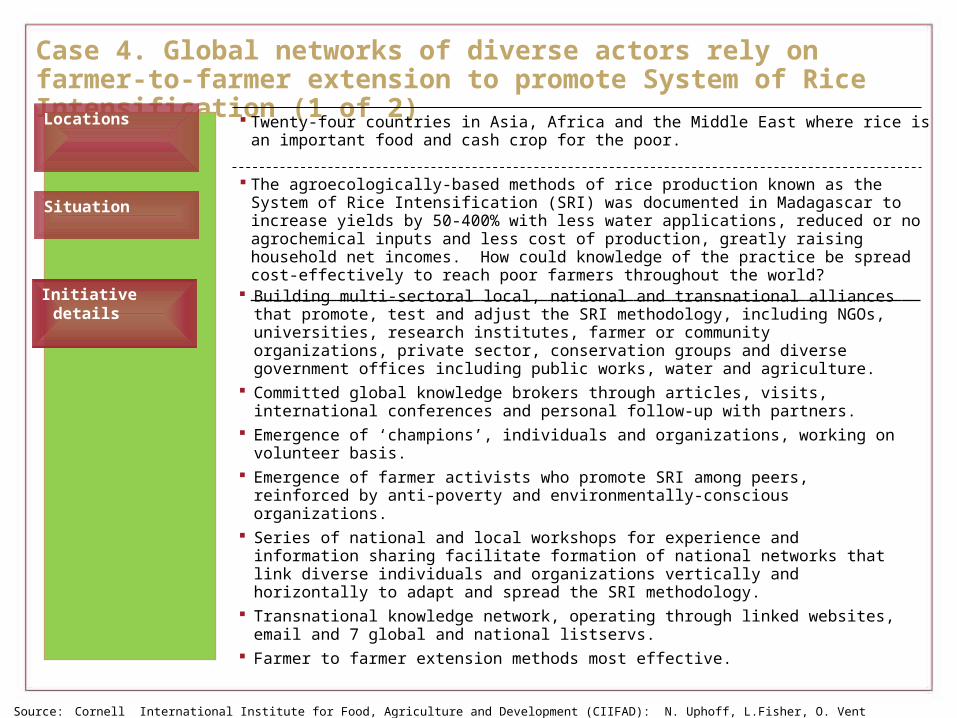
Case 4. Global networks of diverse actors rely on farmer-to-farmer extension to promote System of Rice Intensification (1 of 2)Locations
Situation
The agroecologically-based methods of rice production known as the System of Rice Intensification (SRI) was documented in Madagascar to increase yields by 50-400% with less water applications, reduced or no agrochemical inputs and less cost of production, greatly raising household net incomes. How could knowledge of the practice be spread cost-effectively to reach poor farmers throughout the world? ______________________________________________________________________
Initiative details Building multi-sectoral local, national and transnational alliances that promote, test and adjust the SRI methodology, including NGOs, universities, research institutes, farmer or community organizations, private sector, conservation groups and diverse government offices including public works, water and agriculture.
Committed global knowledge brokers through articles, visits, international conferences and personal follow-up with partners.
Emergence of ‘champions’, individuals and organizations, working on volunteer basis. Emergence of farmer activists who promote SRI among peers, reinforced by anti-poverty and
environmentally-conscious organizations. Series of national and local workshops for experience and information sharing facilitate formation of
national networks that link diverse individuals and organizations vertically and horizontally to adapt and spread the SRI methodology.
Transnational knowledge network, operating through linked websites, email and 7 global and national listservs.
Farmer to farmer extension methods most effective.
Source: Cornell International Institute for Food, Agriculture and Development (CIIFAD): N. Uphoff, L.Fisher, O. Vent
Twenty-four countries in Asia, Africa and the Middle East where rice is an important food and cash crop for the poor.
Case 4. Global networks of diverse actors rely on farmer-to-farmer extension to promote System of Rice Intensification (2 of 2)
Cost
Agricultural benefits
Source: Cornell International Instittue for Food, Agriculture and Development (CIIFAD).
Co-benefits
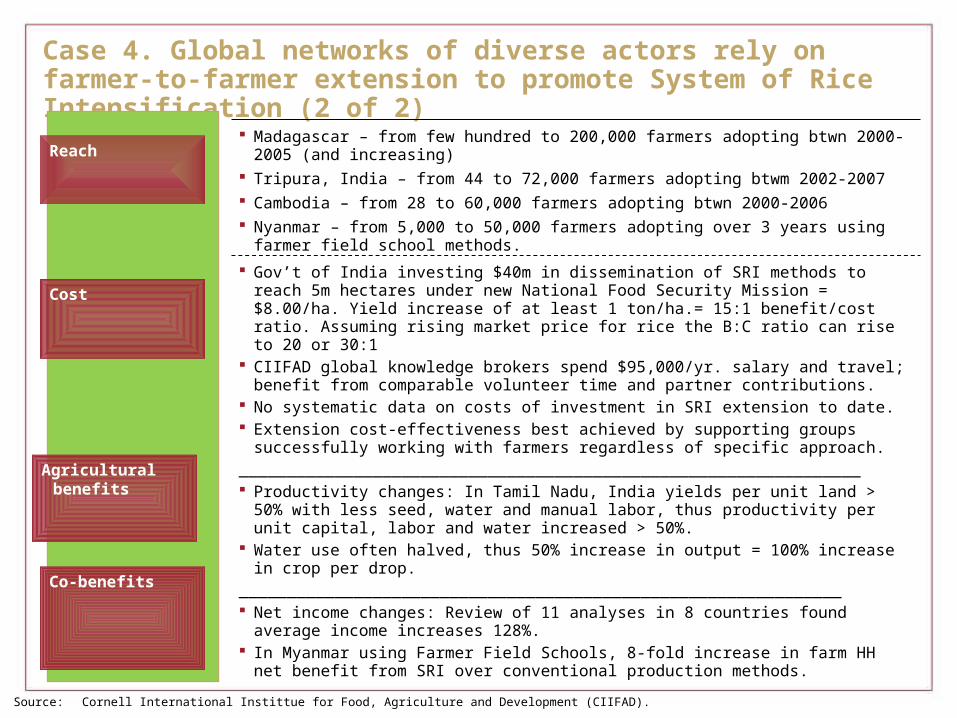
Gov’t of India investing $40m in dissemination of SRI methods to reach 5m hectares under new National Food Security Mission = $8.00/ha. Yield increase of at least 1 ton/ha.= 15:1 benefit/cost ratio. Assuming rising market price for rice the B:C ratio can rise to 20 or 30:1
CIIFAD global knowledge brokers spend $95,000/yr. salary and travel; benefit from comparable volunteer time and partner contributions.
No systematic data on costs of investment in SRI extension to date. Extension cost-effectiveness best achieved by supporting groups successfully working with farmers
regardless of specific approach. _________________________________________________________________ Productivity changes: In Tamil Nadu, India yields per unit land > 50% with less seed, water and
manual labor, thus productivity per unit capital, labor and water increased > 50%. Water use often halved, thus 50% increase in output = 100% increase in crop per drop. _______________________________________________________________ Net income changes: Review of 11 analyses in 8 countries found average income increases 128%. In Myanmar using Farmer Field Schools, 8-fold increase in farm HH net benefit from SRI over
conventional production methods.
Madagascar – from few hundred to 200,000 farmers adopting btwn 2000-2005 (and increasing) Tripura, India – from 44 to 72,000 farmers adopting btwm 2002-2007 Cambodia – from 28 to 60,000 farmers adopting btwn 2000-2006 Nyanmar – from 5,000 to 50,000 farmers adopting over 3 years using farmer field school methods.
Reach
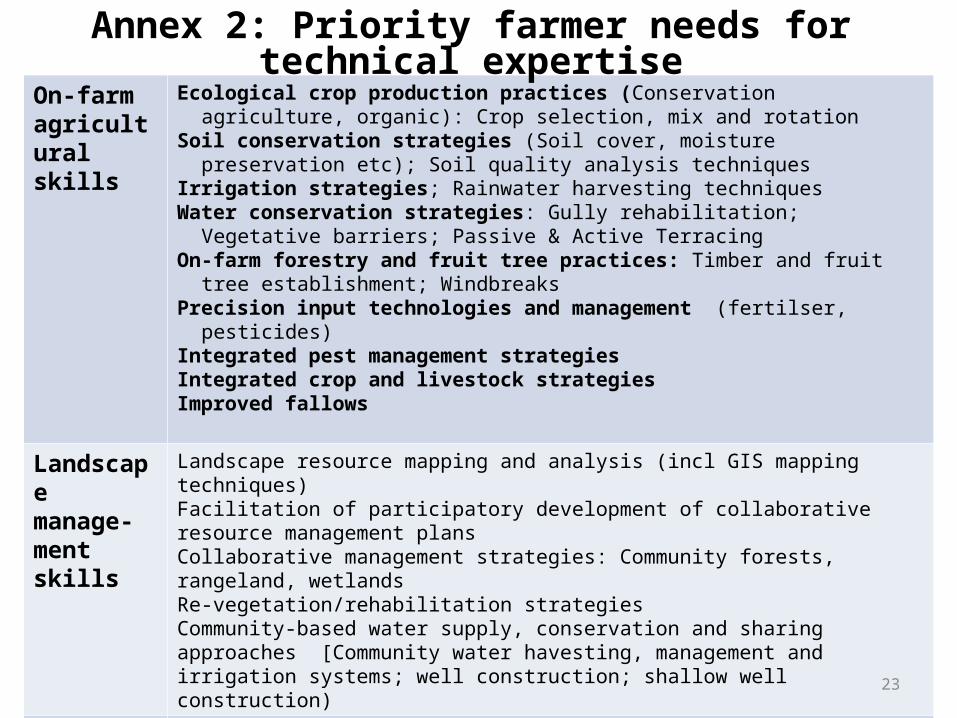
On-farmagricultural skills
Ecological crop production practices (Conservation agriculture, organic): Crop selection, mix and rotation
Soil conservation strategies (Soil cover, moisture preservation etc); Soil quality analysis techniques
Irrigation strategies; Rainwater harvesting techniquesWater conservation strategies: Gully rehabilitation; Vegetative barriers; Passive & Active
TerracingOn-farm forestry and fruit tree practices: Timber and fruit tree establishment; WindbreaksPrecision input technologies and management (fertilser, pesticides)Integrated pest management strategiesIntegrated crop and livestock strategiesImproved fallows
Landscape manage-ment skills
Landscape resource mapping and analysis (incl GIS mapping techniques)Facilitation of participatory development of collaborative resource management plans Collaborative management strategies: Community forests, rangeland, wetlands Re-vegetation/rehabilitation strategiesCommunity-based water supply, conservation and sharing approaches [Community water havesting, management and irrigation systems; well construction; shallow well construction)
Enterprise develop-ment skills
Marketing and supply chain value addition for ag productsCost and revenue- sharing systems established for fruit, timber, seedlings Collective action for community enterprise development (e.g., community beekeeping; livestock raising; tree nurseries; fish farming; nature-based crafts)
Annex 2: Priority farmer needs for technical expertise
23

Annex 3A: Functions of community-based farmer groupsType of Community-based group
Membership Function: Support Community members in
Agricultural Production Financing &Marketing
Info & Knowl’ge Services
Research & Innovations
Advocacy
Local Farmer/ Producer Support Groups
Smallholder farmers; Av. ~20-30 members/group
Input supply & sharingSeedsFertilizers (in/organic)Irrigation technologies Locally-sourced technically adviceEnhanced production volume through collective action;
Enhanced capacity to access markets & demand good prices
Joint venture to enable higher returns on products
Credit & saving schemes
[Membership fees can act as safety nets for poorer groups]
Peer-peer farming learning; Sharing of inputs & innovations; Trade Fairs;
Opportunity to support farmer-led research
[May be formed as extension contract/farmer-trail groups]
Strengthened capacity to articulate local needs to potential service providersLocal Producer
co-operatives-Milk-Crops, Fruit -Vegetables
Community Resource-user associations for:
-Water/irrigation-Grazing/livestock-Agro-forestry-Pastoralists-Forests-Watershed-Fishers
Smallholder farmers – within broader range of community representatives whose livelihoods depend on addressing NRM challenges (community water supply; soil quality; grazing land; fuel wood etc.
Address NRM challenges required to enhance on-farm productivity through collective action: Irrigation supportRainwater harvesting Watershed management, including soil & water management; Restoration of degraded farm- and grazing-lands Apiculture Tree nursery management
Joint marketing
Market development
Improvement of management practices
Rights and resource access
Micro-finance/Self-help groups
~40 members/group(May be gender mixed or women specific)
Harvest help Long-/short-term seed funds or loans for capital inputs, incl. agricultural technology; emergency loans for crop-failure
Forum for information sharing on local socio-economic issues
Community/Village development committees
Broad community representation
Agricultural production goals addressed to the extent that it a community development priority
May be eligible to access public funds
Advocate with state and nat’l gov’t agencies
24
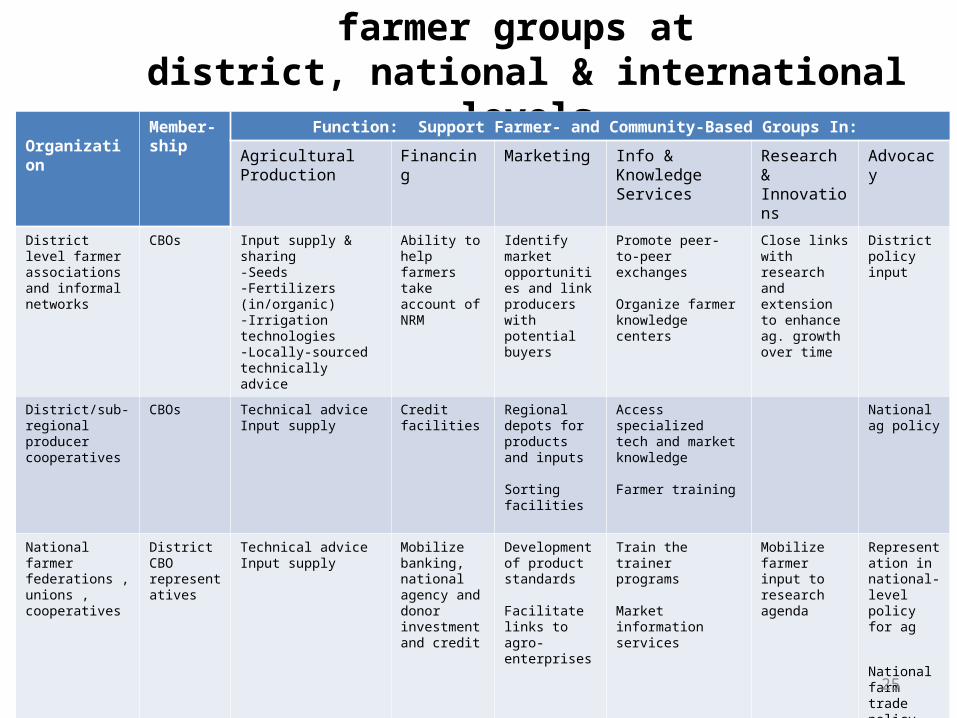
Annex 3B: Functions of networked farmer groups at district, national & international levels
Organization
Member-ship
Function: Support Farmer- and Community-Based Groups In:
Agricultural Production
Financing Marketing Info & Knowledge Services
Research & Innovations
Advocacy
District level farmer associations and informal networks
CBOs Input supply & sharing-Seeds-Fertilizers (in/organic)-Irrigation technologies -Locally-sourced technically advice
Ability to help farmers take account of NRM
Identify market opportunities and link producers with potential buyers
Promote peer-to-peer exchanges
Organize farmer knowledge centers
Close links with research and extension to enhance ag. growth over time
District policy input
District/sub-regional producer cooperatives
CBOs Technical adviceInput supply
Credit facilities
Regional depots for products and inputs
Sorting facilities
Access specialized tech and market knowledge
Farmer training
National ag policy
National farmer federations , unions , cooperatives
District CBO representatives
Technical adviceInput supply
Mobilize banking, national agency and donor investment and credit
Development of product standards
Facilitate links to agro-enterprises
Train the trainer programs
Market information services
Mobilize farmer input to research agenda
Representation in national-level policy for ag
National farm trade policy
International farmer federations
National CBO network representatives
Influence national and donor funds for agriculture
Global trends analysis
Info synthesis
Mobilize research investment
International Farm trade policy
25

Annex 4: Farmer group abundance: Examples from E. AfricaCountry Local, Community-based
GroupsDistrict Associations & Co-operatives
National Associations and Networks
Ethiopia Borana Livestock production groups>65 Farmer Research Groups established, average of 18 farmers per group (commodity based, thematic – crop breeding, social fertility; seed production)
Oromia Coffee Farmer Cooperative Union (OCFCU)
Ethiopian Agricultural Research Centres financing of farmer-research-extension advisory committees
Kenya Estimated >40 000 CBOs – ranging from village level user organizations, district level farmer or commodity organizations to national level networks of CBOs [2006 National data]
Kenya National Federation of Agricultural Producers (KENFAP): >140 district branch members; federation of many diverse CBOs & NGOs engaged in agricultural value changes from production to consumption
Farmer field school network: 2000FFS; >50,000 farmers trained
Kenya Agroforestry Network
National Greenbelt Movement, connecting community Greenbelt networks
Self-help movements, incl. Harambee movement
>4500 farmer- and community-groups supporting soil & water conservation>185 organic farming groups>300 local women’s groups in over 40 districts engaged in a variety of livelihood activities: poultry, livestock (zero-grazing), bee-keeping, tree nurseries, horticulture, milling, water harvesting/irrigation~600 local women’s agroforestry groups>60 community Greenbelt groups managing ~6000 tree nurseries
>140 district farmers organizations.
Marsabit regional pastoralist support network (~11,000 pastoralists)
2 District Landcare Groups (~50,000 farmers reached/district)
Rwanda Initiation of Rwanda District Landcare Programs;
Union of Agriculturalists and Stockholders Syndicat Rwandais des Agriculteurs Eleveurs
Tanzania 50-60 village contact groups per district for at least 12 districts under T&V system (Lema et al 2003)
District level farmers associations, incl: Tanganyika Farmers AssociationWard and District Farmer Fora (National Ag’l Services Support Program)~12 farmer district-level research groupsDairy producer/marketing associations –Seed growers associations
National Network of Farmers (MVIWATA) -covers 120 local farmer networks, ~1,000 affiliated farmer groups (~50.000-70,000 households over 82 districts)
Tanzania Federation of Co-operatives
Uganda 32,026 community-level farmer groups identified via NAADs (2006). [NAADs currnetly working with ~21,270 groups in 49 districts – total of 384,000 farming households.
No.s of CBOs (incl. resource users associations) estimated to be at least 96,000. Estimated >500 village level community associations/district (Kabla, Kisoro & Kayunga districts). Av. Membership of village level associations=40.
Each of 80 district has district farmers association – network of farmer groups & other commodity based associations. (~1000 farmers members from district)
3 district-level Landcare groups(each of ~8 local CBOs). Reach >40,000 farmers per district
District co-operatives: Kaweri Coffee Farmers Alliance (~2500 members)
Uganda National Farmers’ Federation (UNFFE): >500,000 Uganda farmers represented
Ugandan Coffee Farmers Association; Uganda Co-operative Alliance; National Organic Agricultural Movement of Uganda (NOGAMU)
26

Annex 4: Farmer group abundance: Examples from W. Africa
Country Local, Community-based Groups
District and sub-National Associations & Co-operatives
National Associations and Networks
Burkina Faso
Almost every village has at least 1 Farmer group, with >61% of rural households a member
~3000 farmer-water harvesting groups
Pag La Yir women's association (11,000 members) in the region of Zabré
Coordination Nationale des Chambres Régionales d'Agriculture; National Federation of Rural Women (FENAFER/B);National Federation of Naam Groups (FNGN): 700,000 membersNational Federation of Cotton Producers (UNPCB); 6600 groups– 90% of cotton producers
Came-roon
Union des GIC de Planteurs de Cacao et Café de Mbanga
SALMA - Salma Farmers Association
Association for Integral Development of Farmers from the Central Region: 552 members; Focus on Cocoa; Palm Oil; Bananas)
Association of small producers from the Western Region (BINUM); 1307 members – crop-specific production network support
Northwest farmers’ organisation: crop & livestock support
Reg’l Council for Farmers Organisations (CROPSEC) – issue focussed (women, microfinance, marketing; micro-credit network)
Association Camerounaise des Femmes Ingenieurs (ACAFIA);
Association des Producterus por le Developement (BINUM)
Ghana Apex Farmers Organisation of Ghana; Development Acction Association; Farmers Organisation Network (FONG); Ghana Organic Agriculture Network (GOAN)
Guinea Federation des Paysans du Fonta Djallon
Mali Village Associations representing Cotton Producers
National Union of Cotton & Food Crop Proders (SYCOV); Association des Organisations Professionalles Paysannes Baabahuu JICI (Wheat Producers association)
Niger Coordination Nationale de le Plate Farme Paysanne du Niger (CNPFP/N); National Federation of Young Farmers; Fédération des Coopératives Maraîchères du Niger
Nigeria Community forest user groups
Joint ventures by farmer co-ops in Nigeria (WB reference). NGO-Coalition from the environment ~20NGO and CBOs working within Cross River State
All Farmers Apex Association of Nigeria Farmers Development Union (FADU); Union of Small & Media Scale Farmers of Nigeria; Forest Peoples’ Consortium
27

Annex 4: Farmer group abundance: Examples of Africa regional farmer networks
Focus Regional Associations and Networks
Cotton African Network of Cotton Producers
10 Sub-Saharan African national cotton producer organizations from Senegal; Mali; Burkino Faso; Cote d’Ivoire; Benin; Cameroon; Chad; Zimbabwe and Madagascar. Members collectively supply large proportion of cotton supplied from sub-Saharan Africa.
Ecological Agriculture
Various African Conservation Tillage network
ANDEA - African Network on Development of Ecological Agriculture
Livestock APESS (Association for the promotion of livestock breeding in the Savanna region and in the Sahel)
Operates in 10 countries in the Sahel region, and has around 6000 members organized in 56 so-called “regions” and 400 “zones”.
Collective action of Farmer-groups
Landcare Africa Africa-wide movement of Landcare groups spanning Kenya, Uganda, Tanzania, Rwanda, South Africa
Multi-commodity farmers association
ROPPA : West Africa Rural Producers Organisation
Network structured at regional level in W Africa: Rural Producer Organizations and Platforms from Benin, Burkino Faso, Cote d’Ivoire, Gambia, Guinea, Mali, Niger, Senegal and Togo
Fair Trade Certified Production
Africa FairTrade Producers Network
164 Fairtrade Certified Producer Organizations and 43 FLO-CERT registered organizations in 24 countries of Africa.
28

Program Investments Impact/Reach Interventions
Burkina Faso Community-Driven Development Program
-Includes 250 demand-driven agricultural extension sub-projects.
-Initial investments from World Bank;
- 5 year time span
Total: US$115 million
-US$66.7 million from World Bank - Co-investment from International Fund for Agricultural Development (IFAD); Netherlands & Danish Government; Local district-government to fund expansion to more villages
-Of total, US$39 million was distributed to community-level investment (through micro-projects)
Direct program activities in 3,000 of Burkina’s 8,000 villages.
Half of Burkina’s villages have established village committees and built local capacity for planning, implementation and monitoring.
75,000 'manure sinks' producing an average of around 370,000 tons of organic fertilizer per year; anti-erosion measures established on >28,000 hectares of agricultural land.
~5 million person/days of training in building local capacity
Investment in establishment /strengthening of village committees in ~50% of Burkina’s villages.
Village-level decision making and association financing of community-level micro-projects.
Establishment of 302 rural communes.
12,000 agricultural focused micro-projects developed at community level – including on irrigation, fertilizer production & landscape-level interventions to address soil erosion & associated agricultural productivity decline.
Central Kenya Dry Area Smallholder and Community Services Development Project
2001-2009
Total: US$18.1 millionIFAD loan: US$10.9 millionBelgian Survival Fund- US$4.1 million
Anticipated reach: 36,400 households in Central Kenya (Districts of Kirinyaga, Maragwa, Nyandarua, Nyeri and Thika)
Raising food production and income, and improving living conditions through increased agricultural production and productivity through promotion of drought-resistant crop & livestock innovations
-Strengthening local institutions & promoting participation through investment in strengthening institutional capacity of the district to plan, implement and monitor beneficiaries’ participation in the planning and development of district services;
Annex 5: Expenditures and # of farmers supported in selected large-scale investments in Farmer-Driven
Agricultural Development in Africa (1 of 2)
29

Program Investments Impact/Reach Interventions
Pastoralist Community Development Program:
2001-2009
Total: US$60.0 million (2041-2009)IFAD loan: US$20.0 million
Focused on herders in arid- and semi-arid lowlands in the regions of: Afar, Somali and Oromiya regions and the Southern Nations, Nationalities and People’s region.
Directly benefiting: more than 450,000 poor pastoral and agropastoral households over 30 districts.
Anticipated impacts: included enhanced household incomes, complemented to enhanced access to social services.
Investments in strengthening community-based development planning linked to a community investment fund: Promote and facilitate participatory programming, implementation and monitoring through investment in traditional social structures at village and district level.
Mobile support teams working with beneficiaries and sub-district staff in participatory situation analysis and priority identification. Beneficiaries to articulate needs and set priorities.
Beneficiaries to undertake Cost-benefit analysis of micro-porjects to be financed under Community Investment Funds. Monitoring, assigning roles and responsibilities – and performance monitoring integral to learning by doing.
- Forums for policy dialogue and advocacy among key stakeholders at federal level
-Improvements in delivery of support services in agricultural research, extension, marketing and rural finance.
-Establishment of warning systems to enhance pastoralist resilience and ability of cope with drought impact.
30
Annex 5: Expenditures and # of farmers supported in selected large-scale investments in Farmer-Driven
Agricultural Development in Africa (2 of 2)
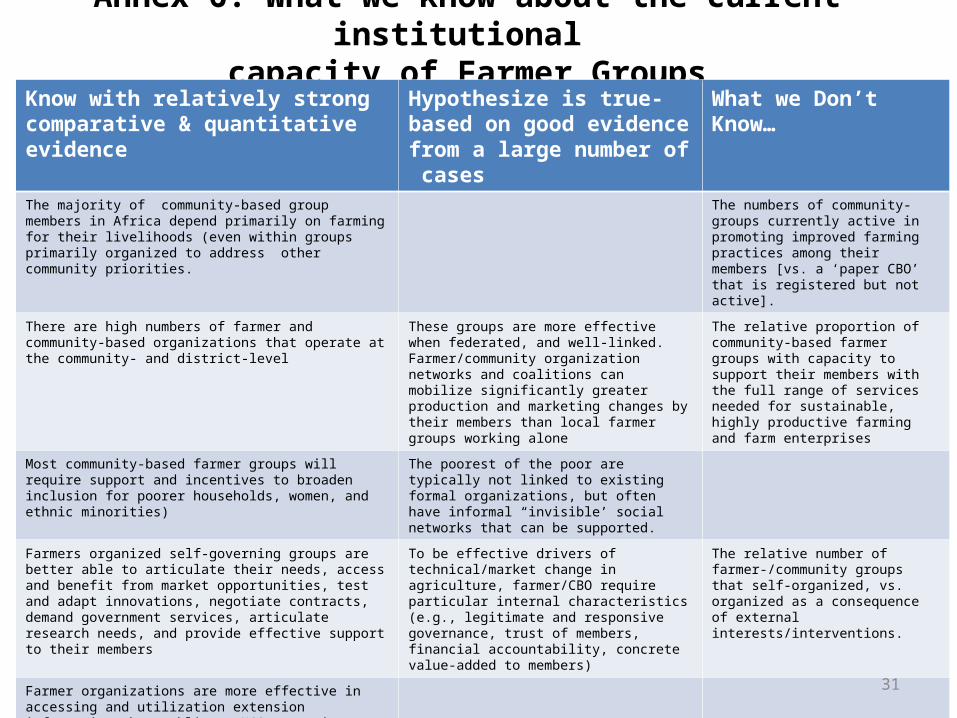
Annex 6: What we know about the current institutional capacity of Farmer Groups
Know with relatively strong comparative & quantitative evidence
Hypothesize is true- based on good evidence from a large number of cases
What we Don’t Know…
The majority of community-based group members in Africa depend primarily on farming for their livelihoods (even within groups primarily organized to address other community priorities.
The numbers of community-groups currently active in promoting improved farming practices among their members [vs. a ‘paper CBO’ that is registered but not active].
There are high numbers of farmer and community-based organizations that operate at the community- and district-level
These groups are more effective when federated, and well-linked. Farmer/community organization networks and coalitions can mobilize significantly greater production and marketing changes by their members than local farmer groups working alone
The relative proportion of community-based farmer groups with capacity to support their members with the full range of services needed for sustainable, highly productive farming and farm enterprises
Most community-based farmer groups will require support and incentives to broaden inclusion for poorer households, women, and ethnic minorities)
The poorest of the poor are typically not linked to existing formal organizations, but often have informal “invisible’ social networks that can be supported.
Farmers organized self-governing groups are better able to articulate their needs, access and benefit from market opportunities, test and adapt innovations, negotiate contracts, demand government services, articulate research needs, and provide effective support to their members
To be effective drivers of technical/market change in agriculture, farmer/CBO require particular internal characteristics (e.g., legitimate and responsive governance, trust of members, financial accountability, concrete value-added to members)
The relative number of farmer-/community groups that self-organized, vs. organized as a consequence of external interests/interventions.
Farmer organizations are more effective in accessing and utilization extension information when public or NGO extension providers are structured to see them as principal clients
Farmer organizations whose members contribute financially/in-kind are more active and effective
Aggregated data on membership fee contributions
Farmer organizations are highly constrained in their access to funding
Building of farmer organizations requires long-term support – with significant co-financing contributed by the organisation and its members
31

With relatively strong comparative and quantitative evidence
Hypothesize is True- based on good evidence from a large number of cases
What we Don’t Know…
The benefits/returns that can be achieved from large-scale investment in community-driven development programs which each address a broad range of development challenges (incl. agriculture, health, nutrition, NRM, finance)
The benefits of investment in community-driven development for agriculture in terms of sustainability, farmer interest, effective farmer mobilization, and livelihood benefits, defined in terms of farmer self-perceived well-being, empowerment (Qualitative & quantitative data_
Benefits of community-driven agricultural development for agricultural productivity (piecemeal quantitative data)
A lot of existing agricultural technology and innovations that will significantly raise productivity and incomes, food & livelihood security are implemented by some farmers and communities within the farming landscape – but are not currently accessible to other farmers. In these circumstances, investment in horizontal sharing can be highly effective without further involvement of external technical experts/ extensionists.
The systematic use of facilitated peer- knowledge-sharing methods can more rapidly and effectively move the adoption of agricultural innovations to scale, both those introduced by external actors and those learned from other farmers or developed by farmers [more than relying upon NGO or government-led direct training or model farmer approaches]
Aggregated data on the % of NGOs currently working with farmer groups to support and facilitate farmer-led model, relative to those providing only technical training
Aggregated, comparative data / evidence on the relative effectiveness of different CBO networking and coalition models in disseminating innovation at scale
32
Annex 7: What we know about the Farmer-led agricultural extension (1 of 2)

Annex 7: What we know about the Farmer-led agricultural extension (2 of 2)
With relatively strong comparative and quantitative evidence
Hypothesize is True- based on good evidence from a large number of cases
What we Don’t Know…
It is critical to link production investments with farm-level and often landscape-level resource management for it to be sustainable and not damaging. Thus even highly targeted agricultural initiatives need to be contextualized by both local people and diverse external service providers
When priority needs for farmer-led research / support services are articulated, farmers’ initial requests are for priority observable system components (e.g., declining crop yields, water quality. As they become engaged in addressing those element, they increasingly address issues that underpin those problems (such as restoring poor soil quality and improving watershed management)
The institutional mechanisms that genuinely achieve effective community participation in priority articulation, especially women’s full participation.[Mixed data on success of institutional provisions specifically made to ensure equitable participation, especially women)
Farmers can as individuals effectively integrate technical innovations related to inputs that simply reflect a qualitative change in the input (e.g., new seed varieties for farmers already using varieties of the same crop species, or substitute better-performing fertilizer for less effective fertilizers). However it is ineffective to train farmers and provide them with information about new practices or significant management changes if they can’t access adequate technical support and financing to innovate on their own farmers (e.g., new soil management practices, agroforestry, conservation agriculture, new micro-irrigation, livestock management for new products)
Farmer learning from extension methodologies: - Farmers place high value/confidence in knowledge learned from neighbors & other farmers they perceive to be like themselves- Farmers learn from diverse sources, and thus benefit most from having complementary information available through diverse media. -Farmers relate to, learn from and therefore are most likely to adopt information and innovations that have been adapted to their local conditions. -Farmers learn most effectively through face-to-face interaction an the opportunity to discuss and observe together their hands-on experience (adult theory, participatory research)
The relative effectiveness of different extension and knowledge-sharing tools within different contexts [for example, the added value of investing in community video techniques if a community radio station and peer-peer knowledge sharing mechanisms are already in place].
33
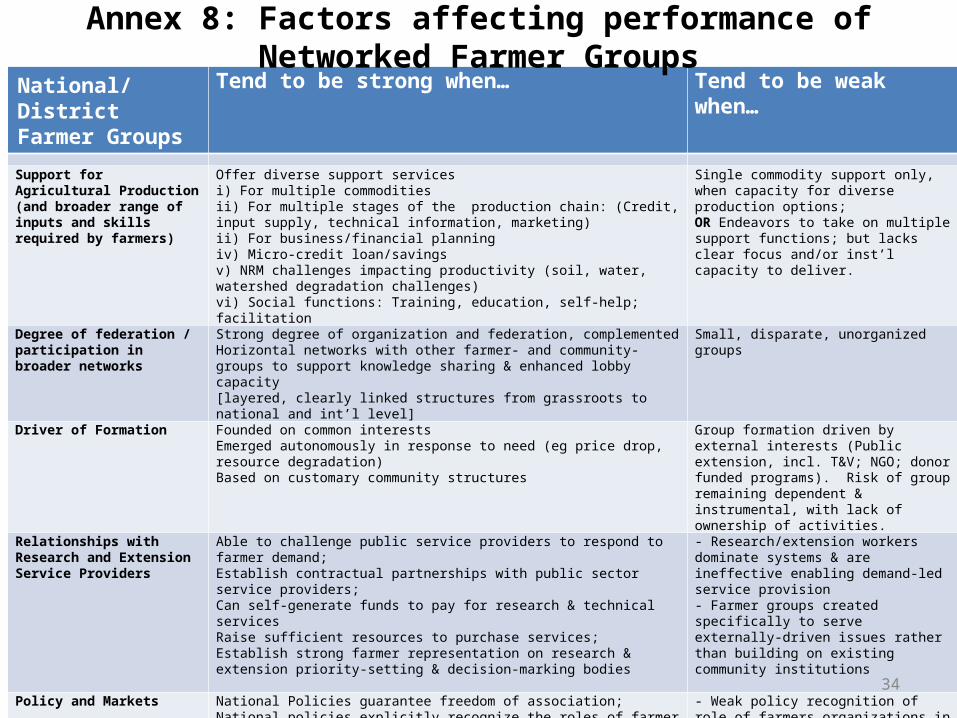
National/District Farmer Groups
Tend to be strong when… Tend to be weak when…
Support for Agricultural Production (and broader range of inputs and skills required by farmers)
Offer diverse support services i) For multiple commoditiesii) For multiple stages of the production chain: (Credit, input supply, technical information, marketing)ii) For business/financial planningiv) Micro-credit loan/savingsv) NRM challenges impacting productivity (soil, water, watershed degradation challenges)vi) Social functions: Training, education, self-help; facilitation
Single commodity support only, when capacity for diverse production options; OR Endeavors to take on multiple support functions; but lacks clear focus and/or inst’l capacity to deliver.
Degree of federation / participation in broader networks
Strong degree of organization and federation, complementedHorizontal networks with other farmer- and community- groups to support knowledge sharing & enhanced lobby capacity[layered, clearly linked structures from grassroots to national and int’l level]
Small, disparate, unorganized groups
Driver of Formation Founded on common interestsEmerged autonomously in response to need (eg price drop, resource degradation)Based on customary community structures
Group formation driven by external interests (Public extension, incl. T&V; NGO; donor funded programs). Risk of group remaining dependent & instrumental, with lack of ownership of activities.
Relationships with Research and Extension Service Providers
Able to challenge public service providers to respond to farmer demand;Establish contractual partnerships with public sector service providers;Can self-generate funds to pay for research & technical servicesRaise sufficient resources to purchase services; Establish strong farmer representation on research & extension priority-setting & decision-marking bodies
- Research/extension workers dominate systems & are ineffective enabling demand-led service provision- Farmer groups created specifically to serve externally-driven issues rather than building on existing community institutions
Policy and Markets National Policies guarantee freedom of association; National policies explicitly recognize the roles of farmer organizations
Able to coordinate policy-level actions that defend members interestsAble to facilitate linkages to agro-enterprises
- Weak policy recognition of role of farmers organizations in the economy- Insufficient strength of internal organization & inadequate negotiating capacity
Financing Financial autonomy, with diverse sources of funding Willingness of members to co-/finance activities[Indicator: Free flowing membership fees of members]
Long-term dependency on external support to be sustained
Governance Traditional modes of organisationsRespected, agreed social rules; Legally recognized rules
Annex 8: Factors affecting performance of Networked Farmer Groups
34

Annex 9: Ensuring gender equity in FBE: Lessons learnedOpportunities Challenges
Income generation/Livelihood security
- Enhanced women’s participation in self-help groups, micro-credit schemes- Enhanced service provision tailored by demands of women smallholders, and responsive to their information needs / learning strengths
- Cultural norms regarding role of women within the household, including management of household finances
Participation in decision-making
- Provisions for 50:50 female: male representation in local council elections (Timor-Lester; Kerela State Gov. case studies) - Designated seats for women on community/village council committees- Provisions for balanced women: men participation in community-development strategies - Rules for joint women and men signatories on community development contracts/ strategies. - Timing and location of meetings to accommodate women’s constraints to participation (incl. transport to attend)
Overall, current evidence indicative of low rates of female engagement in participatory community-development processes
- Operational procedures for including women in community decision-making forums insufficient to ensure meaningful participation & equal decision-making authority/legitimacy. - Cultural norms and policies preventing women from meaningful participation in meetings – Local politics closed to women’s participation
Capacity development
- Specific capacity development services tailored to female members of community building upon differentiated roles of males & females in community - Gender training for men and women – including Initiatives that mobilize men to support women, use of local gender facilitators - Convening of separate women’s meetings to prepare for presentations to broader community
- Women’s self-perception of a lack of leadership ability due to inferior education (Kakar 2005)- Lack of incentives relative to (social/economic) costs of participation- Limited freedom/availability of women to invest time in participating in multi-day peer-peer learning and knowledge-sharing processes
Monitoring & Evaluation
- Strong gender M&E component in process, with gender specific indicators and women central in evaluation process- Collection of disaggregated data 35