farm investments: alternative ownership structures that ... · farm investments: alternative...
TRANSCRIPT

Farm Investments: Alternative Ownership Structures that Address the Liquidity versus
Profitability Conundrum
N.M. SHADBOLT J.W.M. GARDNER
14th International Farm Management Congress, Western Australia, Burswood Convention Centre, Perth - August 10th to 15th, 2003
FARM INVESTMENTS: ALTERNATIVE OWNERSHIP STRUCTURES THAT ADDRESS THE LIQUIDITY VERSUS PROFITABILITY CONUNDRUM
Shadbolt N.M. [email protected]
IFNHH, Massey University Gardner J.W.M. [email protected]
INR, Massey University
Abstract Investing in farmland is fraught with conflicting signals. Oltmans (2001) concludes that while
investing in land may generally be profitable it is seldom, if ever, feasible on a cash flow basis.
He argues that the non-depreciable nature of land and long-term capital gains are incompatible
with the capital recovery terms sought by investors and lenders. He also notes that literature on
this subject tends to focus on either the returns (profitability) or the cash flow (feasibility) but not
on both simultaneously. To assist in the debate it is helpful to split the farm into two businesses
that are often, but not necessarily, linked – the property business, where success is measured
by changes in asset values over time and is driven by smart purchase and sale decisions, and
the farming business, where success reflects effective and efficient sustainable operation of the
resource base. By determining the profitability, liquidity and wealth creation for three ownership
structures (land leasing, sharefarming, equity partnerships) from the perspective of both the
farming entity and the passive investor (property owner or non-managing equity partner) it is
possible to identify for each player the measures most relevant to their expectations from the
investment and the factors which most influence them. If the assets of the property business
and the farming business are owned by different parties there is no need for an aggregate
measure of business performance. The challenge is to determine ‘fair’ returns to each player; is
profit, cash flow or wealth creation criteria the basis for such a comparison? For the property
business investors the opportunity cost of capital comes from the farming ‘rent’ and what they
believe the property business will deliver over time (many expect at the very least an inflation
proof investment). The opportunity cost of capital for the farming business investors must allow
for depreciating assets. Historically the property business has out performed the farming
business although its returns have been three times as volatile as farming returns (Nartea and
Basanta(1998), Brown (1999)).
Introduction
Investment analysis is a technique often learned with great difficulty and rapidly forgotten.
However it is a very useful tool to evaluate farmland purchase decisions. Considering annual

profitability measures only for a long-term investment can be misleading due to the volatility of
annual profit and because this overlooks the nature of farming returns. This paper backgrounds
the issue, describes measures of profitability and financial feasibility for both the property and
the farming businesses and proposes solutions to the liquidity versus profitability conundrum.
Farmland Investment
Investing in farmland is fraught with conflicting signals. In an interesting paper Arnold Oltmans
(2001) concludes that while investing in land may generally be profitable it is seldom, if ever,
feasible on a cash flow basis. He argues that the non-depreciable nature of land and long-term
capital gains are incompatible with the capital recovery terms sought by investors and lenders.
If these are the facts about investing in land why do people continue to buy land and what
makes it worthwhile for them? Or do we agree with those rural professionals who state that
farmers are not clear in their investment decisions; they are too influenced by ‘lifestyle’ factors
to make rational decisions? And are the non-farmer landowners similarly afflicted with emotional
bias in their investment decisions?
Researchers have demonstrated that, historically, farm businesses have achieved attractive
returns but is that relevant in today’s investment climate? To assist in this debate it is helpful to
split the farm into two businesses that are often, but not necessarily, linked – the property
business, where success is measured by changes in asset values over time and is driven by
smart purchase and sale decisions, and the farming business, where success reflects effective
and efficient sustainable operation of the resource base. While property business decisions may
determine whether a business still exists or not it is the farming business and its decisions that
drive sustainable resource use.
The problem in measuring the aggregate businesses’ performance is that success in one
business (e.g. capital gain) can cause a measure of failure in the other (e.g. reduced Return on
Assets) when, in fact, both businesses could be performing well. This is exacerbated in that
returns to land is a principal determinant of farmland price (Cloughley & Journeux (1992).
Oltmans (2001) identified that land produces current earnings as well as being a vehicle for
accumulating wealth so delivers to two common farming goals. With more liquid investments
such as shares an increase in their value without an improvement in earnings is often a prompt
to sell; similarly an improvement in earnings not reflected in an improved share value is a
prompt to buy. While this may seem simple in principle, reported earnings are historical (and not
always reliable or comparable) and share values reflect expectations for future earnings; there
is still ample opportunity to get it wrong with liquid investments. Land investments are illiquid,
not easily reversed nor is it simple to purchase into agricultural land investments. Farming
companies listed on the stock exchange in Australasia have all spectacularly collapsed or
redirected their activities away from farming.
Historically the property business has out performed the farming business although returns
have been three times more volatile than farming returns (Nartea and Basanta(1998), Brown
(1999)). Nartea and Basanta(1998), and Brown (1999) have shown that the returns (both
property and farming) from the farm business fluctuate significantly differently to those from
stocks and bonds. Both Brown (1999) and Nartea and Basanta(1998) recommend investment in
farmland/farming, stocks and bonds in varying proportions as a risk management strategy.
Nartea and Pellegrino (1997) determined that 68 per cent of farmland risk could be eliminated
through effective diversification; a diverse portfolio of investments (stocks, bonds and farmland)
reduced risk to a third of that from farmland alone. Oltmans (2001) referred to recent studies
showing total rates of return to farmland comparing favourably with non-farm assets when
adjusted for risk. He also observed that literature on investing tends to focus on either the
returns (profitability) or the cash flow (feasibility) but not both simultaneously.
While farmers are often criticized for accepting low farming returns, from their farming business,
and relying heavily on property returns they are operating a business in which few assets
depreciate. The opportunity cost of their capital is a combination of the returns from the farming
business and the property business (many expect at the very least an inflation proof
investment).
Farmland assets in the US over the last 30 years have accounted for 70-80% of total farm
assets (Oltmans, 2001) and recent NZ surveys have similar values (The Economic Service,
2001 & 2000, DEXCEL, 2001 & 2000). It is therefore important to determine the impact on farm
business profitability and feasibility, of investing in farmland.
Profitability
Too frequently rural professionals use the terms profit and cash surplus (liquidity)
interchangeably. As identified above the overall profitability of a farm investment is the sum of
its farming and property business. The farming business delivers primarily a cash result and the
property business does not. ‘Asset rich, cash poor’ is commonly used in farming, suggesting
liquidity difficulties identified by Oltmans as the persistent cash flow problems of the farm sector.
The problem inherent in a land investment is described by Oltmans (2001) as that of liquidity not
profitability.
Profitability is the total of the returns from the farming business, the operating profit after tax,
and capital gains or losses from the property business. The returns for 2000/2001 using the
weighted average all classes data from the New Zealand Sheep and Beef Farm Survey 2000/01
(The Economic Service, 2001) are shown below. The capital gain increases the return for this
business nine-fold; a 26.7% return was generated from total opening assets valued at
$1,780,178 (land and buildings of $1.25m plus livestock, plant and machinery of $530,201).

FARMING BUSINESS $530,201
PROPERTY BUSINESS $1,249,977
Capital gains/Losses $425,540
Net Operating Profit after Tax $71,584 * (1-0.3)
Profit
$475,649
The owner-operator data from the Economic Survey of New Zealand Dairy Farmers 2000/01
(Dexcel, 2001) are shown below. The capital gain more than quadruples the return for this
business; a 25% return was generated from total opening assets valued at $1,741,843.
FARMING BUSINESS $527,284
PROPERTY BUSINESS $1,214,559
Capital gains/Losses $322,205
Net Operating Profit after tax $164109 * (1-0.3)
Profit
$437,081
The return on assets after tax (net operating profits after tax / opening assets) for these two
farms in 2000/2001 was 2.8% and 6.6% respectively. Using that measure alone as an indication
of returns and as a guide to investments who would have decided not to buy land and miss out
on the 25-26% return? More specifically who could have bought land at pre-tax interest rates
then of 8.5%?

The above method does not take into account the timeframe of the investment, not does it
recognise that the property business returns are highly volatile. In 1996/97 and 1997/98, for
example, land values in dairying fell (Dexcel, 2001).
To take account of the time value of money Oltmans (2001) uses a capital budgeting
framework. He calculated the internal rate of return and the net present value to evaluate the
profitability of the investments. He then applied a cost of funding to determine the feasibility of
funding the investment over the time frame given.
Oltmans (2001) method is further explored by Shadbolt and Gardner (2002) who used a sheep
and beef cattle farm example to determine that with an average operating profit of $264/ha per
year that yielded a 6% return on assets funding cost of 8% cannot be met, there would be a 2%
shortfall ($88/ha/yr) if the farm was totally funded by debt. This would quickly lead to a liquidity
crisis unless alternative arrangements were found. One common, often short-term, response is
not rewarding family for the true market value of their labour and management. Another
arrangement is termed ‘passive’ equity money. This money would receive no or little return but
at the end of the 15 years would benefit from any improvement in asset value.
Shadbolt and Gardner (2002) calculated that an improvement of just under 4% per annum on
asset values from the property business in their example farm would provide a combined return
of 8% over the 15 years. If equity holders were confident of at least that 4% growth in asset
values, they might find this an attractive investment. Such investors would however need
patience and be reconciled to this investment being a growth rather than an income investment.
This has been well understood by many successful farming families over the years.
The emphasis placed on operating profit over the years by farmers and consultants in both
industries has not been misplaced because as this improves so also does liquidity and farm
investments become income as well as growth investments. If improvements in operating profits
are not achieved the farm might still be a growth investment but it could have liquidity problems
that will diminish any growth achieved.
Alternative Ownership Options Another way of avoiding the cost of land ownership is by leasing. If the land and buildings were
leased at 6% of their market value ($198/ha) the $264/ha return would be $66/ha. To deliver to
an 8% opportunity cost of capital over the 15 years on the investment in stock and plant the
lease option would need to achieve $88/ha; an improvement in operating profit of 8.3% above
that achieved in the land purchase option (from $264/ha to $286/ha). As the proportion of
depreciable assets (machinery and plant) and volatile livestock values is greater under the
lease option, returns would need to be further improved to be in line with land inclusive
investments.

Other ownership arrangements include share leasing in which both parties to an arrangement
share business risks and equity share arrangements when the ownership is spread between off-
farm and on-farm members. Equity share arrangements have operated in large family farm
ventures for many years.
To explore these ownership structures further consider a 400 cow dairy farm in which the land
and buildings are worth $2.36m, the dairy cooperative shares $546,720, the livestock $400,000
and the plant and machinery $150,000.
Profitability The operating profit on this farm is forecast to be $215,600 or $1767/ha. Without accounting for
capital gains/losses this generates a return on $3.373m assets of 6.4%. This is the return that
both an owner operator (who has already fully reimbursed family labour) and an investor in an
equity partnership would achieve (Table 1). Returns, as calculated by a simple two variable
sensitivity analysis, range from 2.6 to 11.9% (Appendix One).
If the investment was split and the land was owned by a landowning company (the property
business) and a 45% sharemilker was contracted to run the farm (the farming business) their
returns would be 5.8% and 9.4% respectively. In this arrangement both parties would gain and
lose from variations in market price and production. The sharemilker, who carries most of the
operating costs of the business would have a much greater range in returns (-1.2 to 24.5%)
than the landowning company (3.3 to 9.4%). The emphasis sharemilkers put on productivity is
therefore understandable.
Under the cash lease option the returns to the landowner are 6% of land value and the lessee,
who purchases the dairy company shares, the livestock and the plant and machinery achieves
7.2%. While the landowner has no variation in returns under a lease arrangement the lessee
returns range form -4.6% to 24%.
Some of these investments are in appreciating assets other are not so it is necessary to extend
this analysis to include time value of money. Also included should be the possibility that land
and livestock values may not be the same at the end of the analysis as at the beginning. The
risk analysis at this point must extend beyond the simple two variable sensitivity tables used in
the return on assets analysis above. Using @RISK to introduce variability in prices, yields and
final market value of assets and the same approach as in the previous example the Internal
Rate of Return and its variability has been calculated for the various ownership structures. The
results presented in Table 1 also include the calculated range (at the 5% and 95% confidence
limits) and are based on no appreciation of land values.

For both the equity partnership and the landowning company to achieve the 9% sharemilker
internal rate of return land values would have to improve by 5.7% per year. For the landowner
who leases land to achieve the 7% lessee return land values would have to improve by 1.8%
per year.
The returns for both the sharemilker and lessee have a much greater range so, although they
are a more profitable option, they are also more risky. There is further risk for them not
calculated here due to the fixed term of their contracts; they do not have the choice of when to
sell their assets. The further risk to the landowners not calculated here is that the sharemilker or
lessee will mismanage land and buildings. This may not affect its earning capacity in the short
term but may have a negative impact on it long-term.
Profitability Equity
Partnership
Landowning
Company
Share-
milker
Lessor Lessee
Return on Assets (RoA)
6.4%
(2.6-11.9)
5.8%
(3.3-9.4)
9.4%
(-1.2-24.5)
6%
7.2%
(-4.6-24)
Internal Rate of Return (IRR) with no capital gain
6.2%
(3-10%)
5.6%
(4-8%)
9.2%
(2-18%)
5.8%
(5-6%)
7.0%
(0-17%)
Capital Gain per year required for equivalence
5.7% 5.7% 1.8%
Table 1: Profitability criteria (and their variability) of ownership structures, Return on
Assets (minimum and maximum values from the sensitivity tables), IRR (5% and 95% confidence limits from @RISK outcome probabilities) and the capital gain required by the
land owning structures to gain the same IRR as their related non-landowning structure.
Liquidity The higher the returns the greater the level of debt the various options can carry. If interest
rates are 8% the sharemilker could handle 100% debt and the lessee can also borrow up to
80% while the amount able to be borrowed by the equity partnership, the landowning company
and the landowner who leases land will depend on how much they want as cash from the
business. This can often be a point of difference and friction between off-farm and on-farm
investors in an equity partnership. Even if they require no cash and view these as purely growth
investments as the returns are below the cost of debt they could not borrow 100% of the funds
required, but would have to put in some ‘passive’ funds.
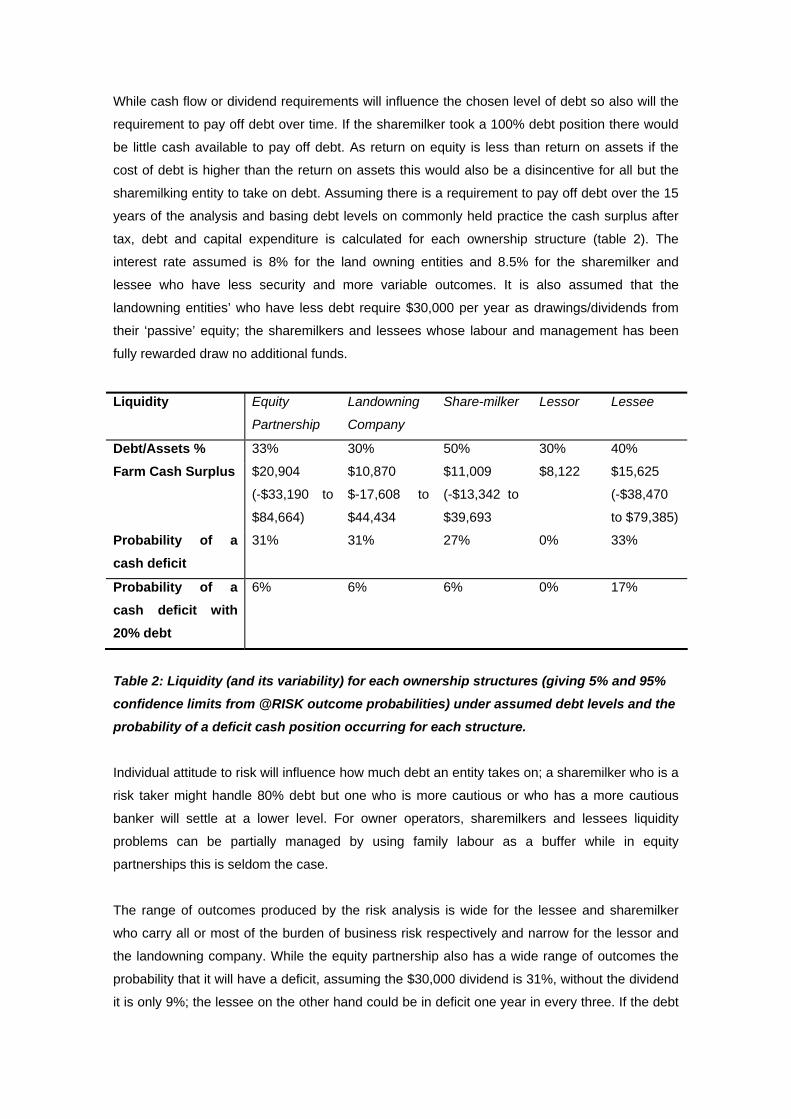
While cash flow or dividend requirements will influence the chosen level of debt so also will the
requirement to pay off debt over time. If the sharemilker took a 100% debt position there would
be little cash available to pay off debt. As return on equity is less than return on assets if the
cost of debt is higher than the return on assets this would also be a disincentive for all but the
sharemilking entity to take on debt. Assuming there is a requirement to pay off debt over the 15
years of the analysis and basing debt levels on commonly held practice the cash surplus after
tax, debt and capital expenditure is calculated for each ownership structure (table 2). The
interest rate assumed is 8% for the land owning entities and 8.5% for the sharemilker and
lessee who have less security and more variable outcomes. It is also assumed that the
landowning entities’ who have less debt require $30,000 per year as drawings/dividends from
their ‘passive’ equity; the sharemilkers and lessees whose labour and management has been
fully rewarded draw no additional funds.
Liquidity Equity
Partnership
Landowning
Company
Share-milker Lessor Lessee
Debt/Assets % 33% 30% 50% 30% 40%
Farm Cash Surplus $20,904
(-$33,190 to
$84,664)
$10,870
$-17,608 to
$44,434
$11,009
(-$13,342 to
$39,693
$8,122
$15,625
(-$38,470
to $79,385)
Probability of a cash deficit
31% 31% 27% 0% 33%
Probability of a cash deficit with 20% debt
6% 6% 6% 0% 17%
Table 2: Liquidity (and its variability) for each ownership structures (giving 5% and 95% confidence limits from @RISK outcome probabilities) under assumed debt levels and the
probability of a deficit cash position occurring for each structure.
Individual attitude to risk will influence how much debt an entity takes on; a sharemilker who is a
risk taker might handle 80% debt but one who is more cautious or who has a more cautious
banker will settle at a lower level. For owner operators, sharemilkers and lessees liquidity
problems can be partially managed by using family labour as a buffer while in equity
partnerships this is seldom the case.
The range of outcomes produced by the risk analysis is wide for the lessee and sharemilker
who carry all or most of the burden of business risk respectively and narrow for the lessor and
the landowning company. While the equity partnership also has a wide range of outcomes the
probability that it will have a deficit, assuming the $30,000 dividend is 31%, without the dividend
it is only 9%; the lessee on the other hand could be in deficit one year in every three. If the debt

levels are set at 20% for all ownership options the probability of deficits is reduced but the
lessee could still be in deficit 17% of the time. Only by reducing the lease payment from 6% to
5% of land value or by dropping debt levels to 5% does the probability of deficits come below
10%. Sharemilkers and lessees often pay themselves less than the market value of family
labour assumed in this analysis to enable themselves to borrow more and to pay debt off faster;
another example of how family labour is a useful buffer for liquidity management.
WEALTH CREATION The Net Present Value of each ownership investment cash flow can be used as measure of
wealth creation; it is the present value of a future stream of cash generated by each investment.
With an IRR of 9% the sharemilking investment is the only one with a positive NPV at an 8%
discount rate. The equity partnership has a similar NPV if land values increase by 4% per year
while the landowning company requires a 4.3% increase to equate. For the lessor to have a
similar NPV to the lessee land values must increase by 3.2% per annum.
If instead the NPV is calculated on the cashflows after tax after debt payment (interest and
principal) for each ownership structure and at a 5.6% post tax discount rate the difference
between the options narrows. To generate the same wealth or NPV as the sharemilker the
annual increase in land values must be just 3.64% and 3.82% respectively for the equity
partnership and the landowning company and lessor land values need only increase by 2.7%
for a similar NPV to the lessees. Historically land in New Zealand has increased in value by
11% per annum (Nartea and Basanta 1998).
As the value of livestock does not appreciate but is instead linked to product prices and highly
volatile and as plant and machinery is replaced so as to be the same value at the end as at the
beginning the sharemilking and leasing options would appear to generate no wealth. The NPV
calculation assumes that cash surpluses generated throughout the life of the investment are
reinvested and not spent; in practice it takes discipline to achieve this assumption.
Conclusion
Many in the farming industry do not use the techniques available to assess both profitability and
feasibility of investing in farm businesses. These techniques help explain the complexities of
investing in both depreciable and appreciable assets. As Oltmans (2001) identifies the inherent
problem in land investments is a cashflow one, not an income or profitability one. He states that
land as a growth asset is more suited to equity financing rather than debt financing; few banks
are willing to be either passive or patient in their demands for cashflow! The solution lies in the
use of passive equity funds that require no cash return in the short term but are reliant on longer
term growth prospects. If the assets of the property business and the farming business are
owned by different parties there is no need for an aggregate measure of business performance.
The challenge is to determine ‘fair’ returns to each player; is profit, cash flow or wealth creation

criteria the basis for such a comparison? The return on asset calculation based on annual
operating profits is not a fair measure for comparison as it does not take into account risk,
capital gain or time value of money. Unfortunately there are a number of sharemilking
agreements that have been altered in the landowners’ favour because of an undue emphasis
being placed on RoA.
For the property business investors their returns include farming ‘rent’ and what they believe the
property business will deliver over time (many expect at the very least an inflation proof
investment). Their returns are less variable than farming business investors. The high variability
in returns for farming business investors requires a greater emphasis to be placed on liquidity
as a measure of success and for a range of risk management strategies to be in place to reduce
the probability of deficit outcomes. Bankruptcies are not uncommon in sharemilkers.
The measures of success used by the property business and the faming business differ so to
ensure ‘fairness’ it may be more relevant to aim to meet the expectations of each party without
attempting equivalence in returns.
References
BROWN, b. (1999) How do Farm Returns Compare with returns from Stocks or Bonds?
Proceedings of the 12th International farm Management Congress; Durban, South Africa
CLOUGHLEY B. and JOURNEUX P. (1992), An Investment perspective on the productive value
of farmland. Internal MAF Policy Document, New Zealand.
DEXCEL, 2001 Economic Survey of Dairy Farmers 2000/2001
NARTEA, G.V. & BASANTA, R.D. (1998) Diversifiable and Non-Diversifiable Risk in New
Zealand Dairy Farming; Proceedings of the 1998 NZ Society of Farm Management Conference;
Hamilton, NZ
NARTEA, G.V. & PELLEGRINO, J.M. (1997) Risk-return Characteristics of Farmland and their
Implications for Land Value. Proceedings of the 1997 NZ Society of Farm Management
Conference; Palmerston North, NZ
OLTMANS (2001) Why Farmland Cannot, Will Not And Should Not Pay For Itself. Journal of the
American Society of Farm Managers & Rural Appraisers :57-67
The Economic Service, 2000 & 2001 Sheep and Beef Farm Survey, 1999-2000 & 2000-2001

APPENDIX I: SENSITIVITY ANALYSES OF RETURN ON CAPITAL TO MILK PRICE ($/KG MS) AND MILK PRODUCTION (KG MS/COW)
EQUITY SHARE ARRANGEMENT
Milk Price $/kgMS6.4% 3.00$ 3.40$ 3.80$ 4.20$ 4.60$ 5.00$
300 2.6% 3.7% 4.9% 6.1% 7.3% 8.4%320 3.1% 4.4% 5.6% 6.9% 8.2% 9.4%340 3.7% 5.1% 6.4% 7.7% 9.1% 10.4%350 4.0% 5.4% 6.8% 8.1% 9.5% 10.9%360 4.3% 5.7% 7.1% 8.5% 10.0% 11.4%370 4.6% 6.1% 7.5% 9.0% 10.4% 11.9%
SHAREMILKER
Milk Price $/kgMS9.4% 3.00$ 3.40$ 3.80$ 4.20$ 4.60$ 5.00$
300 -1.2% 2.1% 5.3% 8.6% 11.8% 15.0%320 0.5% 3.9% 7.4% 10.8% 14.3% 17.7%340 2.1% 5.7% 9.4% 13.1% 16.8% 20.4%350 2.9% 6.7% 10.4% 14.2% 18.0% 21.8%360 3.7% 7.6% 11.5% 15.4% 19.2% 23.1%370 4.5% 8.5% 12.5% 16.5% 20.5% 24.5%
LANDOWNING COMPANY
Milk Price $/kgMS5.8% 3.00$ 3.40$ 3.80$ 4.20$ 4.60$ 5.00$
300 3.3% 4.1% 4.8% 5.6% 6.4% 7.1%320 3.7% 4.5% 5.3% 6.1% 7.0% 7.8%340 4.1% 4.9% 5.8% 6.7% 7.6% 8.4%350 4.2% 5.1% 6.0% 6.9% 7.8% 8.7%360 4.4% 5.4% 6.3% 7.2% 8.1% 9.1%370 4.6% 5.6% 6.5% 7.5% 8.4% 9.4%
LESSEE
Milk Price $/kgMS7.2% 3.00$ 3.40$ 3.80$ 4.20$ 4.60$ 5.00$
300 -4.6% -1.0% 2.6% 6.2% 9.9% 13.5%320 -2.8% 1.1% 4.9% 8.8% 12.6% 16.5%340 -1.0% 3.1% 7.2% 11.3% 15.4% 19.5%350 -0.1% 4.1% 8.3% 12.6% 16.8% 21.0%360 0.8% 5.2% 9.5% 13.8% 18.2% 22.5%370 1.7% 6.2% 10.6% 15.1% 19.5% 24.0%