farah alibay - carnegie mellon school of …vdesaraj/papers/alibay12_iac.pdffarah alibay...
TRANSCRIPT
*Aurora Flight Sciences Corporation, USA, [email protected] §Aurora Flight Sciences Corporation, USA, [email protected] ǂMassachusetts Institute of Technology, USA, [email protected]
IAC-12.A3.3A.9 Page 1 of 12
IAC-12.A3.3A.9
FRACTIONATED ROBOTIC ARCHITECTURES FOR PLANETARY SURFACE MOBILITY SYSTEMS
Farah Alibay
Massachusetts Institute of Technology, USA, [email protected]
Vishnu Desaraju*, Jessica E. Duda§, Jeffrey A. Hoffman
ǂ
Planetary surface exploration missions are becoming increasingly complex and future missions promise to be
even more ambitious than those that have occurred thus far. To deal with this complexity, this paper proposes a
fractionated approach to planetary surface exploration. Fractionation involves splitting up large vehicles into several
smaller ones that work together in order to achieve the science goals. It is believed that fractionation of rovers can
lead to increased value delivery and productivity, as well as helping manage complexity. A science goal-driven
methodology for generating a tradespace of multi-vehicle architectures in the early stages of mission design is
detailed. A set of carefully designed metrics are then put forward as a way to help compare multi-vehicle
architectures to each other and to the single vehicle (monolithic) equivalent. These include science value delivery,
productivity, system- and vehicle-level complexity, and mass metrics. Through two Mars-based case studies, the
advantages and limitations of fractionation are demonstrated. Fractionation is found to be particularly advantageous
when the science goals are broad, when there are competing requirements between goals, and when the exploration
environment is particularly treacherous. Additionally, multi-vehicle systems entail simpler vehicles with lower
vehicle-level complexity, lower mission risk and higher productivity over the mission duration, as well as being
more easily upgradeable. On the other hand, they lead to higher system-level complexity, and can somewhat
increase the overall mass of the system. This means that mass is traded for higher science return and lower risk
during the mission, and complexity is shifted from design complexity to operational complexity. Multi-vehicle
systems involve more testing and on-board automation than single vehicles, but they also lend themselves more
easily to collaboration between different agencies, and can benefit from several emergent properties that increase the
overall functionality of the system.
I. INTRODUCTION
The traditional approach to planetary surface
exploration is to use a single planetary surface vehicle
and consists of a point design with limited exploration
of the multi-vehicle architecture trade space. While this
has led to many successful missions, with the growing
complexity emerging from increasingly ambitious
mission objectives, the accomplishment of future
missions will likely require a change in paradigm in
order to achieve these goals. Looking at the history of
the Mars rovers: the Mars Science Laboratory1 (MSL)
was an order of magnitude heavier, more complex and
more expensive than the Mars Exploration Rovers2
(MERs), which in turn were an order of magnitude
larger that Sojourner.3 It could also be argued that it is
MSL’s excessive complexity that led to the mission
being late and significantly over budget.
In order to continue achieving ever-increasing
science goals while managing this complexity issue,
this paper puts forward a fractionated approach to the
design of planetary surface mobility systems, as a way
to increase scientific return and robustness, as well as to
decrease vehicle level complexity, compared with the
monolithic. Fractionated mobility systems are
composed of physically independent vehicles that can
collaborate to provide additional benefit or value to the
beneficiaries. Separately, each vehicle may have limited
functionality, but together, they have at least as much,
and often more, functionality than their monolithic
counterpart. In the aerospace domain, fractionation is
currently being investigated under the DARPA F6
program,4,5
whose goal is to replace traditional, highly-
integrated, monolithic satellites with wirelessly-
networked clusters of heterogeneous modules
incorporating the various payload and infrastructure
functions. The key finding of this program is that such
fractionated architectures can deliver a comparable or
greater mission capability than monolithic satellites, as
well as significantly enhanced flexibility and robustness
with respect to environmental events and changes in
needs and requirements.
Notionally, fractionation for satellites and
fractionation for planetary surface vehicles are similar
concepts. However, the implementation of fractionation
on mobility systems as compared to satellites is
inherently different, as it presents several novel and
unique opportunities for the following subsystems:
12-A3.3A.9 Page 2 of 12
- Communication: The communication systems can be
shared across vehicles in areas with limited visibility
(when exploring lava tubes or the lunar poles, for
example) or multiple vehicles can carry different
long-range communication systems to increase the
redundancy & data transmission rate;
- Navigation: The path planning and sample taking
activities can be separated to increase overall
mission speed by allowing key activities to occur
concurrently (in a manner similar to that used for de-
mining activities);
- Power Generation and Thermal Protection:
Fractionation can lead to a concept with a larger
“mothership” vehicle providing thermal energy and
power to smaller vehicles. Alternatively, one vehicle
can generate energy using solar panels in a highly
illuminated area while another travels in areas with
low illumination (again for the exploration of lava
tubes, craters or the lunar poles, for example);
- Payload: Fractionation of planetary surface vehicles
allows for the spreading and/or duplication of
scientific instruments across several vehicles to
increase the rate at which scientific activities are
being performed and the coverage area, while also
increasing the robustness of the system.
The idea of multi-vehicle robotic systems for
planetary surface exploration is not a new one. In the
field of controls, a significant amount of work has been
undertaken in function allocation and to demonstrate
the advantages of multi-agent mapping of unknown
areas.6,7,8
Furthermore, the field of collaborative
robotics for planetary surfaces is also rapidly growing,
in an attempt to enable the exploration of particularly
treacherous environments.9,10,11
Finally, multi-rover
architectures have also emerged in recent early mission
concepts. For example, one of the architectures that was
proposed for a potential Mars 2018 mission included a
2-rover system, working collaboratively on the surface
of Mars.12
Despite this increased interest in multi-rover
exploration in the recent years, there has never been an
attempt to systematically explore the tradespace of
multi-vehicle architectures during early system design.
Furthermore, the evaluation of a tradespace of
fractionated multi-vehicle architectures is non-trivial. It
requires non-traditional metrics that highlight the trades
between single vehicle and multi-vehicle architectures.
These include science value return, productivity or
robustness to failure, complexity, system mass and
more specific mission properties such as the speed at
which the mission goals can be achieved or the terrain
slope of the areas that are accessible by the system.
This paper describes a methodology for generating
and exploring a tradespace of fractionated robotic
architectures that may be able to achieve greater science
value return than the monolithic baseline, as applied to
the exploration of the Martian surface. The approach
starts by identifying the mission goals. A functional
decomposition is then performed to identify the
functions required to achieve a particular mission. As
explained in Section II, once these functions have been
identified and labeled, the architecture space can be
generated. A set of constraints can also be applied to
limit the size of the tradespace. Following this, the
tradespace is evaluated using carefully designed
metrics. Finally, the space can be visualized and
explored through the tool described in Section IV of
this paper, and interesting architectures can be down-
selected.
This paper explores the trades that exist between
monolithic and fractionated architectures, through two
case studies. The first is based on the fractionation of an
ExoMars-type rover,13
and is described throughout this
paper to illustrate the methodology. ExoMars is a rover
design from the European Space Agency (ESA) that
was originally part of a 2-vehicle joint mission with
NASA, as the first part of the Mars Sample Return
(MSR) mission. It is now a single-vehicle joint mission
between ESA and the Russian Space Agency, due to
land on Mars by the end of the Decade. The second case
study undertakes a redesign of the MSL1 to demonstrate
the possible advantages of fractionated systems.
II. ARCHITECTURE GENERATION
The first step in generating a tradespace of
architectures is the identification of the science
objectives. The science goals for ExoMars have evolved
significantly over the past few years and are still being
revisited at the time of writing. For the purposes of this
case study, the following goals,13
in order of
importance, were assumed:
1) To search for signs of past and present life on Mars.
2) To characterize the water/geochemical distribution as
a function of depth in the shallow subsurface.
Once the science goals have been identified, the
functions required to fulfill these science goals need to
be identified. Functions are the activities, operations
and transformations that cause, create or contribute to
performance (i.e. to meeting goals). Functions can then
be mapped to forms, which are the physical
embodiment of that function on a vehicle.
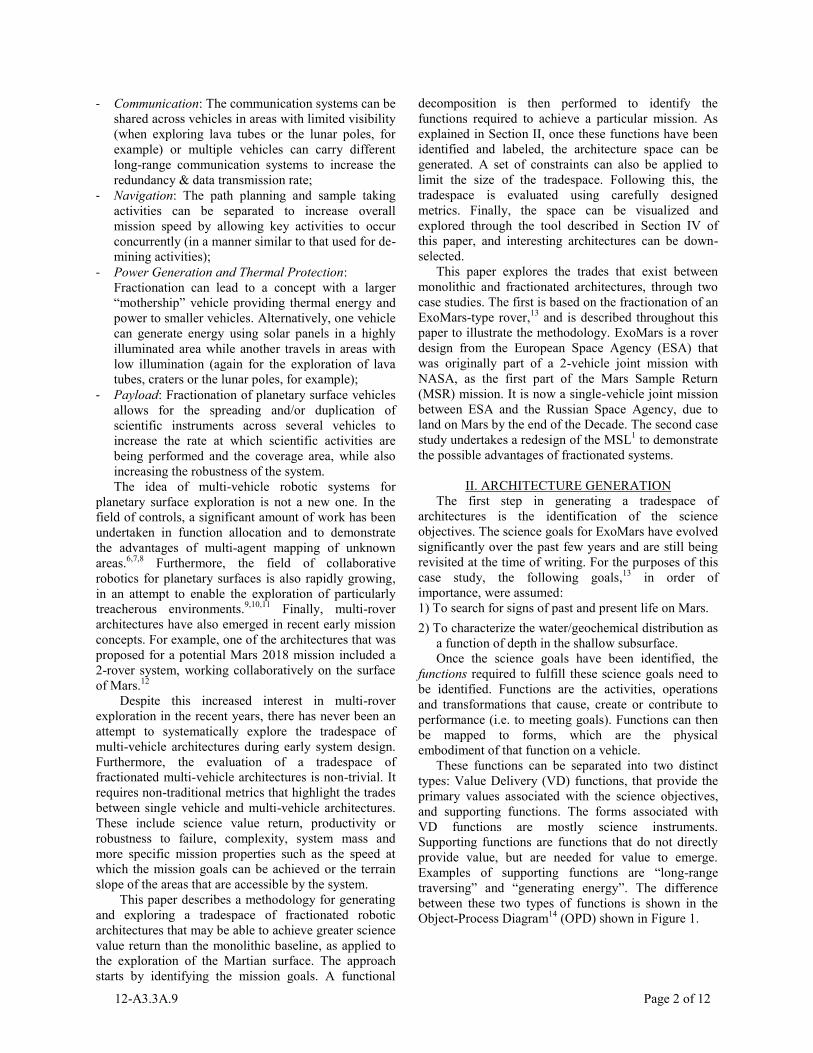
These functions can be separated into two distinct
types: Value Delivery (VD) functions, that provide the
primary values associated with the science objectives,
and supporting functions. The forms associated with
VD functions are mostly science instruments.
Supporting functions are functions that do not directly
provide value, but are needed for value to emerge.
Examples of supporting functions are “long-range
traversing” and “generating energy”. The difference
between these two types of functions is shown in the
Object-Process Diagram14
(OPD) shown in Figure 1.
12-A3.3A.9 Page 3 of 12
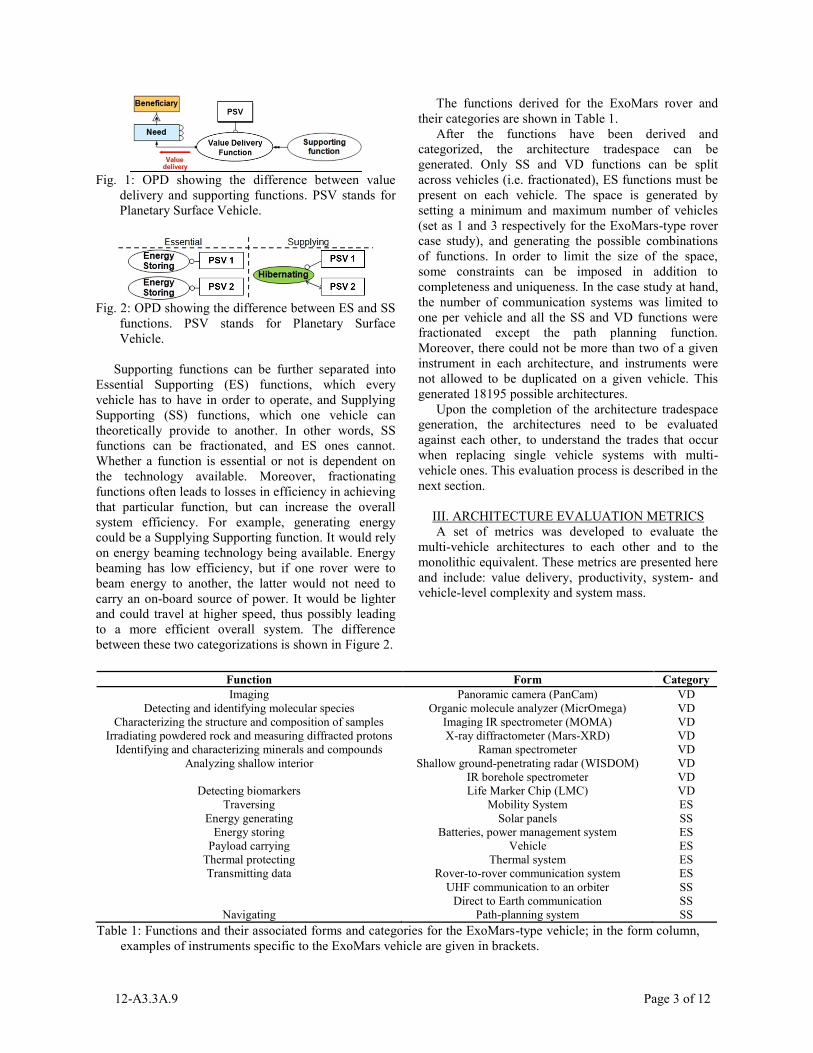
Function Form Category
Imaging Panoramic camera (PanCam) VD
Detecting and identifying molecular species Organic molecule analyzer (MicrOmega) VD
Characterizing the structure and composition of samples Imaging IR spectrometer (MOMA) VD
Irradiating powdered rock and measuring diffracted protons X-ray diffractometer (Mars-XRD) VD
Identifying and characterizing minerals and compounds Raman spectrometer VD
Analyzing shallow interior Shallow ground-penetrating radar (WISDOM) VD
IR borehole spectrometer VD
Detecting biomarkers Life Marker Chip (LMC) VD
Traversing Mobility System ES
Energy generating Solar panels SS
Energy storing Batteries, power management system ES
Payload carrying Vehicle ES
Thermal protecting Thermal system ES
Transmitting data Rover-to-rover communication system ES
UHF communication to an orbiter SS
Direct to Earth communication SS
Navigating Path-planning system SS
Table 1: Functions and their associated forms and categories for the ExoMars-type vehicle; in the form column,
examples of instruments specific to the ExoMars vehicle are given in brackets.
Fig. 1: OPD showing the difference between value
delivery and supporting functions. PSV stands for
Planetary Surface Vehicle.
Fig. 2: OPD showing the difference between ES and SS
functions. PSV stands for Planetary Surface
Vehicle.
Supporting functions can be further separated into
Essential Supporting (ES) functions, which every
vehicle has to have in order to operate, and Supplying
Supporting (SS) functions, which one vehicle can
theoretically provide to another. In other words, SS
functions can be fractionated, and ES ones cannot.
Whether a function is essential or not is dependent on
the technology available. Moreover, fractionating
functions often leads to losses in efficiency in achieving
that particular function, but can increase the overall
system efficiency. For example, generating energy
could be a Supplying Supporting function. It would rely
on energy beaming technology being available. Energy
beaming has low efficiency, but if one rover were to
beam energy to another, the latter would not need to
carry an on-board source of power. It would be lighter
and could travel at higher speed, thus possibly leading
to a more efficient overall system. The difference
between these two categorizations is shown in Figure 2.
The functions derived for the ExoMars rover and
their categories are shown in Table 1.
After the functions have been derived and
categorized, the architecture tradespace can be
generated. Only SS and VD functions can be split
across vehicles (i.e. fractionated), ES functions must be
present on each vehicle. The space is generated by
setting a minimum and maximum number of vehicles
(set as 1 and 3 respectively for the ExoMars-type rover
case study), and generating the possible combinations
of functions. In order to limit the size of the space,
some constraints can be imposed in addition to
completeness and uniqueness. In the case study at hand,
the number of communication systems was limited to
one per vehicle and all the SS and VD functions were
fractionated except the path planning function.
Moreover, there could not be more than two of a given
instrument in each architecture, and instruments were
not allowed to be duplicated on a given vehicle. This
generated 18195 possible architectures.
Upon the completion of the architecture tradespace
generation, the architectures need to be evaluated
against each other, to understand the trades that occur
when replacing single vehicle systems with multi-
vehicle ones. This evaluation process is described in the
next section.
III. ARCHITECTURE EVALUATION METRICS
A set of metrics was developed to evaluate the
multi-vehicle architectures to each other and to the
monolithic equivalent. These metrics are presented here
and include: value delivery, productivity, system- and
vehicle-level complexity and system mass.
12-A3.3A.9 Page 4 of 12
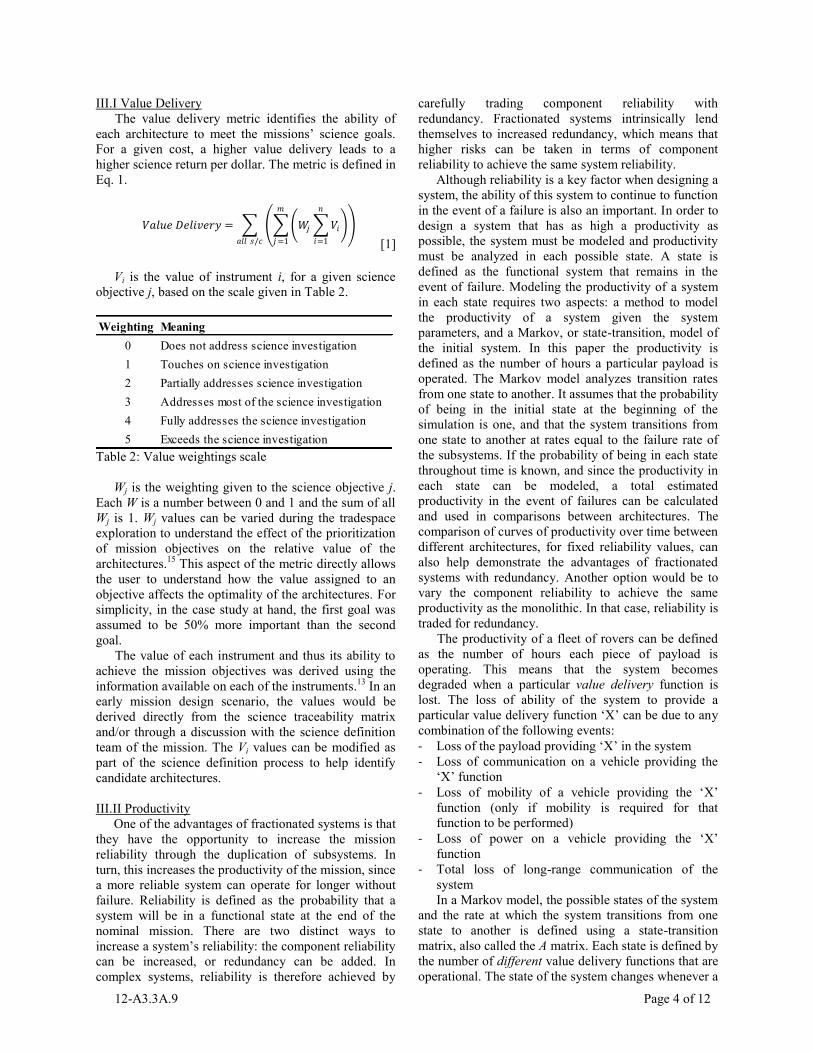
III.I Value Delivery
The value delivery metric identifies the ability of
each architecture to meet the missions’ science goals.
For a given cost, a higher value delivery leads to a
higher science return per dollar. The metric is defined in
Eq. 1.
𝑉𝑎𝑙𝑢𝑒 𝐷𝑒𝑙𝑖𝑣𝑒𝑟𝑦 = 𝑊𝑗 𝑉𝑖
𝑛
𝑖=1
𝑚
𝑗=1
𝑎𝑙𝑙 𝑠/𝑐
[1]
Vi is the value of instrument i, for a given science
objective j, based on the scale given in Table 2.
Weighting Meaning
0 Does not address science investigation
1 Touches on science investigation
2 Partially addresses science investigation
3 Addresses most of the science investigation
4 Fully addresses the science investigation
5 Exceeds the science investigation Table 2: Value weightings scale
Wj is the weighting given to the science objective j.
Each W is a number between 0 and 1 and the sum of all
Wj is 1. Wj values can be varied during the tradespace
exploration to understand the effect of the prioritization
of mission objectives on the relative value of the
architectures.15
This aspect of the metric directly allows
the user to understand how the value assigned to an
objective affects the optimality of the architectures. For
simplicity, in the case study at hand, the first goal was
assumed to be 50% more important than the second
goal.
The value of each instrument and thus its ability to
achieve the mission objectives was derived using the
information available on each of the instruments.13
In an
early mission design scenario, the values would be
derived directly from the science traceability matrix
and/or through a discussion with the science definition
team of the mission. The Vi values can be modified as
part of the science definition process to help identify
candidate architectures.
III.II Productivity
One of the advantages of fractionated systems is that
they have the opportunity to increase the mission
reliability through the duplication of subsystems. In
turn, this increases the productivity of the mission, since
a more reliable system can operate for longer without
failure. Reliability is defined as the probability that a
system will be in a functional state at the end of the
nominal mission. There are two distinct ways to
increase a system’s reliability: the component reliability
can be increased, or redundancy can be added. In
complex systems, reliability is therefore achieved by
carefully trading component reliability with
redundancy. Fractionated systems intrinsically lend
themselves to increased redundancy, which means that
higher risks can be taken in terms of component
reliability to achieve the same system reliability.
Although reliability is a key factor when designing a
system, the ability of this system to continue to function
in the event of a failure is also an important. In order to
design a system that has as high a productivity as
possible, the system must be modeled and productivity
must be analyzed in each possible state. A state is
defined as the functional system that remains in the
event of failure. Modeling the productivity of a system
in each state requires two aspects: a method to model
the productivity of a system given the system
parameters, and a Markov, or state-transition, model of
the initial system. In this paper the productivity is
defined as the number of hours a particular payload is
operated. The Markov model analyzes transition rates
from one state to another. It assumes that the probability
of being in the initial state at the beginning of the
simulation is one, and that the system transitions from
one state to another at rates equal to the failure rate of
the subsystems. If the probability of being in each state
throughout time is known, and since the productivity in
each state can be modeled, a total estimated
productivity in the event of failures can be calculated
and used in comparisons between architectures. The
comparison of curves of productivity over time between
different architectures, for fixed reliability values, can
also help demonstrate the advantages of fractionated
systems with redundancy. Another option would be to
vary the component reliability to achieve the same
productivity as the monolithic. In that case, reliability is
traded for redundancy.
The productivity of a fleet of rovers can be defined
as the number of hours each piece of payload is
operating. This means that the system becomes
degraded when a particular value delivery function is
lost. The loss of ability of the system to provide a
particular value delivery function ‘X’ can be due to any
combination of the following events:
- Loss of the payload providing ‘X’ in the system
- Loss of communication on a vehicle providing the
‘X’ function
- Loss of mobility of a vehicle providing the ‘X’
function (only if mobility is required for that
function to be performed)
- Loss of power on a vehicle providing the ‘X’
function
- Total loss of long-range communication of the
system
In a Markov model, the possible states of the system
and the rate at which the system transitions from one
state to another is defined using a state-transition
matrix, also called the A matrix. Each state is defined by
the number of different value delivery functions that are
operational. The state of the system changes whenever a
12-A3.3A.9 Page 5 of 12
combination of the abovementioned failures causes the
system not to be able to provide a given value-delivery
function at all. If P is defined as the vector of
probabilities of being in each state of the system at any
time, the definition of the A matrix is given in Eq. 2.
𝑑𝑃(𝑡)
𝑑𝑡= 𝐴𝑃(𝑡)
[2]
The state-transition matrix is essential in calculating
the probability of being in each state of the system. It
can be built automatically for each architecture in order
to rapidly explore the tradespace.16
The state-transition
matrix is not only dependent on how many functions
exist within the system, but also on how they are
distributed across the system. For given levels of
reliability, this metric thus enables the comparison of
architectures to each other.
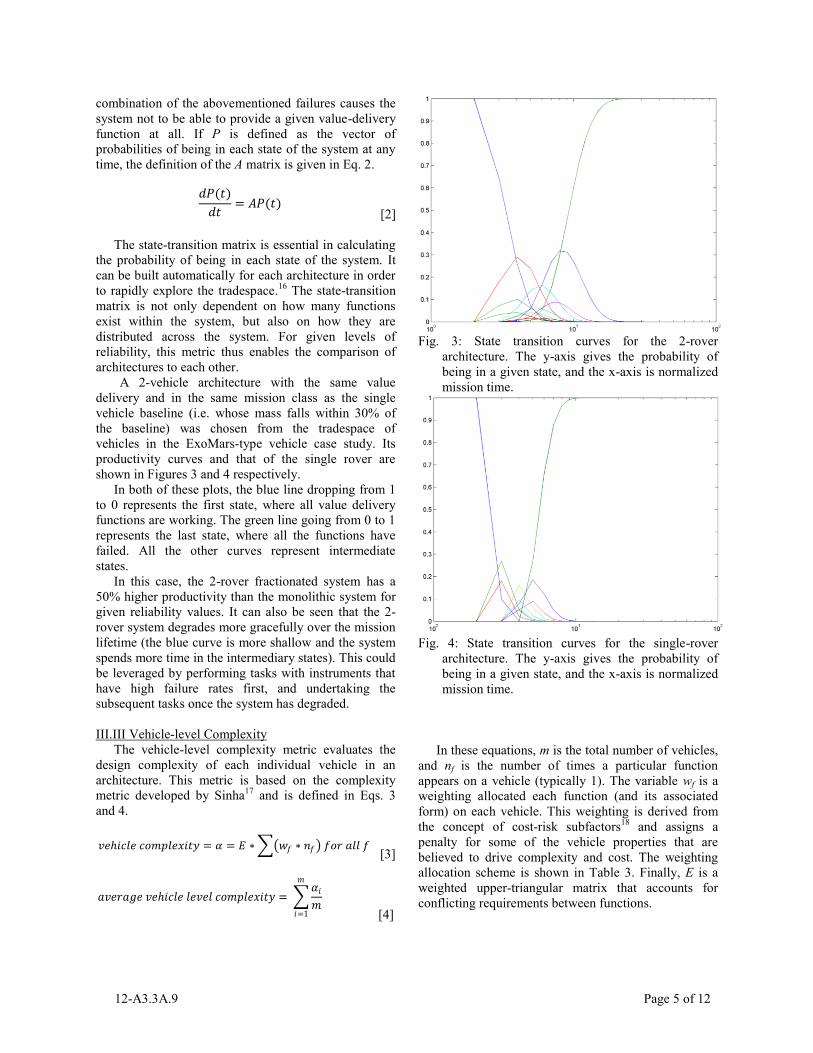
A 2-vehicle architecture with the same value
delivery and in the same mission class as the single
vehicle baseline (i.e. whose mass falls within 30% of
the baseline) was chosen from the tradespace of
vehicles in the ExoMars-type vehicle case study. Its
productivity curves and that of the single rover are
shown in Figures 3 and 4 respectively.
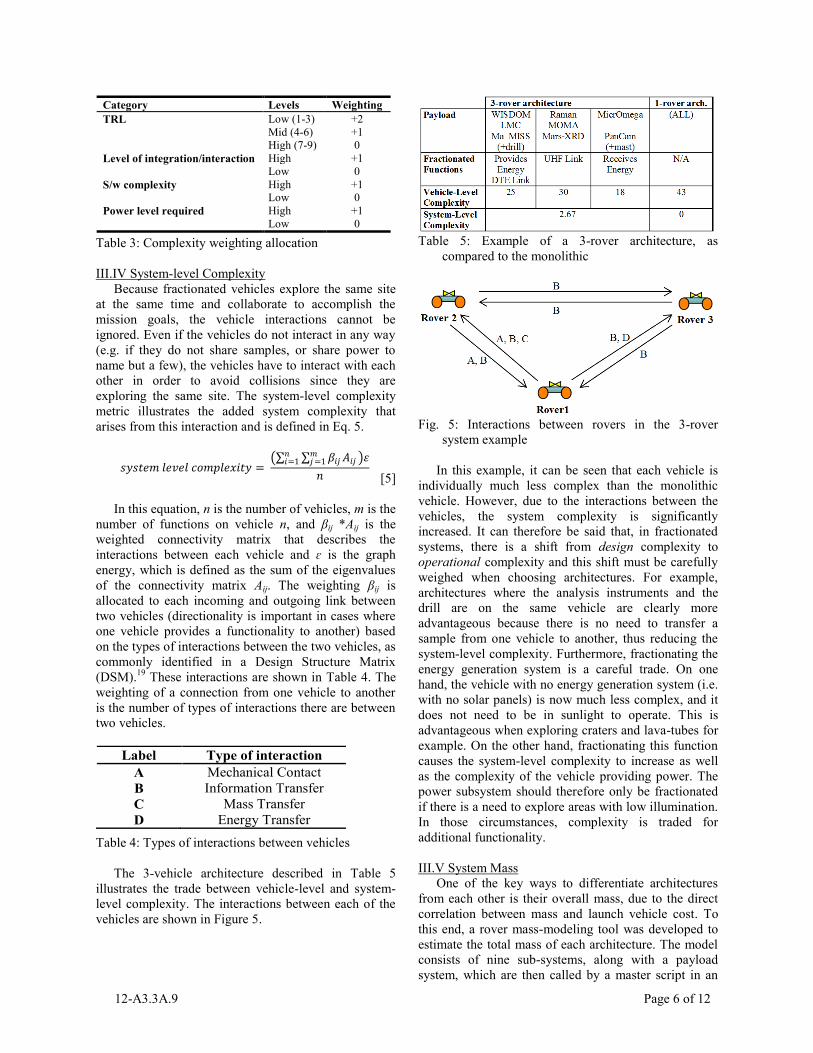
In both of these plots, the blue line dropping from 1
to 0 represents the first state, where all value delivery
functions are working. The green line going from 0 to 1
represents the last state, where all the functions have
failed. All the other curves represent intermediate
states.
In this case, the 2-rover fractionated system has a
50% higher productivity than the monolithic system for
given reliability values. It can also be seen that the 2-
rover system degrades more gracefully over the mission
lifetime (the blue curve is more shallow and the system
spends more time in the intermediary states). This could
be leveraged by performing tasks with instruments that
have high failure rates first, and undertaking the
subsequent tasks once the system has degraded.
III.III Vehicle-level Complexity
The vehicle-level complexity metric evaluates the
design complexity of each individual vehicle in an
architecture. This metric is based on the complexity
metric developed by Sinha17
and is defined in Eqs. 3
and 4.
𝑣𝑒ℎ𝑖𝑐𝑙𝑒 𝑐𝑜𝑚𝑝𝑙𝑒𝑥𝑖𝑡𝑦 = 𝛼 = 𝐸 ∗ 𝑤𝑓 ∗ 𝑛𝑓 𝑓𝑜𝑟 𝑎𝑙𝑙 𝑓 [3]
𝑎𝑣𝑒𝑟𝑎𝑔𝑒 𝑣𝑒ℎ𝑖𝑐𝑙𝑒 𝑙𝑒𝑣𝑒𝑙 𝑐𝑜𝑚𝑝𝑙𝑒𝑥𝑖𝑡𝑦 = 𝛼𝑖𝑚
𝑚
𝑖=1
[4]
Fig. 3: State transition curves for the 2-rover
architecture. The y-axis gives the probability of
being in a given state, and the x-axis is normalized
mission time.
Fig. 4: State transition curves for the single-rover
architecture. The y-axis gives the probability of
being in a given state, and the x-axis is normalized
mission time.
In these equations, m is the total number of vehicles,
and nf is the number of times a particular function
appears on a vehicle (typically 1). The variable wf is a
weighting allocated each function (and its associated
form) on each vehicle. This weighting is derived from
the concept of cost-risk subfactors18
and assigns a
penalty for some of the vehicle properties that are
believed to drive complexity and cost. The weighting
allocation scheme is shown in Table 3. Finally, E is a
weighted upper-triangular matrix that accounts for
conflicting requirements between functions.
12-A3.3A.9 Page 6 of 12
Category Levels Weighting
TRL Level Low (1-3) +2
Mid (4-6) +1
High (7-9) 0
Level of integration/interaction High +1
Low 0
S/w complexity High +1
Low 0
Power level required High +1
Low 0
Table 3: Complexity weighting allocation
III.IV System-level Complexity
Because fractionated vehicles explore the same site
at the same time and collaborate to accomplish the
mission goals, the vehicle interactions cannot be
ignored. Even if the vehicles do not interact in any way
(e.g. if they do not share samples, or share power to
name but a few), the vehicles have to interact with each
other in order to avoid collisions since they are
exploring the same site. The system-level complexity
metric illustrates the added system complexity that
arises from this interaction and is defined in Eq. 5.
𝑠𝑦𝑠𝑡𝑒𝑚 𝑙𝑒𝑣𝑒𝑙 𝑐𝑜𝑚𝑝𝑙𝑒𝑥𝑖𝑡𝑦 = 𝛽𝑖𝑗𝐴𝑖𝑗
𝑚𝑗=1
𝑛𝑖=1 𝜀
𝑛 [5]
In this equation, n is the number of vehicles, m is the
number of functions on vehicle n, and βij *Aij is the
weighted connectivity matrix that describes the
interactions between each vehicle and ɛ is the graph
energy, which is defined as the sum of the eigenvalues
of the connectivity matrix Aij. The weighting βij is
allocated to each incoming and outgoing link between
two vehicles (directionality is important in cases where
one vehicle provides a functionality to another) based
on the types of interactions between the two vehicles, as
commonly identified in a Design Structure Matrix
(DSM).19
These interactions are shown in Table 4. The
weighting of a connection from one vehicle to another
is the number of types of interactions there are between
two vehicles.
Label Type of interaction
A Mechanical Contact
B Information Transfer
C Mass Transfer
D Energy Transfer
Table 4: Types of interactions between vehicles
The 3-vehicle architecture described in Table 5
illustrates the trade between vehicle-level and system-
level complexity. The interactions between each of the
vehicles are shown in Figure 5.
Table 5: Example of a 3-rover architecture, as
compared to the monolithic
Fig. 5: Interactions between rovers in the 3-rover
system example
In this example, it can be seen that each vehicle is
individually much less complex than the monolithic
vehicle. However, due to the interactions between the
vehicles, the system complexity is significantly
increased. It can therefore be said that, in fractionated
systems, there is a shift from design complexity to
operational complexity and this shift must be carefully
weighed when choosing architectures. For example,
architectures where the analysis instruments and the
drill are on the same vehicle are clearly more
advantageous because there is no need to transfer a
sample from one vehicle to another, thus reducing the
system-level complexity. Furthermore, fractionating the
energy generation system is a careful trade. On one
hand, the vehicle with no energy generation system (i.e.
with no solar panels) is now much less complex, and it
does not need to be in sunlight to operate. This is
advantageous when exploring craters and lava-tubes for
example. On the other hand, fractionating this function
causes the system-level complexity to increase as well
as the complexity of the vehicle providing power. The
power subsystem should therefore only be fractionated
if there is a need to explore areas with low illumination.
In those circumstances, complexity is traded for
additional functionality.
III.V System Mass
One of the key ways to differentiate architectures
from each other is their overall mass, due to the direct
correlation between mass and launch vehicle cost. To
this end, a rover mass-modeling tool was developed to
estimate the total mass of each architecture. The model
consists of nine sub-systems, along with a payload
system, which are then called by a master script in an

12-A3.3A.9 Page 7 of 12
iterative manner to obtain a model which meets the
input requirements. The interactions between the
subsystems in the modeling tool are shown in Table 6
and its inputs and outputs are detailed in Table 7.
Table 6: Connection between each subsystem
Input Output
No of Sortie Days Navigation System Mass
Planet Comm System Mass
Bandwidth Comm System Power
Data Rate Needed Structure Mass
No of Wheels Wheel size & mass
Chassis Material Thermal System Mass
Sinkage Wheel Load
% time spent on slope Sprung Mass
Max slope angle Steering Mass
Wheel Slip Turning Radius
Drive Type Level Power
Motor Type Slope Power
Power Source Power Mass
Payload Mass Solar Array Size
Payload Power Total Power
Table 7: Inputs and outputs to the rover modeling tool
Details of the modeling tool can be found in Ref. 20
and a brief overview of the modeling assumptions for
each subsystem is shown in Table 8. The modeling tool
was validated against existing rover designs and was
found to have estimates within 10% of the actual
masses of these rovers.
Since the evaluation of the architecture space occurs
in the early stages of the design process, the system
mass is used to categorize the architecture. Any
architecture having a mass within ±30% of the mass of
the monolithic vehicle is assumed to be part of the same
class of architectures (30% is a standard margin in Pre-
Phase A design). The assumption is that systems of the
same class can be launched on the same launch vehicle
and can be landed with the same Entry Descent and
Landing (EDL) system. Architectures of the same class
can therefore directly be traded against each other. The
rest of the architecture tradespace can also be divided
up into classes, in order to evaluate the potential science
return per dollar.15
Sub-System Assumption
Payload Mass, power and duty cycle for all instruments
given as an input by the user
Communications Mass and power calculated using the link
budget equation and mass correlations11
Chassis Modeled as a simple ladder frame
Thermal Thermal balance equation evaluated, heat is
rejected using radiations and is input using
radioisotope heater units (RHU)
Wheels The diameter and width of the wheels are
sized for a specified sinkage and soil bearing
pressure
Steering Assumes Ackerman steering (models the mass
of a steering motor required for each set of
wheels that are steerable), a steer-by-wire
system, and some additional mass for
mechanisms.
Terrain Terrain properties are used to measure the
driving resistances
Drive Resistances are used to measure torque and
motor power
Power Power of other subsystems are used to
measure energy requirements and size the
power system
Suspension Assumed to be 12% of the rover mass, from
historical data12
Table 8: Overview of the assumptions used for the
design of each sub-system
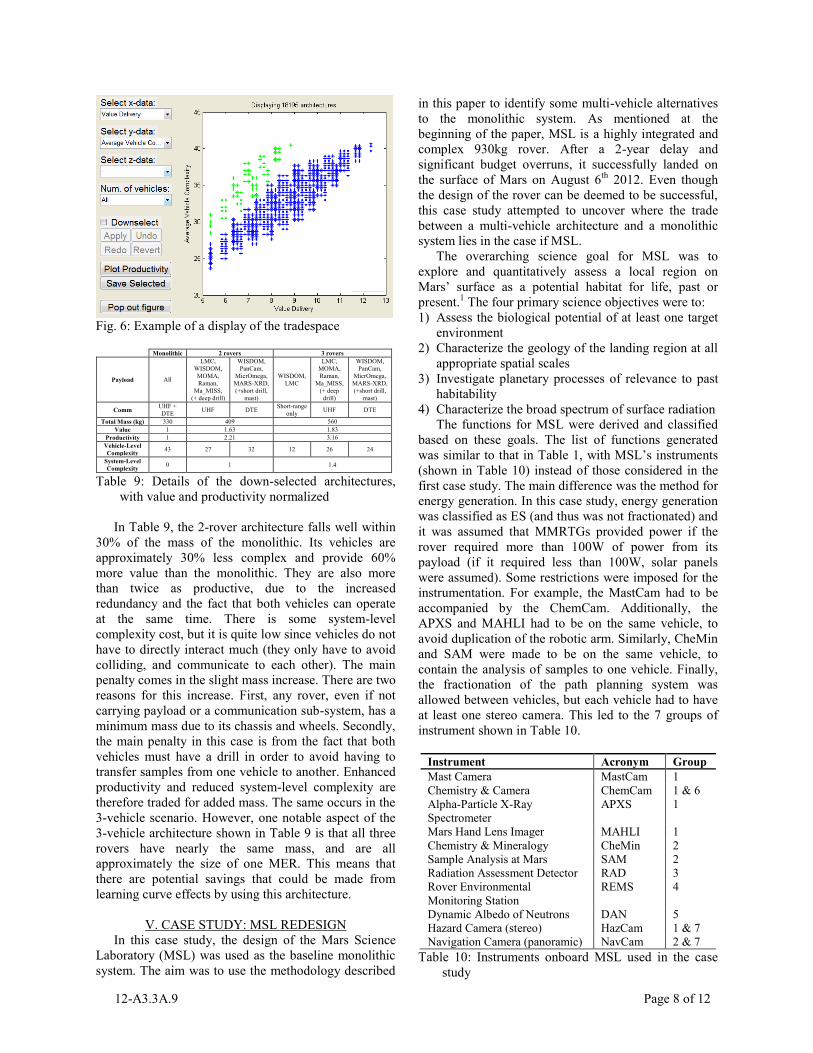
IV. TRADESPACE EXPLORATION
Once the architectures have been generated and the
metrics described in Section III have been calculated,
the architecture space must be visualized in order to
allow the user to iteratively explore the tradespace and
to choose interesting architectures for further study. A
software tool was developed to accomplish this. The
user simply has to: input the monolithic vehicle’s
payload, functionality and the associated weightings;
identify the SS functions; and decide on the maximum
and minimum number of vehicles. The tool then
generates the tradespace of possible architectures and
calculates the aforementioned metrics for each
architecture. The results are displayed on an interactive
screen, as shown in Figure 6 using the ExoMars-type
rover tradespace described thus far as an example. On
this screen, any metric can be plotted against any other.
The user can downsize the space using the down-
selection option. This allows the user to interactively
explore the tradespace. Once the final few architectures
have been chosen, the tool can display the composition
and the productivity plots for each of the final
architectures (examples of which are given in Figures 3
and 4). Two of the most interesting architectures, along
with the monolithic architecture, from this example
tradespace are shown in Table 9.
12-A3.3A.9 Page 8 of 12
Fig. 6: Example of a display of the tradespace
Monolithic 2 rovers 3 rovers
Payload All
LMC,
WISDOM,
MOMA,
Raman,
Ma_MISS,
(+ deep drill)
WISDOM,
PanCam,
MicrOmega,
MARS-XRD,
(+short drill,
mast)
WISDOM,
LMC
LMC,
MOMA,
Raman,
Ma_MISS,
(+ deep
drill)
WISDOM,
PanCam,
MicrOmega,
MARS-XRD,
(+short drill,
mast)
Comm UHF +
DTE UHF DTE
Short-range
only UHF DTE
Total Mass (kg) 330 409 560
Value 1 1.63 1.83
Productivity 1 2.21 3.16
Vehicle-Level
Complexity 43 27 32 12 26 24
System-Level
Complexity 0 1 1.4
Table 9: Details of the down-selected architectures,
with value and productivity normalized
In Table 9, the 2-rover architecture falls well within
30% of the mass of the monolithic. Its vehicles are
approximately 30% less complex and provide 60%
more value than the monolithic. They are also more
than twice as productive, due to the increased
redundancy and the fact that both vehicles can operate
at the same time. There is some system-level
complexity cost, but it is quite low since vehicles do not
have to directly interact much (they only have to avoid
colliding, and communicate to each other). The main
penalty comes in the slight mass increase. There are two
reasons for this increase. First, any rover, even if not
carrying payload or a communication sub-system, has a
minimum mass due to its chassis and wheels. Secondly,
the main penalty in this case is from the fact that both
vehicles must have a drill in order to avoid having to
transfer samples from one vehicle to another. Enhanced
productivity and reduced system-level complexity are
therefore traded for added mass. The same occurs in the
3-vehicle scenario. However, one notable aspect of the
3-vehicle architecture shown in Table 9 is that all three
rovers have nearly the same mass, and are all
approximately the size of one MER. This means that
there are potential savings that could be made from
learning curve effects by using this architecture.
V. CASE STUDY: MSL REDESIGN
In this case study, the design of the Mars Science
Laboratory (MSL) was used as the baseline monolithic
system. The aim was to use the methodology described
in this paper to identify some multi-vehicle alternatives
to the monolithic system. As mentioned at the
beginning of the paper, MSL is a highly integrated and
complex 930kg rover. After a 2-year delay and
significant budget overruns, it successfully landed on
the surface of Mars on August 6th
2012. Even though
the design of the rover can be deemed to be successful,
this case study attempted to uncover where the trade
between a multi-vehicle architecture and a monolithic
system lies in the case if MSL.
The overarching science goal for MSL was to
explore and quantitatively assess a local region on
Mars’ surface as a potential habitat for life, past or
present.1 The four primary science objectives were to:
1) Assess the biological potential of at least one target
environment
2) Characterize the geology of the landing region at all
appropriate spatial scales
3) Investigate planetary processes of relevance to past
habitability
4) Characterize the broad spectrum of surface radiation
The functions for MSL were derived and classified
based on these goals. The list of functions generated
was similar to that in Table 1, with MSL’s instruments
(shown in Table 10) instead of those considered in the
first case study. The main difference was the method for
energy generation. In this case study, energy generation
was classified as ES (and thus was not fractionated) and
it was assumed that MMRTGs provided power if the
rover required more than 100W of power from its
payload (if it required less than 100W, solar panels
were assumed). Some restrictions were imposed for the
instrumentation. For example, the MastCam had to be
accompanied by the ChemCam. Additionally, the
APXS and MAHLI had to be on the same vehicle, to
avoid duplication of the robotic arm. Similarly, CheMin
and SAM were made to be on the same vehicle, to
contain the analysis of samples to one vehicle. Finally,
the fractionation of the path planning system was
allowed between vehicles, but each vehicle had to have
at least one stereo camera. This led to the 7 groups of
instrument shown in Table 10.
Instrument Acronym Group
Mast Camera MastCam 1
Chemistry & Camera ChemCam 1 & 6
Alpha-Particle X-Ray
Spectrometer
APXS 1
Mars Hand Lens Imager MAHLI 1
Chemistry & Mineralogy CheMin 2
Sample Analysis at Mars SAM 2
Radiation Assessment Detector RAD 3
Rover Environmental
Monitoring Station
REMS 4
Dynamic Albedo of Neutrons DAN 5
Hazard Camera (stereo) HazCam 1 & 7
Navigation Camera (panoramic) NavCam 2 & 7
Table 10: Instruments onboard MSL used in the case
study
12-A3.3A.9 Page 9 of 12
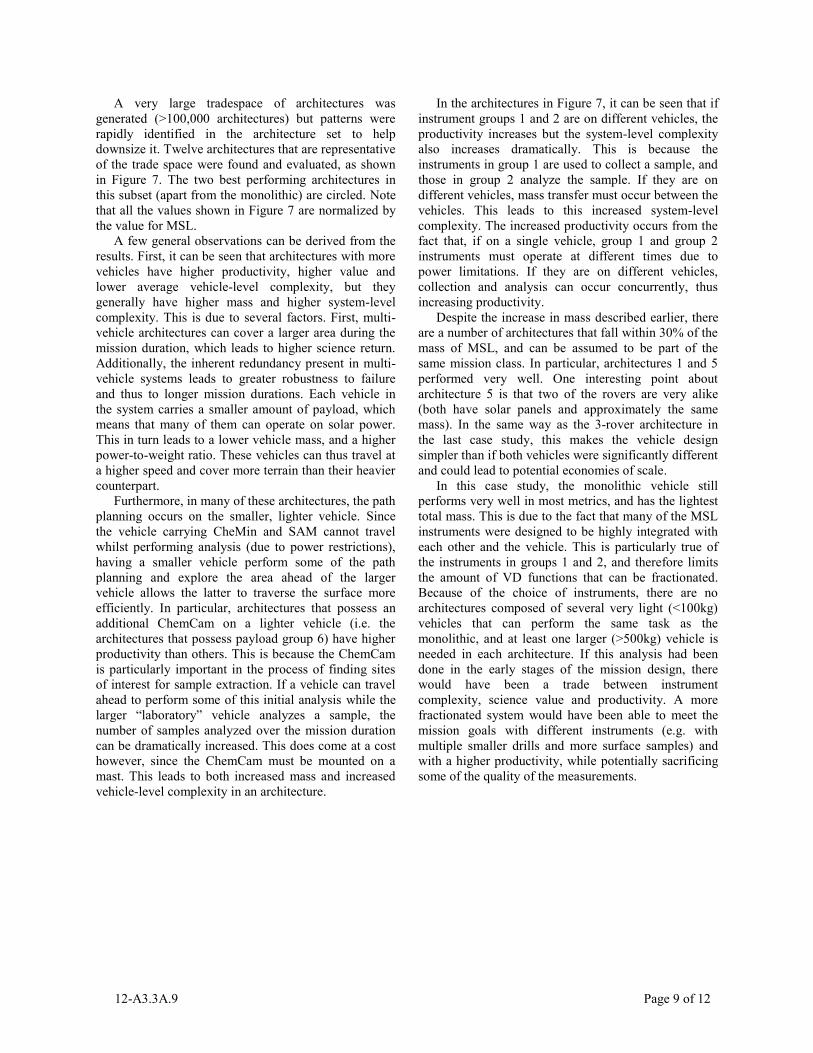
A very large tradespace of architectures was
generated (>100,000 architectures) but patterns were
rapidly identified in the architecture set to help
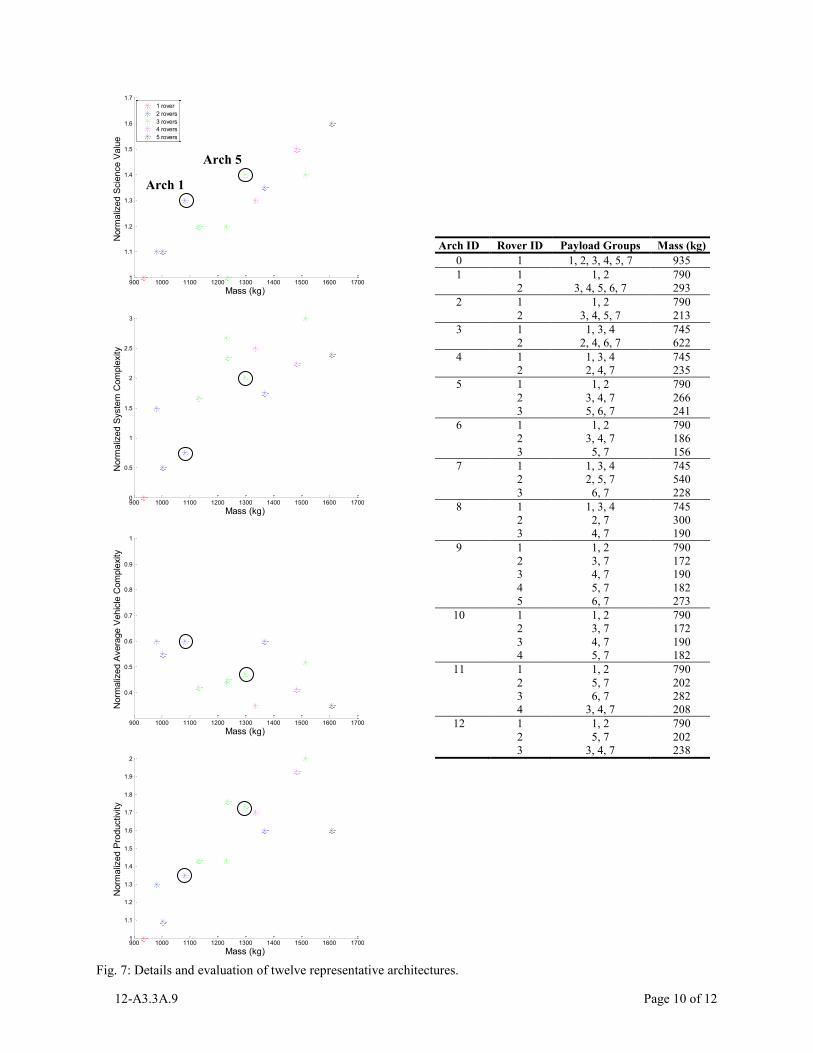
downsize it. Twelve architectures that are representative
of the trade space were found and evaluated, as shown
in Figure 7. The two best performing architectures in
this subset (apart from the monolithic) are circled. Note
that all the values shown in Figure 7 are normalized by
the value for MSL.
A few general observations can be derived from the
results. First, it can be seen that architectures with more
vehicles have higher productivity, higher value and
lower average vehicle-level complexity, but they
generally have higher mass and higher system-level
complexity. This is due to several factors. First, multi-
vehicle architectures can cover a larger area during the
mission duration, which leads to higher science return.
Additionally, the inherent redundancy present in multi-
vehicle systems leads to greater robustness to failure
and thus to longer mission durations. Each vehicle in
the system carries a smaller amount of payload, which
means that many of them can operate on solar power.
This in turn leads to a lower vehicle mass, and a higher
power-to-weight ratio. These vehicles can thus travel at
a higher speed and cover more terrain than their heavier
counterpart.
Furthermore, in many of these architectures, the path
planning occurs on the smaller, lighter vehicle. Since
the vehicle carrying CheMin and SAM cannot travel
whilst performing analysis (due to power restrictions),
having a smaller vehicle perform some of the path
planning and explore the area ahead of the larger
vehicle allows the latter to traverse the surface more
efficiently. In particular, architectures that possess an
additional ChemCam on a lighter vehicle (i.e. the
architectures that possess payload group 6) have higher
productivity than others. This is because the ChemCam
is particularly important in the process of finding sites
of interest for sample extraction. If a vehicle can travel
ahead to perform some of this initial analysis while the
larger “laboratory” vehicle analyzes a sample, the
number of samples analyzed over the mission duration
can be dramatically increased. This does come at a cost
however, since the ChemCam must be mounted on a
mast. This leads to both increased mass and increased
vehicle-level complexity in an architecture.
In the architectures in Figure 7, it can be seen that if
instrument groups 1 and 2 are on different vehicles, the
productivity increases but the system-level complexity
also increases dramatically. This is because the
instruments in group 1 are used to collect a sample, and
those in group 2 analyze the sample. If they are on
different vehicles, mass transfer must occur between the
vehicles. This leads to this increased system-level
complexity. The increased productivity occurs from the
fact that, if on a single vehicle, group 1 and group 2
instruments must operate at different times due to
power limitations. If they are on different vehicles,
collection and analysis can occur concurrently, thus
increasing productivity.
Despite the increase in mass described earlier, there
are a number of architectures that fall within 30% of the
mass of MSL, and can be assumed to be part of the
same mission class. In particular, architectures 1 and 5
performed very well. One interesting point about
architecture 5 is that two of the rovers are very alike
(both have solar panels and approximately the same
mass). In the same way as the 3-rover architecture in
the last case study, this makes the vehicle design
simpler than if both vehicles were significantly different
and could lead to potential economies of scale.
In this case study, the monolithic vehicle still
performs very well in most metrics, and has the lightest
total mass. This is due to the fact that many of the MSL
instruments were designed to be highly integrated with
each other and the vehicle. This is particularly true of
the instruments in groups 1 and 2, and therefore limits
the amount of VD functions that can be fractionated.
Because of the choice of instruments, there are no
architectures composed of several very light (<100kg)
vehicles that can perform the same task as the
monolithic, and at least one larger (>500kg) vehicle is
needed in each architecture. If this analysis had been
done in the early stages of the mission design, there
would have been a trade between instrument
complexity, science value and productivity. A more
fractionated system would have been able to meet the
mission goals with different instruments (e.g. with
multiple smaller drills and more surface samples) and
with a higher productivity, while potentially sacrificing
some of the quality of the measurements.
12-A3.3A.9 Page 10 of 12
900 1000 1100 1200 1300 1400 1500 1600 17001
1.1
1.2
1.3
1.4
1.5
1.6
1.7
Mass (kg)
Norm
aliz
ed S
cie
nce V
alu
e
1 rover
2 rovers
3 rovers
4 rovers
5 rovers
900 1000 1100 1200 1300 1400 1500 1600 17000
0.5
1
1.5
2
2.5
3
Mass (kg)
Norm
aliz
ed S
yste
m C
om
ple
xity
900 1000 1100 1200 1300 1400 1500 1600 1700
0.4
0.5
0.6
0.7
0.8
0.9
1
Mass (kg)
Norm
aliz
ed A
vera
ge V
ehic
le C
om
ple
xity
900 1000 1100 1200 1300 1400 1500 1600 17001
1.1
1.2
1.3
1.4
1.5
1.6
1.7
1.8
1.9
2
Mass (kg)
Norm
aliz
ed P
roductivity
Fig. 7: Details and evaluation of twelve representative architectures.
Arch 1
Arch 5
Arch ID Rover ID Payload Groups Mass (kg)
0 1 1, 2, 3, 4, 5, 7 935
1 1 1, 2 790
2 3, 4, 5, 6, 7 293
2 1 1, 2 790
2 3, 4, 5, 7 213
3 1 1, 3, 4 745
2 2, 4, 6, 7 622
4 1 1, 3, 4 745
2 2, 4, 7 235
5 1 1, 2 790
2 3, 4, 7 266
3 5, 6, 7 241
6 1 1, 2 790
2 3, 4, 7 186
3 5, 7 156
7 1 1, 3, 4 745
2 2, 5, 7 540
3 6, 7 228
8 1 1, 3, 4 745
2 2, 7 300
3 4, 7 190
9 1 1, 2 790
2 3, 7 172
3 4, 7 190
4 5, 7 182
5 6, 7 273
10 1 1, 2 790
2 3, 7 172
3 4, 7 190
4 5, 7 182
11 1 1, 2 790
2 5, 7 202
3 6, 7 282
4 3, 4, 7 208
12 1 1, 2 790
2 5, 7 202
3 3, 4, 7 238
12-A3.3A.9 Page 11 of 12
VI. OPPORTUNITIES AND LIMITATIONS OF
MULTI-VEHICLE SYSTEMS
Through the case studies presented in this paper, and
others undertaken by the authors, a more general
understanding of the opportunities and limitations that
arise from fractionating planetary surface vehicles has
been achieved. These patterns are presented in this
section.
First and foremost, multi-vehicle architectures have
been found to be valuable in missions with conflicting
science goals.15
Having different vehicles to deal with
each of the mission goals leads to reduced vehicle-level
complexity and increased productivity, since different
goals can be addressed at the same time.
Moreover, fractionated multi-vehicle systems can
make use of a number of emergent properties that have
not yet been discussed in this paper. For example, the
rover-to-rover communication systems could be used
for navigation and triangulation or, if a rover was to get
stuck, another could be used to try to tow it.
Additionally, the inherent redundancy in these systems
can lead to higher productivity. Alternatively, the same
productivity as that of the monolithic system could be
achieved with less reliable sub-systems. This could in
turn lead to reduced costs. A multi-vehicle system leads
to lower mission risk: if one vehicle fails, some of the
mission goals can still be achieved. A high risk
component can also easily be added to a fractionated
system without risking the achievement of the main
science goals. For example, small “micro-rovers” could
be added to these systems to increase ground coverage
at a very low cost21
or one of the rovers as part of a
suite could be used to explore a more dangerous terrain
without risking the whole mission.
Fractionated systems are also more upgradeable and
fit better within a “campaign” approach to planetary
surface exploration: new vehicles can be sent to the
surface to enhance an existing system, or can make use
of some of the pre-deployed functionality. The tool
described in this paper can easily be adapted to deal
with this kind of scenario.15
Having multiple moving assets on the surface of a
planet leads to more ground being covered, although
this could also lead to increased operations costs
depending on how the vehicles are commanded.
Furthermore, fractionating certain functions can allow
for a more efficient exploration of treacherous
environments.22
For example, fractionating the energy
generating function (via solar panels) can enable the
exploration of craters or lava-tube: a vehicle without an
energy generation system could undertake the
exploration of low illumination areas, while another
traverses in an illuminated area to generate enough
energy for both vehicles.
Finally, architectures with several similar vehicles,
such as the 3-vehicle architecture presented in the
ExoMars-type rover case study and architecture 5 in the
MSL case study, could make use of learning curve
effects, or of previous designs such as MER, to reduce
design and development costs.
On the other hand, fractionated systems also have
their limitations. Operating a multi-vehicle systems
would require a change in the way operations are
currently undertaken and an increase in the levels of
autonomy onboard the vehicles. In turn, this would lead
to increased testing time and cost. In general,
fractionated systems also increase the overall mass of
the system due to the inherent mass associated with the
chassis and wheels of a rover. Since the rovers in
fractionated systems are most often simpler than the
monolithic, it is not clear whether this increased mass
would affect the design and build cost of the systems.
Finally, depending on the science goals, fractionated
systems are not always advantageous. For example,
when the goals are closely knit and the science package
is highly integrated, as was the case for MSL, the
potential benefits of fractionated systems become
somewhat limited because separating payload can lead
to the duplication of more complex assets such as drills
and masts to avoid excessive interactions between
vehicles.
VII. CONCLUSION
This paper has presented a methodology for the
generation of fractionated multi-vehicle systems for
planetary surface exploration. A set of metrics was
presented to evaluate these architectures and help
identify interesting architectures for more detailed
evaluation. Two redesigns of existing rover concepts
were undertaken to demonstrate the potential of the
methodology. However, the methodology is designed
for use in early mission design, before the
instrumentation has been packaged, to demonstrate
opportunities and trades involved in multi-mission
architectures. Undertaking this analysis early on in the
design process may even help design instrument
packages that lend themselves better to fractionation or
it may help trade different instruments against each
other. Overall, fractionation was found to be
particularly advantageous for missions with ambitious
and/or conflicting science goals, in risky environments
or when productivity and evolvability are important.
ACKNOWLEDGEMENTS
This work was funded under a NASA Phase II
STTR, contract NNX10CB56C.

12-A3.3A.9 Page 12 of 12
REFERENCES
1Jet Propulsion Laboratory, “MSL Science Corner”, Mars Science Laboratory: Curiosity Rover, Website URL: http://msl-
scicorner.jpl.nasa.gov/index.cfm, 2012. 2Jet Propulsion Laboratory, “Mars Exploration Rovers”, Website URL: http://marsrovers.jpl.nasa.gov/home /index.cfm,
2012. 3Jet Propulsion Laboratory, “Mars Pathfinder”, Website URL: http://mars.jpl.nasa.gov/MPF/index1.html, 1999. 4Brown, O.C., Eremenko, P., Collopy, P. D., “Value-Centric Design Methodologies for Fractionated Spacecraft: Progress
Summary from Phase 1 of the DARPA System F6 Program,” AIAA SPACE Conference Proceedings, Pasadena, California 2009. 5O’Neill, M. G., Yue, H., Nag, S, Grogan, P., and de Weck, O. L., “Comparing and Optimizing the DARPA System F6
Program Value-Centric Design Methodologies,” AIAA Paper 2010-8828, AIAA SPACE Conference Proceedings, Anaheim,
California, 2010. 6Burgard, W., Moors, M., Fox, D., Simmons, R., and Thrun, S., “Collaborative Multi-Robot Exploration,” Proceedings of the
2000 IEEE International Conference on Robotics & Automation, San Francisco, CA, 2000. 7 Estlin, T., Yen, J., Petras, R., Mutz, D., Castaño, R., Rabideau, G., “An Integrated Architecture for Cooperating Rovers,”
Proceedings of the 5th International Symposium of Artificial Intelligence, Robotics and Automation in Space, ISAIRAS,
Noordwijk, Netherlands, 1999. 8Chien, S., Barrett, A., Estlin, T. & Rabideau, G., “A Comparison of Coordinated Planning Methods for Cooperating
Rovers,” ACM 2000 1-58113-230-1/00/6, Barcelona, Spain, 2000. 9Wilcox, B. H., “Snow White and the 700 Dwarves,” A Cooperative Robotic System, White Paper, Jet Propulsion
Laboratory, 2002. 10 Sujan, V. A., Dubowsky, S., Huntsberger, T., Aghazarian, H., Cheng, Y., and Schenker, P., “An Architecture for
Distributed Environment Sensing with Application to Robotic Cliff Exploration, ” Autonomous Robots, Vol. 16, pp. 287-311,
2004. 11Lamamy, J.-A., “Methods and Tools for the Formulation, Evaluation and Optimization of Rover Mission Concepts,” PhD
Thesis, Dept. of Aeronautics and Astronautics, Massachusetts Institute of Technology, 2004. 12MEPAG 2-Rover International Science Analysis Group (2R-iSAG), “Two Rovers to the Same Site on Mars, 2018:
Possibilities for Cooperative Science,” Astrobiology, Volume 10, Number 7, DOI: 10.1089, 2010. 13European Space Agency, “Robotic Exploration of Mars,” Website URL: http://exploration.esa.int/science-
e/www/area/index.cfm?fareaid=118, 2012. 14Dori, D., “Object-Process Methodology,” Springer, ISBN: 978-3540654711, 2002. 15Alibay, F., and Hoffman, J. A., “Trade Space Evaluation of Multi-Mission Architectures for the Exploration of Europa,”
Proceedings of the IEEE Aerospace Conference, 2013 (to be published). 16Wertz, J., “Reliability and Productivity Modeling for the Optimization of Separated Spacecraft Interferometers,” M.S.
Thesis, Dept. of Aeronautics and Astronautics, Massachusetts Institute of Technology, 2005. 17Sinha, K., de Weck, O. L., “Structural Complexity Metric for Engineered Complex Systems and its Application,”
Proceedings of the 14th International Design Structure Matrix (DSM) Conference, 2012. 18Leising, C. J., Sherwood, B., Alder, M., Wessen R. R., and Naderi, F. M., “Recent Improvements in JPL’s Mission
Formulation Process,” Proceedings of the IEEE Aerospace Conference, 2010. 19Steward, D. V., “The Design Structure System: A Method for Managing the Design of Complex Systems,” IEEE
Transactions on Engineering Management, 1981. 20 Alibay, F., Desaraju, V., Duda, J. and Hoffman, J.A, “Multi-Rover Exploration of Planetary Surfaces”, STTR Report,
Massachusetts Institute of Technology, Cambridge, MA, 2011 (unpublished). 21Alibay, F., and Cunio, P., “A New Form of Planetary Surface Mobility: Hoppers,” MicroRover Workshop, Brown
University, Providence, RI, 2012. 22Alibay, F., Desaraju, V., Cowlagi, R., Duda, J., “Multi-Vehicle Lunar Operations Simulation Using SEXTANT,”
Proceedings of the AIAA SPACE Conference, Pasadena, CA, 2012.