far plasma wake of titan from the rpws observations: a
TRANSCRIPT

HAL Id: hal-00153882https://hal.archives-ouvertes.fr/hal-00153882
Submitted on 10 Feb 2016
HAL is a multi-disciplinary open accessarchive for the deposit and dissemination of sci-entific research documents, whether they are pub-lished or not. The documents may come fromteaching and research institutions in France orabroad, or from public or private research centers.
L’archive ouverte pluridisciplinaire HAL, estdestinée au dépôt et à la diffusion de documentsscientifiques de niveau recherche, publiés ou non,émanant des établissements d’enseignement et derecherche français ou étrangers, des laboratoirespublics ou privés.
Far plasma wake of Titan from the RPWS observations:A case study.
Ronan Modolo, J.-E. Wahlund, R. Boström, P. Canu, W.S. Kurth, D.Gurnett, G.R. Lewis, A.J. Coates
To cite this version:Ronan Modolo, J.-E. Wahlund, R. Boström, P. Canu, W.S. Kurth, et al.. Far plasma wake of Titanfrom the RPWS observations: A case study.. Geophysical Research Letters, American GeophysicalUnion, 2007, 34 (24), pp.L24S04. �10.1029/2007GL030482�. �hal-00153882�
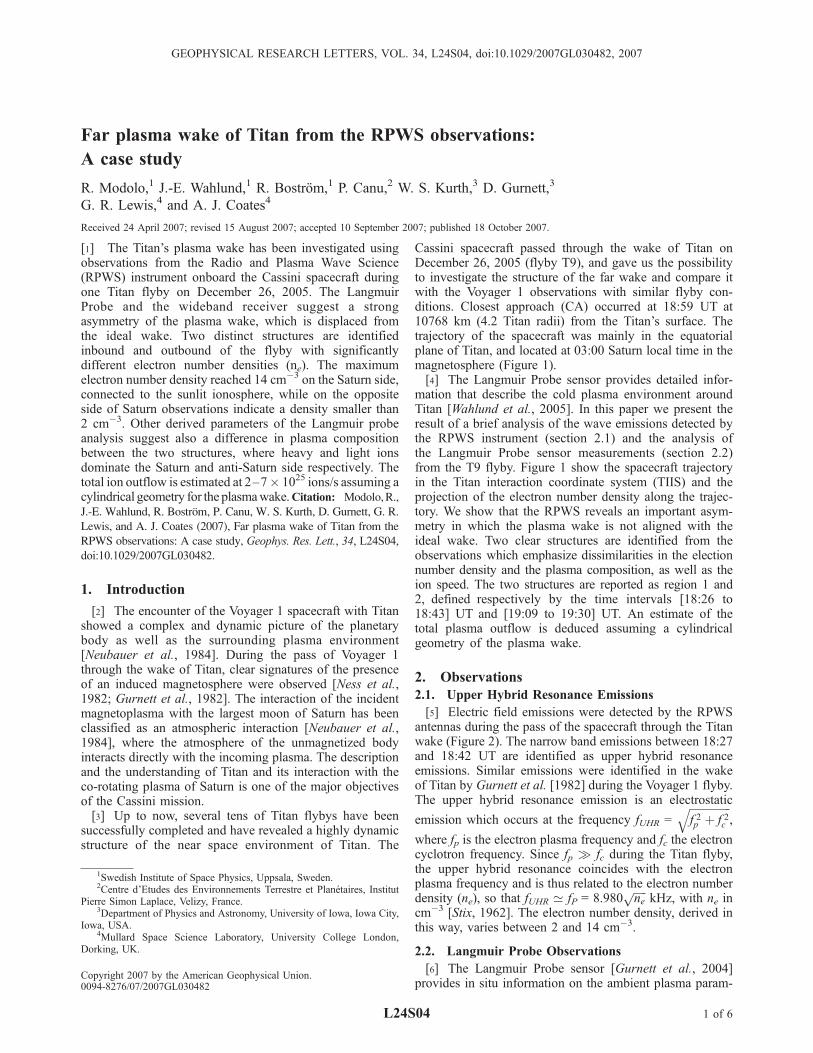
Far plasma wake of Titan from the RPWS observations:
A case study
R. Modolo,1 J.-E. Wahlund,1 R. Bostrom,1 P. Canu,2 W. S. Kurth,3 D. Gurnett,3
G. R. Lewis,4 and A. J. Coates4
Received 24 April 2007; revised 15 August 2007; accepted 10 September 2007; published 18 October 2007.
[1] The Titan’s plasma wake has been investigated usingobservations from the Radio and Plasma Wave Science(RPWS) instrument onboard the Cassini spacecraft duringone Titan flyby on December 26, 2005. The LangmuirProbe and the wideband receiver suggest a strongasymmetry of the plasma wake, which is displaced fromthe ideal wake. Two distinct structures are identifiedinbound and outbound of the flyby with significantlydifferent electron number densities (ne). The maximumelectron number density reached 14 cm�3 on the Saturn side,connected to the sunlit ionosphere, while on the oppositeside of Saturn observations indicate a density smaller than2 cm�3. Other derived parameters of the Langmuir probeanalysis suggest also a difference in plasma compositionbetween the two structures, where heavy and light ionsdominate the Saturn and anti-Saturn side respectively. Thetotal ion outflow is estimated at 2–7� 1025 ions/s assuming acylindrical geometry for the plasmawake.Citation: Modolo, R.,
J.-E. Wahlund, R. Bostrom, P. Canu, W. S. Kurth, D. Gurnett, G. R.
Lewis, and A. J. Coates (2007), Far plasma wake of Titan from the
RPWS observations: A case study, Geophys. Res. Lett., 34, L24S04,
doi:10.1029/2007GL030482.
1. Introduction
[2] The encounter of the Voyager 1 spacecraft with Titanshowed a complex and dynamic picture of the planetarybody as well as the surrounding plasma environment[Neubauer et al., 1984]. During the pass of Voyager 1through the wake of Titan, clear signatures of the presenceof an induced magnetosphere were observed [Ness et al.,1982; Gurnett et al., 1982]. The interaction of the incidentmagnetoplasma with the largest moon of Saturn has beenclassified as an atmospheric interaction [Neubauer et al.,1984], where the atmosphere of the unmagnetized bodyinteracts directly with the incoming plasma. The descriptionand the understanding of Titan and its interaction with theco-rotating plasma of Saturn is one of the major objectivesof the Cassini mission.[3] Up to now, several tens of Titan flybys have been
successfully completed and have revealed a highly dynamicstructure of the near space environment of Titan. The
Cassini spacecraft passed through the wake of Titan onDecember 26, 2005 (flyby T9), and gave us the possibilityto investigate the structure of the far wake and compare itwith the Voyager 1 observations with similar flyby con-ditions. Closest approach (CA) occurred at 18:59 UT at10768 km (4.2 Titan radii) from the Titan’s surface. Thetrajectory of the spacecraft was mainly in the equatorialplane of Titan, and located at 03:00 Saturn local time in themagnetosphere (Figure 1).[4] The Langmuir Probe sensor provides detailed infor-
mation that describe the cold plasma environment aroundTitan [Wahlund et al., 2005]. In this paper we present theresult of a brief analysis of the wave emissions detected bythe RPWS instrument (section 2.1) and the analysis ofthe Langmuir Probe sensor measurements (section 2.2)from the T9 flyby. Figure 1 show the spacecraft trajectoryin the Titan interaction coordinate system (TIIS) and theprojection of the electron number density along the trajec-tory. We show that the RPWS reveals an important asym-metry in which the plasma wake is not aligned with theideal wake. Two clear structures are identified from theobservations which emphasize dissimilarities in the electionnumber density and the plasma composition, as well as theion speed. The two structures are reported as region 1 and2, defined respectively by the time intervals [18:26 to18:43] UT and [19:09 to 19:30] UT. An estimate of thetotal plasma outflow is deduced assuming a cylindricalgeometry of the plasma wake.
2. Observations
2.1. Upper Hybrid Resonance Emissions
[5] Electric field emissions were detected by the RPWSantennas during the pass of the spacecraft through the Titanwake (Figure 2). The narrow band emissions between 18:27and 18:42 UT are identified as upper hybrid resonanceemissions. Similar emissions were identified in the wakeof Titan by Gurnett et al. [1982] during the Voyager 1 flyby.The upper hybrid resonance emission is an electrostatic
emission which occurs at the frequency fUHR =ffiffiffiffiffiffiffiffiffiffiffiffiffiffiffif 2p þ f 2c
q,
where fp is the electron plasma frequency and fc the electroncyclotron frequency. Since fp � fc during the Titan flyby,the upper hybrid resonance coincides with the electronplasma frequency and is thus related to the electron numberdensity (ne), so that fUHR ’ fP = 8.980
ffiffiffiffiffine
pkHz, with ne in
cm�3 [Stix, 1962]. The electron number density, derived inthis way, varies between 2 and 14 cm�3.
2.2. Langmuir Probe Observations
[6] The Langmuir Probe sensor [Gurnett et al., 2004]provides in situ information on the ambient plasma param-
GEOPHYSICAL RESEARCH LETTERS, VOL. 34, L24S04, doi:10.1029/2007GL030482, 2007
1Swedish Institute of Space Physics, Uppsala, Sweden.2Centre d’Etudes des Environnements Terrestre et Planetaires, Institut
Pierre Simon Laplace, Velizy, France.3Department of Physics and Astronomy, University of Iowa, Iowa City,
Iowa, USA.4Mullard Space Science Laboratory, University College London,
Dorking, UK.
Copyright 2007 by the American Geophysical Union.0094-8276/07/2007GL030482
L24S04 1 of 6

Figure 1. The T9 flyby trajectory in the Titan centered coordinate system (TIIS [cf Backes et al., 2005]). Tickmarks on thetrajectory are displayed every 5 minutes. The electron number density is projected along the trajectory of the spacecraft andemphasized the asymmetry of the plasma wake of Titan. The two blue lines indicate the time interval of the two mainstructures.
Figure 2. Plasma wave electric field intensity in the wake of Titan. Different waves have been detected and among themthe upper hybrid resonance emissions between 10 kHz and 32 kHz.
L24S04 MODOLO ET AL.: FAR PLASMA WAKE OF TITAN L24S04
2 of 6
eters. A complete set of parameter estimates are given whenthe bias voltage of the probe is varied from �32 V to +32 V.Ions and electrons are thus collected with respect to the biasvoltage. For this flyby, Langmuir probe sweeps are carriedout every 24 s in the time interval 18:38–19:21 UT and with48 s resolution elsewhere.[7] The analysis of the sweep data is based on the Orbital
Motion Limited (OML) theory [Mott-Smith and Langmuir,1926]. The analysis of the current-voltage curve gives theelectron number density (ne), the electron temperature (Te),the floating potential and, under some assumptions, infor-mation on the ion population [Fahleson, 1967]. Estimationsof error bars for ne and Te are 10% and 20% respectively.The floating potential is the most reliable parameter esti-mate given with an error bar <10%.[8] The electron current is also sampled at a constant
bias voltage (’+10V) with 20 samples per second in ahigh resolution mode, and provides a measurement of Ie /neUsc/
ffiffiffiffiffiTe
p. Between two sweeps, the electron temperature
and the floating potential do not evolve significantly. Thecontinuous data are fitted to the sweep density estimatesassuming a constant electron temperature and floatingpotential between two sweeps. Variations of the highresolution current is thus attributed to density variations.The Langmuir Probe sensor measures the total electronnumber density around the spacecraft, including the am-bient electrons of the plasma and the photoelectronssurrounding the probe and the spacecraft. The exactcontribution of these photoelectrons is difficult to predictin thin plasma and it has been found to be sensitive to thespacecraft attitude with respect to the Sun, and to be non-uniformly distributed.[9] In low density region, the floating potential (Uf) can
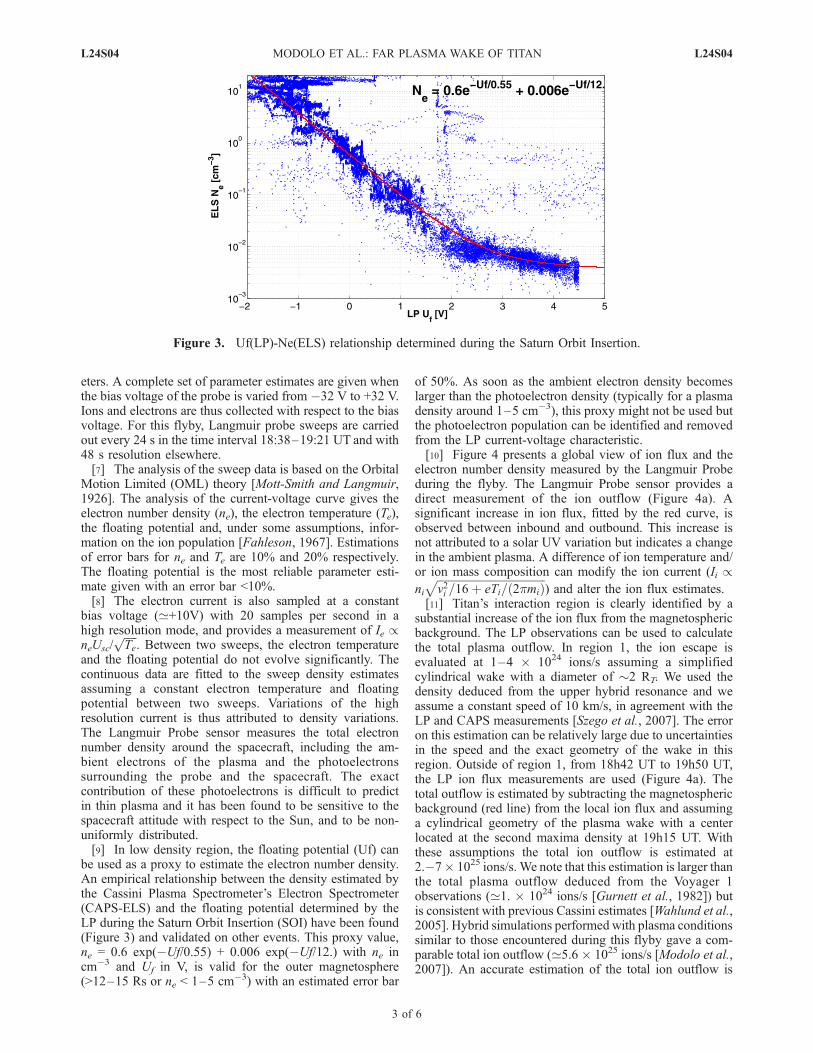
be used as a proxy to estimate the electron number density.An empirical relationship between the density estimated bythe Cassini Plasma Spectrometer’s Electron Spectrometer(CAPS-ELS) and the floating potential determined by theLP during the Saturn Orbit Insertion (SOI) have been found(Figure 3) and validated on other events. This proxy value,ne = 0.6 exp(�Uf/0.55) + 0.006 exp(�Uf/12.) with ne incm�3 and Uf in V, is valid for the outer magnetosphere(>12–15 Rs or ne < 1–5 cm�3) with an estimated error bar
of 50%. As soon as the ambient electron density becomeslarger than the photoelectron density (typically for a plasmadensity around 1–5 cm�3), this proxy might not be used butthe photoelectron population can be identified and removedfrom the LP current-voltage characteristic.[10] Figure 4 presents a global view of ion flux and the
electron number density measured by the Langmuir Probeduring the flyby. The Langmuir Probe sensor provides adirect measurement of the ion outflow (Figure 4a). Asignificant increase in ion flux, fitted by the red curve, isobserved between inbound and outbound. This increase isnot attributed to a solar UV variation but indicates a changein the ambient plasma. A difference of ion temperature and/or ion mass composition can modify the ion current (Ii /ni
ffiffiffiffiffiffiffiffiffiffiffiffiffiffiffiffiffiffiffiffiffiffiffiffiffiffiffiffiffiffiffiffiffiffiffiffiffiffiffiv2i =16þ eTi= 2pmið Þ
p) and alter the ion flux estimates.
[11] Titan’s interaction region is clearly identified by asubstantial increase of the ion flux from the magnetosphericbackground. The LP observations can be used to calculatethe total plasma outflow. In region 1, the ion escape isevaluated at 1–4 � 1024 ions/s assuming a simplifiedcylindrical wake with a diameter of 2 RT. We used thedensity deduced from the upper hybrid resonance and weassume a constant speed of 10 km/s, in agreement with theLP and CAPS measurements [Szego et al., 2007]. The erroron this estimation can be relatively large due to uncertaintiesin the speed and the exact geometry of the wake in thisregion. Outside of region 1, from 18h42 UT to 19h50 UT,the LP ion flux measurements are used (Figure 4a). Thetotal outflow is estimated by subtracting the magnetosphericbackground (red line) from the local ion flux and assuminga cylindrical geometry of the plasma wake with a centerlocated at the second maxima density at 19h15 UT. Withthese assumptions the total ion outflow is estimated at2.�7� 1025 ions/s. We note that this estimation is larger thanthe total plasma outflow deduced from the Voyager 1observations (’1. � 1024 ions/s [Gurnett et al., 1982]) butis consistent with previous Cassini estimates [Wahlund et al.,2005]. Hybrid simulations performed with plasma conditionssimilar to those encountered during this flyby gave a com-parable total ion outflow (’5.6 � 1025 ions/s [Modolo et al.,2007]). An accurate estimation of the total ion outflow is
Figure 3. Uf(LP)-Ne(ELS) relationship determined during the Saturn Orbit Insertion.
L24S04 MODOLO ET AL.: FAR PLASMA WAKE OF TITAN L24S04
3 of 6

difficult to deduce from the observations, due to the unknowngeometry of the wake.[12] Figure 4b presents the electron number density
derived from the upper hybrid resonance (red curve) andthe density deduced from the Langmuir Probe analysis (theblue curve indicates the high resolution density while theblack dots present the density calculated from the sweepanalysis). An increase of the electron number density isconcomitant to the increase of the ion flux during the timeinterval (18:26 UT to 19:52 UT).[13] Observations suggest a strong asymmetry in the
plasma wake of Titan. The center of the ‘‘ideal’’ wakewas located at 18:44 UT (cf Figure 1) while the observedcenter of the wake seems to be located around 18:52 UT atthe minimum electron number density, between the twomain high density regions.[14] A such deviation of the plasma wake is emphasized
by different Cassini instruments [Bertucci et al., 2007;Coates et al., 2007; Szego et al., 2007] and by simulationresults [Modolo et al., 2007].[15] The main density peak is shifted toward Saturn while
the second region, with a lower number density is mainlyextended away from Saturn. The width of the plasma wake,defined by an increase of the electron number density andthe ion fluxes (Figure 4), covers a range of 12 Titan radiifollowing the YTIIS axis.[16] Outside Titan’s interaction region the electron num-
ber density, estimated by the LP-ELS relationship, is closeto 0.05–0.1 cm�3 in agreement with the electron numberdensity estimated by CAPS-ELS [Coates et al., 2007].[17] Region 1 presents a significant peak where the
electron number density reaches 14 cm�3. When the Lang-muir Probe observations are available, a good agreement isfound with the density calculated from the upper hybridresonance.[18] Region 2 presents a maxima of density around
1.6 cm�3. Densities observations in region 2 are consistentwith the ELS observations [Coates et al., 2007].[19] Figure 5 gives a closer and more complete view of the
Langmuir Probe and wave deduced observations. Figure 5bsupplies the electron number density from the observationsof the RPWS experiment, including the continuous (blue
line) and the sweep data (black point) from the LangmuirProbe and the derived analysis from the wave emissions (redline and points). Region 1 and 2 are emphasized by theshaded areas. The electron temperature provided by theLangmuir Probe is accurate and can be relied on only inthe these regions, outside, the ELS experiment providesmore suitable estimations [Coates et al., 2007]. The floatingpotential can be derived from the analysis of the LangmuirProbe’s sweep data and is presented in Figure 5c. A negativefloating potential indicates a denser and colder plasma forwhich the LP is well designed.[20] Two independent methods can provide an estimation
of the ion ram speed from the ion current of the LangmuirProbe data. The current collected by the probe is the sum ofthe electron and ion currents. For a negative bias voltage theelectron current can be neglected since all electrons arerepelled; then I ’ Ii = Ii0(1 + cUbias) + Iphotoe� where Ii0 /ni
ffiffið
pvi2/16 + kBTi), c = qi/
ffiffið
pmivi
2/2 + kBTi) and Iphotoe� isthe current created by the probe’s photoelectrons [Fahleson,1967]. Assuming that the ram term dominates (Ti � mivi
2/2e), either the DC level of the ion current, Ii / nivi +Iphotoe�, or the slope of the ion current can be used todetermine the ram speed. The ion ram speed given by theDC level of the ion current corrected to the photoelectroncurrent and assuming quasi-neutrality ni = ne is presented inFigure 5e (black line and dots). The ion ram speed calcu-lated from the slope of the ion current and assuming aplasma composed of light ions (mi = 2 amu, red dots) orheavy ions (mi = 28 amu, blue dots) are shown in Figure 5e.The ion ram velocity estimate can have a large error baroutside of the denser region (yellow areas) since themeasurements approach the noise level.[21] In Region 1, the ion ram speeds vary between 10 to
20 km/s, in agreement with the speed deduced from theCAPS experiment [Szego et al., 2007]. In this region the ionram speed estimated assuming an ion mass of 28 amucoincides with the ion ram speed derived from the DClevel, while in region 2 the speed assuming light ionsprovides a closer match. The Langmuir Probe analysissuggest an asymmetry of the ion composition in the wakeof Titan, with the region 1 population consisting of heavyions and the second region mainly composed of light ions,
Figure 4. Plasma characteristics during the T9 encounter. (a) The ion flux directly measured by the Langmuir Probesensor. (b) The electron number density derived from the upper hybrid resonance frequency (red) combined with theLangmuir Probe observations. The shaded area emphasizes the two main regions.
L24S04 MODOLO ET AL.: FAR PLASMA WAKE OF TITAN L24S04
4 of 6

in agreement with the CAPS observations [Szego et al.,2007].[22] Furthermore, in region 1, an upper limit of the ion
temperature can be deduced from the LP measurementsand is around 15–60 eV, assuming a speed of 10–20 km/sand a plasma composed of 28 amu ions, while in region 2the ion temperature should be less than 100 eV assuming alight ion composition (2 amu) for the plasma with a speed100 km/s.[23] The combined observations suggest that the Cassini
spacecraft crossed the two lobes induced by the draping ofthe magnetic field around Titan [Bertucci et al., 2007], andpopulated by ions originating from the ionisation of theupper atmosphere of Titan. The strong asymmetry observed
in the data is not only present in the number density but alsoin the ion composition.
3. Conclusion
[24] The RPWS results identify strong variations in theelectron densities during the T9 flyby and an importantasymmetry in regards to the ideal plasma wake with a centerof the wake located at 18:56 UT instead of expected 18:44 UT.The CAPS observations suggest that the incident magneto-spheric plasma flow was not aligned with the ideal direction ofthe co-rotating plasma but is deflected outward by 65� [Szegoet al., 2007]. This important deviation may explain the shift ofthe plasma with respect to the ideal wake.
Figure 5. Langmuir Probe observations during the T9 encounter. (a) The calibrated Langmuir Probe observations. (b) Theelectron number density. The corrected density derived from the sweep analysis and the continuous data are presented inblack point and in blue line respectively, while the red points and line indicate the electron number density deduced fromthe upper hybrid resonance emissions. (c) The spacecraft potential. (d) The electron temperature. (e) An estimation of theion ram speed using either the slope of the ion current and assuming different ion mass (mi = 2 amu, red dots, mi = 28 amu,blues dots) or using the DC level of the ion current (black line).
L24S04 MODOLO ET AL.: FAR PLASMA WAKE OF TITAN L24S04
5 of 6

[25] Two main regions can be determined in the wake ofTitan, characterized by an increase of the electron numberdensity. On the Saturn facing side a denser region isidentified with a maximum of density of 14 cm�3 and anelectron temperature of a few eV. The LP measurementssuggest heavy and cold ions (�15–60 eV) for this region.These ions are a clear signature of the mass loadingassociated with strong field draping.[26] The picture of Titan’s wake described by this flyby is
slightly different than the picture proposed by Voyager 1.Differences in the upstream plasma flow may affect stronglythe plasma environment in the vicinity of Titan.
ReferencesBackes, H., et al. (2005), Titan’s magnetic field signature during the firstCassini encounter, Science, 308, 992–995, doi:10.1126/science.1109763.
Bertucci, C., F. M. Neubauer, K. Szego, J.-E. Wahlund, A. J. Coates,M. K. Dougherty, D. T. Young, and W. S. Kurth (2007), Structure ofTitan’s mid-range magnetic tail: Cassini magnetometer observationsduring the T9 flyby, Geophys. Res. Lett., doi:10.1029/2007GL030865,in press.
Coates, A. J., F. J. Crary, D. T. Young, K. Szego, C. S. Arridge, Z. Bebesi,E. C. Sittler Jr., R. E. Hartle, and T.W. Hill (2007), Ionospheric electrons inTitan’s tail: Plasma structure during the Cassini T9 encounter, Geophys.Res. Lett., doi:10.1029/2007GL030919, in press.
Fahleson, U. (1967), Theory of electric field measurements conducted inthe magnetosphere with electric probes, Space Sci. Rev., 7, 238–262.
Gurnett, D. A., F. L. Scarf, and W. S. Kurth (1982), The structure of Titan’swake from plasma wave observations, J. Geophys. Res., 87, 1395–1403.
Gurnett, D. A., et al. (2004), The Cassini radio and plasma wave investiga-tion, Space Sci. Rev., 114, 395–463, doi:10.1007/s11214-004-1434-0.
Modolo, R., G. M. Chanteur, J.-E. Wahlund, P. Canu, W. S. Kurth,D. Gurnett, A. P. Matthews, and C. Bertucci (2007), Plasma environ-ment in the wake of Titan from hybrid simulation: A case study, Geo-phys. Res. Lett., 34, L24S07, doi:10.1029/2007GL030489.
Mott-Smith, H. M., and I. Langmuir (1926), The theory of collectors ingaseous discharges, Phys. Rev., 28, 727–763, doi:10.1103/PhysRev.28.727.
Ness, N. F., M. H. Acuna, and K. W. Behannon (1982), The inducedmagnetosphere of Titan, J. Geophys. Res., 87, 1369–1381.
Neubauer, F. M., D. A. Gurnett, J. D. Scudder, and R. E. Hartle (1984),Titan’s magnetospheric interaction, in Saturn, edited by T. Gehrels andM. S. Matthews, pp. 760–787, Univ. of Ariz. Press, Tucson.
Stix, T. H. (1962), The Theory of Plasma Waves, McGraw-Hill, New York.Szego, K., Z. Bebesi, C. Bertucci, A. J. Coates, F. Crary, G. Erdos,R. Hartle, E. C. Sittler, and D. T. Young (2007), Charged particleenvironment of Titan during the T9 flyby, Geophys. Res. Lett.,doi:10.1029/2007GL030677, in press.
Wahlund, J.-E., et al. (2005), Cassini measurements of cold plasma in theionosphere of Titan, Science, 308, 986 – 989, doi:10.1126/science.1109807.
�����������������������R. Bostrom, R. Modolo, and J.-E. Wahlund, Swedish Institute of Space
Physics, Uppsala Division, Box 537, SE-75121 Uppsala, Sweden.([email protected])P. Canu, Centre d’Etudes des Environnements Terrestre et Planetaires,
Institut Pierre Simon Laplace, 10-12 avenue de l’Europe, F-78140 Velizy,France.A. J. Coates and G. R. Lewis, Mullard Space Science Laboratory,
University College London, Holmbury St. Mary, Dorking, Surrey RH56NT, UK.D. Gurnett and W. S. Kurth, Department of Physics and Astronomy,
University of Iowa, Iowa City, IA 52242, USA.
L24S04 MODOLO ET AL.: FAR PLASMA WAKE OF TITAN L24S04
6 of 6