far infrared observations of radio quasars and fr ii radio ... · far infrared observations of...
TRANSCRIPT

arX
iv:a
stro
-ph/
0504
622v
1 2
8 A
pr 2
005
Far Infrared Observations of Radio Quasars and FR II Radio
Galaxies
Y. Shi1, G. H. Rieke1, D. C. Hines2, G. Neugebauer1, M. Blaylock1, J. Rigby1, E. Egami1,
K. D. Gordon1, A. Alonso-Herrero3
ABSTRACT
We report MIPS photometry of 20 radio-loud quasars and galaxies at 24
and 70 µm (and of five at 160 µm). We combine this sample with additional
sources detected in the far infrared by IRAS and ISO for a total of 47 objects,
including 23 steep spectrum Type I AGNs: radio-loud quasars and broad line
radio galaxies; and 24 Type II AGNs: narrow line and weak line FR II radio
galaxies. Of this sample, the far infrared emission of all but 3C 380 appears to
be dominated by emission by dust heated by the AGN and by star formation.
The AGN appears to contribute more than 50% of the far infrared luminosity
in most of sources. It is also expected that the material around the nucleus is
optically thin in the far infrared. Thus, the measurements at these wavelengths
can be used to test the orientation-dependent unification model. As predicted
by the model, the behavior of the sources is consistent with the presence of an
obscuring circumnuclear torus; in fact, we find it may still have significant optical
depth at 24 µm. In addition, as expected for the radio-loud quasars, there is a
significant correlation between the low frequency radio (178 MHz) and the 70
µm emission, two presumably isotropic indicators of nuclear activity. This result
is consistent with the simple unified scheme. However, there is a population of
radio galaxies that are underluminous at 70 µm compared with the radio-loud
quasars and hence are a challenge to the simple unified model.
Subject headings: galaxies: active — quasars: general — infrared: galaxies
1Steward Observatory, University of Arizona, 933 N Cherry Ave, Tucson, AZ 85721, USA
2Steward Observatory, currently at Space Science Institue 4750 Walnut Street, Suite 205, Boulder, Col-
orado 80301
3Steward Observatory, now at Instituto de Estructura de la Materia, CSIC, Madrid, Spain

– 2 –
1. Introduction
Unification models of active galactic nuclei (AGN) hypothesize that apparently distinct
types of AGN harbor intrinsically similar nuclear engines that may be described by a small
number of fundamental physical parameters. For example, it is proposed that orientation-
dependent obscuration by a torus surrounding the central supermassive black hole, along
with beamed emission, is responsible for the large diversity in the appearance of radio-loud
AGNs (as reviewed by e.g. Urry & Padovani 1995). In the purest form of the model,
the torus is always of the same geometry, so differences among sources arise only due to
different inclinations relative to the observer and different AGN luminosities. In this paper,
we focus on the unification initially proposed by Orr & Browne (1982) and Barthel (1989)
for steep-spectrum radio quasars and FR II radio galaxies (Fanaroff & Riley 1974).
Recent Infrared Space Observatory (ISO) observations have shown that thermal emis-
sion by dust is the dominant infrared (IR) emission component for most steep-spectrum
extragalactic radio sources (Haas et al. 1998; Polletta et al. 2000; van Bemmel et al. 2001;
Andreani et al. 2002; Siebenmorgen et al. 2004). However the relative luminosity contri-
bution from star formation and from the nuclear engine is not clear. Polletta et al. (2000)
suggest the stellar-powered contribution to the IR emission is less than 27% based on the
relatively warm IR colors indicated by the ratio F (60 to 200µm)/F (3 to 60µm). Although
the IR emission from AGNs is generally warmer than that from star-forming regions, the IR
color of AGNs can be affected by extinction, especially for mis-aligned sources, and the IR
colors F (60µm)/F (25µm) of AGNs and star-forming regions have a large range (Kewley et
al. 2001). Therefore, the color-based arguments may not be rigorous. Theoretically, early
models for AGNs (Pier & Krolik 1993; Granato & Danese 1994) underestimate the far-IR
(FIR) emission from heated dust, which lead Rowan-Robinson (2000) to suggest a star for-
mation origin for most of the FIR emission, consistent with results of recent radiative transfer
models (van Bemmel et al. 2003). Recently, Nenkova et al. (2002) and Siebenmorgen et al.
(2004) suggest that the nuclear engine can heat the dust to large distances from the galaxy
center and therefore that star formation need play only a small role in the dust heating.
In this paper, we combine IR measurements of radio-loud AGN obtained with the Multi-
band Imaging Photometer for Spitzer (MIPS) (Rieke et al. 2004) and previous data from
the Infrared Astronomical Satellite (IRAS) and ISO. We use these observations to show
that the IR emission is usually dominated by radiation from dust heated by the AGN. Thus
we can use the far infrared properties of these sources to gain new insights to unification
models.

– 3 –
2. Observations
2.1. The Sample and Extended Sample
We have used MIPS to observe twenty FR II radio galaxies and steep spectrum radio
quasars listed in Tables 1 and 2. The sample is drawn from Neugebauer et al. (1986) and
Golombek et al. (1988), with priority on objects at z < 0.4 and with good Hubble Space
Telescope (HST ) images. To complement these measurements, we defined an extended
sample, consisting of the 27 additional 3CR sources listed in Table 3, all of which are detected
by IRAS or ISO at least at two wavelengths between 10 µm and 200 µm. The IRAS data
are from the NASA/IPAC Extragalactic Database (NED) and the ISO data are from Haas
et al. (2004), van Bemmel et al. (2001) and NED. The uncertainties in the ISO data from
Haas et al. (2004) are quoted as 10-30%; in this paper we adopt 30% uniformly. Except for
Pic A and 3C 218 the sources belong to the parent 3CR sample. For this study, we divide
the sample into two subsamples as described in Section 3.1: Type I sources including radio
quasars and broad line radio galaxies (BLRG) and Type II sources composed of narrow line
radio galaxies (NLRG) and weak line radio galaxies (WLRG).
To investigate possible selection biases for our sample, in Figure 1 we plot the distri-
bution of all the sources in the plane of 178 MHz flux density versus redshift (top box) and
178 MHz flux density versus spectral index α (bottom box; α is defined as fν∝ ν−α between
38 MHz and 750 MHz). The top box indicates for our sample that the 178 MHz flux den-
sity spans a range from 6 Jy to 104 Jy and the redshift a range from 0.03 to 1.4. From
this figure, we see that the flux density distributions of Type I and II sources are similar.
The Kolmogorov-Smirnov (K-S) test indicates a probability of 82% that the two subsamples
have the same distributions. However, the sample contains many more high redshift (z>0.3)
Type I sources, mainly radio quasars, than high-redshift type II sources. The bottom box
indicates that the spectral indices of the two sub-samples are mainly in the range between
0.5 and 1.2. The K-S test gives a probability of 89% that both types have the same distri-
butions of spectral index. Based on figure 1, we find that our sample is not biased in AGN
characteristics except that there are relatively more Type I sources at high redshift and thus
high luminosity.
2.2. Infrared Data
Our observations were made with the standard MIPS small field photometry mode. The
effective integration time for each source is listed in Table 1. The data were reduced with
the MIPS instrument team Data Analysis Tool (DAT) version 2.73 (Gordon et al. 2004a,
– 4 –
b).
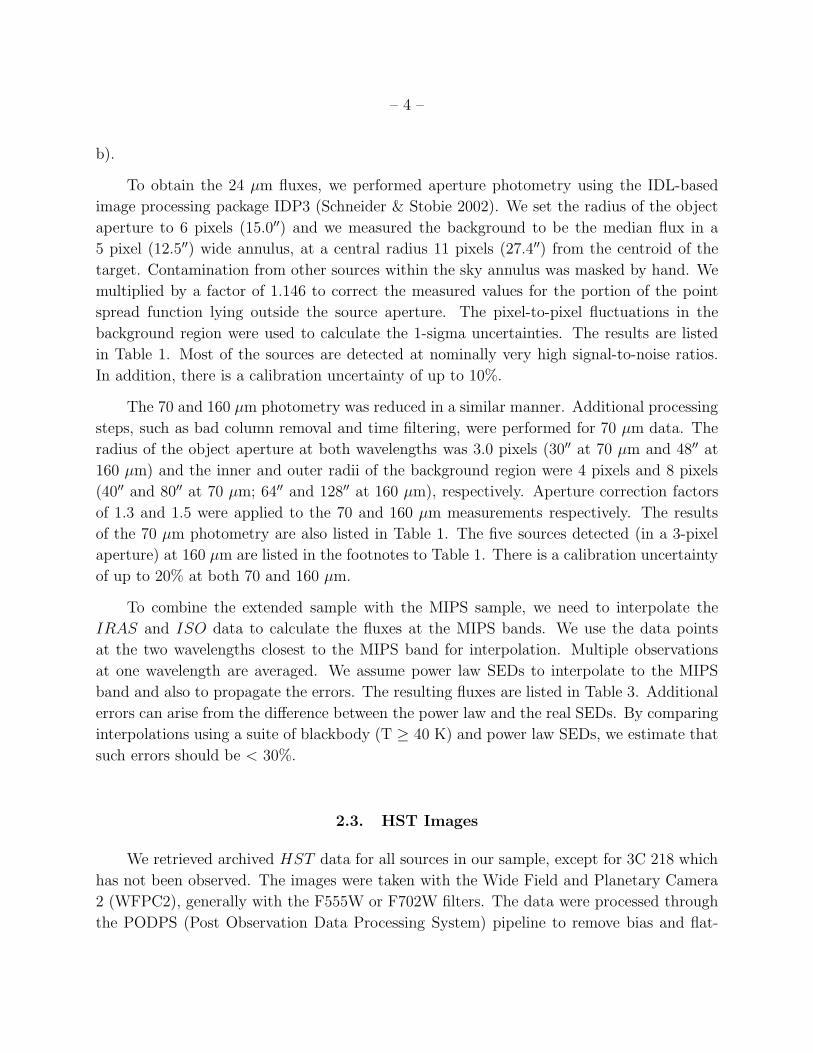
To obtain the 24 µm fluxes, we performed aperture photometry using the IDL-based
image processing package IDP3 (Schneider & Stobie 2002). We set the radius of the object
aperture to 6 pixels (15.0′′) and we measured the background to be the median flux in a
5 pixel (12.5′′) wide annulus, at a central radius 11 pixels (27.4′′) from the centroid of the
target. Contamination from other sources within the sky annulus was masked by hand. We
multiplied by a factor of 1.146 to correct the measured values for the portion of the point
spread function lying outside the source aperture. The pixel-to-pixel fluctuations in the
background region were used to calculate the 1-sigma uncertainties. The results are listed
in Table 1. Most of the sources are detected at nominally very high signal-to-noise ratios.
In addition, there is a calibration uncertainty of up to 10%.
The 70 and 160 µm photometry was reduced in a similar manner. Additional processing
steps, such as bad column removal and time filtering, were performed for 70 µm data. The
radius of the object aperture at both wavelengths was 3.0 pixels (30′′ at 70 µm and 48′′ at
160 µm) and the inner and outer radii of the background region were 4 pixels and 8 pixels
(40′′ and 80′′ at 70 µm; 64′′ and 128′′ at 160 µm), respectively. Aperture correction factors
of 1.3 and 1.5 were applied to the 70 and 160 µm measurements respectively. The results
of the 70 µm photometry are also listed in Table 1. The five sources detected (in a 3-pixel
aperture) at 160 µm are listed in the footnotes to Table 1. There is a calibration uncertainty
of up to 20% at both 70 and 160 µm.
To combine the extended sample with the MIPS sample, we need to interpolate the
IRAS and ISO data to calculate the fluxes at the MIPS bands. We use the data points
at the two wavelengths closest to the MIPS band for interpolation. Multiple observations
at one wavelength are averaged. We assume power law SEDs to interpolate to the MIPS
band and also to propagate the errors. The resulting fluxes are listed in Table 3. Additional
errors can arise from the difference between the power law and the real SEDs. By comparing
interpolations using a suite of blackbody (T ≥ 40 K) and power law SEDs, we estimate that
such errors should be < 30%.
2.3. HST Images
We retrieved archived HST data for all sources in our sample, except for 3C 218 which
has not been observed. The images were taken with the Wide Field and Planetary Camera
2 (WFPC2), generally with the F555W or F702W filters. The data were processed through
the PODPS (Post Observation Data Processing System) pipeline to remove bias and flat-

– 5 –
field artifacts (Biretta et al. 1995). Individual exposures in an observation were combined
to remove cosmic ray events. For observations with only one exposure, the cosmic rays were
masked by interpolating over them.
2.4. Chandra Data
We retrieved data from the Chandra archive for 19 sources observed with the Ad-
vanced CCD Imaging Spectrometer (ACIS). Data reduction and analysis were performed
using CIAO 3.0.2. The level 2 event file was made from the level 1 event file after correction
for gain, aspect and charge transfer inefficiency, and also after PHA randomization and de-
streaking. We used the light curve to remove solar flares. Inspection of the images showed
that there was severe pileup in the central region of 3C 390.3 where a hole without counts
was present. The nuclei of 3C 348 and 3C 173.1 had too few counts for our analysis and they
were dropped from the X-ray sample. For the remaining sources, we extracted the spectra
of the nuclear region with an aperture diameter of 2.5′′ around the peak pixel and then
fitted the rest-frame 2-10 kev spectra using an absorbed power law. Finally we computed
the absorption-corrected hard-X-ray fluxes, which are listed in Column (10) of Table 2 and
Column (13) of Table 3. The photon spectral indices are listed in Column (9) of Table 2 and
Column (12) of Table 3.
3. Analysis
3.1. Division of the sample into quasars and galaxies
We classified the sources as Type I (radio quasar or BLRG) or Type II (NLRG or
WLRG) on a consistent basis. Emission line types were obtained from the literature. The
division between radio quasars and BLRG was based on absolute B magnitude. We retrieved
the apparent Johnson B magnitude from NED, originally from Sandage et al. (1965), Smith
& Heckman (1989) and de Vaucouleurs et al. (1991). For those sources without available blue
magnitudes, we took V magnitudes from Spinrad et al. (1985) and assumed <B−V>=0.3
mag. The conversion formula from the apparent magnitude to absolute magnitude is:
M = m− 5log(DL) + 5−K(z)− Am (1)
where M , m are absolute magnitude and apparent magnitude, DL is the luminosity distance,
K(z) is the K-correction at the redshift z and A is the Galactic extinction. Am is computed
using NED. The majority of our sample are in luminous elliptical galaxies; we obtained

– 6 –
K-corrections for such galaxies from Pence (1976). We assumed H0 = 75km s−1 Mpc−1,
ΩM=0.3 and ΩΛ=0.7. The resultant absolute blue magnitudes are listed in Column (2) of
Table 2 and Table 3. Radio quasars have power law SEDs, typically with a spectral index
of 0.5. Therefore, we also calculated the absolute B magnitude for all sources using the
K-correction based on a power law SED with a spectral index of 0.5
We defined as quasars those broad line sources with an absolute B magnitude < -23 mag
and as BLRGs those with fainter absolute B magnitudes. Only four sources have ambiguous
classifications. 3C 318, 3C 325, 3C 332 and 3C 382 were classified as radio quasars using the
K-correction based on the SED of normal elliptical galaxies, while they were radio galaxies
if we assumed their optical SEDs were power laws. The remaining galaxies without broad
lines were classified as NLRG or WLRG according to the strength of their emission lines.
Column (3) of Table 2 and Table 3 list the results. There are 17 radio quasars, 6 BLRG, 20
NLRG and 4 WLRG. We emphasize that the ambiguous classifications of a few sources do
not affect the results of this paper.
3.2. Spectral Energy Distribution
For each source, we used NED to compile the SED from radio to millimeter, as pre-
sented in Figure 2. The radio and millimeter-wave SEDs of these sources are smoothly
steepening power laws associated with synchrotron emission. This behavior provides the
basis for us to extrapolate to determine the non-thermal contribution to the IR emission.
This process requires a synchrotron radiation model and good high-frequency data, since the
break frequency of the synchrotron emission occurs at ∼ 1Ghz (Polletta et al. 2000). We
used a parabola approximation (Andreani et al. 2002) to fit the synchrotron emission. The
spectrum in this model is given by
logFν = C +1
2A(logν − logνt)
2 (2)
where C is a constant, νt characterizes the spectral break (i.e., where the nominal optical
depth is unity) and 1A
= 2α1 − α2, where α1 and α2 are the spectral indices above and
below the break, respectively. For each source, we adjusted C, A and νt to fit all data
at wavelengths longer than 1 mm. Figure 2 shows the results; the extrapolation is well
constrained since most sources have high-frequency data and the model can usually fit the
data well. The IR emission is generally well above the non-thermal extrapolation. Five
sources, 3C 218, 3C 315, 3C 348, 3C 349 and 3C 380, seem to be exceptions: they have IR
fluxes below the non-thermal extrapolation at one or more bands. Except for 3C 380, the
remaining sources have no sub-millimeter observations and thus their IR emission can be

– 7 –
thermal emission by dust if the radio spectrum turns over at very high frequencies. Since
their 24 µm to 70 µm IR color is redder than the non-thermal continuum, we argue for the
thermal nature of the IR emission for these four sources. This hypothesis is confirmed by
a mid-IR spectrum of 3C 218 that shows PAH emission (our unpublished data). The IR
flux of 3C 380 is along the non-thermal extrapolation as shown in the Figure 2; Bloom et
al. (1994) find that the radio spectrum is flat from around 1 cm up to 1100 µm, implying
that the non-thermal contribution is significant at infrared wavelengths. The 5 GHz radio
emission mainly comes from a region less than 2 arcsec across, as shown by comparing F5t
and F5c in Table 3. VLBI observations of the milliarcsecond-scale structure of this compact
core reveal a one-sided core-jet (Wilkinson et al. 1990; Polatidis & Wilkinson 1998). The
total flux of all compact components of the core-jet is 2-5 Jy at 5 GHz, contributing 30-60%
of the total flux. This radio core with flat spectrum may make a substantial non-thermal
contribution to the infrared emission of 3C 380. Given the ambiguities in the origin of the
infrared emission, we do not use this source in the following analysis.
We also evaluated contamination from stellar light in the host galaxy. The stellar light
in radio quasars should be negligible. To estimate the stellar contribution from the other
host galaxies, we used the spectral template for a normal elliptical galaxy over the spectral
range from 1400 A to 2.75 µm (M. Rieke, private communication). The template was shifted
by (1+z) and then normalized at 4405 A to the apparent B magnitude. The dotted line in
Figure 2 shows the stellar emission of the host galaxy; the contribution in the mid-IR (MIR)
and FIR wavelength ranges will be negligible.
We conclude that the IR emission of most of our sample of radio-loud galaxies and
quasars is mainly thermal IR emission by dust, except for 3C 380.
4. Discussion
4.1. Energy Source for IR Emission
We will use several methods to assess the relative contributions of forming stars and the
AGN in heating the dust in our sample of radio-loud AGNs. We find that star formation
provides less than 50% of the IR luminosity in most sources.

– 8 –
4.1.1. Extension of the IR Emission Region
The MIPS 24 µm images do not resolve the sources. The beam diameter of ∼ 6′′
corresponds to ∼10 kpc at a redshift of 0.1. We convolved the HST image with the PSF of
MIPS at 24 µm created by STINYTIM and found that the 24 µm image should show some
structure for low-redshift (z < 0.3) sources if the IR emission is from the entire host galaxy.
Thus, the IR emission is constrained to the central region.
4.1.2. Emission Line Ratio and IR Color
Baldwin, Phillips, & Terlevich (1981), Osterbrock & de Robertis (1985) and Veilleux &
Osterbrock (1987) have developed spectral diagnostics to classify emission-line galaxies and
determine the dominant energy source, star formation or an active nucleus. They compare
two emission-line ratios combining high and low excitation lines, such as [O III] λ5007/Hβ,
[N II] λ6583/Hα, or [S II] (λ6716+ λ6731)/Hα, in a two dimensional classification diagram.
The dust heated by an AGN is usually warmer than that heated by star formation and
thus the IR color can be used instead of one emission line ratio for classification diagnostics
(Kewley et al. 2001). We use [O III] λ5007/Hβ and IR color to diagnose the dominant source
of energy for the IR emission. The data for the ratio [O III] λ5007/Hβ are collected from the
literature and the extinction corrections follow Veilleux & Osterbrock (1987). Our extinction
estimates assume an intrinsic I(Hα)/I(Hβ) = 3.1 (Kewley et al. 2001). For several sources,
we use the ratio of equivalent widths of the emission lines because the flux ratio is not
available. The extinction corrections are small in virtually all cases. Some sources could not
be corrected for extinction because there are no measurements of Hα. The errors introduced
by uncorrected line strengths should be negligible, given the small corrections for the other
sources.
Figure 3 shows the distribution of 22 sources in the emission-line-ratio versus IR-color
plot. The IR colors are defined as the ratios of 60 µm flux densities to 24 or 25 µm ones.
For sources without 60 µm measurements, the flux densities were obtained by interpolation
as in Section 2.2. A large [O III] λ5007/Hβ ratio and warm IR color indicate significant
AGN activity, i.e., the upper left region of Figure 3. The lower right part of the figure is the
locus of star formation. We use the hypothetical mixing line (Kewley et al. 2001) in Figure
3 to estimate the percentage contribution of star formation. Most of our sources lie close
to the region delinated by confirmed AGNs (filled dots), and for them we conclude that the
AGN contributes >50% of the total power. However, for a few sources, it appears that the
contribution from star formation can be dominant, much higher than the estimation made

– 9 –
by IR color alone (Polletta et al. 2000).
In Section 4.2.1, we show that the circumnuclear torus may have significant optical
depth at 24 µm and so the IR color of Type II AGN may be reddened through obscuration
by the torus. Thus, Figure 3 may underestimate the fraction of the AGN contribution for
Type II AGN.
4.1.3. Relation of IR emission to the Central Hard X-ray Emission
Since the thermal IR emission appears usually to be powered by the nuclear engine,
under the unified model we might expect a relation between IR luminosity and nuclear
luminosity at other wavelengths. Such a relation might be hidden at wavelengths with
strong obscuration by the circumnuclear torus. Hard X-rays are largely immune from such
effects. The weakness of the correlation between hard-X-ray flux and core radio flux at 5
GHz as shown in Table 4 indicates that the hard X-ray emission for our sources is mainly
from the accretion disk and other processes around the central engine, not from the beamed
emission. Hard X-rays from the accretion disk are believed to provide a reasonably isotropic
estimation of the nuclear luminosity.
Figure 4 compares the rest-frame 2-10 kev absorption- and K-corrected X-ray flux in the
central 2.5′′ region and the 70 µm and 24 µm K-corrected flux densities. Because of the in-
homogeneity of our sample, we compare K-corrected flux densities rather than luminosities.
The spectral indices of the power laws assumed for the K-corrections of the X-ray measure-
ments are listed in Column (9) of Table 2 and Column (12) of Table 3. The K-corrections
for the IR bands were calculated assuming a power law SED with spectral index of 1. The
Kendall Tau test on these data (see Table 4) yields S values of 0.05 and 0.09 respectively
at 24 and 70µm, showing only 5% and 9% probabilities respectively that the measurements
are uncorrelated.
Except for 3C 380, all sources in Figure 4 have negligible non-thermal IR emission.
3C 321 is well above the correlation in Figure 4 and may have significant star formation
activity. Additional evidence for active star formation in 3C 321 includes: 3C 321 contains
two close nuclei (Roche & Eales 2000) and large amounts of star formation may be triggered
by mergers (Sanders et al. 1988); Tadhunter, Dickson, & Shaw (1996) find that the AGN
fraction can be as low as 26% of the UV continuum by fitting the observed spectra of 3C
321.
The correlation indicates that the thermal IR emission is associated primarily with the
nuclear output, not with processes such as star formation that would operate independently

– 10 –
of nuclear power. Thus, the IR emission is largely the emission of dust heated by the central
engine. Because of the lack of suitable X-ray detections, the radio galaxies are relatively
poorly represented in Figure 4, but there is no reason to expect them to behave differently
from the other sources.
For the following discussion, we fit the IR/X-ray correlation in luminosity rather than
flux density, since converting to this form and fitting the slope reduces the uncertainties
due to our rather crude K-corrections. Excluding 3C 380 and 3C 321, the fits are given by
Log(L70) = 1.68 + 0.89Log(Lx) and Log(L24) = 1.21 + 0.93Log(Lx). The dispersion of the
relation is given by the relative standard deviation defined by < ((Lobs −Ltheo)/Ltheo)2 >0.5,
where Lobs is the observed IR luminosity and Ltheo is the theoretical IR luminosity heated
by the central black hole, estimated from the fits discussed above. The result is 1.4 and 0.7
for the 70 µm and 24 µm relation respectively. We can derive a rough upper limit to the
contribution of star formation by assuming that all of the scatter arises from this process.
The dispersion values imply that the contribution from star formation is smaller than 60%
and 40% at 70 and 24 µm rest-frame wavelengths, respectively. This result is consistent with
the conclusion from our emission-line-ratio vs. IR color analysis.
4.2. Tests of Unification Models
Since most of the IR emission from these sources seems to be associated with the AGN,
we can use the IR data to probe unification models. We will describe two types of test: 1.) to
see if the distribution of physical parameters is consistent with an obscuring circumnuclear
torus and beamed emission by a jet, observed over a range of viewing angles; and 2.) to
check if the relations between selected physical parameters are the same for the radio quasars
and galaxies.
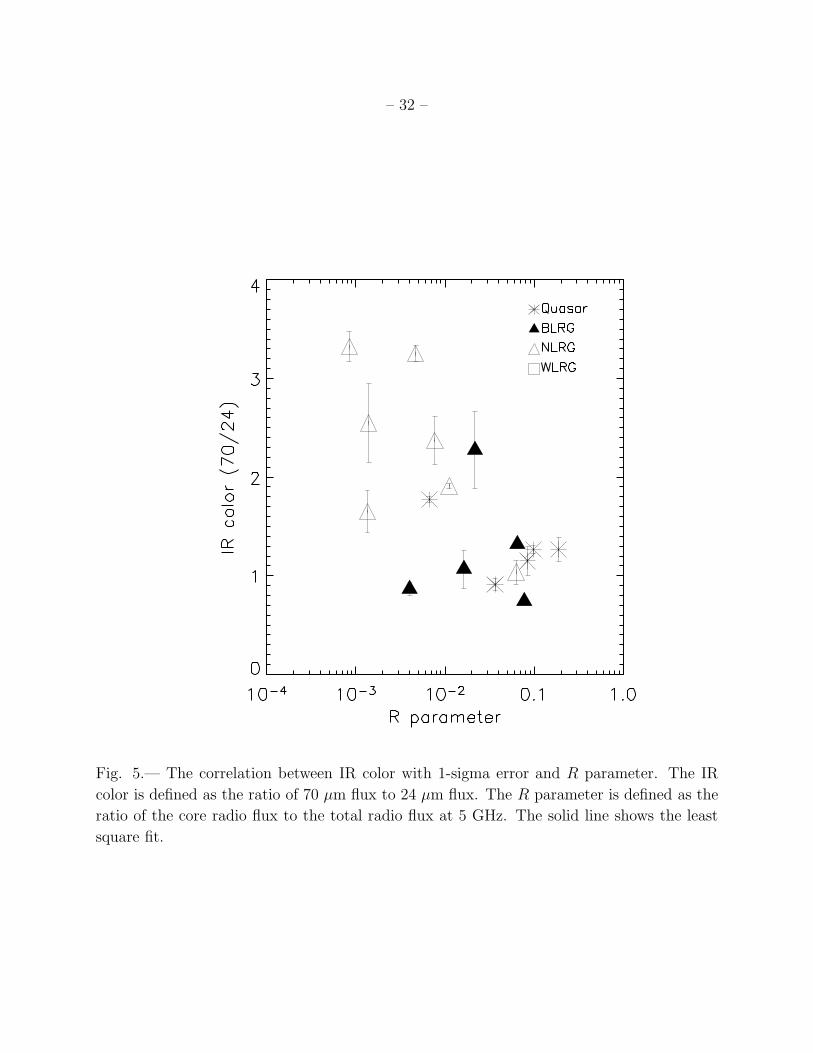
4.2.1. IR Color vs. R Parameter
Because of beaming, the emission of the radio core should be orientation-dependent.
Thus, the radio compactness, the R parameter, can be used to indicate the viewing angle
with respect to the orientation of the radio jet (Orr & Browne 1982). Here we define R =
F5c/F5t, where F5c and F5t are the core and total radio fluxes at 5 GHz, respectively. R = 1
corresponds to the direction along the radio jet and the smaller R, the larger the viewing
angle (we assume the torus is perpendicular to the jet, so R is taken as an indication of the
viewing angle relative to the torus as well as the jet). We obtained from NED the total 5

– 11 –
GHz radio emission listed in Column (5) of Table 2 and Table 3, and from the literature
the radio core emission listed in Column (6) of Table 2 and Table 3. We plot the IR color
defined by F70/F24 as a function of the R parameter in Figure 5. In this figure, we do not
include sources with upper limits to their IR fluxes, nor the sources with possibly significant
non-thermal components or large star formation contributions (∼80% in Figure 3).
We find a trend that redder IR color corresponds to a smaller R parameter and different
emission-line types fall in different regions in the plot, qualitatively consistent with the
prediction of the unification model. The overlapping between different emission-line types
of source in the plot is possibly because the R parameter depends on other characteristics
beside the viewing angle (Orr & Browne 1982), such as the core Lorentz factor, and because
intrinsic dispersion in the radio core and lobe emission causes dispersion in the R parameter
(Lonsdale & Barthel 1987). The least square fit to the relation in Figure 5 is given by
F70/F24 = 0.35 − 0.74Log(R). The corresponding Kendall-Tau test result given in Table 4
indicates a 96% probability of a significant correlation. The observed range of IR color of a
factor of ∼ 2.5 indicates that optical depth effects are still significant at 24 µm in the typical
torus in an FR II radio galaxy. In contrast, Heckman et al. (1994) compare 60 µm fluxes
between narrow line AGN and broad line AGN and found that they were almost the same,
suggesting the torus is optically thin at 60 µm.
For 3C 405, with the smallest R parameter in our sample, the absorbed power law fit
to the hard X-ray spectrum shows the hydrogen column density is NHI = 1023cm−2. Using
AV = 0.62 ∗ 10−21NHI (Savage & Mathis 1979) where AV is the visual extinction, we have
AV = 62. Taking AV /A70 = 364, A70 = 0.17, indicating the extinction is small at 70 µm
even when we view the AGN though the torus, in agreement with our conclusion from the
color behavior.
However, the extinctions at 24 µm and 70 µm should not be very different; A24/A70
is expected to be around 7. Therefore, to explain the systematic change in optical depth
between these two wavelengths may require a specific type of torus model. We hypothesize
that there is a temperature gradient along the radial direction of the torus; the inner part
of the toroidal disk is closer to the central heating source and hence is hotter than the outer
region. To maintain a gradient may require that the outer parts of the disk are heated
by energy reradiated from the inner parts, that the disk is warped or flared, or that it
has a porous (or cloudy) structure. Such a temperature gradient may explain the non-
single-blackbody IR SED of the AGN as shown in Figure 2. As a result, the 24 µm flux is
predominatedly emitted by the dust in the inner torus, while 70 µm emission is mainly from
the outer region. If the density of the toroidal disk drops with distance from the central
region, then the optical depth to the 24µm emission from the inner region could be large

– 12 –
while it is still small to a significant portion of the 70 µm emission from the outer region.
As can be seen in the diagnostic diagram in Figure 3, the reddening due to an edge-on
accretion torus could drive a pure AGN spectrum toward the star-forming region. These
results indicate that the FIR color is not a completely reliable indicator of star formation
activity; an AGN with a large torus inclination angle can also have a red FIR color. Two-
dimensional diagrams, such as IR color vs. emission-line-ratio may be useful to indicate the
level of star formation activity, though they are still not infallible.
Recently, Whysong & Antonucci (2004) argue that the lack of 12µm emission from some
FR I AGNs indicates that they lack a torus. However, if the torus has significant optical
depth at 24 µm, the 12 µm emission will be strongly suppressed and thus cannot be used to
estimate the intrinsic torus emission.
4.2.2. An Indication of the Torus Opening Angle
We return to Figure 4 to compare the IR and X-ray emission for quasars and radio
galaxies. Although the data points in Figure 4 are mainly for radio quasars, the various
kinds of radio galaxy follow the relation well. Since the IR emission is the reprocessing of
the emission from the accretion disk, especially optical and UV photons, the IR emission is
determined under the unified model by the central intrinsic emission and the torus struc-
ture. The torus structure must be very complicated. However, for simplicity, we assume it
is described only by the opening angle and that the light blocked by the torus is reprocessed
completely to IR emission, otherwise it can escape completely. Moreover, we assume the
emission of the torus is isotropic at 70 µm (we also show the behavior at 24 µm for compar-
ison). If the torus opening angle is constant, then the IR emission should be proportional to
the X-ray emission. The least square fit indicates the slope is 0.89 and 0.94 for 70 µm and
24 µm, respectively. Neither value is significantly different from unity. Based on the above
simple model, such a slope suggests that the torus opening angle does not change with the
activity level of the central engine. The radio power of our sources is greater than 1026.5
W Hz−1 at 178 MHz, so this result is consistent with the invariance of the opening angle
based on the quasar fraction (Willott et al. 2000). The result also indicates that most radio
galaxies and radio quasars possess a torus with similar structure, supporting the unification
model.

– 13 –
4.2.3. The Relation of IR emission and 178 MHz radio emission
The 70 µm emission and 178 MHz radio emission should also both be isotropic, so we
can use them to probe unification models for different types of radio source. The relation
of the K-corrected 70 µm flux density with the K-corrected 178 MHz flux density is shown
in Figure 6. For the radio, we base K-corrections on a power law SED with spectral index
of 0.8, while we used a spectral index of 1 at 70µm. The relation between 24 µm and 178
MHz emission is not shown because of the many upper limits to the 24 µm flux. Because the
178 MHz flux density is a defining parameter for the sample, Figure 6 includes all the radio
galaxy members (in comparison, for example, with Figure 4 which includes only a fraction).
The figure shows the distributions of radio quasars and radio galaxies are different. Radio
quasars except for 3C 380 are constrained in a tight correlation with an S value of 3× 10⁻³
by the Kendall Tau test. The solid line is the least square fit to the radio quasars excluding
3C 380 (See Section 3.2); the dashed lines are the 3-sigma bounds to the relation indicated
by the solid line.
Again, 3C 321 is above the 3-sigma bounds. Its behavior may be due to powerful
star formation activity triggered by a merger (see Section 4.1.3). Three additional galaxies
close to the 3-sigma high limit (3C 293, 3C 403 and 3C 459) may also have excess IR
emission powered by star formation. Nearly one-third of the radio galaxies are below the
region between the two dashed lines. Except for 3C 405, PicA, 3C 218 and 3C 348, the
FIR underluminous sources do not show larger radio fluxes compared with radio quasars,
so we cannot attribute the behavior in Figure 6 to selection bias. Since these galaxies are
underluminous at 70 µm, we cannot account for their behavior by an additional FIR source
such as star formation. We conclude that the simple unification model works less well for
the galaxies in the sample than for the quasars; it appears to predict the properties of some
galaxies but not others.
We have examined the FIR underluminous galaxies individually to see if we can un-
derstand why they depart from the simple unification model prediction. We look for expla-
nations in terms of their having a weaker nuclear engine, since the FIR emission is a good
indicator of the nuclear accretion power, or of their having higher radio emission because of
a special environment where radio emission is easily generated (Barthel et al. 1996; Haas et
al. 2004).
3C 388: Based on the relation of the optical core luminosity and radio core emission,
Chiaberge et al. (2000) argue that 3C 388 has a FR I nucleus, i.e., weaker than for classic
FR II galaxies.
3C 348: The radio morphology of 3C 348 is neither like FR I nor FR II. It is better

– 14 –
classified as an intermediate type radio source. Thus, we may speculate 3C 348 has a
relatively weaker nucleus with respect to normal FR II galaxies.
We have not found a good explanation for the behavior of the remaining galaxies.
Their environments are not different from the normal FIR luminous sources. Barthel et
al. (1996) find that sources in X-ray clusters show higher radio-to-infrared ratios than non-
cluster galaxies. This may be due to the upper-limit measurements of IR fluxes by IRAS,
for example, 3C 61.1 and 3C 315 are now detected by MIPS and their ratios can reach 2.9
and 2.75 respectively and therefore only one source in the sample of cluster galaxies shows
a significantly higher ratio than for field galaxies. No direct evidence indicates that the
remaining FIR underluminous sources have weaker nuclei. It may be necessary to modify
the simple unification model to explain them. For example, there may be a large range of
optical depths at 70µm; the weakly emitting galaxies could then be significantly obscured.
4.3. Compact Steep Spectrum Sources
Compact Steep Spectrum (CSS) and Gigahertz-Peaked Spectrum (GPS) radio sources
have similar radio outputs to other radio sources, but are substantially more compact, 1
to 20kpc. As discussed by O’Dea (1998), IR observations can distinguish a number of
hypotheses regarding these objects, most notably whether they are frustrated large-scale
sources due to a dense interstellar medium that absorbs the energy of the radio-emitting jets.
This absorbed energy would be expected to emerge in the FIR. A number of searches have
failed to find any effect of the type predicted by the frustrated source model (Heckman 1994;
Fanti et al. 2000). Because the FIR detection limits available to these studies were generally
inadequate for measurement of single galaxies, they co-added signals from many galaxies to
achieve an average emission level. The levels from the CSS/GPS and control samples are
similar, although the significance level of the comparisons is only modest. The comparisons
are also subject to uncertainty due to the necessity of stacking detections for higher statistical
significance: a few extreme sources can dominate the results. Another probe of these sources
is to determine the absorption and hence the density of the surrounding interstellar medium.
Pihlstrom et al. (2003) report HI observations that show an increase in ISM density with
decreasing radio size. This behavior is qualitatively consistent with the frustrated source
model, but Pihlstrom et al. (2003) show that the ISM density is probably inadequate to
confine the jets, unless the H2/HI ratio is much higher than normal. Fanti et al. (2000) give
additional arguments against the frustrated source model. Our data permit another test of
the frustrated source model, based on IR data with enough sensitivity to detect individual
galaxies.

– 15 –
We identify six CSS sources whose radio sizes are smaller than 20 kpc in our sample. The
comparision sample consists of large scale sources in the redshift range of the CSS sample,
from 0.27 to 1.4. Figure 7 plots the linear radio size and IR luminosity. The radio size
ranges from 2 kpc to 400 kpc and IR luminosity is from 1010 L⊙ to 1014 L⊙. No correlation is
indicated. We conclude that the CSS sources do not show significantly different FIR output
from the large scale radio sources, consistent with the result of IRAS (Heckman et al. 1994)
and ISO (Fanti et al. 2000). Hes, Barthel, & Hoekstra (1995) find that CSS sources are
IR-brighter. Their result may be caused by the selection bias that CSS sources in their
sample are at high-redshift and thus high luminosity. In addition, the lack of an additional
IR luminosity component argues against the proposal that these galaxies might be sites of
strong star formation induced by the interaction between a jet and ambient matter (Baker
et al. 2002).
5. Conclusions
In this paper, we present MIPS observations of steep spectrum radio quasars and FR II
radio galaxies, and combine them with the sample detected by IRAS and ISO. We discuss
the nature of the IR emission in this combined sample and its implications for the unification
model. The main results are:
(1) The IR emission of most sources is thermal. The thermal IR emission of most sources
is dominated by dust heated by the AGN.
(2) The simple unification model predicts the properties of the radio quasars and some
radio galaxies well. However the properties of some FIR underluminous galaxies may be
inconsistent with a pure unification model in which there are no orientation-independent
intrinsic differences among these sources.
(3) The behavior of the 70µm/24µm color with radio compactness is consistent with the
suggestion that a torus that has significant optical depth at 24 µm surrounds the nuclei of
the FR II radio galaxies.
(4) The CSS sources do not show additional IR emission, arguing against the proposals
that these sources reside in extremely dense regions or that they are associated with strong
star-forming activity.
We thank John Moustakas for helpful discussions and the anonymous referee for detailed
comments. This research has made use of the NASA/IPAC Extragalactic Database (NED)
which is operated by the Jet Propulsion Laboratory, California Institute of Technology, under

– 16 –
contract with the National Aeronautics and Space Administration. This work was supported
by NASA through Contract Number 960785 issued by JPL/Caltech.

– 17 –
REFERENCES
Akujor, C. E. & Garrington, S. T. 1995, A&AS, 112, 235
Akujor, C. E., Spencer, R. E., Zhang, F. J., Davis, R. J., Browne, I. W. A. & Fanti, C. 1991,
MNRAS, 250, 215
Allington-Smith, J. R. 1984, MNRAS, 210, 611
Andreani, P., Fosbury, R. A., E., van Bemmel, I., & Freudling, W. 2002, A&A, 381, 389
Barthel, P. D., 1989, ApJ, 336, 606
Barthel, P. D. & Arnaud, K. A. 1996, MNRAS, 283, L45
Baker, J. C., Hunstead, R. W., Athreya, R. M., Barthel, P. D., de Silva, E., Lehnert, M. D.
& SaundersR. D. E. 2002, ApJ, 568, 592
Baldwin, J. A., Phillips, M. M. & Terlevich, R. 1981, PASP, 93, 5
Biretta, J. A., Burrows, C. J., Holtzman, J. A., et al., 1996, In: Biretta J. A. (ed.) Wide
Field and Planetary Camera 2 Instrument Handbook. STScI, Baltimore
Bloom, S. D., Marscher, A. P., Gear, W. K., Terasranta, H., Valtaoja, E., Aller, H. D. &
Aller, M. F. 1994, AJ, 108, 398
Boroson, T. A. & Oke, J. B., 1984, ApJ, 281, 535
Chiaberge, M., Capetti, A., Celotti, A. 2000, A&A, 355, 873
Corbin, M. R. & Boroson, T. A. 1996, ApJS, 107, 69
de Grijp, M. H., K., Keel, W. C., Miley, G. K., Goudfrooij, P. & Lub, J. 1992, A&AS, 96,
389
de Vaucouleurs, G., de Vaucouleurs, A., Corwin, H. G., Jr., Buta, R. J., Paturel, G. &
Fouque, P. 1991, S&T, 82Q, 621D
Fanti, C., Fanti, R., Parma, P., Venturi, T., Schilizzi, R. T., et al. 1989, A&A, 217, 44
Fanti, C., Pozzi, F., Fanti, R., et al., 2000, A&A, 358, 499
Fernini, I., Burns, J. O. & Perley, R. A. 1997, AJ, 114, 2292
Fanaroff, B. L. & Riley, J. M. 1974, MNRAS, 167, 31

– 18 –
Gavazzi, G., Perola, G. C., 1978, A&A, 66, 407
Gelderman, R. & Whittle, M. 1994, ApJS, 91, 491
Giovannini, G., Feretti L., Gregorini L. & Parma P. 1988, A&A, 199, 73
Golombek, D., Miley, G. K., & Neugebauer, G. 1988, 1988, AJ, 95, 26
Gordon, K. D., et al. 2004a, PASP, submitted
Gordon, K. D., et al. 2004b, Proc. SPIE, in press
Granato G. L. & Danese, L. 1994, MNRAS, 268, 235
Grandi, S. A. & Osterbrock, D. E. 1978, ApJ, 220, 783
Haas, M., Chini, R., Meisenheimer, K., Stickel, M., Lemke, D., Klaas, U., Kreysa, E. 1998,
ApJL, 503, L109
Haas, M., Mueller, S. A., H., Bertoldi, F., Chini, R., Egner, S., Freudling, W., Klaas, U.,
Krause, O., Lemke, D., Meisenheimer, K., Siebenmorgen, R., van Bemmel, I. 2004,
astoph/0406111
Heckman, T. M., O’Dea, C. P., Baum, S. A., & Laurikainen, E. 1994, ApJ, 428, 65
Hes, R., Barthel, P. D. & Hoekstra, H. 1995, A&A, 303, 8
Hough, D. H. & Readhead, A. C. S. 1989, AJ, 98, 1208
Kellermann, K. I., Sramek, R., Schmidt, M., Shaffer, D. B. & Green, R. 1989, AJ, 98, 1195
Kewley, L. J., Heisler, C. A., Dopita, M. A. & Lumsden, S. 2001, ApJS, 132, 37
Lawrence, C. R., Zucker, J. R., Readhead, A. C. S., Unwin, S. C., Pearson, T. J. & Xu, W.
1996, ApJS, 107, 541
Lonsdale, C. J. & Barthel, P. D. 1987, AJ, 94, 1487
Nenkova, M., Ivezic, Z. & Elitzur, M 2002, ApJ, 570, 9
Neugebauer, G., Miley, G. K., Soifer, B. T., & Clegg, P. E. 1986, ApJ, 308, 815
Nilsson, K., Valtonen, M. J., Kotilainen, J., Jaakkola, T., 1993, ApJ, 413, 453
O’Dea, C. P. 1998, PASP, 110, 493

– 19 –
Orr, M. J. L. & Browne, I. W. A. 1982, MNRAS, 200, 1067
Osterbrock, D. E. & de Robertis, M. M. 1985, PASP, 97, 1129
Pence, W., 1976, ApJ, 203, 39
Pier, A. P. & Krolik, J. H. 1993, ApJ, 418, 673
Pihlstrom, Y. M., Conway, J. E., & Vermeulen, R. C. 2003, A&A, 404, 871
Polatidis, A. G. & Wilkinson, P. N. 1998, MNRAS, 294, 327
Polletta, M., Courvoisier, T. J., L., Hooper, E. J., & Wilkes, B. J. 2000, A&A, 362, 715
Rieke, G. H., Young, E. T., Engelbracht, C., et al. 2004, ApJS, 154, 25
Roche, N., Eales, S. A. 2000, MNRAS, 317, 120
Rowan-Robinson, M. 2000, MNRAS, 316, 885
Saikia, D. J., Salter, C. J. & Muxlow, T. W., B. 1987, MNRAS, 224, 911
Sandage, A.; Veron, P. & Wyndham, J. D. 1965, ApJ, 142, 1307
Sanders, D. B., Soifer, B. T., Elias, J. H., Madore, B. F., Matthews, K., Neugebauer, G.,
Scoville, N. Z. 1988, ApJ, 325, 74
Savage, B. D. & Mathis, J. S. 1979, ARA&A, 17, 73
Schmidt, M. 1965, ApJ, 141, 1
Schneider, G. & Stobie, E. 2002, ASP Conf. Ser. 281, Astronomical Data Analysis Software
and System XI, ed. D. A. Bohlender , D. Durand & T. H. Handley (San Francisco:
ASP), p. 382
Smith, E. P. & Heckman, T. M., 1989, ApJ, 69, 365
Solorzano-Inarrea, C. & Tadhunter, C. N. 2003, MNRAS, 340, 705
Spinrad, H., Marr, J., Aguilar, L. & Djorgovski, S. 1985, PASP, 97, 932
Siebenmorgen, R., Freudling, W., Krugel, E. & Haas, M. 2004, A&A, 421, 129
Simpson, C., Ward, M., Clements, D. L., Rawlings, S. 1996, MNRAS, 281, 509

– 20 –
Tadhunter, C. N., Morganti, R., di Serego-Alighieri, S., Fosbury, R. A. E. & Danziger, I. J.
1993, MNRAS, 263, 999
Tadhunter, C. N., Metz, S. & Robinson, A. 1994, MNRAS, 268, 989
Tadhunter, C. N., Dickson, R. C., Shaw, M. A. 1996, MNRAS, 281, 591
Urry, C. M., & Padovani, P. 1995, PASP, 107, 803
van Bemmel, I. M., Barthel, P. D. & Yun, M. S. 1998, A&A, 334, 799
van Bemmel, I., Barthel, P. 2001, A&A, 379, L21
van Bemmel, I., Dullemond, C. P. 2003, A&A, 404, 1
Veilleux, S. & Osterbrock, D. E. 1987, ApJS, 63, 295
Wilkinson P. N., Tzioumis A. K., Akujor C. E., Benson J. M., Walker R. C., Simon R. S.
1990, in Zensus J. A., Pearson T. J., eds, Parsec Scale Radio-Jets. Cambridge Univ.
Press, Cambridge, p. 152
Willott, C. J., Rawlings, S., Blundell, K. M. & Lacy, M. 2000, MNRAS, 316, 449
Whysong, D. & Antonucci, R. 2004, ApJ, 602, 116
Zirbel, E. L. & Baum, S. A. 1995, ApJ, 448, 521
This preprint was prepared with the AAS LATEX macros v5.2.

– 21 –
Table 1. MIPS Measurements of Steep Spectrum Radio Sources
source Integ. time(sec) 24 µm(mJy) Integ. time(sec) 70µm(mJy)
(1) (2) (3) (4) (5)
3C48 48.2 131.0 ± 0.09 37.7 696 ± 8
3C61.1 48.2 5.0 ± 0.07 125.8 30 ± 4
PicA 165.7 130 ± 0.04 125.8 171 ± 5
3C171 165.7 7.5 ± 0.05 125.8 19 ± 3
3C173.1 165.7 0.51 ± 0.06 125.8 1.7 ± 2
3C218 165.7 8.6 ± 0.06 125.8 118 ± 5
3C219 165.7 12.7 ± 0.07 125.8 29 ± 5
3C236 165.7 17.4 ± 0.07 125.8 50 ± 3
3C249.1 48.2 45.0 ± 0.07 125.8 57 ± 2
3C277.1 48.2 19.8 ± 0.07 125.8 20 ± 2
3C284 165.7 24.6 ± 0.07 125.8 80 ± 2
3C303.1 165.7 7.6 ± 0.05 125.8 27 ± 15
3C315 165.7 1.9 ± 0.05 125.8 28 ± 4
3C323.1 48.2 33.0 ± 0.08 125.8 30 ± 2
3C327 165.7 245 ± 0.07 125.8 468 ± 7
3C348 165.7 0.25 ± 0.07 125.8 28 ± 5
3C349 165.7 ≤ 0.15 125.8 7 ± 3
3C351 48.2 103 ± 0.07 125.8 182 ± 3
3C381 165.7 46 ± 0.05 125.8 40 ± 3
3C388 165.7 2.34 ± 0.05 125.8 16 ± 3
Note. — Nominal photon-noise errors are given to show the intrinsic signal to
noise ratio for the measurements. Systematic calibration uncertainties are discussed
in the text. The upper limit is at 3σ significance. The integration time at 160µm
was 84 seconds per source. Sources detected at this wavelength are: 3C48, 1147 ±
93; PicA, 475 ± 40 mJy; 3C218, 211 ± 31 mJy; 3C327, 425 ± 38 mJy; 3C351, 182
± 21 mJy

– 22 –
Table 2. Other Properties of the MIPS Sample
source MB Type z F5t F5c Ref Size ΓX X-ray Line Ref
(mJy) (mJy) (kpc) ratio
(1) (2) (3) (4) (5) (6) (7) (8) (9) (10) (11) (12)
3C48 -26.5 Q 0.367 5,330 ± 70 896 A91 2.4 2.12 2.39 -0.013 GW94
3C61.1 -21.3 NLRG 0.186 1,900 ± 90 2.64 ZB95 535 0.47 La96
PicA -19.5 BLRG 0.035 15,500 ± 470 1004 ZB95 281 1.69 8.66 0.62 Ta93
3C171 -22.0 NLRG 0.238 1,210 ± 60 1.68 ZB95 31 0.79 ST03
3C173.1 -22.4 WLRG 0.292 770 ± 120 7.21 ZB95 244
3C218 -22.4 NLRG 0.054 13,100 245 ZB95 1.79 0.224 -0.125 Sm96
3C219 -22.5 BLRG 0.174 2,270 ± 110 49.2 ZB95 441 1.58 1.62 0.32 La96
3C236 -21.6 WLRG 0.098 1,330 ± 130 141 ZB95 3956 0.57 La96
3C249.1 -26.8 Q 0.311 780 ± 40 76 K89 89 1.77 1.49 0.97 BO84
3C277.1 -24.7 Q 0.320 1,040 ± 50 6.5 1.63 0.691 0.20 GW94
3C284 -21.5 NLRG 0.239 685 ± 60 3.2 Gi88 635
3C303.1 -22.0 NLRG 0.267 457 ± 50 <4.7 ZB95 9.6
3C315 -21.4 NLRG 0.108 1,260 ± 60 <150 Gi88 257
3C323.1 -24.3 Q 0.264 880 32 K89 267 0.71 BO84
3C327 -21.9 NLRG 0.103 2,740 ± 140 30.4 ZB95 369 1.22 de92
3C348 -22.2 NLRG 0.154 11,800 ± 590 10.2 ZB95 286
3C349 -21.1 NLRG 0.205 1,130 ± 60 25.0 ZB95 257
3C351 -27.7 Q 0.371 1,200 ± 60 8.0 K89 277 1.69 1.36 -0.016 CB96
3C381 -22.0 BLRG 0.160 1,280 ± 50 5.12 ZB95 177 1.26 GO78
3C388 -23.1 WLRG 0.090 1,760 ± 40 59.0 ZB95 48 0.49 La96
Note. — Column (3): The emission-line type, ′NLRG′=Narrow line radio galaxy, ′BLRG′=Broad line radio galaxy,′WLRG′=weak line radio galaxy, ′Q′=Quasar. Column (5): The 5 GHz flux density in units of mJy. Column(6): The
radio core flux at 5 GHz in the units of mJy. Column (7): References for Column (6): A91 - Akujor et al. (1991);
Gi88 - Giovannini et al. (1988); K89 - Kellermann et al. (1989); ZB95- Zirbel & Baum (1995). Column (8): The linear
radio size in units of kpc. The references for radio sizes are Akujor et al. (1995), Allington-Smith (1984), Gavazzi et
al. (1978) and Nilsson et al. (1993). Column (9): The spectral index of hard X-ray emission over 2-10 kev in the
rest frame, assuming a power law SED. Column (10): The rest-frame 2-10 kev absorption-corrected X-ray flux in the
central 2.5 ′′ region. Units are 10−12ergs s−1 cm−2. Column (11): The logarithm of the ratio of the intensity of [O
III]λ5007 to Hβ. Column (12): References for the Column (11): BO84 - Boroson & Oke (1984); CB96 - Corbin &
Boroson (1996); de92 - de Grijp et al. (1992); Fa89 - Fanti et al. (1989); Fe97 - Fernini et al. (1997); GO78 - Grandi
& Osterbrock (1978); GW94 - Gelderman & Whittle (1994); H89 - Hough et al. (1989); La96 - Lawrence et al. (1996);
S87 - Saikia et al. (1987); Sm96 - Simpson et al. 1996; ST03 - Solorzano-Inarrea & Tadhunter (2003); Ta93 - Tadhunter
et al. (1993); V98 - van Bemmel et al. (1998)
–23
–
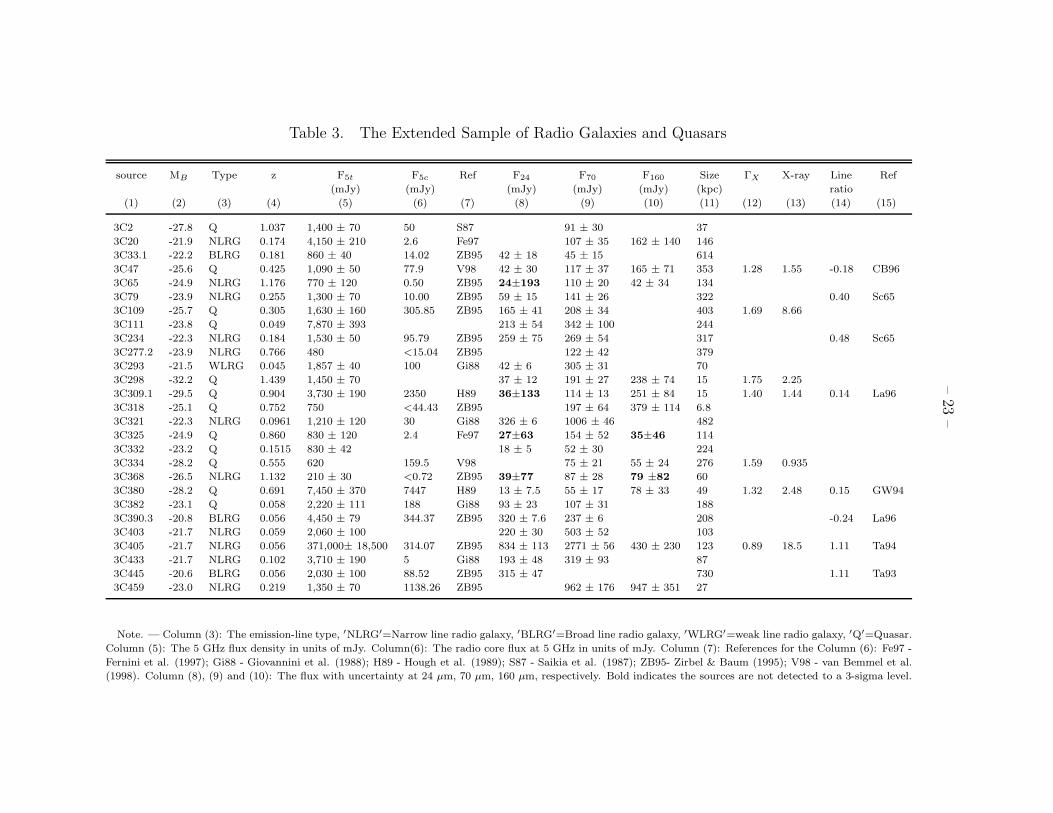
Table 3. The Extended Sample of Radio Galaxies and Quasars
source MB Type z F5t F5c Ref F24 F70 F160 Size ΓX X-ray Line Ref
(mJy) (mJy) (mJy) (mJy) (mJy) (kpc) ratio
(1) (2) (3) (4) (5) (6) (7) (8) (9) (10) (11) (12) (13) (14) (15)
3C2 -27.8 Q 1.037 1,400 ± 70 50 S87 91 ± 30 37
3C20 -21.9 NLRG 0.174 4,150 ± 210 2.6 Fe97 107 ± 35 162 ± 140 146
3C33.1 -22.2 BLRG 0.181 860 ± 40 14.02 ZB95 42 ± 18 45 ± 15 614
3C47 -25.6 Q 0.425 1,090 ± 50 77.9 V98 42 ± 30 117 ± 37 165 ± 71 353 1.28 1.55 -0.18 CB96
3C65 -24.9 NLRG 1.176 770 ± 120 0.50 ZB95 24±193 110 ± 20 42 ± 34 134
3C79 -23.9 NLRG 0.255 1,300 ± 70 10.00 ZB95 59 ± 15 141 ± 26 322 0.40 Sc65
3C109 -25.7 Q 0.305 1,630 ± 160 305.85 ZB95 165 ± 41 208 ± 34 403 1.69 8.66
3C111 -23.8 Q 0.049 7,870 ± 393 213 ± 54 342 ± 100 244
3C234 -22.3 NLRG 0.184 1,530 ± 50 95.79 ZB95 259 ± 75 269 ± 54 317 0.48 Sc65
3C277.2 -23.9 NLRG 0.766 480 <15.04 ZB95 122 ± 42 379
3C293 -21.5 WLRG 0.045 1,857 ± 40 100 Gi88 42 ± 6 305 ± 31 70
3C298 -32.2 Q 1.439 1,450 ± 70 37 ± 12 191 ± 27 238 ± 74 15 1.75 2.25
3C309.1 -29.5 Q 0.904 3,730 ± 190 2350 H89 36±133 114 ± 13 251 ± 84 15 1.40 1.44 0.14 La96
3C318 -25.1 Q 0.752 750 <44.43 ZB95 197 ± 64 379 ± 114 6.8
3C321 -22.3 NLRG 0.0961 1,210 ± 120 30 Gi88 326 ± 6 1006 ± 46 482
3C325 -24.9 Q 0.860 830 ± 120 2.4 Fe97 27±63 154 ± 52 35±46 114
3C332 -23.2 Q 0.1515 830 ± 42 18 ± 5 52 ± 30 224
3C334 -28.2 Q 0.555 620 159.5 V98 75 ± 21 55 ± 24 276 1.59 0.935
3C368 -26.5 NLRG 1.132 210 ± 30 <0.72 ZB95 39±77 87 ± 28 79 ±82 60
3C380 -28.2 Q 0.691 7,450 ± 370 7447 H89 13 ± 7.5 55 ± 17 78 ± 33 49 1.32 2.48 0.15 GW94
3C382 -23.1 Q 0.058 2,220 ± 111 188 Gi88 93 ± 23 107 ± 31 188
3C390.3 -20.8 BLRG 0.056 4,450 ± 79 344.37 ZB95 320 ± 7.6 237 ± 6 208 -0.24 La96
3C403 -21.7 NLRG 0.059 2,060 ± 100 220 ± 30 503 ± 52 103
3C405 -21.7 NLRG 0.056 371,000± 18,500 314.07 ZB95 834 ± 113 2771 ± 56 430 ± 230 123 0.89 18.5 1.11 Ta94
3C433 -21.7 NLRG 0.102 3,710 ± 190 5 Gi88 193 ± 48 319 ± 93 87
3C445 -20.6 BLRG 0.056 2,030 ± 100 88.52 ZB95 315 ± 47 730 1.11 Ta93
3C459 -23.0 NLRG 0.219 1,350 ± 70 1138.26 ZB95 962 ± 176 947 ± 351 27
Note. — Column (3): The emission-line type, ′NLRG′=Narrow line radio galaxy, ′BLRG′=Broad line radio galaxy, ′WLRG′=weak line radio galaxy, ′Q′=Quasar.
Column (5): The 5 GHz flux density in units of mJy. Column(6): The radio core flux at 5 GHz in units of mJy. Column (7): References for the Column (6): Fe97 -
Fernini et al. (1997); Gi88 - Giovannini et al. (1988); H89 - Hough et al. (1989); S87 - Saikia et al. (1987); ZB95- Zirbel & Baum (1995); V98 - van Bemmel et al.
(1998). Column (8), (9) and (10): The flux with uncertainty at 24 µm, 70 µm, 160 µm, respectively. Bold indicates the sources are not detected to a 3-sigma level.

–24
–Column (11): The linear radio size in units of kpc. The references for radio sizes are Akujor et al. (1995), Allington-Smith (1984), Gavazzi et al. (1978) and Nilsson
et al. (1993). Column (12): The spectral index of the hard X-ray emission at 2-10 kev in the rest frame, assuming a power law SED. Column (13): The rest-frame
2-10 kev absorption-corrected X-ray flux in the central 2.5 ′′ region. Units are 10−12ergs s−1 cm−2. Column (14): The logarithm of the ratio of the intensity of [O
III]λ5007 to Hβ. Column (15): References for Column (14): CB96 - Corbin & Boroson (1996); Fa89 - Fanti et al. (1989); GW94 - Gelderman & Whittle (1994);
La96 - Lawrence et al. (1996); Sc65 - Schmidt (1965); Ta93 - Tadhunter et al. (1993); Ta94 - Tadhunter et al. (1994).

– 25 –
Table 4. Kendall Tau test
relation rlum Slum rflux Sflux
X-ray vs 70 µm – – 0.32 0.09
X-ray vs 24 µm – – 0.37 0.05
X-ray vs radio core – – 0.30 0.14
IR color vs R parameter – – -0.37 0.04
178MHz vs 70 µm (all) – – 0.25 0.02
178MHz vs 70 µm (quasars) – – 0.68 0.0002
Radio size vs 24 µm -0.01 0.96 – –
Radio size vs 70 µm -0.11 0.52 – –
Note. — The r value indicates the rank correlation coefficient
and the S value indicates the two-sided significance of the deviation
from zero.

– 26 –
Fig. 1.— The distributions of sources in the plane of the 178 MHz flux versus redshift (top
panel) and 178 MHz flux versus spectral index α (bottom panel).

– 27 –
Fig. 2.—

– 28 –
Fig. 2.—

– 29 –
Fig. 2.— The spectral energy distributions of all sources. The 1-sigma error is used in the
plot. The crosses are the radio and millimeter photometry data from NED. The solid line is
the parabola model for the synchrotron emission. The open circle, open triangle, and filled
triangle denote MIPS, IRAS and ISO data, respectively. The dotted line for radio galaxies
is the template of stellar light for a normal elliptical galaxy, normalized to the apparent
B magnitude. ′Quasar′, ′BLRG′, ′NLRG′ and ′WLRG′ indicate Quasar, broad line radio
galaxies, narrow line radio galaxies and weak line radio galaxies, respectively.

– 30 –
Fig. 3.— IR color versus emission-line ratio. The dashed line is a hypothetical mixing line
on which the AGN fraction is labelled. This figure is from Kewley et al. (2001), with our
sources added. The open triangles denote our sources. Filled circles, unfilled circles and
crosses denote AGNs, ambiguous classification and starbursts, respectively in Kewley et al.
(2001). Note that Section 4.2.1 shows that the torus may have significant optical depth at
24 µm and thus the IR color underestimates the fraction of AGN contributions for Type II
AGN.

– 31 –
Fig. 4.— The correlation of K-corrected 70 µm flux density with 1-sigma error, K-corrected
24 µm flux density with 1-sigma error and central K-corrected hard X-ray flux corrected for
absorption.
– 32 –
Fig. 5.— The correlation between IR color with 1-sigma error and R parameter. The IR
color is defined as the ratio of 70 µm flux to 24 µm flux. The R parameter is defined as the
ratio of the core radio flux to the total radio flux at 5 GHz. The solid line shows the least
square fit.

– 33 –
Fig. 6.— The relation of the K-corrected 70 µm emission with 1-sigma error and K-corrected
radio emission at 178 MHz. The solid line is the least square fit to the radio quasars, excluding
3C 380 with substantial contribution by non-thermal core ouput (See Section 3.2), unlike
those of the other quasars. The two dashed lines are the 3-sigma scatter of the relation
indicated by the solid line.

– 34 –
Fig. 7.— The plot of linear radio size vs. K-corrected FIR luminosity with 1-sigma error.