fannie mae q1 2016 10-q
TRANSCRIPT

UNITED STATES SECURITIES AND EXCHANGE COMMISSIONWashington, D.C. 20549
Form 10-Q QUARTERLY REPORT PURSUANT TO SECTION 13 OR 15(d) OF THE SECURITIES
EXCHANGE ACT OF 1934
For the quarterly period ended March 31, 2016
OR
TRANSITION REPORT PURSUANT TO SECTION 13 OR 15(d) OF THE SECURITIES EXCHANGE ACT OF 1934
For the transition period from to
Commission File No.: 0-50231
Federal National Mortgage Association (Exact name of registrant as specified in its charter)
Fannie Mae
Federally chartered corporation 52-0883107(State or other jurisdiction of
incorporation or organization)(I.R.S. Employer
Identification No.)
3900 Wisconsin Avenue, NWWashington, DC
20016(Zip Code)
(Address of principal executive offices)
Registrant’s telephone number, including area code:(202) 752-7000
Indicate by check mark whether the registrant (1) has filed all reports required to be filed by Section 13 or 15(d) of the Securities Exchange Act of 1934 during the preceding 12 months (or for such shorter period that the registrant was required to file such reports), and (2) has been subject to such filing requirements for the past 90 days. Yes No
Indicate by check mark whether the registrant has submitted electronically and posted on its corporate Web site, if any, every Interactive Data File required to be submitted and posted pursuant to Rule 405 of Regulation S-T (§ 232.405 of this chapter) during the preceding 12 months (or for such shorter period that the registrant was required to submit and post such files). Yes No
Indicate by check mark whether the registrant is a large accelerated filer, an accelerated filer, a non-accelerated filer, or a smaller reporting company. See the definitions of “large accelerated filer,” “accelerated filer” and “smaller reporting company” in Rule 12b-2 of the Exchange Act.
Large accelerated filer Accelerated filer Non-accelerated filer (Do not check if a smaller reporting company) Smaller reporting company
Indicate by check mark whether the registrant is a shell company (as defined in Rule 12b-2 of the Exchange Act). Yes No
As of March 31, 2016, there were 1,158,082,750 shares of common stock of the registrant outstanding.

i
TABLE OF CONTENTS
PagePART I—Financial Information . . . . . . . . . . . . . . . . . . . . . . . . . . . . . . . . . . . . . . . . . . . . . . . . . . . . . . . . . . . . . . . . . .Item 1. Financial Statements
Condensed Consolidated Balance Sheets . . . . . . . . . . . . . . . . . . . . . . . . . . . . . . . . . . . . . . . . . . . . . . . . . . . .Condensed Consolidated Statements of Operations and Comprehensive Income . . . . . . . . . . . . . . . . . . . . .Condensed Consolidated Statements of Cash Flows . . . . . . . . . . . . . . . . . . . . . . . . . . . . . . . . . . . . . . . . . . . .
Note 1—Summary of Significant Accounting Policies. . . . . . . . . . . . . . . . . . . . . . . . . . . . . . . . . . . . . . . . .Note 2—Consolidations and Transfers of Financial Assets . . . . . . . . . . . . . . . . . . . . . . . . . . . . . . . . . . . . .Note 3—Mortgage Loans . . . . . . . . . . . . . . . . . . . . . . . . . . . . . . . . . . . . . . . . . . . . . . . . . . . . . . . . . . . . . . .Note 4—Allowance for Loan Losses . . . . . . . . . . . . . . . . . . . . . . . . . . . . . . . . . . . . . . . . . . . . . . . . . . . . . .Note 5—Investments in Securities . . . . . . . . . . . . . . . . . . . . . . . . . . . . . . . . . . . . . . . . . . . . . . . . . . . . . . . .Note 6—Financial Guarantees . . . . . . . . . . . . . . . . . . . . . . . . . . . . . . . . . . . . . . . . . . . . . . . . . . . . . . . . . . .Note 7—Acquired Property, Net . . . . . . . . . . . . . . . . . . . . . . . . . . . . . . . . . . . . . . . . . . . . . . . . . . . . . . . . . .Note 8—Short-Term Borrowings and Long-Term Debt . . . . . . . . . . . . . . . . . . . . . . . . . . . . . . . . . . . . . . . .Note 9—Derivative Instruments . . . . . . . . . . . . . . . . . . . . . . . . . . . . . . . . . . . . . . . . . . . . . . . . . . . . . . . . . .Note 10—Earnings Per Share . . . . . . . . . . . . . . . . . . . . . . . . . . . . . . . . . . . . . . . . . . . . . . . . . . . . . . . . . . . .Note 11—Segment Reporting . . . . . . . . . . . . . . . . . . . . . . . . . . . . . . . . . . . . . . . . . . . . . . . . . . . . . . . . . . . .Note 12—Equity . . . . . . . . . . . . . . . . . . . . . . . . . . . . . . . . . . . . . . . . . . . . . . . . . . . . . . . . . . . . . . . . . . . . . .Note 13—Concentrations of Credit Risk . . . . . . . . . . . . . . . . . . . . . . . . . . . . . . . . . . . . . . . . . . . . . . . . . . .Note 14—Netting Arrangements . . . . . . . . . . . . . . . . . . . . . . . . . . . . . . . . . . . . . . . . . . . . . . . . . . . . . . . . . .Note 15—Fair Value . . . . . . . . . . . . . . . . . . . . . . . . . . . . . . . . . . . . . . . . . . . . . . . . . . . . . . . . . . . . . . . . . . .Note 16—Commitments and Contingencies . . . . . . . . . . . . . . . . . . . . . . . . . . . . . . . . . . . . . . . . . . . . . . . . .
Item 2. Management’s Discussion and Analysis of Financial Condition and Results of Operations . . . . . . . . . . . . .Introduction . . . . . . . . . . . . . . . . . . . . . . . . . . . . . . . . . . . . . . . . . . . . . . . . . . . . . . . . . . . . . . . . . . . . . . . . . . .Executive Summary . . . . . . . . . . . . . . . . . . . . . . . . . . . . . . . . . . . . . . . . . . . . . . . . . . . . . . . . . . . . . . . . . . . . .Legislative and Regulatory Developments . . . . . . . . . . . . . . . . . . . . . . . . . . . . . . . . . . . . . . . . . . . . . . . . . . .Critical Accounting Policies and Estimates . . . . . . . . . . . . . . . . . . . . . . . . . . . . . . . . . . . . . . . . . . . . . . . . . . .Consolidated Results of Operations. . . . . . . . . . . . . . . . . . . . . . . . . . . . . . . . . . . . . . . . . . . . . . . . . . . . . . . . .Business Segment Results . . . . . . . . . . . . . . . . . . . . . . . . . . . . . . . . . . . . . . . . . . . . . . . . . . . . . . . . . . . . . . . .Consolidated Balance Sheet Analysis . . . . . . . . . . . . . . . . . . . . . . . . . . . . . . . . . . . . . . . . . . . . . . . . . . . . . . .Liquidity and Capital Management . . . . . . . . . . . . . . . . . . . . . . . . . . . . . . . . . . . . . . . . . . . . . . . . . . . . . . . . .Off-Balance Sheet Arrangements . . . . . . . . . . . . . . . . . . . . . . . . . . . . . . . . . . . . . . . . . . . . . . . . . . . . . . . . . .Risk Management . . . . . . . . . . . . . . . . . . . . . . . . . . . . . . . . . . . . . . . . . . . . . . . . . . . . . . . . . . . . . . . . . . . . . .Impact of Future Adoption of New Accounting Guidance . . . . . . . . . . . . . . . . . . . . . . . . . . . . . . . . . . . . . . .Forward-Looking Statements. . . . . . . . . . . . . . . . . . . . . . . . . . . . . . . . . . . . . . . . . . . . . . . . . . . . . . . . . . . . . .
Item 3. Quantitative and Qualitative Disclosures about Market Risk . . . . . . . . . . . . . . . . . . . . . . . . . . . . . . . . . . . . .Item 4. Controls and Procedures . . . . . . . . . . . . . . . . . . . . . . . . . . . . . . . . . . . . . . . . . . . . . . . . . . . . . . . . . . . . . . . . .PART II—Other Information . . . . . . . . . . . . . . . . . . . . . . . . . . . . . . . . . . . . . . . . . . . . . . . . . . . . . . . . . . . . . . . . . . . .Item 1. Legal Proceedings . . . . . . . . . . . . . . . . . . . . . . . . . . . . . . . . . . . . . . . . . . . . . . . . . . . . . . . . . . . . . . . . . . . . . .Item 1A. Risk Factors . . . . . . . . . . . . . . . . . . . . . . . . . . . . . . . . . . . . . . . . . . . . . . . . . . . . . . . . . . . . . . . . . . . . . . . . . . .Item 2. Unregistered Sales of Equity Securities and Use of Proceeds. . . . . . . . . . . . . . . . . . . . . . . . . . . . . . . . . . . . .Item 3. Defaults Upon Senior Securities . . . . . . . . . . . . . . . . . . . . . . . . . . . . . . . . . . . . . . . . . . . . . . . . . . . . . . . . . . .Item 4. Mine Safety Disclosures . . . . . . . . . . . . . . . . . . . . . . . . . . . . . . . . . . . . . . . . . . . . . . . . . . . . . . . . . . . . . . . . .Item 5. Other Information . . . . . . . . . . . . . . . . . . . . . . . . . . . . . . . . . . . . . . . . . . . . . . . . . . . . . . . . . . . . . . . . . . . . . .Item 6. Exhibits . . . . . . . . . . . . . . . . . . . . . . . . . . . . . . . . . . . . . . . . . . . . . . . . . . . . . . . . . . . . . . . . . . . . . . . . . . . . . .
1
666768697274798184858687909092939698
121112
13141423303237376262
123123126126127128129129129129

ii
MD&A TABLE REFERENCE
Table Description Page1 Credit Statistics, Single-Family Guaranty Book of Business . . . . . . . . . . . . . . . . . . . . . . . . . . . . . . . . . . . . . . 52 Single-Family Acquisitions Statistics . . . . . . . . . . . . . . . . . . . . . . . . . . . . . . . . . . . . . . . . . . . . . . . . . . . . . . . . 63 Summary of Condensed Consolidated Results of Operations. . . . . . . . . . . . . . . . . . . . . . . . . . . . . . . . . . . . . . 144 Analysis of Net Interest Income and Yield . . . . . . . . . . . . . . . . . . . . . . . . . . . . . . . . . . . . . . . . . . . . . . . . . . . . 155 Rate/Volume Analysis of Changes in Net Interest Income. . . . . . . . . . . . . . . . . . . . . . . . . . . . . . . . . . . . . . . . 166 Fair Value Losses, Net. . . . . . . . . . . . . . . . . . . . . . . . . . . . . . . . . . . . . . . . . . . . . . . . . . . . . . . . . . . . . . . . . . . . 177 Total Loss Reserves. . . . . . . . . . . . . . . . . . . . . . . . . . . . . . . . . . . . . . . . . . . . . . . . . . . . . . . . . . . . . . . . . . . . . . 188 Changes in Combined Loss Reserves . . . . . . . . . . . . . . . . . . . . . . . . . . . . . . . . . . . . . . . . . . . . . . . . . . . . . . . . 189 Troubled Debt Restructurings and Nonaccrual Loans . . . . . . . . . . . . . . . . . . . . . . . . . . . . . . . . . . . . . . . . . . . 2010 Credit Loss Performance Metrics . . . . . . . . . . . . . . . . . . . . . . . . . . . . . . . . . . . . . . . . . . . . . . . . . . . . . . . . . . . 2111 Credit Loss Concentration Analysis . . . . . . . . . . . . . . . . . . . . . . . . . . . . . . . . . . . . . . . . . . . . . . . . . . . . . . . . . 2212 Single-Family Business Results . . . . . . . . . . . . . . . . . . . . . . . . . . . . . . . . . . . . . . . . . . . . . . . . . . . . . . . . . . . . 2313 Multifamily Business Results . . . . . . . . . . . . . . . . . . . . . . . . . . . . . . . . . . . . . . . . . . . . . . . . . . . . . . . . . . . . . . 2514 Capital Markets Group Results . . . . . . . . . . . . . . . . . . . . . . . . . . . . . . . . . . . . . . . . . . . . . . . . . . . . . . . . . . . . . 2715 Capital Markets Group’s Mortgage Portfolio Activity . . . . . . . . . . . . . . . . . . . . . . . . . . . . . . . . . . . . . . . . . . . 2816 Capital Markets Group’s Mortgage Portfolio Composition . . . . . . . . . . . . . . . . . . . . . . . . . . . . . . . . . . . . . . . 2917 Capital Markets Group’s Mortgage Portfolio . . . . . . . . . . . . . . . . . . . . . . . . . . . . . . . . . . . . . . . . . . . . . . . . . . 3018 Summary of Condensed Consolidated Balance Sheets . . . . . . . . . . . . . . . . . . . . . . . . . . . . . . . . . . . . . . . . . . . 3019 Summary of Mortgage-Related Securities at Fair Value. . . . . . . . . . . . . . . . . . . . . . . . . . . . . . . . . . . . . . . . . . 3120 Activity in Debt of Fannie Mae. . . . . . . . . . . . . . . . . . . . . . . . . . . . . . . . . . . . . . . . . . . . . . . . . . . . . . . . . . . . . 3321 Outstanding Short-Term Borrowings and Long-Term Debt . . . . . . . . . . . . . . . . . . . . . . . . . . . . . . . . . . . . . . . 3522 Cash and Other Investments Portfolio. . . . . . . . . . . . . . . . . . . . . . . . . . . . . . . . . . . . . . . . . . . . . . . . . . . . . . . . 3623 Composition of Mortgage Credit Book of Business . . . . . . . . . . . . . . . . . . . . . . . . . . . . . . . . . . . . . . . . . . . . . 3824 Selected Credit Characteristics of Single-Family Conventional Guaranty Book of Business, by Acquisition
Period. . . . . . . . . . . . . . . . . . . . . . . . . . . . . . . . . . . . . . . . . . . . . . . . . . . . . . . . . . . . . . . . . . . . . . . . . . . . . . . . . 4025 Representation and Warranty Status of Single-Family Conventional Loans Acquired in 2013-2016 . . . . . . . 4226 Credit Risk Transferred Pursuant to CAS and CIRT Transactions. . . . . . . . . . . . . . . . . . . . . . . . . . . . . . . . . . 4327 Risk Characteristics of Single-Family Conventional Business Volume and Guaranty Book of Business . . . . 4528 Delinquency Status and Activity of Single-Family Conventional Loans . . . . . . . . . . . . . . . . . . . . . . . . . . . . . 4929 Single-Family Conventional Seriously Delinquent Loan Concentration Analysis . . . . . . . . . . . . . . . . . . . . . . 5030 Statistics on Single-Family Loan Workouts . . . . . . . . . . . . . . . . . . . . . . . . . . . . . . . . . . . . . . . . . . . . . . . . . . . 5131 Single-Family Foreclosed Properties . . . . . . . . . . . . . . . . . . . . . . . . . . . . . . . . . . . . . . . . . . . . . . . . . . . . . . . . 5232 Multifamily Guaranty Book of Business Key Risk Characteristics . . . . . . . . . . . . . . . . . . . . . . . . . . . . . . . . . 5333 Mortgage Insurance Coverage. . . . . . . . . . . . . . . . . . . . . . . . . . . . . . . . . . . . . . . . . . . . . . . . . . . . . . . . . . . . . . 5634 Interest Rate Sensitivity of Net Portfolio to Changes in Interest Rate Level and Slope of Yield Curve . . . . . 6135 Derivative Impact on Interest Rate Risk (50 Basis Points) . . . . . . . . . . . . . . . . . . . . . . . . . . . . . . . . . . . . . . . . 62
1
PART I—FINANCIAL INFORMATION
Item 2. Management’s Discussion and Analysis of Financial Condition and Results of OperationsWe have been under conservatorship, with the Federal Housing Finance Agency (“FHFA”) acting as conservator, since September 6, 2008. As conservator, FHFA succeeded to all rights, titles, powers and privileges of the company, and of any shareholder, officer or director of the company with respect to the company and its assets. The conservator has since delegated specified authorities to our Board of Directors and has delegated to management the authority to conduct our day-to-day operations. Our directors do not have any fiduciary duties to any person or entity except to the conservator and, accordingly, are not obligated to consider the interests of the company, the holders of our equity or debt securities or the holders of Fannie Mae MBS unless specifically directed to do so by the conservator. We describe the rights and powers of the conservator, key provisions of our agreements with the U.S. Department of the Treasury (“Treasury”), and their impact on shareholders in our Annual Report on Form 10-K for the year ended December 31, 2015 (“2015 Form 10-K”) in “Business—Conservatorship and Treasury Agreements.”You should read this Management’s Discussion and Analysis of Financial Condition and Results of Operations (“MD&A”) in conjunction with our unaudited condensed consolidated financial statements and related notes and the more detailed information in our 2015 Form 10-K.This report contains forward-looking statements that are based on management’s current expectations and are subject to significant uncertainties and changes in circumstances. Please review “Forward-Looking Statements” for more information on the forward-looking statements in this report. Our actual results may differ materially from those reflected in our forward-looking statements due to a variety of factors including, but not limited to, those discussed in “Risk Factors” and elsewhere in this report and in our 2015 Form 10-K. You can find a “Glossary of Terms Used in This Report” in the “MD&A” of our 2015 Form 10-K.
INTRODUCTION
Fannie Mae is a government-sponsored enterprise (“GSE”) that was chartered by Congress in 1938. We serve an essential role in the functioning of the U.S. housing market and are investing in improvements to the U.S. housing finance system. Our public mission is to support liquidity and stability in the secondary mortgage market, where existing mortgage-related assets are purchased and sold, and to increase the supply of affordable housing. Our charter does not permit us to originate loans or lend money directly to consumers in the primary mortgage market.
Fannie Mae provides reliable, large-scale access to affordable mortgage credit and indirectly enables families to buy, refinance or rent homes. We securitize mortgage loans originated by lenders into Fannie Mae mortgage-backed securities that we guarantee, which we refer to as Fannie Mae MBS. One of our key functions is to evaluate, price and manage the credit risk on the loans and securities that we guarantee. We also purchase mortgage loans and mortgage-related securities, primarily for securitization and sale at a later date. We use the term “acquire” in this report to refer to both our securitizations and our purchases of mortgage-related assets. We obtain funds to support our business activities by issuing a variety of debt securities in the domestic and international capital markets, which attracts global capital to the United States housing market.
We remain in conservatorship and our conservatorship has no specified termination date. We do not know when or how the conservatorship will terminate, what further changes to our business will be made during or following conservatorship, what form we will have and what ownership interest, if any, our current common and preferred stockholders will hold in us after the conservatorship is terminated or whether we will continue to exist following conservatorship. In addition, as a result of our agreements with Treasury and dividend directives from our conservator, we are not permitted to retain our net worth (other than a limited amount that will decrease to zero by 2018), rebuild our capital position or pay dividends or other distributions to stockholders other than Treasury. Our senior preferred stock purchase agreement with Treasury also includes covenants that significantly restrict our business activities. Congress and the Obama Administration continue to consider options for reform of the housing finance system, including the GSEs. We cannot predict the prospects for the enactment, timing or final content of housing finance reform legislation or actions the Administration or FHFA may take with respect to housing finance reform. The conservatorship, the uncertainty of our future, limitations on executive and employee compensation, and negative publicity concerning the GSEs have had and are likely to continue to have an adverse effect on our ability to retain and recruit well-qualified executives and other employees. We provide additional information on the conservatorship, the provisions of our agreements with Treasury, and their impact on our business in our 2015 Form 10-K in “Business—Conservatorship and Treasury Agreements” and “Risk Factors.” We discuss the uncertainty of our future in

2
“Executive Summary—Outlook” and “Risk Factors” in this report. We discuss proposals for housing finance reform that could materially affect our business in our 2015 Form 10-K in “Business—Housing Finance Reform.”
Although Treasury owns our senior preferred stock and a warrant to purchase 79.9% of our common stock, and has made a commitment under a senior preferred stock purchase agreement to provide us with funds to maintain a positive net worth under specified conditions, the U.S. government does not guarantee our securities or other obligations.
Our common stock is traded in the over-the-counter market and quoted on the OTC Bulletin Board under the symbol “FNMA.” Our debt securities are actively traded in the over-the-counter market.
EXECUTIVE SUMMARY
OverviewWe reported net income of $1.1 billion for the first quarter of 2016, compared with net income of $1.9 billion for the first quarter of 2015. See “Summary of Our Financial Performance” below for an overview of our financial performance for the first quarter of 2016, compared with the first quarter of 2015. We expect to remain profitable on an annual basis for the foreseeable future; however, certain factors, such as changes in interest rates or home prices, could result in significant volatility in our financial results from quarter to quarter or year to year. For more information regarding our expectations for our future financial performance, see “Outlook” below.
With our expected June 2016 dividend payment to Treasury, we will have paid a total of $148.5 billion in dividends to Treasury on our senior preferred stock. The aggregate amount of draws we have received from Treasury to date under the senior preferred stock purchase agreement is $116.1 billion. Under the terms of the senior preferred stock purchase agreement, dividend payments do not offset prior Treasury draws. For more information regarding our dividend payments to Treasury, see “Treasury Senior Preferred Stock Purchase Agreement” below.
Our Strategy and Business ObjectivesOur vision is to be America’s most valued housing partner and to provide liquidity, access to credit and affordability in all U.S. housing markets at all times, while effectively managing and reducing risk to our business, taxpayers and the housing finance system. In support of this vision, we are focused on:
• advancing a sustainable and reliable business model that reduces risk to the housing finance system and taxpayers;
• providing reliable, large-scale access to affordable mortgage credit for qualified borrowers and helping struggling homeowners; and
• serving customer needs and improving our business efficiency.
Advancing a sustainable and reliable business model that reduces risk to the housing finance system and taxpayersWe have significantly changed our business model since we entered conservatorship in 2008 and our business continues to evolve. We have strengthened our underwriting and eligibility standards, we are moving from a portfolio-focused business to a guaranty-focused business and we are transferring an increasing portion of the credit risk on our guaranty book of business. These changes are transforming our business model and reducing certain risks of our business as compared with our business prior to entering conservatorship.
Stronger Underwriting and Eligibility Standards. Beginning in 2008, we made changes to strengthen our underwriting and eligibility standards that have improved the credit quality of our single-family guaranty book of business and contributed to improvement in our credit performance. See “Single-Family Guaranty Book of Business” below for information on the credit performance of the mortgage loans in our single-family guaranty book of business and on our recent single-family acquisitions.
Moving from a portfolio-focused business to a guaranty-focused business. In recent years, an increasing portion of our net interest income has been derived from the guaranty fees we receive for managing the credit risk on loans underlying our Fannie Mae MBS, rather than from interest income on our retained mortgage portfolio assets. This shift has been driven by both the impact of guaranty fee increases implemented in 2012 and the reduction of our retained mortgage portfolio in accordance with the requirements of our senior preferred stock purchase agreement with Treasury and direction from FHFA. Our “retained mortgage portfolio” refers to the mortgage-related assets we own (which excludes the portion of assets held by consolidated MBS trusts that back mortgage-related securities owned by third parties). In the first quarter of 2016, approximately two-thirds of our net interest income was derived from our guaranty business. As described in more detail in

3
“Outlook—Revenues” below, we expect that guaranty fees will continue to account for an increasing portion of our net interest income.
Transferring a portion of the mortgage credit risk on our single-family book of business. In late 2013, we began entering into credit risk transfer transactions with the goal of transferring, to the extent economically sensible, a portion of the mortgage credit risk on some of the recently-acquired loans in our single-family book of business in order to reduce the economic risk to us and to taxpayers of future borrower defaults. In the aggregate, our credit risk transfer transactions completed through March 31, 2016 transferred a significant portion of the mortgage credit risk on single-family mortgages with an unpaid principal balance of over $590 billion. We intend to continue to engage in credit risk transfer transactions on an ongoing basis, subject to market conditions. Approximately 18% of the loans in our single-family conventional guaranty book of business as of March 31, 2016, measured by unpaid principal balance, were included in a reference pool for a Connecticut Avenue SecuritiesTM (“CAS”) or a Credit Insurance Risk TransferTM (“CIRTTM”) transaction. Over time, we expect that a larger portion of our single-family conventional guaranty book of business will be covered by credit risk transfer transactions. For further discussion of our credit risk transfer transactions, see “Risk Management—Credit Risk Management—Single-Family Mortgage Credit Risk Management—Transfer of Mortgage Credit Risk—Credit Risk-Sharing Transactions.”
Our business also continues to evolve as a result of our many other efforts to build a safer and sustainable housing finance system and to pursue the strategic goals identified by our conservator, and we continue to invest significant resources towards these goals. See “Business—Executive Summary—Helping to Build a Sustainable Housing Finance System” in our 2015 Form 10-K for a discussion of these efforts and FHFA’s strategic goals for our conservatorship, including a description of some of the actions we are taking pursuant to the mandates of FHFA’s conservatorship scorecards in order to build the policies and infrastructure for a sustainable housing finance system. For more information on FHFA’s 2016 conservatorship scorecard objectives, see our Current Report on Form 8-K filed with the Securities and Exchange Commission (“SEC”) on December 17, 2015.
Providing reliable, large-scale access to affordable mortgage credit for qualified borrowers and helping struggling homeowners We continued to provide reliable, large-scale access to affordable mortgage credit to the U.S. housing market in the first quarter of 2016 and remained a leading source of liquidity in the single-family and multifamily markets. We also continued to help struggling homeowners. In the first quarter of 2016, we provided approximately 27,000 loan workouts to help homeowners stay in their homes or otherwise avoid foreclosure. We discuss our activities to support the housing and mortgage markets in “Contributions to the Housing and Mortgage Markets” below.
Serving customer needs and improving our business efficiencyWe are continuing our initiatives to better serve our customers’ needs and improve our business efficiency in 2016. These initiatives include continuing to revise and clarify our representation and warranty framework, implementing innovative new and enhanced tools that deliver greater value and certainty to lenders, simplifying our business processes, and updating our infrastructure. We discuss these initiatives in “Serving Customer Needs and Improving Our Business Efficiency” below and in our 2015 Form 10-K in “Business—Executive Summary.”
Summary of Our Financial Performance
Comprehensive IncomeWe recognized comprehensive income of $936 million in the first quarter of 2016, consisting of net income of $1.1 billion and other comprehensive loss of $200 million. In comparison, we recognized comprehensive income of $1.8 billion in the first quarter of 2015, consisting of net income of $1.9 billion and other comprehensive loss of $92 million. The decline in our net income in the first quarter of 2016 compared to the first quarter of 2015 was primarily driven by higher fair value losses and lower net revenues, partially offset by an increase in credit-related income.
Fair value losses increased to $2.8 billion in the first quarter of 2016 compared with $1.9 billion in the first quarter of 2015. Fair value losses in the first quarter of 2016 were driven by declines in longer-term swap rates during the period.
Net revenues, which consist of net interest income and fee and other income, were $5.0 billion in the first quarter of 2016, compared with $5.4 billion in the first quarter of 2015. Net interest income of $4.8 billion for the first quarter of 2016 was driven by guaranty fee revenue and interest income earned on mortgage assets in our retained mortgage portfolio.
We recognized credit-related income of $850 million in the first quarter of 2016 compared with $60 million in the first quarter of 2015. Credit-related income in the first quarter of 2016 was primarily driven by a $1.2 billion benefit for credit losses during the quarter, which was primarily attributable to a decline in actual and projected mortgage interest rates. As
4
mortgage interest rates decline, we expect an increase in future prepayments on single-family individually impaired loans, including modified loans. Higher expected prepayments shorten the expected lives of modified loans, which decreases the impairment relating to concessions provided on these loans and results in a decrease in our provision for credit losses. In addition, an increase in home prices, including distressed property valuations, also contributed to the benefit for credit losses during the first quarter of 2016.
We expect volatility from period to period in our financial results from a number of factors, particularly changes in market conditions that result in fluctuations in the estimated fair value of the financial instruments that we mark to market through our earnings. These instruments include derivatives and certain securities. The estimated fair value of our derivatives and securities may fluctuate substantially from period to period because of changes in interest rates, the yield curve, mortgage and credit spreads, and implied volatility, as well as activity related to these financial instruments. We use derivatives to manage the interest rate risk exposure of our net portfolio, which consists of our retained mortgage portfolio, cash and other investments portfolio, and outstanding debt of Fannie Mae. Some of these financial instruments in our net portfolio are not recorded at fair value in our condensed consolidated financial statements, and as a result we may experience accounting gains or losses due to changes in interest rates or other market conditions that may not be indicative of the economic interest rate risk exposure of our net portfolio. See “Risk Management—Market Risk Management, Including Interest Rate Risk Management” for more information. In addition, our credit-related income or expense can vary substantially from period to period based on factors such as changes in actual and expected home prices, borrower payment behavior, the types and volume of our loss mitigation activities, the volumes of foreclosures completed, redesignations of loans from held for investment (“HFI”) to held for sale (“HFS”), and fluctuations in mortgage interest rates.
See “Consolidated Results of Operations” for more information on our results.
Net WorthOur net worth decreased to $2.1 billion as of March 31, 2016 from $4.1 billion as of December 31, 2015 primarily due to our payment to Treasury of $2.9 billion in senior preferred stock dividends, partially offset by our comprehensive income of $936 million during the first quarter of 2016. Our expected dividend payment of $919 million for the second quarter of 2016 is calculated based on our net worth of $2.1 billion as of March 31, 2016 less the applicable capital reserve amount of $1.2 billion.
Single-Family Guaranty Book of Business
Credit PerformanceWe continued to acquire loans with strong credit profiles and to execute on our strategies for reducing credit losses in the first quarter of 2016, such as helping eligible Fannie Mae borrowers with high loan-to-value (“LTV”) ratio loans refinance into more sustainable loans through the Administration’s Home Affordable Refinance Program® (“HARP®”), offering borrowers loan modifications that can significantly reduce their monthly payments, pursuing foreclosure alternatives and managing our REO inventory to appropriately manage costs and maximize sales proceeds. As we work to reduce credit losses, we also seek to assist struggling homeowners, help stabilize communities and support the housing market.
Table 1 presents information about the credit performance of mortgage loans in our single-family guaranty book of business and our workouts. The term “workouts” refers to both home retention solutions (loan modifications and other solutions that enable a borrower to stay in his or her home) and foreclosure alternatives (short sales and deeds-in-lieu of foreclosure). The workout information in Table 1 does not reflect repayment plans and forbearances that have been initiated but not completed, nor does it reflect trial modifications that have not become permanent.

5
Table 1: Credit Statistics, Single-Family Guaranty Book of Business(1)
2016 2015
Q1FullYear Q4 Q3 Q2 Q1
(Dollars in millions)
As of the end of each period:
Serious delinquency rate(2) . . . . . . . . . . . . . . . . . . . . . . . . . . . . . . 1.44 % 1.55 % 1.55 % 1.59 % 1.66 % 1.78 %
Seriously delinquent loan count . . . . . . . . . . . . . . . . . . . . . . . . . . 247,281 267,174 267,174 275,548 287,372 308,546
Foreclosed property inventory:Number of properties(3) . . . . . . . . . . . . . . . . . . . . . . . . . . . . . . 52,289 57,253 57,253 60,958 68,717 79,319
Carrying value . . . . . . . . . . . . . . . . . . . . . . . . . . . . . . . . . . . . . $ 5,963 $ 6,608 $ 6,608 $ 7,245 $ 7,997 $ 8,915
Combined loss reserves . . . . . . . . . . . . . . . . . . . . . . . . . . . . . . . . $ 26,092 $ 28,325 $ 28,325 $ 29,404 $ 31,510 $ 32,157
During the period:
Credit-related income (expense)(4) . . . . . . . . . . . . . . . . . . . . . . . . $ 828 $ (1,035) $ (819) $ 1,029 $ (1,238) $ (7)
Credit losses(5). . . . . . . . . . . . . . . . . . . . . . . . . . . . . . . . . . . . . . . . $ 1,569 $ 10,731 $ 2,081 $ 1,168 $ 2,109 $ 5,373
REO net sales price to unpaid principal balance(6) . . . . . . . . . . . . 73 % 72 % 73 % 72 % 72 % 70 %
Short sales net sales price to unpaid principal balance(7) . . . . . . . 73 % 73 % 74 % 74 % 74 % 73 %
Loan workout activity (number of loans):
Home retention loan workouts(8) . . . . . . . . . . . . . . . . . . . . . . . . . 22,195 100,208 20,300 23,571 27,769 28,568
Short sales and deeds-in-lieu of foreclosure. . . . . . . . . . . . . . . . . 4,740 22,077 4,761 5,531 6,128 5,657
Total loan workouts . . . . . . . . . . . . . . . . . . . . . . . . . . . . . . . . . 26,935 122,285 25,061 29,102 33,897 34,225Loan workouts as a percentage of delinquent loans in our
guaranty book of business(9) . . . . . . . . . . . . . . . . . . . . . . . . . . . 19.24 % 19.95 % 16.66 % 19.28 % 22.69 % 21.71 %
__________(1) Our single-family guaranty book of business consists of (a) single-family mortgage loans of Fannie Mae, (b) single-family mortgage
loans underlying Fannie Mae MBS, and (c) other credit enhancements that we provide on single-family mortgage assets, such as long-term standby commitments. It excludes non-Fannie Mae mortgage-related securities held in our retained mortgage portfolio for which we do not provide a guaranty.
(2) Calculated based on the number of single-family conventional loans that are 90 days or more past due or in the foreclosure process, divided by the number of loans in our single-family conventional guaranty book of business.
(3) Includes acquisitions through deeds-in-lieu of foreclosure. Also includes held for use properties, which are reported in our condensed consolidated balance sheets as a component of “Other assets.”
(4) Consists of (a) the benefit (provision) for credit losses and (b) foreclosed property income (expense).(5) Consists of (a) charge-offs, net of recoveries and (b) foreclosed property expense (income), adjusted to exclude the impact of fair value
losses resulting from credit-impaired loans acquired from MBS trusts. (6) Calculated as the amount of sale proceeds received on disposition of REO properties during the respective period, excluding those
subject to repurchase requests made to our sellers or servicers, divided by the aggregate unpaid principal balance of the related loans at the time of foreclosure. Net sales price represents the contract sales price less selling costs for the property and other charges paid by the seller at closing.
(7) Calculated as the amount of sale proceeds received on properties sold in short sale transactions during the respective periods divided by the aggregate unpaid principal balance of the related loans. Net sales price represents the contract sales price less the selling costs for the property and other charges paid by the seller at the closing, including borrower relocation incentive payments and subordinate lien(s) negotiated payoffs.
(8) Consists of (a) modifications, which do not include trial modifications, loans to certain borrowers who have received bankruptcy relief that are classified as troubled debt restructurings (“TDRs”), or repayment plans or forbearances that have been initiated but not completed and (b) repayment plans and forbearances completed. See “Table 30: Statistics on Single-Family Loan Workouts” in “Risk Management—Credit Risk Management—Single-Family Mortgage Credit Risk Management—Problem Loan Management—Loan Workout Metrics” for additional information on our various types of loan workouts.
(9) Calculated based on annualized problem loan workouts during the period as a percentage of the average balance of delinquent loans in our single-family guaranty book of business.
Beginning in 2008, we took actions to significantly strengthen our underwriting and eligibility standards to promote sustainable homeownership and stability in the housing market. These actions have improved the credit quality of our book of

6
business and contributed to improvement in our credit performance. For information on the credit risk profile of our single-family guaranty book of business, see “Risk Management—Credit Risk Management—Single-Family Mortgage Credit Risk Management,” including “Table 27: Risk Characteristics of Single-Family Conventional Business Volume and Guaranty Book of Business.”
Our single-family serious delinquency rate has decreased each quarter since the first quarter of 2010, and was 1.44% as of March 31, 2016, compared with 1.55% as of December 31, 2015. We continue to experience disproportionately higher serious delinquency rates and credit losses from single-family loans originated in 2005 through 2008 than from loans originated in other years. Single-family loans originated in 2005 through 2008 constituted 10% of our single-family book of business as of March 31, 2016, but constituted 55% of our seriously delinquent single-family loans as of March 31, 2016 and drove 69% of our single-family credit losses in the first quarter of 2016. For information on the credit performance of our single-family book of business based on loan vintage, see “Table 11: Credit Loss Concentration Analysis” in “Consolidated Results of Operations—Credit-Related Income—Credit Loss Performance Metrics” and “Table 29: Single-Family Conventional Seriously Delinquent Loan Concentration Analysis” in “Risk Management—Credit Risk Management—Single-Family Mortgage Credit Risk Management.” For information on certain credit characteristics of our single-family book of business based on the period in which we acquired the loans, see “Table 24: Selected Credit Characteristics of Single-Family Conventional Guaranty Book of Business, by Acquisition Period” in “Risk Management—Credit Risk Management—Single-Family Mortgage Credit Risk Management.”
We provide additional information on our credit-related income and credit losses in “Consolidated Results of Operations—Credit-Related Income.” We provide more information on the credit performance of mortgage loans in our single-family book of business and our efforts to reduce our credit losses in “Risk Management—Credit Risk Management—Single-Family Mortgage Credit Risk Management.” See also “Risk Factors” in our 2015 Form 10-K, where we describe factors that may increase our credit-related expense and credit losses, as well as factors that may adversely affect the success of our efforts to reduce our credit losses.
Recently Acquired Single-Family LoansTable 2 below displays information regarding our average charged guaranty fee on and select risk characteristics of the single-family loans we acquired in each of the last five quarters, including HARP acquisitions. Table 2 also displays the volume of our single-family Fannie Mae MBS issuances for these periods, which is indicative of the volume of single-family loans we acquired in these periods.
Table 2: Single-Family Acquisitions Statistics
2016 2015Q1 Q4 Q3 Q2 Q1
(Dollars in millions)
Single-family average charged guaranty fee on new acquisitions, net of TCCA fee (in basis points)(1) . . . 49.2 50.5 50.6 49.9 51.2
Single-family Fannie Mae MBS issuances . . . . . . . . . . $101,797 $104,359 $126,144 $130,974 $110,994Select risk characteristics of single-family
conventional acquisitions:(2)
Weighted average FICO® credit score at origination . 746 746 747 750 748FICO credit score at origination less than 660 . . . . . . 6 % 6 % 6 % 5 % 5 %Weighted average original LTV ratio(3) . . . . . . . . . . . 75 % 75 % 76 % 74 % 74 %Original LTV ratio over 80%(3)(4) . . . . . . . . . . . . . . . . 27 % 30 % 30 % 27 % 26 %Original LTV ratio over 95%(3) . . . . . . . . . . . . . . . . . . 3 % 3 % 3 % 3 % 2 %Loan purpose:
Purchase . . . . . . . . . . . . . . . . . . . . . . . . . . . . . . . . . . 46 % 50 % 54 % 40 % 37 %Refinance . . . . . . . . . . . . . . . . . . . . . . . . . . . . . . . . . 54 % 50 % 46 % 60 % 63 %
7
__________ (1) Excludes the impact of a 10 basis point guaranty fee increase implemented in 2012 pursuant to the Temporary Payroll Tax Cut
Continuation Act of 2011 (the “TCCA”). This TCCA-related fee is unrelated to our pricing strategy, as the incremental revenue from this fee is remitted to Treasury and not retained by us. Average charged guaranty fee is calculated based on the average contractual fee rate, net of TCCA fee, for our single-family guaranty arrangements entered into during the period plus the recognition of any upfront cash payments ratably over an estimated average life, expressed in basis points.
(2) Calculated based on unpaid principal balance of single-family loans for each category at time of acquisition. (3) The original LTV ratio generally is based on the original unpaid principal balance of the loan divided by the appraised property value
reported to us at the time of acquisition of the loan. Excludes loans for which this information is not readily available.(4) We purchase loans with original LTV ratios above 80% as part of our mission to serve the primary mortgage market and provide
liquidity to the housing finance system. Except as permitted under HARP, our charter generally requires primary mortgage insurance or other credit enhancement for loans that we acquire that have an LTV ratio over 80%.
The average charged guaranty fee on our newly-acquired single-family loans may vary from period to period as a result of shifts in the loan level price adjustments we charge or changes we make to our contractual fee rates. Loan level price adjustments refer to one-time cash fees that we charge at the time we acquire a loan based on its credit characteristics. The contractual fee rates we charge vary to the extent we make changes in our pricing strategy in response to the market and competitive environment.
The single-family loans we acquired in the first quarter of 2016 continued to have a strong credit profile, with a weighted average original LTV ratio of 75% and a weighted average FICO credit score of 746. For more information on the credit risk profile of our single-family conventional loan acquisitions in the first quarter of 2016, see “Risk Management—Credit Risk Management—Single-Family Mortgage Credit Risk Management,” including “Table 27: Risk Characteristics of Single-Family Conventional Business Volume and Guaranty Book of Business” in that section.
Whether the loans we acquire in the future will exhibit an overall credit profile and performance similar to our more recent acquisitions will depend on a number of factors, including: our future guaranty fee pricing and any impact of that pricing on the volume and mix of loans we acquire; our future eligibility standards and those of mortgage insurers, the Federal Housing Administration (“FHA”) and the Department of Veterans Affairs (“VA”); the percentage of loan originations representing refinancings; changes in interest rates; our future objectives and activities in support of those objectives, including actions we may take to reach additional underserved creditworthy borrowers; government policy; market and competitive conditions; and the volume and characteristics of HARP loans we acquire in the future. In addition, if our lender customers retain more of the higher-quality loans they originate, it could negatively affect the credit risk profile of our new single-family acquisitions.
Providing Access to Credit Opportunities for Creditworthy Borrowers We are continuing our efforts to increase access to mortgage credit for creditworthy borrowers, consistent with the full extent of our applicable credit requirements and risk management practices. As part of these efforts, in 2014 we changed our eligibility requirements to increase our maximum LTV ratio from 95% to 97% for loans meeting certain criteria, and in 2015 we announced an improved affordable lending product, HomeReady®, which is designed for creditworthy borrowers with lower and moderate incomes and provides expanded eligibility for financing homes in designated low-income, minority and disaster-impacted communities. We began acquiring loans under our revised eligibility criteria in December 2014 and under HomeReady in December 2015. See “Business—Executive Summary—Single-Family Guaranty Book of Business—Providing Access to Credit Opportunities for Creditworthy Borrowers” in our 2015 Form 10-K for more information regarding these loans, including a discussion of their eligibility requirements, the number of these loans acquired in 2015 and our expectations regarding our future acquisitions of these loans.
We continue to seek new ways to responsibly expand access to mortgage credit. FHFA’s 2016 conservatorship scorecard specifies that in 2016 we should continue to assess impediments to credit access and develop recommendations to address these barriers. To the extent we are able to encourage lenders to increase access to mortgage credit, we may acquire a greater number of single-family loans with higher risk characteristics than we acquired in recent periods; however, we expect our single-family acquisitions will continue to have a strong overall credit risk profile given our current underwriting and eligibility standards and product design. We actively monitor the credit risk profile and credit performance of our single-family loan acquisitions, in conjunction with housing market and economic conditions, to determine if our pricing, eligibility and underwriting criteria accurately reflect the risks associated with loans we acquire or guarantee.
8
Contributions to the Housing and Mortgage Markets
Liquidity and Support ActivitiesAs a leading provider of residential mortgage credit in the United States, we indirectly enable families to buy, refinance or rent homes. During the first quarter of 2016, we continued to provide critical liquidity and support to the U.S. mortgage market in a number of important ways:
• We serve as a stable source of liquidity for purchases of homes and financing of multifamily rental housing, as well as for refinancing existing mortgages. We provided approximately $115 billion in liquidity to the mortgage market in the first quarter of 2016 through our purchases of loans and guarantees of loans and securities. This liquidity enabled borrowers to complete approximately 256,000 mortgage refinancings and approximately 210,000 home purchases, and provided financing for approximately 161,000 units of multifamily housing.
• Our role in the market enables qualified borrowers to have reliable access to affordable mortgage credit, including a variety of conforming mortgage products such as the prepayable 30-year fixed-rate mortgage that protects homeowners from fluctuations in interest rates.
• We provided approximately 27,000 loan workouts in the first quarter of 2016 to help homeowners stay in their homes or otherwise avoid foreclosure. Our loan workout efforts have helped to stabilize neighborhoods, home prices and the housing market.
• We helped borrowers refinance loans, including through our Refi Plus™ initiative, which offers additional refinancing flexibility to eligible borrowers who are current on their loans, whose loans are owned or guaranteed by us and who meet certain additional criteria. We acquired approximately 38,000 Refi Plus loans in the first quarter of 2016. Refinancings delivered to us through Refi Plus in the first quarter of 2016 reduced borrowers’ monthly mortgage payments by an average of $192.
• We support affordability in the multifamily rental market. Over 80% of the multifamily units we financed in the first quarter of 2016 were affordable to families earning at or below 120% of the median income in their area, providing support for both workforce housing and affordable housing.
• In addition to purchasing and guaranteeing loans, we provide funds to the mortgage market through short-term financing and other activities. These activities are described in our 2015 Form 10-K in “Business—Business Segments—Capital Markets.”
2016 Market Share We were one of the largest issuers of mortgage-related securities in the secondary market during the first quarter of 2016, with an estimated market share of new single-family mortgage-related securities issuances of 37%, compared with 36% in the fourth quarter of 2015 and 40% in the first quarter of 2015.
We remained a continuous source of liquidity in the multifamily market in the first quarter of 2016. We owned or guaranteed approximately 18% of the outstanding debt on multifamily properties as of December 31, 2015 (the latest date for which information is available).
Serving Customer Needs and Improving Our Business EfficiencyWe are engaged in various initiatives to better serve our customers’ needs and improve our business efficiency. We are committed to providing our lender partners with the products, services and tools they need to serve the market more effectively and efficiently. To further this commitment, we are focused on continuing to revise and clarify our representation and warranty framework, implementing innovative new and enhanced tools that deliver greater value and certainty to lenders, and making our customers’ interactions with us simpler and more efficient.
Continuing to revise and clarify our representation and warranty framework. We have taken several actions in recent years to improve our representation and warranty framework. These actions have significantly reduced uncertainty surrounding lenders’ repurchase risk relating to loans they deliver to us, and our intention is that these actions will encourage lenders to safely expand their lending to a wider range of qualified borrowers. As of March 31, 2016, over 1.8 million loans in our book of business had obtained relief from repurchases for breaches of certain representations and warranties. We continue to work on new ways to reduce or clarify lenders’ repurchase risk. See “Business—Executive Summary—Serving Customer Needs and Improving Our Business Efficiency” in our 2015 Form 10-K and “Risk Management—Credit Risk Management—Single-Family Mortgage Credit Risk Management” in both our 2015 Form 10-K and this report for further discussion of changes to our representation and warranty framework and actions we have taken to reduce and clarify lenders’ repurchase risk.
9
Implementing innovative new and enhanced tools that deliver greater value and certainty to lenders. As described in “Business—Executive Summary—Serving Customer Needs and Improving Our Business Efficiency” in our 2015 Form 10-K, in 2015 we implemented a number of changes designed to help our customers originate mortgages with increased certainty, efficiency and lower costs, and we continue to focus on improving our business to provide value to customers. For example, we expect to implement additional enhancements to Desktop Underwriter® during 2016 to further help our lender customers originate mortgages with increased efficiency and lower costs and to help increase access to credit for creditworthy borrowers, such as incorporating trended credit data and offering third-party validation of specified borrower data.
Making our customers’ interactions with us simpler and more efficient. We are also engaged in a multi-year effort to improve our business efficiency and agility through simplification of our business processes and enhancements to our infrastructure. Many of these improvements are also designed to enhance our customers’ experience when doing business with us, including making our customers’ interactions with us simpler and more efficient. These efforts include replacing some of our systems with simpler, more automated infrastructure that will enable us to more efficiently process transactions and manage our book of business, as well as to better adapt to industry and regulatory changes in the future. We are also implementing infrastructure improvements to support the integration of our business with the common securitization platform and our ability to issue a single GSE security.
Treasury Senior Preferred Stock Purchase AgreementFrom 2009 through the first quarter of 2012, we received a total of $116.1 billion from Treasury under the senior preferred stock purchase agreement. This funding provided us with the capital and liquidity needed to fulfill our mission of providing liquidity and support to the nation’s housing finance markets and to avoid triggering mandatory receivership under the Federal Housing Enterprises Financial Safety and Soundness Act of 1992, as amended by the Federal Housing Finance Regulatory Reform Act of 2008 (together, the “GSE Act”). In addition, a portion of the $116.1 billion we received from Treasury was drawn to pay dividends to Treasury because, prior to 2013, our dividend payments on the senior preferred stock accrued at an annual rate of 10%, and we were directed by our conservator to pay these dividends to Treasury each quarter even when we did not have sufficient income to pay the dividend. We have not received funds from Treasury under the agreement since the first quarter of 2012.
From 2008 through the first quarter of 2016, we paid a total of $147.6 billion in dividends to Treasury on the senior preferred stock. Under the terms of the senior preferred stock purchase agreement, dividend payments do not offset prior Treasury draws, and we are not permitted to pay down draws we have made under the agreement except in limited circumstances. Accordingly, the current aggregate liquidation preference of the senior preferred stock is $117.1 billion, due to the initial $1.0 billion liquidation preference of the senior preferred stock (for which we did not receive cash proceeds) and the $116.1 billion we have drawn from Treasury.
The Director of FHFA has directed us to make dividend payments on the senior preferred stock on a quarterly basis. We expect to pay Treasury a senior preferred stock dividend of $919 million by June 30, 2016 for the second quarter of 2016.
We expect to retain only a limited amount of any future net worth because we are required by the dividend provisions of the senior preferred stock and quarterly directives from our conservator to pay Treasury each quarter any dividends declared consisting of the amount, if any, by which our net worth as of the end of the immediately preceding fiscal quarter exceeds an applicable capital reserve amount. This capital reserve amount is $1.2 billion for each quarter of 2016, will decrease to $600 million in 2017 and will decrease to zero in 2018. Those dividend payment provisions are referred to as “net worth sweep” dividend provisions.
Although we expect to remain profitable on an annual basis for the foreseeable future, due to our expectation of continued declining capital and the potential for significant volatility in our financial results, we could experience a net worth deficit in a future quarter, particularly as our capital reserve amount approaches or reaches zero. If that were to occur, we would be required to draw additional funds from Treasury under the senior preferred stock purchase agreement in order to avoid being placed into receivership. As of the date of this filing, the maximum amount of remaining funding under the agreement is $117.6 billion. If we were to draw additional funds from Treasury under the agreement in a future period, the amount of remaining funding under the agreement would be reduced by the amount of our draw. Dividend payments we make to Treasury do not restore or increase the amount of funding available to us under the agreement. See “Risk Factors” in our 2015 Form 10-K for a discussion of the risks associated with our limited and declining capital.
As described in “Legal Proceedings” and “Note 16, Commitments and Contingencies,” several lawsuits have been filed by preferred and common stockholders of Fannie Mae and Freddie Mac against one or more of the United States, Treasury and FHFA challenging actions taken by the defendants relating to the senior preferred stock purchase agreements and the conservatorships of Fannie Mae and Freddie Mac, including challenges to the net worth sweep dividend provisions of the
10
senior preferred stock. We are also a party to some of those lawsuits. We cannot predict the course or the outcome of these lawsuits, or the actions the U.S. government (including Treasury or FHFA) may take in response to any ruling or finding in any of these lawsuits.
Housing and Mortgage Market and Economic Conditions Economic growth moderated in the first quarter of 2016. According to the U.S. Bureau of Economic Analysis advance estimate, the inflation-adjusted U.S. gross domestic product, or GDP, rose by 0.5% on an annualized basis in the first quarter of 2016, compared with an increase of 1.4% in the fourth quarter of 2015. The overall economy gained an estimated 628,000 non-farm jobs in the first quarter of 2016. According to the U.S. Bureau of Labor Statistics, over the 12 months ending in March 2016, the economy created an estimated 2.8 million non-farm jobs. The unemployment rate was 5.0% in both March 2016 and December 2015.
According to the Federal Reserve, total U.S. residential mortgage debt outstanding, which includes $10.0 trillion of single-family debt outstanding, was estimated to be approximately $11.1 trillion as of December 31, 2015 (the latest date for which information is available), compared with $11.0 trillion as of September 30, 2015.
Housing sales increased in the first quarter of 2016 as compared with the fourth quarter of 2015. Total existing home sales averaged 5.3 million units annualized in the first quarter of 2016, a 1.7% increase from the fourth quarter of 2015, according to data from the National Association of REALTORS®. Sales of foreclosed homes and preforeclosure, or “short,” sales (together, “distressed sales”) accounted for 8% of existing home sales in March 2016, compared with 8% in December 2015 and 10% in March 2015. According to the U.S. Census Bureau, new single-family home sales increased during the first quarter of 2016, averaging an annualized rate of 517,000 units, a 1.5% gain from the fourth quarter of 2015.
The number of months’ supply, or the inventory/sales ratio, of available existing homes and of new homes increased in the first quarter of 2016. According to the U.S. Census Bureau, the months’ supply of new single-family unsold homes was 5.8 months as of March 31, 2016, compared with 5.3 months as of December 31, 2015. According to the National Association of REALTORS®, the months’ supply of existing unsold homes was 4.5 months as of March 31, 2016, compared with a 3.9 months’ supply as of December 31, 2015.
The overall mortgage market serious delinquency rate fell to 3.4% as of December 31, 2015 (the latest date for which information is available), according to the Mortgage Bankers Association’s National Delinquency Survey, its lowest level since the third quarter of 2007, compared with 4.5% as of December 31, 2014. We provide information about Fannie Mae’s serious delinquency rate, which decreased in the first quarter of 2016, in “Single-Family Guaranty Book of Business—Credit Performance.”
Based on our home price index, we estimate that home prices on a national basis increased by 0.5% in the first quarter of 2016, following increases of 4.9% in 2015, 4.4% in 2014 and 7.9% in 2013. Despite the recent increases in home prices, we estimate that, through March 31, 2016, home prices on a national basis remained 5.7% below their peak in the third quarter of 2006. Our home price estimates are based on preliminary data and are subject to change as additional data become available.
Despite the recent increases in home prices, many homeowners continue to have “negative equity” in their homes as a result of declines in home prices since 2006, which means their mortgage principal balance exceeds the current market value of their home. This increases the likelihood that borrowers will abandon their mortgage obligations and that the loans will become delinquent and proceed to foreclosure. According to CoreLogic, Inc. the number of residential properties with mortgages in a negative equity position in the fourth quarter of 2015 was approximately 4.3 million, up from 4.2 million in the third quarter of 2015 and down from 5.3 million in the fourth quarter of 2014. The percentage of properties with mortgages in a negative equity position in the fourth quarter of 2015 was 8.5%, up from 8.3% in the third quarter of 2015 and down from 10.7% in the fourth quarter of 2014.
Thirty-year fixed-rate mortgage rates ended the quarter at 3.71% for the week of March 31, 2016, down from 4.01% for the week of December 31, 2015, according to the Freddie Mac Primary Mortgage Market Survey®.
During the first quarter of 2016, the multifamily sector exhibited positive but slowing fundamentals, according to preliminary third-party data, with a modestly higher national vacancy level but also increasing rent growth. The estimated national multifamily vacancy rate for institutional investment-type apartment properties was 5.1% as of March 31, 2016, compared with 5.0% as of December 31, 2015. National asking rents increased by an estimated 0.50% during the first quarter of 2016, compared with a 0.25% increase during the fourth quarter of 2015. Because estimated multifamily rent growth has outpaced wage growth over the past few years, multifamily rental housing affordability has declined in recent years.
Despite the increase in the multifamily vacancy rate, continued demand for multifamily rental units was reflected in the estimated positive net absorption (that is, the net change in the number of occupied rental units during the time period) of
11
approximately 31,000 units during the first quarter of 2016, according to preliminary data from Reis, Inc., compared with approximately 37,000 units during the fourth quarter of 2015. As a result of the continued demand for multifamily rental units over the past few years, there has been an increase in the amount of new multifamily construction development nationally. More than 386,000 new multifamily units are expected to be completed this year. Although the bulk of this new supply is concentrated in a limited number of metropolitan areas, we believe this increase in supply will result in lower national net absorption levels in 2016, leading to an increase in the national multifamily vacancy rate and a slowdown in rent growth.
OutlookUncertainty Regarding our Future Status. We expect continued significant uncertainty regarding the future of our company and the housing finance system, including how long the company will continue to exist in its current form, the extent of our role in the market, how long we will be in conservatorship, what form we will have and what ownership interest, if any, our current common and preferred stockholders will hold in us after the conservatorship is terminated, and whether we will continue to exist following conservatorship.
We cannot predict the prospects for the enactment, timing or final content of housing finance reform legislation. See “Business—Housing Finance Reform” in our 2015 Form 10-K for a discussion of proposals for reform of the housing finance system, including the GSEs, that could materially affect our business, including proposals to wind down Fannie Mae and Freddie Mac. See “Risk Factors” in both this report and our 2015 Form 10-K for a discussion of the risks to our business relating to the uncertain future of our company.
Financial Results. We continued to be profitable in the first quarter of 2016, with net income of $1.1 billion. We expect to remain profitable on an annual basis for the foreseeable future; however, certain factors, such as changes in interest rates or home prices, could result in significant volatility in our financial results from quarter to quarter or year to year. Our future financial results also will be affected by a number of other factors, including: our guaranty fee rates; the volume of single-family mortgage originations in the future; the size, composition and quality of our retained mortgage portfolio and guaranty book of business; and economic and housing market conditions. Although we expect to remain profitable on an annual basis for the foreseeable future, due to our expectation of continued declining capital and the potential for significant volatility in our financial results, we could experience a net worth deficit in a future quarter, particularly as our capital reserve amount approaches or reaches zero. See “Treasury Senior Preferred Stock Purchase Agreement” above and “Risk Factors” in our 2015 Form 10-K for more information on, and the risks associated with, our limited and declining capital. In addition, our expectations for our future financial results do not take into account the impact on our business of potential future legislative or regulatory changes, which could have a material impact on our financial results, particularly the enactment of housing finance reform legislation as noted in “Uncertainty Regarding our Future Status” above.
Revenues. We currently have two primary sources of revenues: (1) the guaranty fees we receive for managing the credit risk on loans underlying Fannie Mae MBS held by third parties; and (2) the difference between interest income earned on the assets in our retained mortgage portfolio and the interest expense associated with the debt that funds those assets. In recent years, an increasing portion of our net interest income has been derived from guaranty fees rather than from our retained mortgage portfolio assets, due to the impact of guaranty fee increases implemented in 2012 and the reduction of our retained mortgage portfolio. Approximately two-thirds of our net interest income in the first quarter of 2016 was derived from the loans underlying our Fannie Mae MBS in consolidated trusts, which primarily generate income through guaranty fees. We expect that guaranty fees will continue to account for an increasing portion of our net interest income.
We expect continued decreases in the size of our retained mortgage portfolio, which will continue to negatively impact our net interest income and net revenues; however, we also expect increases in our guaranty fee revenues will partially offset the negative impact of the decline in our retained mortgage portfolio. We expect our guaranty fee revenues to increase over the next several years, as loans with lower guaranty fees liquidate from our book of business and are replaced with new loans with higher guaranty fees. The extent to which the positive impact of increased guaranty fee revenues will offset the negative impact of the decline in the size of our retained mortgage portfolio will depend on many factors, including: changes to guaranty fee pricing we may make in the future and their impact on our competitive environment and guaranty fee revenues; the size, composition and quality of our guaranty book of business; the life of the loans in our guaranty book of business; the size, composition and quality of our retained mortgage portfolio; economic and housing market conditions, including changes in interest rates; our market share; and legislative and regulatory changes.
Overall Market Conditions. While we expect the single-family serious delinquency rate for the overall mortgage market will continue to decline, we believe the rate of decline will be gradual. We expect the national single-family serious delinquency rate will remain high compared with pre-housing crisis levels because it will take some time for the remaining delinquent loans originated prior to 2009 to work their way through the foreclosure process.
12
We forecast that total originations in the U.S. single-family mortgage market in 2016 will decrease from 2015 levels by approximately 9% from an estimated $1.71 trillion in 2015 to $1.56 trillion in 2016, and that the amount of originations in the U.S. single-family mortgage market that are refinancings will decrease from an estimated $795 billion in 2015 to $615 billion in 2016.
Home Prices. Based on our home price index, we estimate that home prices on a national basis increased by 0.5% in the first quarter of 2016. We expect the rate of home price appreciation in 2016 to be similar to the rate in 2015. Future home price changes may be very different from our expectations as a result of significant inherent uncertainty in the current market environment, including uncertainty about the effect of recent and future changes in mortgage rates; actions the federal government has taken and may take with respect to fiscal policies, mortgage finance programs and policies, and housing finance reform; the Federal Reserve’s purchases and sales of mortgage-backed securities; the impact of those actions on and changes generally in unemployment and the general economic and interest rate environment; and the impact on the U.S. economy of global economic and political conditions. We also expect significant regional variation in the timing and rate of home price growth.
Credit Losses. Our credit losses, which include our charge-offs, net of recoveries, reflect our realization of losses on our loans. Our credit losses were $1.6 billion in the first quarter of 2016, down from $5.4 billion in the first quarter of 2015. We expect our credit losses to be lower in 2016 than our 2015 credit losses. See “Consolidated Results of Operations—Credit-Related Income—Credit Loss Performance Metrics” for a discussion of our credit losses for the first quarter of 2016 and 2015, including the impact on our first quarter 2015 credit losses of our adoption of FHFA’s Advisory Bulletin AB 2012-02, “Framework for Adversely Classifying Loans, Other Real Estate Owned, and Other Assets and Listing Assets for Special Mention” (the “Advisory Bulletin”) and a change in our accounting policy for nonaccrual loans, which collectively resulted in $3.6 billion in charge-offs in the first quarter of 2015.
Loss Reserves. Our combined loss reserves were $26.3 billion as of March 31, 2016, down from $28.6 billion as of December 31, 2015. Our loss reserves have declined substantially from their peak and are expected to decline further. For a discussion of the factors that contributed to the decline in our loss reserves in the first quarter of 2016, see “Consolidated Results of Operations—Credit-Related Income” and “Consolidated Balance Sheet Analysis—Mortgage Loans.”
Factors that Could Cause Actual Results to be Materially Different from Our Estimates and Expectations. We present a number of estimates and expectations in this executive summary regarding our future performance, including estimates and expectations regarding our future financial results and profitability, the level and sources of our future revenues and net interest income, our future dividend payments to Treasury, the credit characteristics of, and the credit risk posed by, our future acquisitions, our future credit risk transfer transactions, our future credit losses and our future loss reserves. We also present a number of estimates and expectations in this executive summary regarding future housing market conditions, including expectations regarding future single-family loan delinquency rates, future mortgage originations, future refinancings, future home prices and future conditions in the multifamily market. These estimates and expectations are forward-looking statements based on our current assumptions regarding numerous factors. Our future estimates of our performance and housing market conditions, as well as the actual results, may differ materially from our current estimates and expectations as a result of: the timing and level of, as well as regional variation in, home price changes; changes in interest rates, including negative interest rates; changes in unemployment rates and other macroeconomic and housing market variables; our future guaranty fee pricing and the impact of that pricing on our guaranty fee revenues and competitive environment; our future serious delinquency rates; our future objectives and activities in support of those objectives, including actions we may take to reach additional underserved creditworthy borrowers; future legislative or regulatory requirements or changes that have a significant impact on our business, such as the enactment of housing finance reform legislation; actions we may be required to take by FHFA, in its role as our conservator or as our regulator, such as changes in the type of business we do or implementation of a single GSE security; limitations on our business imposed by FHFA, in its role as our conservator or as our regulator; future updates to our models relating to our loss reserves, including the assumptions used by these models; future changes to our accounting policies; significant changes in modification and foreclosure activity; the volume and pace of future nonperforming loan sales and their impact on our results and serious delinquency rates; changes in borrower behavior, such as an increasing number of underwater borrowers who strategically default on their mortgage loans; the effectiveness of our loss mitigation strategies, management of our REO inventory and pursuit of contractual remedies; whether our counterparties meet their obligations in full; resolution or settlement agreements we may enter into with our counterparties; changes in the fiscal and monetary policies of the Federal Reserve, including any change in the Federal Reserve’s policy towards the reinvestment of principal payments of mortgage-backed securities or any future sales of such securities; changes in the fair value of our assets and liabilities; changes in generally accepted accounting principles (“GAAP”); credit availability; global political risks; natural disasters, environmental disasters, terrorist attacks, pandemics or other major disruptive events; information security breaches; and other factors, including those discussed in “Forward-Looking Statements,” “Risk Factors” and elsewhere in this report and in our 2015 Form 10-K. Due to the large size of our
13
guaranty book of business, even small changes in these factors could have a significant impact on our financial results for a particular period.
LEGISLATIVE AND REGULATORY DEVELOPMENTS
The information in this section updates and supplements information regarding legislative and regulatory developments set forth in “Business—Housing Finance Reform” and “Business—Our Charter and Regulation of Our Activities” in our 2015 Form 10-K. Also see “Risk Factors” in this report and in our 2015 Form 10-K for a discussion of risks relating to legislative and regulatory matters.
Housing Finance ReformCongress continues to consider housing finance reform that could result in significant changes in our structure and role in the future. As described in “Business—Housing Finance Reform—Legislative Developments” in our 2015 Form 10-K, in the first session of the 114th Congress, which convened in January 2015, several bills were introduced and considered in the Senate and the House of Representatives relating to Fannie Mae, Freddie Mac and the housing finance system, two of which were enacted into law.
We expect Congress to continue to consider legislation relating to the GSEs and housing finance reform in the current congressional session, including conducting hearings and considering legislation that would alter the housing finance system or the activities or operations of the GSEs. See “Risk Factors” in this report and our 2015 Form 10-K for a discussion of the risks to our business relating to the uncertain future of our company.
2015 Housing Goals PerformanceWe are subject to housing goals, which establish specified requirements for our mortgage acquisitions relating to affordability or location. Our single-family performance is measured against the lower of benchmarks established by FHFA or goals-qualifying originations in the primary mortgage market. Multifamily goals are established as a number of units to be financed.
For 2015, we believe we met three of our five single-family benchmarks. The two single-family benchmarks we believe we did not meet were the low-income families home purchase benchmark and the very low-income families home purchase benchmark. In addition, we believe we met our multifamily goal and subgoals for 2015. Final performance results will be calculated and published by FHFA after the release in the fall of 2016 of data reported by primary market originators under the Home Mortgage Disclosure Act. To determine whether we met our low-income families home purchase goal and our very low-income families home purchase goal, FHFA will compare our performance with that of the market. We will be in compliance with these goals if we meet the applicable market share measures for these goals. See “Business—Our Charter and Regulation of Our Activities—The GSE Act—Housing Goals and Duty to Serve Undeserved Markets—Housing Goals for 2015 to 2017” in our 2015 Form 10-K for a more detailed discussion of our housing goals.
Proposed Rule on Incentive CompensationOn April 26, 2016, FHFA reissued its portion of a proposed rule under Section 956 of the Dodd-Frank Wall Street Reform and Consumer Protection Act (the “Dodd-Frank Act”) relating to incentive compensation. Section 956 of the Dodd-Frank Act requires that FHFA and other financial regulators issue rules or guidelines: (1) prohibiting incentive-based payment arrangements that the regulators determine encourage inappropriate risks by providing excessive compensation or that could lead to material financial loss; and (2) requiring enhanced disclosure and reporting of incentive compensation arrangements. The proposed rule provides that, while we are in conservatorship, FHFA will determine how to best fulfill the requirements and purpose of Section 956, taking into consideration the possible duration of the conservatorship, the nature of our governance, the need to attract and retain management and other talent, limitations on the ability to employ equity-like instruments as incentive-based compensation, and any other circumstances FHFA deems relevant.
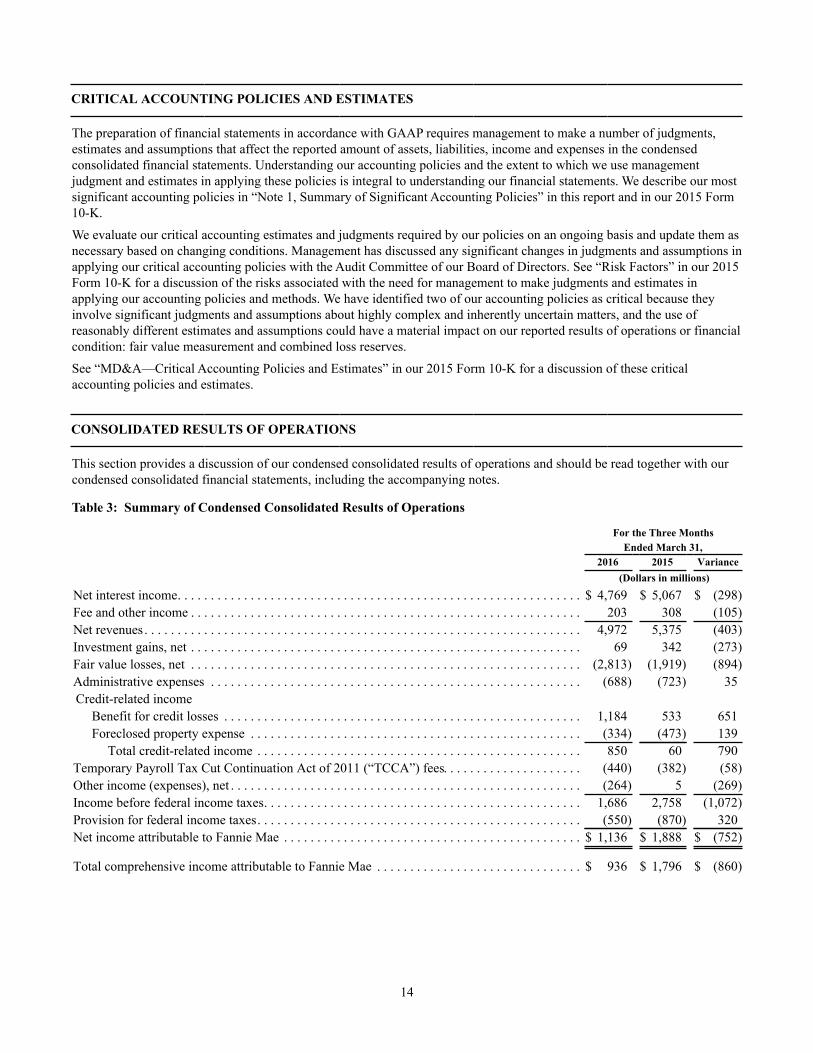
14
CRITICAL ACCOUNTING POLICIES AND ESTIMATES
The preparation of financial statements in accordance with GAAP requires management to make a number of judgments, estimates and assumptions that affect the reported amount of assets, liabilities, income and expenses in the condensed consolidated financial statements. Understanding our accounting policies and the extent to which we use management judgment and estimates in applying these policies is integral to understanding our financial statements. We describe our most significant accounting policies in “Note 1, Summary of Significant Accounting Policies” in this report and in our 2015 Form 10-K.
We evaluate our critical accounting estimates and judgments required by our policies on an ongoing basis and update them as necessary based on changing conditions. Management has discussed any significant changes in judgments and assumptions in applying our critical accounting policies with the Audit Committee of our Board of Directors. See “Risk Factors” in our 2015 Form 10-K for a discussion of the risks associated with the need for management to make judgments and estimates in applying our accounting policies and methods. We have identified two of our accounting policies as critical because they involve significant judgments and assumptions about highly complex and inherently uncertain matters, and the use of reasonably different estimates and assumptions could have a material impact on our reported results of operations or financial condition: fair value measurement and combined loss reserves.
See “MD&A—Critical Accounting Policies and Estimates” in our 2015 Form 10-K for a discussion of these critical accounting policies and estimates.
CONSOLIDATED RESULTS OF OPERATIONS
This section provides a discussion of our condensed consolidated results of operations and should be read together with our condensed consolidated financial statements, including the accompanying notes.
Table 3: Summary of Condensed Consolidated Results of Operations
For the Three MonthsEnded March 31,
2016 2015 Variance(Dollars in millions)
Net interest income. . . . . . . . . . . . . . . . . . . . . . . . . . . . . . . . . . . . . . . . . . . . . . . . . . . . . . . . . . . . . $ 4,769 $ 5,067 $ (298)Fee and other income . . . . . . . . . . . . . . . . . . . . . . . . . . . . . . . . . . . . . . . . . . . . . . . . . . . . . . . . . . . 203 308 (105)Net revenues . . . . . . . . . . . . . . . . . . . . . . . . . . . . . . . . . . . . . . . . . . . . . . . . . . . . . . . . . . . . . . . . . . 4,972 5,375 (403)Investment gains, net . . . . . . . . . . . . . . . . . . . . . . . . . . . . . . . . . . . . . . . . . . . . . . . . . . . . . . . . . . . 69 342 (273)Fair value losses, net . . . . . . . . . . . . . . . . . . . . . . . . . . . . . . . . . . . . . . . . . . . . . . . . . . . . . . . . . . . (2,813) (1,919) (894)Administrative expenses . . . . . . . . . . . . . . . . . . . . . . . . . . . . . . . . . . . . . . . . . . . . . . . . . . . . . . . . (688) (723) 35Credit-related income
Benefit for credit losses . . . . . . . . . . . . . . . . . . . . . . . . . . . . . . . . . . . . . . . . . . . . . . . . . . . . . . 1,184 533 651Foreclosed property expense . . . . . . . . . . . . . . . . . . . . . . . . . . . . . . . . . . . . . . . . . . . . . . . . . . (334) (473) 139
Total credit-related income . . . . . . . . . . . . . . . . . . . . . . . . . . . . . . . . . . . . . . . . . . . . . . . . . 850 60 790Temporary Payroll Tax Cut Continuation Act of 2011 (“TCCA”) fees. . . . . . . . . . . . . . . . . . . . . (440) (382) (58)Other income (expenses), net . . . . . . . . . . . . . . . . . . . . . . . . . . . . . . . . . . . . . . . . . . . . . . . . . . . . . (264) 5 (269)Income before federal income taxes. . . . . . . . . . . . . . . . . . . . . . . . . . . . . . . . . . . . . . . . . . . . . . . . 1,686 2,758 (1,072)Provision for federal income taxes. . . . . . . . . . . . . . . . . . . . . . . . . . . . . . . . . . . . . . . . . . . . . . . . . (550) (870) 320Net income attributable to Fannie Mae . . . . . . . . . . . . . . . . . . . . . . . . . . . . . . . . . . . . . . . . . . . . . $ 1,136 $ 1,888 $ (752)
Total comprehensive income attributable to Fannie Mae . . . . . . . . . . . . . . . . . . . . . . . . . . . . . . . $ 936 $ 1,796 $ (860)
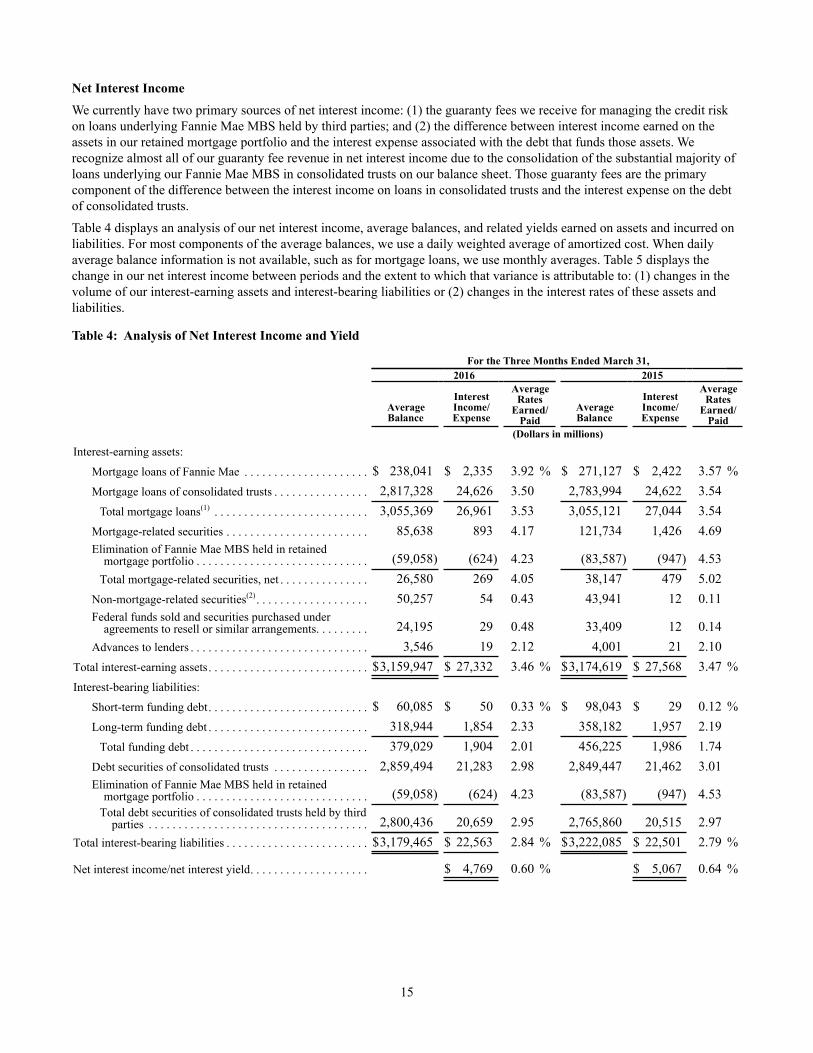
15
Net Interest IncomeWe currently have two primary sources of net interest income: (1) the guaranty fees we receive for managing the credit risk on loans underlying Fannie Mae MBS held by third parties; and (2) the difference between interest income earned on the assets in our retained mortgage portfolio and the interest expense associated with the debt that funds those assets. We recognize almost all of our guaranty fee revenue in net interest income due to the consolidation of the substantial majority of loans underlying our Fannie Mae MBS in consolidated trusts on our balance sheet. Those guaranty fees are the primary component of the difference between the interest income on loans in consolidated trusts and the interest expense on the debt of consolidated trusts.
Table 4 displays an analysis of our net interest income, average balances, and related yields earned on assets and incurred on liabilities. For most components of the average balances, we use a daily weighted average of amortized cost. When daily average balance information is not available, such as for mortgage loans, we use monthly averages. Table 5 displays the change in our net interest income between periods and the extent to which that variance is attributable to: (1) changes in the volume of our interest-earning assets and interest-bearing liabilities or (2) changes in the interest rates of these assets and liabilities.
Table 4: Analysis of Net Interest Income and Yield
For the Three Months Ended March 31,2016 2015
AverageBalance
InterestIncome/Expense
AverageRates
Earned/Paid
AverageBalance
InterestIncome/Expense
AverageRates
Earned/Paid
(Dollars in millions)
Interest-earning assets:
Mortgage loans of Fannie Mae . . . . . . . . . . . . . . . . . . . . . $ 238,041 $ 2,335 3.92 % $ 271,127 $ 2,422 3.57 %Mortgage loans of consolidated trusts . . . . . . . . . . . . . . . . 2,817,328 24,626 3.50 2,783,994 24,622 3.54
Total mortgage loans(1) . . . . . . . . . . . . . . . . . . . . . . . . . . 3,055,369 26,961 3.53 3,055,121 27,044 3.54Mortgage-related securities . . . . . . . . . . . . . . . . . . . . . . . . 85,638 893 4.17 121,734 1,426 4.69Elimination of Fannie Mae MBS held in retained
mortgage portfolio . . . . . . . . . . . . . . . . . . . . . . . . . . . . . (59,058) (624) 4.23 (83,587) (947) 4.53Total mortgage-related securities, net . . . . . . . . . . . . . . . 26,580 269 4.05 38,147 479 5.02
Non-mortgage-related securities(2) . . . . . . . . . . . . . . . . . . . 50,257 54 0.43 43,941 12 0.11Federal funds sold and securities purchased under
agreements to resell or similar arrangements. . . . . . . . . 24,195 29 0.48 33,409 12 0.14Advances to lenders . . . . . . . . . . . . . . . . . . . . . . . . . . . . . . 3,546 19 2.12 4,001 21 2.10
Total interest-earning assets. . . . . . . . . . . . . . . . . . . . . . . . . . . $3,159,947 $ 27,332 3.46 % $3,174,619 $ 27,568 3.47 %Interest-bearing liabilities:
Short-term funding debt. . . . . . . . . . . . . . . . . . . . . . . . . . . $ 60,085 $ 50 0.33 % $ 98,043 $ 29 0.12 %Long-term funding debt . . . . . . . . . . . . . . . . . . . . . . . . . . . 318,944 1,854 2.33 358,182 1,957 2.19
Total funding debt . . . . . . . . . . . . . . . . . . . . . . . . . . . . . . 379,029 1,904 2.01 456,225 1,986 1.74Debt securities of consolidated trusts . . . . . . . . . . . . . . . . 2,859,494 21,283 2.98 2,849,447 21,462 3.01Elimination of Fannie Mae MBS held in retained
mortgage portfolio . . . . . . . . . . . . . . . . . . . . . . . . . . . . . (59,058) (624) 4.23 (83,587) (947) 4.53Total debt securities of consolidated trusts held by third
parties . . . . . . . . . . . . . . . . . . . . . . . . . . . . . . . . . . . . . 2,800,436 20,659 2.95 2,765,860 20,515 2.97Total interest-bearing liabilities . . . . . . . . . . . . . . . . . . . . . . . . $3,179,465 $ 22,563 2.84 % $3,222,085 $ 22,501 2.79 %
Net interest income/net interest yield. . . . . . . . . . . . . . . . . . . . $ 4,769 0.60 % $ 5,067 0.64 %
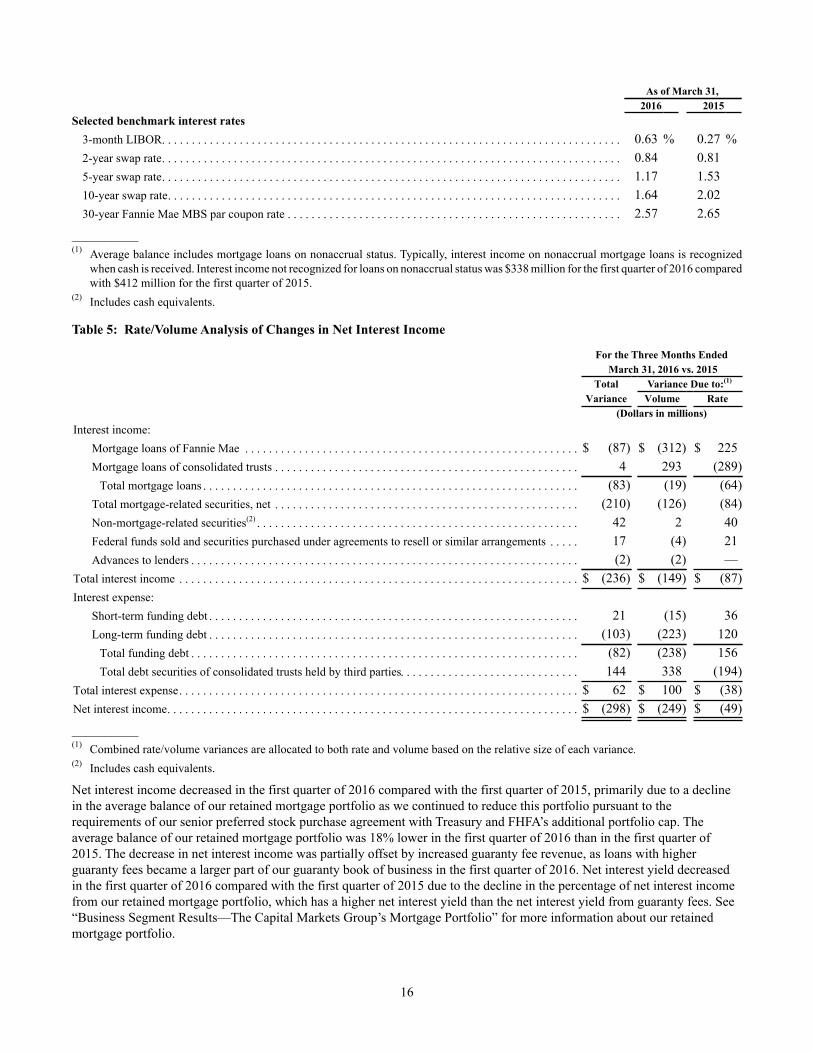
16
As of March 31,2016 2015
Selected benchmark interest rates3-month LIBOR. . . . . . . . . . . . . . . . . . . . . . . . . . . . . . . . . . . . . . . . . . . . . . . . . . . . . . . . . . . . . . . . . . . . . . . . . . . . . 0.63 % 0.27 %2-year swap rate. . . . . . . . . . . . . . . . . . . . . . . . . . . . . . . . . . . . . . . . . . . . . . . . . . . . . . . . . . . . . . . . . . . . . . . . . . . . . 0.84 0.815-year swap rate. . . . . . . . . . . . . . . . . . . . . . . . . . . . . . . . . . . . . . . . . . . . . . . . . . . . . . . . . . . . . . . . . . . . . . . . . . . . . 1.17 1.5310-year swap rate. . . . . . . . . . . . . . . . . . . . . . . . . . . . . . . . . . . . . . . . . . . . . . . . . . . . . . . . . . . . . . . . . . . . . . . . . . . . 1.64 2.0230-year Fannie Mae MBS par coupon rate . . . . . . . . . . . . . . . . . . . . . . . . . . . . . . . . . . . . . . . . . . . . . . . . . . . . . . . . 2.57 2.65
__________(1) Average balance includes mortgage loans on nonaccrual status. Typically, interest income on nonaccrual mortgage loans is recognized
when cash is received. Interest income not recognized for loans on nonaccrual status was $338 million for the first quarter of 2016 compared with $412 million for the first quarter of 2015.
(2) Includes cash equivalents.
Table 5: Rate/Volume Analysis of Changes in Net Interest Income
For the Three Months EndedMarch 31, 2016 vs. 2015
Total Variance Due to:(1)
Variance Volume Rate(Dollars in millions)
Interest income:Mortgage loans of Fannie Mae . . . . . . . . . . . . . . . . . . . . . . . . . . . . . . . . . . . . . . . . . . . . . . . . . . . . . . . . $ (87) $ (312) $ 225Mortgage loans of consolidated trusts . . . . . . . . . . . . . . . . . . . . . . . . . . . . . . . . . . . . . . . . . . . . . . . . . . . 4 293 (289)
Total mortgage loans . . . . . . . . . . . . . . . . . . . . . . . . . . . . . . . . . . . . . . . . . . . . . . . . . . . . . . . . . . . . . . . (83) (19) (64)Total mortgage-related securities, net . . . . . . . . . . . . . . . . . . . . . . . . . . . . . . . . . . . . . . . . . . . . . . . . . . . (210) (126) (84)Non-mortgage-related securities(2) . . . . . . . . . . . . . . . . . . . . . . . . . . . . . . . . . . . . . . . . . . . . . . . . . . . . . . 42 2 40Federal funds sold and securities purchased under agreements to resell or similar arrangements . . . . . 17 (4) 21Advances to lenders . . . . . . . . . . . . . . . . . . . . . . . . . . . . . . . . . . . . . . . . . . . . . . . . . . . . . . . . . . . . . . . . . (2) (2) —
Total interest income . . . . . . . . . . . . . . . . . . . . . . . . . . . . . . . . . . . . . . . . . . . . . . . . . . . . . . . . . . . . . . . . . . . $ (236) $ (149) $ (87)Interest expense:
Short-term funding debt . . . . . . . . . . . . . . . . . . . . . . . . . . . . . . . . . . . . . . . . . . . . . . . . . . . . . . . . . . . . . . 21 (15) 36Long-term funding debt . . . . . . . . . . . . . . . . . . . . . . . . . . . . . . . . . . . . . . . . . . . . . . . . . . . . . . . . . . . . . . (103) (223) 120
Total funding debt . . . . . . . . . . . . . . . . . . . . . . . . . . . . . . . . . . . . . . . . . . . . . . . . . . . . . . . . . . . . . . . . . (82) (238) 156Total debt securities of consolidated trusts held by third parties. . . . . . . . . . . . . . . . . . . . . . . . . . . . . . 144 338 (194)
Total interest expense. . . . . . . . . . . . . . . . . . . . . . . . . . . . . . . . . . . . . . . . . . . . . . . . . . . . . . . . . . . . . . . . . . . $ 62 $ 100 $ (38)Net interest income. . . . . . . . . . . . . . . . . . . . . . . . . . . . . . . . . . . . . . . . . . . . . . . . . . . . . . . . . . . . . . . . . . . . . $ (298) $ (249) $ (49)__________(1) Combined rate/volume variances are allocated to both rate and volume based on the relative size of each variance.(2) Includes cash equivalents.
Net interest income decreased in the first quarter of 2016 compared with the first quarter of 2015, primarily due to a decline in the average balance of our retained mortgage portfolio as we continued to reduce this portfolio pursuant to the requirements of our senior preferred stock purchase agreement with Treasury and FHFA’s additional portfolio cap. The average balance of our retained mortgage portfolio was 18% lower in the first quarter of 2016 than in the first quarter of 2015. The decrease in net interest income was partially offset by increased guaranty fee revenue, as loans with higher guaranty fees became a larger part of our guaranty book of business in the first quarter of 2016. Net interest yield decreased in the first quarter of 2016 compared with the first quarter of 2015 due to the decline in the percentage of net interest income from our retained mortgage portfolio, which has a higher net interest yield than the net interest yield from guaranty fees. See “Business Segment Results—The Capital Markets Group’s Mortgage Portfolio” for more information about our retained mortgage portfolio.

17
Fee and Other IncomeFee and other income includes transaction fees, multifamily fees, technology fees and other miscellaneous income. Fee and other income decreased in the first quarter of 2016 compared with the first quarter of 2015 primarily driven by lower technology fees as a result of eliminating fees charged to our customers for using our Desktop Underwriter and Desktop Originator® systems beginning in June 2015.
Investment Gains, NetInvestment gains, net primarily includes gains and losses recognized from the sale of available-for-sale securities, gains and losses recognized on the consolidation and deconsolidation of securities, and net other-than-temporary impairments recognized on our investments. Investment gains decreased in the first quarter of 2016 compared with the first quarter of 2015 primarily due to a decline in sales volume of non-agency securities.
Fair Value Losses, Net
Table 6 displays the components of our fair value gains and losses.
Table 6: Fair Value Losses, Net
For the Three MonthsEnded March 31,
2016 2015(Dollars in millions)
Risk management derivatives fair value losses attributable to:Net contractual interest expense accruals on interest rate swaps . . . . . . . . . . . . . . . . . . . . . . . . . . . $ (269) $ (229)Net change in fair value during the period . . . . . . . . . . . . . . . . . . . . . . . . . . . . . . . . . . . . . . . . . . . . (2,102) (1,285)
Total risk management derivatives fair value losses, net. . . . . . . . . . . . . . . . . . . . . . . . . . . . . . (2,371) (1,514)Mortgage commitment derivatives fair value losses, net . . . . . . . . . . . . . . . . . . . . . . . . . . . . . . . . . . . . (362) (239)Total derivatives fair value losses, net . . . . . . . . . . . . . . . . . . . . . . . . . . . . . . . . . . . . . . . . . . . . . . . . . . (2,733) (1,753)Trading securities gains, net . . . . . . . . . . . . . . . . . . . . . . . . . . . . . . . . . . . . . . . . . . . . . . . . . . . . . . . . . . 28 36Other, net(1) . . . . . . . . . . . . . . . . . . . . . . . . . . . . . . . . . . . . . . . . . . . . . . . . . . . . . . . . . . . . . . . . . . . . . . . (108) (202)
Fair value losses, net . . . . . . . . . . . . . . . . . . . . . . . . . . . . . . . . . . . . . . . . . . . . . . . . . . . . . . . . . . . . $ (2,813) $ (1,919)__________(1) Consists of debt fair value gains (losses), net, which includes gains (losses) on CAS; debt foreign exchange gains (losses), net; and
mortgage loans fair value gains (losses), net.
Risk Management Derivatives Fair Value Losses, NetRisk management derivative instruments are an integral part of our interest rate risk management strategy. We supplement our issuance of debt securities with derivative instruments to further reduce interest rate risk. We recognized risk management derivative fair value losses in the first quarter of 2016 and 2015 primarily as a result of decreases in the fair value of our pay-fixed derivatives due to declines in longer-term swap rates during the periods.
We present, by derivative instrument type, the fair value gains and losses, net on our derivatives in “Note 9, Derivative Instruments.”
Mortgage Commitment Derivatives Fair Value Losses, NetWe recognized fair value losses on our mortgage commitments in the first quarter of 2016 and 2015 primarily due to losses on commitments to sell mortgage-related securities driven by an increase in prices as interest rates decreased during the commitment periods.
Credit-Related Income We refer to our provision (benefit) for loan losses and provision (benefit) for guaranty losses collectively as our “provision (benefit) for credit losses.” Credit-related income (expense) consists of our provision (benefit) for credit losses and foreclosed property expense (income).
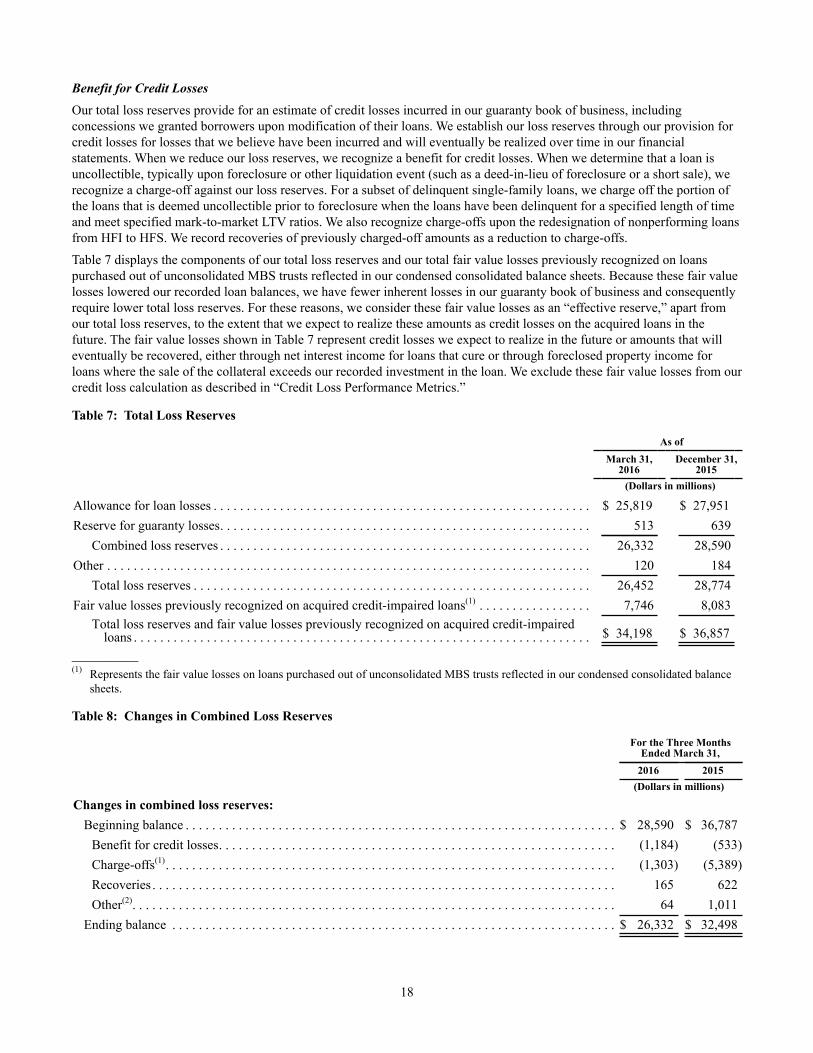
18
Benefit for Credit LossesOur total loss reserves provide for an estimate of credit losses incurred in our guaranty book of business, including concessions we granted borrowers upon modification of their loans. We establish our loss reserves through our provision for credit losses for losses that we believe have been incurred and will eventually be realized over time in our financial statements. When we reduce our loss reserves, we recognize a benefit for credit losses. When we determine that a loan is uncollectible, typically upon foreclosure or other liquidation event (such as a deed-in-lieu of foreclosure or a short sale), we recognize a charge-off against our loss reserves. For a subset of delinquent single-family loans, we charge off the portion of the loans that is deemed uncollectible prior to foreclosure when the loans have been delinquent for a specified length of time and meet specified mark-to-market LTV ratios. We also recognize charge-offs upon the redesignation of nonperforming loans from HFI to HFS. We record recoveries of previously charged-off amounts as a reduction to charge-offs.
Table 7 displays the components of our total loss reserves and our total fair value losses previously recognized on loans purchased out of unconsolidated MBS trusts reflected in our condensed consolidated balance sheets. Because these fair value losses lowered our recorded loan balances, we have fewer inherent losses in our guaranty book of business and consequently require lower total loss reserves. For these reasons, we consider these fair value losses as an “effective reserve,” apart from our total loss reserves, to the extent that we expect to realize these amounts as credit losses on the acquired loans in the future. The fair value losses shown in Table 7 represent credit losses we expect to realize in the future or amounts that will eventually be recovered, either through net interest income for loans that cure or through foreclosed property income for loans where the sale of the collateral exceeds our recorded investment in the loan. We exclude these fair value losses from our credit loss calculation as described in “Credit Loss Performance Metrics.”
Table 7: Total Loss Reserves
As ofMarch 31,
2016December 31,
2015(Dollars in millions)
Allowance for loan losses . . . . . . . . . . . . . . . . . . . . . . . . . . . . . . . . . . . . . . . . . . . . . . . . . . . . . . . . . $ 25,819 $ 27,951Reserve for guaranty losses. . . . . . . . . . . . . . . . . . . . . . . . . . . . . . . . . . . . . . . . . . . . . . . . . . . . . . . . 513 639
Combined loss reserves . . . . . . . . . . . . . . . . . . . . . . . . . . . . . . . . . . . . . . . . . . . . . . . . . . . . . . . . 26,332 28,590Other . . . . . . . . . . . . . . . . . . . . . . . . . . . . . . . . . . . . . . . . . . . . . . . . . . . . . . . . . . . . . . . . . . . . . . . . . 120 184
Total loss reserves . . . . . . . . . . . . . . . . . . . . . . . . . . . . . . . . . . . . . . . . . . . . . . . . . . . . . . . . . . . . 26,452 28,774Fair value losses previously recognized on acquired credit-impaired loans(1) . . . . . . . . . . . . . . . . . 7,746 8,083
Total loss reserves and fair value losses previously recognized on acquired credit-impairedloans . . . . . . . . . . . . . . . . . . . . . . . . . . . . . . . . . . . . . . . . . . . . . . . . . . . . . . . . . . . . . . . . . . . . . $ 34,198 $ 36,857
__________(1) Represents the fair value losses on loans purchased out of unconsolidated MBS trusts reflected in our condensed consolidated balance
sheets.
Table 8: Changes in Combined Loss Reserves
For the Three MonthsEnded March 31,
2016 2015(Dollars in millions)
Changes in combined loss reserves:Beginning balance . . . . . . . . . . . . . . . . . . . . . . . . . . . . . . . . . . . . . . . . . . . . . . . . . . . . . . . . . . . . . . . . . $ 28,590 $ 36,787
Benefit for credit losses. . . . . . . . . . . . . . . . . . . . . . . . . . . . . . . . . . . . . . . . . . . . . . . . . . . . . . . . . . . . (1,184) (533)Charge-offs(1). . . . . . . . . . . . . . . . . . . . . . . . . . . . . . . . . . . . . . . . . . . . . . . . . . . . . . . . . . . . . . . . . . . . (1,303) (5,389)Recoveries . . . . . . . . . . . . . . . . . . . . . . . . . . . . . . . . . . . . . . . . . . . . . . . . . . . . . . . . . . . . . . . . . . . . . . 165 622Other(2). . . . . . . . . . . . . . . . . . . . . . . . . . . . . . . . . . . . . . . . . . . . . . . . . . . . . . . . . . . . . . . . . . . . . . . . . 64 1,011
Ending balance . . . . . . . . . . . . . . . . . . . . . . . . . . . . . . . . . . . . . . . . . . . . . . . . . . . . . . . . . . . . . . . . . . . $ 26,332 $ 32,498

19
As ofMarch 31,
2016December 31,
2015(Dollars in millions)
Allocation of combined loss reserves:Balance at end of each period attributable to:
Single-family . . . . . . . . . . . . . . . . . . . . . . . . . . . . . . . . . . . . . . . . . . . . . . . . . . . . . . . . . . . . . . . . . $ 26,092 $ 28,325Multifamily . . . . . . . . . . . . . . . . . . . . . . . . . . . . . . . . . . . . . . . . . . . . . . . . . . . . . . . . . . . . . . . . . . . 240 265 Total . . . . . . . . . . . . . . . . . . . . . . . . . . . . . . . . . . . . . . . . . . . . . . . . . . . . . . . . . . . . . . . . . . . . . $ 26,332 $ 28,590
Single-family and multifamily combined loss reserves as a percentage of applicableguaranty book of business:Single-family . . . . . . . . . . . . . . . . . . . . . . . . . . . . . . . . . . . . . . . . . . . . . . . . . . . . . . . . . . . . . . . . . 0.92 % 1.00 %Multifamily . . . . . . . . . . . . . . . . . . . . . . . . . . . . . . . . . . . . . . . . . . . . . . . . . . . . . . . . . . . . . . . . . . . 0.11 0.12
Combined loss reserves as a percentage of:Total guaranty book of business . . . . . . . . . . . . . . . . . . . . . . . . . . . . . . . . . . . . . . . . . . . . . . . . . . . 0.87 % 0.94 %Recorded investment in nonaccrual loans . . . . . . . . . . . . . . . . . . . . . . . . . . . . . . . . . . . . . . . . . . . 53.13 57.86
_________(1) Our charge-offs for 2015 reflect initial charge-offs associated with our approach to adopting the charge-off provisions of the Advisory
Bulletin, as well as charge-offs relating to a change in accounting policy for nonaccrual loans.(2) Amounts represent changes in other loss reserves which are reflected in benefit for credit losses, charge-offs and recoveries. The amount of our provision or benefit for credit losses may vary from period to period based on factors such as changes in actual and expected home prices, borrower payment behavior, the types and volumes of our loss mitigation activities, the volumes of foreclosures completed, redesignations of loans from HFI to HFS, and fluctuations in mortgage interest rates. In addition, our provision or benefit for credit losses and our loss reserves can be impacted by updates to the models, assumptions and data used in determining our allowance for loan losses.
The following factors contributed to our benefit for credit losses in the first quarter of 2016: • Actual and projected mortgage interest rates declined during the first quarter of 2016. As mortgage interest rates
decline, we expect an increase in future prepayments on single-family individually impaired loans, including modified loans. Higher expected prepayments shorten the expected lives of modified loans, which decreases the impairment relating to concessions provided on these loans and results in a decrease in the provision for credit losses.
• Home prices, including distressed property valuations, increased during the first quarter of 2016. Higher home prices decrease the likelihood that loans will default and reduce the amount of credit loss on loans that do default, which impacts our estimate of losses and ultimately reduces our total loss reserves and provision for credit losses.
We recognized a benefit for credit losses in the first quarter of 2015 primarily due to an increase in actual and forecasted home prices, a decline in actual and projected interest rates and the liquidation of mortgage loans. Our approach to the adoption of the charge-off provisions of the Advisory Bulletin on January 1, 2015 had no impact on the amount of benefit for credit losses that we recognized in the first quarter of 2015.
We discuss our expectations regarding our future loss reserves in “Executive Summary—Outlook—Loss Reserves.”

20
Troubled Debt Restructurings and Nonaccrual LoansTable 9 displays the composition of loans restructured in a troubled debt restructuring (“TDR”) that are on accrual status and loans on nonaccrual status. The table includes our recorded investment in HFI and HFS mortgage loans. For information on the impact of TDRs and other individually impaired loans on our allowance for loan losses, see “Note 3, Mortgage Loans.”
Table 9: Troubled Debt Restructurings and Nonaccrual Loans
As ofMarch 31,
2016December 31,
2015(Dollars in millions)
TDRs on accrual status:Single-family . . . . . . . . . . . . . . . . . . . . . . . . . . . . . . . . . . . . . . . . . . . . . . . . . . . . . . . . . . . . . . $ 137,303 $ 140,588Multifamily. . . . . . . . . . . . . . . . . . . . . . . . . . . . . . . . . . . . . . . . . . . . . . . . . . . . . . . . . . . . . . . . 347 376
Total TDRs on accrual status. . . . . . . . . . . . . . . . . . . . . . . . . . . . . . . . . . . . . . . . . . . . . . . . . $ 137,650 $ 140,964Nonaccrual loans:
Single-family . . . . . . . . . . . . . . . . . . . . . . . . . . . . . . . . . . . . . . . . . . . . . . . . . . . . . . . . . . . . . . $ 49,018 $ 48,821Multifamily. . . . . . . . . . . . . . . . . . . . . . . . . . . . . . . . . . . . . . . . . . . . . . . . . . . . . . . . . . . . . . . . 547 591
Total nonaccrual loans . . . . . . . . . . . . . . . . . . . . . . . . . . . . . . . . . . . . . . . . . . . . . . . . . . . . . . $ 49,565 $ 49,412Accruing on-balance sheet loans past due 90 days or more(1) . . . . . . . . . . . . . . . . . . . . . . . . . . . . $ 460 $ 499
For the Three MonthsEnded March 31,
2016 2015(Dollars in millions)
Interest related to on-balance sheet TDRs and nonaccrual loans:Interest income forgone(2) . . . . . . . . . . . . . . . . . . . . . . . . . . . . . . . . . . . . . . . . . . . . . . . . . . . . . $ 1,238 $ 1,666Interest income recognized for the period(3) . . . . . . . . . . . . . . . . . . . . . . . . . . . . . . . . . . . . . . . 1,610 1,480
__________(1) Includes loans that, as of the end of each period, are 90 days or more past due and continuing to accrue interest. The majority of these
amounts consists of loans insured or guaranteed by the U.S. government and loans for which we have recourse against the seller in the event of a default.
(2) Represents the amount of interest income we did not recognize, but would have recognized during the period for nonaccrual loans and TDRs on accrual status as of the end of each period had the loans performed according to their original contractual terms.
(3) Represents interest income recognized during the period, including the amortization of any deferred cost basis adjustments, for loans classified as either nonaccrual loans or TDRs on accrual status as of the end of each period. Includes primarily amounts accrued while the loans were performing and cash payments received on nonaccrual loans.
Foreclosed Property ExpenseForeclosed property expense decreased in the first quarter of 2016 compared with the first quarter of 2015 primarily due to a decline in the number of foreclosed properties in the first quarter of 2016 compared with the first quarter of 2015.
Credit Loss Performance MetricsOur credit-related expense (income) should be considered in conjunction with our credit loss performance metrics. Our credit loss performance metrics, however, are not defined terms within GAAP and may not be calculated in the same manner as similarly titled measures reported by other companies. Because management does not view changes in the fair value of our mortgage loans as credit losses, we adjust our credit loss performance metrics for the impact associated with our acquisition of credit-impaired loans from unconsolidated MBS trusts. We also exclude interest forgone on nonaccrual loans and TDRs, other-than-temporary impairment losses resulting from deterioration in the credit quality of our mortgage-related securities and accretion of interest income on acquired credit-impaired loans from credit losses. We believe that credit loss performance metrics may be useful to investors as the losses are presented as a percentage of our book of business and have historically been used by analysts, investors and other companies within the financial services industry. Moreover, by presenting credit losses with and without the effect of fair value losses associated with the acquisition of credit-impaired loans, investors are able to evaluate our credit performance on a more consistent basis among periods. Table 10 displays the components of our credit loss performance metrics as well as our single-family and multifamily initial charge-off severity rates.

21
Table 10: Credit Loss Performance Metrics
For the Three Months Ended March 31,2016 2015
Amount Ratio(1) Amount Ratio(1)
(Dollars in millions)
Charge-offs, net of recoveries . . . . . . . . . . . . . . . . . . . . . . . . . . . . . . . . . . . . . . . . . . . . . . . . $ 1,138 15.0 bps $ 1,212 15.9 bpsAdoption of Advisory Bulletin and change in accounting policy(2). . . . . . . . . . . . . . . . . . . . — — 3,555 46.6Foreclosed property expense . . . . . . . . . . . . . . . . . . . . . . . . . . . . . . . . . . . . . . . . . . . . . . . . . 334 4.4 473 6.2Credit losses including the effect of fair value losses on acquired credit-impaired loans. . . 1,472 19.4 5,240 68.7Plus: Impact of acquired credit-impaired loans on charge-offs and foreclosed property
expense(3) . . . . . . . . . . . . . . . . . . . . . . . . . . . . . . . . . . . . . . . . . . . . . . . . . . . . . . . . . . . . . . 100 1.3 136 1.8Credit losses and credit loss ratio. . . . . . . . . . . . . . . . . . . . . . . . . . . . . . . . . . . . . . . . . . . . . . $ 1,572 20.7 bps $ 5,376 70.5 bpsCredit losses attributable to:
Single-family . . . . . . . . . . . . . . . . . . . . . . . . . . . . . . . . . . . . . . . . . . . . . . . . . . . . . . . . . . $ 1,569 $ 5,373Multifamily . . . . . . . . . . . . . . . . . . . . . . . . . . . . . . . . . . . . . . . . . . . . . . . . . . . . . . . . . . . 3 3 Total . . . . . . . . . . . . . . . . . . . . . . . . . . . . . . . . . . . . . . . . . . . . . . . . . . . . . . . . . . . . . . $ 1,572 $ 5,376
Single-family initial charge-off severity rate(4) . . . . . . . . . . . . . . . . . . . . . . . . . . . . . . . . . . . 23.16 % 30.81 %Multifamily initial charge-off severity rate(4). . . . . . . . . . . . . . . . . . . . . . . . . . . . . . . . . . . . . 15.35 % 23.60 %
__________(1) Basis points are based on the annualized amount for each line item presented divided by the average guaranty book of business during
the period.(2) Our charge-offs for 2015 reflect initial charge-offs associated with our approach to adopting the charge-off provisions of the Advisory
Bulletin, as well as charge-offs relating to a change in accounting policy for nonaccrual loans.(3) Includes fair value losses from acquired credit-impaired loans.(4) Single-family and multifamily rates exclude fair value losses on credit-impaired loans acquired from MBS trusts and any costs, gains or
losses associated with REO after initial acquisition through final disposition. The single-family rate includes charge-offs pursuant to the provisions of the Advisory Bulletin and charge-offs of property tax and insurance receivables, while it excludes charge-offs from short sales and third-party sales. Multifamily rate is net of risk-sharing agreements.
Credit losses and our credit loss ratio decreased in the first quarter of 2016 compared with the first quarter of 2015 primarily due to our approach to adopting the charge-off provisions of the Advisory Bulletin and a change in our accounting policy for nonaccrual loans in the first quarter of 2015.
We discuss our expectations regarding our future credit losses in “Executive Summary—Outlook—Credit Losses.”

22
Table 11 displays concentrations of our single-family credit losses based on geography, credit characteristics and loan vintages.
Table 11: Credit Loss Concentration Analysis
Percentage of Single-Family Conventional Guaranty Book of Business Outstanding(1)
Percentage of Single-Family Credit Losses(2)
As of For the Three MonthsEnded March 31,March 31, December 31, March 31,
2016 2015 2015 2016 2015
Geographical Distribution:California . . . . . . . . . . . . . . . . . . . . . . . . . . . . . . . . . . . . . 20% 20% 20% 1% 1%Florida . . . . . . . . . . . . . . . . . . . . . . . . . . . . . . . . . . . . . . . 6 6 6 9 29New Jersey . . . . . . . . . . . . . . . . . . . . . . . . . . . . . . . . . . . . 4 4 4 17 22New York. . . . . . . . . . . . . . . . . . . . . . . . . . . . . . . . . . . . . 5 5 5 24 14All other states . . . . . . . . . . . . . . . . . . . . . . . . . . . . . . . . . 65 65 65 49 34
Select higher-risk product features(3). . . . . . . . . . . . . . . . . . 22 22 22 58 66Vintages:(4)
2004 and prior . . . . . . . . . . . . . . . . . . . . . . . . . . . . . . . . . 5 5 7 17 72005 - 2008 . . . . . . . . . . . . . . . . . . . . . . . . . . . . . . . . . . . 10 10 12 69 882009 - 2016 . . . . . . . . . . . . . . . . . . . . . . . . . . . . . . . . . . . 85 85 81 14 5
__________(1) Calculated based on the unpaid principal balance of loans, where we have detailed loan-level information, for each category divided by
the unpaid principal balance of our single-family conventional guaranty book of business as of the end of each period.(2) Excludes the impact of recoveries resulting from resolution agreements related to representation and warranty matters and
compensatory fee income related to servicing matters that have not been allocated to specific loans.(3) Includes Alt-A loans, subprime loans, interest-only loans, loans with original LTV ratios greater than 90% and loans with FICO credit
scores less than 620.(4) Credit losses on mortgage loans typically do not peak until the third through sixth years following origination; however, this range can
vary based on many factors, including changes in macroeconomic conditions and foreclosure timelines.
As shown in Table 11, the majority of our credit losses for the first quarter of 2016 continued to be driven by loans originated in 2005 through 2008. Our credit losses in New York were higher in the first quarter of 2016 compared with the first quarter of 2015 because we charged off a greater portion of excessively delinquent loans in this state in the first quarter of 2016 than in the first quarter of 2015. Our credit losses in Florida and New Jersey, as well as credit losses on loans originated in 2005 through 2008, were higher in the first quarter of 2015 compared with the first quarter of 2016 primarily because we charged off a portion of a large number of excessively delinquent loans in these states and relating to these vintages that remained in the foreclosure process pursuant to the revised charge-off policy we implemented in 2015. We provide more detailed single-family credit performance information, including serious delinquency rates share and foreclosure activity, in “Risk Management—Credit Risk Management—Single-Family Mortgage Credit Risk Management.”
Temporary Payroll Tax Cut Continuation Act of 2011 (“TCCA”) FeesPursuant to the TCCA, which was enacted by Congress in December 2011, FHFA directed us to increase our single-family guaranty fees by 10 basis points and remit this increase to Treasury. This TCCA-related revenue is included in “Net interest income” and the expense is recognized as “TCCA fees.” TCCA fees increased in the first quarter of 2016 compared with the first quarter of 2015 as our book of business subject to the TCCA continued to grow. We expect the guaranty fees collected and expenses incurred under the TCCA to continue to increase in the future.
Other Income (Expenses), NetOther income (expenses), net consists of debt extinguishment gains (losses), gains on sale of partnership investments and other miscellaneous income (expenses). We recognized expense during the first quarter of 2016, compared to income during the first quarter of 2015. The shift from income to expense was primarily driven by lower gains on the sale of partnership investments during the first quarter of 2016 compared with the first quarter of 2015.
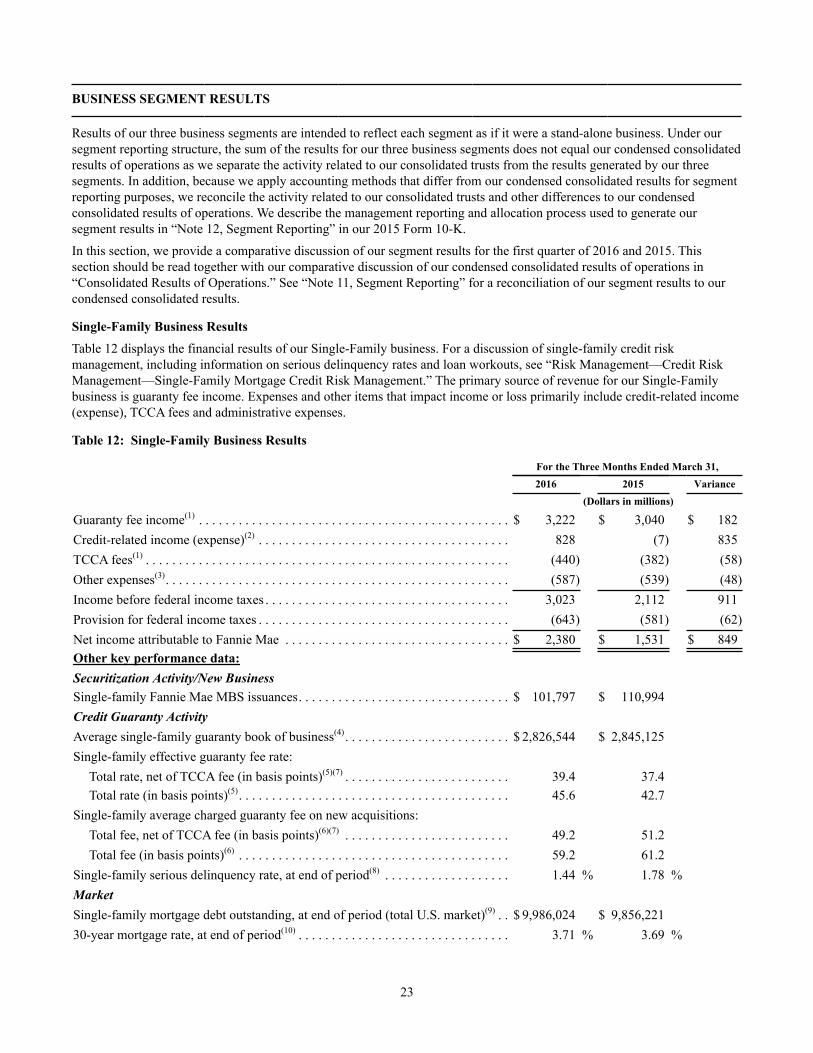
23
BUSINESS SEGMENT RESULTS
Results of our three business segments are intended to reflect each segment as if it were a stand-alone business. Under our segment reporting structure, the sum of the results for our three business segments does not equal our condensed consolidated results of operations as we separate the activity related to our consolidated trusts from the results generated by our three segments. In addition, because we apply accounting methods that differ from our condensed consolidated results for segment reporting purposes, we reconcile the activity related to our consolidated trusts and other differences to our condensed consolidated results of operations. We describe the management reporting and allocation process used to generate our segment results in “Note 12, Segment Reporting” in our 2015 Form 10-K.
In this section, we provide a comparative discussion of our segment results for the first quarter of 2016 and 2015. This section should be read together with our comparative discussion of our condensed consolidated results of operations in “Consolidated Results of Operations.” See “Note 11, Segment Reporting” for a reconciliation of our segment results to our condensed consolidated results.
Single-Family Business ResultsTable 12 displays the financial results of our Single-Family business. For a discussion of single-family credit risk management, including information on serious delinquency rates and loan workouts, see “Risk Management—Credit Risk Management—Single-Family Mortgage Credit Risk Management.” The primary source of revenue for our Single-Family business is guaranty fee income. Expenses and other items that impact income or loss primarily include credit-related income (expense), TCCA fees and administrative expenses.
Table 12: Single-Family Business Results
For the Three Months Ended March 31,2016 2015 Variance
(Dollars in millions)
Guaranty fee income(1) . . . . . . . . . . . . . . . . . . . . . . . . . . . . . . . . . . . . . . . . . . . . . . . $ 3,222 $ 3,040 $ 182Credit-related income (expense)(2) . . . . . . . . . . . . . . . . . . . . . . . . . . . . . . . . . . . . . . 828 (7) 835TCCA fees(1) . . . . . . . . . . . . . . . . . . . . . . . . . . . . . . . . . . . . . . . . . . . . . . . . . . . . . . . (440) (382) (58)Other expenses(3). . . . . . . . . . . . . . . . . . . . . . . . . . . . . . . . . . . . . . . . . . . . . . . . . . . . (587) (539) (48)Income before federal income taxes . . . . . . . . . . . . . . . . . . . . . . . . . . . . . . . . . . . . . 3,023 2,112 911Provision for federal income taxes . . . . . . . . . . . . . . . . . . . . . . . . . . . . . . . . . . . . . . (643) (581) (62)Net income attributable to Fannie Mae . . . . . . . . . . . . . . . . . . . . . . . . . . . . . . . . . . $ 2,380 $ 1,531 $ 849Other key performance data:Securitization Activity/New BusinessSingle-family Fannie Mae MBS issuances. . . . . . . . . . . . . . . . . . . . . . . . . . . . . . . . $ 101,797 $ 110,994Credit Guaranty ActivityAverage single-family guaranty book of business(4) . . . . . . . . . . . . . . . . . . . . . . . . . $ 2,826,544 $ 2,845,125Single-family effective guaranty fee rate:
Total rate, net of TCCA fee (in basis points)(5)(7) . . . . . . . . . . . . . . . . . . . . . . . . . 39.4 37.4Total rate (in basis points)(5). . . . . . . . . . . . . . . . . . . . . . . . . . . . . . . . . . . . . . . . . 45.6 42.7
Single-family average charged guaranty fee on new acquisitions:Total fee, net of TCCA fee (in basis points)(6)(7) . . . . . . . . . . . . . . . . . . . . . . . . . 49.2 51.2Total fee (in basis points)(6) . . . . . . . . . . . . . . . . . . . . . . . . . . . . . . . . . . . . . . . . . 59.2 61.2
Single-family serious delinquency rate, at end of period(8) . . . . . . . . . . . . . . . . . . . 1.44 % 1.78 %MarketSingle-family mortgage debt outstanding, at end of period (total U.S. market)(9) . . $ 9,986,024 $ 9,856,22130-year mortgage rate, at end of period(10) . . . . . . . . . . . . . . . . . . . . . . . . . . . . . . . . 3.71 % 3.69 %

24
__________(1) Reflects the impact of a 10 basis point guaranty fee increase implemented in 2012 pursuant to the TCCA, the incremental revenue from
which is remitted to Treasury. The resulting revenue is included in guaranty fee income and the expense is recognized as “TCCA fees.” (2) Consists of the benefit (provision) for credit losses and foreclosed property income (expense).(3) Consists of net interest income (loss), investment gains (losses), net, fair value gains (losses), net, gains (losses) from partnership
investments, fee and other income (expense), administrative expenses and other expenses.(4) Our single-family guaranty book of business consists of (a) single-family mortgage loans of Fannie Mae, (b) single-family mortgage
loans underlying Fannie Mae MBS, and (c) other credit enhancements that we provide on single-family mortgage assets, such as long-term standby commitments. It excludes non-Fannie Mae mortgage-related securities held in our retained mortgage portfolio for which we do not provide a guaranty.
(5) Calculated based on annualized Single-Family segment guaranty fee income divided by the average single-family guaranty book of business.
(6) Calculated based on the average contractual fee rate for our single-family guaranty arrangements entered into during the period plus the recognition of any upfront cash payments ratably over an estimated average life.
(7) Excludes the impact of a 10 basis point guaranty fee increase implemented in 2012 pursuant to the TCCA, the incremental revenue from which is remitted to Treasury and not retained by us.
(8) Calculated based on the number of single-family conventional loans that are 90 days or more past due or in the foreclosure process, divided by the number of loans in our single-family conventional guaranty book of business.
(9) Information labeled as of March 31, 2016 is as of December 31, 2015 and is based on the Federal Reserve’s March 2016 mortgage debt outstanding release, the latest date for which the Federal Reserve has estimated mortgage debt outstanding for single-family residences. Prior period amounts have been changed to reflect revised historical data from the Federal Reserve.
(10) Based on Freddie Mac’s Primary Mortgage Market Survey® rate for the last week in the period, which represents the national average mortgage commitment rate to a qualified borrower exclusive of any fees and points required by the lender.
Pre-tax income increased in the first quarter of 2016 compared with the first quarter of 2015 primarily due to a shift to credit-related income and higher guaranty fee income.
We recognized single-family credit-related income in the first quarter of 2016 compared with credit-related expense in the first quarter of 2015. Credit-related income in the first quarter of 2016 was primarily due to a decline in actual and projected mortgage interest rates. As mortgage interest rates decline, we expect an increase in future prepayments on individually impaired loans, including modified loans. Higher expected prepayments shorten the expected lives of modified loans, which decreases the impairment relating to concessions provided on these loans and results in a decrease in the provision for credit losses. In addition, an increase in home prices, including distressed property valuations, also contributed to the benefit for credit losses during the first quarter of 2016. Higher home prices decrease the likelihood that loans will default and reduce the amount of credit loss on loans that do default, which impacts our estimate of losses and ultimately reduces our total loss reserves and provision for credit losses. See “Consolidated Results of Operations—Credit-Related Income” for more information on the drivers of our credit-related income.
Guaranty fee income and our effective guaranty fee rate increased in the first quarter of 2016 compared with the first quarter of 2015 as loans with higher guaranty fees have become a larger part of our single-family guaranty book of business primarily due to the cumulative impact of guaranty fee price increases implemented in 2012.
Our single-family acquisition volume and single-family Fannie Mae MBS issuances decreased in the first quarter of 2016 compared with the first quarter of 2015, driven primarily by a decrease in refinance activity. Lower refinance activity also drove a decrease in liquidations of loans from our single-family guaranty book of business in the first quarter of 2016 compared with the first quarter of 2015. Accordingly, the size of our single-family guaranty book of business remained relatively flat.
Multifamily Business ResultsMultifamily business results primarily reflect our multifamily guaranty business. Our Multifamily business results also include activity relating to our low-income housing tax credit (“LIHTC”) investments and equity investments. Although we are not currently making new LIHTC or equity investments, we continue to make contractually required contributions for our legacy investments. Activity from multifamily products is also reflected in the Capital Markets group results, which include net interest income related to multifamily loans and securities held in our retained mortgage portfolio, gains and losses from the sale of multifamily Fannie Mae MBS, mortgage loans and re-securitizations, and other miscellaneous income.
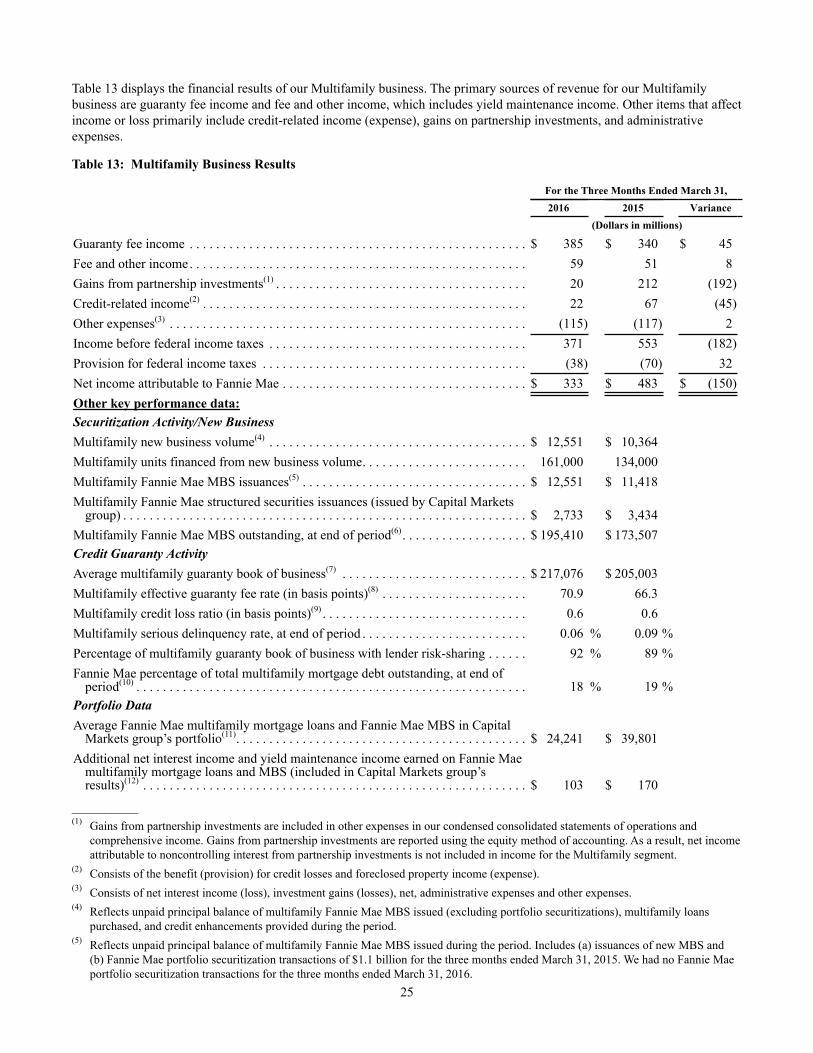
25
Table 13 displays the financial results of our Multifamily business. The primary sources of revenue for our Multifamily business are guaranty fee income and fee and other income, which includes yield maintenance income. Other items that affect income or loss primarily include credit-related income (expense), gains on partnership investments, and administrative expenses.
Table 13: Multifamily Business Results
For the Three Months Ended March 31,2016 2015 Variance
(Dollars in millions)
Guaranty fee income . . . . . . . . . . . . . . . . . . . . . . . . . . . . . . . . . . . . . . . . . . . . . . . . . . . $ 385 $ 340 $ 45Fee and other income. . . . . . . . . . . . . . . . . . . . . . . . . . . . . . . . . . . . . . . . . . . . . . . . . . . 59 51 8Gains from partnership investments(1) . . . . . . . . . . . . . . . . . . . . . . . . . . . . . . . . . . . . . . 20 212 (192)Credit-related income(2) . . . . . . . . . . . . . . . . . . . . . . . . . . . . . . . . . . . . . . . . . . . . . . . . . 22 67 (45)Other expenses(3) . . . . . . . . . . . . . . . . . . . . . . . . . . . . . . . . . . . . . . . . . . . . . . . . . . . . . . (115) (117) 2Income before federal income taxes . . . . . . . . . . . . . . . . . . . . . . . . . . . . . . . . . . . . . . . 371 553 (182)Provision for federal income taxes . . . . . . . . . . . . . . . . . . . . . . . . . . . . . . . . . . . . . . . . (38) (70) 32Net income attributable to Fannie Mae . . . . . . . . . . . . . . . . . . . . . . . . . . . . . . . . . . . . . $ 333 $ 483 $ (150)Other key performance data:Securitization Activity/New BusinessMultifamily new business volume(4) . . . . . . . . . . . . . . . . . . . . . . . . . . . . . . . . . . . . . . . $ 12,551 $ 10,364Multifamily units financed from new business volume. . . . . . . . . . . . . . . . . . . . . . . . . 161,000 134,000Multifamily Fannie Mae MBS issuances(5) . . . . . . . . . . . . . . . . . . . . . . . . . . . . . . . . . . $ 12,551 $ 11,418Multifamily Fannie Mae structured securities issuances (issued by Capital Markets
group) . . . . . . . . . . . . . . . . . . . . . . . . . . . . . . . . . . . . . . . . . . . . . . . . . . . . . . . . . . . . . $ 2,733 $ 3,434Multifamily Fannie Mae MBS outstanding, at end of period(6) . . . . . . . . . . . . . . . . . . . $ 195,410 $ 173,507Credit Guaranty ActivityAverage multifamily guaranty book of business(7) . . . . . . . . . . . . . . . . . . . . . . . . . . . . $ 217,076 $ 205,003Multifamily effective guaranty fee rate (in basis points)(8) . . . . . . . . . . . . . . . . . . . . . . 70.9 66.3Multifamily credit loss ratio (in basis points)(9) . . . . . . . . . . . . . . . . . . . . . . . . . . . . . . . 0.6 0.6Multifamily serious delinquency rate, at end of period . . . . . . . . . . . . . . . . . . . . . . . . . 0.06 % 0.09 %Percentage of multifamily guaranty book of business with lender risk-sharing . . . . . . 92 % 89 %Fannie Mae percentage of total multifamily mortgage debt outstanding, at end of
period(10) . . . . . . . . . . . . . . . . . . . . . . . . . . . . . . . . . . . . . . . . . . . . . . . . . . . . . . . . . . . 18 % 19 %Portfolio DataAverage Fannie Mae multifamily mortgage loans and Fannie Mae MBS in Capital
Markets group’s portfolio(11). . . . . . . . . . . . . . . . . . . . . . . . . . . . . . . . . . . . . . . . . . . . $ 24,241 $ 39,801Additional net interest income and yield maintenance income earned on Fannie Mae
multifamily mortgage loans and MBS (included in Capital Markets group’s results)(12) . . . . . . . . . . . . . . . . . . . . . . . . . . . . . . . . . . . . . . . . . . . . . . . . . . . . . . . . . . $ 103 $ 170
__________(1) Gains from partnership investments are included in other expenses in our condensed consolidated statements of operations and
comprehensive income. Gains from partnership investments are reported using the equity method of accounting. As a result, net income attributable to noncontrolling interest from partnership investments is not included in income for the Multifamily segment.
(2) Consists of the benefit (provision) for credit losses and foreclosed property income (expense).(3) Consists of net interest income (loss), investment gains (losses), net, administrative expenses and other expenses.(4) Reflects unpaid principal balance of multifamily Fannie Mae MBS issued (excluding portfolio securitizations), multifamily loans
purchased, and credit enhancements provided during the period.(5) Reflects unpaid principal balance of multifamily Fannie Mae MBS issued during the period. Includes (a) issuances of new MBS and
(b) Fannie Mae portfolio securitization transactions of $1.1 billion for the three months ended March 31, 2015. We had no Fannie Mae portfolio securitization transactions for the three months ended March 31, 2016.

26
(6) Includes $9.1 billion and $16.4 billion of Fannie Mae multifamily MBS held in our retained mortgage portfolio, the vast majority of which have been consolidated to loans in our condensed consolidated balance sheets, as of March 31, 2016 and 2015, respectively.
(7) Our multifamily guaranty book of business consists of (a) multifamily mortgage loans of Fannie Mae, (b) multifamily mortgage loans underlying Fannie Mae MBS, and (c) other credit enhancements that we provide on multifamily mortgage assets. It excludes non-Fannie Mae mortgage-related securities held in our retained mortgage portfolio for which we do not provide a guaranty.
(8) Calculated based on annualized Multifamily segment guaranty fee income divided by the average multifamily guaranty book of business, expressed in basis points.
(9) Calculated based on annualized Multifamily segment credit losses divided by the average multifamily guaranty book of business, expressed in basis points. Negative credit losses are the result of recoveries on previously charged-off amounts.
(10) Includes mortgage loans and Fannie Mae MBS guaranteed by the Multifamily segment. Information labeled as of March 31, 2016 is as of December 31, 2015 and is based on the Federal Reserve’s March 2016 mortgage debt outstanding release, the latest date for which the Federal Reserve has estimated mortgage debt outstanding for multifamily residences. Prior period amounts may have been changed to reflect revised historical data from the Federal Reserve.
(11) Based on unpaid principal balance.(12) Interest expense estimate is based on allocated duration-matched funding costs. Net interest income was reduced by guaranty fees
allocated to Multifamily from the Capital Markets group on multifamily loans in our retained mortgage portfolio. Yield maintenance income represents the investor portion of fees earned as a result of prepayments of multifamily loans and MBS in our retained mortgage portfolio. A portion of yield maintenance income is reported in Multifamily business results to the extent attributable to our multifamily guaranty business.
Pre-tax income decreased in the first quarter of 2016 compared with the first quarter of 2015 primarily as a result of decreases in gains from partnership investments and credit-related income, partially offset by an increase in guaranty fee income.
Guaranty fee income increased in the first quarter of 2016 compared with the first quarter of 2015 as loans with higher guaranty fees have become a larger part of our multifamily guaranty book of business, while loans with lower guaranty fees continue to liquidate.
Credit-related income decreased in the first quarter of 2016 compared with the first quarter of 2015 primarily driven by a smaller reduction in the allowance for loan losses and lower gains resulting from the disposition of fewer REO properties, as the credit performance of the multifamily guaranty book of business remains strong.
Gains from partnership investments decreased in the first quarter of 2016 compared with the first quarter of 2015 as the number of investments continues to decline.
FHFA’s 2016 conservatorship scorecard includes an objective to maintain the dollar volume of new multifamily business at or below $35 billion, excluding certain targeted business segments. On May 4, 2016, FHFA announced an increase in the 2016 multifamily lending caps for Fannie Mae and Freddie Mac from $31 billion to $35 billion. Approximately 69% of Fannie Mae’s multifamily new business volume of $12.6 billion for the first quarter of 2016 counted towards FHFA’s 2016 multifamily volume cap.
Capital Markets Group ResultsTable 14 displays the financial results of our Capital Markets group. Following the table we discuss the Capital Markets group’s financial results and describe the Capital Markets group’s retained mortgage portfolio. For a discussion of the debt issued by the Capital Markets group to fund its investment activities, see “Liquidity and Capital Management.” For a discussion of the derivative instruments that the Capital Markets group uses to manage interest rate risk, see “MD&A—Risk Management—Market Risk Management, Including Interest Rate Risk Management” in our 2015 Form 10-K and “Note 9, Derivative Instruments” in this report and our 2015 Form 10-K. The primary source of revenue for our Capital Markets group is net interest income. Other items that impact income or loss primarily include fair value gains and losses, investment gains and losses, as well as allocated guaranty fee expense and administrative expenses.
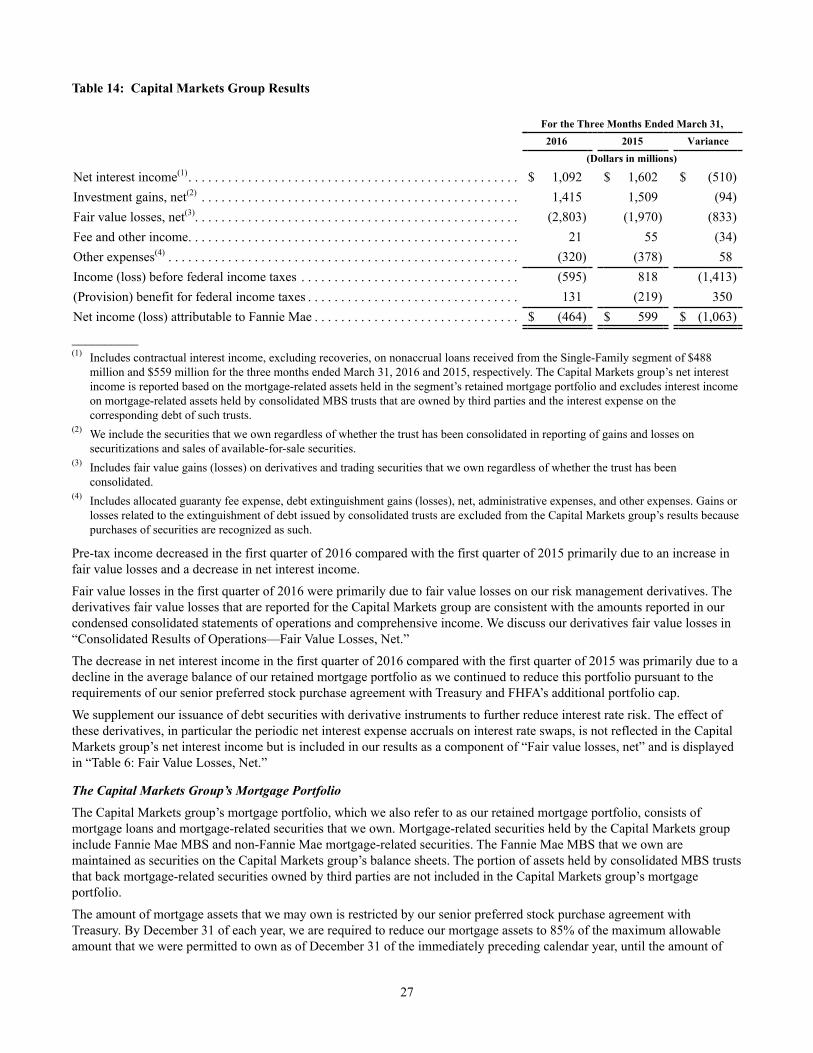
27
Table 14: Capital Markets Group Results
For the Three Months Ended March 31,2016 2015 Variance
(Dollars in millions)
Net interest income(1). . . . . . . . . . . . . . . . . . . . . . . . . . . . . . . . . . . . . . . . . . . . . . . . . . $ 1,092 $ 1,602 $ (510)Investment gains, net(2) . . . . . . . . . . . . . . . . . . . . . . . . . . . . . . . . . . . . . . . . . . . . . . . . 1,415 1,509 (94)Fair value losses, net(3). . . . . . . . . . . . . . . . . . . . . . . . . . . . . . . . . . . . . . . . . . . . . . . . . (2,803) (1,970) (833)Fee and other income. . . . . . . . . . . . . . . . . . . . . . . . . . . . . . . . . . . . . . . . . . . . . . . . . . 21 55 (34)Other expenses(4) . . . . . . . . . . . . . . . . . . . . . . . . . . . . . . . . . . . . . . . . . . . . . . . . . . . . . (320) (378) 58Income (loss) before federal income taxes . . . . . . . . . . . . . . . . . . . . . . . . . . . . . . . . . (595) 818 (1,413)(Provision) benefit for federal income taxes . . . . . . . . . . . . . . . . . . . . . . . . . . . . . . . . 131 (219) 350Net income (loss) attributable to Fannie Mae . . . . . . . . . . . . . . . . . . . . . . . . . . . . . . . $ (464) $ 599 $ (1,063)__________(1) Includes contractual interest income, excluding recoveries, on nonaccrual loans received from the Single-Family segment of $488
million and $559 million for the three months ended March 31, 2016 and 2015, respectively. The Capital Markets group’s net interest income is reported based on the mortgage-related assets held in the segment’s retained mortgage portfolio and excludes interest income on mortgage-related assets held by consolidated MBS trusts that are owned by third parties and the interest expense on the corresponding debt of such trusts.
(2) We include the securities that we own regardless of whether the trust has been consolidated in reporting of gains and losses on securitizations and sales of available-for-sale securities.
(3) Includes fair value gains (losses) on derivatives and trading securities that we own regardless of whether the trust has been consolidated.
(4) Includes allocated guaranty fee expense, debt extinguishment gains (losses), net, administrative expenses, and other expenses. Gains or losses related to the extinguishment of debt issued by consolidated trusts are excluded from the Capital Markets group’s results because purchases of securities are recognized as such.
Pre-tax income decreased in the first quarter of 2016 compared with the first quarter of 2015 primarily due to an increase in fair value losses and a decrease in net interest income.
Fair value losses in the first quarter of 2016 were primarily due to fair value losses on our risk management derivatives. The derivatives fair value losses that are reported for the Capital Markets group are consistent with the amounts reported in our condensed consolidated statements of operations and comprehensive income. We discuss our derivatives fair value losses in “Consolidated Results of Operations—Fair Value Losses, Net.”
The decrease in net interest income in the first quarter of 2016 compared with the first quarter of 2015 was primarily due to a decline in the average balance of our retained mortgage portfolio as we continued to reduce this portfolio pursuant to the requirements of our senior preferred stock purchase agreement with Treasury and FHFA’s additional portfolio cap.
We supplement our issuance of debt securities with derivative instruments to further reduce interest rate risk. The effect of these derivatives, in particular the periodic net interest expense accruals on interest rate swaps, is not reflected in the Capital Markets group’s net interest income but is included in our results as a component of “Fair value losses, net” and is displayed in “Table 6: Fair Value Losses, Net.”
The Capital Markets Group’s Mortgage PortfolioThe Capital Markets group’s mortgage portfolio, which we also refer to as our retained mortgage portfolio, consists of mortgage loans and mortgage-related securities that we own. Mortgage-related securities held by the Capital Markets group include Fannie Mae MBS and non-Fannie Mae mortgage-related securities. The Fannie Mae MBS that we own are maintained as securities on the Capital Markets group’s balance sheets. The portion of assets held by consolidated MBS trusts that back mortgage-related securities owned by third parties are not included in the Capital Markets group’s mortgage portfolio.
The amount of mortgage assets that we may own is restricted by our senior preferred stock purchase agreement with Treasury. By December 31 of each year, we are required to reduce our mortgage assets to 85% of the maximum allowable amount that we were permitted to own as of December 31 of the immediately preceding calendar year, until the amount of
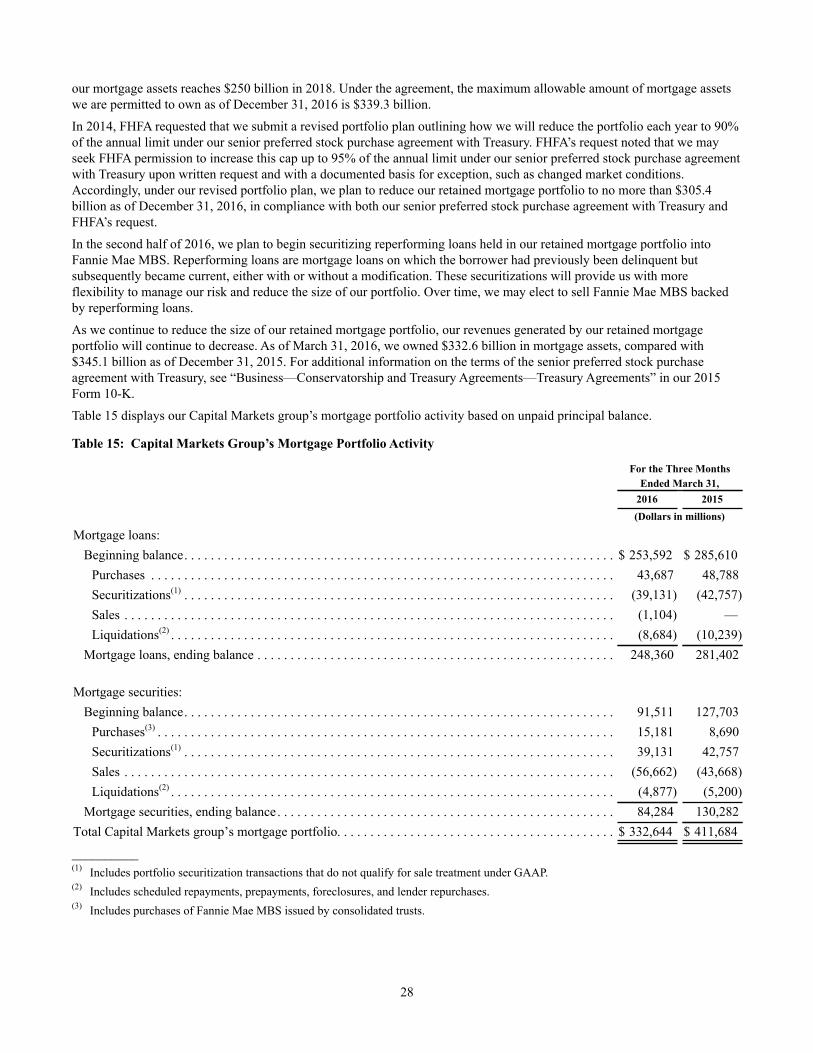
28
our mortgage assets reaches $250 billion in 2018. Under the agreement, the maximum allowable amount of mortgage assets we are permitted to own as of December 31, 2016 is $339.3 billion.
In 2014, FHFA requested that we submit a revised portfolio plan outlining how we will reduce the portfolio each year to 90% of the annual limit under our senior preferred stock purchase agreement with Treasury. FHFA’s request noted that we may seek FHFA permission to increase this cap up to 95% of the annual limit under our senior preferred stock purchase agreement with Treasury upon written request and with a documented basis for exception, such as changed market conditions. Accordingly, under our revised portfolio plan, we plan to reduce our retained mortgage portfolio to no more than $305.4 billion as of December 31, 2016, in compliance with both our senior preferred stock purchase agreement with Treasury and FHFA’s request.
In the second half of 2016, we plan to begin securitizing reperforming loans held in our retained mortgage portfolio into Fannie Mae MBS. Reperforming loans are mortgage loans on which the borrower had previously been delinquent but subsequently became current, either with or without a modification. These securitizations will provide us with more flexibility to manage our risk and reduce the size of our portfolio. Over time, we may elect to sell Fannie Mae MBS backed by reperforming loans.
As we continue to reduce the size of our retained mortgage portfolio, our revenues generated by our retained mortgage portfolio will continue to decrease. As of March 31, 2016, we owned $332.6 billion in mortgage assets, compared with $345.1 billion as of December 31, 2015. For additional information on the terms of the senior preferred stock purchase agreement with Treasury, see “Business—Conservatorship and Treasury Agreements—Treasury Agreements” in our 2015 Form 10-K.
Table 15 displays our Capital Markets group’s mortgage portfolio activity based on unpaid principal balance.
Table 15: Capital Markets Group’s Mortgage Portfolio Activity
For the Three MonthsEnded March 31,
2016 2015(Dollars in millions)
Mortgage loans:Beginning balance. . . . . . . . . . . . . . . . . . . . . . . . . . . . . . . . . . . . . . . . . . . . . . . . . . . . . . . . . . . . . . . . . $ 253,592 $ 285,610
Purchases . . . . . . . . . . . . . . . . . . . . . . . . . . . . . . . . . . . . . . . . . . . . . . . . . . . . . . . . . . . . . . . . . . . . . . 43,687 48,788Securitizations(1) . . . . . . . . . . . . . . . . . . . . . . . . . . . . . . . . . . . . . . . . . . . . . . . . . . . . . . . . . . . . . . . . . (39,131) (42,757)Sales . . . . . . . . . . . . . . . . . . . . . . . . . . . . . . . . . . . . . . . . . . . . . . . . . . . . . . . . . . . . . . . . . . . . . . . . . . (1,104) —Liquidations(2) . . . . . . . . . . . . . . . . . . . . . . . . . . . . . . . . . . . . . . . . . . . . . . . . . . . . . . . . . . . . . . . . . . . (8,684) (10,239)
Mortgage loans, ending balance . . . . . . . . . . . . . . . . . . . . . . . . . . . . . . . . . . . . . . . . . . . . . . . . . . . . . . 248,360 281,402
Mortgage securities:Beginning balance. . . . . . . . . . . . . . . . . . . . . . . . . . . . . . . . . . . . . . . . . . . . . . . . . . . . . . . . . . . . . . . . . 91,511 127,703
Purchases(3) . . . . . . . . . . . . . . . . . . . . . . . . . . . . . . . . . . . . . . . . . . . . . . . . . . . . . . . . . . . . . . . . . . . . . 15,181 8,690Securitizations(1) . . . . . . . . . . . . . . . . . . . . . . . . . . . . . . . . . . . . . . . . . . . . . . . . . . . . . . . . . . . . . . . . . 39,131 42,757Sales . . . . . . . . . . . . . . . . . . . . . . . . . . . . . . . . . . . . . . . . . . . . . . . . . . . . . . . . . . . . . . . . . . . . . . . . . . (56,662) (43,668)Liquidations(2) . . . . . . . . . . . . . . . . . . . . . . . . . . . . . . . . . . . . . . . . . . . . . . . . . . . . . . . . . . . . . . . . . . . (4,877) (5,200)
Mortgage securities, ending balance . . . . . . . . . . . . . . . . . . . . . . . . . . . . . . . . . . . . . . . . . . . . . . . . . . . 84,284 130,282Total Capital Markets group’s mortgage portfolio. . . . . . . . . . . . . . . . . . . . . . . . . . . . . . . . . . . . . . . . . . $ 332,644 $ 411,684__________(1) Includes portfolio securitization transactions that do not qualify for sale treatment under GAAP.(2) Includes scheduled repayments, prepayments, foreclosures, and lender repurchases. (3) Includes purchases of Fannie Mae MBS issued by consolidated trusts.

29
Table 16 displays the composition of the unpaid principal balance of our Capital Markets group’s mortgage portfolio and our assessment of the liquidity of these assets. Our assessment is based on the liquidity within the markets in which the assets are traded, the issuers of the assets and the nature of the collateral underlying the assets. Our unsecuritized mortgage loans, private-label mortgage-related securities (“PLS”) and other non-agency securities are considered less liquid. Fannie Mae securities that are collateralized by non-agency mortgage-related securities are also considered to be less liquid.
Table 16: Capital Markets Group’s Mortgage Portfolio Composition
As ofMarch 31, 2016 December 31, 2015
MoreLiquid
LessLiquid Total
MoreLiquid
LessLiquid Total
(Dollars in millions)
Mortgage loans:Single-family loans:
Government insured or guaranteed . . . . . . . . . . . . . . $ — $ 32,647 $ 32,647 $ — $ 33,376 $ 33,376Conventional . . . . . . . . . . . . . . . . . . . . . . . . . . . . . . . — 202,759 202,759 — 206,851 206,851
Total single-family loans. . . . . . . . . . . . . . . . . . . . . . . . . — 235,406 235,406 — 240,227 240,227Multifamily loans:
Government insured or guaranteed . . . . . . . . . . . . . . — 220 220 — 224 224Conventional . . . . . . . . . . . . . . . . . . . . . . . . . . . . . . . — 12,734 12,734 — 13,141 13,141
Total multifamily loans . . . . . . . . . . . . . . . . . . . . . . . . . . — 12,954 12,954 — 13,365 13,365Total mortgage loans. . . . . . . . . . . . . . . . . . . . . . . . . . . . — 248,360 248,360 — 253,592 253,592Mortgage-related securities:
Fannie Mae . . . . . . . . . . . . . . . . . . . . . . . . . . . . . . . . 54,829 11,330 66,159 57,185 11,512 68,697Freddie Mac. . . . . . . . . . . . . . . . . . . . . . . . . . . . . . . . 4,251 — 4,251 5,232 — 5,232Ginnie Mae . . . . . . . . . . . . . . . . . . . . . . . . . . . . . . . . 628 — 628 748 — 748Alt-A private-label securities. . . . . . . . . . . . . . . . . . . — 2,639 2,639 — 3,481 3,481Subprime private-label securities . . . . . . . . . . . . . . . — 4,137 4,137 — 5,212 5,212Commercial mortgage-backed securities (“CMBS”) — 2,536 2,536 — 3,515 3,515Mortgage revenue bonds . . . . . . . . . . . . . . . . . . . . . . — 2,841 2,841 — 3,105 3,105Other mortgage-related securities . . . . . . . . . . . . . . . — 1,093 1,093 — 1,521 1,521
Total mortgage-related securities(1) . . . . . . . . . . . . . . . . . 59,708 24,576 84,284 63,165 28,346 91,511Total Capital Markets group’s mortgage portfolio . . . . . $ 59,708 $272,936 $332,644 $ 63,165 $281,938 $345,103__________(1) The fair value of these mortgage-related securities was $89.2 billion and $96.0 billion as of March 31, 2016 and December 31, 2015,
respectively.
Our Capital Markets group’s mortgage portfolio decreased as of March 31, 2016 compared with December 31, 2015, as we continued to reduce the size of our retained mortgage portfolio. The overall portfolio decrease was driven by higher sales volumes and liquidations, partially offset by increased purchase activity.
In the first quarter of 2016, we sold nonperforming loans with an aggregate unpaid principal balance of $975 million and reverse mortgage loans with an aggregate unpaid principal balance of $129 million, which reduced our less liquid assets as of March 31, 2016.
The loans we purchased in the first quarter of 2016 included $3.3 billion in delinquent loans we purchased from our single-family MBS trusts. We expect to continue purchasing loans from MBS trusts as they become four or more consecutive monthly payments delinquent subject to market conditions, economic benefit, servicer capacity and other factors, including the limit on the amount of mortgage assets that we may own pursuant to the senior preferred stock purchase agreement and FHFA’s portfolio plan requirements. Table 17 displays the composition of loans restructured in a TDR that were on accrual status, loans on nonaccrual status and all other mortgage-related assets in our Capital Markets group’s mortgage portfolio.

30
Table 17: Capital Markets Group’s Mortgage Portfolio
As ofMarch 31, 2016 December 31, 2015
UnpaidPrincipalBalance
Percentof Total
UnpaidPrincipalBalance
Percent ofTotal
(Dollars in millions)
TDRs on accrual status. . . . . . . . . . . . . . . . . . . . . . . . . . . . . . . . . . . . . . . . . . . . . $ 133,897 40% $ 137,117 40%Nonaccrual loans . . . . . . . . . . . . . . . . . . . . . . . . . . . . . . . . . . . . . . . . . . . . . . . . . 46,831 14 47,000 13All other mortgage-related assets . . . . . . . . . . . . . . . . . . . . . . . . . . . . . . . . . . . . . 151,916 46 160,986 47
Total Capital Markets group’s mortgage portfolio. . . . . . . . . . . . . . . . . . . . . . . $ 332,644 100% $ 345,103 100%
CONSOLIDATED BALANCE SHEET ANALYSIS
This section provides a discussion of our condensed consolidated balance sheets and should be read together with our condensed consolidated financial statements, including the accompanying notes.
Table 18: Summary of Condensed Consolidated Balance Sheets
As ofMarch 31,
2016December 31,
2015 Variance(Dollars in millions)
Assets
Cash and cash equivalents and federal funds sold and securities purchased underagreements to resell or similar arrangements . . . . . . . . . . . . . . . . . . . . . . . . . . . . $ 36,466 $ 42,024 $ (5,558)
Restricted cash . . . . . . . . . . . . . . . . . . . . . . . . . . . . . . . . . . . . . . . . . . . . . . . . . . . . . 33,873 30,879 2,994Investments in securities(1) . . . . . . . . . . . . . . . . . . . . . . . . . . . . . . . . . . . . . . . . . . . . 56,983 60,138 (3,155)Mortgage loans:
Of Fannie Mae . . . . . . . . . . . . . . . . . . . . . . . . . . . . . . . . . . . . . . . . . . . . . . . . . . . 233,309 238,397 (5,088)Of consolidated trusts . . . . . . . . . . . . . . . . . . . . . . . . . . . . . . . . . . . . . . . . . . . . . . 2,817,457 2,809,198 8,259
Allowance for loan losses. . . . . . . . . . . . . . . . . . . . . . . . . . . . . . . . . . . . . . . . . . . . . (25,819) (27,951) 2,132Mortgage loans, net of allowance for loan losses. . . . . . . . . . . . . . . . . . . . . . . . . 3,024,947 3,019,644 5,303
Deferred tax assets, net . . . . . . . . . . . . . . . . . . . . . . . . . . . . . . . . . . . . . . . . . . . . . . . 37,048 37,187 (139)Other . . . . . . . . . . . . . . . . . . . . . . . . . . . . . . . . . . . . . . . . . . . . . . . . . . . . . . . . . . . . . 32,384 32,045 339
Total assets . . . . . . . . . . . . . . . . . . . . . . . . . . . . . . . . . . . . . . . . . . . . . . . . . . . . . . $ 3,221,701 $ 3,221,917 $ (216)Liabilities and equityDebt:
Of Fannie Mae . . . . . . . . . . . . . . . . . . . . . . . . . . . . . . . . . . . . . . . . . . . . . . . . . . . $ 370,819 $ 386,135 $ (15,316)Of consolidated trusts . . . . . . . . . . . . . . . . . . . . . . . . . . . . . . . . . . . . . . . . . . . . . . 2,828,951 2,811,536 17,415
Other . . . . . . . . . . . . . . . . . . . . . . . . . . . . . . . . . . . . . . . . . . . . . . . . . . . . . . . . . . . . . 19,812 20,187 (375)Total liabilities . . . . . . . . . . . . . . . . . . . . . . . . . . . . . . . . . . . . . . . . . . . . . . . . . . . 3,219,582 3,217,858 1,724
Equity . . . . . . . . . . . . . . . . . . . . . . . . . . . . . . . . . . . . . . . . . . . . . . . . . . . . . . . . . . . . 2,119 4,059 (1,940)Total liabilities and equity . . . . . . . . . . . . . . . . . . . . . . . . . . . . . . . . . . . . . . . . . . $ 3,221,701 $ 3,221,917 $ (216)
__________(1) Includes $30.7 billion as of March 31, 2016 and $29.5 billion as of December 31, 2015 of U.S. Treasury securities that are included in
our other investments portfolio, which we present in “Table 22: Cash and Other Investments Portfolio.”

31
Cash and Other Investments PortfolioOur cash and other investments portfolio consists of cash and cash equivalents, securities purchased under agreements to resell or similar arrangements, and investments in U.S. Treasury securities. See “Liquidity and Capital Management—Liquidity Management—Cash and Other Investments Portfolio” for additional information on our cash and other investments portfolio.
Investments in Mortgage-Related SecuritiesOur investments in mortgage-related securities are classified in our condensed consolidated balance sheets as either trading or available-for-sale and are measured at fair value. Table 19 displays the fair value of our investments in mortgage-related securities, including trading and available-for-sale securities. We classify private-label securities as Alt-A, subprime or commercial mortgage-backed securities (“CMBS”) if the securities were labeled as such when issued. We have also invested in subprime private-label securities that we have resecuritized to include our guaranty.
Table 19: Summary of Mortgage-Related Securities at Fair Value
As ofMarch 31,
2016December 31,
2015(Dollars in millions)
Mortgage-related securities:Fannie Mae . . . . . . . . . . . . . . . . . . . . . . . . . . . . . . . . . . . . . . . . . . . . . . . . . . . . . . . . . . . . . . . . . $ 9,339 $ 9,034Freddie Mac. . . . . . . . . . . . . . . . . . . . . . . . . . . . . . . . . . . . . . . . . . . . . . . . . . . . . . . . . . . . . . . . . 4,568 5,613Ginnie Mae . . . . . . . . . . . . . . . . . . . . . . . . . . . . . . . . . . . . . . . . . . . . . . . . . . . . . . . . . . . . . . . . . 688 817Alt-A private-label securities. . . . . . . . . . . . . . . . . . . . . . . . . . . . . . . . . . . . . . . . . . . . . . . . . . . . 2,227 3,114Subprime private-label securities . . . . . . . . . . . . . . . . . . . . . . . . . . . . . . . . . . . . . . . . . . . . . . . . 2,950 3,925CMBS . . . . . . . . . . . . . . . . . . . . . . . . . . . . . . . . . . . . . . . . . . . . . . . . . . . . . . . . . . . . . . . . . . . . . 2,598 3,596Mortgage revenue bonds . . . . . . . . . . . . . . . . . . . . . . . . . . . . . . . . . . . . . . . . . . . . . . . . . . . . . . . 2,927 3,150Other mortgage-related securities . . . . . . . . . . . . . . . . . . . . . . . . . . . . . . . . . . . . . . . . . . . . . . . . 940 1,404
Total . . . . . . . . . . . . . . . . . . . . . . . . . . . . . . . . . . . . . . . . . . . . . . . . . . . . . . . . . . . . . . . . . . . . $ 26,237 $ 30,653
The decrease in mortgage-related securities at fair value from December 31, 2015 to March 31, 2016 was primarily driven by sales activity and liquidations, partially offset by higher pricing on agency securities in the first three months of 2016.
Mortgage LoansThe decrease in mortgage loans from December 31, 2015 to March 31, 2016 was primarily due to liquidations outpacing acquisitions. For additional information on our mortgage loans, see “Note 3, Mortgage Loans.” For additional information on the mortgage loan purchase and sale activities reported by our Capital Markets group, see “Business Segment Results—Capital Markets Group Results.”
The decrease in our allowance for loan losses from December 31, 2015 to March 31, 2016 was primarily driven by declines in actual and projected mortgage interest rates, liquidations of mortgage loans, as well as charge-offs which relieved the allowance on these loans. See “Consolidated Results of Operations—Credit Related Income” for more information.
Debt Debt of Fannie Mae is the primary means of funding our mortgage investments. The decrease in debt of Fannie Mae from December 31, 2015 to March 31, 2016 was primarily driven by lower funding needs, as our retained mortgage portfolio decreased. We provide a summary of the activity of the debt of Fannie Mae and a comparison of the mix between our outstanding short-term and long-term debt in “Liquidity and Capital Management—Liquidity Management—Debt Funding.” Also see “Note 8, Short-Term Borrowings and Long-Term Debt” for additional information on our outstanding debt.
Debt of consolidated trusts represents the amount of Fannie Mae MBS issued from consolidated trusts and held by third-party certificateholders. The increase in debt of consolidated trusts from December 31, 2015 to March 31, 2016 was primarily driven by sales of Fannie Mae MBS, which are accounted for as reissuances of debt of consolidated trusts in our condensed consolidated balance sheets, since the MBS certificate ownership is transferred from us to a third party.

32
Stockholders’ EquityOur equity decreased as of March 31, 2016 compared with December 31, 2015 due to our payment of senior preferred stock dividends to Treasury during the first quarter of 2016, partially offset by our comprehensive income recognized during the quarter.
LIQUIDITY AND CAPITAL MANAGEMENT
Liquidity ManagementOur business activities require that we maintain adequate liquidity to fund our operations. Our liquidity risk management framework is designed to address our liquidity risk. Liquidity risk is the risk that we will not be able to meet our funding obligations in a timely manner. Liquidity risk management involves forecasting funding requirements, maintaining sufficient capacity to meet our needs based on our ongoing assessment of financial market liquidity and adhering to our regulatory requirements.
Our treasury group is responsible for implementing our liquidity and contingency planning strategies. We hold a portfolio of highly liquid investments and maintain access to alternative sources of liquidity which are designed to provide near term availability of cash in the event that our access to the debt markets becomes limited. While our liquidity contingency planning attempts to address stressed market conditions, we believe that our liquidity contingency plan may be difficult or impossible to execute for a company of our size and in our circumstances.
Our liquidity position could be adversely affected by many factors, both internal and external to our business, including: actions taken by FHFA, the Federal Reserve, Treasury or other government agencies; legislation relating to us or our business; a U.S. government payment default on its debt obligations; a downgrade in the credit ratings of our senior unsecured debt or the U.S. government’s debt from the major ratings organizations; a systemic event leading to the withdrawal of liquidity from the market; an extreme market-wide widening of credit spreads; public statements by key policy makers; a significant decline in our net worth; potential investor concerns about the adequacy of funding available to us under the senior preferred stock purchase agreement; loss of demand for our debt, or certain types of our debt, from a major group of investors; a significant credit event involving one of our major institutional counterparties; a sudden catastrophic operational failure in the financial sector; or elimination of our GSE status.
This section supplements and updates information regarding liquidity risk management contained in our 2015 Form 10-K. See “MD&A—Liquidity and Capital Management—Liquidity Management” and “Risk Factors” in our 2015 Form 10-K for additional information, including discussions of our primary sources and uses of funds, our liquidity risk management practices and liquidity contingency planning, factors that influence our debt funding activity, factors that may impact our access to or the cost of our debt funding, and factors that could adversely affect our liquidity.
Debt FundingWe fund our business primarily through the issuance of short-term and long-term debt securities in the domestic and international capital markets. Because debt issuance is our primary funding source, we are subject to “roll over,” or refinancing, risk on our outstanding debt.
Our debt funding needs and debt funding activity may vary from quarter to quarter depending on market conditions and are influenced by anticipated liquidity needs, the size of our retained mortgage portfolio and our dividend payment obligations to Treasury. See “Business Segment Results—Capital Markets Group Results—The Capital Markets Group’s Mortgage Portfolio” for information about our retained mortgage portfolio, our requirement to reduce the size of our retained mortgage portfolio and our portfolio reduction plan.

33
Fannie Mae Debt Funding ActivityTable 20 displays the activity in debt of Fannie Mae. This activity excludes the debt of consolidated trusts and intraday loans. Activity for short-term debt of Fannie Mae relates to borrowings with an original contractual maturity of one year or less while activity for long-term debt of Fannie Mae relates to borrowings with an original contractual maturity of greater than one year. The reported amounts of debt issued and paid off during the period represent the face amount of the debt at issuance and redemption. The increase in our issuances and payoffs of short-term debt during the first quarter of 2016 compared with the first quarter of 2015 was driven by our utilization of short-term notes with overnight maturities in the first quarter of 2016.
Table 20: Activity in Debt of Fannie Mae
For the Three Months Ended March 31,
2016 2015(Dollars in millions)
Issued during the period:Short-term:
Amount . . . . . . . . . . . . . . . . . . . . . . . . . . . . . . . . . . . . . . . . . . . . . . . . . . . . . . . . . . . . . . . . . . . . $106,813 $ 52,111Weighted-average interest rate . . . . . . . . . . . . . . . . . . . . . . . . . . . . . . . . . . . . . . . . . . . . . . . . . . 0.27% 0.12%
Long-term:(1)
Amount . . . . . . . . . . . . . . . . . . . . . . . . . . . . . . . . . . . . . . . . . . . . . . . . . . . . . . . . . . . . . . . . . . . . $ 24,268 $ 16,723Weighted-average interest rate . . . . . . . . . . . . . . . . . . . . . . . . . . . . . . . . . . . . . . . . . . . . . . . . . . 1.89% 1.63%
Total issued:Amount . . . . . . . . . . . . . . . . . . . . . . . . . . . . . . . . . . . . . . . . . . . . . . . . . . . . . . . . . . . . . . . . . . . . $131,081 $ 68,834Weighted-average interest rate . . . . . . . . . . . . . . . . . . . . . . . . . . . . . . . . . . . . . . . . . . . . . . . . . . 0.57% 0.49%
Paid off during the period:(2)
Short-term:Amount . . . . . . . . . . . . . . . . . . . . . . . . . . . . . . . . . . . . . . . . . . . . . . . . . . . . . . . . . . . . . . . . . . . . $117,429 $ 57,726Weighted-average interest rate . . . . . . . . . . . . . . . . . . . . . . . . . . . . . . . . . . . . . . . . . . . . . . . . . . 0.23% 0.07%
Long-term:Amount . . . . . . . . . . . . . . . . . . . . . . . . . . . . . . . . . . . . . . . . . . . . . . . . . . . . . . . . . . . . . . . . . . . . $ 29,252 $ 23,163Weighted-average interest rate . . . . . . . . . . . . . . . . . . . . . . . . . . . . . . . . . . . . . . . . . . . . . . . . . . 2.23% 0.81%
Total paid off:Amount . . . . . . . . . . . . . . . . . . . . . . . . . . . . . . . . . . . . . . . . . . . . . . . . . . . . . . . . . . . . . . . . . . . . $146,681 $ 80,889Weighted-average interest rate . . . . . . . . . . . . . . . . . . . . . . . . . . . . . . . . . . . . . . . . . . . . . . . . . . 0.63% 0.28%
__________(1) Includes credit risk-sharing securities issued under our CAS series. For additional information on our credit risk-sharing transactions,
see “Risk Management—Credit Risk Management—Single-Family Mortgage Credit Risk Management—Transfer of Mortgage Credit Risk—Credit Risk-Sharing Transactions.”
(2) Consists of all payments on debt, including regularly scheduled principal payments, payments at maturity, payments resulting from calls and payments for any other repurchases. Repurchases of debt and early retirements of zero-coupon debt are reported at original face value, which does not equal the amount of actual cash payment.
Outstanding DebtTotal outstanding debt of Fannie Mae includes short-term and long-term debt, excluding debt of consolidated trusts. Short-term debt of Fannie Mae consists of borrowings with an original contractual maturity of one year or less and, therefore, does not include the current portion of long-term debt. Long-term debt of Fannie Mae consists of borrowings with an original contractual maturity of greater than one year.

34
Our outstanding short-term debt, based on its original contractual maturity, as a percentage of our total outstanding debt, was 16% as of March 31, 2016, compared with 18% as of December 31, 2015. The weighted-average interest rate on our long-term debt, based on its original contractual maturity, decreased to 2.40% as of March 31, 2016 from 2.41% as of December 31, 2015.
Our outstanding debt maturing within one year, including the current portion of our long-term debt and amounts we have announced for early redemption, as a percentage of our total outstanding debt, excluding debt of consolidated trusts, was 31% as of March 31, 2016 and 32% as of December 31, 2015. The weighted-average maturity of our outstanding debt that is maturing within one year was 129 days as of March 31, 2016, compared with 125 days as of December 31, 2015. The weighted-average maturity of our outstanding debt maturing in more than one year was approximately 56 months as of March 31, 2016 and approximately 57 months as of December 31, 2015.
We intend to repay our short-term and long-term debt obligations as they become due primarily through proceeds from the issuance of additional debt securities. We also may use proceeds from our mortgage assets to pay our debt obligations.
Pursuant to the terms of the senior preferred stock purchase agreement, we are prohibited from issuing debt without the prior consent of Treasury if it would result in our aggregate indebtedness exceeding our outstanding debt limit, which is 120% of the amount of mortgage assets we were allowed to own under the senior preferred stock purchase agreement on December 31 of the immediately preceding calendar year. Our debt limit under the senior preferred stock purchase agreement was reduced to $479.0 billion in 2016. As of March 31, 2016, our aggregate indebtedness totaled $373.8 billion, which was $105.2 billion below our debt limit. The calculation of our indebtedness for purposes of complying with our debt limit reflects the unpaid principal balance and excludes debt basis adjustments and debt of consolidated trusts. Because of our debt limit, we may be restricted in the amount of debt we issue to fund our operations.
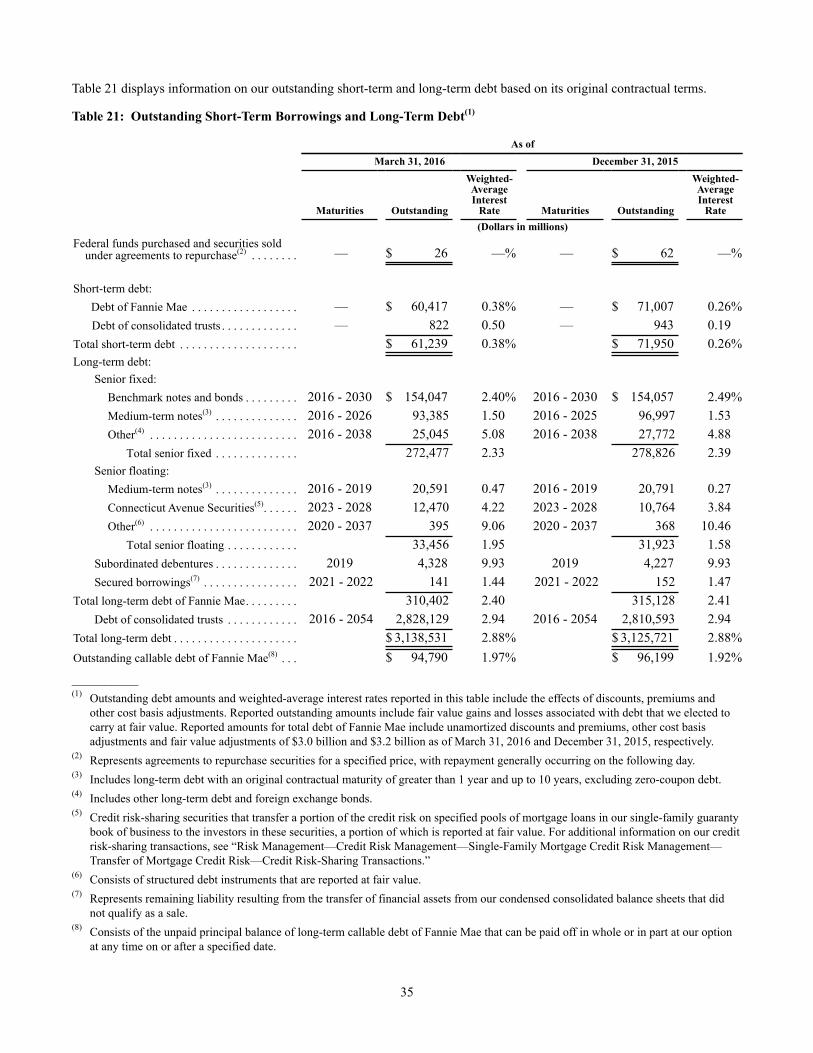
35
Table 21 displays information on our outstanding short-term and long-term debt based on its original contractual terms.
Table 21: Outstanding Short-Term Borrowings and Long-Term Debt(1)
As ofMarch 31, 2016 December 31, 2015
Maturities Outstanding
Weighted-AverageInterest
Rate Maturities Outstanding
Weighted-AverageInterest
Rate(Dollars in millions)
Federal funds purchased and securities sold under agreements to repurchase(2) . . . . . . . . — $ 26 —% — $ 62 —%
Short-term debt: Debt of Fannie Mae . . . . . . . . . . . . . . . . . . — $ 60,417 0.38% — $ 71,007 0.26%
Debt of consolidated trusts . . . . . . . . . . . . . — 822 0.50 — 943 0.19Total short-term debt . . . . . . . . . . . . . . . . . . . . $ 61,239 0.38% $ 71,950 0.26%Long-term debt:
Senior fixed:Benchmark notes and bonds . . . . . . . . . 2016 - 2030 $ 154,047 2.40% 2016 - 2030 $ 154,057 2.49%Medium-term notes(3) . . . . . . . . . . . . . . 2016 - 2026 93,385 1.50 2016 - 2025 96,997 1.53Other(4) . . . . . . . . . . . . . . . . . . . . . . . . . 2016 - 2038 25,045 5.08 2016 - 2038 27,772 4.88
Total senior fixed . . . . . . . . . . . . . . 272,477 2.33 278,826 2.39Senior floating:
Medium-term notes(3) . . . . . . . . . . . . . . 2016 - 2019 20,591 0.47 2016 - 2019 20,791 0.27Connecticut Avenue Securities(5). . . . . . 2023 - 2028 12,470 4.22 2023 - 2028 10,764 3.84Other(6) . . . . . . . . . . . . . . . . . . . . . . . . . 2020 - 2037 395 9.06 2020 - 2037 368 10.46
Total senior floating . . . . . . . . . . . . 33,456 1.95 31,923 1.58Subordinated debentures . . . . . . . . . . . . . . 2019 4,328 9.93 2019 4,227 9.93Secured borrowings(7) . . . . . . . . . . . . . . . . 2021 - 2022 141 1.44 2021 - 2022 152 1.47
Total long-term debt of Fannie Mae. . . . . . . . . 310,402 2.40 315,128 2.41Debt of consolidated trusts . . . . . . . . . . . . 2016 - 2054 2,828,129 2.94 2016 - 2054 2,810,593 2.94
Total long-term debt . . . . . . . . . . . . . . . . . . . . . $ 3,138,531 2.88% $ 3,125,721 2.88%Outstanding callable debt of Fannie Mae(8) . . . $ 94,790 1.97% $ 96,199 1.92%__________(1) Outstanding debt amounts and weighted-average interest rates reported in this table include the effects of discounts, premiums and
other cost basis adjustments. Reported outstanding amounts include fair value gains and losses associated with debt that we elected to carry at fair value. Reported amounts for total debt of Fannie Mae include unamortized discounts and premiums, other cost basis adjustments and fair value adjustments of $3.0 billion and $3.2 billion as of March 31, 2016 and December 31, 2015, respectively.
(2) Represents agreements to repurchase securities for a specified price, with repayment generally occurring on the following day. (3) Includes long-term debt with an original contractual maturity of greater than 1 year and up to 10 years, excluding zero-coupon debt.(4) Includes other long-term debt and foreign exchange bonds.(5) Credit risk-sharing securities that transfer a portion of the credit risk on specified pools of mortgage loans in our single-family guaranty
book of business to the investors in these securities, a portion of which is reported at fair value. For additional information on our credit risk-sharing transactions, see “Risk Management—Credit Risk Management—Single-Family Mortgage Credit Risk Management—Transfer of Mortgage Credit Risk—Credit Risk-Sharing Transactions.”
(6) Consists of structured debt instruments that are reported at fair value.(7) Represents remaining liability resulting from the transfer of financial assets from our condensed consolidated balance sheets that did
not qualify as a sale.(8) Consists of the unpaid principal balance of long-term callable debt of Fannie Mae that can be paid off in whole or in part at our option
at any time on or after a specified date.
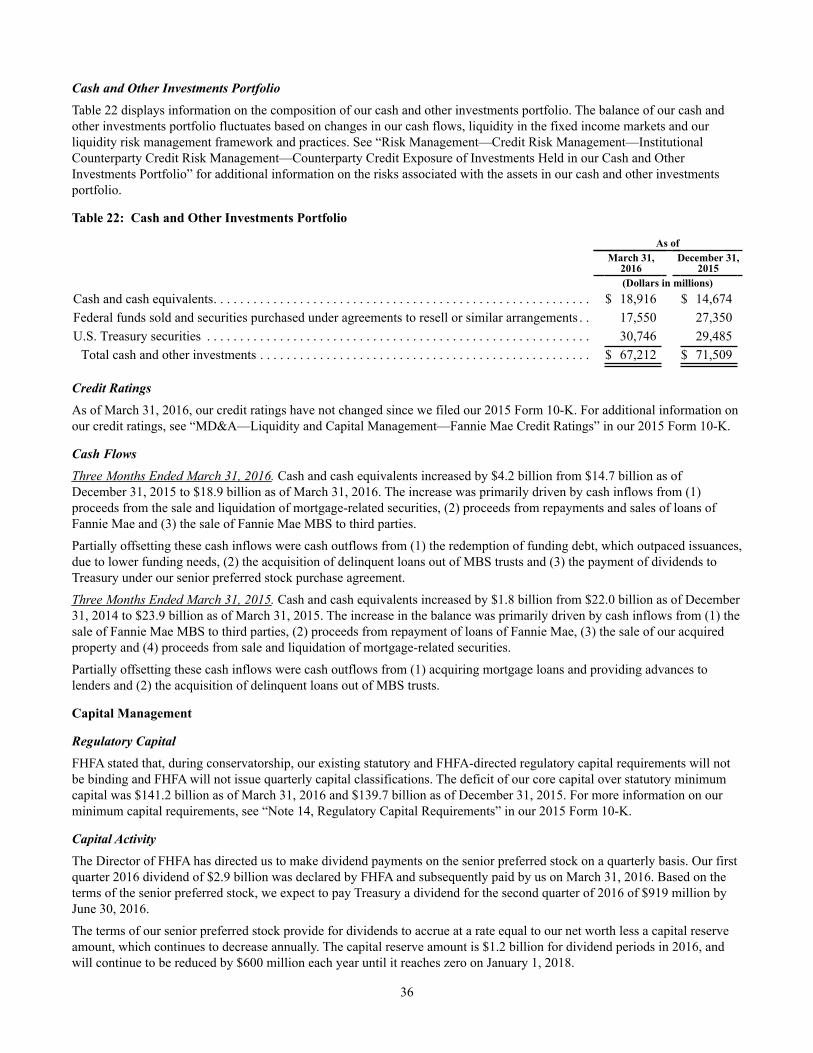
36
Cash and Other Investments PortfolioTable 22 displays information on the composition of our cash and other investments portfolio. The balance of our cash and other investments portfolio fluctuates based on changes in our cash flows, liquidity in the fixed income markets and our liquidity risk management framework and practices. See “Risk Management—Credit Risk Management—Institutional Counterparty Credit Risk Management—Counterparty Credit Exposure of Investments Held in our Cash and Other Investments Portfolio” for additional information on the risks associated with the assets in our cash and other investments portfolio.
Table 22: Cash and Other Investments Portfolio
As ofMarch 31,
2016December 31,
2015(Dollars in millions)
Cash and cash equivalents. . . . . . . . . . . . . . . . . . . . . . . . . . . . . . . . . . . . . . . . . . . . . . . . . . . . . . . . . $ 18,916 $ 14,674Federal funds sold and securities purchased under agreements to resell or similar arrangements . . 17,550 27,350U.S. Treasury securities . . . . . . . . . . . . . . . . . . . . . . . . . . . . . . . . . . . . . . . . . . . . . . . . . . . . . . . . . . 30,746 29,485
Total cash and other investments . . . . . . . . . . . . . . . . . . . . . . . . . . . . . . . . . . . . . . . . . . . . . . . . . . $ 67,212 $ 71,509
Credit RatingsAs of March 31, 2016, our credit ratings have not changed since we filed our 2015 Form 10-K. For additional information on our credit ratings, see “MD&A—Liquidity and Capital Management—Fannie Mae Credit Ratings” in our 2015 Form 10-K.
Cash FlowsThree Months Ended March 31, 2016. Cash and cash equivalents increased by $4.2 billion from $14.7 billion as of December 31, 2015 to $18.9 billion as of March 31, 2016. The increase was primarily driven by cash inflows from (1) proceeds from the sale and liquidation of mortgage-related securities, (2) proceeds from repayments and sales of loans of Fannie Mae and (3) the sale of Fannie Mae MBS to third parties.
Partially offsetting these cash inflows were cash outflows from (1) the redemption of funding debt, which outpaced issuances, due to lower funding needs, (2) the acquisition of delinquent loans out of MBS trusts and (3) the payment of dividends to Treasury under our senior preferred stock purchase agreement.
Three Months Ended March 31, 2015. Cash and cash equivalents increased by $1.8 billion from $22.0 billion as of December 31, 2014 to $23.9 billion as of March 31, 2015. The increase in the balance was primarily driven by cash inflows from (1) the sale of Fannie Mae MBS to third parties, (2) proceeds from repayment of loans of Fannie Mae, (3) the sale of our acquired property and (4) proceeds from sale and liquidation of mortgage-related securities.
Partially offsetting these cash inflows were cash outflows from (1) acquiring mortgage loans and providing advances to lenders and (2) the acquisition of delinquent loans out of MBS trusts.
Capital Management
Regulatory CapitalFHFA stated that, during conservatorship, our existing statutory and FHFA-directed regulatory capital requirements will not be binding and FHFA will not issue quarterly capital classifications. The deficit of our core capital over statutory minimum capital was $141.2 billion as of March 31, 2016 and $139.7 billion as of December 31, 2015. For more information on our minimum capital requirements, see “Note 14, Regulatory Capital Requirements” in our 2015 Form 10-K.
Capital ActivityThe Director of FHFA has directed us to make dividend payments on the senior preferred stock on a quarterly basis. Our first quarter 2016 dividend of $2.9 billion was declared by FHFA and subsequently paid by us on March 31, 2016. Based on the terms of the senior preferred stock, we expect to pay Treasury a dividend for the second quarter of 2016 of $919 million by June 30, 2016.
The terms of our senior preferred stock provide for dividends to accrue at a rate equal to our net worth less a capital reserve amount, which continues to decrease annually. The capital reserve amount is $1.2 billion for dividend periods in 2016, and will continue to be reduced by $600 million each year until it reaches zero on January 1, 2018.
37
We are effectively unable to raise equity capital from private sources at this time and, therefore, are reliant on the funding available under our senior preferred stock purchase agreement with Treasury to address any net worth deficit. Under the senior preferred stock purchase agreement, Treasury made a commitment to provide funding, under certain conditions, to eliminate deficiencies in our net worth. We have received a total of $116.1 billion from Treasury pursuant to the senior preferred stock purchase agreement as of March 31, 2016. The current aggregate liquidation preference of the senior preferred stock, including the initial aggregate liquidation preference of $1.0 billion, remains at $117.1 billion.
While we had a positive net worth as of March 31, 2016 and have not received funds from Treasury under the agreement since the first quarter of 2012, we will be required to obtain additional funding from Treasury pursuant to the senior preferred stock purchase agreement if we have a net worth deficit in future periods. As of the date of this filing, the amount of remaining available funding under the senior preferred stock purchase agreement is $117.6 billion. If we were to draw additional funds from Treasury under the agreement in a future period, the amount of remaining funding under the agreement would be reduced by the amount of our draw. Dividend payments we make to Treasury do not restore or increase the amount of funding available to us under the agreement.
See “Business—Conservatorship and Treasury Agreements—Treasury Agreements” in our 2015 Form 10-K for more information on the terms of the senior preferred stock and our senior preferred stock purchase agreement with Treasury. See “Risk Factors” in our 2015 Form 10-K for a discussion of the risks relating to our dividend obligations to Treasury on the senior preferred stock.
OFF-BALANCE SHEET ARRANGEMENTS
Our maximum potential exposure to credit losses relating to our outstanding and unconsolidated Fannie Mae MBS and other financial guarantees is primarily represented by the unpaid principal balance of the mortgage loans underlying outstanding and unconsolidated Fannie Mae MBS and other financial guarantees of $26.8 billion as of March 31, 2016 and $27.5 billion as of December 31, 2015.
For a description of our off-balance sheet arrangements, see “MD&A—Off-Balance Sheet Arrangements” in our 2015 Form 10-K.
RISK MANAGEMENT
Our business activities expose us to the following three major categories of risk: credit risk, market risk (including interest rate and liquidity risk) and operational risk. We seek to actively monitor and manage these risks by using an established risk management framework. In addition to our exposure to credit, market and operational risks, there is significant uncertainty regarding the future of our company, including how long we will continue to be in existence, which we discuss in more detail in “Risk Factors” in this report and in “Business—Housing Finance Reform” in our 2015 Form 10-K. This uncertainty, along with limitations on our employee compensation arising from our conservatorship, could adversely affect our ability to retain and hire qualified employees.
We are also subject to a number of other risks that could adversely impact our business, financial condition and earnings including human capital, model, legal, regulatory and compliance, reputational, technological and cybersecurity, strategic and execution risks. These risks may arise due to a failure to comply with laws, regulations or ethical standards and codes of conduct applicable to our business activities and functions.
In this section we provide an update on our management of our major risk categories. For a more complete discussion of the primary risks we face and how we manage credit risk, market risk and operational risk, see “MD&A—Risk Management” in our 2015 Form 10-K and “Risk Factors” in this report and our 2015 Form 10-K.
Credit Risk ManagementWe are generally subject to two types of credit risk: mortgage credit risk and institutional counterparty credit risk. Mortgage credit risk is the risk that a borrower will fail to make required mortgage payments. Institutional counterparty credit risk is the risk that our institutional counterparties may fail to fulfill their contractual obligations to us.

38
Mortgage Credit Risk ManagementWe are exposed to credit risk on our mortgage credit book of business because we either hold mortgage assets, have issued a guaranty in connection with the creation of Fannie Mae MBS backed by mortgage assets or provided other credit enhancements on mortgage assets. While our mortgage credit book of business includes all of our mortgage-related assets, both on- and off-balance sheet, our guaranty book of business excludes non-Fannie Mae mortgage-related securities held in our retained mortgage portfolio for which we do not provide a guaranty. We provide information on the performance of non-Fannie Mae mortgage-related securities held in our retained mortgage portfolio, including the impairment that we have recognized on these securities, in “Note 5, Investments in Securities.”
Mortgage Credit Book of BusinessTable 23 displays the composition of our mortgage credit book of business based on unpaid principal balance. Our single-family mortgage credit book of business accounted for 93% of our mortgage credit book of business as of March 31, 2016 and December 31, 2015.
Table 23: Composition of Mortgage Credit Book of Business
As ofMarch 31, 2016 December 31, 2015
Single-Family Multifamily Total
Single-Family Multifamily Total
(Dollars in millions)
Mortgage loans and Fannie Mae MBS(1) . . . . . . . . . . . $ 2,811,363 $ 205,979 $ 3,017,342 $ 2,817,251 $ 198,342 $ 3,015,593Unconsolidated Fannie Mae MBS, held by third
parties(2) . . . . . . . . . . . . . . . . . . . . . . . . . . . . . . . . . . 9,461 1,215 10,676 9,818 1,226 11,044Other credit guarantees(3) . . . . . . . . . . . . . . . . . . . . . . . 2,543 13,538 16,081 2,652 13,852 16,504
Guaranty book of business . . . . . . . . . . . . . . . . . . . . $ 2,823,367 $ 220,732 $ 3,044,099 $ 2,829,721 $ 213,420 $ 3,043,141Agency mortgage-related securities(4) . . . . . . . . . . . . . 4,871 8 4,879 5,973 7 5,980Other mortgage-related securities(5) . . . . . . . . . . . . . . . 8,003 5,243 13,246 10,365 6,469 16,834
Mortgage credit book of business . . . . . . . . . . . . . . $ 2,836,241 $ 225,983 $ 3,062,224 $ 2,846,059 $ 219,896 $ 3,065,955
Guaranty Book of Business Detail:Conventional Guaranty Book of Business(6) . . . . . . $ 2,773,101 $ 219,302 $ 2,992,403 $ 2,778,254 $ 211,975 $ 2,990,229Government Guaranty Book of Business(7) . . . . . . . $ 50,266 $ 1,430 $ 51,696 $ 51,467 $ 1,445 $ 52,912
__________(1) Consists of mortgage loans and Fannie Mae MBS recognized in our condensed consolidated balance sheets. The principal balance of
resecuritized Fannie Mae MBS is included only once in the reported amount.(2) The principal balance of resecuritized Fannie Mae MBS is included only once in the reported amount.(3) Consists of single-family and multifamily credit enhancements that we have provided and that are not otherwise reflected in the table.(4) Consists of mortgage-related securities issued by Freddie Mac and Ginnie Mae.(5) Primarily includes mortgage revenue bonds, Alt-A and subprime PLS and CMBS.(6) Consists of mortgage loans and mortgage-related securities that are not guaranteed or insured, in whole or in part, by the U.S.
government or one of its agencies.(7) Consists of mortgage loans and mortgage-related securities guaranteed or insured, in whole or in part, by the U.S. government or one of
its agencies.
The GSE Act requires us to set aside each year an amount equal to 4.2 basis points for each dollar of the unpaid principal balance of our total new business purchases and to pay this amount to specified HUD and Treasury funds. New business purchases consist of single-family and multifamily whole mortgage loans purchased during the period and single-family and multifamily mortgage loans underlying Fannie Mae MBS issued during the period pursuant to lender swaps. In February 2016, we paid $217 million to the funds based on our new business purchases in 2015. Our new business purchases were $115.2 billion in the first three months of 2016. Accordingly, we recognized an expense of $48 million related to this obligation for the first three months of 2016. We expect to pay this amount, plus additional amounts to be accrued based on our new business purchases in the remaining nine months of 2016, to the funds in February 2017. See “Business—Our Charter and Regulation of Our Activities—The GSE Act—Affordable Housing Allocations” in our 2015 Form 10-K for more information regarding this obligation.

39
In the following sections, we discuss the mortgage credit risk of the single-family and multifamily loans in our guaranty book of business. The credit statistics reported below, unless otherwise noted, pertain generally to the portion of our guaranty book of business for which we have access to detailed loan-level information, which constituted approximately 99% of each of our single-family conventional guaranty book of business and our multifamily guaranty book of business, excluding defeased loans, as of March 31, 2016 and December 31, 2015. We typically obtain this data from the sellers or servicers of the mortgage loans in our guaranty book of business and receive representations and warranties from them as to the accuracy of the information. While we perform various quality assurance checks by sampling loans to assess compliance with our underwriting and eligibility criteria, we do not independently verify all reported information and we rely on lender representations regarding the accuracy of the characteristics of loans in our guaranty book of business. See “Risk Factors” in our 2015 Form 10-K for a discussion of the risk that we could experience mortgage fraud as a result of this reliance on lender representations.
Single-Family Mortgage Credit Risk ManagementOur strategy in managing single-family mortgage credit risk consists of five primary components: (1) our acquisition and servicing policies along with our underwriting and servicing standards; (2) the transfer of credit risk through risk-sharing transactions and the use of credit enhancements; (3) portfolio diversification and monitoring; (4) management of problem loans; and (5) REO management. We provide information on our credit-related income and credit losses in “Consolidated Results of Operations—Credit-Related Income.” For information on how we evaluate and factors that affect our single-family mortgage credit risk, see “MD&A—Risk Management—Credit Risk Management—Single-Family Mortgage Credit Risk Management” in our 2015 Form 10-K.
The single-family credit statistics we focus on and report in the sections below generally relate to our single-family conventional guaranty book of business, which represents the substantial majority of our total single-family guaranty book of business. We provide information on non-Fannie Mae mortgage-related securities held in our portfolio in “Note 5, Investments in Securities.”
Single-Family Acquisition and Servicing Policies and Underwriting and Servicing StandardsOur Single-Family business, with the oversight of our Enterprise Risk Management division, is responsible for pricing and managing credit risk relating to the portion of our single-family mortgage credit book of business consisting of single-family mortgage loans and Fannie Mae MBS backed by single-family mortgage loans (whether held in our portfolio or held by third parties). Desktop Underwriter, our proprietary automated underwriting system which measures credit risk by assessing the primary risk factors of a mortgage, is used to evaluate the majority of the loans we purchase or securitize. For information on our single-family acquisition and servicing policies and on our underwriting and servicing standards, see “MD&A—Risk Management—Credit Risk Management—Single-Family Mortgage Credit Risk Management—Single-Family Acquisition and Servicing Policies and Underwriting and Servicing Standards” in our 2015 Form 10-K.
We initiated underwriting and eligibility changes that became effective for deliveries in late 2008 and 2009 and that focused on strengthening our underwriting and eligibility standards to promote sustainable homeownership. The result of many of these changes is reflected in the substantially improved risk profile of our single-family loan acquisitions since 2009.
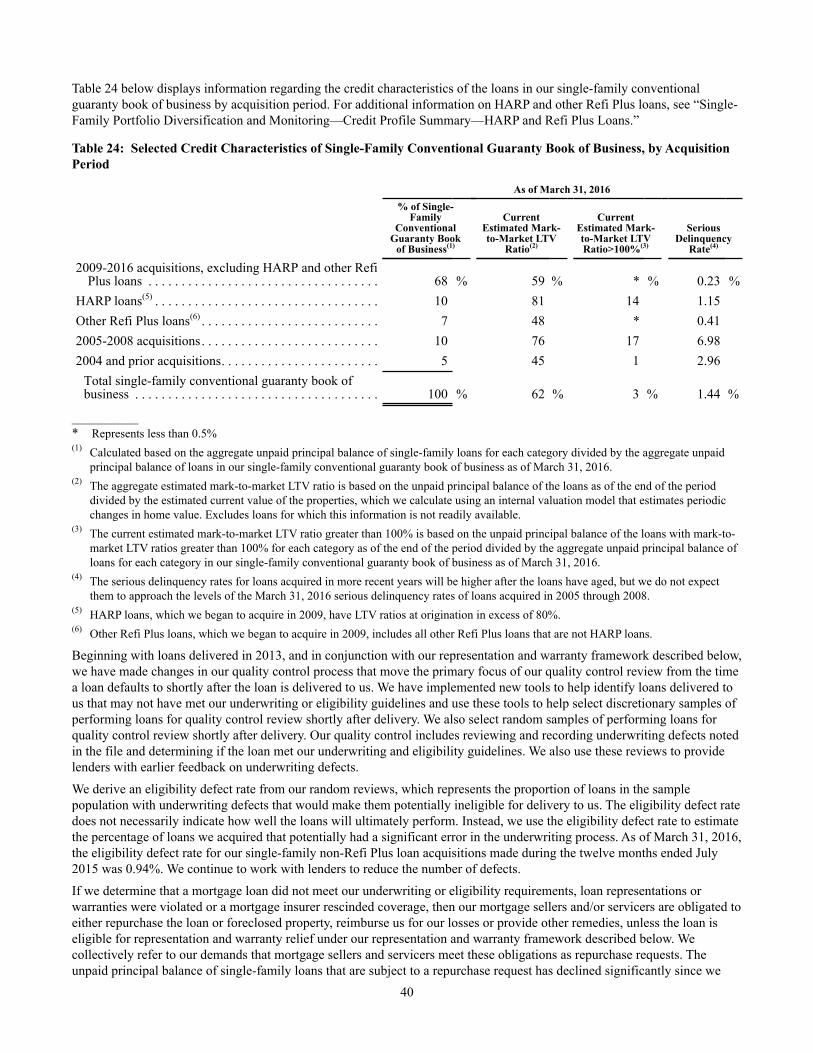
40
Table 24 below displays information regarding the credit characteristics of the loans in our single-family conventional guaranty book of business by acquisition period. For additional information on HARP and other Refi Plus loans, see “Single-Family Portfolio Diversification and Monitoring—Credit Profile Summary—HARP and Refi Plus Loans.”
Table 24: Selected Credit Characteristics of Single-Family Conventional Guaranty Book of Business, by Acquisition Period
As of March 31, 2016% of Single-
Family Conventional
Guaranty Book of Business(1)
Current Estimated Mark-to-Market LTV
Ratio(2)
Current Estimated Mark-to-Market LTV Ratio>100%(3)
Serious Delinquency
Rate(4)
2009-2016 acquisitions, excluding HARP and other RefiPlus loans . . . . . . . . . . . . . . . . . . . . . . . . . . . . . . . . . . . 68 % 59 % * % 0.23 %
HARP loans(5) . . . . . . . . . . . . . . . . . . . . . . . . . . . . . . . . . . 10 81 14 1.15Other Refi Plus loans(6) . . . . . . . . . . . . . . . . . . . . . . . . . . . 7 48 * 0.412005-2008 acquisitions. . . . . . . . . . . . . . . . . . . . . . . . . . . 10 76 17 6.982004 and prior acquisitions. . . . . . . . . . . . . . . . . . . . . . . . 5 45 1 2.96
Total single-family conventional guaranty book ofbusiness . . . . . . . . . . . . . . . . . . . . . . . . . . . . . . . . . . . . . 100 % 62 % 3 % 1.44 %
__________ * Represents less than 0.5%(1) Calculated based on the aggregate unpaid principal balance of single-family loans for each category divided by the aggregate unpaid
principal balance of loans in our single-family conventional guaranty book of business as of March 31, 2016.(2) The aggregate estimated mark-to-market LTV ratio is based on the unpaid principal balance of the loans as of the end of the period
divided by the estimated current value of the properties, which we calculate using an internal valuation model that estimates periodic changes in home value. Excludes loans for which this information is not readily available.
(3) The current estimated mark-to-market LTV ratio greater than 100% is based on the unpaid principal balance of the loans with mark-to-market LTV ratios greater than 100% for each category as of the end of the period divided by the aggregate unpaid principal balance of loans for each category in our single-family conventional guaranty book of business as of March 31, 2016.
(4) The serious delinquency rates for loans acquired in more recent years will be higher after the loans have aged, but we do not expect them to approach the levels of the March 31, 2016 serious delinquency rates of loans acquired in 2005 through 2008.
(5) HARP loans, which we began to acquire in 2009, have LTV ratios at origination in excess of 80%.(6) Other Refi Plus loans, which we began to acquire in 2009, includes all other Refi Plus loans that are not HARP loans.
Beginning with loans delivered in 2013, and in conjunction with our representation and warranty framework described below, we have made changes in our quality control process that move the primary focus of our quality control review from the time a loan defaults to shortly after the loan is delivered to us. We have implemented new tools to help identify loans delivered to us that may not have met our underwriting or eligibility guidelines and use these tools to help select discretionary samples of performing loans for quality control review shortly after delivery. We also select random samples of performing loans for quality control review shortly after delivery. Our quality control includes reviewing and recording underwriting defects noted in the file and determining if the loan met our underwriting and eligibility guidelines. We also use these reviews to provide lenders with earlier feedback on underwriting defects.
We derive an eligibility defect rate from our random reviews, which represents the proportion of loans in the sample population with underwriting defects that would make them potentially ineligible for delivery to us. The eligibility defect rate does not necessarily indicate how well the loans will ultimately perform. Instead, we use the eligibility defect rate to estimate the percentage of loans we acquired that potentially had a significant error in the underwriting process. As of March 31, 2016, the eligibility defect rate for our single-family non-Refi Plus loan acquisitions made during the twelve months ended July 2015 was 0.94%. We continue to work with lenders to reduce the number of defects.
If we determine that a mortgage loan did not meet our underwriting or eligibility requirements, loan representations or warranties were violated or a mortgage insurer rescinded coverage, then our mortgage sellers and/or servicers are obligated to either repurchase the loan or foreclosed property, reimburse us for our losses or provide other remedies, unless the loan is eligible for representation and warranty relief under our representation and warranty framework described below. We collectively refer to our demands that mortgage sellers and servicers meet these obligations as repurchase requests. The unpaid principal balance of single-family loans that are subject to a repurchase request has declined significantly since we
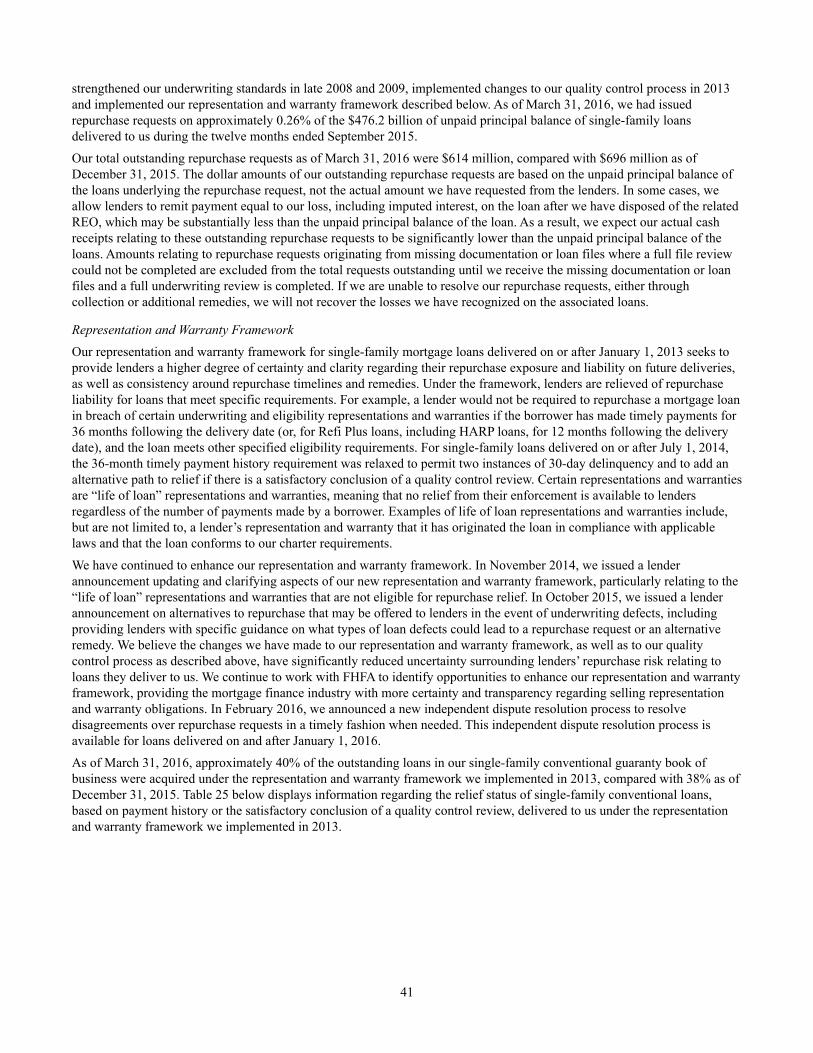
41
strengthened our underwriting standards in late 2008 and 2009, implemented changes to our quality control process in 2013 and implemented our representation and warranty framework described below. As of March 31, 2016, we had issued repurchase requests on approximately 0.26% of the $476.2 billion of unpaid principal balance of single-family loans delivered to us during the twelve months ended September 2015.
Our total outstanding repurchase requests as of March 31, 2016 were $614 million, compared with $696 million as of December 31, 2015. The dollar amounts of our outstanding repurchase requests are based on the unpaid principal balance of the loans underlying the repurchase request, not the actual amount we have requested from the lenders. In some cases, we allow lenders to remit payment equal to our loss, including imputed interest, on the loan after we have disposed of the related REO, which may be substantially less than the unpaid principal balance of the loan. As a result, we expect our actual cash receipts relating to these outstanding repurchase requests to be significantly lower than the unpaid principal balance of the loans. Amounts relating to repurchase requests originating from missing documentation or loan files where a full file review could not be completed are excluded from the total requests outstanding until we receive the missing documentation or loan files and a full underwriting review is completed. If we are unable to resolve our repurchase requests, either through collection or additional remedies, we will not recover the losses we have recognized on the associated loans.
Representation and Warranty FrameworkOur representation and warranty framework for single-family mortgage loans delivered on or after January 1, 2013 seeks to provide lenders a higher degree of certainty and clarity regarding their repurchase exposure and liability on future deliveries, as well as consistency around repurchase timelines and remedies. Under the framework, lenders are relieved of repurchase liability for loans that meet specific requirements. For example, a lender would not be required to repurchase a mortgage loan in breach of certain underwriting and eligibility representations and warranties if the borrower has made timely payments for 36 months following the delivery date (or, for Refi Plus loans, including HARP loans, for 12 months following the delivery date), and the loan meets other specified eligibility requirements. For single-family loans delivered on or after July 1, 2014, the 36-month timely payment history requirement was relaxed to permit two instances of 30-day delinquency and to add an alternative path to relief if there is a satisfactory conclusion of a quality control review. Certain representations and warranties are “life of loan” representations and warranties, meaning that no relief from their enforcement is available to lenders regardless of the number of payments made by a borrower. Examples of life of loan representations and warranties include, but are not limited to, a lender’s representation and warranty that it has originated the loan in compliance with applicable laws and that the loan conforms to our charter requirements.
We have continued to enhance our representation and warranty framework. In November 2014, we issued a lender announcement updating and clarifying aspects of our new representation and warranty framework, particularly relating to the “life of loan” representations and warranties that are not eligible for repurchase relief. In October 2015, we issued a lender announcement on alternatives to repurchase that may be offered to lenders in the event of underwriting defects, including providing lenders with specific guidance on what types of loan defects could lead to a repurchase request or an alternative remedy. We believe the changes we have made to our representation and warranty framework, as well as to our quality control process as described above, have significantly reduced uncertainty surrounding lenders’ repurchase risk relating to loans they deliver to us. We continue to work with FHFA to identify opportunities to enhance our representation and warranty framework, providing the mortgage finance industry with more certainty and transparency regarding selling representation and warranty obligations. In February 2016, we announced a new independent dispute resolution process to resolve disagreements over repurchase requests in a timely fashion when needed. This independent dispute resolution process is available for loans delivered on and after January 1, 2016.
As of March 31, 2016, approximately 40% of the outstanding loans in our single-family conventional guaranty book of business were acquired under the representation and warranty framework we implemented in 2013, compared with 38% as of December 31, 2015. Table 25 below displays information regarding the relief status of single-family conventional loans, based on payment history or the satisfactory conclusion of a quality control review, delivered to us under the representation and warranty framework we implemented in 2013.

42
Table 25: Representation and Warranty Status of Single-Family Conventional Loans Acquired in 2013-2016
As of March 31, 2016Refi Plus Non-Refi Plus Total
UnpaidPrincipalBalance
Number ofLoans
UnpaidPrincipalBalance
Number ofLoans
UnpaidPrincipalBalance
Number ofLoans
(Dollars in millions)
Single-family conventional loans that:Obtained relief . . . . . . . . . . . . . . . . . . . . . $ 168,151 1,167,453 $ 136,181 648,938 $ 304,332 1,816,391Remain eligible for relief . . . . . . . . . . . . . 30,827 204,252 993,930 4,834,896 1,024,757 5,039,148Are not eligible for relief . . . . . . . . . . . . . 3,849 25,069 8,476 45,454 12,325 70,523
Total outstanding loans acquired sinceJanuary 1, 2013 . . . . . . . . . . . . . . . . . . . . $ 202,827 1,396,774 $1,138,587 5,529,288 $1,341,414 6,926,062
As of March 31, 2016, approximately 26% of loans acquired under the representation and warranty framework had obtained relief, compared with 19% as of December 31, 2015. The increase in the percentage of loans that have obtained repurchase relief in the first quarter of 2016 was driven by the large number of non-Refi Plus single-family loans purchased in the first quarter of 2013 that have now received representation and warranty relief by meeting the 36-month timely payment history requirement. Providing lenders with relief from repurchasing loans for breaches of certain representations and warranties on loans acquired beginning in 2013 that meet specified eligibility requirements shifts some of the risk of non-compliance with our requirements back to us. However, we believe that we have taken appropriate steps to mitigate this risk, including moving the primary focus of our quality control reviews to shortly after the time the loans are delivered to us. We also retain the right to review any defaulted loans that were not previously reviewed and have not obtained relief, in addition to retaining the right to review all loans for any violations of life of loan representations and warranties.
Transfer of Mortgage Credit Risk
Credit Risk-Sharing TransactionsOur Single-Family business has developed risk-sharing capabilities to transfer portions of our single-family mortgage credit risk to the private market. The goal of these transactions is, to the extent economically sensible, to transfer a portion of the existing mortgage credit risk on a portion of recently acquired loans in our single-family guaranty book of business in order to reduce the economic risk to us and to taxpayers of future borrower defaults. Our primary method of achieving this objective has been through CAS and CIRT transactions. Approximately 18% of the loans in our single-family conventional guaranty book of business as of March 31, 2016, measured by unpaid principal balance, were included in a reference pool for a CAS or CIRT transaction. We have also executed other types of risk-sharing transactions in addition to our CAS and CIRT transactions. In the aggregate, our credit risk transfer transactions completed through March 31, 2016 transferred a significant portion of the mortgage credit risk on single-family mortgages with an unpaid principal balance of over $590 billion.
The loans we have included in our single-family credit risk transfer transactions have been limited to specified categories of loans we have acquired in recent years. Loan categories we have targeted for credit risk transfer transactions generally consist of fixed-rate 30-year single-family conventional loans that meet certain credit performance characteristics, are non-Refi Plus and have LTV ratios between 60% and 97%. These targeted loan categories constituted about half of our loan acquisitions for the twelve months ended November 2014, and over 95% of the loans in these categories that we acquired in the twelve months ended November 2014 were included in a subsequent credit risk transfer transaction. Loans are included in reference pools for credit risk transfer transactions on a lagged basis; typically, about one year after we initially acquire the loans. The portion of our single-family loan acquisitions we include in credit risk transfer transactions can vary from period to period based on market conditions and other factors.
In a CAS transaction, we transfer to investors a portion of the mortgage credit risk associated with losses on a reference pool of mortgage loans. We create a reference pool consisting of recently acquired single-family mortgage loans included in our guaranty book of business. We then create a hypothetical securitization structure with notional credit risk positions, or tranches (that is, first loss, mezzanine and senior) and issue CAS notes related to the first loss and mezzanine risk positions. The mezzanine risk positions we sell in a CAS transaction typically exceed our estimated stress losses for the reference pool. The CAS notes are generally issued with a stated final maturity date of either 10 or 12.5 years from issuance.
Beginning in 2016, we recognize CAS notes we issue to investors at amortized cost as “Debt of Fannie Mae” in our condensed consolidated balance sheets. CAS notes we issued prior to 2016 are recognized at fair value as “Debt of Fannie
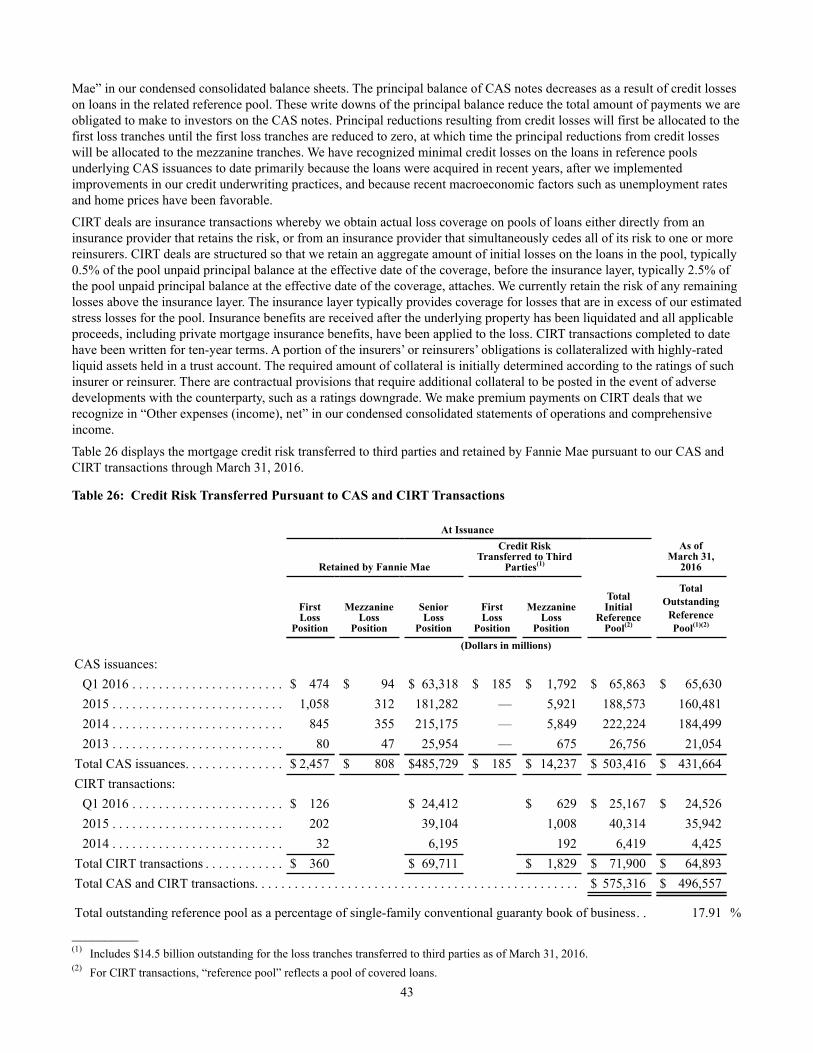
43
Mae” in our condensed consolidated balance sheets. The principal balance of CAS notes decreases as a result of credit losses on loans in the related reference pool. These write downs of the principal balance reduce the total amount of payments we are obligated to make to investors on the CAS notes. Principal reductions resulting from credit losses will first be allocated to the first loss tranches until the first loss tranches are reduced to zero, at which time the principal reductions from credit losses will be allocated to the mezzanine tranches. We have recognized minimal credit losses on the loans in reference pools underlying CAS issuances to date primarily because the loans were acquired in recent years, after we implemented improvements in our credit underwriting practices, and because recent macroeconomic factors such as unemployment rates and home prices have been favorable.
CIRT deals are insurance transactions whereby we obtain actual loss coverage on pools of loans either directly from an insurance provider that retains the risk, or from an insurance provider that simultaneously cedes all of its risk to one or more reinsurers. CIRT deals are structured so that we retain an aggregate amount of initial losses on the loans in the pool, typically 0.5% of the pool unpaid principal balance at the effective date of the coverage, before the insurance layer, typically 2.5% of the pool unpaid principal balance at the effective date of the coverage, attaches. We currently retain the risk of any remaining losses above the insurance layer. The insurance layer typically provides coverage for losses that are in excess of our estimated stress losses for the pool. Insurance benefits are received after the underlying property has been liquidated and all applicable proceeds, including private mortgage insurance benefits, have been applied to the loss. CIRT transactions completed to date have been written for ten-year terms. A portion of the insurers’ or reinsurers’ obligations is collateralized with highly-rated liquid assets held in a trust account. The required amount of collateral is initially determined according to the ratings of such insurer or reinsurer. There are contractual provisions that require additional collateral to be posted in the event of adverse developments with the counterparty, such as a ratings downgrade. We make premium payments on CIRT deals that we recognize in “Other expenses (income), net” in our condensed consolidated statements of operations and comprehensive income.
Table 26 displays the mortgage credit risk transferred to third parties and retained by Fannie Mae pursuant to our CAS and CIRT transactions through March 31, 2016.
Table 26: Credit Risk Transferred Pursuant to CAS and CIRT Transactions
At IssuanceAs of
March 31,2016Retained by Fannie Mae
Credit Risk Transferred to Third
Parties(1)
FirstLoss
Position
MezzanineLoss
Position
SeniorLoss
Position
FirstLoss
Position
MezzanineLoss
Position
Total Initial
Reference Pool(2)
Total Outstanding
Reference Pool(1)(2)
(Dollars in millions)
CAS issuances:Q1 2016 . . . . . . . . . . . . . . . . . . . . . . . $ 474 $ 94 $ 63,318 $ 185 $ 1,792 $ 65,863 $ 65,6302015 . . . . . . . . . . . . . . . . . . . . . . . . . . 1,058 312 181,282 — 5,921 188,573 160,4812014 . . . . . . . . . . . . . . . . . . . . . . . . . . 845 355 215,175 — 5,849 222,224 184,4992013 . . . . . . . . . . . . . . . . . . . . . . . . . . 80 47 25,954 — 675 26,756 21,054
Total CAS issuances. . . . . . . . . . . . . . . $ 2,457 $ 808 $485,729 $ 185 $ 14,237 $ 503,416 $ 431,664CIRT transactions:
Q1 2016 . . . . . . . . . . . . . . . . . . . . . . . $ 126 $ 24,412 $ 629 $ 25,167 $ 24,5262015 . . . . . . . . . . . . . . . . . . . . . . . . . . 202 39,104 1,008 40,314 35,9422014 . . . . . . . . . . . . . . . . . . . . . . . . . . 32 6,195 192 6,419 4,425
Total CIRT transactions . . . . . . . . . . . . $ 360 $ 69,711 $ 1,829 $ 71,900 $ 64,893Total CAS and CIRT transactions. . . . . . . . . . . . . . . . . . . . . . . . . . . . . . . . . . . . . . . . . . . . . . . . . $ 575,316 $ 496,557
Total outstanding reference pool as a percentage of single-family conventional guaranty book of business. . 17.91 %__________(1) Includes $14.5 billion outstanding for the loss tranches transferred to third parties as of March 31, 2016.(2) For CIRT transactions, “reference pool” reflects a pool of covered loans.

44
We intend to continue to engage in regular CAS and CIRT transactions on an ongoing basis, subject to market conditions. FHFA’s 2016 conservatorship scorecard noted that, because Fannie Mae and Freddie Mac’s single-family credit risk transfers have evolved into a core business practice, it is FHFA’s current expectation that single-family credit risk transfers will continue to be an ongoing conservatorship requirement. Accordingly, FHFA’s 2016 conservatorship scorecard includes several objectives relating to our single-family credit risk transfer transactions.
Although we have designed our CAS and CIRT transactions to mitigate some of our potential future credit losses, these transactions may provide less protection than we expect. In addition, the credit risk transfer market is relatively new, and it is uncertain if there will be adequate demand for these products over the long term to meet our goals for these transactions.
Single-Family Portfolio Diversification and MonitoringDiversification within our single-family mortgage credit book of business by product type, loan characteristics and geography is an important factor that influences credit quality and performance and may reduce our credit risk. We monitor various loan attributes, in conjunction with housing market and economic conditions, to determine if our pricing, eligibility and underwriting criteria accurately reflect the risk associated with loans we acquire or guarantee. In some cases, we may decide to significantly reduce our participation in riskier loan product categories. We also review the payment performance of loans in order to help identify potential problem loans early in the delinquency cycle and to guide the development of our loss mitigation strategies. For additional information on key loan attributes, see “MD&A—Risk Management—Credit Risk Management—Single-Family Mortgage Credit Risk Management—Single-Family Portfolio Diversification and Monitoring” in our 2015 Form 10-K.

45
Table 27 displays our single-family conventional business volumes and our single-family conventional guaranty book of business, based on certain key risk characteristics that we use to evaluate the risk profile and credit quality of our single-family loans.
Table 27: Risk Characteristics of Single-Family Conventional Business Volume and Guaranty Book of Business(1)
Percent of Single-Family Conventional Business Volume(2) Percent of Single-Family
Conventional Guaranty Book of Business(3)(4)
As ofFor the Three Months Ended
March 31,2016 2015 March 31, 2016 December 31, 2015
Original LTV ratio:(5)
<= 60% . . . . . . . . . . . . . . . . . . . . . . . . . . . . . . . . . . . . . . 19 % 19 % 21 % 21 %60.01% to 70% . . . . . . . . . . . . . . . . . . . . . . . . . . . . . . . . 14 15 14 1470.01% to 80% . . . . . . . . . . . . . . . . . . . . . . . . . . . . . . . . 40 40 38 3880.01% to 90%(6) . . . . . . . . . . . . . . . . . . . . . . . . . . . . . . . 12 12 11 1190.01% to 100%(6) . . . . . . . . . . . . . . . . . . . . . . . . . . . . . . 15 13 12 12100.01% to 125%(6) . . . . . . . . . . . . . . . . . . . . . . . . . . . . . * 1 3 3Greater than 125%(6) . . . . . . . . . . . . . . . . . . . . . . . . . . . . * * 1 1
Total . . . . . . . . . . . . . . . . . . . . . . . . . . . . . . . . . . . . . . 100 % 100 % 100 % 100 %Weighted average. . . . . . . . . . . . . . . . . . . . . . . . . . . . 75 % 74 % 75 % 75 %
Average loan amount . . . . . . . . . . . . . . . . . . . . . . . . . . . . . . $ 219,195 $ 221,682 $ 160,822 $ 160,741Estimated mark-to-market LTV ratio:(7)
<= 60% . . . . . . . . . . . . . . . . . . . . . . . . . . . . . . . . . . . . . . 46 % 46 %60.01% to 70% . . . . . . . . . . . . . . . . . . . . . . . . . . . . . . . . 19 1970.01% to 80% . . . . . . . . . . . . . . . . . . . . . . . . . . . . . . . . 17 1780.01% to 90% . . . . . . . . . . . . . . . . . . . . . . . . . . . . . . . . 10 1090.01% to 100% . . . . . . . . . . . . . . . . . . . . . . . . . . . . . . . 5 5100.01% to 125%. . . . . . . . . . . . . . . . . . . . . . . . . . . . . . . 2 2Greater than 125% . . . . . . . . . . . . . . . . . . . . . . . . . . . . . 1 1
Total . . . . . . . . . . . . . . . . . . . . . . . . . . . . . . . . . . . . . . 100 % 100 %Weighted-average. . . . . . . . . . . . . . . . . . . . . . . . . . . . 62 % 62 %
Product type:Fixed-rate:(8)
Long-term. . . . . . . . . . . . . . . . . . . . . . . . . . . . . . . . . . 81 % 80 % 76 % 76 %Intermediate-term . . . . . . . . . . . . . . . . . . . . . . . . . . . . 17 17 17 17Interest-only . . . . . . . . . . . . . . . . . . . . . . . . . . . . . . . . — — * *
Total fixed-rate . . . . . . . . . . . . . . . . . . . . . . . . . . . . 98 97 93 93Adjustable-rate:
Interest-only . . . . . . . . . . . . . . . . . . . . . . . . . . . . . . . . — — 2 2Other ARMs . . . . . . . . . . . . . . . . . . . . . . . . . . . . . . . . 2 3 5 5
Total adjustable-rate . . . . . . . . . . . . . . . . . . . . . . . . 2 3 7 7Total . . . . . . . . . . . . . . . . . . . . . . . . . . . . . . . . . . . 100 % 100 % 100 % 100 %
Number of property units:1 unit . . . . . . . . . . . . . . . . . . . . . . . . . . . . . . . . . . . . . . . . 97 % 97 % 97 % 97 %2-4 units. . . . . . . . . . . . . . . . . . . . . . . . . . . . . . . . . . . . . . 3 3 3 3
Total. . . . . . . . . . . . . . . . . . . . . . . . . . . . . . . . . . . . . . 100 % 100 % 100 % 100 %Property type:
Single-family homes . . . . . . . . . . . . . . . . . . . . . . . . . . . . 90 % 90 % 91 % 91 %Condo/Co-op. . . . . . . . . . . . . . . . . . . . . . . . . . . . . . . . . . 10 10 9 9
Total. . . . . . . . . . . . . . . . . . . . . . . . . . . . . . . . . . . . . . 100 % 100 % 100 % 100 %

46
Percent of Single-FamilyConventional Business Volume(2) Percent of Single-Family
Conventional GuarantyBook of Business(3)(4)
As ofFor the Three Months Ended
March 31,2016 2015 March 31, 2016 December 31, 2015
Occupancy type:Primary residence. . . . . . . . . . . . . . . . . . . . . . . . . . . . . . 89 % 88 % 88 % 88 %Second/vacation home . . . . . . . . . . . . . . . . . . . . . . . . . . 4 4 4 4Investor . . . . . . . . . . . . . . . . . . . . . . . . . . . . . . . . . . . . . 7 8 8 8
Total. . . . . . . . . . . . . . . . . . . . . . . . . . . . . . . . . . . . . . 100 % 100 % 100 % 100 %FICO credit score at origination:
< 620(9) . . . . . . . . . . . . . . . . . . . . . . . . . . . . . . . . . . . . . . 1 % 1 % 2 % 2 %620 to < 660 . . . . . . . . . . . . . . . . . . . . . . . . . . . . . . . . . . 5 4 5 5660 to < 700 . . . . . . . . . . . . . . . . . . . . . . . . . . . . . . . . . . 13 12 12 12700 to < 740 . . . . . . . . . . . . . . . . . . . . . . . . . . . . . . . . . . 21 20 20 20>= 740 . . . . . . . . . . . . . . . . . . . . . . . . . . . . . . . . . . . . . . 60 63 61 61
Total. . . . . . . . . . . . . . . . . . . . . . . . . . . . . . . . . . . . . . 100 % 100 % 100 % 100 %Weighted average . . . . . . . . . . . . . . . . . . . . . . . . . . . 746 748 744 744
Loan purpose:
Purchase . . . . . . . . . . . . . . . . . . . . . . . . . . . . . . . . . . . . . 46 % 37 % 33 % 33 %Cash-out refinance . . . . . . . . . . . . . . . . . . . . . . . . . . . . . 20 19 20 20Other refinance. . . . . . . . . . . . . . . . . . . . . . . . . . . . . . . . 34 44 47 47
Total. . . . . . . . . . . . . . . . . . . . . . . . . . . . . . . . . . . . . . 100 % 100 % 100 % 100 %Geographic concentration:(10)
Midwest . . . . . . . . . . . . . . . . . . . . . . . . . . . . . . . . . . . . . 13 % 14 % 15 % 15 %Northeast . . . . . . . . . . . . . . . . . . . . . . . . . . . . . . . . . . . . 14 14 18 19Southeast . . . . . . . . . . . . . . . . . . . . . . . . . . . . . . . . . . . . 22 20 22 22Southwest. . . . . . . . . . . . . . . . . . . . . . . . . . . . . . . . . . . . 20 18 17 16West . . . . . . . . . . . . . . . . . . . . . . . . . . . . . . . . . . . . . . . . 31 34 28 28
Total. . . . . . . . . . . . . . . . . . . . . . . . . . . . . . . . . . . . . . 100 % 100 % 100 % 100 %Origination year:
<= 2007 . . . . . . . . . . . . . . . . . . . . . . . . . . . . . . . . . . . . . 13 % 13 %2008 . . . . . . . . . . . . . . . . . . . . . . . . . . . . . . . . . . . . . . . . 2 22009 . . . . . . . . . . . . . . . . . . . . . . . . . . . . . . . . . . . . . . . . 4 52010 . . . . . . . . . . . . . . . . . . . . . . . . . . . . . . . . . . . . . . . . 6 72011 . . . . . . . . . . . . . . . . . . . . . . . . . . . . . . . . . . . . . . . . 8 82012 . . . . . . . . . . . . . . . . . . . . . . . . . . . . . . . . . . . . . . . . 20 212013 . . . . . . . . . . . . . . . . . . . . . . . . . . . . . . . . . . . . . . . . 18 182014 . . . . . . . . . . . . . . . . . . . . . . . . . . . . . . . . . . . . . . . . 11 112015 . . . . . . . . . . . . . . . . . . . . . . . . . . . . . . . . . . . . . . . . 16 152016 . . . . . . . . . . . . . . . . . . . . . . . . . . . . . . . . . . . . . . . . 2 —
Total. . . . . . . . . . . . . . . . . . . . . . . . . . . . . . . . . . . . . . 100 % 100 %__________* Represents less than 0.5% of single-family conventional business volume or book of business.(1) Second lien mortgage loans held by third parties are not reflected in the original LTV or mark-to-market LTV ratios in this table. (2) Calculated based on unpaid principal balance of single-family loans for each category at time of acquisition.(3) Calculated based on the aggregate unpaid principal balance of single-family loans for each category divided by the aggregate unpaid
principal balance of loans in our single-family conventional guaranty book of business as of the end of each period.(4) Our single-family conventional guaranty book of business includes jumbo-conforming and high-balance loans that represented
approximately 5% of our single-family conventional guaranty book of business as of March 31, 2016 and December 31, 2015, respectively. See “Business—Our Charter and Regulation of Our Activities—Charter Act—Loan Standards” and “MD&A—Risk

47
Management—Credit Risk Management—Single-Family Mortgage Credit Risk Management—Credit Profile Summary—Jumbo Conforming and High-Balance Loans” in our 2015 Form 10-K for information on our loan limits.
(5) The original LTV ratio generally is based on the original unpaid principal balance of the loan divided by the appraised property value reported to us at the time of acquisition of the loan. Excludes loans for which this information is not readily available.
(6) We purchase loans with original LTV ratios above 80% as part of our mission to serve the primary mortgage market and provide liquidity to the housing finance system. Except as permitted under HARP, our charter generally requires primary mortgage insurance or other credit enhancement for loans that we acquire that have an LTV ratio over 80%.
(7) The aggregate estimated mark-to-market LTV ratio is based on the unpaid principal balance of the loan as of the end of each reported period divided by the estimated current value of the property, which we calculate using an internal valuation model that estimates periodic changes in home value. Excludes loans for which this information is not readily available.
(8) Long-term fixed-rate consists of mortgage loans with maturities greater than 15 years, while intermediate-term fixed-rate loans have maturities equal to or less than 15 years. Loans with interest-only terms are included in the interest-only category regardless of their maturities.
(9) Loans acquired after 2009 with FICO credit scores below 620 consist primarily of the refinance of existing loans under our Refi Plus initiative.
(10) Midwest consists of IL, IN, IA, MI, MN, NE, ND, OH, SD and WI. Northeast consists of CT, DE, ME, MA, NH, NJ, NY, PA, PR, RI, VT and VI. Southeast consists of AL, DC, FL, GA, KY, MD, MS, NC, SC, TN, VA and WV. Southwest consists of AZ, AR, CO, KS, LA, MO, NM, OK, TX and UT. West consists of AK, CA, GU, HI, ID, MT, NV, OR, WA and WY.
Credit Profile Summary
OverviewOur acquisitions in the first quarter of 2016 continued to have a strong credit profile with a weighted average original LTV ratio of 75%, compared with 74% in the first quarter of 2015. Our acquisition of loans with original LTV ratios over 80% increased to 27% in the first quarter of 2016, compared with 26% in the first quarter of 2015. This increase was primarily due to a decrease in our acquisitions of refinance loans, which decreased to 54% in the first quarter of 2016, compared with 63% in the first quarter of 2015, and an increase in our acquisitions of home purchase loans. Home purchase loans typically have higher LTV ratios than non-HARP refinance loans. The weighted average FICO credit score of our acquisitions decreased to 746 in the first quarter of 2016, compared with 748 in the first quarter of 2015. Our acquisitions of loans with FICO credit scores at origination of 740 or above decreased to 60% in the first quarter of 2016, compared with 63% in the first quarter of 2015. Our acquisition of loans with FICO credit scores at origination of less than 700 increased to 19% in the first quarter of 2016, compared with 17% in the first quarter of 2015.
The credit profile of our future acquisitions will depend on many factors, including: our future guaranty fee pricing and any impact of that pricing on the volume and mix of loans we acquire; our future eligibility standards and those of mortgage insurers, FHA and VA; the percentage of loan originations representing refinancings; changes in interest rates; our future objectives and activities in support of those objectives, including actions we may take to reach additional underserved creditworthy borrowers; government policy; market and competitive conditions; and the volume and characteristics of HARP loans we acquire in the future. We expect the ultimate performance of all our loans will be affected by borrower behavior, public policy and macroeconomic trends, including unemployment, the economy and home prices. In addition, if lender customers retain more of the higher-quality loans they originate, it could negatively affect the credit profile of our new single-family acquisitions. We discuss our efforts to increase access to mortgage credit for creditworthy borrowers in “Executive Summary—Single-Family Guaranty Book of Business—Providing Access to Credit Opportunities for Creditworthy Borrowers.”
HARP and Refi Plus LoansSince 2009, we have offered HARP under our Refi Plus initiative, which was designed to expand refinancing opportunities for borrowers who may otherwise be unable to refinance their mortgage loans due to a decline in home values. HARP offers refinancing flexibility to eligible borrowers who are current on their loans and whose loans are owned or guaranteed by us and meet certain additional criteria. Under HARP, we allow our borrowers who have mortgage loans that have note dates prior to June 2009 with current LTV ratios greater than 80% to refinance their mortgages without obtaining new mortgage insurance in excess of what is already in place. Accordingly, HARP loans have LTV ratios at origination in excess of 80%. HARP loans cannot (1) be an adjustable-rate mortgage loan, if the initial fixed period is less than five years; (2) have an interest only feature, which permits the payment of interest without a payment of principal; (3) be a balloon mortgage loan; or (4) have the potential for negative amortization. In May 2015, FHFA announced the extension of the ending date for HARP to December 31, 2016. In addition, we have extended our Refi Plus initiative until December 31, 2016.

48
The loans we acquire under HARP have higher LTV ratios than we would otherwise permit, greater than 100% in some cases. Since 2012, we have acquired HARP loans with LTV ratios greater than 125% for fixed-rate loans of eligible borrowers. In addition to the high LTV ratios that characterize HARP loans, some borrowers for HARP and Refi Plus loans may also have lower FICO credit scores and may provide less documentation than we would otherwise require. As of March 31, 2016, HARP loans, which constituted 10% of our single-family book of business, had a weighted average FICO credit score at origination of 728 compared with 744 for loans in our single-family book of business overall.
Loans we acquire under Refi Plus and HARP represent refinancings of loans that are already in our guaranty book of business. The credit risk associated with the newly acquired loans essentially replaces the credit risk on the loans that we already held prior to the refinancing. These loans have higher risk profiles and higher serious delinquency rates than the other loans we have acquired since the beginning of 2009. However, we expect these loans will perform better than the loans they replace because HARP and Refi Plus loans should either reduce the borrowers’ monthly payments or provide more stable terms than the borrowers’ old loans (for example, by refinancing into a mortgage with a fixed interest rate instead of an adjustable rate). HARP loans constituted approximately 2% of our total single-family acquisitions in the first quarter of 2016, compared with approximately 3% of total single-family acquisitions in the first quarter of 2015. We expect the volume of refinancings under HARP to continue to decline, due to a decrease in the population of borrowers with loans that have high LTV ratios who are willing to refinance and would benefit from refinancing.
For information on the serious delinquency rates and current mark-to-market LTV ratios as of March 31, 2016 of single-family loans we acquired under HARP and Refi Plus, compared with other single-family loans we have acquired, see “Table 24: Selected Credit Characteristics of Single-Family Conventional Guaranty Book of Business, by Acquisition Period.”
Alt-A LoansWe classify certain loans as Alt-A so that we can discuss our exposure to Alt-A loans in this Form 10-Q and elsewhere. However, there is no universally accepted definition of Alt-A loans. Our single-family conventional guaranty book of business includes loans with some features that are similar to Alt-A loans that we have not classified as Alt-A because they do not meet our classification criteria.
We do not rely solely on our classifications of loans as Alt-A to evaluate the credit risk exposure relating to these loans in our single-family conventional guaranty book of business. For more information about the credit risk characteristics of loans in our single-family guaranty book of business, see “Table 27: Risk Characteristics of Single-Family Conventional Business Volume and Guaranty Book of Business,” “Note 3, Mortgage Loans” and “Note 13, Concentrations of Credit Risk.”
Our exposure to Alt-A loans included in our single-family conventional guaranty book of business, based on the classification criteria described in this section, does not include (1) our investments in private-label mortgage-related securities backed by Alt-A loans or (2) resecuritizations, or wraps, of private-label mortgage-related securities backed by Alt-A mortgage loans that we have guaranteed. See “Note 5, Investments in Securities” for more information on our exposure to private label mortgage-related securities backed by Alt-A loans.
We have classified a mortgage loan as Alt-A if and only if the lender that delivered the loan to us classified the loan as Alt-A, based on documentation or other features. The unpaid principal balance of Alt-A loans included in our single-family conventional guaranty book of business of $98.6 billion as of March 31, 2016, represented approximately 4% of our single-family conventional guaranty book of business. Because we discontinued the purchase of newly originated Alt-A loans in 2009, except for those that represent the refinancing of a loan we acquired prior to 2009, we expect our acquisitions of Alt-A mortgage loans to continue to be minimal in future periods and the percentage of the book of business attributable to Alt-A to continue to decrease over time.
See “MD&A—Risk Management—Credit Risk Management—Single-Family Mortgage Credit Risk Management—Single-Family Portfolio Diversification and Monitoring” in our 2015 Form 10-K for a discussion of other types of loans, including jumbo conforming loans, high balance loans, reverse mortgages and mortgages with rate resets.
Problem Loan ManagementOur problem loan management strategies are primarily focused on reducing defaults to avoid losses that would otherwise occur and pursuing foreclosure alternatives to attempt to minimize the severity of the losses we incur. If a borrower does not make required payments, or is in jeopardy of not making payments, we work with the servicers of our loans to offer workout solutions to minimize the likelihood of foreclosure as well as the severity of loss. Our loan workouts reflect our various types of home retention solutions, including loan modifications, repayment plans and forbearances, and foreclosure alternatives, including short sales and deeds-in-lieu of foreclosure. When appropriate, we seek to move to foreclosure expeditiously. See “MD&A—Risk Management—Credit Risk Management—Single-Family Mortgage Credit Risk Management—Problem
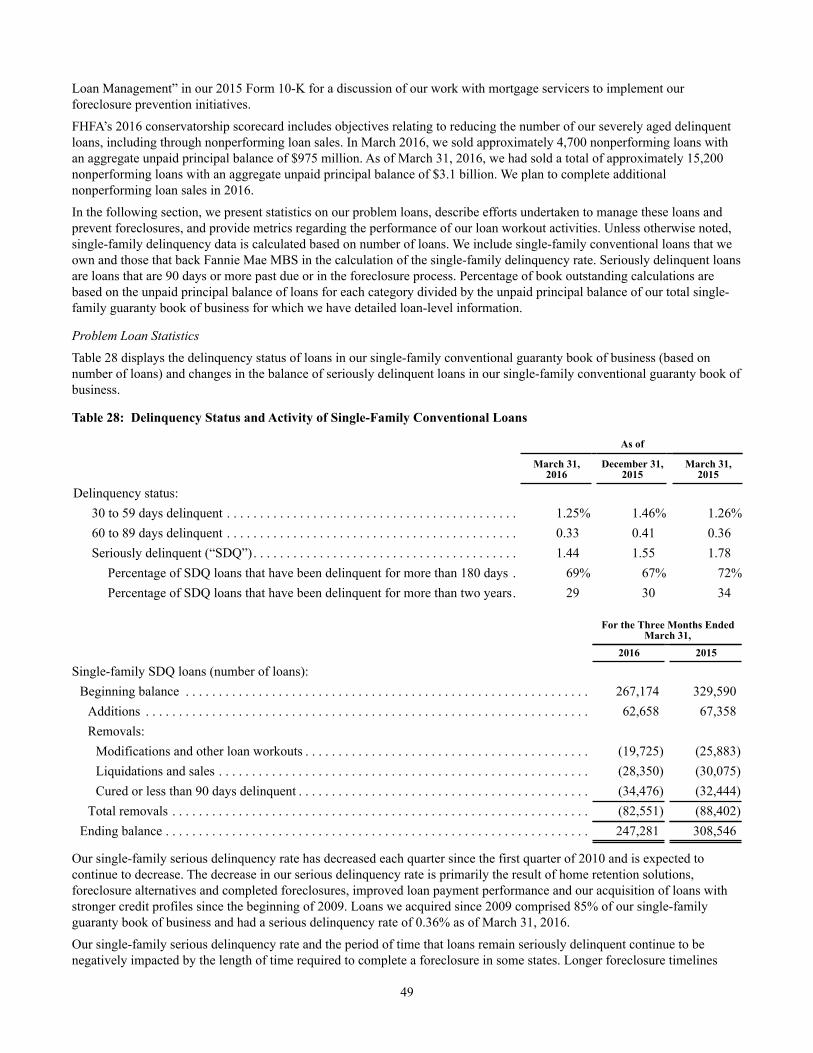
49
Loan Management” in our 2015 Form 10-K for a discussion of our work with mortgage servicers to implement our foreclosure prevention initiatives.
FHFA’s 2016 conservatorship scorecard includes objectives relating to reducing the number of our severely aged delinquent loans, including through nonperforming loan sales. In March 2016, we sold approximately 4,700 nonperforming loans with an aggregate unpaid principal balance of $975 million. As of March 31, 2016, we had sold a total of approximately 15,200 nonperforming loans with an aggregate unpaid principal balance of $3.1 billion. We plan to complete additional nonperforming loan sales in 2016.
In the following section, we present statistics on our problem loans, describe efforts undertaken to manage these loans and prevent foreclosures, and provide metrics regarding the performance of our loan workout activities. Unless otherwise noted, single-family delinquency data is calculated based on number of loans. We include single-family conventional loans that we own and those that back Fannie Mae MBS in the calculation of the single-family delinquency rate. Seriously delinquent loans are loans that are 90 days or more past due or in the foreclosure process. Percentage of book outstanding calculations are based on the unpaid principal balance of loans for each category divided by the unpaid principal balance of our total single-family guaranty book of business for which we have detailed loan-level information.
Problem Loan StatisticsTable 28 displays the delinquency status of loans in our single-family conventional guaranty book of business (based on number of loans) and changes in the balance of seriously delinquent loans in our single-family conventional guaranty book of business.
Table 28: Delinquency Status and Activity of Single-Family Conventional Loans
As of
March 31,2016
December 31,2015
March 31,2015
Delinquency status:30 to 59 days delinquent . . . . . . . . . . . . . . . . . . . . . . . . . . . . . . . . . . . . . . . . . . . . 1.25% 1.46% 1.26%60 to 89 days delinquent . . . . . . . . . . . . . . . . . . . . . . . . . . . . . . . . . . . . . . . . . . . . 0.33 0.41 0.36Seriously delinquent (“SDQ”). . . . . . . . . . . . . . . . . . . . . . . . . . . . . . . . . . . . . . . . 1.44 1.55 1.78
Percentage of SDQ loans that have been delinquent for more than 180 days . 69% 67% 72%Percentage of SDQ loans that have been delinquent for more than two years. 29 30 34
For the Three Months EndedMarch 31,
2016 2015
Single-family SDQ loans (number of loans):Beginning balance . . . . . . . . . . . . . . . . . . . . . . . . . . . . . . . . . . . . . . . . . . . . . . . . . . . . . . . . . . . . . 267,174 329,590
Additions . . . . . . . . . . . . . . . . . . . . . . . . . . . . . . . . . . . . . . . . . . . . . . . . . . . . . . . . . . . . . . . . . . . 62,658 67,358Removals:
Modifications and other loan workouts . . . . . . . . . . . . . . . . . . . . . . . . . . . . . . . . . . . . . . . . . . . (19,725) (25,883)Liquidations and sales . . . . . . . . . . . . . . . . . . . . . . . . . . . . . . . . . . . . . . . . . . . . . . . . . . . . . . . . (28,350) (30,075)Cured or less than 90 days delinquent . . . . . . . . . . . . . . . . . . . . . . . . . . . . . . . . . . . . . . . . . . . . (34,476) (32,444)
Total removals . . . . . . . . . . . . . . . . . . . . . . . . . . . . . . . . . . . . . . . . . . . . . . . . . . . . . . . . . . . . . . . (82,551) (88,402)Ending balance . . . . . . . . . . . . . . . . . . . . . . . . . . . . . . . . . . . . . . . . . . . . . . . . . . . . . . . . . . . . . . . . 247,281 308,546
Our single-family serious delinquency rate has decreased each quarter since the first quarter of 2010 and is expected to continue to decrease. The decrease in our serious delinquency rate is primarily the result of home retention solutions, foreclosure alternatives and completed foreclosures, improved loan payment performance and our acquisition of loans with stronger credit profiles since the beginning of 2009. Loans we acquired since 2009 comprised 85% of our single-family guaranty book of business and had a serious delinquency rate of 0.36% as of March 31, 2016.
Our single-family serious delinquency rate and the period of time that loans remain seriously delinquent continue to be negatively impacted by the length of time required to complete a foreclosure in some states. Longer foreclosure timelines
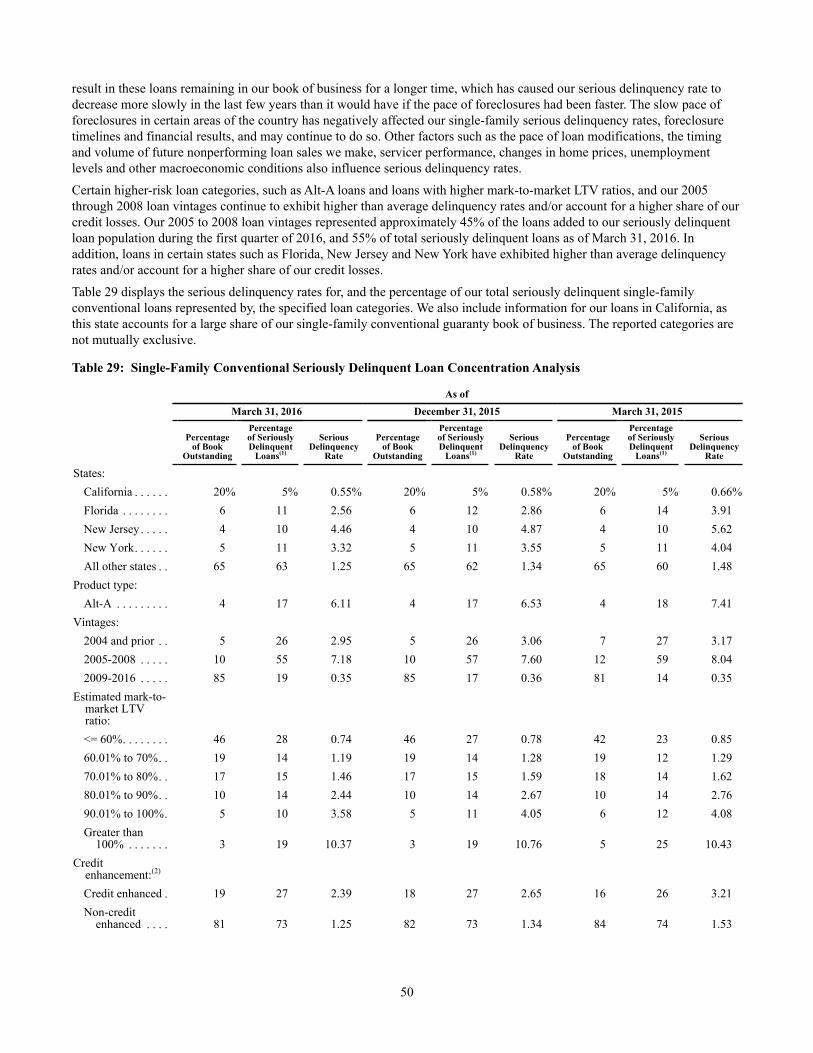
50
result in these loans remaining in our book of business for a longer time, which has caused our serious delinquency rate to decrease more slowly in the last few years than it would have if the pace of foreclosures had been faster. The slow pace of foreclosures in certain areas of the country has negatively affected our single-family serious delinquency rates, foreclosure timelines and financial results, and may continue to do so. Other factors such as the pace of loan modifications, the timing and volume of future nonperforming loan sales we make, servicer performance, changes in home prices, unemployment levels and other macroeconomic conditions also influence serious delinquency rates.
Certain higher-risk loan categories, such as Alt-A loans and loans with higher mark-to-market LTV ratios, and our 2005 through 2008 loan vintages continue to exhibit higher than average delinquency rates and/or account for a higher share of our credit losses. Our 2005 to 2008 loan vintages represented approximately 45% of the loans added to our seriously delinquent loan population during the first quarter of 2016, and 55% of total seriously delinquent loans as of March 31, 2016. In addition, loans in certain states such as Florida, New Jersey and New York have exhibited higher than average delinquency rates and/or account for a higher share of our credit losses.
Table 29 displays the serious delinquency rates for, and the percentage of our total seriously delinquent single-family conventional loans represented by, the specified loan categories. We also include information for our loans in California, as this state accounts for a large share of our single-family conventional guaranty book of business. The reported categories are not mutually exclusive.
Table 29: Single-Family Conventional Seriously Delinquent Loan Concentration Analysis
As ofMarch 31, 2016 December 31, 2015 March 31, 2015
Percentageof Book
Outstanding
Percentage of Seriously Delinquent
Loans(1)
SeriousDelinquency
Rate
Percentageof Book
Outstanding
Percentage of Seriously Delinquent
Loans(1)
SeriousDelinquency
Rate
Percentageof Book
Outstanding
Percentage of Seriously Delinquent
Loans(1)
SeriousDelinquency
Rate
States:California . . . . . . 20% 5% 0.55% 20% 5% 0.58% 20% 5% 0.66%Florida . . . . . . . . 6 11 2.56 6 12 2.86 6 14 3.91New Jersey . . . . . 4 10 4.46 4 10 4.87 4 10 5.62New York. . . . . . 5 11 3.32 5 11 3.55 5 11 4.04All other states . . 65 63 1.25 65 62 1.34 65 60 1.48
Product type:Alt-A . . . . . . . . . 4 17 6.11 4 17 6.53 4 18 7.41
Vintages:2004 and prior . . 5 26 2.95 5 26 3.06 7 27 3.172005-2008 . . . . . 10 55 7.18 10 57 7.60 12 59 8.042009-2016 . . . . . 85 19 0.35 85 17 0.36 81 14 0.35
Estimated mark-to-market LTVratio:<= 60%. . . . . . . . 46 28 0.74 46 27 0.78 42 23 0.8560.01% to 70%. . 19 14 1.19 19 14 1.28 19 12 1.2970.01% to 80%. . 17 15 1.46 17 15 1.59 18 14 1.6280.01% to 90%. . 10 14 2.44 10 14 2.67 10 14 2.7690.01% to 100%. 5 10 3.58 5 11 4.05 6 12 4.08Greater than
100% . . . . . . . 3 19 10.37 3 19 10.76 5 25 10.43Credit
enhancement:(2)
Credit enhanced . 19 27 2.39 18 27 2.65 16 26 3.21Non-credit
enhanced . . . . 81 73 1.25 82 73 1.34 84 74 1.53

51
__________(1) Calculated based on the number of single-family loans that were seriously delinquent for each category divided by the total number of
single-family conventional loans that were seriously delinquent.(2) Refers to loans included in an agreement used to reduce credit risk by requiring collateral, letters of credit, mortgage insurance,
corporate guarantees, or other agreements to provide an entity with some assurance that it will be compensated to some degree in the event of a financial loss.
See “Table 11: Credit Loss Concentration Analysis” in “Consolidated Results of Operations—Credit-Related Income—Credit Loss Performance Metrics” for information on concentrations of our single-family credit losses in recent periods based on geography, credit characteristics and loan vintages.
Loan Workout MetricsTable 30 displays statistics on our single-family loan workouts that were completed, by type. These statistics include loan modifications but do not include trial modifications, loans to certain borrowers who have received bankruptcy relief that are classified as TDRs, or repayment or forbearance plans that have been initiated but not completed. As of March 31, 2016, there were approximately 33,200 loans in a trial modification period. For a description of our loan workout types, see “MD&A— Risk Management—Credit Risk Management—Single-Family Mortgage Credit Risk Management—Problem Loan Management—Loan Workout Metrics” in our 2015 Form 10-K.
Table 30: Statistics on Single-Family Loan Workouts
For the Three Months Ended March 31,2016 2015
UnpaidPrincipalBalance
Number ofLoans
UnpaidPrincipalBalance
Number ofLoans
(Dollars in millions)
Home retention solutions:Modifications . . . . . . . . . . . . . . . . . . . . . . . . . . . . . . . . . . . . . . . . . $ 3,451 20,899 $ 4,415 26,700Repayment plans and forbearances completed(1) . . . . . . . . . . . . . . 175 1,296 257 1,868
Total home retention solutions . . . . . . . . . . . . . . . . . . . . . . . . . . . 3,626 22,195 4,672 28,568Foreclosure alternatives:
Short sales . . . . . . . . . . . . . . . . . . . . . . . . . . . . . . . . . . . . . . . . . . . . 611 2,995 758 3,689Deeds-in-lieu of foreclosure . . . . . . . . . . . . . . . . . . . . . . . . . . . . . . 265 1,745 304 1,968
Total foreclosure alternatives . . . . . . . . . . . . . . . . . . . . . . . . . . . . 876 4,740 1,062 5,657Total loan workouts . . . . . . . . . . . . . . . . . . . . . . . . . . . . . . . . . . . . . . . $ 4,502 26,935 $ 5,734 34,225Loan workouts as a percentage of single-family guaranty book of
business . . . . . . . . . . . . . . . . . . . . . . . . . . . . . . . . . . . . . . . . . . . . . . . 0.64 % 0.62 % 0.81 % 0.79 %__________(1) Repayment plans reflect only those plans associated with loans that were 60 days or more delinquent. Forbearances reflect loans that were
90 days or more delinquent.
The volume of home retention solutions completed in the first quarter of 2016 decreased compared with the first quarter of 2015, primarily due to a decline in the number of delinquent loans in the first quarter of 2016, compared with the first quarter of 2015.
We continue to work with our servicers to implement our home retention and foreclosure prevention initiatives. Our approach to workouts continues to focus on the large number of borrowers facing financial hardships. Accordingly, the vast majority of loan modifications we have completed since 2009 have been concentrated on deferring or lowering the borrowers’ monthly mortgage payments to allow borrowers to work through their hardships.
Our loan modifications can include a reduction in the borrower’s interest rate that is fixed for an initial period and may be followed by one or more annual interest rate increases. The majority of these rate reset modifications are performing loans that were modified under HAMP® and have fixed interest rates for an initial five-year period followed by annual interest rate increases, of up to one percent per year, until the mortgage rate reaches the prevailing market rate at the time of modification. The outstanding unpaid principal balance of rate reset modifications in our guaranty book of business was $73.9 billion as of March 31, 2016. During the first quarter of 2016, approximately 17% of these modified loans experienced an interest rate

52
reset to a weighted average interest rate of 3.63%. In anticipation of potential financial hardship related to interest rate increases, we have directed servicers to evaluate rate reset modifications for a re-modification if the loan is at imminent risk of default and the borrower requests a loan modification or if the loan becomes 60 days delinquent within the first 12 months after an interest rate adjustment. Additionally, for borrowers with HAMP modifications we extended “pay for performance” incentives, in the form of principal curtailment, to encourage borrowers to stay current on their mortgages after the initial interest rate reset and to reduce their monthly payments in cases where the borrower chooses to re-amortize their unpaid principal balance following receipt of the incentive. In May 2015, FHFA announced the extension of the ending date for HAMP to December 31, 2016. See “MD&A—Risk Management—Credit Risk Management—Credit Profile Summary—Mortgage Products with Rate Resets” in our 2015 Form 10-K for additional information on the timing of these initial interest rate resets.
As directed by FHFA, in April 2016, we announced a new principal reduction modification program. This program is a targeted effort to assist seriously delinquent borrowers with negative equity in their homes avoid foreclosure and help improve the stability of communities that have not yet recovered from the housing crisis. The program will offer principal reduction to borrowers who meet the specific requirements set forth in the program, including the following: as of March 1, 2016, the borrower is at least 90 days delinquent, has a loan with an unpaid principal balance of $250,000 or less, and is an owner-occupant. In addition, at the time of evaluation, the loan must have a post-modification mark-to-market LTV ratio of more than 115%. The amount of principal reduction we will provide to a borrower who meets the requirements of the program is the lesser of: (1) the amount that would create a post-modification mark-to-market LTV ratio of 115%; or (2) 30% of the gross post-modified unpaid principal balance of the loan. We estimate that approximately 22,000 loans in our single-family guaranty book of business as of March 31, 2016 are eligible for the principal reduction modification program.
REO ManagementForeclosure and REO activity affect the amount of credit losses we realize in a given period. Table 31 displays our foreclosure activity by region. Regional REO acquisition and charge-off trends generally follow a pattern that is similar to, but lags, that of regional delinquency trends.
Table 31: Single-Family Foreclosed Properties
For the Three MonthsEnded March 31,
2016 2015
Single-family foreclosed properties (number of properties):Beginning of period inventory of single-family foreclosed properties (REO)(1). . . . . . . . . . . 57,253 87,063
Acquisitions by geographic area:(2)
Midwest . . . . . . . . . . . . . . . . . . . . . . . . . . . . . . . . . . . . . . . . . . . . . . . . . . . . . . . . . . . . . . . 3,830 5,428Northeast. . . . . . . . . . . . . . . . . . . . . . . . . . . . . . . . . . . . . . . . . . . . . . . . . . . . . . . . . . . . . . . 3,679 4,128Southeast. . . . . . . . . . . . . . . . . . . . . . . . . . . . . . . . . . . . . . . . . . . . . . . . . . . . . . . . . . . . . . . 5,399 10,006Southwest . . . . . . . . . . . . . . . . . . . . . . . . . . . . . . . . . . . . . . . . . . . . . . . . . . . . . . . . . . . . . . 1,983 2,387West . . . . . . . . . . . . . . . . . . . . . . . . . . . . . . . . . . . . . . . . . . . . . . . . . . . . . . . . . . . . . . . . . . 1,476 2,367
Total properties acquired through foreclosure(1) . . . . . . . . . . . . . . . . . . . . . . . . . . . . . . . . . . 16,367 24,316Dispositions of REO . . . . . . . . . . . . . . . . . . . . . . . . . . . . . . . . . . . . . . . . . . . . . . . . . . . . . . . (21,331) (32,060)
End of period inventory of single-family foreclosed properties (REO)(1) . . . . . . . . . . . . . . . . . 52,289 79,319Carrying value of single-family foreclosed properties (dollars in millions) . . . . . . . . . . . . . . . $ 5,963 $ 8,915Single-family foreclosure rate(3) . . . . . . . . . . . . . . . . . . . . . . . . . . . . . . . . . . . . . . . . . . . . . . . . . 0.38 % 0.56 %__________(1) Includes acquisitions through deeds-in-lieu of foreclosure. Also includes held for use properties, which are reported in our condensed
consolidated balance sheets as a component of “Other assets.”(2) See footnote 10 to “Table 27: Risk Characteristics of Single-Family Conventional Business Volume and Guaranty Book of Business”
for states included in each geographic region.(3) Estimated based on the annualized total number of properties acquired through foreclosure or deeds-in-lieu of foreclosure as a
percentage of the total number of loans in our single-family guaranty book of business as of the end of each respective period.
The continued decrease in the number of our seriously delinquent single-family loans has resulted in a reduction in the number of REO acquisitions in the first quarter of 2016 as compared with the first quarter of 2015.
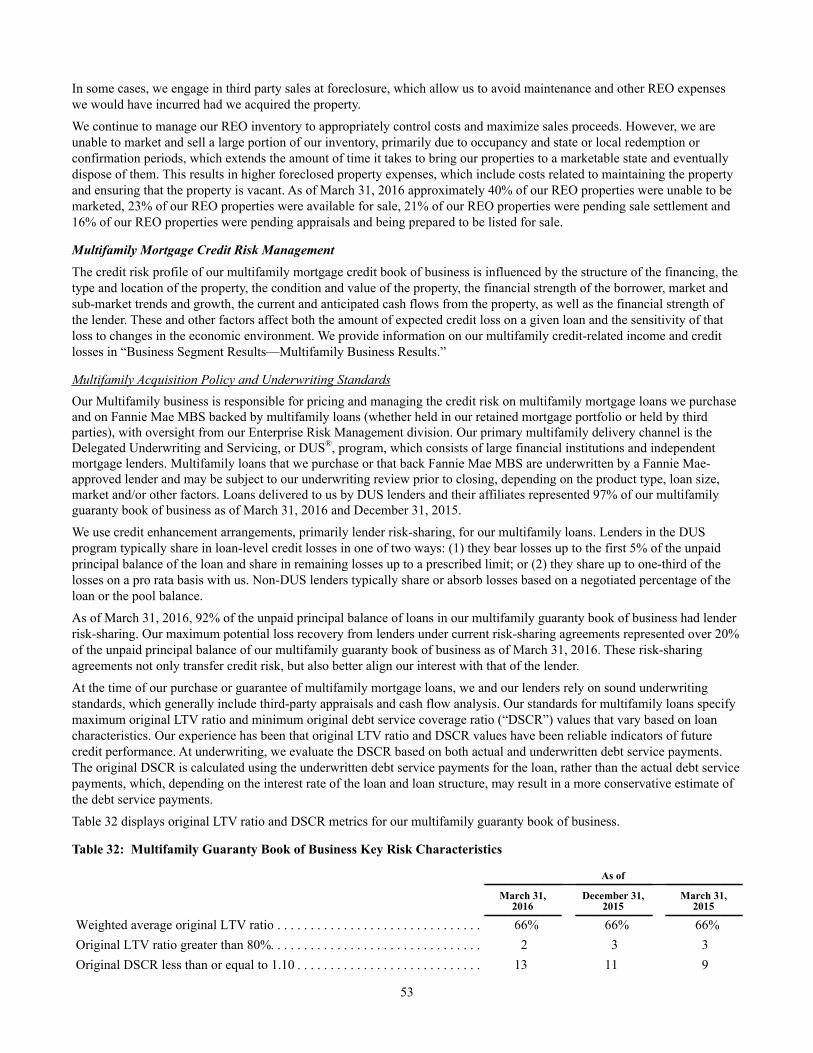
53
In some cases, we engage in third party sales at foreclosure, which allow us to avoid maintenance and other REO expenses we would have incurred had we acquired the property.
We continue to manage our REO inventory to appropriately control costs and maximize sales proceeds. However, we are unable to market and sell a large portion of our inventory, primarily due to occupancy and state or local redemption or confirmation periods, which extends the amount of time it takes to bring our properties to a marketable state and eventually dispose of them. This results in higher foreclosed property expenses, which include costs related to maintaining the property and ensuring that the property is vacant. As of March 31, 2016 approximately 40% of our REO properties were unable to be marketed, 23% of our REO properties were available for sale, 21% of our REO properties were pending sale settlement and 16% of our REO properties were pending appraisals and being prepared to be listed for sale.
Multifamily Mortgage Credit Risk ManagementThe credit risk profile of our multifamily mortgage credit book of business is influenced by the structure of the financing, the type and location of the property, the condition and value of the property, the financial strength of the borrower, market and sub-market trends and growth, the current and anticipated cash flows from the property, as well as the financial strength of the lender. These and other factors affect both the amount of expected credit loss on a given loan and the sensitivity of that loss to changes in the economic environment. We provide information on our multifamily credit-related income and credit losses in “Business Segment Results—Multifamily Business Results.”
Multifamily Acquisition Policy and Underwriting StandardsOur Multifamily business is responsible for pricing and managing the credit risk on multifamily mortgage loans we purchase and on Fannie Mae MBS backed by multifamily loans (whether held in our retained mortgage portfolio or held by third parties), with oversight from our Enterprise Risk Management division. Our primary multifamily delivery channel is the Delegated Underwriting and Servicing, or DUS®, program, which consists of large financial institutions and independent mortgage lenders. Multifamily loans that we purchase or that back Fannie Mae MBS are underwritten by a Fannie Mae-approved lender and may be subject to our underwriting review prior to closing, depending on the product type, loan size, market and/or other factors. Loans delivered to us by DUS lenders and their affiliates represented 97% of our multifamily guaranty book of business as of March 31, 2016 and December 31, 2015.
We use credit enhancement arrangements, primarily lender risk-sharing, for our multifamily loans. Lenders in the DUS program typically share in loan-level credit losses in one of two ways: (1) they bear losses up to the first 5% of the unpaid principal balance of the loan and share in remaining losses up to a prescribed limit; or (2) they share up to one-third of the losses on a pro rata basis with us. Non-DUS lenders typically share or absorb losses based on a negotiated percentage of the loan or the pool balance.
As of March 31, 2016, 92% of the unpaid principal balance of loans in our multifamily guaranty book of business had lender risk-sharing. Our maximum potential loss recovery from lenders under current risk-sharing agreements represented over 20% of the unpaid principal balance of our multifamily guaranty book of business as of March 31, 2016. These risk-sharing agreements not only transfer credit risk, but also better align our interest with that of the lender.
At the time of our purchase or guarantee of multifamily mortgage loans, we and our lenders rely on sound underwriting standards, which generally include third-party appraisals and cash flow analysis. Our standards for multifamily loans specify maximum original LTV ratio and minimum original debt service coverage ratio (“DSCR”) values that vary based on loan characteristics. Our experience has been that original LTV ratio and DSCR values have been reliable indicators of future credit performance. At underwriting, we evaluate the DSCR based on both actual and underwritten debt service payments. The original DSCR is calculated using the underwritten debt service payments for the loan, rather than the actual debt service payments, which, depending on the interest rate of the loan and loan structure, may result in a more conservative estimate of the debt service payments.
Table 32 displays original LTV ratio and DSCR metrics for our multifamily guaranty book of business.
Table 32: Multifamily Guaranty Book of Business Key Risk Characteristics
As of
March 31,2016
December 31,2015
March 31,2015
Weighted average original LTV ratio . . . . . . . . . . . . . . . . . . . . . . . . . . . . . . . 66% 66% 66%Original LTV ratio greater than 80%. . . . . . . . . . . . . . . . . . . . . . . . . . . . . . . . 2 3 3Original DSCR less than or equal to 1.10 . . . . . . . . . . . . . . . . . . . . . . . . . . . . 13 11 9

54
The percentage of our book of business with an original DSCR less than or equal to 1.10 has increased to 13% as of March 31, 2016, driven by an increase in business volume funded with adjustable-rate mortgages and with fixed-rate mortgages with different loan structures and actual interest rates below the interest rate at which we underwrite those loans.
Multifamily Portfolio Diversification and MonitoringDiversification within our multifamily mortgage credit book of business by geographic concentration, term to maturity, interest rate structure, borrower concentration and loan size, as well as credit enhancement coverage, are important factors that influence credit performance and help reduce our credit risk.
We and our lenders monitor the performance and risk characteristics of our multifamily loans and the underlying properties on an ongoing basis throughout the loan term at the asset and portfolio level. We closely monitor loans with an estimated current DSCR below 1.0, as that is an indicator of heightened default risk. The percentage of loans in our multifamily guaranty book of business, calculated based on unpaid principal balance, with a current DSCR less than 1.0 was approximately 2% as of March 31, 2016 and December 31, 2015. Our estimates of current DSCRs are based on the latest available income information for these properties. Although we use the most recently available results from our multifamily borrowers, there is a lag in reporting, which typically can range from 3 to 6 months but in some cases may be longer.
Multifamily Problem Loan Management and Foreclosure PreventionWe periodically refine our underwriting standards in response to market conditions and implement proactive portfolio management and monitoring which are each designed to keep credit losses and delinquencies to a low level relative to our multifamily guaranty book of business. The multifamily serious delinquency rate was 0.06% as of March 31, 2016 and 0.07% as of December 31, 2015. We classify multifamily loans as seriously delinquent when payment is 60 days or more past due.
REO ManagementThe number of multifamily foreclosed properties held for sale increased from 12 properties with a carrying value of $91 million as of December 31, 2015 to 19 properties with a carrying value of $114 million as of March 31, 2016.
Institutional Counterparty Credit Risk Management Institutional counterparty credit risk is the risk that our institutional counterparties may fail to fulfill their contractual obligations to us. Defaults by a counterparty with significant obligations to us could result in significant financial losses to us.
See “MD&A—Risk Management—Credit Risk Management—Institutional Counterparty Credit Risk Management” and “Risk Factors” in our 2015 Form 10-K for additional information about institutional counterparty risk, including counterparty risk we face from mortgage originators, investors and dealers, from debt security dealers, from document custodians and from mortgage fraud.
Mortgage Sellers and ServicersOne of our primary exposures to institutional counterparty risk is with mortgage servicers that service the loans we hold in our retained mortgage portfolio or that back our Fannie Mae MBS, as well as mortgage sellers and servicers that are obligated to repurchase loans from us or reimburse us for losses in certain circumstances. We rely on mortgage servicers to meet our servicing standards and fulfill their servicing obligations. We also rely on mortgage sellers and servicers to fulfill their repurchase obligations. Our five largest single-family mortgage servicers, including their affiliates, serviced approximately 43% of our single-family guaranty book of business as of March 31, 2016, compared with approximately 44% as of December 31, 2015. Our largest mortgage servicer is Wells Fargo Bank, N.A., which, together with its affiliates, serviced approximately 17% of our single-family guaranty book of business as of March 31, 2016 and December 31, 2015. As of March 31, 2016 and December 31, 2015, one additional mortgage servicer, JPMorgan Chase Bank, N.A., with its affiliates, serviced over 10% of our single-family guaranty book of business.Our ten largest multifamily mortgage servicers, including their affiliates, serviced approximately 71% of our multifamily guaranty book of business as of March 31, 2016, compared with approximately 70% as of December 31, 2015. Wells Fargo Bank, N.A. and Walker & Dunlop, LLC each serviced over 10% of our multifamily guaranty book of business as of March 31, 2016 and December 31, 2015. A large portion of our single-family guaranty book is serviced by non-depository servicers. As of March 31, 2016, 19% of our total single-family guaranty book of business, including 61% of our delinquent single-family loans, was serviced by our five largest non-depository servicers, compared with 19% of our total single-family guaranty book of business, including 60% of our delinquent single-family loans, as of December 31, 2015. Compared with depository financial institutions, non-
55
depository servicers pose additional risks to us because non-depository servicers may have a greater reliance on third-party sources of liquidity and may, in the event of significant increases in delinquent loan volumes, have less financial capacity to advance funds on our behalf or satisfy repurchase requests or compensatory fee obligations. In addition, regulatory bodies have been reviewing the activities of some of our largest non-depository servicers. See “Risk Factors” in our 2015 Form 10-K for a discussion of the risks of our reliance on servicers.
Our five largest single-family mortgage sellers, including their affiliates, accounted for approximately 29% of our single-family business acquisition volume in the first quarter of 2016, compared with approximately 32% in the first quarter of 2015. Our largest mortgage seller is Wells Fargo Bank, N.A., which, together with its affiliates, accounted for approximately 12% of our single-family business acquisition volume in the first quarter of 2016, compared with approximately 13% in the first quarter of 2015. We acquire a portion of our business volume directly from non-depository and smaller depository financial institutions that may not have the same financial strength or operational capacity as our largest mortgage seller counterparties. We could be required to absorb losses on defaulted loans that a failed mortgage seller is obligated to repurchase from us if we determine there was an underwriting eligibility breach.
Repurchase RequestsMortgage sellers and servicers may not meet the terms of their repurchase obligations, and we may be unable to recover on all outstanding loan repurchase obligations resulting from their breaches of contractual obligations, which may have an adverse effect on our results of operations and financial condition. See “Single-Family Mortgage Credit Risk Management—Single-Family Acquisition and Servicing Policies and Underwriting and Servicing Standards” for additional information regarding repurchase requests and the balance of our outstanding repurchase requests as of March 31, 2016.
Credit GuarantorsWe use various types of credit guarantors to manage our mortgage credit risk, including mortgage insurers, financial guarantors, reinsurers and multifamily lenders with risk sharing.
Mortgage InsurersWe are generally required, pursuant to our charter, to obtain credit enhancements on single-family conventional mortgage loans that we purchase or securitize with LTV ratios over 80% at the time of purchase. We use several types of credit enhancements to manage our single-family mortgage credit risk, including primary and pool mortgage insurance coverage. Table 33 displays our risk in force for mortgage insurance coverage on single-family loans in our guaranty book of business and our insurance in force for our mortgage insurer counterparties, excluding insurance coverage provided by federal government entities. The table includes our top ten mortgage insurer counterparties, which provided over 99% of our total mortgage insurance coverage on single-family loans in our guaranty book of business as of March 31, 2016 and December 31, 2015. In addition, for our mortgage insurer counterparties not approved to write new business, we have provided the percentage of their claims payments the counterparties are currently deferring based on the direction of their state regulators, referred to as their deferred payment obligation. As of March 31, 2016 and December 31, 2015, approximately 1% of our total risk in force mortgage insurance coverage and approximately 2% of our total insurance in force mortgage insurance coverage was pool insurance.

56
Table 33: Mortgage Insurance Coverage
Risk in Force(1) Insurance in Force(2)
As of As of DeferredMarch 31, December 31, March 31, December 31, Payment
2016 2015 2016 2015 Obligation %(3)
(Dollars in millions)Counterparty:(4)
Approved:(5)
United Guaranty Residential Insurance Co. . . . . . . . . . . . $ 27,547 $ 27,396 $ 106,063 $ 105,627Radian Guaranty, Inc. . . . . . . . . . . . . . . . . . . . . . . . . . . . . 25,198 25,191 98,108 98,274Mortgage Guaranty Insurance Corp.. . . . . . . . . . . . . . . . . 24,017 23,850 92,618 92,026Genworth Mortgage Insurance Corp. . . . . . . . . . . . . . . . . 17,010 16,700 66,853 65,735Essent Guaranty, Inc. . . . . . . . . . . . . . . . . . . . . . . . . . . . . 9,173 8,787 37,110 35,673Arch Mortgage Insurance Co.. . . . . . . . . . . . . . . . . . . . . . 3,863 3,697 15,458 14,822National Mortgage Insurance Corp. . . . . . . . . . . . . . . . . . 2,535 1,989 14,140 11,997Others . . . . . . . . . . . . . . . . . . . . . . . . . . . . . . . . . . . . . . . . 243 233 1,473 1,409
Total approved . . . . . . . . . . . . . . . . . . . . . . . . . . . . . . . . 109,586 107,843 431,823 425,563Not approved:(5)
PMI Mortgage Insurance Co.(6). . . . . . . . . . . . . . . . . . . . . 4,578 4,805 18,299 19,212 30%Republic Mortgage Insurance Co.(6) . . . . . . . . . . . . . . . . . 3,740 3,921 14,700 15,450 —Triad Guaranty Insurance Corp.(6). . . . . . . . . . . . . . . . . . . 1,293 1,348 4,662 4,864 25%Others . . . . . . . . . . . . . . . . . . . . . . . . . . . . . . . . . . . . . . . . 14 14 42 44
Total not approved . . . . . . . . . . . . . . . . . . . . . . . . . . . . . 9,625 10,088 37,703 39,570Total . . . . . . . . . . . . . . . . . . . . . . . . . . . . . . . . . . . . . . . . . . . $ 119,211 $ 117,931 $ 469,526 $ 465,133
Total as a percentage of single-family guaranty book ofbusiness . . . . . . . . . . . . . . . . . . . . . . . . . . . . . . . . . . . . . . 4 % 4 % 17 % 16 %
__________(1) Risk in force is generally the maximum potential loss recovery under the applicable mortgage insurance policies in force and is
based on the loan level insurance coverage percentage and, if applicable, any aggregate pool loss limit, as specified in the policy. (2) Insurance in force represents the unpaid principal balance of single-family loans in our guaranty book of business covered under the
applicable mortgage insurance policies.(3) Deferred payment obligation represents the percentage of cash payments on policyholder claims being deferred as directed by the
insurer’s respective regulator in the state of domicile as of March 31, 2016.(4) Insurance coverage amounts provided for each counterparty may include coverage provided by consolidated affiliates and subsidiaries
of the counterparty.(5) “Approved” mortgage insurers are counterparties approved to write new insurance with us. “Not approved” mortgage insurers are
counterparties that are no longer approved to write new insurance with us.(6) These mortgage insurers are under various forms of supervised control by their state regulators and are in run-off.
We manage our exposure to mortgage insurers by maintaining eligibility requirements that an insurer must meet to be a qualified mortgage insurer. We require a certification and supporting documentation annually from each mortgage insurer and perform periodic reviews of mortgage insurers to confirm compliance with eligibility requirements and to evaluate their management, control and underwriting practices. Our monitoring of the mortgage insurers includes in-depth financial reviews and analyses of the insurers’ portfolios and capital adequacy under hypothetical stress scenarios.
Although the financial condition of our primary mortgage insurer counterparties currently approved to write new business has improved in recent years, there is still a risk that these counterparties may fail to fulfill their obligations to pay our claims under insurance policies. In addition, as shown in “Table 33: Mortgage Insurance Coverage,” three of our top mortgage insurer counterparties—PMI Mortgage Insurance Co., Republic Mortgage Insurance Company and Triad Guaranty Insurance Corporation—are currently under various forms of supervised control by their state regulators and are in run-off, which increases the risk that these counterparties will pay claims only in part or fail to pay claims at all under existing insurance policies. See “Risk Factors” in our 2015 Form 10-K for a discussion of the risks to our business of claims under our mortgage insurance policies not being paid in full or at all, including the risks associated with our three mortgage insurance counterparties that are in run off.

57
When we estimate the credit losses that are inherent in our mortgage loans and under the terms of our guaranty obligations we also consider the recoveries that we will receive on primary mortgage insurance, as mortgage insurance recoveries would reduce the severity of the loss associated with defaulted loans. We evaluate the financial condition of our mortgage insurer counterparties and adjust the contractually due recovery amounts to ensure that only probable losses as of the balance sheet date are included in our loss reserve estimate. As a result, if our assessment of one or more of our mortgage insurer counterparties’ ability to fulfill their respective obligations to us worsens, it could result in an increase in our loss reserves. The amount by which our estimated benefit from mortgage insurance reduced our total loss reserves was $1.9 billion as of March 31, 2016 and $2.3 billion as of December 31, 2015.
When an insured loan held in our retained mortgage portfolio subsequently goes into foreclosure, we charge off the loan, eliminating any previously-recorded loss reserves, and record REO and a mortgage insurance receivable for the claim proceeds deemed probable of recovery, as appropriate. However, if a mortgage insurer rescinds, cancels or denies insurance coverage, the initial receivable becomes due from the mortgage seller or servicer. We had outstanding receivables of $1.1 billion recorded in “Other assets” in our condensed consolidated balance sheets as of March 31, 2016 and $1.2 billion as of December 31, 2015 related to amounts claimed on insured, defaulted loans excluding government insured loans. Of this amount, $197 million as of March 31, 2016 and $241 million as of December 31, 2015 was due from our mortgage sellers or servicers. We assessed the total outstanding receivables for collectibility, and they are recorded net of a valuation allowance of $742 million as of March 31, 2016 and $770 million as of December 31, 2015. The valuation allowance reduces our claim receivable to the amount considered probable of collection as of March 31, 2016 and December 31, 2015.
Financial GuarantorsWe are the beneficiary of non-governmental financial guarantees on non-agency securities held in our retained mortgage portfolio and on non-agency securities that have been resecuritized to include a Fannie Mae guaranty and sold to third parties. The total unpaid principal balance of guaranteed non-agency securities in our retained mortgage portfolio was $2.9 billion as of March 31, 2016 and $3.2 billion as of December 31, 2015. See “Note 15, Concentrations of Credit Risk” in our 2015 Form 10-K for a further discussion of our exposure to financial guarantors.
We are also the beneficiary of financial guarantees included in securities issued by Freddie Mac, the federal government and its agencies that totaled $15.4 billion as of March 31, 2016 and $16.7 billion as of December 31, 2015.
Credit Insurance Risk Transfer CounterpartiesIn a credit insurance risk transfer transaction, we shift a portion of the credit risk on a reference pool of single-family mortgage loans to a panel of credit insurers or reinsurers. A portion of the credit insurers’ or reinsurers’ obligations are collateralized with highly-rated liquid assets held in a trust account. Our credit insurance risk transfer transactions are described in “Single-Family Mortgage Credit Risk Management—Transfer of Mortgage Credit Risk—Credit Risk-Sharing Transactions.”
Multifamily Lenders with Risk SharingWe enter into risk sharing agreements with lenders pursuant to which the lenders agree to bear all or some portion of the credit losses on the covered loans. Our maximum potential loss recovery from lenders under risk sharing agreements on DUS and non-DUS multifamily loans was $48.3 billion as of March 31, 2016, compared with $46.2 billion as of December 31, 2015. As of March 31, 2016, 42% of our maximum potential loss recovery on multifamily loans was from four DUS lenders, compared with 40% as of December 31, 2015.
As noted above in “Multifamily Mortgage Credit Risk Management—Multifamily Acquisition Policy and Underwriting Standards,” our primary multifamily delivery channel is our DUS program, which is comprised of lenders that range from large depositories to independent non-bank financial institutions. As of March 31, 2016, approximately 36% of the unpaid principal balance of loans in our multifamily guaranty book of business serviced by our DUS lenders was from institutions with an external investment grade credit rating or a guaranty from an affiliate with an external investment grade credit rating, compared with approximately 35% as of December 31, 2015. Given the recourse nature of the DUS program, the lenders are bound by eligibility standards that dictate, among other items, minimum capital and liquidity levels, and the posting of collateral at a highly rated custodian to secure a portion of the lenders’ future obligations. We actively monitor the financial condition of these lenders to help ensure the level of risk remains within our standards and to ensure required capital levels are maintained and are in alignment with actual and modeled loss projections.
58
Custodial Depository InstitutionsWe evaluate our custodial depository institutions to determine whether they are eligible to hold deposits on our behalf based on requirements specified in our Servicing Guide. If a custodial depository institution were to fail while holding remittances of borrower payments of principal and interest due to us in our custodial account, we would be an unsecured creditor of the depository for balances in excess of the deposit insurance protection and might not be able to recover all of the principal and interest payments being held by the depository on our behalf, or there might be a substantial delay in receiving these amounts. If this were to occur, we would be required to replace these amounts with our own funds to make payments that are due to Fannie Mae MBS certificateholders. Accordingly, the insolvency of one of our principal custodial depository counterparties could result in significant financial losses to us. During the month of March 2016, approximately $1.8 billion, or 6%, of our total deposits for single-family payments and approximately $1.2 billion, or 60%, of our total deposits for multifamily payments received and held by these institutions was in excess of the deposit insurance protection limit. During the month of December 2015, approximately $2.0 billion, or 6%, of our single-family payment deposits and $1.3 billion, or 39%, of our multifamily payment deposits were in excess of this limit. These amounts can vary as they are calculated based on individual payments of mortgage borrowers, which requires us to estimate which borrowers are paying their regular principal and interest payments and other types of payments, such as prepayments from refinancing or sales.
A total of $30.6 billion in deposits for single-family payments were received and held by 263 institutions during the month of March 2016 and a total of $31.5 billion in deposits for single-family payments were received and held by 263 institutions during the month of December 2015. Of these total deposits, 92% as of March 31, 2016 and December 31, 2015, were held by institutions rated as investment grade by S&P, Moody’s and Fitch. Our transactions with custodial depository institutions are concentrated. Our six largest custodial depository institutions held 81% of these deposits as of March 31, 2016, compared with 83% as of December 31, 2015.
During the month of March 2016, a total of $2.0 billion in deposits for multifamily payments were received and held by 28 institutions, and $3.4 billion in deposits for multifamily payments were received and held by 28 institutions during the month of December 2015. Of these total deposits, 97% as of March 31, 2016, compared with 98% as of December 31, 2015, were held by institutions rated as investment grade by S&P, Moody’s and Fitch. Our transactions with custodial depository institutions are concentrated. Our six largest custodial depository institutions held 91% of these deposits as of March 31, 2016, compared with 95% as of December 31, 2015.
Counterparty Credit Exposure of Investments Held in our Cash and Other Investments PortfolioOur cash and other investments portfolio consists of cash and cash equivalents, securities purchased under agreements to resell or similar arrangements and U.S. Treasury securities. Our cash and other investment counterparties are primarily financial institutions and the Federal Reserve Bank. As of March 31, 2016 and December 31, 2015, we held $2.0 billion in short-term unsecured deposits with two financial institutions that had a short-term credit rating of A-1 from S&P (or its equivalent), based on the lowest credit rating issued by S&P, Moody’s and Fitch, and no other unsecured positions other than U.S. Treasury securities. See “Liquidity and Capital Management—Liquidity Management—Cash and Other Investments Portfolio” for more detailed information on our cash and other investments portfolio.
Derivative Counterparty Credit ExposureOur derivative counterparty credit exposure relates principally to interest rate derivative contracts. We are exposed to the risk that a counterparty in a derivative transaction will default on payments due to us, which may require us to seek a replacement derivative from a different counterparty. This replacement may be at a higher cost, or we may be unable to find a suitable replacement. Historically, our risk management derivative transactions have been made pursuant to bilateral contracts with a specific counterparty governed by the terms of an International Swaps and Derivatives Association Inc. master agreement. Pursuant to regulations implementing the Dodd-Frank Act, we are required to submit certain categories of new interest rate swaps to a derivatives clearing organization. We refer to our derivative transactions made pursuant to bilateral contracts as our over-the-counter (“OTC”) derivative transactions and our derivative transactions accepted for clearing by a derivatives clearing organization as our cleared derivative transactions.
We manage our derivative counterparty credit exposure relating to our OTC derivative transactions through enforceable master netting arrangements. These arrangements allow us to net derivative assets and liabilities with the same counterparty. We also manage our derivative counterparty exposure relating to our OTC derivative transactions by requiring counterparties to post collateral, which includes cash, U.S. Treasury securities, agency debt and agency mortgage-related securities.
Our cleared derivative transactions are submitted to a derivatives clearing organization on our behalf through a clearing member of the organization. A contract accepted by a derivatives clearing organization is governed by the terms of the clearing organization’s rules and arrangements between us and the clearing member of the clearing organization. As a result,

59
we are exposed to the institutional credit risk of both the derivatives clearing organization and the member who is acting on our behalf. We manage our credit exposure relating to our cleared derivative transactions through enforceable master netting arrangements. These arrangements allow us to net our exposure to cleared derivatives by clearing organization and by clearing member.
Our institutional credit risk exposure to derivatives clearing organizations and certain of their members will continue to increase in the future as cleared derivative contracts comprise a larger percentage of our derivative instruments. We estimate our exposure to credit loss on derivative instruments by calculating the replacement cost, on a present value basis, to settle at current market prices all outstanding derivative contracts in a net gain position at the counterparty level where the right of legal offset exists.
The fair value of derivatives in a gain position is included in our condensed consolidated balance sheets in “Other assets.” Total exposure represents our exposure to credit loss on derivative instruments less the cash and non-cash collateral posted by our counterparties to us. This does not include collateral held in excess of exposure. Our total exposure was $34 million as of March 31, 2016 and $31 million as of December 31, 2015. The majority of our total exposure as of each date consisted of mortgage insurance contracts accounted for as derivatives.
As of March 31, 2016 and December 31, 2015, we had sixteen counterparties with which we may transact OTC derivative transactions, all of which were subject to enforceable master netting arrangements. We had outstanding notional amounts with all of these counterparties, and the highest concentration by our total outstanding notional amount was approximately 7% as of March 31, 2016 and December 31, 2015.
See “Note 9, Derivative Instruments” and “Note 14, Netting Arrangements” for additional information on our derivative contracts as of March 31, 2016 and December 31, 2015.
Market Risk Management, Including Interest Rate Risk ManagementWe are subject to market risk, which includes interest rate risk, spread risk and liquidity risk. These risks arise from our mortgage asset investments. Interest rate risk is the risk of loss in value or expected future earnings that may result from changes to interest rates. Spread risk or basis risk is the resulting impact of changes in the spread between our mortgage assets and our debt and derivatives we use to hedge our position. Liquidity risk is the risk that we will not be able to meet our funding obligations in a timely manner. We describe our sources of interest rate risk exposure, business risks posed by changes in interest rates, and our strategy for managing interest rate risk and spread risk in “MD&A—Risk Management—Market Risk Management, Including Interest Rate Risk Management” and in “Risk Factors” in both our 2015 Form 10-K and this report.
Measurement of Interest Rate RiskBelow we present two quantitative metrics that provide estimates of our interest rate risk exposure: (1) fair value sensitivity of our net portfolio to changes in interest rate levels and slope of yield curve; and (2) duration gap. Our net portfolio consists of our retained mortgage portfolio assets; cash and other investments portfolio assets; our outstanding debt of Fannie Mae that is used to fund our retained mortgage portfolio assets and cash and other investments portfolio assets; mortgage commitments; and risk management derivatives. Risk management derivatives along with our debt instruments are used to manage interest rate risk.
The metrics presented are calculated using internal models that require standard assumptions regarding interest rates and future prepayments of principal over the remaining life of our securities. These assumptions are derived based on the characteristics of the underlying structure of the securities and historical prepayment rates experienced at specified interest rate levels, taking into account current market conditions, the current mortgage rates of our existing outstanding loans, loan age and other factors. On a continuous basis, management makes judgments about the appropriateness of the risk assessments and will make adjustments as necessary to properly assess our interest rate exposure and manage our interest rate risk. The methodologies used to calculate risk estimates are periodically changed on a prospective basis to reflect improvements in the underlying estimation process.
Interest Rate Sensitivity to Changes in Interest Rate Level and Slope of Yield CurvePursuant to a disclosure commitment with FHFA, we disclose on a monthly basis the estimated adverse impact on the fair value of our net portfolio that would result from the following hypothetical situations:
• A 50 basis point shift in interest rates.
• A 25 basis point change in the slope of the yield curve.
60
In measuring the estimated impact of changes in the level of interest rates, we assume a parallel shift in all maturities of the U.S. LIBOR interest rate swap curve.
In measuring the estimated impact of changes in the slope of the yield curve, we assume a constant 7-year rate and a shift of 16.7 basis points for the 1-year rate and 8.3 basis points for the 30-year rate. We believe the aforementioned interest rate shocks for our monthly disclosures represent moderate movements in interest rates over a one-month period.
Duration GapDuration gap measures the price sensitivity of our assets and liabilities in our net portfolio to changes in interest rates by quantifying the difference between the estimated durations of our assets and liabilities. Our duration gap analysis reflects the extent to which the estimated maturity and repricing cash flows for our assets are matched, on average, over time and across interest rate scenarios to those of our liabilities. A positive duration gap indicates that the duration of our assets exceeds the duration of our liabilities. We disclose duration gap on a monthly basis under the caption “Interest Rate Risk Disclosures” in our Monthly Summary, which is available on our website and announced in a press release.
While our goal is to reduce the price sensitivity of our net portfolio to movements in interest rates, various factors can contribute to a duration gap that is either positive or negative. For example, changes in the market environment can increase or decrease the price sensitivity of our mortgage assets relative to the price sensitivity of our liabilities because of prepayment uncertainty associated with our assets. In a declining interest rate environment, prepayment rates tend to accelerate, thereby shortening the duration and average life of the fixed rate mortgage assets we hold in our net portfolio. Conversely, when interest rates increase, prepayment rates generally slow, which extends the duration and average life of our mortgage assets. Our debt and derivative instrument positions are used to manage the interest rate sensitivity of our retained mortgage portfolio and our investments in non-mortgage securities. As a result, the degree to which the interest rate sensitivity of our retained mortgage portfolio and our investments in non-mortgage securities is offset will be dependent upon, among other factors, the mix of funding and other risk management derivative instruments we use at any given point in time.
The market value sensitivities of our net portfolio are a function of both the duration and the convexity of our net portfolio. Duration provides a measure of the price sensitivity of a financial instrument to changes in interest rates while convexity reflects the degree to which the duration of the assets and liabilities in our net portfolio changes in response to a given change in interest rates. We use convexity measures to provide us with information about how quickly and by how much our net portfolio’s duration may change in different interest rate environments. The market value sensitivity of our net portfolio will depend on a number of factors, including the interest rate environment, modeling assumptions and the composition of assets and liabilities in our net portfolio, which vary over time.
Results of Interest Rate Sensitivity MeasuresThe interest rate risk measures discussed below exclude the impact of changes in the fair value of our guaranty assets and liabilities resulting from changes in interest rates. We exclude our guaranty business from these sensitivity measures based on our current assumption that the guaranty fee income generated from future business activity will largely replace guaranty fee income lost due to mortgage prepayments.
Table 34 displays the pre-tax market value sensitivity of our net portfolio to changes in the level of interest rates and the slope of the yield curve as measured on the last day of each period presented. Table 34 also provides the daily average, minimum, maximum and standard deviation values for duration gap and for the most adverse market value impact on the net portfolio to changes in the level of interest rates and the slope of the yield curve for the three months ended March 31, 2016 and 2015.
The sensitivity measures displayed in Table 34, which we disclose on a quarterly basis pursuant to a disclosure commitment with FHFA, are an extension of our monthly sensitivity measures. There are three primary differences between our monthly sensitivity disclosure and the quarterly sensitivity disclosure presented below: (1) the quarterly disclosure is expanded to include the sensitivity results for larger rate level shocks of plus or minus 100 basis points; (2) the monthly disclosure reflects the estimated pre-tax impact on the market value of our net portfolio calculated based on a daily average, while the quarterly disclosure reflects the estimated pre-tax impact calculated based on the estimated financial position of our net portfolio and the market environment as of the last business day of the quarter; and (3) the monthly disclosure shows the most adverse pre-tax impact on the market value of our net portfolio from the hypothetical interest rate shocks, while the quarterly disclosure includes the estimated pre-tax impact of both up and down interest rate shocks.

61
Table 34: Interest Rate Sensitivity of Net Portfolio to Changes in Interest Rate Level and Slope of Yield Curve(1)
As of
March 31, 2016(2) December 31, 2015(2)
(Dollars in billions)
Rate level shock:-100 basis points . . . . . . . . . . . . . . . . . . . . . . . . . . . . . . . . . . . . . . . . . . . . . . . . . . $ 0.4 $ 0.4-50 basis points . . . . . . . . . . . . . . . . . . . . . . . . . . . . . . . . . . . . . . . . . . . . . . . . . . . 0.2 0.1+50 basis points. . . . . . . . . . . . . . . . . . . . . . . . . . . . . . . . . . . . . . . . . . . . . . . . . . . (0.1) (0.1)+100 basis points. . . . . . . . . . . . . . . . . . . . . . . . . . . . . . . . . . . . . . . . . . . . . . . . . . (0.2) (0.4)
Rate slope shock:-25 basis points (flattening). . . . . . . . . . . . . . . . . . . . . . . . . . . . . . . . . . . . . . . . . . 0.0 0.0+25 basis points (steepening) . . . . . . . . . . . . . . . . . . . . . . . . . . . . . . . . . . . . . . . . (0.0) (0.0)
For the Three Months Ended March 31, 2016(3)
DurationGap
Rate Slope Shock25 bps
Rate Level Shock50 bps
Exposure(In months) (Dollars in billions)
Average . . . . . . . . . . . . . . . . . . . . . . . . . . . . . . . . . . . . . . . . . . . . . . . . . . . . . . (0.1) $ 0.1 $ 0.0Minimum . . . . . . . . . . . . . . . . . . . . . . . . . . . . . . . . . . . . . . . . . . . . . . . . . . . . . (0.9) 0.0 0.0Maximum . . . . . . . . . . . . . . . . . . . . . . . . . . . . . . . . . . . . . . . . . . . . . . . . . . . . 0.7 0.1 0.4Standard deviation . . . . . . . . . . . . . . . . . . . . . . . . . . . . . . . . . . . . . . . . . . . . . . 0.3 0.0 0.1
For the Three Months Ended March 31, 2015(3)
DurationGap
Rate Slope Shock 25 bps
Rate Level Shock50 bps
Exposure(In months) (Dollars in billions)
Average . . . . . . . . . . . . . . . . . . . . . . . . . . . . . . . . . . . . . . . . . . . . . . . . . . . . . . 0.2 $ 0.0 $ 0.0Minimum . . . . . . . . . . . . . . . . . . . . . . . . . . . . . . . . . . . . . . . . . . . . . . . . . . . . . (0.5) 0.0 0.0Maximum . . . . . . . . . . . . . . . . . . . . . . . . . . . . . . . . . . . . . . . . . . . . . . . . . . . . 1.1 0.1 0.1Standard deviation . . . . . . . . . . . . . . . . . . . . . . . . . . . . . . . . . . . . . . . . . . . . . . 0.4 0.0 0.0__________(1) Computed based on changes in U.S. LIBOR interest rates swap curve.(2) Measured on the last day of each period presented.(3) Computed based on daily values during the period presented.
The market value sensitivity of our net portfolio varies across a range of interest rate shocks depending upon the duration and convexity profile of our net portfolio. Because the effective duration gap of our net portfolio was close to zero months in the periods presented, convexity risk was the primary driver of the market value sensitivity of our net portfolio in those periods.
A majority of the interest rate risk associated with our mortgage-related securities and loans is hedged with our debt issuances, which include callable debt. We use derivatives to help manage the residual interest rate risk exposure between our assets and liabilities. Derivatives have enabled us to keep our interest rate risk exposure at consistently low levels in a wide range of interest-rate environments. Table 35 displays an example of how derivatives impacted the net market value exposure for a 50 basis point parallel interest rate shock.

62
Table 35: Derivative Impact on Interest Rate Risk (50 Basis Points)(1)
As ofMarch 31, 2016 December 31, 2015
(Dollars in billions)
Before derivatives. . . . . . . . . . . . . . . . . . . . . . . . . . . . . . . . . . . . . . . . . . . . . . . . . . . . . $ (1.6) $ (1.5)After derivatives . . . . . . . . . . . . . . . . . . . . . . . . . . . . . . . . . . . . . . . . . . . . . . . . . . . . . . (0.1) (0.1)Effect of derivatives . . . . . . . . . . . . . . . . . . . . . . . . . . . . . . . . . . . . . . . . . . . . . . . . . . . 1.5 1.4__________(1) Measured on the last day of each period presented.
Liquidity Risk ManagementSee “MD&A—Liquidity and Capital Management—Liquidity Management” in our 2015 Form 10-K and in this report for a discussion of how we manage liquidity risk.
Operational Risk ManagementSee “MD&A—Risk Management—Operational Risk Management” in our 2015 Form 10-K for information on operational risks that we face and our framework for managing operational risk.
IMPACT OF FUTURE ADOPTION OF NEW ACCOUNTING GUIDANCE
We identify and discuss the expected impact on our condensed consolidated financial statements of recently issued accounting guidance in “Note 1, Summary of Significant Accounting Policies.”
FORWARD-LOOKING STATEMENTS
This report includes statements that constitute forward-looking statements within the meaning of Section 21E of the Securities Exchange Act of 1934 (the “Exchange Act”). In addition, our senior management may from time to time make forward-looking statements orally to analysts, investors, the news media and others. Forward-looking statements often include words such as “expect,” “anticipate,” “intend,” “plan,” “believe,” “seek,” “estimate,” “forecast,” “project,” “would,” “should,” “could,” “likely,” “may,” “will” or similar words.
Among the forward-looking statements in this report are statements relating to:
• Our expectation that we will remain profitable on an annual basis for the foreseeable future; however, certain factors, such as changes in interest rates or home prices, could result in significant volatility in our financial results from quarter to quarter or year to year;
• Our expectation that our future financial results also will be affected by a number of other factors, including: our guaranty fee rates; the volume of single-family mortgage originations in the future; the size, composition and quality of our retained mortgage portfolio and guaranty book of business; and economic and housing market conditions;
• Our expectation of volatility from period to period in our financial results from a number of factors, particularly changes in market conditions that result in fluctuations in the estimated fair value of the financial instruments that we mark to market through our earnings;
• Our expectation that we will pay Treasury a senior preferred stock dividend of $919 million for the second quarter of 2016 by June 30, 2016;
• Our expectation that we will retain only a limited amount of any future net worth because we are required by the dividend provisions of the senior preferred stock and quarterly directives from our conservator to pay Treasury each quarter any dividends declared consisting of the amount, if any, by which our net worth as of the end of the immediately preceding fiscal quarter exceeds an applicable capital reserve amount;
• Our intention to continue to engage in credit risk transfer transactions on an ongoing basis, subject to market conditions;

63
• Our expectation that, over time, a larger portion of our single-family conventional guaranty book of business will be covered by credit risk transfer transactions;
• Our expectation that our single-family acquisitions will continue to have a strong overall credit risk profile given our current underwriting and eligibility standards and product design;
• Our expectation that we will implement additional enhancements to Desktop Underwriter during 2016 to further help our lender customers originate mortgages with increased efficiency and lower costs and to help increase access to credit for creditworthy borrowers;
• The expectation that more than 386,000 new multifamily units will be completed this year;
• Our belief that the increase in the supply of new multifamily units in 2016 will result in lower national net absorption levels in 2016, leading to an increase in the national multifamily vacancy rate and a slowdown in rent growth;
• Our expectation that significant uncertainty regarding the future of our company and the housing finance system will continue;
• Our expectation that the guaranty fees we receive for managing the credit risk on loans underlying Fannie Mae MBS held by third parties will continue to account for an increasing portion of our net interest income;
• Our expectation that our guaranty fee revenues will increase over the next several years, as loans with lower guaranty fees liquidate from our book of business and are replaced with new loans with higher guaranty fees;
• Our expectation that continued decreases in the size of our retained mortgage portfolio will continue to negatively impact our net interest income and net revenues;
• Our expectation that increases in our guaranty fee revenues will partially offset the negative impact of the decline in our retained mortgage portfolio, and our expectation that the extent to which the positive impact of increased guaranty fee revenues will offset the negative impact of the decline in the size of our retained mortgage portfolio will depend on many factors, including: changes to guaranty fee pricing we may make in the future and their impact on our competitive environment and guaranty fee revenues; the size, composition and quality of our guaranty book of business; the life of the loans in our guaranty book of business; the size, composition and quality of our retained mortgage portfolio; economic and housing market conditions, including changes in interest rates; our market share; and legislative and regulatory changes;
• Our expectation that the single-family serious delinquency rate for the overall mortgage market will continue to decline, and our belief that the rate of this decline will be gradual;
• Our expectation that the national single-family serious delinquency rate will remain high compared with pre-housing crisis levels because it will take some time for the remaining delinquent loans originated prior to 2009 to work their way through the foreclosure process;
• Our forecast that total originations in the U.S. single-family mortgage market in 2016 will decrease from 2015 levels by approximately 9% from an estimated $1.71 trillion in 2015 to $1.56 trillion in 2016;
• Our forecast that the amount of originations in the U.S. single family mortgage market that are refinancings will decrease from an estimated $795 billion in 2015 to $615 billion in 2016;
• Our expectation that the rate of home price appreciation in 2016 will be similar to the rate in 2015;
• Our expectation of significant regional variation in the timing and rate of home price growth;
• Our expectation that our credit losses will be lower in 2016 than our 2015 credit losses;
• Our expectation that our loss reserves will decline further;
• Our belief that we met three of five single-family housing goal benchmarks and each of our multifamily goals and subgoals for 2015;
• Our plan to begin securitizing reperforming loans held in our retained mortgage portfolio into Fannie Mae MBS in the second half of 2016, and our expectation that these securitizations will provide us with more flexibility to manage our risk and reduce the size of our portfolio;
• Our expectation that we will pay $48 million that we accrued in the first quarter of 2016, plus additional amounts to be accrued based on our new business purchases in the remaining nine months of 2016, to specified HUD and Treasury funds in February 2017;

64
• Our expectation that the guaranty fees we collect and the expenses we incur under the TCCA will continue to increase in the future;
• Our plan to reduce our retained mortgage portfolio to no more than $305.4 billion as of December 31, 2016, in compliance with both our senior preferred stock purchase agreement with Treasury and FHFA’s request;
• Our expectation that we will continue purchasing loans from MBS trusts as they become four or more consecutive monthly payments delinquent subject to market conditions, economic benefit, servicer capacity and other factors, including the limit on the amount of mortgage assets that we may own pursuant to the senior preferred stock purchase agreement with Treasury and FHFA’s portfolio plan requirements;
• Our belief that our liquidity contingency plan may be difficult or impossible to execute for a company of our size and in our circumstances;
• Our intention to repay our short-term and long-term debt obligations as they become due primarily through proceeds from the issuance of additional debt securities;
• Our expectation that we may also use proceeds from our mortgage assets to pay our debt obligations;
• Our expectation that we will not eliminate our deficit of core capital over statutory minimum capital;
• Our expectation that, as a result of allowing lenders to remit payment equal to our losses on loans after we have disposed of the related REO, our actual cash receipts relating to our outstanding repurchase requests will be significantly lower than the unpaid principal balance of the loans;
• Our belief that we have taken appropriate steps to mitigate the risk associated with providing lenders with relief from repurchasing certain loans for breaches of certain representations and warranties;
• FHFA’s expectation that single-family credit risk transfers will continue to be an ongoing conservatorship requirement;
• Our expectation that our acquisition of Alt-A mortgage loans will continue to be minimal in future periods and the percentage of the book of business attributable to Alt-A will continue to decrease over time;
• Our expectation that the serious delinquency rates for single-family loans acquired in more recent years will be higher after the loans have aged, but will not approach the levels of the March 31, 2016 serious delinquency rates of loans acquired in 2005 through 2008;
• Our expectation that the ultimate performance of all our loans will be affected by borrower behavior, public policy and macroeconomic trends, including unemployment, the economy and home prices;
• Our expectation that loans we acquire under Refi Plus and HARP will perform better than the loans they replace because they should either reduce the borrowers’ monthly payments or provide more stable terms than the borrowers’ old loans (for example, by refinancing into a mortgage with a fixed interest rate instead of an adjustable rate);
• Our expectation that the volume of refinancings under HARP will continue to decline, due to a decrease in the population of borrowers with loans that have high LTV ratios who are willing to refinance and would benefit from refinancing;
• Our expectation that our institutional credit risk exposure to derivatives clearing organizations and certain of their members will continue to increase in the future as cleared derivative contracts comprise a larger percentage of our derivative instruments;
• Our assumption that the guaranty fee income generated from future business activity will largely replace guaranty fee income lost due to mortgage prepayments;
• Our expectation that, as a result of our various loss mitigation and foreclosure prevention efforts, a portion of the loans in the process of formal foreclosure proceedings will not ultimately foreclose;
• Our plan to complete additional nonperforming loan sales in 2016;
• Our expectation that our single-family serious delinquency rate will continue to decrease;
• Our expectation that we will not remediate the material weakness relating to our disclosure controls and procedures while we are under conservatorship;
• Our expectation that Congress will continue to hold hearings and consider legislation on the future status of Fannie Mae and Freddie Mac, including proposals that would result in Fannie Mae’s liquidation or dissolution; and
65
• Our belief that continued federal government support of our business, as well as our status as a GSE, are essential to maintaining our access to debt funding and that changes or perceived changes in federal government support of our business or our status as a GSE could materially and adversely affect our liquidity, financial condition and results of operations.
Forward-looking statements reflect our management’s or in some cases FHFA’s expectations, forecasts or predictions of future conditions, events or results based on various assumptions and management’s estimates of trends and economic factors in the markets in which we are active, as well as our business plans. They are not guarantees of future performance. By their nature, forward-looking statements are subject to risks and uncertainties. Our actual results and financial condition may differ, possibly materially, from the anticipated results and financial condition indicated in these forward-looking statements. There are a number of factors that could cause actual conditions, events or results to differ materially from those described in the forward-looking statements contained in this report, including, but not limited to, the following: the uncertainty of our future; legislative and regulatory changes affecting us; the timing and level of, as well as regional variation in, home price changes; changes in interest rates, including negative interest rates; changes in unemployment rates and other macroeconomic and housing market variables; our future guaranty fee pricing and the impact of that pricing on our competitive environment and guaranty fee revenues; challenges we face in retaining and hiring qualified executives and other employees; our future serious delinquency rates; the deteriorated credit performance of many loans in our guaranty book of business; the conservatorship and its effect on our business; the investment by Treasury and its effect on our business; adverse effects from activities we undertake to support the mortgage market and help borrowers; actions we may be required to take by FHFA, in its role as our conservator or as our regulator, such as changes in the type of business we do or implementation of a single GSE security; limitations on our business imposed by FHFA, in its role as our conservator or as our regulator; our future objectives and activities in support of those objectives, including actions we may take to reach additional underserved creditworthy borrowers; a decrease in our credit ratings; limitations on our ability to access the debt capital markets; disruptions in the housing and credit markets; significant changes in modification and foreclosure activity; the volume and pace of future nonperforming loan sales and their impact on our results and serious delinquency rates; changes in borrower behavior; the effectiveness of our loss mitigation strategies, management of our REO inventory and pursuit of contractual remedies; defaults by one or more institutional counterparties; resolution or settlement agreements we may enter into with our counterparties; our need to rely on third parties to fully achieve some of our corporate objectives; our reliance on mortgage servicers; changes in GAAP; guidance by the Financial Accounting Standards Board (“FASB”); future changes to our accounting policies; changes in the fair value of our assets and liabilities; operational control weaknesses; our reliance on models; future updates to our models, including the assumptions used by these models; the level and volatility of interest rates and credit spreads; changes in the fiscal and monetary policies of the Federal Reserve, including any change in the Federal Reserve’s policy towards the reinvestment of principal payments of mortgage-backed securities or any future sales of such securities; changes in the structure and regulation of the financial services industry; credit availability; global political risks; natural disasters, environmental disasters, terrorist attacks, pandemics or other major disruptive events; information security breaches; and those factors described in “Risk Factors” in this report and in our 2015 Form 10-K, as well as the factors described in “Executive Summary—Outlook—Factors that Could Cause Actual Results to be Materially Different from Our Estimates and Expectations” in this report.
Readers are cautioned to place forward-looking statements in this report or that we make from time to time into proper context by carefully considering the factors discussed in “Risk Factors” in our 2015 Form 10-K and in this report. These forward-looking statements are representative only as of the date they are made, and we undertake no obligation to update any forward-looking statement as a result of new information, future events or otherwise, except as required under the federal securities laws.

66
Item 1. Financial StatementsFANNIE MAE
(In conservatorship)Condensed Consolidated Balance Sheets — (Unaudited)
(Dollars in millions, except share amounts)
As ofMarch 31, December 31,
2016 2015ASSETS
Cash and cash equivalents . . . . . . . . . . . . . . . . . . . . . . . . . . . . . . . . . . . . . . . . . . . . . . . . . . . . . . . . . . . . . . . . . . . . . . . . . . $ 18,916 $ 14,674Restricted cash (includes $29,302 and $25,865, respectively, related to consolidated trusts) . . . . . . . . . . . . . . . . . . . . . . . 33,873 30,879Federal funds sold and securities purchased under agreements to resell or similar arrangements. . . . . . . . . . . . . . . . . . . . 17,550 27,350Investments in securities:
Trading, at fair value (includes $1,200 and $135, respectively, pledged as collateral) . . . . . . . . . . . . . . . . . . . . . . . . . 40,000 39,908Available-for-sale, at fair value (includes $80 and $285, respectively, related to consolidated trusts) . . . . . . . . . . . . . 16,983 20,230
Total investments in securities . . . . . . . . . . . . . . . . . . . . . . . . . . . . . . . . . . . . . . . . . . . . . . . . . . . . . . . . . . . . . . . . . 56,983 60,138Mortgage loans:
Loans held for sale, at lower of cost or fair value. . . . . . . . . . . . . . . . . . . . . . . . . . . . . . . . . . . . . . . . . . . . . . . . . . . . . . 4,639 5,361Loans held for investment, at amortized cost:
Of Fannie Mae . . . . . . . . . . . . . . . . . . . . . . . . . . . . . . . . . . . . . . . . . . . . . . . . . . . . . . . . . . . . . . . . . . . . . . . . . . . . . . . 228,687 233,054Of consolidated trusts . . . . . . . . . . . . . . . . . . . . . . . . . . . . . . . . . . . . . . . . . . . . . . . . . . . . . . . . . . . . . . . . . . . . . . . . . 2,817,440 2,809,180Total loans held for investment (includes $13,714 and $14,075, respectively, at fair value) . . . . . . . . . . . . . . . . . . . 3,046,127 3,042,234Allowance for loan losses . . . . . . . . . . . . . . . . . . . . . . . . . . . . . . . . . . . . . . . . . . . . . . . . . . . . . . . . . . . . . . . . . . . . . . (25,819) (27,951)
Total loans held for investment, net of allowance . . . . . . . . . . . . . . . . . . . . . . . . . . . . . . . . . . . . . . . . . . . . . . . . . . 3,020,308 3,014,283Total mortgage loans. . . . . . . . . . . . . . . . . . . . . . . . . . . . . . . . . . . . . . . . . . . . . . . . . . . . . . . . . . . . . . . . . . . . . . 3,024,947 3,019,644
Deferred tax assets, net . . . . . . . . . . . . . . . . . . . . . . . . . . . . . . . . . . . . . . . . . . . . . . . . . . . . . . . . . . . . . . . . . . . . . . . . . . . . . 37,048 37,187Accrued interest receivable (includes $7,246 and $6,974, respectively, related to consolidated trusts) . . . . . . . . . . . . . . . 7,978 7,726Acquired property, net . . . . . . . . . . . . . . . . . . . . . . . . . . . . . . . . . . . . . . . . . . . . . . . . . . . . . . . . . . . . . . . . . . . . . . . . . . . . . 6,188 6,766Other assets . . . . . . . . . . . . . . . . . . . . . . . . . . . . . . . . . . . . . . . . . . . . . . . . . . . . . . . . . . . . . . . . . . . . . . . . . . . . . . . . . . . . . . 18,218 17,553
Total assets . . . . . . . . . . . . . . . . . . . . . . . . . . . . . . . . . . . . . . . . . . . . . . . . . . . . . . . . . . . . . . . . . . . . . . . . . . . . . . . . . . . $ 3,221,701 $ 3,221,917LIABILITIES AND EQUITY
Liabilities:Accrued interest payable (includes $8,212 and $8,194, respectively, related to consolidated trusts). . . . . . . . . . . . . . . . $ 9,909 $ 9,794Debt:
Of Fannie Mae (includes $10,901 and $11,133, respectively, at fair value). . . . . . . . . . . . . . . . . . . . . . . . . . . . . . . . . . 370,819 386,135Of consolidated trusts (includes $28,563 and $23,609, respectively, at fair value) . . . . . . . . . . . . . . . . . . . . . . . . . . . . 2,828,951 2,811,536
Other liabilities (includes $408 and $448, respectively, related to consolidated trusts) . . . . . . . . . . . . . . . . . . . . . . . . . . 9,903 10,393Total liabilities . . . . . . . . . . . . . . . . . . . . . . . . . . . . . . . . . . . . . . . . . . . . . . . . . . . . . . . . . . . . . . . . . . . . . . . . . . . . . . . . 3,219,582 3,217,858
Commitments and contingencies (Note 16) . . . . . . . . . . . . . . . . . . . . . . . . . . . . . . . . . . . . . . . . . . . . . . . . . . . . . . . . . . . . . — —Fannie Mae stockholders’ equity:
Senior preferred stock, 1,000,000 shares issued and outstanding. . . . . . . . . . . . . . . . . . . . . . . . . . . . . . . . . . . . . . . . . . 117,149 117,149Preferred stock, 700,000,000 shares are authorized—555,374,922 shares issued and outstanding . . . . . . . . . . . . . . . . 19,130 19,130Common stock, no par value, no maximum authorization—1,308,762,703 shares issued and 1,158,082,750 shares
outstanding . . . . . . . . . . . . . . . . . . . . . . . . . . . . . . . . . . . . . . . . . . . . . . . . . . . . . . . . . . . . . . . . . . . . . . . . . . . . . . . . . 687 687Accumulated deficit . . . . . . . . . . . . . . . . . . . . . . . . . . . . . . . . . . . . . . . . . . . . . . . . . . . . . . . . . . . . . . . . . . . . . . . . . . . . (128,665) (126,942)Accumulated other comprehensive income . . . . . . . . . . . . . . . . . . . . . . . . . . . . . . . . . . . . . . . . . . . . . . . . . . . . . . . . . . 1,207 1,407Treasury stock, at cost, 150,679,953 shares . . . . . . . . . . . . . . . . . . . . . . . . . . . . . . . . . . . . . . . . . . . . . . . . . . . . . . . . . . (7,401) (7,401)Total Fannie Mae stockholders’ equity. . . . . . . . . . . . . . . . . . . . . . . . . . . . . . . . . . . . . . . . . . . . . . . . . . . . . . . . . . . . . . 2,107 4,030
Noncontrolling interest . . . . . . . . . . . . . . . . . . . . . . . . . . . . . . . . . . . . . . . . . . . . . . . . . . . . . . . . . . . . . . . . . . . . . . . . . . . . . 12 29Total equity (See Note 1: Impact of U.S. Government Support for information on our dividend obligation to
Treasury). . . . . . . . . . . . . . . . . . . . . . . . . . . . . . . . . . . . . . . . . . . . . . . . . . . . . . . . . . . . . . . . . . . . . . . . . . . . . . . . . . . 2,119 4,059Total liabilities and equity. . . . . . . . . . . . . . . . . . . . . . . . . . . . . . . . . . . . . . . . . . . . . . . . . . . . . . . . . . . . . . . . . . . . . . . . . . . $ 3,221,701 $ 3,221,917
See Notes to Condensed Consolidated Financial Statements

67
FANNIE MAE(In conservatorship)
Condensed Consolidated Statements of Operations and Comprehensive Income — (Unaudited)(Dollars and shares in millions, except per share amounts)
For the Three MonthsEnded March 31,2016 2015
Interest income:Trading securities . . . . . . . . . . . . . . . . . . . . . . . . . . . . . . . . . . . . . . . . . . . . . . . . . . . . . . . . . . . . . . . . . . . . . . . . . . . . . . . . . . . . . . $ 120 $ 115Available-for-sale securities . . . . . . . . . . . . . . . . . . . . . . . . . . . . . . . . . . . . . . . . . . . . . . . . . . . . . . . . . . . . . . . . . . . . . . . . . . . . . . 203 376Mortgage loans (includes $24,626 and $24,622, respectively, related to consolidated trusts). . . . . . . . . . . . . . . . . . . . . . . . . . . . 26,961 27,044Other . . . . . . . . . . . . . . . . . . . . . . . . . . . . . . . . . . . . . . . . . . . . . . . . . . . . . . . . . . . . . . . . . . . . . . . . . . . . . . . . . . . . . . . . . . . . . . . . 48 33
Total interest income . . . . . . . . . . . . . . . . . . . . . . . . . . . . . . . . . . . . . . . . . . . . . . . . . . . . . . . . . . . . . . . . . . . . . . . . . . . . . . . . . . 27,332 27,568Interest expense:
Short-term debt . . . . . . . . . . . . . . . . . . . . . . . . . . . . . . . . . . . . . . . . . . . . . . . . . . . . . . . . . . . . . . . . . . . . . . . . . . . . . . . . . . . . . . . . 51 29Long-term debt (includes $20,658 and $20,515, respectively, related to consolidated trusts). . . . . . . . . . . . . . . . . . . . . . . . . . . . 22,512 22,472
Total interest expense. . . . . . . . . . . . . . . . . . . . . . . . . . . . . . . . . . . . . . . . . . . . . . . . . . . . . . . . . . . . . . . . . . . . . . . . . . . . . . . . . . 22,563 22,501Net interest income . . . . . . . . . . . . . . . . . . . . . . . . . . . . . . . . . . . . . . . . . . . . . . . . . . . . . . . . . . . . . . . . . . . . . . . . . . . . . . . . . . . . . . 4,769 5,067Benefit for credit losses . . . . . . . . . . . . . . . . . . . . . . . . . . . . . . . . . . . . . . . . . . . . . . . . . . . . . . . . . . . . . . . . . . . . . . . . . . . . . . . . . . . 1,184 533Net interest income after benefit for credit losses . . . . . . . . . . . . . . . . . . . . . . . . . . . . . . . . . . . . . . . . . . . . . . . . . . . . . . . . . . . . . . . 5,953 5,600Investment gains, net . . . . . . . . . . . . . . . . . . . . . . . . . . . . . . . . . . . . . . . . . . . . . . . . . . . . . . . . . . . . . . . . . . . . . . . . . . . . . . . . . . . . . 69 342Fair value losses, net . . . . . . . . . . . . . . . . . . . . . . . . . . . . . . . . . . . . . . . . . . . . . . . . . . . . . . . . . . . . . . . . . . . . . . . . . . . . . . . . . . . . . (2,813) (1,919)Fee and other income. . . . . . . . . . . . . . . . . . . . . . . . . . . . . . . . . . . . . . . . . . . . . . . . . . . . . . . . . . . . . . . . . . . . . . . . . . . . . . . . . . . . . 203 308
Non-interest loss . . . . . . . . . . . . . . . . . . . . . . . . . . . . . . . . . . . . . . . . . . . . . . . . . . . . . . . . . . . . . . . . . . . . . . . . . . . . . . . . . . . . . . . (2,541) (1,269)Administrative expenses:
Salaries and employee benefits. . . . . . . . . . . . . . . . . . . . . . . . . . . . . . . . . . . . . . . . . . . . . . . . . . . . . . . . . . . . . . . . . . . . . . . . . . . . 364 351Professional services. . . . . . . . . . . . . . . . . . . . . . . . . . . . . . . . . . . . . . . . . . . . . . . . . . . . . . . . . . . . . . . . . . . . . . . . . . . . . . . . . . . . 215 271Occupancy expenses . . . . . . . . . . . . . . . . . . . . . . . . . . . . . . . . . . . . . . . . . . . . . . . . . . . . . . . . . . . . . . . . . . . . . . . . . . . . . . . . . . . . 45 43Other administrative expenses . . . . . . . . . . . . . . . . . . . . . . . . . . . . . . . . . . . . . . . . . . . . . . . . . . . . . . . . . . . . . . . . . . . . . . . . . . . . 64 58
Total administrative expenses . . . . . . . . . . . . . . . . . . . . . . . . . . . . . . . . . . . . . . . . . . . . . . . . . . . . . . . . . . . . . . . . . . . . . . . . . . . 688 723Foreclosed property expense . . . . . . . . . . . . . . . . . . . . . . . . . . . . . . . . . . . . . . . . . . . . . . . . . . . . . . . . . . . . . . . . . . . . . . . . . . . . . . . 334 473Temporary Payroll Tax Cut Continuation Act of 2011 (“TCCA”) fees. . . . . . . . . . . . . . . . . . . . . . . . . . . . . . . . . . . . . . . . . . . . . . . 440 382Other expenses (income), net. . . . . . . . . . . . . . . . . . . . . . . . . . . . . . . . . . . . . . . . . . . . . . . . . . . . . . . . . . . . . . . . . . . . . . . . . . . . . . . 264 (5)
Total expenses . . . . . . . . . . . . . . . . . . . . . . . . . . . . . . . . . . . . . . . . . . . . . . . . . . . . . . . . . . . . . . . . . . . . . . . . . . . . . . . . . . . . . . . 1,726 1,573Income before federal income taxes . . . . . . . . . . . . . . . . . . . . . . . . . . . . . . . . . . . . . . . . . . . . . . . . . . . . . . . . . . . . . . . . . . . . . . . . . 1,686 2,758Provision for federal income taxes . . . . . . . . . . . . . . . . . . . . . . . . . . . . . . . . . . . . . . . . . . . . . . . . . . . . . . . . . . . . . . . . . . . . . . . . . . (550) (870)Net income. . . . . . . . . . . . . . . . . . . . . . . . . . . . . . . . . . . . . . . . . . . . . . . . . . . . . . . . . . . . . . . . . . . . . . . . . . . . . . . . . . . . . . . . . . . . . 1,136 1,888Other comprehensive loss:
Changes in unrealized gains on available-for-sale securities, net of reclassification adjustments and taxes. . . . . . . . . . . . . . . . . (198) (91)Other . . . . . . . . . . . . . . . . . . . . . . . . . . . . . . . . . . . . . . . . . . . . . . . . . . . . . . . . . . . . . . . . . . . . . . . . . . . . . . . . . . . . . . . . . . . . . . . . (2) (1)
Total other comprehensive loss . . . . . . . . . . . . . . . . . . . . . . . . . . . . . . . . . . . . . . . . . . . . . . . . . . . . . . . . . . . . . . . . . . . . . . . . . . (200) (92)Total comprehensive income attributable to Fannie Mae . . . . . . . . . . . . . . . . . . . . . . . . . . . . . . . . . . . . . . . . . . . . . . . . . . . . . . . . . $ 936 $ 1,796Net income attributable to Fannie Mae . . . . . . . . . . . . . . . . . . . . . . . . . . . . . . . . . . . . . . . . . . . . . . . . . . . . . . . . . . . . . . . . . . . . . . . 1,136 1,888Dividends distributed or available for distribution to senior preferred stockholder (Note 10) . . . . . . . . . . . . . . . . . . . . . . . . . . . . . (919) (1,796)Net income attributable to common stockholders (Note 10) . . . . . . . . . . . . . . . . . . . . . . . . . . . . . . . . . . . . . . . . . . . . . . . . . . . . . . . $ 217 $ 92Earnings per share:
Basic. . . . . . . . . . . . . . . . . . . . . . . . . . . . . . . . . . . . . . . . . . . . . . . . . . . . . . . . . . . . . . . . . . . . . . . . . . . . . . . . . . . . . . . . . . . . . . . $ 0.04 $ 0.02Diluted . . . . . . . . . . . . . . . . . . . . . . . . . . . . . . . . . . . . . . . . . . . . . . . . . . . . . . . . . . . . . . . . . . . . . . . . . . . . . . . . . . . . . . . . . . . . . 0.04 0.02
Weighted-average common shares outstanding:Basic. . . . . . . . . . . . . . . . . . . . . . . . . . . . . . . . . . . . . . . . . . . . . . . . . . . . . . . . . . . . . . . . . . . . . . . . . . . . . . . . . . . . . . . . . . . . . . . 5,762 5,762Diluted . . . . . . . . . . . . . . . . . . . . . . . . . . . . . . . . . . . . . . . . . . . . . . . . . . . . . . . . . . . . . . . . . . . . . . . . . . . . . . . . . . . . . . . . . . . . . 5,893 5,893
See Notes to Condensed Consolidated Financial Statements
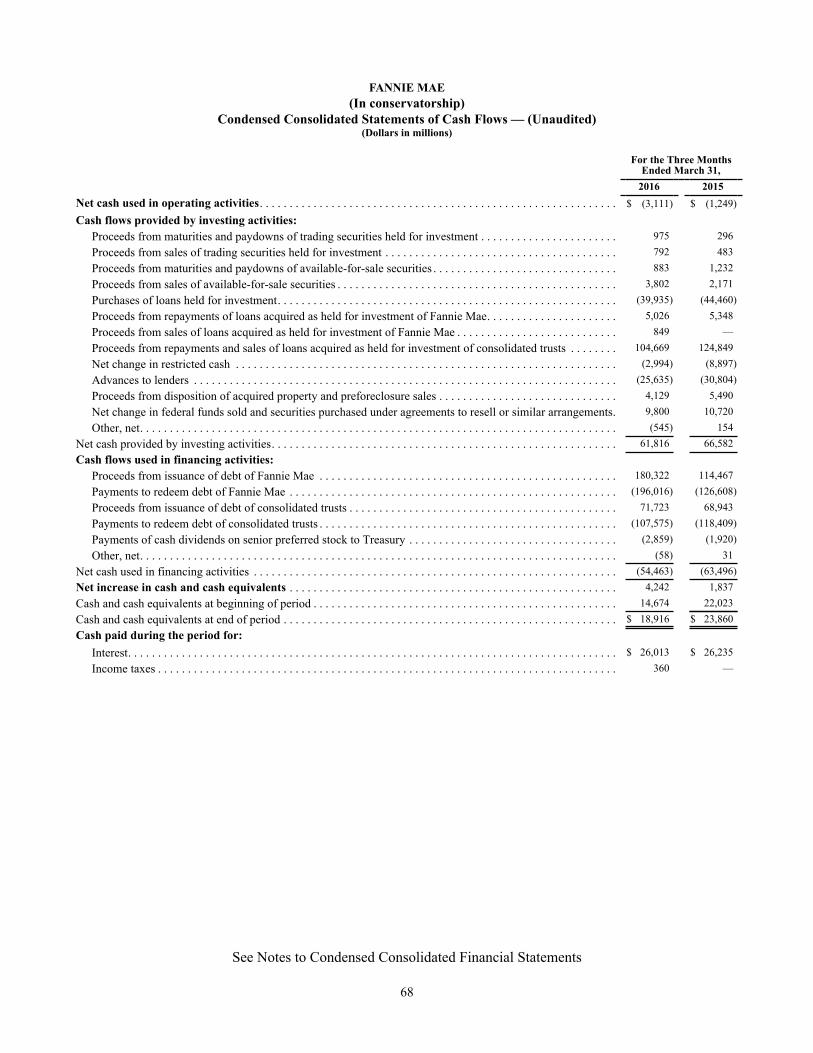
68
FANNIE MAE(In conservatorship)
Condensed Consolidated Statements of Cash Flows — (Unaudited)(Dollars in millions)
For the Three MonthsEnded March 31,
2016 2015Net cash used in operating activities. . . . . . . . . . . . . . . . . . . . . . . . . . . . . . . . . . . . . . . . . . . . . . . . . . . . . . . . . . . . $ (3,111) $ (1,249)Cash flows provided by investing activities:
Proceeds from maturities and paydowns of trading securities held for investment . . . . . . . . . . . . . . . . . . . . . . . 975 296Proceeds from sales of trading securities held for investment . . . . . . . . . . . . . . . . . . . . . . . . . . . . . . . . . . . . . . . 792 483Proceeds from maturities and paydowns of available-for-sale securities . . . . . . . . . . . . . . . . . . . . . . . . . . . . . . . 883 1,232Proceeds from sales of available-for-sale securities . . . . . . . . . . . . . . . . . . . . . . . . . . . . . . . . . . . . . . . . . . . . . . . 3,802 2,171Purchases of loans held for investment. . . . . . . . . . . . . . . . . . . . . . . . . . . . . . . . . . . . . . . . . . . . . . . . . . . . . . . . . (39,935) (44,460)Proceeds from repayments of loans acquired as held for investment of Fannie Mae. . . . . . . . . . . . . . . . . . . . . . 5,026 5,348Proceeds from sales of loans acquired as held for investment of Fannie Mae . . . . . . . . . . . . . . . . . . . . . . . . . . . 849 —Proceeds from repayments and sales of loans acquired as held for investment of consolidated trusts . . . . . . . . 104,669 124,849Net change in restricted cash . . . . . . . . . . . . . . . . . . . . . . . . . . . . . . . . . . . . . . . . . . . . . . . . . . . . . . . . . . . . . . . . (2,994) (8,897)Advances to lenders . . . . . . . . . . . . . . . . . . . . . . . . . . . . . . . . . . . . . . . . . . . . . . . . . . . . . . . . . . . . . . . . . . . . . . . (25,635) (30,804)Proceeds from disposition of acquired property and preforeclosure sales . . . . . . . . . . . . . . . . . . . . . . . . . . . . . . 4,129 5,490Net change in federal funds sold and securities purchased under agreements to resell or similar arrangements. 9,800 10,720Other, net. . . . . . . . . . . . . . . . . . . . . . . . . . . . . . . . . . . . . . . . . . . . . . . . . . . . . . . . . . . . . . . . . . . . . . . . . . . . . . . . (545) 154
Net cash provided by investing activities. . . . . . . . . . . . . . . . . . . . . . . . . . . . . . . . . . . . . . . . . . . . . . . . . . . . . . . . . . 61,816 66,582Cash flows used in financing activities:
Proceeds from issuance of debt of Fannie Mae . . . . . . . . . . . . . . . . . . . . . . . . . . . . . . . . . . . . . . . . . . . . . . . . . . 180,322 114,467Payments to redeem debt of Fannie Mae . . . . . . . . . . . . . . . . . . . . . . . . . . . . . . . . . . . . . . . . . . . . . . . . . . . . . . . (196,016) (126,608)Proceeds from issuance of debt of consolidated trusts . . . . . . . . . . . . . . . . . . . . . . . . . . . . . . . . . . . . . . . . . . . . . 71,723 68,943Payments to redeem debt of consolidated trusts . . . . . . . . . . . . . . . . . . . . . . . . . . . . . . . . . . . . . . . . . . . . . . . . . . (107,575) (118,409)Payments of cash dividends on senior preferred stock to Treasury . . . . . . . . . . . . . . . . . . . . . . . . . . . . . . . . . . . (2,859) (1,920)Other, net. . . . . . . . . . . . . . . . . . . . . . . . . . . . . . . . . . . . . . . . . . . . . . . . . . . . . . . . . . . . . . . . . . . . . . . . . . . . . . . . (58) 31
Net cash used in financing activities . . . . . . . . . . . . . . . . . . . . . . . . . . . . . . . . . . . . . . . . . . . . . . . . . . . . . . . . . . . . . (54,463) (63,496)Net increase in cash and cash equivalents . . . . . . . . . . . . . . . . . . . . . . . . . . . . . . . . . . . . . . . . . . . . . . . . . . . . . . . 4,242 1,837Cash and cash equivalents at beginning of period . . . . . . . . . . . . . . . . . . . . . . . . . . . . . . . . . . . . . . . . . . . . . . . . . . . 14,674 22,023Cash and cash equivalents at end of period . . . . . . . . . . . . . . . . . . . . . . . . . . . . . . . . . . . . . . . . . . . . . . . . . . . . . . . . $ 18,916 $ 23,860Cash paid during the period for:
Interest. . . . . . . . . . . . . . . . . . . . . . . . . . . . . . . . . . . . . . . . . . . . . . . . . . . . . . . . . . . . . . . . . . . . . . . . . . . . . . . . . . $ 26,013 $ 26,235Income taxes . . . . . . . . . . . . . . . . . . . . . . . . . . . . . . . . . . . . . . . . . . . . . . . . . . . . . . . . . . . . . . . . . . . . . . . . . . . . . 360 —
See Notes to Condensed Consolidated Financial Statements

FANNIE MAE(In conservatorship)
NOTES TO CONDENSED CONSOLIDATED FINANCIAL STATEMENTS(UNAUDITED)
69
1. Summary of Significant Accounting Policies
OrganizationWe are a stockholder-owned corporation organized and existing under the Federal National Mortgage Association Charter Act (the “Charter Act” or our “charter”). We are a government-sponsored enterprise (“GSE”) and we are subject to government oversight and regulation. Our regulators include the Federal Housing Finance Agency (“FHFA”), the U.S. Department of Housing and Urban Development (“HUD”), the U.S. Securities and Exchange Commission (“SEC”), and the U.S. Department of the Treasury (“Treasury”). The U.S. government does not guarantee our securities or other obligations.
ConservatorshipOn September 7, 2008, the Secretary of the Treasury and the Director of FHFA announced several actions taken by Treasury and FHFA regarding Fannie Mae, which included: (1) placing us in conservatorship, and (2) the execution of a senior preferred stock purchase agreement by our conservator, on our behalf, and Treasury, pursuant to which we issued to Treasury both senior preferred stock and a warrant to purchase common stock.
Under the Federal Housing Enterprises Financial Safety and Soundness Act of 1992, as amended by the Federal Housing Finance Regulatory Reform Act of 2008 (together, the “GSE Act”), the conservator immediately succeeded to (1) all rights, titles, powers and privileges of Fannie Mae, and of any stockholder, officer or director of Fannie Mae with respect to Fannie Mae and its assets, and (2) title to the books, records and assets of any other legal custodian of Fannie Mae. The conservator has since delegated specified authorities to our Board of Directors and has delegated to management the authority to conduct our day-to-day operations. The conservator retains the authority to withdraw its delegations at any time.
The conservatorship has no specified termination date and there continues to be significant uncertainty regarding our future, including how long we will continue to exist in our current form, the extent of our role in the market, how long we will be in conservatorship, what form we will have and what ownership interest, if any, our current common and preferred stockholders will hold in us after the conservatorship is terminated and whether we will continue to exist following conservatorship. Under the GSE Act, FHFA must place us into receivership if the Director of FHFA makes a written determination that our assets are less than our obligations or if we have not been paying our debts, in either case, for a period of 60 days. In addition, the Director of FHFA may place us into receivership at his discretion at any time for other reasons set forth in the GSE Act, including if we are critically undercapitalized or if we are undercapitalized and have no reasonable prospect of becoming adequately capitalized. Should we be placed into receivership, different assumptions would be required to determine the carrying value of our assets, which could lead to substantially different financial results. We are not aware of any plans of FHFA to fundamentally change our business model or capital structure in the near term.
Impact of U.S. Government SupportWe continue to rely on support from Treasury to eliminate any net worth deficits we may experience in the future, which would otherwise trigger our being placed into receivership. Based on consideration of all the relevant conditions and events affecting our operations, including our reliance on the U.S. government, we continue to operate as a going concern and in accordance with our delegation of authority from FHFA.
We believe that continued federal government support of our business, as well as our status as a GSE, are essential to maintaining our access to debt funding. Changes or perceived changes in federal government support of our business or our status as a GSE could materially and adversely affect our liquidity, financial condition and results of operations.
Pursuant to the senior preferred stock purchase agreement, Treasury has committed to provide us with funding to help us maintain a positive net worth thereby avoiding the mandatory receivership trigger described above. We have received a total of $116.1 billion from Treasury pursuant to the senior preferred stock purchase agreement as of March 31, 2016. The aggregate liquidation preference of the senior preferred stock, including the initial aggregate liquidation preference of $1.0 billion, was $117.1 billion as of March 31, 2016. As of March 31, 2016, the amount of remaining funding available to us under the senior preferred stock purchase agreement was $117.6 billion.
Based on the terms of the senior preferred stock, we paid Treasury a dividend of $2.9 billion on March 31, 2016 based on our net worth of $4.1 billion as of December 31, 2015 less the applicable capital reserve amount of $1.2 billion. We expect to pay Treasury an additional dividend of $919 million by June 30, 2016 based on our net worth of $2.1 billion as of March 31, 2016 less the applicable capital reserve amount of $1.2 billion. The capital reserve amount was $1.8 billion for dividend

FANNIE MAE(In conservatorship)
NOTES TO CONDENSED CONSOLIDATED FINANCIAL STATEMENTS - (Continued)(UNAUDITED)
70
periods in 2015. The capital reserve amount will continue to be reduced by $600 million each year until it reaches zero on January 1, 2018.
Basis of Presentation The accompanying unaudited interim condensed consolidated financial statements have been prepared in accordance with accounting principles generally accepted in the United States of America (“GAAP”) for interim financial information and with the SEC’s instructions to Form 10-Q and Article 10 of Regulation S-X. Accordingly, they do not include all of the information and note disclosures required by GAAP for complete consolidated financial statements. In the opinion of management, all adjustments of a normal recurring nature considered necessary for a fair presentation have been included. The accompanying condensed consolidated financial statements include our accounts as well as the accounts of other entities in which we have a controlling financial interest. All intercompany accounts and transactions have been eliminated. To conform to our current period presentation, we have reclassified certain amounts reported in our prior periods’ condensed consolidated financial statements. Results for the three months ended March 31, 2016 may not necessarily be indicative of the results for the year ending December 31, 2016. The unaudited interim condensed consolidated financial statements as of and for the three months ended March 31, 2016 should be read in conjunction with our audited consolidated financial statements and related notes included in our Annual Report on Form 10-K for the year ended December 31, 2015 (“2015 Form 10-K”), filed with the SEC on February 19, 2016.
Regulatory CapitalFHFA stated that, during conservatorship, our existing statutory and FHFA-directed regulatory capital requirements will not be binding and FHFA will not issue quarterly capital classifications. We submit capital reports to FHFA and FHFA monitors our capital levels. The deficit of core capital over statutory minimum capital was $141.2 billion as of March 31, 2016 and $139.7 billion as of December 31, 2015.
Under the terms of the senior preferred stock, we are required to pay Treasury a dividend each quarter, when, as and if declared, equal to the excess of our net worth as of the end of the preceding quarter over an applicable capital reserve amount. The Director of FHFA has directed us to make dividend payments on the senior preferred stock on a quarterly basis. Therefore, we do not expect to eliminate our deficit of core capital over statutory minimum capital.
Related PartiesAs a result of our issuance to Treasury of the warrant to purchase shares of Fannie Mae common stock equal to 79.9% of the total number of shares of Fannie Mae common stock, we and Treasury are deemed related parties. As of March 31, 2016, Treasury held an investment in our senior preferred stock with an aggregate liquidation preference of $117.1 billion. FHFA’s control of both us and Freddie Mac has caused us, FHFA and Freddie Mac to be deemed related parties. In 2013, Fannie Mae and Freddie Mac established Common Securitization Solutions, LLC (“CSS”), a jointly owned limited liability company to operate a common securitization platform; therefore, CSS is deemed a related party.
Transactions with Treasury
Our administrative expenses were reduced by $16 million for the three months ended March 31, 2016 and 2015 due to reimbursements from Treasury and Freddie Mac for expenses incurred as program administrator for Treasury’s Home Affordable Modification Program (“HAMP”) and other initiatives under Treasury’s Making Home Affordable Program.
During the three months ended March 31, 2016, we made tax payments of $360 million to the Internal Revenue Service (“IRS”), a bureau of Treasury. We did not make any tax payments during the three months ended March 31, 2015. We received no refund from the IRS during the three months ended March 31, 2016. We received a refund of $135 million from the IRS during the three months ended March 31, 2015 for income tax adjustments related to tax years 2004 through 2006.
Under the new issue bond (“NIB”) program, we had $3.7 billion outstanding of pass-through securities backed by single-family and multifamily housing bonds issued by housing finance agencies (“HFAs”) as of March 31, 2016 and December 31, 2015. Treasury will bear the initial losses of principal under the NIB program up to 35% of the total original principal on a combined program-wide basis, and thereafter we will bear the losses of principal that are attributable to the securities we have issued. Treasury will also bear any losses of unpaid interest under the program. As of March 31, 2016, there had been no losses of principal or interest under the NIB program.
The fee revenue and expense related to the Temporary Payroll Tax Cut Continuation Act of 2011 (“TCCA”) are recorded in “Mortgage loans interest income” and “TCCA fees,” respectively, in our condensed consolidated statements of operations and
FANNIE MAE(In conservatorship)
NOTES TO CONDENSED CONSOLIDATED FINANCIAL STATEMENTS - (Continued)(UNAUDITED)
71
comprehensive income. We recognized $440 million and $382 million for the three months ended March 31, 2016 and 2015, respectively, of which $440 million had not been remitted to Treasury as of March 31, 2016.
We incurred expenses in connection with certain funding obligations under the GSE Act, a portion of which is attributable to Treasury’s Capital Magnet and HOPE Funds. These expenses, recognized in “Other expenses (income), net” in our condensed consolidated statements of operations and comprehensive income, were measured as the product of 4.2 basis points and the unpaid principal balance of our total new business purchases for the respective period. We recognized $25 million and $18 million in other expenses in connection with Treasury’s Capital Magnet and HOPE Funds for the three months ended March 31, 2016 and 2015, respectively, of which $25 million had not been remitted as of March 31, 2016. During the three months ended March 31, 2016, we made payments of $111 million to Treasury’s Capital Magnet and HOPE Funds.
In addition to the transactions with Treasury mentioned above, we also purchase and sell Treasury securities in the normal course of business. As of March 31, 2016 and December 31, 2015, we held Treasury securities with a fair value of $30.7 billion and $29.5 billion, respectively, and accrued interest receivable of $23 million and $15 million, respectively. We recognized interest income on these securities held by us of $32 million and $4 million for the three months ended March 31, 2016 and 2015, respectively.
Transactions with Freddie Mac
As of March 31, 2016 and December 31, 2015, we held Freddie Mac mortgage-related securities with a fair value of $4.6 billion and $5.6 billion, respectively, and accrued interest receivable of $18 million and $22 million, respectively. We recognized interest income on these securities held by us of $45 million and $61 million for the three months ended March 31, 2016 and 2015, respectively. In addition, Freddie Mac may be an investor in variable interest entities (“VIEs”) that we have consolidated, and we may be an investor in VIEs that Freddie Mac has consolidated.
Transactions with FHFA
The GSE Act authorizes FHFA to establish an annual assessment for regulated entities, including Fannie Mae, which is payable on a semi-annual basis (April and October), for FHFA’s costs and expenses, as well as to maintain FHFA’s working capital. We recognized FHFA assessment fees, which are recorded in “Administrative expenses” in our condensed consolidated statements of operations and comprehensive income, of $28 million for the three months ended March 31, 2016 and 2015.
Transactions with CSS
In connection with our jointly owned company with Freddie Mac, for the three months ended March 31, 2016 and 2015, we contributed $30 million and $13 million, respectively, of capital into CSS. No other transactions outside of normal business activities have occurred between us and Freddie Mac during the three months ended March 31, 2016 and 2015.
Use of EstimatesPreparing condensed consolidated financial statements in accordance with GAAP requires management to make estimates and assumptions that affect our reported amounts of assets and liabilities, and disclosure of contingent assets and liabilities as of the dates of our condensed consolidated financial statements, as well as our reported amounts of revenues and expenses during the reporting periods. Management has made significant estimates in a variety of areas including, but not limited to, valuation of certain financial instruments and other assets and liabilities, recoverability of our deferred tax assets and allowance for loan losses. Actual results could be different from these estimates.
On January 1, 2015, we adopted regulatory guidance issued by FHFA which prescribes, among other things, guidance on when a loan should be charged off. This change in estimate resulted in the recognition on January 1, 2015 of (1) $1.8 billion in charge-offs of held for investment loans, (2) $724 million in charge-offs of preforeclosure property taxes and insurance receivable and (3) a reduction to our allowance for loan losses and our allowance for preforeclosure property taxes and insurance receivable in amounts equal to charge-offs recognized in connection with held for investment loans and preforeclosure property taxes and insurance receivable.
For the majority of our delinquent single-family loans, we charge off the loan at the date of foreclosure or other liquidation event (such as a deed-in-lieu of foreclosure or a short sale). For a subset of delinquent single-family loans, we charge off the portion of the loans that is deemed uncollectible prior to foreclosure when the loans have been delinquent for a specified length of time and meet specified mark-to-market loan-to-value (“LTV”) ratios. We continue to enhance our data collection and analysis efforts to further refine our loss estimates as we obtain incremental information on the performance of our loans.
FANNIE MAE(In conservatorship)
NOTES TO CONDENSED CONSOLIDATED FINANCIAL STATEMENTS - (Continued)(UNAUDITED)
72
DebtWe issue debt in the form of credit risk transfer notes under the Connecticut Avenue Securities (“CAS”) program where repayment of the debt is linked to a reference portfolio of mortgage loans. We account for CAS notes issued in 2016 at amortized cost. As credit events occur and the principal balance of these CAS notes is legally reduced, we recognize an extinguishment gain. We elected the fair value option on CAS notes that were issued prior to 2016.
New Accounting GuidanceEffective January 1, 2016, we adopted guidance regarding consolidation of legal entities such as limited partnerships, limited liability corporations and securitization structures. The impact of the adoption was not material to our condensed consolidated financial statements.
In February 2016, the Financial Accounting Standards Board (“FASB”) issued guidance on leases. The guidance clarified the definition of a lease and requires lessees to recognize on the balance sheet a right-of-use asset, representing its right to use the underlying asset for the lease term, and a corresponding lease liability for all leases with terms greater than 12 months. This guidance supersedes the existing lease guidance; however, we must continue to classify leases to determine how to recognize lease-related expense in our condensed consolidated statements of operations and comprehensive income. The new guidance is effective for us on January 1, 2019. We have evaluated this guidance and determined it will not have a material impact on our condensed consolidated financial statements.
2. Consolidations and Transfers of Financial AssetsWe have interests in various entities that are considered to be VIEs. The primary types of entities are securitization trusts guaranteed by us via lender swap and portfolio securitization transactions and mortgage-backed trusts that were not created by us, as well as housing partnerships that are established to finance the acquisition, construction, development or rehabilitation of affordable multifamily and single-family housing. These interests include investments in securities issued by VIEs, such as Fannie Mae MBS created pursuant to our securitization transactions and our guaranty to the entity. We consolidate the substantial majority of our single-class securitization trusts because our role as guarantor and master servicer provides us with the power to direct matters (primarily the servicing of mortgage loans) that impact the credit risk to which we are exposed. In contrast, we do not consolidate single-class securitization trusts when other organizations have the power to direct these activities.
We continually assess whether we are the primary beneficiary of the VIEs with which we are involved and therefore may consolidate or deconsolidate a VIE through the duration of our involvement. Examples of certain events that may change whether or not we consolidate the VIE include a change in the design of the entity or a change in our ownership in the entity such that we no longer hold substantially all of the certificates issued by a multi-class securitization trust. As of March 31, 2016, we consolidated certain VIEs that were not consolidated as of December 31, 2015. As a result of consolidating these entities, which had combined total assets of $135 million in unpaid principal balance as of March 31, 2016, we derecognized our investment in these entities and recognized the assets and liabilities of the consolidated entities at fair value. As of March 31, 2016, we also deconsolidated certain VIEs that were consolidated as of December 31, 2015. As a result of deconsolidating these entities, which had combined total assets of $3.0 billion in unpaid principal balance as of December 31, 2015, we derecognized the assets and liabilities of the entities and recognized at fair value our retained interests as securities in our condensed consolidated balance sheets.
FANNIE MAE(In conservatorship)
NOTES TO CONDENSED CONSOLIDATED FINANCIAL STATEMENTS - (Continued)(UNAUDITED)
73
Unconsolidated VIEsWe do not consolidate VIEs when we are not deemed to be the primary beneficiary. Our unconsolidated VIEs include securitization trusts and limited partnerships. The following table displays the carrying amount and classification of our assets and liabilities that relate to our involvement with unconsolidated mortgage-backed trusts.
As ofMarch 31, 2016 December 31, 2015
(Dollars in millions)
Assets and liabilities recorded in our condensed consolidated balance sheets related tomortgage-backed trusts:Assets:
Trading securities:Fannie Mae . . . . . . . . . . . . . . . . . . . . . . . . . . . . . . . . . . . . . . . . . . . . . . . . . . . . . . $ 5,270 $ 4,704Non-Fannie Mae . . . . . . . . . . . . . . . . . . . . . . . . . . . . . . . . . . . . . . . . . . . . . . . . . . 3,816 5,596
Total trading securities . . . . . . . . . . . . . . . . . . . . . . . . . . . . . . . . . . . . . . . . . . . . 9,086 10,300Available-for-sale securities:
Fannie Mae . . . . . . . . . . . . . . . . . . . . . . . . . . . . . . . . . . . . . . . . . . . . . . . . . . . . . . 3,833 3,936Non-Fannie Mae . . . . . . . . . . . . . . . . . . . . . . . . . . . . . . . . . . . . . . . . . . . . . . . . . . 11,829 14,644
Total available-for-sale securities. . . . . . . . . . . . . . . . . . . . . . . . . . . . . . . . . . . . 15,662 18,580Other assets . . . . . . . . . . . . . . . . . . . . . . . . . . . . . . . . . . . . . . . . . . . . . . . . . . . . . . . 84 100
Other liabilities . . . . . . . . . . . . . . . . . . . . . . . . . . . . . . . . . . . . . . . . . . . . . . . . . . . . . . . (691) (827)Net carrying amount. . . . . . . . . . . . . . . . . . . . . . . . . . . . . . . . . . . . . . . . . . . . . . . . . . . $ 24,141 $ 28,153
Our maximum exposure to loss generally represents the greater of our recorded investment in the entity or the unpaid principal balance of the assets covered by our guaranty. However, our securities issued by Fannie Mae multi-class resecuritization trusts that are not consolidated do not give rise to any additional exposure to loss as we already consolidate the underlying collateral. The maximum exposure to loss related to unconsolidated mortgage-backed trusts was approximately $30 billion and $34 billion as of March 31, 2016 and December 31, 2015, respectively. The total assets of our unconsolidated mortgage-backed trusts were approximately $180 billion and $220 billion as of March 31, 2016 and December 31, 2015, respectively.
The maximum exposure to loss for our unconsolidated limited partnerships and similar legal entities, which consist of low-income housing tax credit investments, community investments and other entities, was $133 million and its related carrying value was $100 million as of March 31, 2016. As of December 31, 2015, the maximum exposure to loss was $12 million and its related carrying value was a deficit of $24 million. The total assets of these limited partnership investments were $5.1 billion and $4.9 billion as of March 31, 2016 and December 31, 2015, respectively.
The unpaid principal balance of our multifamily loan portfolio was $206.0 billion as of March 31, 2016. As our lending relationship does not provide us with a controlling financial interest in the borrower entity, we do not consolidate these borrowers regardless of their status as either a VIE or a voting interest entity. We have excluded these entities from our VIE disclosures. However, the disclosures we have provided in “Note 3, Mortgage Loans,” “Note 4, Allowance for Loan Losses” and “Note 6, Financial Guarantees” with respect to this population are consistent with the FASB’s stated objectives for the disclosures related to unconsolidated VIEs.
Transfers of Financial AssetsWe issue Fannie Mae MBS through portfolio securitization transactions by transferring pools of mortgage loans or mortgage-related securities to one or more trusts or special purpose entities. We are considered to be the transferor when we transfer assets from our own retained mortgage portfolio in a portfolio securitization transaction. For the three months ended March 31, 2016 and 2015, the unpaid principal balance of portfolio securitizations was $48.3 billion and $48.9 billion, respectively.
We retain interests from the transfer and sale of mortgage-related securities to unconsolidated single-class and multi-class portfolio securitization trusts. As of March 31, 2016, the unpaid principal balance of retained interests was $5.4 billion and its related fair value was $7.3 billion. The unpaid principal balance of retained interests was $5.5 billion and its related fair value

FANNIE MAE(In conservatorship)
NOTES TO CONDENSED CONSOLIDATED FINANCIAL STATEMENTS - (Continued)(UNAUDITED)
74
was $6.8 billion as of December 31, 2015. For the three months ended March 31, 2016 and 2015, the principal and interest received on retained interests was $308 million and $350 million, respectively.
Managed LoansManaged loans are on-balance sheet mortgage loans, as well as mortgage loans that we have securitized in unconsolidated portfolio securitization trusts. The unpaid principal balance of securitized loans in unconsolidated portfolio securitization trusts, which are primarily loans that are guaranteed or insured, in whole or in part, by the U.S. government, was $1.5 billion and $1.6 billion as of March 31, 2016 and December 31, 2015, respectively. For information on our on-balance sheet mortgage loans, see “Note 3, Mortgage Loans.”
3. Mortgage Loans
We own single-family mortgage loans, which are secured by four or fewer residential dwelling units, and multifamily mortgage loans, which are secured by five or more residential dwelling units. We classify these loans as either held for investment (“HFI”) or held for sale (“HFS”). We report the carrying value of HFI loans at the unpaid principal balance, net of unamortized premiums and discounts, other cost basis adjustments, and an allowance for loan losses. We report the carrying value of HFS loans at the lower of cost or fair value and record valuation changes in our condensed consolidated statements of operations and comprehensive income. We define the recorded investment of HFI loans as unpaid principal balance, net of unamortized premiums and discounts, other cost basis adjustments, and accrued interest receivable.
For purposes of the single-family mortgage loan disclosures below, we define “primary” class as mortgage loans that are not included in other loan classes; “government” class as mortgage loans guaranteed or insured, in whole or in part, by the U.S. government or one of its agencies, that are not Alt-A; and “other” class as loans with higher-risk characteristics, such as interest-only loans and negative-amortizing loans, that are neither government nor Alt-A.
The following table displays the carrying value of our mortgage loans.
As ofMarch 31, 2016 December 31, 2015
Of FannieMae
OfConsolidated
Trusts TotalOf Fannie
Mae
OfConsolidated
Trusts Total(Dollars in millions)
Single-family . . . . . . . . . . . . . . . . . . . . . . . . $ 233,244 $ 2,573,346 $ 2,806,590 $ 238,237 $ 2,574,174 $ 2,812,411Multifamily. . . . . . . . . . . . . . . . . . . . . . . . . . 12,751 193,228 205,979 13,099 185,243 198,342
Total unpaid principal balance ofmortgage loans . . . . . . . . . . . . . . . . . . . . 245,995 2,766,574 3,012,569 251,336 2,759,417 3,010,753
Cost basis and fair value adjustments, net . . (12,686) 50,883 38,197 (12,939) 49,781 36,842Allowance for loan losses for loans held for
investment. . . . . . . . . . . . . . . . . . . . . . . . . (24,557) (1,262) (25,819) (26,510) (1,441) (27,951)Total mortgage loans . . . . . . . . . . . . . $ 208,752 $ 2,816,195 $ 3,024,947 $ 211,887 $ 2,807,757 $ 3,019,644
During the three months ended March 31, 2016 and 2015, we redesignated loans with a carrying value of $596 million and $330 million, respectively, from HFI to HFS. We sold loans with an unpaid principal balance of $1.1 billion during the three months ended March 31, 2016. There were no sales of loans during the three months ended March 31, 2015.
The recorded investment of single-family mortgage loans for which formal foreclosure proceedings are in process was $24.3 billion and $25.6 billion as of March 31, 2016 and December 31, 2015, respectively. As a result of our various loss mitigation and foreclosure prevention efforts, we expect that a portion of the loans in the process of formal foreclosure proceedings will not ultimately foreclose.
Nonaccrual LoansWe discontinue accruing interest on loans when we believe collectibility of principal or interest is not reasonably assured, which for a single-family loan we have determined, based on our historical experience, to be when the loan becomes two months or more past due according to its contractual terms. Interest previously accrued but not collected is reversed through interest income at the date a loan is placed on nonaccrual status. We return a non-modified single-family loan to accrual status at the point that the borrower brings the loan current. We return a modified single-family loans to accrual status at the

FANNIE MAE(In conservatorship)
NOTES TO CONDENSED CONSOLIDATED FINANCIAL STATEMENTS - (Continued)(UNAUDITED)
75
point that the borrower successfully makes all required payments during the trial period (generally three to four months) and the modification is made permanent. We place a multifamily loan on nonaccrual status when the loan becomes three months or more past due according to its contractual terms or is deemed to be individually impaired, unless the loan is well secured such that collectibility of principal and accrued interest is reasonably assured. We return a multifamily loan to accrual status when the borrower cures the delinquency of the loan or we otherwise determine that the loan is well secured such that collectibility is reasonably assured.
Aging AnalysisThe following tables display an aging analysis of the total recorded investment in our HFI mortgage loans by portfolio segment and class, excluding loans for which we have elected the fair value option.
As of March 31, 2016
30 - 59 Days
Delinquent
60 - 89Days
DelinquentSeriously
Delinquent(1)Total
Delinquent Current Total
RecordedInvestment
in Loans90 Days or
MoreDelinquent
andAccruingInterest
RecordedInvestment
inNonaccrual
Loans(Dollars in millions)
Single-family:Primary . . . . . . . . . . . . . $ 24,913 $ 6,564 $ 24,390 $ 55,867 $ 2,608,768 $ 2,664,635 $ 42 $ 35,108Government(2) . . . . . . . . 51 20 273 344 39,731 40,075 273 —Alt-A . . . . . . . . . . . . . . . 3,488 1,083 5,559 10,130 82,596 92,726 6 7,359Other . . . . . . . . . . . . . . . 1,291 412 1,930 3,633 31,192 34,825 3 2,604
Total single-family . . . 29,743 8,079 32,152 69,974 2,762,287 2,832,261 324 45,071Multifamily(3) . . . . . . . . . . 41 N/A 125 166 207,790 207,956 — 547
Total . . . . . . . . . . . . $ 29,784 $ 8,079 $ 32,277 $ 70,140 $ 2,970,077 $ 3,040,217 $ 324 $ 45,618
As of December 31, 2015
30 - 59 Days
Delinquent
60 - 89Days
DelinquentSeriously
Delinquent(1)Total
Delinquent Current Total
RecordedInvestment
in Loans90 Days or
MoreDelinquent
andAccruingInterest
Recorded Investment
in Nonaccrual
Loans
(Dollars in millions)Single-family:
Primary . . . . . . . . . . . . . $ 29,154 $ 7,937 $ 26,346 $ 63,437 $ 2,598,756 $ 2,662,193 $ 46 $ 34,216Government(2) . . . . . . . . 58 24 291 373 40,461 40,834 291 —Alt-A . . . . . . . . . . . . . . . 4,085 1,272 6,141 11,498 84,603 96,101 6 7,407Other . . . . . . . . . . . . . . . 1,494 484 2,160 4,138 32,272 36,410 6 2,632
Total single-family . . . 34,791 9,717 34,938 79,446 2,756,092 2,835,538 349 44,255Multifamily(3) . . . . . . . . . . 23 N/A 123 146 200,028 200,174 — 591
Total . . . . . . . . . . . . $ 34,814 $ 9,717 $ 35,061 $ 79,592 $ 2,956,120 $ 3,035,712 $ 349 $ 44,846__________(1) Single-family seriously delinquent loans are loans that are 90 days or more past due or in the foreclosure process. Multifamily seriously
delinquent loans are loans that are 60 days or more past due.(2) Primarily consists of reverse mortgages, which due to their nature, are not aged and are included in the current column.(3) Multifamily loans 60-89 days delinquent are included in the seriously delinquent column.

FANNIE MAE(In conservatorship)
NOTES TO CONDENSED CONSOLIDATED FINANCIAL STATEMENTS - (Continued)(UNAUDITED)
76
Credit Quality Indicators The following table displays the total recorded investment in our single-family HFI loans by class and credit quality indicator, excluding loans for which we have elected the fair value option.
As of March 31, 2016(1) December 31, 2015(1)
Primary Alt-A Other Primary Alt-A Other(Dollars in millions)
Estimated mark-to-market LTV ratio:(2)
Less than or equal to 80% . . . . . . . . . . . . . . . . . . . . . . . . . . . . $2,216,911 $ 57,304 $20,615 $2,228,533 $ 59,000 $21,274Greater than 80% and less than or equal to 90%. . . . . . . . . . . 255,504 11,966 4,619 250,373 12,588 4,936Greater than 90% and less than or equal to 100%. . . . . . . . . . 133,225 8,965 3,602 122,939 9,345 3,861Greater than 100% and less than or equal to 110%. . . . . . . . . 27,604 5,984 2,478 27,875 6,231 2,596Greater than 110% and less than or equal to 120% . . . . . . . . 14,175 3,633 1,512 14,625 3,730 1,592Greater than 120% and less than or equal to 125% . . . . . . . . 4,361 1,163 484 4,520 1,260 545Greater than 125% . . . . . . . . . . . . . . . . . . . . . . . . . . . . . . . . . . 12,855 3,711 1,515 13,328 3,947 1,606
Total . . . . . . . . . . . . . . . . . . . . . . . . . . . . . . . . . . . . . . . . . . . $2,664,635 $ 92,726 $34,825 $2,662,193 $ 96,101 $36,410__________(1) Excludes $40.1 billion and $40.8 billion as of March 31, 2016 and December 31, 2015, respectively, of mortgage loans guaranteed or
insured, in whole or in part, by the U.S. government or one of its agencies, that are not Alt-A loans. The segment class is primarily reverse mortgages for which we do not calculate an estimated mark-to-market LTV ratio.
(2) The aggregate estimated mark-to-market LTV ratio is based on the unpaid principal balance of the loan as of the end of each reported period divided by the estimated current value of the property, which we calculate using an internal valuation model that estimates periodic changes in home value.
The following table displays the total recorded investment in our multifamily HFI loans by credit quality indicator, excluding loans for which we have elected the fair value option.
As ofMarch 31, December 31,
2016 2015(Dollars in millions)
Credit risk profile by internally assigned grade:(1)
Pass. . . . . . . . . . . . . . . . . . . . . . . . . . . . . . . . . . . . . . . . . . . . . . . . . . . . . . . . . . . . . . . . . . . . . . $ 202,213 $194,132Special Mention . . . . . . . . . . . . . . . . . . . . . . . . . . . . . . . . . . . . . . . . . . . . . . . . . . . . . . . . . . . . 3,145 3,202Substandard . . . . . . . . . . . . . . . . . . . . . . . . . . . . . . . . . . . . . . . . . . . . . . . . . . . . . . . . . . . . . . . 2,597 2,833Doubtful . . . . . . . . . . . . . . . . . . . . . . . . . . . . . . . . . . . . . . . . . . . . . . . . . . . . . . . . . . . . . . . . . . 1 7
Total . . . . . . . . . . . . . . . . . . . . . . . . . . . . . . . . . . . . . . . . . . . . . . . . . . . . . . . . . . . . . . . . . . . . $ 207,956 $200,174_________(1) Pass (loan is current and adequately protected by the current financial strength and debt service capacity of the borrower); special
mention (loan with signs of potential weakness); substandard (loan with a well defined weakness that jeopardizes the timely full repayment); and doubtful (loan with a weakness that makes collection or liquidation in full highly questionable and improbable based on existing conditions and values).

FANNIE MAE(In conservatorship)
NOTES TO CONDENSED CONSOLIDATED FINANCIAL STATEMENTS - (Continued)(UNAUDITED)
77
Individually Impaired LoansIndividually impaired loans include troubled debt restructurings (“TDRs”), acquired credit-impaired loans and multifamily loans that we have assessed as probable that we will not collect all contractual amounts due, regardless of whether we are currently accruing interest; excluding loans classified as HFS. The following tables display the total unpaid principal balance, recorded investment, related allowance, average recorded investment and interest income recognized for individually impaired loans.
As of
March 31, 2016 December 31, 2015
UnpaidPrincipalBalance
TotalRecorded
Investment
RelatedAllowancefor LoanLosses
UnpaidPrincipalBalance
TotalRecorded
Investment
RelatedAllowancefor LoanLosses
(Dollars in millions)
Individually impaired loans:
With related allowance recorded:
Single-family:
Primary . . . . . . . . . . . . . . . . . . . . . . . . . . . . . . . . . . . . . . . $ 113,863 $ 108,108 $ 15,657 $ 116,477 $ 110,502 $ 16,745Government . . . . . . . . . . . . . . . . . . . . . . . . . . . . . . . . . . . 316 320 59 322 327 59Alt-A. . . . . . . . . . . . . . . . . . . . . . . . . . . . . . . . . . . . . . . . . 30,969 28,261 5,768 31,888 29,103 6,217Other . . . . . . . . . . . . . . . . . . . . . . . . . . . . . . . . . . . . . . . . . 12,503 11,821 2,239 12,893 12,179 2,416
Total single-family. . . . . . . . . . . . . . . . . . . . . . . . . . . . . 157,651 148,510 23,723 161,580 152,111 25,437Multifamily . . . . . . . . . . . . . . . . . . . . . . . . . . . . . . . . . . . . . 575 577 71 650 654 80Total individually impaired loans with related allowance
recorded. . . . . . . . . . . . . . . . . . . . . . . . . . . . . . . . . . . . . . 158,226 149,087 23,794 162,230 152,765 25,517
With no related allowance recorded:(1)
Single-family:
Primary . . . . . . . . . . . . . . . . . . . . . . . . . . . . . . . . . . . . . . . 16,410 15,214 — 15,891 14,725 —Government . . . . . . . . . . . . . . . . . . . . . . . . . . . . . . . . . . . 63 59 — 58 54 —Alt-A. . . . . . . . . . . . . . . . . . . . . . . . . . . . . . . . . . . . . . . . . 3,939 3,376 — 3,721 3,169 —Other . . . . . . . . . . . . . . . . . . . . . . . . . . . . . . . . . . . . . . . . . 1,252 1,125 — 1,222 1,102 —
Total single-family. . . . . . . . . . . . . . . . . . . . . . . . . . . . . 21,664 19,774 — 20,892 19,050 —Multifamily . . . . . . . . . . . . . . . . . . . . . . . . . . . . . . . . . . . . . 344 345 — 353 354 —Total individually impaired loans with no related
allowance recorded . . . . . . . . . . . . . . . . . . . . . . . . . . . . . 22,008 20,119 — 21,245 19,404 —Total individually impaired loans(2) . . . . . . . . . . . . . . . . . . . . $ 180,234 $ 169,206 $ 23,794 $ 183,475 $ 172,169 $ 25,517
FANNIE MAE(In conservatorship)
NOTES TO CONDENSED CONSOLIDATED FINANCIAL STATEMENTS - (Continued)(UNAUDITED)
78
For the Three Months Ended March 31,
2016 2015
AverageRecorded
Investment
Total Interest Income
Recognized(3)
InterestIncome
Recognizedon a Cash
Basis
AverageRecorded
Investment
Total Interest Income
Recognized(3)
InterestIncome
Recognizedon a Cash
Basis(Dollars in millions)
Individually impaired loans:
With related allowance recorded:
Single-family:
Primary . . . . . . . . . . . . . . . . . . . . . . . . . . . . . . . . . . . . . . . . . . . . $ 109,318 $ 1,021 $ 104 $ 117,721 $ 1,034 $ 104Government. . . . . . . . . . . . . . . . . . . . . . . . . . . . . . . . . . . . . . . . . 323 3 — 282 3 —Alt-A . . . . . . . . . . . . . . . . . . . . . . . . . . . . . . . . . . . . . . . . . . . . . . 28,665 253 19 31,491 251 17Other . . . . . . . . . . . . . . . . . . . . . . . . . . . . . . . . . . . . . . . . . . . . . . 12,013 92 8 13,416 94 7
Total single-family. . . . . . . . . . . . . . . . . . . . . . . . . . . . . . . . . . 150,319 1,369 131 162,910 1,382 128Multifamily . . . . . . . . . . . . . . . . . . . . . . . . . . . . . . . . . . . . . . . . . . 616 5 — 1,229 3 —Total individually impaired loans with related allowance
recorded . . . . . . . . . . . . . . . . . . . . . . . . . . . . . . . . . . . . . . . . . . . 150,935 1,374 131 164,139 1,385 128
With no related allowance recorded:(1)
Single-family:
Primary . . . . . . . . . . . . . . . . . . . . . . . . . . . . . . . . . . . . . . . . . . . . 15,241 268 20 16,249 247 41Government. . . . . . . . . . . . . . . . . . . . . . . . . . . . . . . . . . . . . . . . . 57 1 — 59 1 —Alt-A . . . . . . . . . . . . . . . . . . . . . . . . . . . . . . . . . . . . . . . . . . . . . . 3,367 62 3 3,736 44 7Other . . . . . . . . . . . . . . . . . . . . . . . . . . . . . . . . . . . . . . . . . . . . . . 1,135 22 1 1,301 18 2
Total single-family. . . . . . . . . . . . . . . . . . . . . . . . . . . . . . . . . . 19,800 353 24 21,345 310 50Multifamily . . . . . . . . . . . . . . . . . . . . . . . . . . . . . . . . . . . . . . . . . . 350 3 — 541 1 —Total individually impaired loans with no related allowance
recorded . . . . . . . . . . . . . . . . . . . . . . . . . . . . . . . . . . . . . . . . . . . 20,150 356 24 21,886 311 50Total individually impaired loans . . . . . . . . . . . . . . . . . . . . . . . . . . . $ 171,085 $ 1,730 $ 155 $ 186,025 $ 1,696 $ 178
__________(1) The discounted cash flows or collateral value equals or exceeds the carrying value of the loan and, as such, no valuation allowance is
required.(2) Includes single-family loans restructured in a TDR with a recorded investment of $167.5 billion and $170.3 billion as of March 31,
2016 and December 31, 2015, respectively. Includes multifamily loans restructured in a TDR with a recorded investment of $411 million and $451 million as of March 31, 2016 and December 31, 2015, respectively.
(3) Total single-family interest income recognized of $1.7 billion for the three months ended March 31, 2016 consists of $1.4 billion of contractual interest and $310 million of effective yield adjustments. Total single-family interest income recognized of $1.7 billion for the three months ended March 31, 2015 consists of $1.4 billion of contractual interest and $276 million of effective yield adjustments.
Troubled Debt RestructuringsA modification to the contractual terms of a loan that results in granting a concession to a borrower experiencing financial difficulties is considered a TDR. In addition to formal loan modifications, we also engage in other loss mitigation activities with troubled borrowers, which include repayment plans and forbearance arrangements, both of which represent informal agreements with the borrower that do not result in the legal modification of the loan’s contractual terms. We account for these informal restructurings as a TDR if we defer more than three missed payments. We also classify loans to certain borrowers who have received bankruptcy relief as TDRs.
The substantial majority of the loan modifications we complete result in term extensions, interest rate reductions or a combination of both. During the three months ended March 31, 2016 and 2015, the average term extension of a single-family modified loan was 157 months and 161 months, respectively, and the average interest rate reduction was 0.73 and 0.77 percentage points, respectively.
FANNIE MAE(In conservatorship)
NOTES TO CONDENSED CONSOLIDATED FINANCIAL STATEMENTS - (Continued)(UNAUDITED)
79
The following table displays the number of loans and recorded investment in loans restructured in a TDR.
For the Three Months Ended March 31,2016 2015
Number ofLoans
Recorded
InvestmentNumber of
LoansRecorded
Investment(Dollars in millions)
Single-family:Primary . . . . . . . . . . . . . . . . . . . . . . . . . . . . . . . . . . . . . . . . . . . . . . . 17,190 $ 2,332 21,407 $ 2,945Government . . . . . . . . . . . . . . . . . . . . . . . . . . . . . . . . . . . . . . . . . . . . 54 6 74 8Alt-A . . . . . . . . . . . . . . . . . . . . . . . . . . . . . . . . . . . . . . . . . . . . . . . . . 1,911 270 2,789 438Other . . . . . . . . . . . . . . . . . . . . . . . . . . . . . . . . . . . . . . . . . . . . . . . . . 399 72 590 108Total single-family. . . . . . . . . . . . . . . . . . . . . . . . . . . . . . . . . . . . . . 19,554 2,680 24,860 3,499
Multifamily . . . . . . . . . . . . . . . . . . . . . . . . . . . . . . . . . . . . . . . . . . . . . . — — 3 5 Total TDRs. . . . . . . . . . . . . . . . . . . . . . . . . . . . . . . . . . . . . . . . . . . 19,554 $ 2,680 24,863 $ 3,504
The following table displays the number of loans and our recorded investment in these loans at the time of payment default for loans that were restructured in a TDR in the twelve months prior to the payment default. For purposes of this disclosure, we define loans that had a payment default as: single-family and multifamily loans with completed TDRs that liquidated during the period, either through foreclosure, deed-in-lieu of foreclosure or a short sale; single-family loans with completed modifications that are two or more months delinquent during the period; or multifamily loans with completed modifications that are one or more months delinquent during the period.
For the Three Months Ended March 31,2016 2015
Number ofLoans
Recorded
InvestmentNumber of
LoansRecorded
Investment(Dollars in millions)
Single-family:Primary . . . . . . . . . . . . . . . . . . . . . . . . . . . . . . . . . . . . . . . . . . . . . . . 5,461 $ 802 6,723 $ 1,003Government . . . . . . . . . . . . . . . . . . . . . . . . . . . . . . . . . . . . . . . . . . . . 15 2 20 3Alt-A . . . . . . . . . . . . . . . . . . . . . . . . . . . . . . . . . . . . . . . . . . . . . . . . . 852 144 1,153 203Other . . . . . . . . . . . . . . . . . . . . . . . . . . . . . . . . . . . . . . . . . . . . . . . . . 243 49 304 66Total single-family. . . . . . . . . . . . . . . . . . . . . . . . . . . . . . . . . . . . . . 6,571 997 8,200 1,275
Multifamily . . . . . . . . . . . . . . . . . . . . . . . . . . . . . . . . . . . . . . . . . . . . . . — — 2 4 Total TDRs that subsequently defaulted . . . . . . . . . . . . . . . . . . . . 6,571 $ 997 8,202 $ 1,279
4. Allowance for Loan LossesWe maintain an allowance for loan losses for HFI loans held by Fannie Mae and loans backing Fannie Mae MBS issued from consolidated trusts. When calculating our allowance for loan losses, we consider our net recorded investment in the loan at the balance sheet date, which includes unpaid principal balance, net of amortized premiums and discounts, and other cost basis adjustments. We record charge-offs as a reduction to the allowance for loan losses when losses are confirmed through the receipt of assets in full satisfaction of a loan, such as the underlying collateral upon foreclosure or cash upon completion of a short sale. Additionally, we record charge-offs as a reduction to our allowance for loan losses when a loan is determined to be uncollectible or upon the redesignation of nonperforming loans from HFI to HFS.
We aggregate single-family HFI loans that are not individually impaired based on similar risk characteristics for purposes of estimating incurred credit losses and establishing a collective single-family loss reserve using an econometric model that derives an overall loss reserve estimate. We base our allowance methodology on historical events and trends, such as loss severity (in event of default), default rates, and recoveries from mortgage insurance contracts and other credit enhancements. In addition, management performs a review of the observable data used in its estimate to ensure it is representative of prevailing economic conditions and other events existing as of the balance sheet date.
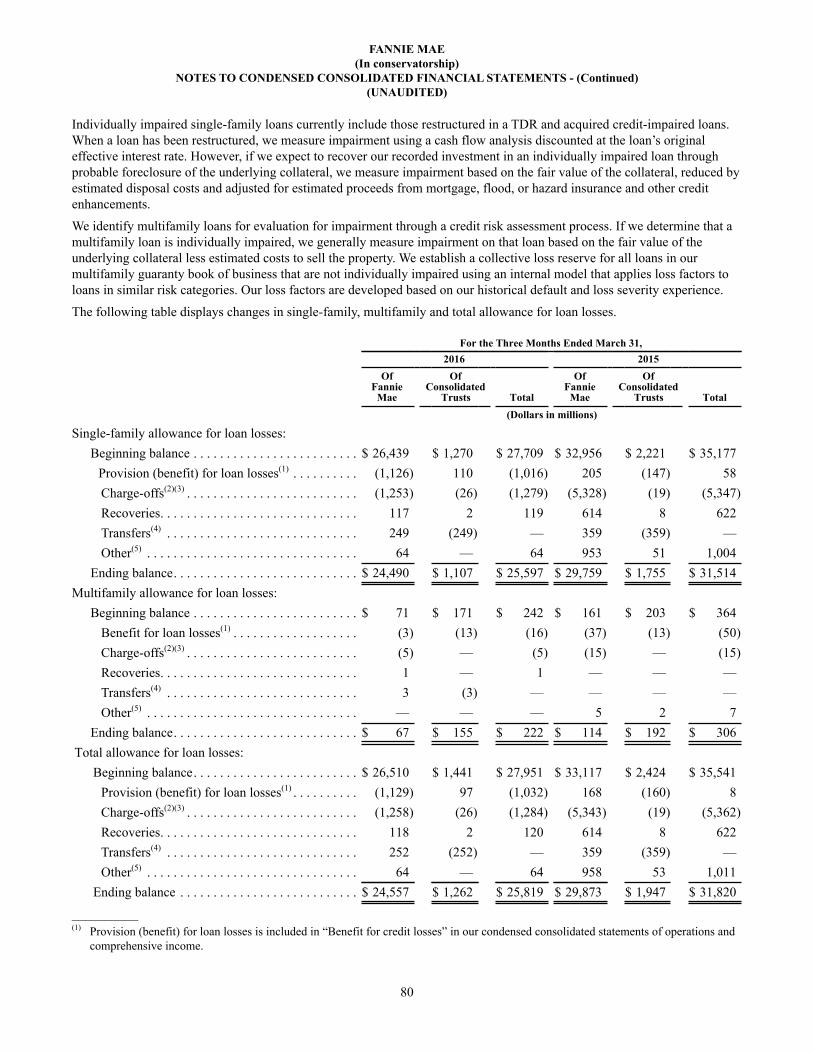
FANNIE MAE(In conservatorship)
NOTES TO CONDENSED CONSOLIDATED FINANCIAL STATEMENTS - (Continued)(UNAUDITED)
80
Individually impaired single-family loans currently include those restructured in a TDR and acquired credit-impaired loans. When a loan has been restructured, we measure impairment using a cash flow analysis discounted at the loan’s original effective interest rate. However, if we expect to recover our recorded investment in an individually impaired loan through probable foreclosure of the underlying collateral, we measure impairment based on the fair value of the collateral, reduced by estimated disposal costs and adjusted for estimated proceeds from mortgage, flood, or hazard insurance and other credit enhancements.
We identify multifamily loans for evaluation for impairment through a credit risk assessment process. If we determine that a multifamily loan is individually impaired, we generally measure impairment on that loan based on the fair value of the underlying collateral less estimated costs to sell the property. We establish a collective loss reserve for all loans in our multifamily guaranty book of business that are not individually impaired using an internal model that applies loss factors to loans in similar risk categories. Our loss factors are developed based on our historical default and loss severity experience.
The following table displays changes in single-family, multifamily and total allowance for loan losses.
For the Three Months Ended March 31,2016 2015
OfFannie
Mae
OfConsolidated
Trusts Total
OfFannie
Mae
OfConsolidated
Trusts Total(Dollars in millions)
Single-family allowance for loan losses:Beginning balance . . . . . . . . . . . . . . . . . . . . . . . . . $ 26,439 $ 1,270 $ 27,709 $ 32,956 $ 2,221 $ 35,177
Provision (benefit) for loan losses(1) . . . . . . . . . . (1,126) 110 (1,016) 205 (147) 58Charge-offs(2)(3) . . . . . . . . . . . . . . . . . . . . . . . . . . (1,253) (26) (1,279) (5,328) (19) (5,347)Recoveries. . . . . . . . . . . . . . . . . . . . . . . . . . . . . . 117 2 119 614 8 622Transfers(4) . . . . . . . . . . . . . . . . . . . . . . . . . . . . . 249 (249) — 359 (359) —Other(5) . . . . . . . . . . . . . . . . . . . . . . . . . . . . . . . . 64 — 64 953 51 1,004
Ending balance. . . . . . . . . . . . . . . . . . . . . . . . . . . . $ 24,490 $ 1,107 $ 25,597 $ 29,759 $ 1,755 $ 31,514Multifamily allowance for loan losses:
Beginning balance . . . . . . . . . . . . . . . . . . . . . . . . . $ 71 $ 171 $ 242 $ 161 $ 203 $ 364Benefit for loan losses(1) . . . . . . . . . . . . . . . . . . . (3) (13) (16) (37) (13) (50)Charge-offs(2)(3) . . . . . . . . . . . . . . . . . . . . . . . . . . (5) — (5) (15) — (15)Recoveries. . . . . . . . . . . . . . . . . . . . . . . . . . . . . . 1 — 1 — — —Transfers(4) . . . . . . . . . . . . . . . . . . . . . . . . . . . . . 3 (3) — — — —Other(5) . . . . . . . . . . . . . . . . . . . . . . . . . . . . . . . . — — — 5 2 7
Ending balance. . . . . . . . . . . . . . . . . . . . . . . . . . . . $ 67 $ 155 $ 222 $ 114 $ 192 $ 306Total allowance for loan losses:
Beginning balance. . . . . . . . . . . . . . . . . . . . . . . . . $ 26,510 $ 1,441 $ 27,951 $ 33,117 $ 2,424 $ 35,541Provision (benefit) for loan losses(1) . . . . . . . . . . (1,129) 97 (1,032) 168 (160) 8Charge-offs(2)(3) . . . . . . . . . . . . . . . . . . . . . . . . . . (1,258) (26) (1,284) (5,343) (19) (5,362)Recoveries. . . . . . . . . . . . . . . . . . . . . . . . . . . . . . 118 2 120 614 8 622Transfers(4) . . . . . . . . . . . . . . . . . . . . . . . . . . . . . 252 (252) — 359 (359) —Other(5) . . . . . . . . . . . . . . . . . . . . . . . . . . . . . . . . 64 — 64 958 53 1,011
Ending balance . . . . . . . . . . . . . . . . . . . . . . . . . . . $ 24,557 $ 1,262 $ 25,819 $ 29,873 $ 1,947 $ 31,820__________(1) Provision (benefit) for loan losses is included in “Benefit for credit losses” in our condensed consolidated statements of operations and
comprehensive income.

FANNIE MAE(In conservatorship)
NOTES TO CONDENSED CONSOLIDATED FINANCIAL STATEMENTS - (Continued)(UNAUDITED)
81
(2) While we purchase the substantial majority of loans that are four or more months delinquent from our MBS trusts, we do not exercise this option to purchase loans during a forbearance period. Charge-offs of consolidated trusts generally represent loans that remained in our consolidated trusts at the time of default.
(3) Our charge-offs for 2015 reflect initial charge-offs associated with our approach to adopting the charge-off provisions of Advisory Bulletin AB 2012-02, “Framework for Adversely Classifying Loans, Other Real Estate Owned, and Other Assets and Listing Assets for Special Mention,” as well as charge-offs relating to a change in accounting policy for nonaccrual loans.
(4) Includes transfers from trusts for delinquent loan purchases.(5) Amounts represent changes in other loss reserves which are reflected in provision (benefit) for loan losses, charge-offs, and recoveries.
The following table displays the allowance for loan losses and recorded investment in our HFI loans, excluding loans for which we have elected the fair value option, by impairment or reserve methodology and portfolio segment.
As ofMarch 31, 2016 December 31, 2015
Single-Family Multifamily Total
Single-Family Multifamily Total
(Dollars in millions)
Allowance for loan losses by segment:Individually impaired loans(1) . . . . . . . . . . . . $ 23,723 $ 71 $ 23,794 $ 25,437 $ 80 $ 25,517Collectively reserved loans. . . . . . . . . . . . . . 1,874 151 2,025 2,272 162 2,434
Total allowance for loan losses . . . . . . . . $ 25,597 $ 222 $ 25,819 $ 27,709 $ 242 $ 27,951
Recorded investment in loans by segment:Individually impaired loans(1) . . . . . . . . . . . . $ 168,284 $ 922 $ 169,206 $ 171,161 $ 1,008 $ 172,169Collectively reserved loans. . . . . . . . . . . . . . 2,663,977 207,034 2,871,011 2,664,377 199,166 2,863,543
Total recorded investment in loans . . . . . $ 2,832,261 $ 207,956 $ 3,040,217 $ 2,835,538 $ 200,174 $ 3,035,712
__________(1) Includes acquired credit-impaired loans.
5. Investments in Securities
Trading SecuritiesTrading securities are recorded at fair value with subsequent changes in fair value recorded as “Fair value losses, net” in our condensed consolidated statements of operations and comprehensive income. The following table displays our investments in trading securities.
As ofMarch 31,
2016December 31,
2015(Dollars in millions)
Mortgage-related securities:Fannie Mae . . . . . . . . . . . . . . . . . . . . . . . . . . . . . . . . . . . . . . . . . . . . . . . . . . . . . . . . . . . . . . . . . . $ 5,426 $ 4,813Freddie Mac . . . . . . . . . . . . . . . . . . . . . . . . . . . . . . . . . . . . . . . . . . . . . . . . . . . . . . . . . . . . . . . . . 867 1,314Ginnie Mae . . . . . . . . . . . . . . . . . . . . . . . . . . . . . . . . . . . . . . . . . . . . . . . . . . . . . . . . . . . . . . . . . . 434 426Alt-A private-label securities . . . . . . . . . . . . . . . . . . . . . . . . . . . . . . . . . . . . . . . . . . . . . . . . . . . . 307 436Subprime private-label securities . . . . . . . . . . . . . . . . . . . . . . . . . . . . . . . . . . . . . . . . . . . . . . . . . 406 644Commercial mortgage-backed securities (“CMBS”) . . . . . . . . . . . . . . . . . . . . . . . . . . . . . . . . . . 1,451 2,341Mortgage revenue bonds . . . . . . . . . . . . . . . . . . . . . . . . . . . . . . . . . . . . . . . . . . . . . . . . . . . . . . . . 363 449
Total mortgage-related securities . . . . . . . . . . . . . . . . . . . . . . . . . . . . . . . . . . . . . . . . . . . . . . . . 9,254 10,423U.S. Treasury securities . . . . . . . . . . . . . . . . . . . . . . . . . . . . . . . . . . . . . . . . . . . . . . . . . . . . . . . . . . 30,746 29,485
Total trading securities . . . . . . . . . . . . . . . . . . . . . . . . . . . . . . . . . . . . . . . . . . . . . . . . . . . . . . . . . $40,000 $39,908

FANNIE MAE(In conservatorship)
NOTES TO CONDENSED CONSOLIDATED FINANCIAL STATEMENTS - (Continued)(UNAUDITED)
82
Available-for-Sale SecuritiesWe record available-for-sale (“AFS”) securities at fair value with unrealized gains and losses, recorded net of tax, as a component of “Other comprehensive loss” and we recognize realized gains and losses from the sale of AFS securities in “Investment gains, net” in our condensed consolidated statements of operations and comprehensive income.
The following table displays the gross realized gains, losses and proceeds on sales of AFS securities.
For the ThreeMonths Ended
March 31,2016 2015
(Dollars in millions)
Gross realized gains . . . . . . . . . . . . . . . . . . . . . . . . . . . . . . . . . . . . . . . . . . . . . . . . . . . . . . . . . . . . . . . . . . . . $ 211 $ 400Gross realized losses . . . . . . . . . . . . . . . . . . . . . . . . . . . . . . . . . . . . . . . . . . . . . . . . . . . . . . . . . . . . . . . . . . . 4 7Total proceeds (excludes initial sale of securities from new portfolio securitizations). . . . . . . . . . . . . . . . . 3,622 2,112
The following tables display the amortized cost, gross unrealized gains and losses, and fair value by major security type for AFS securities in our retained mortgage portfolio.
As of March 31, 2016
Total Amortized
Cost(1)
GrossUnrealized
Gains
Gross Unrealized
Losses(2)
TotalFair
Value(Dollars in millions)
Fannie Mae . . . . . . . . . . . . . . . . . . . . . . . . . . . . . . . . . . . . . . . . . . . . . . . . . . . $ 3,719 $ 224 $ (30) $ 3,913Freddie Mac . . . . . . . . . . . . . . . . . . . . . . . . . . . . . . . . . . . . . . . . . . . . . . . . . . 3,449 252 — 3,701Ginnie Mae . . . . . . . . . . . . . . . . . . . . . . . . . . . . . . . . . . . . . . . . . . . . . . . . . . . 221 33 — 254Alt-A private-label securities . . . . . . . . . . . . . . . . . . . . . . . . . . . . . . . . . . . . . 1,356 569 (5) 1,920Subprime private-label securities . . . . . . . . . . . . . . . . . . . . . . . . . . . . . . . . . . 1,929 620 (5) 2,544CMBS . . . . . . . . . . . . . . . . . . . . . . . . . . . . . . . . . . . . . . . . . . . . . . . . . . . . . . . 1,131 17 (1) 1,147Mortgage revenue bonds . . . . . . . . . . . . . . . . . . . . . . . . . . . . . . . . . . . . . . . . . 2,473 100 (9) 2,564Other mortgage-related securities . . . . . . . . . . . . . . . . . . . . . . . . . . . . . . . . . . 921 19 — 940
Total . . . . . . . . . . . . . . . . . . . . . . . . . . . . . . . . . . . . . . . . . . . . . . . . . . . . . . . $ 15,199 $ 1,834 $ (50) $ 16,983
As of December 31, 2015
Total Amortized
Cost(1)
GrossUnrealized
Gains
Gross Unrealized
Losses(2)
TotalFair
Value(Dollars in millions)
Fannie Mae . . . . . . . . . . . . . . . . . . . . . . . . . . . . . . . . . . . . . . . . . . . . . . . . . . . $ 4,008 $ 243 $ (30) $ 4,221Freddie Mac . . . . . . . . . . . . . . . . . . . . . . . . . . . . . . . . . . . . . . . . . . . . . . . . . . 4,000 299 — 4,299Ginnie Mae . . . . . . . . . . . . . . . . . . . . . . . . . . . . . . . . . . . . . . . . . . . . . . . . . . . 343 48 — 391Alt-A private-label securities . . . . . . . . . . . . . . . . . . . . . . . . . . . . . . . . . . . . . 2,029 653 (4) 2,678Subprime private-label securities . . . . . . . . . . . . . . . . . . . . . . . . . . . . . . . . . . 2,526 759 (4) 3,281CMBS . . . . . . . . . . . . . . . . . . . . . . . . . . . . . . . . . . . . . . . . . . . . . . . . . . . . . . . 1,235 20 — 1,255Mortgage revenue bonds . . . . . . . . . . . . . . . . . . . . . . . . . . . . . . . . . . . . . . . . . 2,639 99 (37) 2,701Other mortgage-related securities . . . . . . . . . . . . . . . . . . . . . . . . . . . . . . . . . . 1,361 49 (6) 1,404
Total . . . . . . . . . . . . . . . . . . . . . . . . . . . . . . . . . . . . . . . . . . . . . . . . . . . . . . . $ 18,141 $ 2,170 $ (81) $ 20,230__________(1) Amortized cost consists of unpaid principal balance, unamortized premiums, discounts and other cost basis adjustments as well as net
other-than-temporary impairments (“OTTI”) recognized in “Investment gains, net” in our condensed consolidated statements of operations and comprehensive income.

FANNIE MAE(In conservatorship)
NOTES TO CONDENSED CONSOLIDATED FINANCIAL STATEMENTS - (Continued)(UNAUDITED)
83
(2) Represents the gross unrealized losses on securities for which we have not recognized OTTI, as well as the noncredit component of OTTI and cumulative changes in fair value of securities for which we previously recognized the credit component of OTTI in “Accumulated other comprehensive income” in our condensed consolidated balance sheets.
The following tables display additional information regarding gross unrealized losses and fair value by major security type for AFS securities in an unrealized loss position.
As of March 31, 2016Less Than 12
Consecutive Months12 Consecutive Months
or LongerGross
UnrealizedLosses
FairValue
GrossUnrealized
LossesFair
Value(Dollars in millions)
Fannie Mae . . . . . . . . . . . . . . . . . . . . . . . . . . . . . . . . . . . . . . . . . . . . . . . . . . . . . $ (2) $ 288 $ (28) $ 540Alt-A private-label securities . . . . . . . . . . . . . . . . . . . . . . . . . . . . . . . . . . . . . . . (1) 70 (4) 52Subprime private-label securities . . . . . . . . . . . . . . . . . . . . . . . . . . . . . . . . . . . . — — (5) 86CMBS . . . . . . . . . . . . . . . . . . . . . . . . . . . . . . . . . . . . . . . . . . . . . . . . . . . . . . . . . (1) 96 — —Mortgage revenue bonds. . . . . . . . . . . . . . . . . . . . . . . . . . . . . . . . . . . . . . . . . . . (8) 370 (1) 20
Total . . . . . . . . . . . . . . . . . . . . . . . . . . . . . . . . . . . . . . . . . . . . . . . . . . . . . . . . . $ (12) $ 824 $ (38) $ 698
As of December 31, 2015Less Than 12
Consecutive Months12 Consecutive Months
or LongerGross
UnrealizedLosses
FairValue
GrossUnrealized
LossesFair
Value(Dollars in millions)
Fannie Mae . . . . . . . . . . . . . . . . . . . . . . . . . . . . . . . . . . . . . . . . . . . . . . . . . . . . . $ (8) $ 659 $ (22) $ 491Alt-A private-label securities . . . . . . . . . . . . . . . . . . . . . . . . . . . . . . . . . . . . . . . (1) 26 (3) 54Subprime private-label securities . . . . . . . . . . . . . . . . . . . . . . . . . . . . . . . . . . . . — 12 (4) 91Mortgage revenue bonds. . . . . . . . . . . . . . . . . . . . . . . . . . . . . . . . . . . . . . . . . . . (35) 631 (2) 22Other mortgage-related securities. . . . . . . . . . . . . . . . . . . . . . . . . . . . . . . . . . . . (6) 224 — —
Total . . . . . . . . . . . . . . . . . . . . . . . . . . . . . . . . . . . . . . . . . . . . . . . . . . . . . . . . . $ (50) $ 1,552 $ (31) $ 658
Other-Than-Temporary Impairments We recognized $29 million and $170 million of OTTI for the three months ended March 31, 2016 and 2015, respectively, which are included in “Investment gains, net” in our condensed consolidated statements of operations and comprehensive income.
The following table displays the modeled attributes, including default rates and severities, which were used to determine as of March 31, 2016 whether our senior interests in certain non-agency mortgage-related securities (including those we intend to sell) will experience a cash shortfall. An estimate of voluntary prepayment rates is also an input to the present value of expected losses.
As of March 31, 2016
Alt-A
Subprime Option ARM Fixed Rate Variable Rate Hybrid Rate
(Dollars in millions)
Unpaid principal balance. . . . . . . . . . . . . . . . . . . . . $ 3,531 $ 385 $ 535 $ 652 $ 720Weighted average collateral default(1) . . . . . . . . . . . 40.9% 27.4% 14.4% 19.4% 7.8%Weighted average collateral severities(2) . . . . . . . . . 56.0 39.0 46.2 32.1 31.8Weighted average voluntary prepayment rates(3). . . 2.6 8.0 11.0 8.7 13.1Average credit enhancement(4). . . . . . . . . . . . . . . . . 14.9 3.9 6.5 4.3 1.6
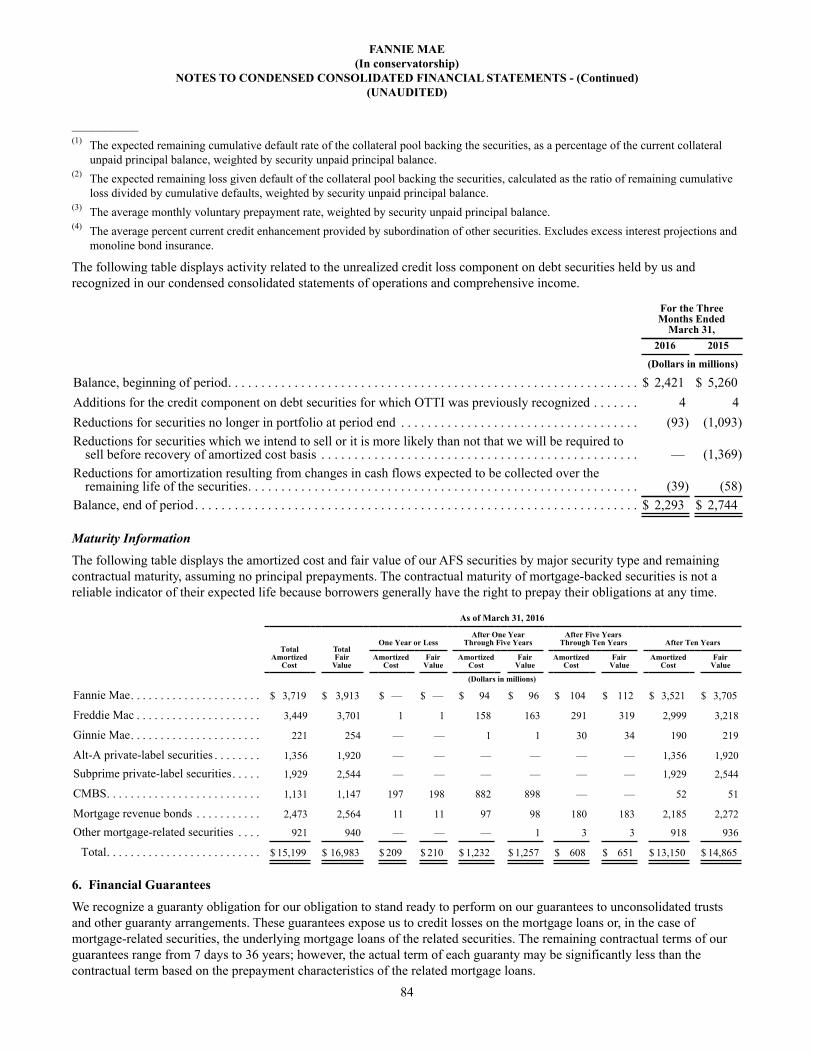
FANNIE MAE(In conservatorship)
NOTES TO CONDENSED CONSOLIDATED FINANCIAL STATEMENTS - (Continued)(UNAUDITED)
84
__________(1) The expected remaining cumulative default rate of the collateral pool backing the securities, as a percentage of the current collateral
unpaid principal balance, weighted by security unpaid principal balance.(2) The expected remaining loss given default of the collateral pool backing the securities, calculated as the ratio of remaining cumulative
loss divided by cumulative defaults, weighted by security unpaid principal balance.(3) The average monthly voluntary prepayment rate, weighted by security unpaid principal balance.(4) The average percent current credit enhancement provided by subordination of other securities. Excludes excess interest projections and
monoline bond insurance.
The following table displays activity related to the unrealized credit loss component on debt securities held by us and recognized in our condensed consolidated statements of operations and comprehensive income.
For the ThreeMonths Ended
March 31,2016 2015
(Dollars in millions)
Balance, beginning of period. . . . . . . . . . . . . . . . . . . . . . . . . . . . . . . . . . . . . . . . . . . . . . . . . . . . . . . . . . . . . . $ 2,421 $ 5,260Additions for the credit component on debt securities for which OTTI was previously recognized . . . . . . . 4 4Reductions for securities no longer in portfolio at period end . . . . . . . . . . . . . . . . . . . . . . . . . . . . . . . . . . . . (93) (1,093)Reductions for securities which we intend to sell or it is more likely than not that we will be required to
sell before recovery of amortized cost basis . . . . . . . . . . . . . . . . . . . . . . . . . . . . . . . . . . . . . . . . . . . . . . . . — (1,369)Reductions for amortization resulting from changes in cash flows expected to be collected over the
remaining life of the securities. . . . . . . . . . . . . . . . . . . . . . . . . . . . . . . . . . . . . . . . . . . . . . . . . . . . . . . . . . . (39) (58)Balance, end of period. . . . . . . . . . . . . . . . . . . . . . . . . . . . . . . . . . . . . . . . . . . . . . . . . . . . . . . . . . . . . . . . . . . $ 2,293 $ 2,744
Maturity InformationThe following table displays the amortized cost and fair value of our AFS securities by major security type and remaining contractual maturity, assuming no principal prepayments. The contractual maturity of mortgage-backed securities is not a reliable indicator of their expected life because borrowers generally have the right to prepay their obligations at any time.
As of March 31, 2016
TotalAmortized
Cost
Total Fair
Value
One Year or LessAfter One Year
Through Five YearsAfter Five Years
Through Ten Years After Ten Years
AmortizedCost
FairValue
AmortizedCost
FairValue
AmortizedCost
FairValue
AmortizedCost
FairValue
(Dollars in millions)
Fannie Mae. . . . . . . . . . . . . . . . . . . . . . $ 3,719 $ 3,913 $ — $ — $ 94 $ 96 $ 104 $ 112 $ 3,521 $ 3,705
Freddie Mac . . . . . . . . . . . . . . . . . . . . . 3,449 3,701 1 1 158 163 291 319 2,999 3,218
Ginnie Mae. . . . . . . . . . . . . . . . . . . . . . 221 254 — — 1 1 30 34 190 219
Alt-A private-label securities . . . . . . . . 1,356 1,920 — — — — — — 1,356 1,920
Subprime private-label securities. . . . . 1,929 2,544 — — — — — — 1,929 2,544
CMBS. . . . . . . . . . . . . . . . . . . . . . . . . . 1,131 1,147 197 198 882 898 — — 52 51
Mortgage revenue bonds . . . . . . . . . . . 2,473 2,564 11 11 97 98 180 183 2,185 2,272
Other mortgage-related securities . . . . 921 940 — — — 1 3 3 918 936
Total. . . . . . . . . . . . . . . . . . . . . . . . . . $ 15,199 $ 16,983 $ 209 $ 210 $ 1,232 $ 1,257 $ 608 $ 651 $ 13,150 $ 14,865
6. Financial GuaranteesWe recognize a guaranty obligation for our obligation to stand ready to perform on our guarantees to unconsolidated trusts and other guaranty arrangements. These guarantees expose us to credit losses on the mortgage loans or, in the case of mortgage-related securities, the underlying mortgage loans of the related securities. The remaining contractual terms of our guarantees range from 7 days to 36 years; however, the actual term of each guaranty may be significantly less than the contractual term based on the prepayment characteristics of the related mortgage loans.

FANNIE MAE(In conservatorship)
NOTES TO CONDENSED CONSOLIDATED FINANCIAL STATEMENTS - (Continued)(UNAUDITED)
85
The following table displays our maximum exposure, guaranty obligation recognized in our condensed consolidated balance sheets and the maximum potential recovery from third parties through available credit enhancements and recourse related to our financial guarantees.
As ofMarch 31, 2016 December 31, 2015
Maximum Exposure(1)
GuarantyObligation
Maximum Recovery(2)
Maximum Exposure(1)
GuarantyObligation
Maximum Recovery(2)
(Dollars in millions)Unconsolidated Fannie Mae MBS. . . . . . . . . . . $ 14,645 $ 190 $ 8,672 $ 15,069 $ 194 $ 8,857Other guaranty arrangements(3) . . . . . . . . . . . . . 16,081 130 2,875 16,504 135 2,869 Total. . . . . . . . . . . . . . . . . . . . . . . . . . . . . . . . $ 30,726 $ 320 $ 11,547 $ 31,573 $ 329 $ 11,726__________(1) Primarily consists of the unpaid principal balance of the underlying mortgage loans.(2) Recoverability of such credit enhancements and recourse is subject to, among other factors, our mortgage insurers’ and financial
guarantors’ ability to meet their obligations to us. For information on our mortgage insurers, see “Note 13, Concentrations of Credit Risk.”
(3) Primarily consists of credit enhancements and long-term standby commitments.
The fair value of our guaranty obligations associated with the Fannie Mae MBS included in “Investments in securities” in our condensed consolidated balance sheets was $518 million and $488 million as of March 31, 2016 and December 31, 2015, respectively. These Fannie Mae MBS consist primarily of private-label wraps where our guaranty arrangement is with an unconsolidated MBS trust.
7. Acquired Property, NetAcquired property, net consists of held-for-sale foreclosed property received in satisfaction of a loan, net of a valuation allowance for declines in the fair value of the properties after initial acquisition. We classify properties as held for sale when we intend to sell the property, are actively marketing it and it is ready for immediate sale in its current condition. The following table displays the activity in acquired property, and the related valuation allowance.
For the Three MonthsEnded March 31,2016 2015
(Dollars in millions)
Beginning balance — Acquired property . . . . . . . . . . . . . . . . . . . . . . . . . . . . . . . . . . . . . . . . . . . . . . . . . . $ 7,481 $ 11,442Additions . . . . . . . . . . . . . . . . . . . . . . . . . . . . . . . . . . . . . . . . . . . . . . . . . . . . . . . . . . . . . . . . . . . . . . . . 1,837 2,935Disposals . . . . . . . . . . . . . . . . . . . . . . . . . . . . . . . . . . . . . . . . . . . . . . . . . . . . . . . . . . . . . . . . . . . . . . . . (2,581) (4,029)
Ending balance — Acquired property. . . . . . . . . . . . . . . . . . . . . . . . . . . . . . . . . . . . . . . . . . . . . . . . . . . . . 6,737 10,348Valuation allowance. . . . . . . . . . . . . . . . . . . . . . . . . . . . . . . . . . . . . . . . . . . . . . . . . . . . . . . . . . . . . . . . (549) (830)
Ending balance — Acquired property, net . . . . . . . . . . . . . . . . . . . . . . . . . . . . . . . . . . . . . . . . . . . . . . . . . $ 6,188 $ 9,518

FANNIE MAE(In conservatorship)
NOTES TO CONDENSED CONSOLIDATED FINANCIAL STATEMENTS - (Continued)(UNAUDITED)
86
8. Short-Term Borrowings and Long-Term Debt
Short-Term BorrowingsThe following table displays our outstanding short-term borrowings (borrowings with an original contractual maturity of one year or less) and weighted-average interest rates of these borrowings.
As ofMarch 31, 2016 December 31, 2015
Outstanding
Weighted- Average
Interest Rate(1) Outstanding
Weighted- Average
Interest Rate(1)
(Dollars in millions)
Federal funds purchased and securities sold under agreements to repurchase(2) . . . . . . . . . . . . . . . . . . . . . . . . . . . . . . . . . . . . . . . . . . $ 26 —% $ 62 —%
Short-term debt of Fannie Mae . . . . . . . . . . . . . . . . . . . . . . . . . . . . . . $ 60,417 0.38% $ 71,007 0.26%Debt of consolidated trusts . . . . . . . . . . . . . . . . . . . . . . . . . . . . . . . . . 822 0.50 943 0.19
Total short-term debt . . . . . . . . . . . . . . . . . . . . . . . . . . . . . . . . . . . $ 61,239 0.38% $ 71,950 0.26%__________(1) Includes the effects of discounts, premiums and other cost basis adjustments.(2) Represents agreements to repurchase securities for a specified price, with repayment generally occurring on the following day.
Intraday Line of CreditWe periodically use a secured intraday funding line of credit provided by a large financial institution. We post collateral which, in some circumstances, the secured party has the right to repledge to third parties. As this line of credit is an uncommitted intraday loan facility, we may be unable to draw on it if and when needed. The line of credit under this facility was $15.0 billion as of March 31, 2016 and December 31, 2015. We had no borrowings outstanding under this line of credit as of March 31, 2016.
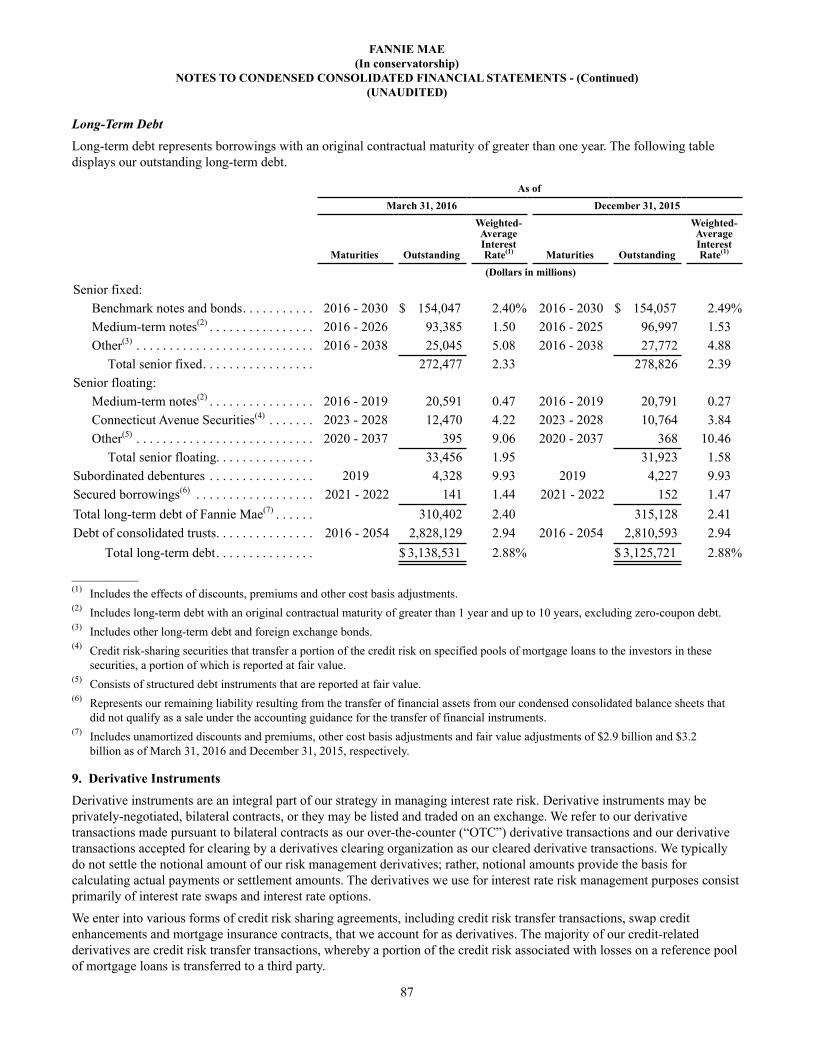
FANNIE MAE(In conservatorship)
NOTES TO CONDENSED CONSOLIDATED FINANCIAL STATEMENTS - (Continued)(UNAUDITED)
87
Long-Term DebtLong-term debt represents borrowings with an original contractual maturity of greater than one year. The following table displays our outstanding long-term debt.
As ofMarch 31, 2016 December 31, 2015
Maturities Outstanding
Weighted- Average Interest Rate(1) Maturities Outstanding
Weighted- Average Interest Rate(1)
(Dollars in millions)
Senior fixed:Benchmark notes and bonds. . . . . . . . . . . 2016 - 2030 $ 154,047 2.40% 2016 - 2030 $ 154,057 2.49%Medium-term notes(2) . . . . . . . . . . . . . . . . 2016 - 2026 93,385 1.50 2016 - 2025 96,997 1.53Other(3) . . . . . . . . . . . . . . . . . . . . . . . . . . . 2016 - 2038 25,045 5.08 2016 - 2038 27,772 4.88
Total senior fixed. . . . . . . . . . . . . . . . . 272,477 2.33 278,826 2.39Senior floating:
Medium-term notes(2) . . . . . . . . . . . . . . . . 2016 - 2019 20,591 0.47 2016 - 2019 20,791 0.27Connecticut Avenue Securities(4) . . . . . . . 2023 - 2028 12,470 4.22 2023 - 2028 10,764 3.84Other(5) . . . . . . . . . . . . . . . . . . . . . . . . . . . 2020 - 2037 395 9.06 2020 - 2037 368 10.46
Total senior floating. . . . . . . . . . . . . . . 33,456 1.95 31,923 1.58Subordinated debentures . . . . . . . . . . . . . . . . 2019 4,328 9.93 2019 4,227 9.93Secured borrowings(6) . . . . . . . . . . . . . . . . . . 2021 - 2022 141 1.44 2021 - 2022 152 1.47Total long-term debt of Fannie Mae(7) . . . . . . 310,402 2.40 315,128 2.41Debt of consolidated trusts. . . . . . . . . . . . . . . 2016 - 2054 2,828,129 2.94 2016 - 2054 2,810,593 2.94
Total long-term debt. . . . . . . . . . . . . . . $ 3,138,531 2.88% $ 3,125,721 2.88%__________(1) Includes the effects of discounts, premiums and other cost basis adjustments.(2) Includes long-term debt with an original contractual maturity of greater than 1 year and up to 10 years, excluding zero-coupon debt.(3) Includes other long-term debt and foreign exchange bonds.(4) Credit risk-sharing securities that transfer a portion of the credit risk on specified pools of mortgage loans to the investors in these
securities, a portion of which is reported at fair value. (5) Consists of structured debt instruments that are reported at fair value.(6) Represents our remaining liability resulting from the transfer of financial assets from our condensed consolidated balance sheets that
did not qualify as a sale under the accounting guidance for the transfer of financial instruments.(7) Includes unamortized discounts and premiums, other cost basis adjustments and fair value adjustments of $2.9 billion and $3.2
billion as of March 31, 2016 and December 31, 2015, respectively.
9. Derivative Instruments Derivative instruments are an integral part of our strategy in managing interest rate risk. Derivative instruments may be privately-negotiated, bilateral contracts, or they may be listed and traded on an exchange. We refer to our derivative transactions made pursuant to bilateral contracts as our over-the-counter (“OTC”) derivative transactions and our derivative transactions accepted for clearing by a derivatives clearing organization as our cleared derivative transactions. We typically do not settle the notional amount of our risk management derivatives; rather, notional amounts provide the basis for calculating actual payments or settlement amounts. The derivatives we use for interest rate risk management purposes consist primarily of interest rate swaps and interest rate options.
We enter into various forms of credit risk sharing agreements, including credit risk transfer transactions, swap credit enhancements and mortgage insurance contracts, that we account for as derivatives. The majority of our credit-related derivatives are credit risk transfer transactions, whereby a portion of the credit risk associated with losses on a reference pool of mortgage loans is transferred to a third party.

FANNIE MAE(In conservatorship)
NOTES TO CONDENSED CONSOLIDATED FINANCIAL STATEMENTS - (Continued)(UNAUDITED)
88
We enter into forward purchase and sale commitments that lock in the future delivery of mortgage loans and mortgage-related securities at a fixed price or yield. Certain commitments to purchase mortgage loans and purchase or sell mortgage-related securities meet the criteria of a derivative. We typically settle the notional amount of our mortgage commitments that are accounted for as derivatives.
We recognize all derivatives as either assets or liabilities in our condensed consolidated balance sheets at their fair value on a trade date basis. Fair value amounts, which are netted to the extent a legal right of offset exists and is enforceable by law at the counterparty level and are inclusive of the right or obligation associated with the cash collateral posted or received, are recorded in “Other assets” or “Other liabilities” in our condensed consolidated balance sheets. See “Note 15, Fair Value” for additional information on derivatives recorded at fair value. We present cash flows from derivatives as operating activities in our condensed consolidated statements of cash flows.
Notional and Fair Value Position of our DerivativesThe following table displays the notional amount and estimated fair value of our asset and liability derivative instruments.
As of March 31, 2016 As of December 31, 2015Asset Derivatives Liability Derivatives Asset Derivatives Liability Derivatives
NotionalAmount
EstimatedFair Value
NotionalAmount
EstimatedFair Value
NotionalAmount
EstimatedFair Value
NotionalAmount
EstimatedFair Value
(Dollars in millions)
Risk management derivatives:Swaps:
Pay-fixed . . . . . . . . . . . . . . . . . . $ 525 $ — $ 153,975 $ (11,582) $ 33,154 $ 267 $ 123,106 $ (6,920)Receive-fixed . . . . . . . . . . . . . . 142,656 5,651 60,286 (53) 59,796 3,436 143,209 (753)Basis . . . . . . . . . . . . . . . . . . . . . 1,864 174 17,100 (14) 1,864 141 17,100 (15)Foreign currency . . . . . . . . . . . . 263 98 251 (61) 295 95 258 (52)
Swaptions:Pay-fixed . . . . . . . . . . . . . . . . . . 9,800 43 4,600 (7) 7,050 45 14,950 (26)Receive-fixed . . . . . . . . . . . . . . 2,000 4 6,350 (164) 2,000 8 13,950 (171)
Other(1) . . . . . . . . . . . . . . . . . . . . . . . . 8,323 27 — (1) 9,196 28 — (2)Total gross risk management
derivatives . . . . . . . . . . . . . . . . . 165,431 5,997 242,562 (11,882) 113,355 4,020 312,573 (7,939)Accrued interest receivable
(payable) . . . . . . . . . . . . . . . . . . — 917 — (1,227) — 758 — (977)Netting adjustment(2) . . . . . . . . . . . — (6,724) — 12,598 — (4,024) — 8,650
Total net risk managementderivatives . . . . . . . . . . . . . . . $ 165,431 $ 190 $ 242,562 $ (511) $ 113,355 $ 754 $ 312,573 $ (266)
Mortgage commitment derivatives:Mortgage commitments to
purchase whole loans . . . . . . . . $ 10,507 $ 48 $ 211 $ — $ 4,815 $ 9 $ 2,960 $ (9)Forward contracts to purchase
mortgage-related securities. . . . 77,994 457 1,893 (4) 31,273 66 19,418 (57)Forward contracts to sell
mortgage-related securities. . . . 1,525 5 107,159 (601) 26,224 65 40,753 (92)Total mortgage commitmentderivatives . . . . . . . . . . . . . . . . . $ 90,026 $ 510 $ 109,263 $ (605) $ 62,312 $ 140 $ 63,131 $ (158)Derivatives at fair value . . . . . . $ 255,457 $ 700 $ 351,825 $ (1,116) $ 175,667 $ 894 $ 375,704 $ (424)
__________(1) Includes swap credit enhancements and futures, as well as credit risk transfer transactions and mortgage insurance contracts that we
account for as derivatives.(2) The netting adjustment represents the effect of the legal right to offset under legally enforceable master netting arrangements to settle
with the same counterparty on a net basis, including cash collateral posted and received. Cash collateral posted was $6.2 billion and
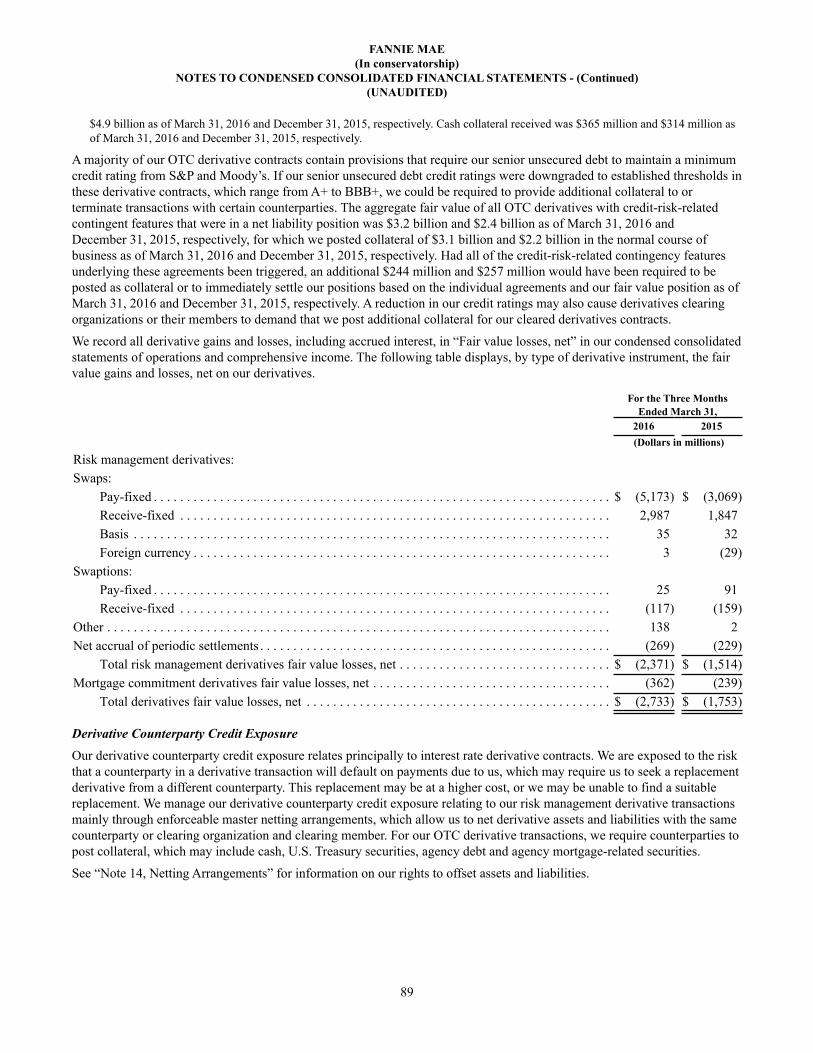
FANNIE MAE(In conservatorship)
NOTES TO CONDENSED CONSOLIDATED FINANCIAL STATEMENTS - (Continued)(UNAUDITED)
89
$4.9 billion as of March 31, 2016 and December 31, 2015, respectively. Cash collateral received was $365 million and $314 million as of March 31, 2016 and December 31, 2015, respectively.
A majority of our OTC derivative contracts contain provisions that require our senior unsecured debt to maintain a minimum credit rating from S&P and Moody’s. If our senior unsecured debt credit ratings were downgraded to established thresholds in these derivative contracts, which range from A+ to BBB+, we could be required to provide additional collateral to or terminate transactions with certain counterparties. The aggregate fair value of all OTC derivatives with credit-risk-related contingent features that were in a net liability position was $3.2 billion and $2.4 billion as of March 31, 2016 and December 31, 2015, respectively, for which we posted collateral of $3.1 billion and $2.2 billion in the normal course of business as of March 31, 2016 and December 31, 2015, respectively. Had all of the credit-risk-related contingency features underlying these agreements been triggered, an additional $244 million and $257 million would have been required to be posted as collateral or to immediately settle our positions based on the individual agreements and our fair value position as of March 31, 2016 and December 31, 2015, respectively. A reduction in our credit ratings may also cause derivatives clearing organizations or their members to demand that we post additional collateral for our cleared derivatives contracts.
We record all derivative gains and losses, including accrued interest, in “Fair value losses, net” in our condensed consolidated statements of operations and comprehensive income. The following table displays, by type of derivative instrument, the fair value gains and losses, net on our derivatives.
For the Three Months Ended March 31,
2016 2015(Dollars in millions)
Risk management derivatives:Swaps:
Pay-fixed . . . . . . . . . . . . . . . . . . . . . . . . . . . . . . . . . . . . . . . . . . . . . . . . . . . . . . . . . . . . . . . . . . . . . $ (5,173) $ (3,069)Receive-fixed . . . . . . . . . . . . . . . . . . . . . . . . . . . . . . . . . . . . . . . . . . . . . . . . . . . . . . . . . . . . . . . . . 2,987 1,847Basis . . . . . . . . . . . . . . . . . . . . . . . . . . . . . . . . . . . . . . . . . . . . . . . . . . . . . . . . . . . . . . . . . . . . . . . . 35 32Foreign currency . . . . . . . . . . . . . . . . . . . . . . . . . . . . . . . . . . . . . . . . . . . . . . . . . . . . . . . . . . . . . . . 3 (29)
Swaptions:Pay-fixed . . . . . . . . . . . . . . . . . . . . . . . . . . . . . . . . . . . . . . . . . . . . . . . . . . . . . . . . . . . . . . . . . . . . . 25 91Receive-fixed . . . . . . . . . . . . . . . . . . . . . . . . . . . . . . . . . . . . . . . . . . . . . . . . . . . . . . . . . . . . . . . . . (117) (159)
Other . . . . . . . . . . . . . . . . . . . . . . . . . . . . . . . . . . . . . . . . . . . . . . . . . . . . . . . . . . . . . . . . . . . . . . . . . . . . 138 2Net accrual of periodic settlements . . . . . . . . . . . . . . . . . . . . . . . . . . . . . . . . . . . . . . . . . . . . . . . . . . . . . (269) (229)
Total risk management derivatives fair value losses, net . . . . . . . . . . . . . . . . . . . . . . . . . . . . . . . . $ (2,371) $ (1,514)Mortgage commitment derivatives fair value losses, net . . . . . . . . . . . . . . . . . . . . . . . . . . . . . . . . . . . . (362) (239)
Total derivatives fair value losses, net . . . . . . . . . . . . . . . . . . . . . . . . . . . . . . . . . . . . . . . . . . . . . . $ (2,733) $ (1,753)
Derivative Counterparty Credit ExposureOur derivative counterparty credit exposure relates principally to interest rate derivative contracts. We are exposed to the risk that a counterparty in a derivative transaction will default on payments due to us, which may require us to seek a replacement derivative from a different counterparty. This replacement may be at a higher cost, or we may be unable to find a suitable replacement. We manage our derivative counterparty credit exposure relating to our risk management derivative transactions mainly through enforceable master netting arrangements, which allow us to net derivative assets and liabilities with the same counterparty or clearing organization and clearing member. For our OTC derivative transactions, we require counterparties to post collateral, which may include cash, U.S. Treasury securities, agency debt and agency mortgage-related securities.
See “Note 14, Netting Arrangements” for information on our rights to offset assets and liabilities.
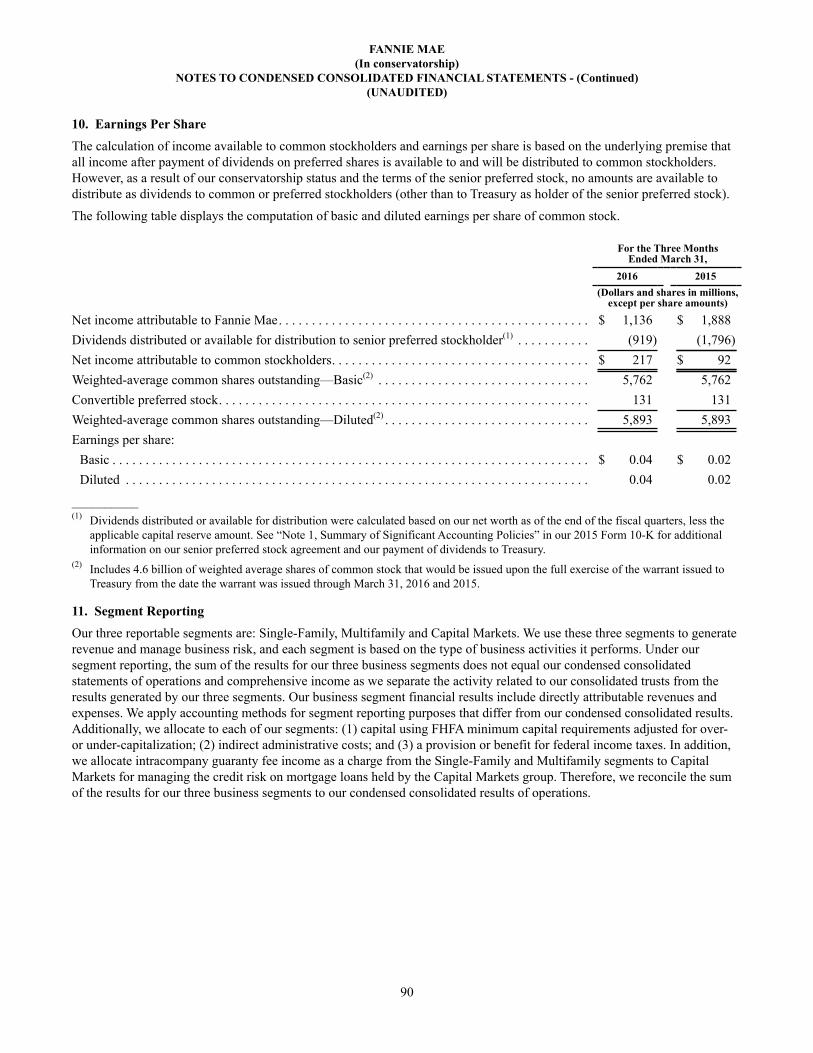
FANNIE MAE(In conservatorship)
NOTES TO CONDENSED CONSOLIDATED FINANCIAL STATEMENTS - (Continued)(UNAUDITED)
90
10. Earnings Per Share The calculation of income available to common stockholders and earnings per share is based on the underlying premise that all income after payment of dividends on preferred shares is available to and will be distributed to common stockholders. However, as a result of our conservatorship status and the terms of the senior preferred stock, no amounts are available to distribute as dividends to common or preferred stockholders (other than to Treasury as holder of the senior preferred stock).
The following table displays the computation of basic and diluted earnings per share of common stock.
For the Three MonthsEnded March 31,
2016 2015(Dollars and shares in millions,
except per share amounts)
Net income attributable to Fannie Mae. . . . . . . . . . . . . . . . . . . . . . . . . . . . . . . . . . . . . . . . . . . . . . . $ 1,136 $ 1,888Dividends distributed or available for distribution to senior preferred stockholder(1) . . . . . . . . . . . (919) (1,796)Net income attributable to common stockholders. . . . . . . . . . . . . . . . . . . . . . . . . . . . . . . . . . . . . . . $ 217 $ 92Weighted-average common shares outstanding—Basic(2) . . . . . . . . . . . . . . . . . . . . . . . . . . . . . . . . 5,762 5,762Convertible preferred stock. . . . . . . . . . . . . . . . . . . . . . . . . . . . . . . . . . . . . . . . . . . . . . . . . . . . . . . . 131 131Weighted-average common shares outstanding—Diluted(2) . . . . . . . . . . . . . . . . . . . . . . . . . . . . . . . 5,893 5,893Earnings per share:
Basic . . . . . . . . . . . . . . . . . . . . . . . . . . . . . . . . . . . . . . . . . . . . . . . . . . . . . . . . . . . . . . . . . . . . . . . . $ 0.04 $ 0.02Diluted . . . . . . . . . . . . . . . . . . . . . . . . . . . . . . . . . . . . . . . . . . . . . . . . . . . . . . . . . . . . . . . . . . . . . . 0.04 0.02
__________(1) Dividends distributed or available for distribution were calculated based on our net worth as of the end of the fiscal quarters, less the
applicable capital reserve amount. See “Note 1, Summary of Significant Accounting Policies” in our 2015 Form 10-K for additional information on our senior preferred stock agreement and our payment of dividends to Treasury.
(2) Includes 4.6 billion of weighted average shares of common stock that would be issued upon the full exercise of the warrant issued to Treasury from the date the warrant was issued through March 31, 2016 and 2015.
11. Segment ReportingOur three reportable segments are: Single-Family, Multifamily and Capital Markets. We use these three segments to generate revenue and manage business risk, and each segment is based on the type of business activities it performs. Under our segment reporting, the sum of the results for our three business segments does not equal our condensed consolidated statements of operations and comprehensive income as we separate the activity related to our consolidated trusts from the results generated by our three segments. Our business segment financial results include directly attributable revenues and expenses. We apply accounting methods for segment reporting purposes that differ from our condensed consolidated results. Additionally, we allocate to each of our segments: (1) capital using FHFA minimum capital requirements adjusted for over- or under-capitalization; (2) indirect administrative costs; and (3) a provision or benefit for federal income taxes. In addition, we allocate intracompany guaranty fee income as a charge from the Single-Family and Multifamily segments to Capital Markets for managing the credit risk on mortgage loans held by the Capital Markets group. Therefore, we reconcile the sum of the results for our three business segments to our condensed consolidated results of operations.

FANNIE MAE(In conservatorship)
NOTES TO CONDENSED CONSOLIDATED FINANCIAL STATEMENTS - (Continued)(UNAUDITED)
91
For the Three Months Ended March 31, 2016Business Segments
Single-Family Multifamily
CapitalMarkets
Reconciling Items(1)
TotalResults
(Dollars in millions)
Net interest income (loss). . . . . . . . . . . . . . . . . . . . . . . . . . . . . $ 143 $ (25) $ 1,092 $ 3,559 (2) $ 4,769
Benefit for credit losses . . . . . . . . . . . . . . . . . . . . . . . . . . . . . . 1,163 21 — — 1,184
Net interest income (loss) after benefit for credit losses . . . . . 1,306 (4) 1,092 3,559 5,953
Guaranty fee income (expense)(3). . . . . . . . . . . . . . . . . . . . . . . 3,222 385 (195) (3,387) (4) 25 (4)
Investment gains (losses), net. . . . . . . . . . . . . . . . . . . . . . . . . . (1) 3 1,415 (1,348) (5) 69
Fair value gains (losses), net . . . . . . . . . . . . . . . . . . . . . . . . . . — — (2,803) (10) (6) (2,813)
Gains (losses) from partnership investments(7) . . . . . . . . . . . . (19) 20 — — 1
Fee and other income (expense). . . . . . . . . . . . . . . . . . . . . . . . 101 59 21 (3) 178
Administrative expenses . . . . . . . . . . . . . . . . . . . . . . . . . . . . . (508) (84) (96) — (688)
Foreclosed property income (expense) . . . . . . . . . . . . . . . . . . (335) 1 — — (334)
TCCA fees(3) . . . . . . . . . . . . . . . . . . . . . . . . . . . . . . . . . . . . . . . (440) — — — (440)
Other income (expenses), net . . . . . . . . . . . . . . . . . . . . . . . . . . (303) (9) (29) 76 (265)
Income (loss) before federal income taxes. . . . . . . . . . . . . . . . 3,023 371 (595) (1,113) 1,686
(Provision) benefit for federal income taxes . . . . . . . . . . . . . . (643) (38) 131 — (550)
Net income (loss) attributable to Fannie Mae. . . . . . . . . . . $ 2,380 $ 333 $ (464) $ (1,113) $ 1,136
For the Three Months Ended March 31, 2015Business Segments
Single-Family Multifamily
CapitalMarkets
Reconciling Items(1)
TotalResults
(Dollars in millions)
Net interest income (loss). . . . . . . . . . . . . . . . . . . . . . . . . . . . . $ 9 $ (31) $ 1,602 $ 3,487 (2) $ 5,067
Benefit for credit losses . . . . . . . . . . . . . . . . . . . . . . . . . . . . . . 478 55 — — 533
Net interest income after benefit for credit losses . . . . . . . . . . 487 24 1,602 3,487 5,600
Guaranty fee income (expense)(3). . . . . . . . . . . . . . . . . . . . . . . 3,040 340 (227) (3,122) (4) 31 (4)
Investment gains (losses), net. . . . . . . . . . . . . . . . . . . . . . . . . . — 9 1,509 (1,176) (5) 342
Fair value gains (losses), net . . . . . . . . . . . . . . . . . . . . . . . . . . (4) — (1,970) 55 (6) (1,919)
Gains (losses) from partnership investments(7) . . . . . . . . . . . . (5) 212 — — 207
Fee and other income (expense). . . . . . . . . . . . . . . . . . . . . . . . 172 51 55 (1) 277
Administrative expenses . . . . . . . . . . . . . . . . . . . . . . . . . . . . . (484) (88) (151) — (723)
Foreclosed property income (expense) . . . . . . . . . . . . . . . . . . (485) 12 — — (473)
TCCA fees(3) . . . . . . . . . . . . . . . . . . . . . . . . . . . . . . . . . . . . . . . (382) — — — (382)
Other income (expenses), net . . . . . . . . . . . . . . . . . . . . . . . . . . (227) (7) — 32 (202)
Income before federal income taxes. . . . . . . . . . . . . . . . . . . . . 2,112 553 818 (725) 2,758
Provision for federal income taxes. . . . . . . . . . . . . . . . . . . . . . (581) (70) (219) — (870)
Net income attributable to Fannie Mae . . . . . . . . . . . . . . . $ 1,531 $ 483 $ 599 $ (725) $ 1,888
__________(1) Represents activity related to the assets and liabilities of consolidated trusts in our condensed consolidated balance sheets, and the
elimination of intercompany transactions occurring between the three business segments and our consolidated trusts, as well as other adjustments to reconcile to our condensed consolidated results.

FANNIE MAE(In conservatorship)
NOTES TO CONDENSED CONSOLIDATED FINANCIAL STATEMENTS - (Continued)(UNAUDITED)
92
(2) Represents net interest income of consolidated trusts and amortization expense of cost basis adjustments on securities in the Capital Markets group’s mortgage portfolio that on a GAAP basis are eliminated.
(3) Reflects the impact of a 10 basis point guaranty fee increase implemented in 2012 pursuant to the TCCA, the incremental revenue from which is remitted to Treasury. The resulting revenue is included in guaranty fee income and the expense is recognized as “TCCA fees.”
(4) Represents the guaranty fees paid from consolidated trusts to the Single-Family and Multifamily segments and the elimination of the amortization of deferred cash fees related to consolidated trusts that were re-established for segment reporting. Total guaranty fee income related to unconsolidated Fannie Mae MBS trusts and other credit enhancement arrangements is included in fee and other income in our condensed consolidated statements of operations and comprehensive income.
(5) Primarily represents the removal of realized gains and losses on sales of Fannie Mae MBS classified as available-for-sale securities that are issued by consolidated trusts and in the Capital Markets group’s mortgage portfolio. The adjustment also includes the removal of securitization gains (losses) recognized in the Capital Markets segment relating to portfolio securitization transactions that do not qualify for sale accounting under GAAP.
(6) Represents the removal of fair value adjustments on consolidated Fannie Mae MBS classified as trading that are in the Capital Markets group’s mortgage portfolio.
(7) Gains (losses) from partnership investments are included in “Other expenses (income), net” in our condensed consolidated statements of operations and comprehensive income.
12. EquityThe following table displays the activity in other comprehensive loss, net of tax, by major categories.
For the Three MonthsEnded March 31,
2016 2015(Dollars in millions)
Net income . . . . . . . . . . . . . . . . . . . . . . . . . . . . . . . . . . . . . . . . . . . . . . . . . . . . . . . . . . . . . . . . . . . . . . . . $ 1,136 $ 1,888Other comprehensive loss, net of tax effect:
Changes in net unrealized gains on AFS securities (net of tax of $48 and $13, respectively). . . . . . . . (89) 24Reclassification adjustment for OTTI recognized in net income (net of tax of $10 and $60,
respectively) . . . . . . . . . . . . . . . . . . . . . . . . . . . . . . . . . . . . . . . . . . . . . . . . . . . . . . . . . . . . . . . . . . . . 19 110Reclassification adjustment for gains on AFS securities included in net income (net of tax of $69
and $121, respectively) . . . . . . . . . . . . . . . . . . . . . . . . . . . . . . . . . . . . . . . . . . . . . . . . . . . . . . . . . . . . (128) (225)Other . . . . . . . . . . . . . . . . . . . . . . . . . . . . . . . . . . . . . . . . . . . . . . . . . . . . . . . . . . . . . . . . . . . . . . . . . . . . (2) (1)
Total other comprehensive loss . . . . . . . . . . . . . . . . . . . . . . . . . . . . . . . . . . . . . . . . . . . . . . . . . . . . . . (200) (92)Total comprehensive income. . . . . . . . . . . . . . . . . . . . . . . . . . . . . . . . . . . . . . . . . . . . . . . . . . . . . . . . . . . $ 936 $ 1,796
The following table displays our accumulated other comprehensive income by major categories.
As ofMarch 31, December 31,
2016 2015(Dollars in millions)
Net unrealized gains on AFS securities for which we have not recorded OTTI, net of tax . . . . . . . $ 398 $ 455Net unrealized gains on AFS securities for which we have recorded OTTI, net of tax . . . . . . . . . . 762 903Other, net of tax. . . . . . . . . . . . . . . . . . . . . . . . . . . . . . . . . . . . . . . . . . . . . . . . . . . . . . . . . . . . . . . . . 47 49
Accumulated other comprehensive income . . . . . . . . . . . . . . . . . . . . . . . . . . . . . . . . . . . . . . . . $ 1,207 $ 1,407
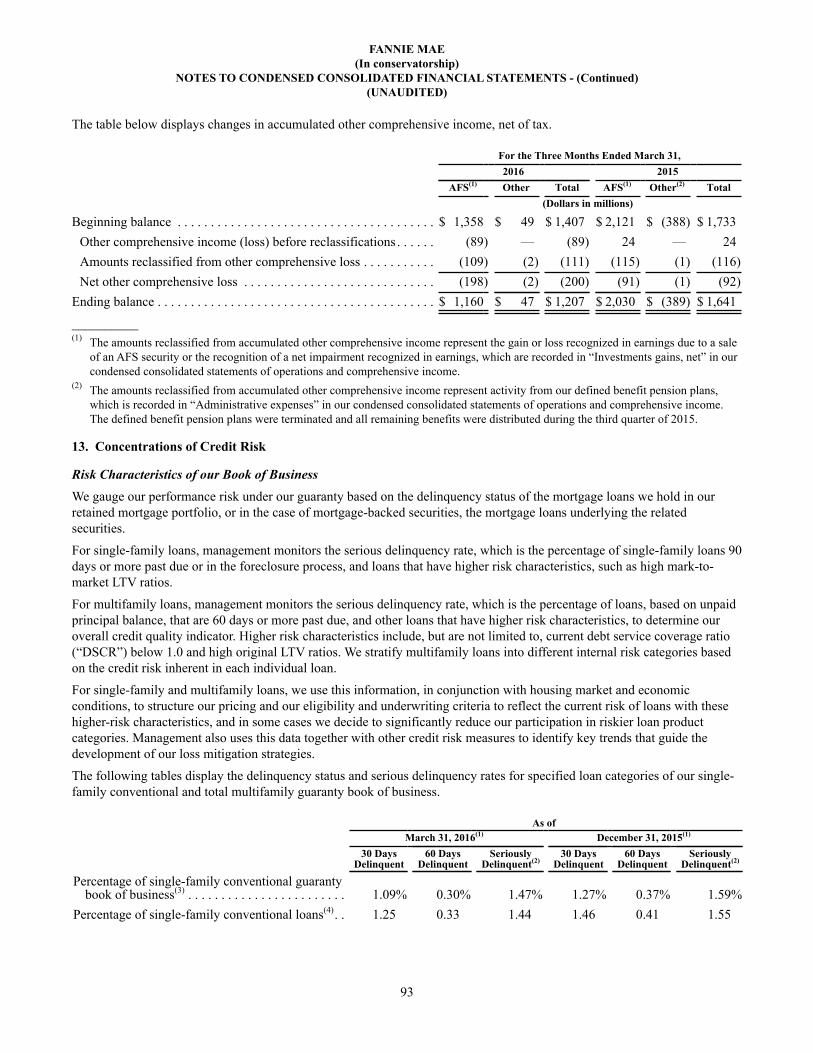
FANNIE MAE(In conservatorship)
NOTES TO CONDENSED CONSOLIDATED FINANCIAL STATEMENTS - (Continued)(UNAUDITED)
93
The table below displays changes in accumulated other comprehensive income, net of tax.
For the Three Months Ended March 31,2016 2015
AFS(1) Other Total AFS(1) Other(2) Total(Dollars in millions)
Beginning balance . . . . . . . . . . . . . . . . . . . . . . . . . . . . . . . . . . . . . . . $ 1,358 $ 49 $ 1,407 $ 2,121 $ (388) $ 1,733Other comprehensive income (loss) before reclassifications . . . . . . (89) — (89) 24 — 24Amounts reclassified from other comprehensive loss . . . . . . . . . . . (109) (2) (111) (115) (1) (116)Net other comprehensive loss . . . . . . . . . . . . . . . . . . . . . . . . . . . . . (198) (2) (200) (91) (1) (92)
Ending balance . . . . . . . . . . . . . . . . . . . . . . . . . . . . . . . . . . . . . . . . . . $ 1,160 $ 47 $ 1,207 $ 2,030 $ (389) $ 1,641__________(1) The amounts reclassified from accumulated other comprehensive income represent the gain or loss recognized in earnings due to a sale
of an AFS security or the recognition of a net impairment recognized in earnings, which are recorded in “Investments gains, net” in our condensed consolidated statements of operations and comprehensive income.
(2) The amounts reclassified from accumulated other comprehensive income represent activity from our defined benefit pension plans, which is recorded in “Administrative expenses” in our condensed consolidated statements of operations and comprehensive income. The defined benefit pension plans were terminated and all remaining benefits were distributed during the third quarter of 2015.
13. Concentrations of Credit Risk
Risk Characteristics of our Book of BusinessWe gauge our performance risk under our guaranty based on the delinquency status of the mortgage loans we hold in our retained mortgage portfolio, or in the case of mortgage-backed securities, the mortgage loans underlying the related securities.
For single-family loans, management monitors the serious delinquency rate, which is the percentage of single-family loans 90 days or more past due or in the foreclosure process, and loans that have higher risk characteristics, such as high mark-to-market LTV ratios.
For multifamily loans, management monitors the serious delinquency rate, which is the percentage of loans, based on unpaid principal balance, that are 60 days or more past due, and other loans that have higher risk characteristics, to determine our overall credit quality indicator. Higher risk characteristics include, but are not limited to, current debt service coverage ratio (“DSCR”) below 1.0 and high original LTV ratios. We stratify multifamily loans into different internal risk categories based on the credit risk inherent in each individual loan.
For single-family and multifamily loans, we use this information, in conjunction with housing market and economic conditions, to structure our pricing and our eligibility and underwriting criteria to reflect the current risk of loans with these higher-risk characteristics, and in some cases we decide to significantly reduce our participation in riskier loan product categories. Management also uses this data together with other credit risk measures to identify key trends that guide the development of our loss mitigation strategies.
The following tables display the delinquency status and serious delinquency rates for specified loan categories of our single-family conventional and total multifamily guaranty book of business.
As ofMarch 31, 2016(1) December 31, 2015(1)
30 DaysDelinquent
60 DaysDelinquent
Seriously Delinquent(2)
30 DaysDelinquent
60 DaysDelinquent
Seriously Delinquent(2)
Percentage of single-family conventional guaranty book of business(3) . . . . . . . . . . . . . . . . . . . . . . . . 1.09% 0.30% 1.47% 1.27% 0.37% 1.59%
Percentage of single-family conventional loans(4). . 1.25 0.33 1.44 1.46 0.41 1.55

FANNIE MAE(In conservatorship)
NOTES TO CONDENSED CONSOLIDATED FINANCIAL STATEMENTS - (Continued)(UNAUDITED)
94
As ofMarch 31, 2016(1) December 31, 2015(1)
Percentage of Single-FamilyConventional
Guaranty Book of Business(3)
Seriously Delinquent
Rate(2)
Percentage of Single-FamilyConventional
Guaranty Book of Business(3)
Seriously Delinquent
Rate(2)
Estimated mark-to-market loan-to-value ratio:Greater than 100% . . . . . . . . . . . . . . . . . . . . . . . . . . . . . . . . . . 3% 10.37% 3% 10.76%
Geographical distribution:California . . . . . . . . . . . . . . . . . . . . . . . . . . . . . . . . . . . . . . . . . 20 0.55 20 0.58Florida . . . . . . . . . . . . . . . . . . . . . . . . . . . . . . . . . . . . . . . . . . . . 6 2.56 6 2.86New Jersey . . . . . . . . . . . . . . . . . . . . . . . . . . . . . . . . . . . . . . . . 4 4.46 4 4.87New York . . . . . . . . . . . . . . . . . . . . . . . . . . . . . . . . . . . . . . . . . 5 3.32 5 3.55All other states . . . . . . . . . . . . . . . . . . . . . . . . . . . . . . . . . . . . . 65 1.25 65 1.34
Product distribution:Alt-A . . . . . . . . . . . . . . . . . . . . . . . . . . . . . . . . . . . . . . . . . . . . . 4 6.11 4 6.53
Vintages:2004 and prior . . . . . . . . . . . . . . . . . . . . . . . . . . . . . . . . . . . . . . 5 2.95 5 3.062005-2008 . . . . . . . . . . . . . . . . . . . . . . . . . . . . . . . . . . . . . . . . . 10 7.18 10 7.602009-2016 . . . . . . . . . . . . . . . . . . . . . . . . . . . . . . . . . . . . . . . . . 85 0.35 85 0.36
__________(1) Consists of the portion of our single-family conventional guaranty book of business for which we have detailed loan level information,
which constituted approximately 99% our total single-family conventional guaranty book of business as of March 31, 2016 and December 31, 2015.
(2) Consists of single-family conventional loans that were 90 days or more past due or in the foreclosure process as of March 31, 2016 and December 31, 2015.
(3) Calculated based on the aggregate unpaid principal balance of single-family conventional loans for each category divided by the aggregate unpaid principal balance of loans in our single-family conventional guaranty book of business.
(4) Calculated based on the number of single-family conventional loans that were delinquent divided by the total number of loans in our single-family conventional guaranty book of business.
As ofMarch 31, 2016(1)(2) December 31, 2015(1)(2)
30 DaysDelinquent
Seriously Delinquent(3)
30 DaysDelinquent
Seriously Delinquent(3)
Percentage of multifamily guaranty book of business . . . . . . . . . . . . 0.01% 0.06% 0.03% 0.07%
As ofMarch 31, 2016(1) December 31, 2015(1)
Percentage of Multifamily
Guaranty Book of Business(2)
Percentage Seriously
Delinquent(3)(4)
Percentage of Multifamily
Guaranty Book of Business(2)
Percentage Seriously
Delinquent(3)(4)
Original LTV ratio:Greater than 80% . . . . . . . . . . . . . . . . . . . . . . . . . . . . . . . 2% 0.07% 3% 0.40%Less than or equal to 80% . . . . . . . . . . . . . . . . . . . . . . . . 98 0.06 97 0.06
Current DSCR less than 1.0(5) . . . . . . . . . . . . . . . . . . . . . . . . 2 1.23 2 1.51__________(1) Consists of the portion of our multifamily guaranty book of business for which we have detailed loan level information, which
constituted approximately 99% of our total multifamily guaranty book of business as of March 31, 2016 and December 31, 2015, excluding loans that have been defeased.
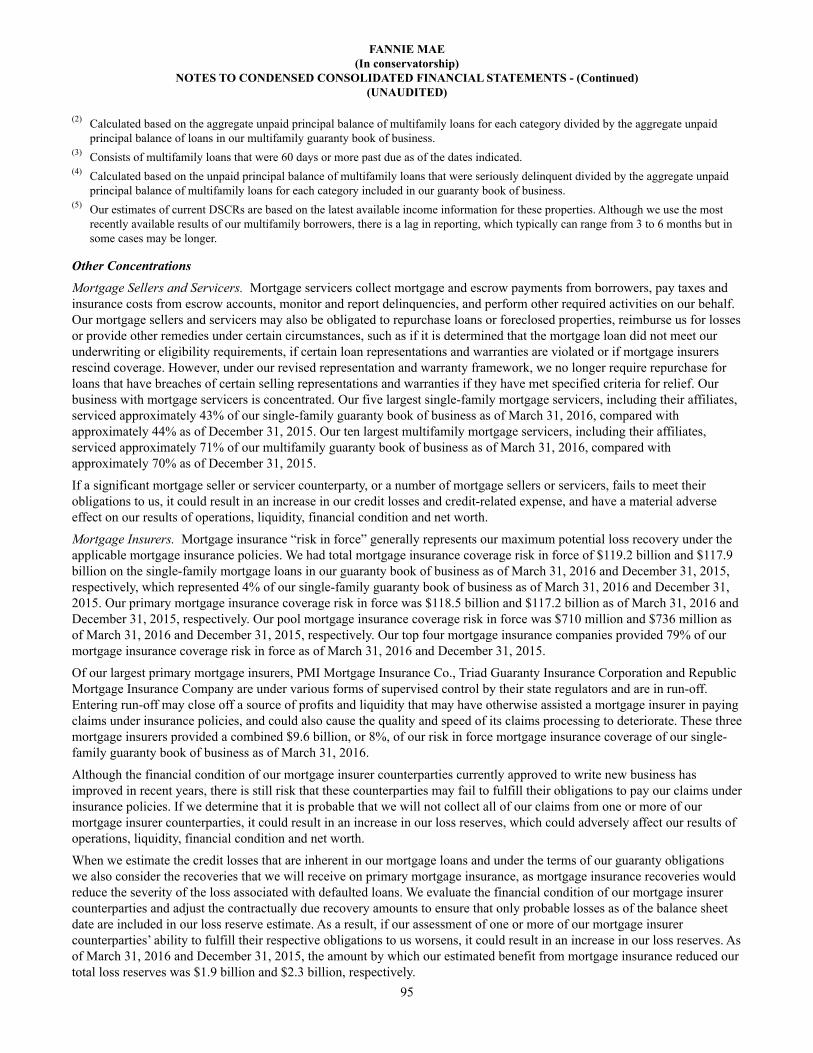
FANNIE MAE(In conservatorship)
NOTES TO CONDENSED CONSOLIDATED FINANCIAL STATEMENTS - (Continued)(UNAUDITED)
95
(2) Calculated based on the aggregate unpaid principal balance of multifamily loans for each category divided by the aggregate unpaid principal balance of loans in our multifamily guaranty book of business.
(3) Consists of multifamily loans that were 60 days or more past due as of the dates indicated.(4) Calculated based on the unpaid principal balance of multifamily loans that were seriously delinquent divided by the aggregate unpaid
principal balance of multifamily loans for each category included in our guaranty book of business.(5) Our estimates of current DSCRs are based on the latest available income information for these properties. Although we use the most
recently available results of our multifamily borrowers, there is a lag in reporting, which typically can range from 3 to 6 months but in some cases may be longer.
Other ConcentrationsMortgage Sellers and Servicers. Mortgage servicers collect mortgage and escrow payments from borrowers, pay taxes and insurance costs from escrow accounts, monitor and report delinquencies, and perform other required activities on our behalf. Our mortgage sellers and servicers may also be obligated to repurchase loans or foreclosed properties, reimburse us for losses or provide other remedies under certain circumstances, such as if it is determined that the mortgage loan did not meet our underwriting or eligibility requirements, if certain loan representations and warranties are violated or if mortgage insurers rescind coverage. However, under our revised representation and warranty framework, we no longer require repurchase for loans that have breaches of certain selling representations and warranties if they have met specified criteria for relief. Our business with mortgage servicers is concentrated. Our five largest single-family mortgage servicers, including their affiliates, serviced approximately 43% of our single-family guaranty book of business as of March 31, 2016, compared with approximately 44% as of December 31, 2015. Our ten largest multifamily mortgage servicers, including their affiliates, serviced approximately 71% of our multifamily guaranty book of business as of March 31, 2016, compared with approximately 70% as of December 31, 2015.
If a significant mortgage seller or servicer counterparty, or a number of mortgage sellers or servicers, fails to meet their obligations to us, it could result in an increase in our credit losses and credit-related expense, and have a material adverse effect on our results of operations, liquidity, financial condition and net worth.
Mortgage Insurers. Mortgage insurance “risk in force” generally represents our maximum potential loss recovery under the applicable mortgage insurance policies. We had total mortgage insurance coverage risk in force of $119.2 billion and $117.9 billion on the single-family mortgage loans in our guaranty book of business as of March 31, 2016 and December 31, 2015, respectively, which represented 4% of our single-family guaranty book of business as of March 31, 2016 and December 31, 2015. Our primary mortgage insurance coverage risk in force was $118.5 billion and $117.2 billion as of March 31, 2016 and December 31, 2015, respectively. Our pool mortgage insurance coverage risk in force was $710 million and $736 million as of March 31, 2016 and December 31, 2015, respectively. Our top four mortgage insurance companies provided 79% of our mortgage insurance coverage risk in force as of March 31, 2016 and December 31, 2015.
Of our largest primary mortgage insurers, PMI Mortgage Insurance Co., Triad Guaranty Insurance Corporation and Republic Mortgage Insurance Company are under various forms of supervised control by their state regulators and are in run-off. Entering run-off may close off a source of profits and liquidity that may have otherwise assisted a mortgage insurer in paying claims under insurance policies, and could also cause the quality and speed of its claims processing to deteriorate. These three mortgage insurers provided a combined $9.6 billion, or 8%, of our risk in force mortgage insurance coverage of our single-family guaranty book of business as of March 31, 2016.
Although the financial condition of our mortgage insurer counterparties currently approved to write new business has improved in recent years, there is still risk that these counterparties may fail to fulfill their obligations to pay our claims under insurance policies. If we determine that it is probable that we will not collect all of our claims from one or more of our mortgage insurer counterparties, it could result in an increase in our loss reserves, which could adversely affect our results of operations, liquidity, financial condition and net worth.
When we estimate the credit losses that are inherent in our mortgage loans and under the terms of our guaranty obligations we also consider the recoveries that we will receive on primary mortgage insurance, as mortgage insurance recoveries would reduce the severity of the loss associated with defaulted loans. We evaluate the financial condition of our mortgage insurer counterparties and adjust the contractually due recovery amounts to ensure that only probable losses as of the balance sheet date are included in our loss reserve estimate. As a result, if our assessment of one or more of our mortgage insurer counterparties’ ability to fulfill their respective obligations to us worsens, it could result in an increase in our loss reserves. As of March 31, 2016 and December 31, 2015, the amount by which our estimated benefit from mortgage insurance reduced our total loss reserves was $1.9 billion and $2.3 billion, respectively.

FANNIE MAE(In conservatorship)
NOTES TO CONDENSED CONSOLIDATED FINANCIAL STATEMENTS - (Continued)(UNAUDITED)
96
We had outstanding receivables of $1.1 billion recorded in “Other assets” in our condensed consolidated balance sheets as of March 31, 2016 and $1.2 billion as of December 31, 2015 related to amounts claimed on insured, defaulted loans excluding government insured loans. Of this amount, $197 million as of March 31, 2016 and $241 million as of December 31, 2015 was due from our mortgage sellers or servicers. We assessed the total outstanding receivables for collectibility, and they are recorded net of a valuation allowance of $742 million as of March 31, 2016 and $770 million as of December 31, 2015. The valuation allowance reduces our claim receivable to the amount which is considered probable of collection as of March 31, 2016 and December 31, 2015.
For information on credit risk associated with our derivative transactions and repurchase agreements refer to “Note 9, Derivative Instruments” and “Note 14, Netting Arrangements.”
14. Netting Arrangements We use master netting arrangements, which allow us to offset certain financial instruments and collateral with the same counterparty, to minimize counterparty credit exposure. The tables below display information related to derivatives, securities purchased under agreements to resell or similar arrangements, and securities sold under agreements to repurchase or similar arrangements, which are subject to an enforceable master netting arrangement or similar agreement that are either offset or not offset in our condensed consolidated balance sheets.
As of March 31, 2016
Net AmountPresented in
our CondensedConsolidated
Balance Sheets
Amounts Not Offset in ourCondensed Consolidated
Balance Sheets
GrossAmount
Gross Amount Offset(1)
Financial Instruments(2) Collateral(3)
NetAmount
(Dollars in millions)
Assets:OTC risk management derivatives . . . . . . . . . . . . $ 5,032 $(4,874) $ 158 $ — $ — $ 158Cleared risk management derivatives . . . . . . . . . . 1,855 (1,850) 5 — — 5Mortgage commitment derivatives . . . . . . . . . . . . 510 — 510 (334) (1) 175
Total derivative assets. . . . . . . . . . . . . . . . . . . . . 7,397 (6,724) 673 (4) (334) (1) 338Securities purchased under agreements to resell
or similar arrangements(5) . . . . . . . . . . . . . . . . . 32,450 — 32,450 — (32,450) —
Total assets . . . . . . . . . . . . . . . . . . . . . . . . . . . . $ 39,847 $(6,724) $ 33,123 $ (334) $(32,451) $ 338Liabilities:
OTC risk management derivatives . . . . . . . . . . . . $ (7,895) $ 7,622 $ (273) $ — $ — $ (273)Cleared risk management derivatives . . . . . . . . . . (5,213) 4,976 (237) — 237 —Mortgage commitment derivatives . . . . . . . . . . . . (605) — (605) 334 — (271)
Total derivative liabilities . . . . . . . . . . . . . . . . . . (13,713) 12,598 (1,115) (4) 334 237 (544)Securities sold under agreements to repurchase or
similar arrangements . . . . . . . . . . . . . . . . . . . . . (26) — (26) — 26 —
Total liabilities . . . . . . . . . . . . . . . . . . . . . . . . . $(13,739) $12,598 $ (1,141) $ 334 $ 263 $ (544)

FANNIE MAE(In conservatorship)
NOTES TO CONDENSED CONSOLIDATED FINANCIAL STATEMENTS - (Continued)(UNAUDITED)
97
As of December 31, 2015
Net AmountPresented in
our CondensedConsolidated
Balance Sheets
Amounts Not Offset in ourCondensed Consolidated
Balance Sheets
GrossAmount
Gross Amount Offset(1)
Financial Instruments(2) Collateral(3)
NetAmount
(Dollars in millions)
Assets:OTC risk management derivatives . . . . . . . . . . . . $ 4,042 $(4,021) $ 21 $ — $ (18) $ 3Cleared risk management derivatives . . . . . . . . . . 708 (3) 705 — — 705Mortgage commitment derivatives . . . . . . . . . . . . 140 — 140 (119) (3) 18
Total derivative assets. . . . . . . . . . . . . . . . . . . . . 4,890 (4,024) 866 (4) (119) (21) 726Securities purchased under agreements to resell
or similar arrangements(5) . . . . . . . . . . . . . . . . . 37,950 — 37,950 — (37,950) —
Total assets . . . . . . . . . . . . . . . . . . . . . . . . . . . . $ 42,840 $(4,024) $ 38,816 $ (119) $ (37,971) $ 726Liabilities:
OTC risk management derivatives . . . . . . . . . . . . $ (6,118) $ 5,861 $ (257) $ — $ — $ (257)Cleared risk management derivatives . . . . . . . . . . (2,796) 2,789 (7) — — (7)Mortgage commitment derivatives . . . . . . . . . . . . (158) — (158) 119 (1) (40)
Total derivative liabilities . . . . . . . . . . . . . . . . . . (9,072) 8,650 (422) (4) 119 (1) (304)Securities sold under agreements to repurchase or
similar arrangements . . . . . . . . . . . . . . . . . . . . . (62) — (62) — 62 —
Total liabilities . . . . . . . . . . . . . . . . . . . . . . . . . $ (9,134) $ 8,650 $ (484) $ 119 $ 61 $ (304)
__________(1) Represents the effect of the right to offset under legally enforceable master netting arrangements to settle with the same counterparty on
a net basis, including cash collateral posted and received and accrued interest. (2) Mortgage commitment derivative amounts reflect where we have recognized both an asset and a liability with the same counterparty
under an enforceable master netting arrangement but we have not elected to offset the related amounts in our condensed consolidated balance sheets.
(3) Represents non-cash collateral received that has not been recognized and not offset in our condensed consolidated balance sheets as well as non-cash collateral posted which has been recognized but not offset in our condensed consolidated balance sheets. Does not include collateral held or posted in excess of our exposure. The fair value of non-cash collateral we pledged was $1.2 billion and $197 million as of March 31, 2016 and December 31, 2015, respectively, which the counterparty was permitted to sell or repledge. The fair value of non-cash collateral received was $32.5 billion and $38.0 billion, of which billion $29.2 billion and $36.2 billion could be sold or repledged as of March 31, 2016 and December 31, 2015, respectively. None of the underlying collateral was sold or repledged as of March 31, 2016 and December 31, 2015.
(4) Excludes derivative assets of $27 million and $28 million as of March 31, 2016 and December 31, 2015, and derivative liabilities of $1 million and $2 million recognized in our condensed consolidated balance sheets as of March 31, 2016 and December 31, 2015, respectively, that are not subject to enforceable master netting arrangements.
(5) Includes $14.9 billion and $10.6 billion of securities purchased under agreements to resell classified as “Cash and cash equivalents” in our condensed consolidated balance sheets as of March 31, 2016 and December 31, 2015, respectively.
Derivative instruments are recorded at fair value and securities purchased under agreements to resell or similar arrangements are recorded at amortized cost in our condensed consolidated balance sheets.
We determine our rights to offset the assets and liabilities presented above with the same counterparty, including collateral posted or received, based on the contractual arrangements entered into with our individual counterparties and various rules and regulations that would govern the insolvency of a derivative counterparty. The following is a description, under various agreements, of the nature of those rights and their effect or potential effect on our financial position.
The terms of the majority of our contracts for OTC risk management derivatives are governed under master agreements of the International Swaps and Derivatives Association Inc. (“ISDA”). These agreements provide that all transactions entered into under the agreement with the counterparty constitute a single contractual relationship. An event of default by the counterparty
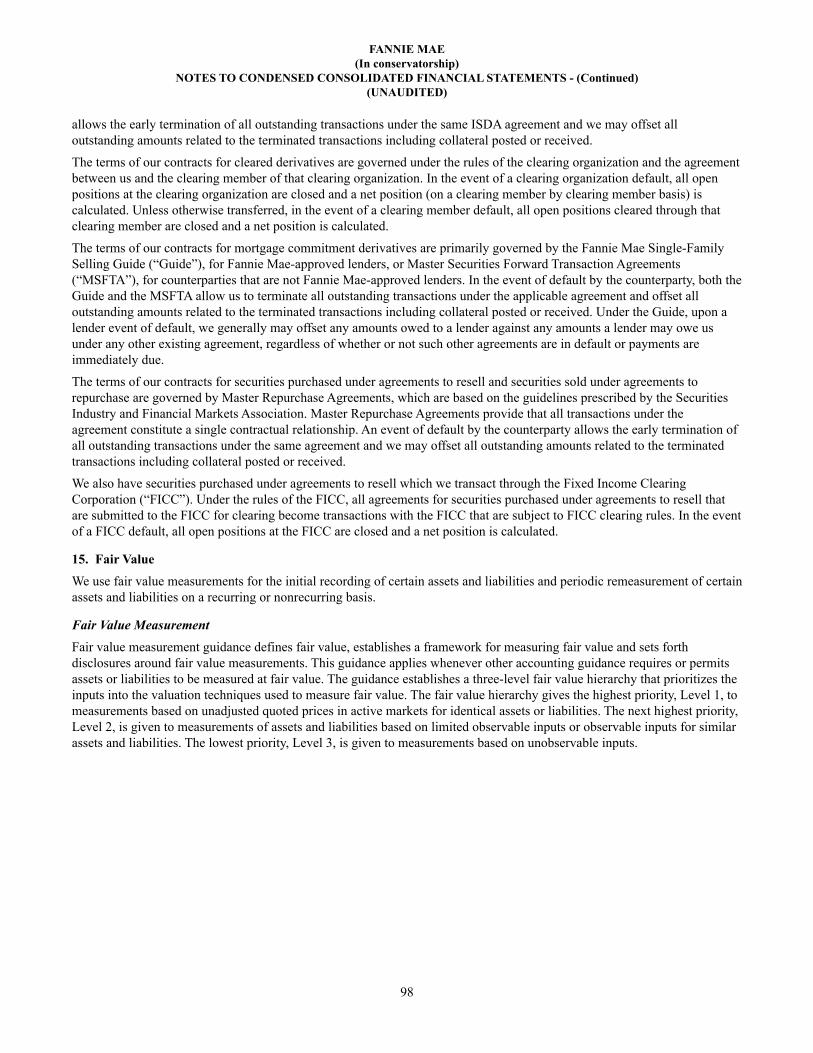
FANNIE MAE(In conservatorship)
NOTES TO CONDENSED CONSOLIDATED FINANCIAL STATEMENTS - (Continued)(UNAUDITED)
98
allows the early termination of all outstanding transactions under the same ISDA agreement and we may offset all outstanding amounts related to the terminated transactions including collateral posted or received.
The terms of our contracts for cleared derivatives are governed under the rules of the clearing organization and the agreement between us and the clearing member of that clearing organization. In the event of a clearing organization default, all open positions at the clearing organization are closed and a net position (on a clearing member by clearing member basis) is calculated. Unless otherwise transferred, in the event of a clearing member default, all open positions cleared through that clearing member are closed and a net position is calculated.
The terms of our contracts for mortgage commitment derivatives are primarily governed by the Fannie Mae Single-Family Selling Guide (“Guide”), for Fannie Mae-approved lenders, or Master Securities Forward Transaction Agreements (“MSFTA”), for counterparties that are not Fannie Mae-approved lenders. In the event of default by the counterparty, both the Guide and the MSFTA allow us to terminate all outstanding transactions under the applicable agreement and offset all outstanding amounts related to the terminated transactions including collateral posted or received. Under the Guide, upon a lender event of default, we generally may offset any amounts owed to a lender against any amounts a lender may owe us under any other existing agreement, regardless of whether or not such other agreements are in default or payments are immediately due.
The terms of our contracts for securities purchased under agreements to resell and securities sold under agreements to repurchase are governed by Master Repurchase Agreements, which are based on the guidelines prescribed by the Securities Industry and Financial Markets Association. Master Repurchase Agreements provide that all transactions under the agreement constitute a single contractual relationship. An event of default by the counterparty allows the early termination of all outstanding transactions under the same agreement and we may offset all outstanding amounts related to the terminated transactions including collateral posted or received.
We also have securities purchased under agreements to resell which we transact through the Fixed Income Clearing Corporation (“FICC”). Under the rules of the FICC, all agreements for securities purchased under agreements to resell that are submitted to the FICC for clearing become transactions with the FICC that are subject to FICC clearing rules. In the event of a FICC default, all open positions at the FICC are closed and a net position is calculated.
15. Fair Value We use fair value measurements for the initial recording of certain assets and liabilities and periodic remeasurement of certain assets and liabilities on a recurring or nonrecurring basis.
Fair Value MeasurementFair value measurement guidance defines fair value, establishes a framework for measuring fair value and sets forth disclosures around fair value measurements. This guidance applies whenever other accounting guidance requires or permits assets or liabilities to be measured at fair value. The guidance establishes a three-level fair value hierarchy that prioritizes the inputs into the valuation techniques used to measure fair value. The fair value hierarchy gives the highest priority, Level 1, to measurements based on unadjusted quoted prices in active markets for identical assets or liabilities. The next highest priority, Level 2, is given to measurements of assets and liabilities based on limited observable inputs or observable inputs for similar assets and liabilities. The lowest priority, Level 3, is given to measurements based on unobservable inputs.

FANNIE MAE(In conservatorship)
NOTES TO CONDENSED CONSOLIDATED FINANCIAL STATEMENTS - (Continued)(UNAUDITED)
99
Recurring Changes in Fair Value The following tables display our assets and liabilities measured in our condensed consolidated balance sheets at fair value on a recurring basis subsequent to initial recognition, including instruments for which we have elected the fair value option.
Fair Value Measurements as of March 31, 2016Quoted Prices
in ActiveMarkets for
Identical Assets(Level 1)
Significant Other
Observable Inputs
(Level 2)
Significant Unobservable
Inputs(Level 3)
Netting Adjustment(1)
EstimatedFair Value
(Dollars in millions)
Recurring fair value measurements:Assets:Trading securities:
Mortgage-related securities:Fannie Mae. . . . . . . . . . . . . . . . . . . . . . . . . . . . $ — $ 5,401 $ 25 $ — $ 5,426Freddie Mac . . . . . . . . . . . . . . . . . . . . . . . . . . . — 866 1 — 867Ginnie Mae. . . . . . . . . . . . . . . . . . . . . . . . . . . . — 434 — — 434Alt-A private-label securities. . . . . . . . . . . . . . — 62 245 — 307Subprime private-label securities. . . . . . . . . . . — 363 43 — 406CMBS . . . . . . . . . . . . . . . . . . . . . . . . . . . . . . . — 1,451 — — 1,451Mortgage revenue bonds . . . . . . . . . . . . . . . . . — — 363 — 363
Non-mortgage-related securities:U.S. Treasury securities . . . . . . . . . . . . . . . . . . 30,746 — — — 30,746
Total trading securities. . . . . . . . . . . . . . . . . . . . . . . 30,746 8,577 677 — 40,000Available-for-sale securities:
Mortgage-related securities:Fannie Mae. . . . . . . . . . . . . . . . . . . . . . . . . . . . — 3,912 1 — 3,913Freddie Mac . . . . . . . . . . . . . . . . . . . . . . . . . . . — 3,699 2 — 3,701Ginnie Mae. . . . . . . . . . . . . . . . . . . . . . . . . . . . — 254 — — 254Alt-A private-label securities. . . . . . . . . . . . . . — 1,743 177 — 1,920Subprime private-label securities. . . . . . . . . . . — 2,322 222 — 2,544CMBS . . . . . . . . . . . . . . . . . . . . . . . . . . . . . . . — 1,147 — — 1,147Mortgage revenue bonds . . . . . . . . . . . . . . . . . — — 2,564 — 2,564Other . . . . . . . . . . . . . . . . . . . . . . . . . . . . . . . . — 285 655 — 940
Total available-for-sale securities . . . . . . . . . . . . . . — 13,362 3,621 — 16,983Mortgage loans. . . . . . . . . . . . . . . . . . . . . . . . . . . . . — 12,403 1,311 — 13,714Other assets:
Risk management derivatives:Swaps . . . . . . . . . . . . . . . . . . . . . . . . . . . . . . . . — 6,648 192 — 6,840Swaptions. . . . . . . . . . . . . . . . . . . . . . . . . . . . . — 47 — — 47Other . . . . . . . . . . . . . . . . . . . . . . . . . . . . . . . . — — 27 — 27Netting adjustment . . . . . . . . . . . . . . . . . . . . . . — — — (6,724) (6,724)
Mortgage commitment derivatives. . . . . . . . . . . — 490 20 — 510Total other assets . . . . . . . . . . . . . . . . . . . . . . . . . . . — 7,185 239 (6,724) 700
Total assets at fair value. . . . . . . . . . . . . . . . . . $ 30,746 $ 41,527 $ 5,848 $ (6,724) $ 71,397
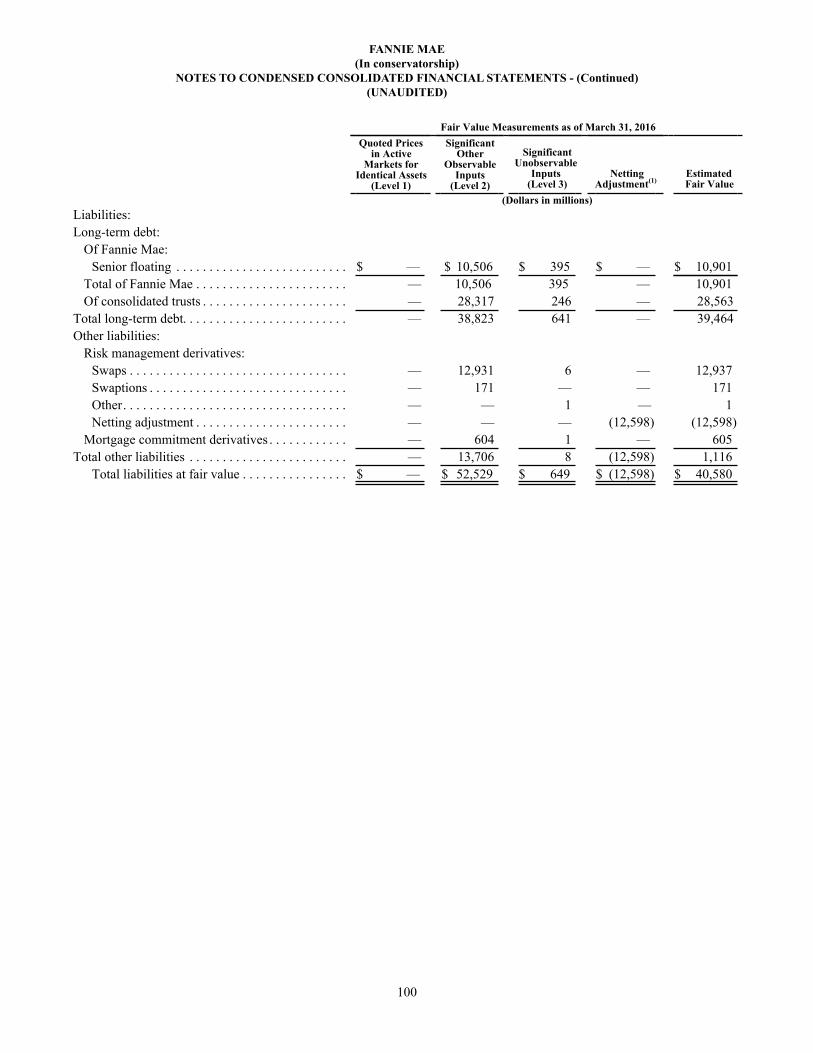
FANNIE MAE(In conservatorship)
NOTES TO CONDENSED CONSOLIDATED FINANCIAL STATEMENTS - (Continued)(UNAUDITED)
100
Fair Value Measurements as of March 31, 2016Quoted Prices
in ActiveMarkets for
Identical Assets(Level 1)
Significant Other
Observable Inputs
(Level 2)
Significant Unobservable
Inputs(Level 3)
Netting Adjustment(1)
EstimatedFair Value
(Dollars in millions)Liabilities:Long-term debt:
Of Fannie Mae:Senior floating . . . . . . . . . . . . . . . . . . . . . . . . . . $ — $ 10,506 $ 395 $ — $ 10,901
Total of Fannie Mae . . . . . . . . . . . . . . . . . . . . . . . — 10,506 395 — 10,901Of consolidated trusts . . . . . . . . . . . . . . . . . . . . . . — 28,317 246 — 28,563
Total long-term debt. . . . . . . . . . . . . . . . . . . . . . . . . — 38,823 641 — 39,464Other liabilities:
Risk management derivatives:Swaps . . . . . . . . . . . . . . . . . . . . . . . . . . . . . . . . . — 12,931 6 — 12,937Swaptions . . . . . . . . . . . . . . . . . . . . . . . . . . . . . . — 171 — — 171Other. . . . . . . . . . . . . . . . . . . . . . . . . . . . . . . . . . — — 1 — 1Netting adjustment . . . . . . . . . . . . . . . . . . . . . . . — — — (12,598) (12,598)
Mortgage commitment derivatives . . . . . . . . . . . . — 604 1 — 605Total other liabilities . . . . . . . . . . . . . . . . . . . . . . . . — 13,706 8 (12,598) 1,116
Total liabilities at fair value . . . . . . . . . . . . . . . . $ — $ 52,529 $ 649 $ (12,598) $ 40,580

FANNIE MAE(In conservatorship)
NOTES TO CONDENSED CONSOLIDATED FINANCIAL STATEMENTS - (Continued)(UNAUDITED)
101
Fair Value Measurements as of December 31, 2015Quoted Prices
in ActiveMarkets for
Identical Assets(Level 1)
SignificantOther
ObservableInputs
(Level 2)
Significant Unobservable
Inputs (Level 3)
Netting Adjustment(1)
EstimatedFair Value
(Dollars in millions)
Assets:Trading securities:
Mortgage-related securities:Fannie Mae. . . . . . . . . . . . . . . . . . . . . . . . . . . . . $ — $ 4,813 $ — $ — $ 4,813Freddie Mac . . . . . . . . . . . . . . . . . . . . . . . . . . . . — 1,314 — — 1,314Ginnie Mae. . . . . . . . . . . . . . . . . . . . . . . . . . . . . — 426 — — 426Alt-A private-label securities . . . . . . . . . . . . . . . — 131 305 — 436Subprime private-label securities . . . . . . . . . . . . — — 644 — 644CMBS. . . . . . . . . . . . . . . . . . . . . . . . . . . . . . . . . — 2,341 — — 2,341Mortgage revenue bonds . . . . . . . . . . . . . . . . . . — — 449 — 449
Non-mortgage-related securities:U.S. Treasury securities . . . . . . . . . . . . . . . . . . . 29,485 — — — 29,485
Total trading securities. . . . . . . . . . . . . . . . . . . . . . . 29,485 9,025 1,398 — 39,908Available-for-sale securities:
Mortgage-related securities:Fannie Mae. . . . . . . . . . . . . . . . . . . . . . . . . . . . . — 4,221 — — 4,221Freddie Mac . . . . . . . . . . . . . . . . . . . . . . . . . . . . — 4,295 4 — 4,299Ginnie Mae. . . . . . . . . . . . . . . . . . . . . . . . . . . . . — 391 — — 391Alt-A private-label securities . . . . . . . . . . . . . . . — 1,637 1,041 — 2,678Subprime private-label securities . . . . . . . . . . . . — — 3,281 — 3,281CMBS. . . . . . . . . . . . . . . . . . . . . . . . . . . . . . . . . — 1,255 — — 1,255Mortgage revenue bonds . . . . . . . . . . . . . . . . . . — — 2,701 — 2,701Other. . . . . . . . . . . . . . . . . . . . . . . . . . . . . . . . . . — — 1,404 — 1,404
Total available-for-sale securities . . . . . . . . . . . . . . — 11,799 8,431 — 20,230Mortgage loans. . . . . . . . . . . . . . . . . . . . . . . . . . . . . — 12,598 1,477 — 14,075Other assets:
Risk management derivatives:Swaps . . . . . . . . . . . . . . . . . . . . . . . . . . . . . . . . . — 4,541 156 — 4,697Swaptions . . . . . . . . . . . . . . . . . . . . . . . . . . . . . . — 53 — — 53Other. . . . . . . . . . . . . . . . . . . . . . . . . . . . . . . . . . — — 28 — 28Netting adjustment . . . . . . . . . . . . . . . . . . . . . . . — — — (4,024) (4,024)
Mortgage commitment derivatives . . . . . . . . . . . . — 135 5 — 140Total other assets . . . . . . . . . . . . . . . . . . . . . . . . . . . — 4,729 189 (4,024) 894
Total assets at fair value . . . . . . . . . . . . . . . . . . . $ 29,485 $ 38,151 $ 11,495 $ (4,024) $ 75,107
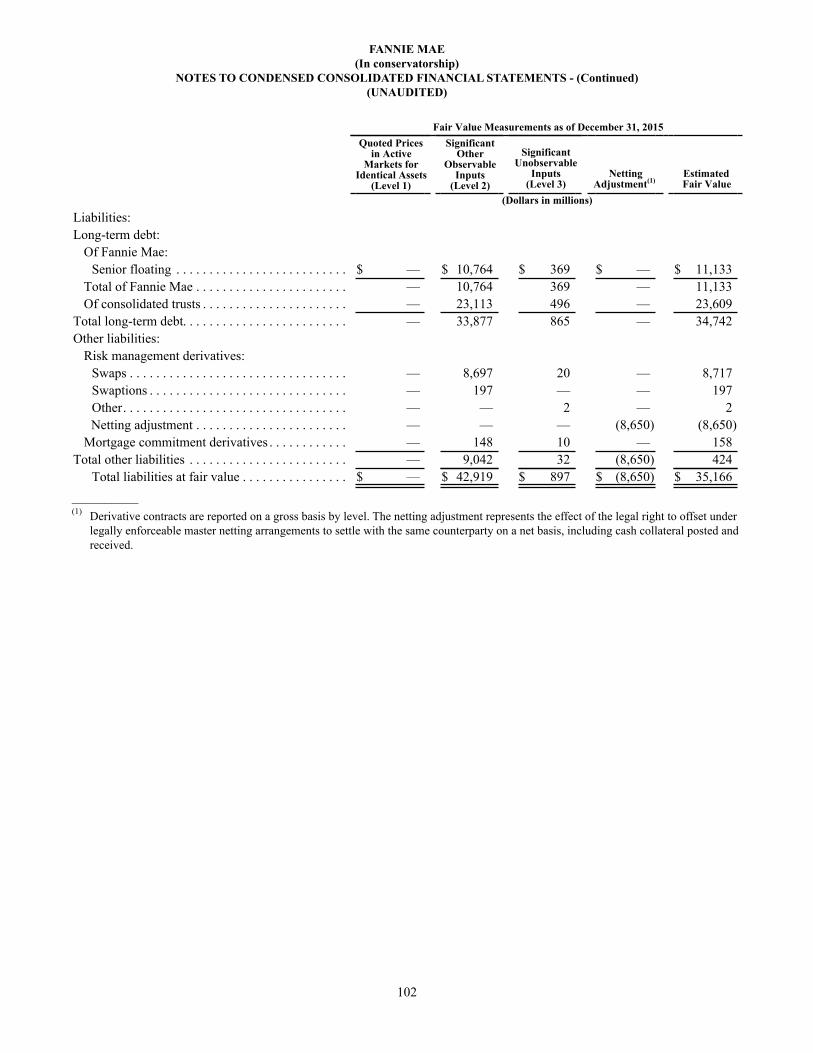
FANNIE MAE(In conservatorship)
NOTES TO CONDENSED CONSOLIDATED FINANCIAL STATEMENTS - (Continued)(UNAUDITED)
102
Fair Value Measurements as of December 31, 2015Quoted Prices
in ActiveMarkets for
Identical Assets(Level 1)
SignificantOther
ObservableInputs
(Level 2)
Significant Unobservable
Inputs (Level 3)
Netting Adjustment(1)
EstimatedFair Value
(Dollars in millions)
Liabilities:Long-term debt:
Of Fannie Mae:Senior floating . . . . . . . . . . . . . . . . . . . . . . . . . . $ — $ 10,764 $ 369 $ — $ 11,133
Total of Fannie Mae . . . . . . . . . . . . . . . . . . . . . . . — 10,764 369 — 11,133Of consolidated trusts . . . . . . . . . . . . . . . . . . . . . . — 23,113 496 — 23,609
Total long-term debt. . . . . . . . . . . . . . . . . . . . . . . . . — 33,877 865 — 34,742Other liabilities:
Risk management derivatives:Swaps . . . . . . . . . . . . . . . . . . . . . . . . . . . . . . . . . — 8,697 20 — 8,717Swaptions . . . . . . . . . . . . . . . . . . . . . . . . . . . . . . — 197 — — 197Other. . . . . . . . . . . . . . . . . . . . . . . . . . . . . . . . . . — — 2 — 2
Netting adjustment . . . . . . . . . . . . . . . . . . . . . . . — — — (8,650) (8,650)Mortgage commitment derivatives . . . . . . . . . . . . — 148 10 — 158
Total other liabilities . . . . . . . . . . . . . . . . . . . . . . . . — 9,042 32 (8,650) 424Total liabilities at fair value . . . . . . . . . . . . . . . . $ — $ 42,919 $ 897 $ (8,650) $ 35,166
__________(1) Derivative contracts are reported on a gross basis by level. The netting adjustment represents the effect of the legal right to offset under
legally enforceable master netting arrangements to settle with the same counterparty on a net basis, including cash collateral posted and received.

FANNIE MAE(In conservatorship)
NOTES TO CONDENSED CONSOLIDATED FINANCIAL STATEMENTS - (Continued)(UNAUDITED)
103
The following tables display a reconciliation of all assets and liabilities measured at fair value on a recurring basis using significant unobservable inputs (Level 3). The tables also display gains and losses due to changes in fair value, including both realized and unrealized gains and losses, recognized in our condensed consolidated statements of operations and comprehensive income for Level 3 assets and liabilities. When assets and liabilities are transferred between levels, we recognize the transfer as of the end of the period.
Fair Value Measurements Using Significant Unobservable Inputs (Level 3)For the Three Months Ended March 31, 2016
Total Gains (Losses)(Realized/Unrealized) Net Unrealized
Gains (Losses) Included in Net Income Related
to Assets and Liabilities Still
Held as of March 31, 2016(5)(6)
Balance,December 31,
2015
Includedin Net
Income
Included in Total Other
Comprehensive Loss(1) Purchases(2) Sales(2) Issues(3) Settlements(3)
Transfers out of
Level 3(4)
Transfers into
Level 3(4)
Balance,March 31,
2016
(Dollars in millions)
Trading securities:
Mortgage-related:
Fannie Mae . . . . . . . $ — $ — $ — $ — $ — $ — $ — $ — $ 25 $ 25 $ —
Freddie Mac . . . . . . . — — — — — — — — 1 1 —
Alt-A private-labelsecurities. . . . . . . . 305 (54) — — — — (6) — — 245 (55)
Subprime private-label securities . . . 644 (37) — — (187) — (14) (363) — 43 (12)
Mortgage revenuebonds . . . . . . . . . . 449 12 — — (95) — (3) — — 363 10
Total trading securities . $ 1,398 $ (79) (6)(7) $ — $ — $ (282) $ — $ (23) $ (363) $ 26 $ 677 $ (57)
Available-for-salesecurities:
Mortgage-related:
Fannie Mae . . . . . . . $ — $ — $ — $ — $ — $ — $ — $ — $ 1 $ 1 $ —
Freddie Mac . . . . . . . 4 — — — — — — (2) — 2 —
Alt-A private-labelsecurities. . . . . . . . 1,041 12 (29) — (291) — (40) (516) — 177 —
Subprime private-label securities . . . 3,281 91 (139) — (584) — (104) (2,323) — 222 —
Mortgage revenuebonds . . . . . . . . . . 2,701 4 30 — (43) — (128) — — 2,564 —
Other . . . . . . . . . . . . 1,404 (3) (25) — (404) — (33) (284) — 655 —
Total available-for-salesecurities . . . . . . . . . $ 8,431 $ 104
(7)(8)$ (163) $ — $ (1,322) $ — $ (305) $ (3,125) $ 1 $ 3,621 $ —
Mortgage loans . . . . . . . $ 1,477 $ 101(6)(7)
$ — $ — $ (320) $ — $ (72) $ (65) $ 190 $ 1,311 $ 13
Net derivatives . . . . . . . 157 180 (6) — — — (4) (100) (2) — 231 66
Long-term debt:
Of Fannie Mae:
Senior floating. . . . $ (369) $ (26) $ — $ — $ — $ — $ — $ — $ — $ (395) $ (26)
Of consolidated trusts (496) (68) — — — (7) 309 37 (21) (246) (2)
Total long-term debt . . . $ (865) $ (94) (6) $ — $ — $ — $ (7) $ 309 $ 37 $ (21) $ (641) $ (28)
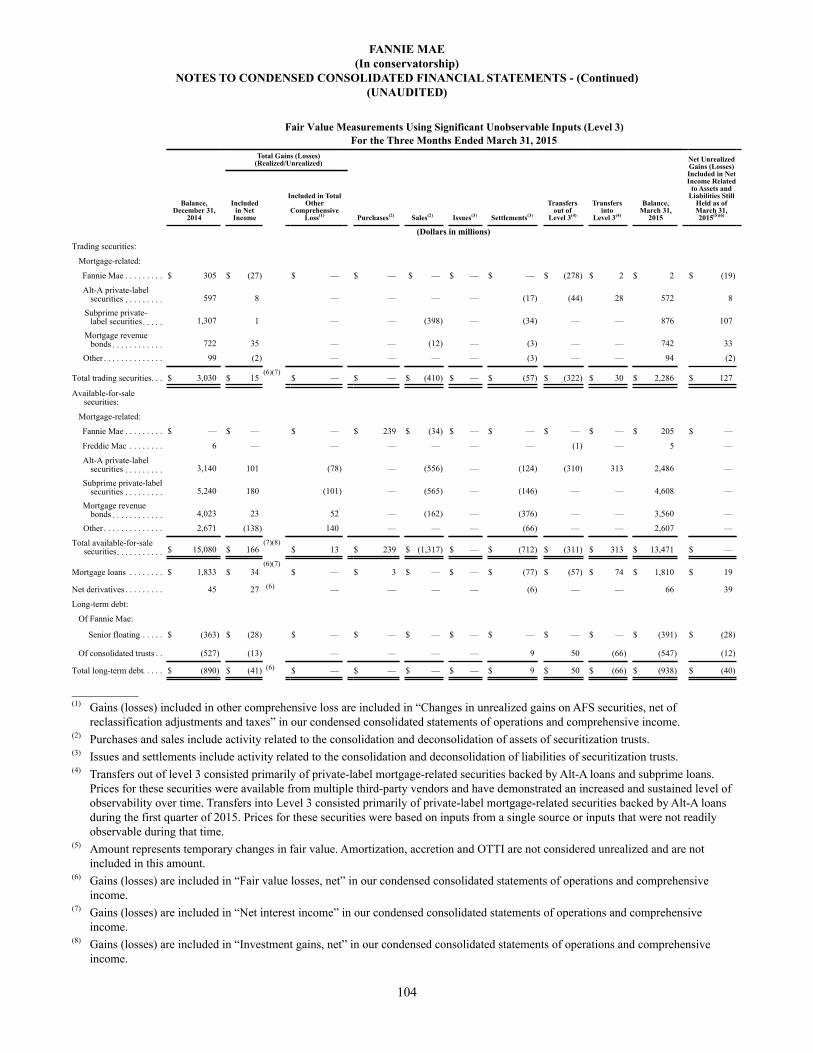
FANNIE MAE(In conservatorship)
NOTES TO CONDENSED CONSOLIDATED FINANCIAL STATEMENTS - (Continued)(UNAUDITED)
104
Fair Value Measurements Using Significant Unobservable Inputs (Level 3)For the Three Months Ended March 31, 2015
Total Gains (Losses)(Realized/Unrealized) Net Unrealized
Gains (Losses) Included in Net Income Related
to Assets and Liabilities Still
Held as of March 31, 2015(5)(6)
Balance,December 31,
2014
Includedin Net
Income
Included in Total Other
Comprehensive Loss(1) Purchases(2) Sales(2) Issues(3) Settlements(3)
Transfers out of
Level 3(4)
Transfers into
Level 3(4)
Balance,March 31,
2015
(Dollars in millions)
Trading securities:
Mortgage-related:
Fannie Mae . . . . . . . . . $ 305 $ (27) $ — $ — $ — $ — $ — $ (278) $ 2 $ 2 $ (19)
Alt-A private-labelsecurities . . . . . . . . . 597 8 — — — — (17) (44) 28 572 8
Subprime private-label securities. . . . . 1,307 1 — — (398) — (34) — — 876 107
Mortgage revenuebonds . . . . . . . . . . . . 722 35 — — (12) — (3) — — 742 33
Other . . . . . . . . . . . . . . 99 (2) — — — — (3) — — 94 (2)
Total trading securities. . . $ 3,030 $ 15(6)(7)
$ — $ — $ (410) $ — $ (57) $ (322) $ 30 $ 2,286 $ 127
Available-for-salesecurities:
Mortgage-related:
Fannie Mae . . . . . . . . . $ — $ — $ — $ 239 $ (34) $ — $ — $ — $ — $ 205 $ —
Freddie Mac . . . . . . . . 6 — — — — — — (1) — 5 —
Alt-A private-labelsecurities . . . . . . . . . 3,140 101 (78) — (556) — (124) (310) 313 2,486 —
Subprime private-labelsecurities . . . . . . . . . 5,240 180 (101) — (565) — (146) — — 4,608 —
Mortgage revenuebonds . . . . . . . . . . . . 4,023 23 52 — (162) — (376) — — 3,560 —
Other . . . . . . . . . . . . . . 2,671 (138) 140 — — — (66) — — 2,607 —
Total available-for-salesecurities. . . . . . . . . . . $ 15,080 $ 166
(7)(8)$ 13 $ 239 $ (1,317) $ — $ (712) $ (311) $ 313 $ 13,471 $ —
Mortgage loans . . . . . . . . $ 1,833 $ 34(6)(7)
$ — $ 3 $ — $ — $ (77) $ (57) $ 74 $ 1,810 $ 19
Net derivatives . . . . . . . . . 45 27 (6) — — — — (6) — — 66 39
Long-term debt:
Of Fannie Mae:
Senior floating . . . . . $ (363) $ (28) $ — $ — $ — $ — $ — $ — $ — $ (391) $ (28)
Of consolidated trusts . . (527) (13) — — — — 9 50 (66) (547) (12)
Total long-term debt. . . . . $ (890) $ (41) (6) $ — $ — $ — $ — $ 9 $ 50 $ (66) $ (938) $ (40)
__________(1) Gains (losses) included in other comprehensive loss are included in “Changes in unrealized gains on AFS securities, net of
reclassification adjustments and taxes” in our condensed consolidated statements of operations and comprehensive income.(2) Purchases and sales include activity related to the consolidation and deconsolidation of assets of securitization trusts.(3) Issues and settlements include activity related to the consolidation and deconsolidation of liabilities of securitization trusts.(4) Transfers out of level 3 consisted primarily of private-label mortgage-related securities backed by Alt-A loans and subprime loans.
Prices for these securities were available from multiple third-party vendors and have demonstrated an increased and sustained level of observability over time. Transfers into Level 3 consisted primarily of private-label mortgage-related securities backed by Alt-A loans during the first quarter of 2015. Prices for these securities were based on inputs from a single source or inputs that were not readily observable during that time.
(5) Amount represents temporary changes in fair value. Amortization, accretion and OTTI are not considered unrealized and are not included in this amount.
(6) Gains (losses) are included in “Fair value losses, net” in our condensed consolidated statements of operations and comprehensive income.
(7) Gains (losses) are included in “Net interest income” in our condensed consolidated statements of operations and comprehensive income.
(8) Gains (losses) are included in “Investment gains, net” in our condensed consolidated statements of operations and comprehensive income.

FANNIE MAE(In conservatorship)
NOTES TO CONDENSED CONSOLIDATED FINANCIAL STATEMENTS - (Continued)(UNAUDITED)
105
The following tables display valuation techniques and the range and the weighted average of significant unobservable inputs for our Level 3 assets and liabilities measured at fair value on a recurring basis.
Fair Value Measurements as of March 31, 2016
FairValue
Significant ValuationTechniques
Significant Unobservable Inputs(1) Range(1)
Weighted - Average(1)
(Dollars in millions)Recurring fair value measurements:
Trading securities:Mortgage-related securities:Agency(2) . . . . . . . . . . . . . . . . . . . . . . . . $ 25 Consensus
1 OtherTotal Agency . . . . . . . . . . . . . . . . . . . . 26
Alt-A private-label securities(3) . . . . . . . 60 Consensus185 Discounted Cash Flow Default Rate (%) 0.9 - 4.0 3.4
Prepayment Speed (%) 2.0 - 6.0 5.3Severity (%) 95.0 95.0Spreads (bps) 339.2 - 644.8 587.7
Total Alt-A private-label securities . . . 245 Subprime private-label securities(3) . . . . . 43 Discounted Cash Flow Default Rate (%) 4.4 4.4
Prepayment Speed (%) 4.8 4.8Severity (%) 56.0 56.0Spreads (bps) 724.9 724.9
Total subprime private-label securities 43Mortgage revenue bonds . . . . . . . . . . . . . 353 Discounted Cash Flow Spreads (bps) 23.5 - 348.6 319.0
10 OtherTotal mortgage revenue bonds. . . . . . . 363
Total trading securities . . . . . . . . . . . . . . . . . $ 677

FANNIE MAE(In conservatorship)
NOTES TO CONDENSED CONSOLIDATED FINANCIAL STATEMENTS - (Continued)(UNAUDITED)
106
Fair Value Measurements as of March 31, 2016Fair
ValueSignificant Valuation
TechniquesSignificant
Unobservable Inputs(1) Range(1)Weighted - Average(1)
(Dollars in millions)Available-for-sale securities:
Mortgage-related securities:Agency(2) . . . . . . . . . . . . . . . . . . . . . . . . $ 3 OtherAlt-A private-label securities(3) . . . . . . . 106 Consensus Default Rate (%) 4.0 - 6.0 4.2
Prepayment Speed (%) 5.0 - 7.0 5.2Severity (%) 50.0 - 70.0 55.5Spreads (bps) 306.4 - 382.3 372.7
71 Discounted Cash Flow Default Rate (%) 3.5 - 6.0 4.5Prepayment Speed (%) 4.0 - 7.5 5.4Severity (%) 41.0 - 56.0 50.1Spreads (bps) 311.3 - 406.0 384.7
Total Alt-A private-label securities . . . 177Subprime private-label securities (3) . . . . 170 Consensus Default Rate (%) 5.0 - 7.0 6.0
Prepayment Speed (%) 3.0 - 4.0 3.5Severity (%) 88.0 - 95.0 91.5Spreads (bps) 431.9 - 480.3 455.8
52 OtherTotal subprime private-label securities 222
Mortgage revenue bonds . . . . . . . . . . . . 988 Single Vendor Spreads (bps) 3.5 - 395.6 57.81,420 Discounted Cash Flow Spreads (bps) 3.5 - 424.6 313.0
156 OtherTotal mortgage revenue bonds. . . . . . . 2,564
Other. . . . . . . . . . . . . . . . . . . . . . . . . . . . 97 Consensus Default Rate (%) 3.5 3.5Prepayment Speed (%) 2.5 - 3.0 2.8Severity (%) 88.0 88.0Spreads (bps) 358.1 - 479.1 413.5
546 Discounted Cash Flow Default Rate (%) 2.1 - 3.8 3.7Prepayment Speed (%) 0.8 - 6.0 5.9Severity (%) 4.0 - 95.0 6.3Spreads (bps) 235.0 - 487.0 475.5
12 OtherTotal other . . . . . . . . . . . . . . . . . . . . . . 655
Total available-for-sale securities. . . . . . . . . $ 3,621

FANNIE MAE(In conservatorship)
NOTES TO CONDENSED CONSOLIDATED FINANCIAL STATEMENTS - (Continued)(UNAUDITED)
107
Fair Value Measurements as of March 31, 2016
FairValue
Significant ValuationTechniques
Significant Unobservable Inputs(1) Range(1)
Weighted - Average(1)
(Dollars in millions)Mortgage loans:
Single-family . . . . . . . . . . . . . . . . . . . . . . $ 120 Build-Up Default Rate (%) 0.0 - 98.7 36.7Prepayment Speed (%) 3.6 - 100.0 10.8Severity (%) 0.0 - 100.0 40.0
602 Build-Up105 Consensus Default Rate (%) 0.5 - 4.9 2.3
Prepayment Speed (%) 1.0 - 13.8 5.8Severity (%) 20.0 - 95.0 74.4Spreads (bps) 268.7 - 345.0 278.1
261 Consensus72 Other
Total single-family. . . . . . . . . . . . . . . . . 1,160Multifamily. . . . . . . . . . . . . . . . . . . . . . . . 151 Build-Up Spreads (bps) 70.0 - 364.2 179.9
Total mortgage loans. . . . . . . . . . . . . . . . . . $ 1,311Net derivatives. . . . . . . . . . . . . . . . . . . . . . . $ 187 Dealer Mark
44 OtherTotal net derivatives . . . . . . . . . . . . . . . . . $ 231
Long-term debt:Of Fannie Mae:
Senior floating . . . . . . . . . . . . . . . . . . . $ (395) Discounted Cash FlowOf consolidated trusts(4) . . . . . . . . . . . . . . (118) Consensus
(128) OtherTotal of consolidated trusts . . . . . . . . . . (246)
Total long-term debt . . . . . . . . . . . . . . . . . . $ (641)
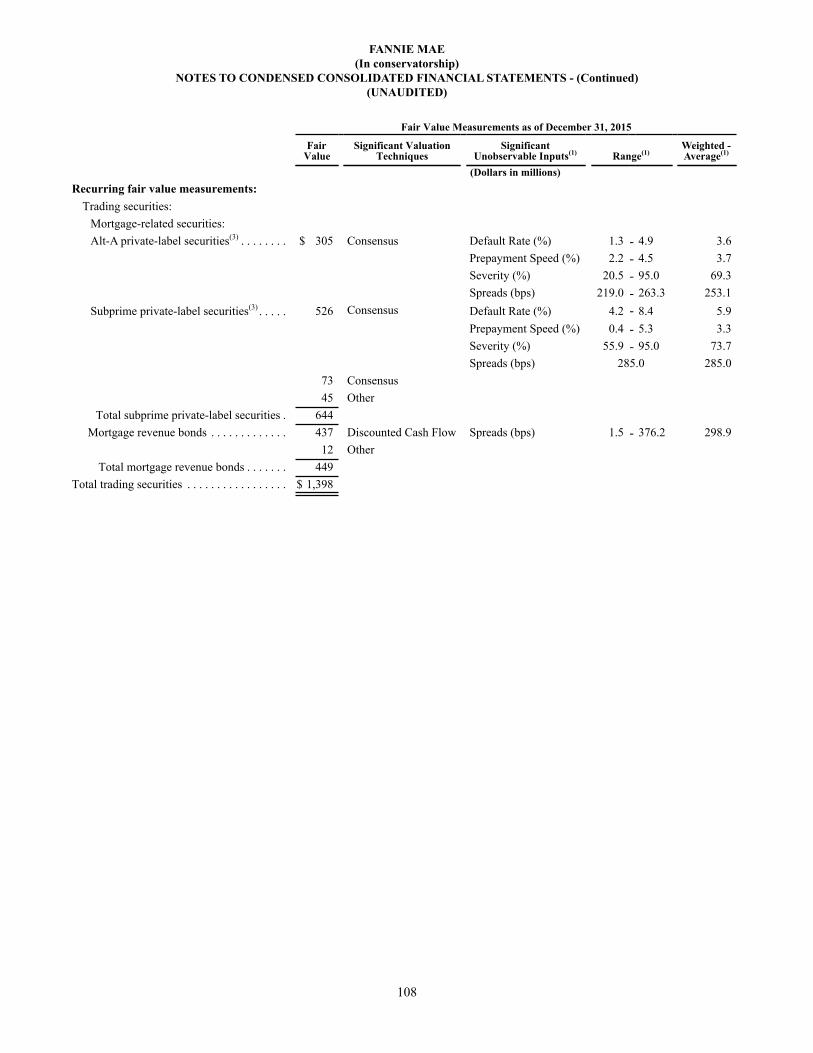
FANNIE MAE(In conservatorship)
NOTES TO CONDENSED CONSOLIDATED FINANCIAL STATEMENTS - (Continued)(UNAUDITED)
108
Fair Value Measurements as of December 31, 2015
FairValue
Significant ValuationTechniques
Significant Unobservable Inputs(1) Range(1)
Weighted - Average(1)
(Dollars in millions)Recurring fair value measurements:
Trading securities:Mortgage-related securities:Alt-A private-label securities(3) . . . . . . . . $ 305 Consensus Default Rate (%) 1.3 - 4.9 3.6
Prepayment Speed (%) 2.2 - 4.5 3.7Severity (%) 20.5 - 95.0 69.3Spreads (bps) 219.0 - 263.3 253.1
Subprime private-label securities(3) . . . . . 526 Consensus Default Rate (%) 4.2 - 8.4 5.9Prepayment Speed (%) 0.4 - 5.3 3.3Severity (%) 55.9 - 95.0 73.7Spreads (bps) 285.0 285.0
73 Consensus45 Other
Total subprime private-label securities . 644Mortgage revenue bonds . . . . . . . . . . . . . 437 Discounted Cash Flow Spreads (bps) 1.5 - 376.2 298.9
12 OtherTotal mortgage revenue bonds . . . . . . . 449
Total trading securities . . . . . . . . . . . . . . . . . $ 1,398

FANNIE MAE(In conservatorship)
NOTES TO CONDENSED CONSOLIDATED FINANCIAL STATEMENTS - (Continued)(UNAUDITED)
109
Fair Value Measurements as of December 31, 2015Fair
ValueSignificant Valuation
TechniquesSignificant
Unobservable Inputs(1) Range(1)Weighted - Average(1)
(Dollars in millions)Available-for-sale securities:
Mortgage-related securities:Agency(2) . . . . . . . . . . . . . . . . . . . . . . . . $ 4 OtherAlt-A private-label securities(3) . . . . . . . 671 Consensus Default Rate (%) 0.5 - 40.7 3.4
Prepayment Speed (%) 1.7 - 72.6 13.5Severity (%) 1.4 - 95.0 58.5Spreads (bps) 225.6 - 280.4 260.0
201 Consensus169 Discounted Cash Flow Default Rate (%) 4.0 - 5.0 4.8
Prepayment Speed (%) 4.0 - 7.5 6.4Severity (%) 50.0 - 64.0 59.2Spreads (bps) 260.0 - 369.4 296.5
Total Alt-A private-label securities . . . 1,041Subprime private-label securities(3) . . . . 343 Single Vendor Default Rate (%) 2.5 - 7.5 4.8
Prepayment Speed (%) 1.9 - 5.7 3.3Severity (%) 67.6 - 85.7 72.7Spreads (bps) 285.0 - 340.0 299.6
1,848 Consensus Default Rate (%) 0.5 - 11.3 5.9Prepayment Speed (%) 0.5 - 11.2 3.8Severity (%) 20.0 - 95.0 79.0Spreads (bps) 255.0 - 285.0 283.3
945 Consensus145 Other
Total subprime private-label securities 3,281Mortgage revenue bonds . . . . . . . . . . . . 991 Single Vendor Spreads (bps) (33.1) - 386.8 37.9
1,462 Discounted Cash Flow Spreads (bps) (15.8) - 379.1 283.8248 Other
Total mortgage revenue bonds. . . . . . . 2,701Other. . . . . . . . . . . . . . . . . . . . . . . . . . . . 683 Consensus Default Rate (%) 0.5 - 4.6 3.4
Prepayment Speed (%) 2.5 - 15.5 4.7Severity (%) 6.6 - 95.0 65.7Spreads (bps) 200.0 - 454.4 315.6
520 Discounted Cash Flow Default Rate (%) 0.0 - 1.8 0.0Prepayment Speed (%) 0.0 - 0.5 0.0Severity (%) 95.0 95.0Spreads (bps) 260.0 - 350.0 323.6
201 OtherTotal other . . . . . . . . . . . . . . . . . . . . . . 1,404
Total available-for-sale securities. . . . . . . . . $ 8,431

FANNIE MAE(In conservatorship)
NOTES TO CONDENSED CONSOLIDATED FINANCIAL STATEMENTS - (Continued)(UNAUDITED)
110
Fair Value Measurements as of December 31, 2015
FairValue
Significant ValuationTechniques
Significant Unobservable Inputs(1) Range(1)
Weighted - Average(1)
(Dollars in millions)Mortgage loans:
Single-family. . . . . . . . . . . . . . . . . . . . . . . $ 127 Build-Up Default Rate (%) 0.0 - 99.2 34.8Prepayment Speed (%) 3.0 - 100.0 10.4Severity (%) 0.0 - 100.0 39.9
632 Build-Up234 Consensus Default Rate (%) 0.5 - 5.0 3.7
Prepayment Speed (%) 2.5 - 26.0 6.4Severity (%) 20.0 - 89.1 69.0Spreads (bps) 255.0 - 277.6 264.6
274 Consensus54 Other
Total single-family . . . . . . . . . . . . . . . . . 1,321Multifamily . . . . . . . . . . . . . . . . . . . . . . . . 156 Build-Up Spreads (bps) 70.0 - 327.2 158.8
Total mortgage loans . . . . . . . . . . . . . . . . . . $ 1,477Net derivatives . . . . . . . . . . . . . . . . . . . . . . . $ 17 Internal Model
136 Dealer Mark4 Other
Total net derivatives. . . . . . . . . . . . . . . . . . $ 157Long-term debt:
Of Fannie Mae:Senior floating . . . . . . . . . . . . . . . . . . . . $ (369) Discounted Cash Flow
Of consolidated trusts(4) . . . . . . . . . . . . . . (181) Consensus Default Rate (%) 0.5 - 3.8 3.4Prepayment Speed (%) 2.5 - 26.0 5.6Severity (%) 20.0 - 80.6 67.8Spreads (bps) 255.0 - 270.0 265.8
(149) Consensus(166) Other
Total of consolidated trusts. . . . . . . . . . . (496)Total long-term debt . . . . . . . . . . . . . . . . . . $ (865)_________(1) Valuation techniques for which no unobservable inputs are disclosed generally reflect the use of third-party pricing services or dealers,
and the range of unobservable inputs applied by these sources is not readily available or cannot be reasonably estimated. Where we have disclosed unobservable inputs for consensus and single vendor techniques, those inputs are based on our validations performed at the security level using discounted cash flows.
(2) Includes Fannie Mae and Freddie Mac securities.(3) Default rate as disclosed represents the estimated beginning annualized rate of default and is used as a basis to forecast the future
default rates that serve as an input for valuation.(4) Includes instruments for which the prepayment speed as disclosed represents the estimated annualized rate of prepayment after all
prepayment penalty provisions have expired and also instruments for which prepayment speed as disclosed represents the estimated rate of prepayment over the remaining life of the instrument.
In our condensed consolidated balance sheets certain assets and liabilities are measured at fair value on a nonrecurring basis; that is, the instruments are not measured at fair value on an ongoing basis but are subject to fair value adjustments in certain circumstances (for example, when we evaluate loans for impairment). We did not have any Level 1 assets or liabilities held as of March 31, 2016 or December 31, 2015 that were measured at fair value on a nonrecurring basis. We held Level 2 assets, comprised of mortgage loans held for sale, as of March 31, 2016 and December 31, 2015 that had fair value measurements of $8 million and $17 million during the three months ended March 31, 2016 and the year ended December 31, 2015, respectively. We had no Level 2 liabilities as of March 31, 2016 and December 31, 2015, that were measured at fair value on a nonrecurring basis.
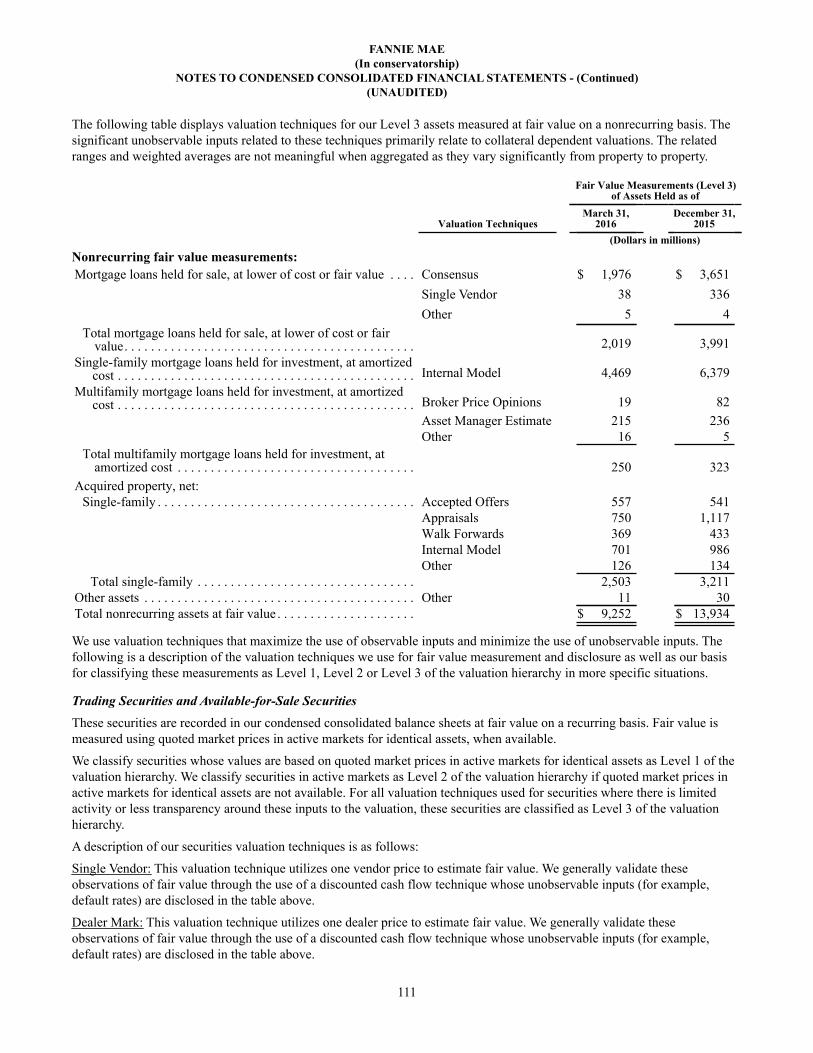
FANNIE MAE(In conservatorship)
NOTES TO CONDENSED CONSOLIDATED FINANCIAL STATEMENTS - (Continued)(UNAUDITED)
111
The following table displays valuation techniques for our Level 3 assets measured at fair value on a nonrecurring basis. The significant unobservable inputs related to these techniques primarily relate to collateral dependent valuations. The related ranges and weighted averages are not meaningful when aggregated as they vary significantly from property to property.
Fair Value Measurements (Level 3)of Assets Held as of
Valuation TechniquesMarch 31,
2016December 31,
2015(Dollars in millions)
Nonrecurring fair value measurements:Mortgage loans held for sale, at lower of cost or fair value . . . . Consensus $ 1,976 $ 3,651
Single Vendor 38 336Other 5 4
Total mortgage loans held for sale, at lower of cost or fairvalue. . . . . . . . . . . . . . . . . . . . . . . . . . . . . . . . . . . . . . . . . . . . 2,019 3,991
Single-family mortgage loans held for investment, at amortizedcost . . . . . . . . . . . . . . . . . . . . . . . . . . . . . . . . . . . . . . . . . . . . . Internal Model 4,469 6,379
Multifamily mortgage loans held for investment, at amortizedcost . . . . . . . . . . . . . . . . . . . . . . . . . . . . . . . . . . . . . . . . . . . . . Broker Price Opinions 19 82
Asset Manager Estimate 215 236Other 16 5
Total multifamily mortgage loans held for investment, atamortized cost . . . . . . . . . . . . . . . . . . . . . . . . . . . . . . . . . . . . 250 323
Acquired property, net:Single-family . . . . . . . . . . . . . . . . . . . . . . . . . . . . . . . . . . . . . . . Accepted Offers 557 541
Appraisals 750 1,117Walk Forwards 369 433Internal Model 701 986Other 126 134
Total single-family . . . . . . . . . . . . . . . . . . . . . . . . . . . . . . . . . 2,503 3,211Other assets . . . . . . . . . . . . . . . . . . . . . . . . . . . . . . . . . . . . . . . . . Other 11 30Total nonrecurring assets at fair value . . . . . . . . . . . . . . . . . . . . . $ 9,252 $ 13,934
We use valuation techniques that maximize the use of observable inputs and minimize the use of unobservable inputs. The following is a description of the valuation techniques we use for fair value measurement and disclosure as well as our basis for classifying these measurements as Level 1, Level 2 or Level 3 of the valuation hierarchy in more specific situations.
Trading Securities and Available-for-Sale SecuritiesThese securities are recorded in our condensed consolidated balance sheets at fair value on a recurring basis. Fair value is measured using quoted market prices in active markets for identical assets, when available.
We classify securities whose values are based on quoted market prices in active markets for identical assets as Level 1 of the valuation hierarchy. We classify securities in active markets as Level 2 of the valuation hierarchy if quoted market prices in active markets for identical assets are not available. For all valuation techniques used for securities where there is limited activity or less transparency around these inputs to the valuation, these securities are classified as Level 3 of the valuation hierarchy.
A description of our securities valuation techniques is as follows:
Single Vendor: This valuation technique utilizes one vendor price to estimate fair value. We generally validate these observations of fair value through the use of a discounted cash flow technique whose unobservable inputs (for example, default rates) are disclosed in the table above.
Dealer Mark: This valuation technique utilizes one dealer price to estimate fair value. We generally validate these observations of fair value through the use of a discounted cash flow technique whose unobservable inputs (for example, default rates) are disclosed in the table above.
FANNIE MAE(In conservatorship)
NOTES TO CONDENSED CONSOLIDATED FINANCIAL STATEMENTS - (Continued)(UNAUDITED)
112
Consensus: This technique utilizes an average of two or more vendor prices for similar securities. We generally validate these observations of fair value through the use of a discounted cash flow technique whose unobservable inputs (for example, default rates) are disclosed in the table above.
Discounted Cash Flow: In the absence of prices provided by third-party pricing services supported by observable market data, we estimate the fair value of a portion of our securities using a discounted cash flow technique that uses inputs such as default rates, prepayment speeds, loss severity and spreads based on market assumptions where available.
For private-label securities, an increase in unobservable prepayment speeds in isolation would generally result in an increase in fair value, and an increase in unobservable spreads, severity rates or default rates in isolation would generally result in a decrease in fair value. For mortgage revenue bonds classified as Level 3 of the valuation hierarchy, an increase in unobservable spreads would result in a decrease in fair value. Although the sensitivities of the fair value of our recurring Level 3 securities of the valuation hierarchy to various unobservable inputs are discussed above in isolation, interrelationships exist among these inputs such that a change in one unobservable input typically results in a change to one or more of the other inputs.
Mortgage Loans Held for InvestmentThe majority of HFI loans are reported in our condensed consolidated balance sheets at the principal amount outstanding, net of cost basis adjustments and an allowance for loan losses. We estimate the fair value of HFI loans using the build-up and consensus valuation techniques, as discussed below, for periodic disclosure of financial instruments as required by GAAP. For our remaining loans, which include those containing embedded derivatives that would otherwise require bifurcation and consolidated loans of senior-subordinated trust structures, we elected the fair value option and therefore, we record these loans at fair value in our condensed consolidated balance sheets. We measure these loans on a recurring basis using the build-up, consensus, discounted cash flow and single vendor price techniques. Certain impaired loans are measured at fair value on a nonrecurring basis by using the fair value of their underlying collateral. Specific techniques used include internal models, broker price opinions and appraisals.
A description of our loan valuation techniques is as follows:
Build-up: We derive the fair value of mortgage loans using a build-up valuation technique. In the build-up valuation technique we start with the base value for our Fannie Mae MBS and then add or subtract the fair value of the associated guaranty asset, guaranty obligation (“GO”) and master servicing arrangement. We use observable market values of Fannie Mae MBS with similar characteristics, either on a pool or loan level, determined primarily from third party pricing services, quoted market prices in active markets for similar securities, and other observable market data as a base value. We set the GO equal to the estimated fair value we would receive if we were to issue our guaranty to an unrelated party in a stand-alone arm’s length transaction at the measurement date. We estimate the fair value of the GO using our internal valuation models, which calculate the present value of expected cash flows based on management’s best estimate of certain key assumptions such as current mark-to-market LTV ratios, future house prices, default rates, severity rates and required rate of return. We also estimate the fair value of the GO using our current guaranty pricing and adjust that pricing, as appropriate, for the seasoning of the collateral when such transactions reflect credit characteristics of loans held in our portfolio. As a result, the fair value of our mortgage loans will change when the pricing for our credit guaranty changes in the GSE securitization market.
Our performing loans are generally classified as Level 2 of the valuation hierarchy to the extent that significant inputs are observable. To the extent that unobservable inputs are significant, the loans are classified as Level 3 of the valuation hierarchy.
Consensus: The fair value of single-family nonperforming loans and TDRs on accrual status represents an estimate of the prices we would receive if we were to sell these loans in the whole-loan market. These nonperforming loans and TDRs on accrual status are either two or more months delinquent, in an open modification period, or in a closed modification state (both performing and nonperforming in accordance with the loan’s modified terms). Key factors that influence the price of these loans include collateral value, estimated loan cash flows and mortgage insurance. Collateral value is derived from the current estimated mark-to-market LTV ratio of the individual loan and, where appropriate, a state-level distressed property sales discount. Cash flow characteristics include attributes such as the weighted average coupon rate and loan payment history. The fair value of mortgage insurance is estimated by taking the loan level coverage and adjusting it by the expected claims paying ability of the associated mortgage insurer. The expected claims paying abilities used for estimating the fair value of mortgage insurance are consistent with our credit loss forecast. Fair value is estimated from the extrapolation of

FANNIE MAE(In conservatorship)
NOTES TO CONDENSED CONSOLIDATED FINANCIAL STATEMENTS - (Continued)(UNAUDITED)
113
indicative sample bids obtained from multiple active market participants plus the estimated value of any applicable mortgage insurance. These loans are classified as Level 3 of the valuation hierarchy because significant inputs are unobservable.
We estimate the fair value for a portion of our senior-subordinated trust structures using the average of two or more vendor prices at the security level as a proxy for estimating loan fair value. These loans are classified as Level 3 of the valuation hierarchy because significant inputs are unobservable.
Discounted Cash Flow: We estimate the fair value of a portion of our senior-subordinated trust structures using discounted cash flow at the security level as a proxy for estimating loan fair value. This valuation technique uses unobservable inputs such as prepayment speeds, default rates, spreads, and loss severities to estimate the fair value of our securities. These inputs are weighted in a model that calculates the expected cash flow of the security which is used as the basis of fair value. These loans are classified as Level 3 of the valuation hierarchy because significant inputs are unobservable.
Single Vendor: We estimate the fair value of our reverse mortgages using the single vendor valuation technique. These loans are classified as Level 3 of the valuation hierarchy because significant inputs are unobservable.
Internal Model: For loans whose value it has been determined should be based on collateral value, we use an internal proprietary distressed home price model. The internal model used in this process takes one of two approaches when valuing the collateral.
The first approach relies on comparable foreclosed property sales to estimate the value of the target collateral. The comparable foreclosed property sales approach uses various factors such as geographic distance, transaction time and the value difference. The second approach referred to as the median Metropolitan Statistical Area (“MSA”) is based on the median of all the foreclosure sales of REOs in a specific MSA. Using this sales price, MSA level discount is computed and applied to the estimated non distressed value to derive an estimated fair value. If there are not enough REO sales in a specific MSA, a median state level foreclosure discount is used to estimate the fair value.
The majority of the internal model valuations come from the comparable sales approach. The determination of whether the internal model valuations in a particular geographic area should use the comparable sales approach or median MSA is based on historical accuracy. These loans are classified as Level 3 of the valuation hierarchy because significant inputs are unobservable.
Appraisals: For a portion of our multifamily loans, we use appraisals to estimate the fair value of the loan. There are three approaches used to estimate fair value of a specific property: (1) cost, (2) income capitalization and (3) sales comparison. The cost approach uses the insurable value as a basis. The unobservable inputs used in this model include the estimated cost to construct or replace multifamily properties in the closest localities available. The income capitalization approach estimates the fair value using the present value of the future cash flow expectations by applying an appropriate capitalization rate to the forecasted net operating income. The significant unobservable inputs used in this calculation include rental income, fees associated with rental income, expenses associated with the property including taxes, payroll, insurance and other items, and capitalization rates, which are determined through market extraction and the DSCR. The sales comparison approach compares the prices paid for similar properties, the prices asked by owners and offers made. The unobservable inputs to this methodology include ratios of sales prices to annual gross income, price paid per unit and adjustments made based on financing, conditions of sale and physical characteristics of the property. These loans are classified as Level 3 of the valuation hierarchy because significant inputs are unobservable.
Broker Price Opinion (“BPO”): For a portion of our multifamily loans, we use BPO to estimate the fair value of the loan. This technique uses both current property value and the property value adjusted for stabilization and market conditions. These approaches compute net operating income based on current rents and expenses and use a range of market capitalization rates to estimate property value. The unobservable inputs used in this technique are property net operating income and market capitalization rates to estimate property value. These loans are classified as Level 3 of the valuation hierarchy because significant inputs are unobservable.
Asset Manager Estimate (“AME”): For a portion of our multifamily loans, AME is used to estimate the fair value of the loan. This technique uses the net operating income and tax assessments of the specific property as well as MSA-specific market capitalization rates and average per unit sales values to estimate property fair value. These loans are classified as Level 3 of the valuation hierarchy because significant inputs are unobservable.
An increase in prepayment speeds in isolation would generally result in an increase in the fair value of our mortgage loans classified as Level 3 of the valuation hierarchy, and an increase in severity rates, default rates or spreads in isolation would generally result in a decrease in fair value. Although the sensitivities of the fair value of mortgage loans classified as Level 3
FANNIE MAE(In conservatorship)
NOTES TO CONDENSED CONSOLIDATED FINANCIAL STATEMENTS - (Continued)(UNAUDITED)
114
of the valuation hierarchy to various unobservable inputs are discussed above in isolation, interrelationships exist among these inputs such that a change in one unobservable input typically results in a change to one or more of the other inputs.
Acquired Property, Net and Other AssetsAcquired property, net represents foreclosed property received in full satisfaction of a loan net of a valuation allowance. Acquired property is initially recorded in our condensed consolidated balance sheets at its fair value less its estimated cost to sell. The initial fair value of foreclosed properties is determined using a hierarchy based on the reliability of available information. The hierarchy for single-family acquired property includes accepted offers, appraisals, broker price opinions and proprietary home price model values. The hierarchy for multifamily acquired property includes accepted offers, appraisals and broker price opinions. We consider an accepted offer on a specific foreclosed property to be the best estimate of its fair value. If we have not accepted an offer on the property we use the next highest priority valuation methodology available, as described in our valuation hierarchy to determine fair value. While accepted offers represent an agreement in principle to transact, a significant portion of these agreements do not get executed for various reasons, and are therefore classified as Level 3 of the valuation hierarchy.
Third-party valuations can be obtained from either an appraisal or a broker price opinion. These valuations are kept current using a monthly walk forward process that updates them for changes in market conditions. When accepted offers or third-party valuations are not available, we generally utilize the home price values determined using an internal model.
Subsequent to initial measurement, the foreclosed properties that we intend to sell are reported at the lower of the carrying amount or fair value less estimated costs to sell. Foreclosed properties classified as held for use, included in “Other assets” in our condensed consolidated balance sheets, are depreciated and impaired when circumstances indicate that the carrying amount of the property is no longer recoverable. The fair values of our single-family foreclosed properties subsequent to initial measurement are determined using the same information hierarchy used for the initial fair value measurement.
The most commonly used techniques in our valuation of acquired property are proprietary home price model and third-party valuations (both current and walk forward). Based on the number of properties measured as of March 31, 2016, these methodologies comprised approximately 71% of our valuations, while accepted offers comprised approximately 24% of our valuations. Based on the number of properties measured as of December 31, 2015, these methodologies comprised approximately 77% of our valuations, while accepted offers comprised approximately 18% of our valuations.
Acquired property is classified as Level 3 of the valuation hierarchy because significant inputs are unobservable.
A description of our acquired property significant valuation techniques is as follows:
Single-family acquired property valuation techniques Appraisal: An appraisal is an estimate of the value of a specific property by a certified or licensed appraiser, in accordance with the Uniform Standards of Professional Appraisal Practice. Data most commonly used is from the local Multiple Listing Service and includes properties currently listed for sale, properties under contract, and closed transactions. The appraiser performs an analysis that starts with these data points and then adjusts for differences between the comparable properties and the property being appraised, to arrive at an estimated value for the specific property. Adjustments are made for differences between comparable properties for unobservable inputs such as square footage, location, and condition of the property. The appraiser typically uses recent historical data for the estimate of value.
Broker Price Opinion: This technique provides an estimate of what the property is worth based upon a real estate broker’s knowledge. The broker uses research of pertinent data in the appropriate market, and a sales comparison approach that is similar to the appraisal process. The broker typically has insight into local market trends, such as the number of and terms of offers, lack of offers, increasing supply, shortage of inventory and overall interest in buying a home. This information, all of which is unobservable, is used along with recent and pending sales and current listings of similar properties to arrive at an estimate of value.
We review the appraisals and broker price opinions received to determine if they have been performed in accordance with applicable standards and if the results are consistent with our observed transactions on similar properties. We make necessary adjustments as required.
Appraisal and Broker Price Opinion Walk Forwards (“Walk Forwards”): We use these techniques to adjust appraisal and broker price opinion valuations for changing market conditions by applying a walk forward factor based on local price movements since the time the third-party value was obtained. The majority of third-party values are updated by comparing the difference in our internal home price model from the month of the original appraisal/broker price opinion to the current

FANNIE MAE(In conservatorship)
NOTES TO CONDENSED CONSOLIDATED FINANCIAL STATEMENTS - (Continued)(UNAUDITED)
115
period and by applying the resulting percentage change to the original value. If a price is not determinable through our internal home price model, we use our zip code level home price index to update the valuations.
Internal Model: We use an internal model to estimate fair value for distressed properties. The valuation methodology and inputs used are described under “Mortgage Loans Held for Investment.”
Multifamily acquired property valuation techniques Appraisals: We use this method to estimate property values for distressed properties. The valuation methodology and inputs used are described under “Mortgage Loans Held for Investment.”
Broker Price Opinions: We use this method to estimate property values for distressed properties. The valuation methodology and inputs used are described under “Mortgage Loans Held for Investment.”
Derivatives Assets and Liabilities (collectively “Derivatives”)Derivatives are recorded in our condensed consolidated balance sheets at fair value on a recurring basis. The valuation process for the majority of our risk management derivatives uses observable market data provided by third-party sources, resulting in Level 2 classification of the valuation hierarchy.
A description of our derivatives valuation techniques is as follows:
Internal Model: We use internal models to value interest rate swaps which are valued by referencing yield curves derived from observable interest rates and spreads to project and discount swap cash flows to present value. Option-based derivatives use an internal model that projects the probability of various levels of interest rates by referencing swaption volatilities provided by market makers/dealers. The projected cash flows of the underlying swaps of these option-based derivatives are discounted to present value using yield curves derived from observable interest rates and spreads.
Dealer Mark: Certain highly complex structured swaps primarily use a single dealer mark due to lack of transparency in the market and may be modeled using observable interest rates and volatility levels as well as significant unobservable assumptions, resulting in Level 3 classification of the valuation hierarchy. Mortgage commitment derivatives that use observable market data, quotes and actual transaction price levels adjusted for market movement are typically classified as Level 2 of the valuation hierarchy. To the extent mortgage commitment derivatives include adjustments for market movement that cannot be corroborated by observable market data, we classify them as Level 3 of the valuation hierarchy.
DebtThe majority of debt of Fannie Mae is recorded in our condensed consolidated balance sheets at the principal amount outstanding, net of cost basis adjustments. We elected the fair value option for certain structured Fannie Mae debt instruments and debt of consolidated trusts with embedded derivatives, which are recorded in our condensed consolidated balance sheets at fair value on a recurring basis.
We classify debt instruments that have quoted market prices in active markets for similar liabilities when traded as assets as Level 2 of the valuation hierarchy. For all valuation techniques used for debts instruments where there is limited activity or less transparency around these inputs to the valuation, these debt instruments are classified as Level 3 of the valuation hierarchy.
A description of our debt valuation techniques is as follows:
Consensus: We estimate the fair value of debt of Fannie Mae and our debt of consolidated trusts using an average of two or more vendor prices or dealer marks that represents estimated fair value for similar liabilities when traded as assets.
Single Vendor: We estimate the fair value of debt of Fannie Mae and our debt of consolidated trusts using a single vendor price that represents estimated fair value for these liabilities when traded as assets.
Discounted Cash Flow: In the absence of prices provided by third-party pricing services supported by observable market data, we estimate the fair value of a portion of the debt of Fannie Mae and our debt of consolidated trusts using a discounted cash flow technique that uses spreads based on market assumptions where available.
The valuation methodology and inputs used in estimating the fair value of MBS assets are described under “Trading Securities and Available-for-Sale Securities.”
FANNIE MAE(In conservatorship)
NOTES TO CONDENSED CONSOLIDATED FINANCIAL STATEMENTS - (Continued)(UNAUDITED)
116
Valuation Control Processes We have control processes that are designed to ensure that our fair value measurements are appropriate and reliable, that they are based on observable inputs wherever possible and that our valuation approaches are consistently applied and the assumptions used are reasonable. Our control processes consist of a framework that provides for a segregation of duties and oversight of our fair value methodologies and valuations, as well as validation procedures.
The Pricing and Verification Group, along with the Credit Valuation team, are responsible for the estimation and verification of the fair value for the majority of our financial assets and financial liabilities, including review of material assumptions used when market-based inputs do not exist. These groups also provide updates to the Finance Committee on relevant market information, pricing trends, significant valuation challenges and the resolution of those challenges. The Pricing and Verification Group, along with the Credit Valuation team, reside within our Finance Division and are independent of any trading or market related activities. Fair value measurements for acquired property and collateral dependent loans are determined by other valuation groups in the Finance Division.
Our Finance Committee includes senior representation from our Capital Markets segment, our Enterprise Risk Management and our Finance Division, and is responsible for reviewing and approving the methods used in valuing financial instruments for the purpose of financial reporting. The composition of the Finance Committee is set forth in its charter, which was approved by the Chief Executive Officer. Based on its review of valuation methodologies and fair value results for various financial instruments used for financial reporting, the Finance Committee has the ultimate responsibility over all valuation processes and results.
We use third-party vendor prices and dealer quotes to estimate fair value of some of our financial assets and liabilities. Third-party vendor prices are primarily used to estimate fair value for trading securities, available-for-sale securities, debt of Fannie Mae and consolidated MBS debt. Our Pricing and Verification Group performs various review and validation procedures prior to utilizing these prices in our fair value estimation process. We verify selected prices, using a variety of methods, including corroborating the prices by reference to other independent market data, such as non-binding broker or dealer quotations, relevant benchmark indices and prices of similar instruments. We also review prices for reasonableness based on variations from prices provided in previous periods, comparing prices to internally estimated prices, using primarily a discounted cash flow approach, and conducting relative value comparisons based on specific characteristics of securities.
We have discussions with the pricing vendors as part of our due diligence process in order to maintain a current understanding of the valuation processes and related assumptions and inputs that these vendors use in developing prices. The prices provided to us by third-party pricing services reflect the existence of market reliance upon credit enhancements, if any, and the current levels of liquidity in the marketplace. If we determine that a price provided to us is outside established parameters or in certain other circumstances, we will further examine the price, including having follow-up discussions with the pricing service or dealer. If we conclude that a price is not valid, we will adjust the price for various factors, such as liquidity, bid-ask spreads and credit considerations. All of these procedures are executed before we use the prices in preparing our financial statements. Our Real Estate Property Valuation Group utilizes third-party appraisals and broker price opinions along with internal models and market data to compare the values received on a property and determine the valuation risk based on several factors including the deviation between the various values. The property valuation team reviews the valuations with higher valuation risk for reasonableness. The internal models utilized in the process are subject to oversight from the Model Risk Management Group, which is responsible for establishing risk management controls and for reviewing models used in the determination of fair value measurements for financial reporting. In addition, our Quality Control Group reviews the work performed and inspects a portion of the properties in major markets, for which the third-party valuations are obtained, in order to assess the quality of the valuations.
For fair value reporting purposes, we mark each property in inventory each month, incorporating the values assigned by the property valuation team along with other information including accepted offers and predictions from our proprietary distressed home price model.
We calibrate the performance of our proprietary distressed home price model using actual offers in recently observed transactions. The model’s performance is reviewed on a monthly basis by the REO valuation team and compared quarterly to specific model performance thresholds. The results of the validation are regularly reviewed with the Finance Committee.
Our Real Estate Property Valuation Group reviews appraisals and broker price opinions to determine the most appropriate value by comparing data within these products with current comparable properties and market data. We conduct regular

FANNIE MAE(In conservatorship)
NOTES TO CONDENSED CONSOLIDATED FINANCIAL STATEMENTS - (Continued)(UNAUDITED)
117
performance reviews of the counterparties that provide products and services for this process. In addition, valuation results and trend analyses are reviewed regularly by management responsible for valuing and disposing of real estate.
Fair Value of Financial InstrumentsThe following table displays the carrying value and estimated fair value of our financial instruments. The fair value of financial instruments we disclose includes commitments to purchase multifamily and single-family mortgage loans that we do not record in our condensed consolidated balance sheets. The fair values of these commitments are included as “Mortgage loans held for investment, net of allowance for loan losses.” The disclosure excludes all non-financial instruments; therefore, the fair value of our financial assets and liabilities does not represent the underlying fair value of our total consolidated assets and liabilities.
As of March 31, 2016
CarryingValue
QuotedPrice inActive
Markets forIdentical
Assets(Level 1)
SignificantOther
ObservableInputs
(Level 2)
SignificantUnobservable
Inputs (Level 3)
NettingAdjustment
EstimatedFair Value
(Dollars in millions)
Financial assets:Cash and cash equivalents and restricted
cash . . . . . . . . . . . . . . . . . . . . . . . . . . . . . . $ 52,789 $ 37,889 $ 14,900 $ — $ — $ 52,789Federal funds sold and securities purchased
under agreements to resell or similararrangements. . . . . . . . . . . . . . . . . . . . . . . 17,550 — 17,550 — — 17,550
Trading securities . . . . . . . . . . . . . . . . . . . . . 40,000 30,746 8,577 677 — 40,000Available-for-sale securities. . . . . . . . . . . . . 16,983 — 13,362 3,621 — 16,983Mortgage loans held for sale . . . . . . . . . . . . 4,639 — 150 4,864 — 5,014Mortgage loans held for investment, net of
allowance for loan losses:Of Fannie Mae . . . . . . . . . . . . . . . . . . . . 204,130 — 26,826 190,363 — 217,189Of consolidated trusts. . . . . . . . . . . . . . . 2,816,178 — 2,660,824 220,665 — 2,881,489
Mortgage loans held for investment. . . . . . . 3,020,308 — 2,687,650 411,028 — 3,098,678Advances to lenders . . . . . . . . . . . . . . . . . . . 4,722 — 4,333 379 — 4,712Derivative assets at fair value. . . . . . . . . . . . 700 — 7,185 239 (6,724) 700Guaranty assets and buy-ups . . . . . . . . . . . . 176 — — 513 — 513Total financial assets . . . . . . . . . . . . . . . . . . $ 3,157,867 $ 68,635 $ 2,753,707 $ 421,321 $ (6,724) $ 3,236,939
Financial liabilities:Federal funds purchased and securities sold
under agreements to repurchase . . . . . . . . $ 26 $ — $ 26 $ — $ — $ 26Short-term debt: Of Fannie Mae . . . . . . . . . . . . . . . . . . . . . 60,417 — 60,433 — — 60,433 Of consolidated trusts . . . . . . . . . . . . . . . 822 — — 822 — 822Long-term debt: Of Fannie Mae. . . . . . . . . . . . . . . . . . . . . 310,402 — 322,565 903 — 323,468 Of consolidated trusts . . . . . . . . . . . . . . . 2,828,129 — 2,873,051 31,112 — 2,904,163Derivative liabilities at fair value . . . . . . . . . 1,116 — 13,706 8 (12,598) 1,116Guaranty obligations . . . . . . . . . . . . . . . . . . 320 — — 998 — 998Total financial liabilities. . . . . . . . . . . . . . . . $ 3,201,232 $ — $ 3,269,781 $ 33,843 $ (12,598) $ 3,291,026

FANNIE MAE(In conservatorship)
NOTES TO CONDENSED CONSOLIDATED FINANCIAL STATEMENTS - (Continued)(UNAUDITED)
118
As of December 31, 2015
CarryingValue
QuotedPrice inActive
Markets forIdentical
Assets(Level 1)
SignificantOther
ObservableInputs
(Level 2)
SignificantUnobservable
Inputs (Level 3)
NettingAdjustment
EstimatedFair Value
(Dollars in millions)
Financial assets:Cash and cash equivalents and restricted
cash . . . . . . . . . . . . . . . . . . . . . . . . . . . . . . $ 45,553 $ 34,953 $ 10,600 $ — $ — $ 45,553Federal funds sold and securities purchased
under agreements to resell or similararrangements . . . . . . . . . . . . . . . . . . . . . . . 27,350 — 27,350 — — 27,350
Trading securities . . . . . . . . . . . . . . . . . . . . . 39,908 29,485 9,025 1,398 — 39,908Available-for-sale securities . . . . . . . . . . . . . 20,230 — 11,799 8,431 — 20,230Mortgage loans held for sale . . . . . . . . . . . . . 5,361 — 157 5,541 — 5,698Mortgage loans held for investment, net of
allowance for loan losses:Of Fannie Mae. . . . . . . . . . . . . . . . . . . . . 206,544 — 26,544 193,670 — 220,214Of consolidated trusts . . . . . . . . . . . . . . . 2,807,739 — 2,675,982 157,685 — 2,833,667
Mortgage loans held for investment . . . . . . . 3,014,283 — 2,702,526 351,355 — 3,053,881Advances to lenders. . . . . . . . . . . . . . . . . . . . 4,308 — 3,902 394 — 4,296Derivative assets at fair value . . . . . . . . . . . . 894 — 4,729 189 (4,024) 894Guaranty assets and buy-ups . . . . . . . . . . . . . 184 — — 544 — 544Total financial assets . . . . . . . . . . . . . . . . . . . $ 3,158,071 $ 64,438 $ 2,770,088 $ 367,852 $ (4,024) $ 3,198,354
Financial liabilities:Federal funds purchased and securities sold
under agreements to repurchase. . . . . . . . . $ 62 $ — $ 62 $ — $ — $ 62Short-term debt: Of Fannie Mae . . . . . . . . . . . . . . . . . . . . . 71,007 — 71,006 — — 71,006 Of consolidated trusts . . . . . . . . . . . . . . . . 943 — — 944 — 944Long-term debt: Of Fannie Mae . . . . . . . . . . . . . . . . . . . . . 315,128 — 324,248 898 — 325,146 Of consolidated trusts . . . . . . . . . . . . . . . . 2,810,593 — 2,819,733 27,175 — 2,846,908Derivative liabilities at fair value . . . . . . . . . 424 — 9,042 32 (8,650) 424Guaranty obligations . . . . . . . . . . . . . . . . . . . 329 — — 1,012 — 1,012Total financial liabilities . . . . . . . . . . . . . . . . $ 3,198,486 $ — $ 3,224,091 $ 30,061 $ (8,650) $ 3,245,502
Financial Instruments for which fair value approximates carrying value—We hold certain financial instruments that are not carried at fair value but for which the carrying value approximates fair value due to the short-term nature and negligible credit risk inherent in them. These financial instruments include cash and cash equivalents, the majority of advances to lenders, and federal funds and securities sold/purchased under agreements to repurchase/resell.
Federal funds and securities sold/purchased under agreements to repurchase/resell—The carrying value for the majority of these specific instruments approximates the fair value due to the short-term nature and the negligible inherent credit risk, as they involve the exchange of collateral that is easily traded. Were we to calculate the fair value of these instruments we would use observable inputs resulting in Level 2 classification.
Mortgage Loans Held for Sale—Loans are reported at the lower of cost or fair value in our condensed consolidated balance sheets. The valuation methodology and inputs used in estimating the fair value of HFS loans are the same as for our HFI loans and are described under “Fair Value Measurement—Mortgage Loans Held for Investment.” These loans are classified

FANNIE MAE(In conservatorship)
NOTES TO CONDENSED CONSOLIDATED FINANCIAL STATEMENTS - (Continued)(UNAUDITED)
119
as Level 2 of the valuation hierarchy to the extent that significant inputs are observable. To the extent that significant inputs are unobservable, the loans are classified within Level 3 of the valuation hierarchy.
HARP Loans—We measure the fair value of loans that are delivered under the Home Affordable Refinance Program (“HARP”) using a modified build-up approach while the loan is performing. Under this modified approach, we set the credit component of the consolidated loans (that is, the guaranty obligation) equal to the compensation we would currently receive for a loan delivered to us under the program because the total compensation for these loans is equal to their current exit price in the GSE securitization market. For a description of the build-up valuation methodology, refer to “Fair Value Measurement—Mortgage Loans Held for Investment.” We will continue to use this pricing methodology as long as the HARP program is available to market participants. If, subsequent to delivery, the refinanced loan becomes past due or is modified as a part of a troubled debt restructuring, the fair value of the guaranty obligation is then measured consistent with other loans that have similar characteristics.
The total compensation that we receive for the delivery of a HARP loan reflects the pricing that we are willing to offer because HARP is a part of a broader government program intended to provide assistance to homeowners and prevent foreclosures. If these benefits were not reflected in the pricing for these loans (that is, if the loans were valued using our standard build-up approach), the fair value disclosed in the table above would be lower by $1.0 billion as of March 31, 2016 and $1.1 billion as of December 31, 2015. The total fair value of our mortgage loans that have been refinanced under HARP as presented in the table above was $279.0 billion as of March 31, 2016 and $282.0 billion as of December 31, 2015.
Advances to Lenders—The carrying value for the majority of our advances to lenders approximates fair value due to the short-term nature and the negligible inherent credit risk. If we were to calculate the fair value of these instruments we would use discounted cash flow models that use observable inputs such as spreads based on market assumptions, resulting in Level 2 classification.
Advances to lenders also include loans for which the carrying value does not approximate fair value. These loans do not qualify for Fannie Mae MBS securitization and are valued using market-based techniques including credit spreads, severities and prepayment speeds for similar loans, through third-party pricing services or through a model approach incorporating both interest rate and credit risk simulating a loan sale via a synthetic structure. We classify these valuations as Level 3 given that significant inputs are not observable or are determined by extrapolation of observable inputs.
Guaranty Assets and Buy-ups—Guaranty assets related to our portfolio securitizations are recorded in our condensed consolidated balance sheets at fair value on a recurring basis and are classified as Level 3. Guaranty assets in lender swap transactions are recorded in our condensed consolidated balance sheets at the lower of cost or fair value. These assets, which are measured at fair value on a nonrecurring basis, are also classified as Level 3.
We estimate the fair value of guaranty assets based on the present value of expected future cash flows of the underlying mortgage assets using management’s best estimate of certain key assumptions, which include prepayment speeds, forward yield curves, and discount rates commensurate with the risks involved. These cash flows are projected using proprietary prepayment, interest rate and credit risk models. Because guaranty assets are like an interest-only income stream, the projected cash flows from our guaranty assets are discounted using one-month LIBOR plus an option-adjusted spread that is calibrated using a representative sample of interest-only swaps that reference Fannie Mae MBS. We believe the remitted fee income is less liquid than interest-only swaps and more like an excess servicing strip. Therefore, we take a further discount of the present value for these liquidity considerations. This discount is based on market quotes from third-party pricing services.The fair value of the guaranty assets includes the fair value of any associated buy-ups.
Guaranty Obligations—The fair value of all guaranty obligations, measured subsequent to their initial recognition, is our estimate of a hypothetical transaction price we would receive if we were to issue our guaranty to an unrelated party in a standalone arm’s-length transaction at the measurement date. These obligations are classified as Level 3. The valuation methodology and inputs used in estimating the fair value of the guaranty obligations are described under “Fair Value Measurement—Mortgage Loans Held for Investment—Build-up.”
Fair Value OptionWe elected the fair value option for our credit risk sharing debt securities issued under our CAS series issued prior to January 1, 2016 and certain loans that contain embedded derivatives that would otherwise require bifurcation. Under the fair value option, we elected to carry these instruments at fair value instead of bifurcating the embedded derivative from such instruments.

FANNIE MAE(In conservatorship)
NOTES TO CONDENSED CONSOLIDATED FINANCIAL STATEMENTS - (Continued)(UNAUDITED)
120
We elected the fair value option for all long-term structured debt instruments that are issued in response to specific investor demand and have interest rates that are based on a calculated index or formula and are economically hedged with derivatives at the time of issuance. By electing the fair value option for these instruments, we are able to eliminate the volatility in our results of operations that would otherwise result from the accounting asymmetry created by recording these structured debt instruments at cost while recording the related derivatives at fair value.
We elected the fair value option for the financial assets and liabilities of the consolidated senior-subordinate trust structures. By electing the fair value option for these instruments, we are able to eliminate the volatility in our results of operations that would otherwise result from different accounting treatment between loans at cost and debt at cost.
Interest income for the mortgage loans is recorded in “Interest income—Mortgage loans” and interest expense for the debt instruments is recorded in “Interest expense—Long-term debt” in our condensed consolidated statements of operations and comprehensive income.
The following table displays the fair value and unpaid principal balance of the financial instruments for which we have made fair value elections.
As ofMarch 31, 2016 December 31, 2015
Loans(1)
Long-TermDebt of
Fannie Mae
Long-Term Debt ofConsolidated
Trusts Loans(1)
Long-TermDebt of
Fannie Mae
Long-Term Debt ofConsolidated
Trusts(Dollars in millions)
Fair value . . . . . . . . . . . . . . . $ 13,714 $ 10,901 $ 28,563 $ 14,075 $ 11,133 $ 23,609Unpaid principal balance . . . 13,087 10,945 25,685 13,661 11,263 21,604__________(1) Includes nonaccrual loans with a fair value of $149 million and $238 million as of March 31, 2016 and December 31, 2015,
respectively. The difference between unpaid principal balance and the fair value of these nonaccrual loans as of March 31, 2016 and December 31, 2015 was $31 million and $59 million, respectively. Includes loans that are 90 days or more past due with a fair value of $174 million and $256 million as of March 31, 2016 and December 31, 2015, respectively. The difference between unpaid principal balance and the fair value of these 90 or more days past due loans as of March 31, 2016 and December 31, 2015 was $26 million and $52 million, respectively.
Changes in Fair Value under the Fair Value Option ElectionThe following table displays fair value gains and losses, net, including changes attributable to instrument-specific credit risk, for loans and debt for which the fair value election was made. Amounts are recorded as a component of “Fair value losses, net” in our condensed consolidated statements of operations and comprehensive income.
For the Three Months Ended March 31,2016 2015
Loans
Long-TermDebt
TotalGains
(Losses) Loans
Long-TermDebt
TotalGains
(Losses)(Dollars in millions)
Changes in instrument-specific credit risk . . . . . . . . . . . . . . . . . . $ 13 $ (52) $ (39) $ (12) $ (193) $ (205)Other changes in fair value . . . . . . . . . . . . . . . . . . . . . . . . . . . . . . 218 (302) (84) 167 (188) (21)
Fair value gains (losses), net . . . . . . . . . . . . . . . . . . . . . . . . . . . $ 231 $ (354) $ (123) $ 155 $ (381) $ (226)
In determining the changes in the instrument-specific credit risk for loans, the changes in the associated credit-related components of these loans, primarily the guaranty obligation, were taken into consideration with the change in the fair value of the loans for which we elected the fair value option for financial instruments. In determining the changes in the instrument-specific credit risk for debt, the changes in Fannie Mae debt spreads to LIBOR that occurred during the period were taken into consideration with the change in the fair value of the debt for which we elected the fair value option for financial instruments. Specifically, cash flows are evaluated taking into consideration any derivatives through which Fannie Mae has swapped out of the structured features of the notes and thus created a floating-rate LIBOR-based debt instrument.
FANNIE MAE(In conservatorship)
NOTES TO CONDENSED CONSOLIDATED FINANCIAL STATEMENTS - (Continued)(UNAUDITED)
121
The change in value of these LIBOR-based cash flows based on the Fannie Mae yield curve at the beginning and end of the period represents the instrument-specific credit risk.
16. Commitments and Contingencies We are party to various types of legal actions and proceedings, including actions brought on behalf of various classes of claimants. We also are subject to regulatory examinations, inquiries and investigations, and other information gathering requests. In some of the matters, indeterminate amounts are sought. Modern pleading practice in the U.S. permits considerable variation in the assertion of monetary damages or other relief. Jurisdictions may permit claimants not to specify the monetary damages sought or may permit claimants to state only that the amount sought is sufficient to invoke the jurisdiction of the trial court. This variability in pleadings, together with our and our counsel’s actual experience in litigating or settling claims, leads us to conclude that the monetary relief that may be sought by plaintiffs bears little relevance to the merits or disposition value of claims.
On a quarterly basis, we review relevant information about all pending legal actions and proceedings for the purpose of evaluating and revising our contingencies, accruals and disclosures.
We have substantial and valid defenses to the claims in the proceedings described below and intend to defend these matters vigorously. However, legal actions and proceedings of all types are subject to many uncertain factors that generally cannot be predicted with assurance. Accordingly, the outcome of any given matter and the amount or range of potential loss at particular points in time is frequently difficult to ascertain. Uncertainties can include how fact finders will evaluate documentary evidence and the credibility and effectiveness of witness testimony, and how courts will apply the law. Disposition valuations are also subject to the uncertainty of how opposing parties and their counsel may view the evidence and applicable law.
We establish an accrual for matters when a loss is probable and we can reasonably estimate the amount of such loss. For legal actions or proceedings where there is only a reasonable possibility that a loss may be incurred, or where we are not currently able to estimate the reasonably possible loss or range of loss, we do not establish an accrual. We are often unable to estimate the possible losses or ranges of losses, particularly for proceedings that are in their early stages of development, where plaintiffs seek indeterminate or unspecified damages, where there may be novel or unsettled legal questions relevant to the proceedings, or where settlement negotiations have not occurred or progressed.
Given the uncertainties involved in any action or proceeding, regardless of whether we have established an accrual, the ultimate resolution of certain of these matters may be material to our operating results for a particular period, depending on, among other factors, the size of the loss or liability imposed and the level of our net income or loss for that period.
In addition to the matters specifically described below, we are involved in a number of legal and regulatory proceedings that arise in the ordinary course of business that we do not expect will have a material impact on our business or financial condition. We have also advanced fees and expenses of certain current and former officers and directors in connection with various legal proceedings pursuant to our bylaws and indemnification agreements.
Senior Preferred Stock Purchase Agreements LitigationA number of putative class action lawsuits were filed in the U.S. District Court for the District of Columbia against us, FHFA as our conservator, Treasury and Freddie Mac from July through September 2013 by shareholders of Fannie Mae and/or Freddie Mac challenging the August 2012 amendment to each company’s senior preferred stock purchase agreement with Treasury. These lawsuits were consolidated and, on December 3, 2013, plaintiffs (preferred and common shareholders of Fannie Mae and/or Freddie Mac) filed a consolidated class action complaint in the U.S. District Court for the District of Columbia against us, FHFA as our conservator, Treasury and Freddie Mac (“In re Fannie Mae/Freddie Mac Senior Preferred Stock Purchase Agreement Class Action Litigations”). The preferred shareholder plaintiffs allege that the net worth sweep dividend provisions of the senior preferred stock that were implemented pursuant to the August 2012 amendments to the senior preferred stock purchase agreements nullified certain of the shareholders’ rights, particularly the right to receive dividends. The common shareholder plaintiffs allege that the August 2012 amendments constituted a taking of their property by requiring that all future profits of Fannie Mae and Freddie Mac be paid to Treasury. Plaintiffs allege claims for breach of contract and breach of the implied covenant of good faith and fair dealing against us, FHFA and Freddie Mac, a takings claim against FHFA and Treasury, and a breach of fiduciary duty claim derivatively on our and Freddie Mac’s behalf against FHFA and Treasury. Plaintiffs seek to represent several classes of preferred and/or common shareholders of Fannie Mae and/or Freddie Mac who held stock as of the public announcement of the August 2012 amendments. Plaintiffs seek unspecified damages, equitable and injunctive relief, and costs and expenses, including attorneys’ fees.

FANNIE MAE(In conservatorship)
NOTES TO CONDENSED CONSOLIDATED FINANCIAL STATEMENTS - (Continued)(UNAUDITED)
122
A non-class action suit, Arrowood Indemnity Company v. Fannie Mae, was filed in the U.S. District Court for the District of Columbia on September 20, 2013 by preferred shareholders against us, FHFA as our conservator, the Director of FHFA (in his official capacity), Treasury, the Secretary of the Treasury (in his official capacity) and Freddie Mac. Plaintiffs bring claims for breach of contract and breach of the implied covenant of good faith and fair dealing against us, FHFA and Freddie Mac, and claims for violation of the Administrative Procedure Act against the FHFA and Treasury defendants, alleging that the net worth sweep dividend provisions nullified certain rights of the preferred shareholders, particularly the right to receive dividends. Plaintiffs seek damages, equitable and injunctive relief, and costs and expenses, including attorneys’ fees.
On September 30, 2014, the court dismissed both lawsuits and plaintiffs in both suits filed timely notices of appeal. On October 27, 2014, the U.S. Court of Appeals for the D.C. Circuit consolidated these appeals with appeals in two other cases involving the same subject matter, but to which we are not a party. The D.C. Circuit heard oral argument on these appeals on April 15, 2016.
Given the stage of these lawsuits, the substantial and novel legal questions that remain, and our substantial defenses, we are currently unable to estimate the reasonably possible loss or range of loss arising from this litigation.
123
Item 3. Quantitative and Qualitative Disclosures about Market RiskInformation about market risk is set forth in “MD&A—Risk Management—Market Risk Management, Including Interest Rate Risk Management.”
Item 4. Controls and Procedures
OverviewWe are required under applicable laws and regulations to maintain controls and procedures, which include disclosure controls and procedures as well as internal control over financial reporting, as further described below.
Evaluation of Disclosure Controls and Procedures
Disclosure Controls and ProceduresDisclosure controls and procedures refer to controls and other procedures designed to provide reasonable assurance that information required to be disclosed in the reports we file or submit under the Exchange Act is recorded, processed, summarized and reported within the time periods specified in the rules and forms of the SEC. Disclosure controls and procedures include, without limitation, controls and procedures designed to provide reasonable assurance that information required to be disclosed by us in the reports that we file or submit under the Exchange Act is accumulated and communicated to management, including our Chief Executive Officer and Chief Financial Officer, as appropriate, to allow timely decisions regarding our required disclosure. In designing and evaluating our disclosure controls and procedures, management recognizes that any controls and procedures, no matter how well designed and operated, can provide only reasonable assurance of achieving the desired control objectives, and management was required to apply its judgment in evaluating and implementing possible controls and procedures.
Evaluation of Disclosure Controls and ProceduresAs required by Rule 13a-15 under the Exchange Act, management has evaluated, with the participation of our Chief Executive Officer and Chief Financial Officer, the effectiveness of our disclosure controls and procedures as in effect as of March 31, 2016, the end of the period covered by this report. As a result of management’s evaluation, our Chief Executive Officer and Chief Financial Officer concluded that our disclosure controls and procedures were not effective at a reasonable assurance level as of March 31, 2016 or as of the date of filing this report.
Our disclosure controls and procedures were not effective as of March 31, 2016 or as of the date of filing this report because they did not adequately ensure the accumulation and communication to management of information known to FHFA that is needed to meet our disclosure obligations under the federal securities laws. As a result, we were not able to rely upon the disclosure controls and procedures that were in place as of March 31, 2016 or as of the date of this filing, and we continue to have a material weakness in our internal control over financial reporting. This material weakness is described in more detail below under “Description of Material Weakness.” Based on discussions with FHFA and the structural nature of this material weakness, we do not expect to remediate this material weakness while we are under conservatorship.
Description of Material WeaknessThe Public Company Accounting Oversight Board’s Auditing Standard No. 5 defines a material weakness as a deficiency or a combination of deficiencies in internal control over financial reporting, such that there is a reasonable possibility that a material misstatement of the company’s annual or interim financial statements will not be prevented or detected on a timely basis.
Management has determined that we continued to have the following material weakness as of March 31, 2016 and as of the date of filing this report:
• Disclosure Controls and Procedures. We have been under the conservatorship of FHFA since September 6, 2008. Under the GSE Act, FHFA is an independent agency that currently functions as both our conservator and our regulator with respect to our safety, soundness and mission. Because of the nature of the conservatorship under the GSE Act, which places us under the “control” of FHFA (as that term is defined by securities laws), some of the information that we may need to meet our disclosure obligations may be solely within the knowledge of FHFA. As our conservator, FHFA has the power to take actions without our knowledge that could be material to our shareholders and other stakeholders, and could significantly affect our financial performance or our continued existence as an ongoing business. Although we and FHFA attempted to design and implement disclosure policies and procedures that would account for the conservatorship and accomplish the same objectives as a disclosure controls and procedures policy of a typical reporting company, there are inherent structural limitations on our ability to design, implement, test or

124
operate effective disclosure controls and procedures. As both our regulator and our conservator under the GSE Act, FHFA is limited in its ability to design and implement a complete set of disclosure controls and procedures relating to Fannie Mae, particularly with respect to current reporting pursuant to Form 8-K. Similarly, as a regulated entity, we are limited in our ability to design, implement, operate and test the controls and procedures for which FHFA is responsible.
Due to these circumstances, we have not been able to update our disclosure controls and procedures in a manner that adequately ensures the accumulation and communication to management of information known to FHFA that is needed to meet our disclosure obligations under the federal securities laws, including disclosures affecting our condensed consolidated financial statements. As a result, we did not maintain effective controls and procedures designed to ensure complete and accurate disclosure as required by GAAP as of March 31, 2016 or as of the date of filing this report. Based on discussions with FHFA and the structural nature of this weakness, we do not expect to remediate this material weakness while we are under conservatorship.
Mitigating Actions Relating to Material WeaknessAs described above under “Description of Material Weakness,” we continue to have a material weakness in our internal control over financial reporting relating to our disclosure controls and procedures. However, we and FHFA have engaged in the following practices intended to permit accumulation and communication to management of information needed to meet our disclosure obligations under the federal securities laws:
• FHFA has established the Division of Conservatorship, which is intended to facilitate operation of the company with the oversight of the conservator.
• We have provided drafts of our SEC filings to FHFA personnel for their review and comment prior to filing. We also have provided drafts of external press releases, statements and speeches to FHFA personnel for their review and comment prior to release.
• FHFA personnel, including senior officials, have reviewed our SEC filings prior to filing, including this quarterly report on Form 10-Q for the quarter ended March 31, 2016 (“First Quarter 2016 Form 10-Q”), and engaged in discussions regarding issues associated with the information contained in those filings. Prior to filing our First Quarter 2016 Form 10-Q, FHFA provided Fannie Mae management with a written acknowledgment that it had reviewed the First Quarter 2016 Form 10-Q, and it was not aware of any material misstatements or omissions in the First Quarter 2016 Form 10-Q and had no objection to our filing the First Quarter 2016 Form 10-Q.
• The Director of FHFA and our Chief Executive Officer have been in frequent communication, typically meeting on at least a bi-weekly basis.
• FHFA representatives attend meetings frequently with various groups within the company to enhance the flow of information and to provide oversight on a variety of matters, including accounting, credit and market risk management, external communications and legal matters.
• Senior officials within FHFA’s Office of the Chief Accountant have met frequently with our senior finance executives regarding our accounting policies, practices and procedures.
Changes in Internal Control over Financial Reporting
OverviewManagement has evaluated, with the participation of our Chief Executive Officer and Chief Financial Officer, whether any changes in our internal control over financial reporting that occurred during our last fiscal quarter have materially affected, or are reasonably likely to materially affect, our internal control over financial reporting. Below we describe changes in our internal control over financial reporting since December 31, 2015 that management believes have materially affected, or are reasonably likely to materially affect, our internal control over financial reporting.
In the ordinary course of business, we review our system of internal control over financial reporting and make changes that we believe will improve these controls and increase efficiency, while continuing to ensure that we maintain effective internal controls. Changes may include implementing new, more efficient systems, automating manual processes and updating existing systems.
Implementation of New Single-Family Mortgage Loan Accounting PlatformIn April 2016, we completed an initiative to consolidate most of our single-family performing loan accounting onto a single platform. This new platform will support future integration with internal infrastructure improvements and the common

125
securitization platform. This new platform also will provide us with the capability to securitize performing loans that were previously delinquent, known as reperforming loans, that are held in our retained mortgage portfolio. As a result of this implementation, we redesigned, removed or replaced multiple existing internal controls over financial reporting that were previously considered effective with new controls. We will continue to monitor and test these new controls for adequate design and operating effectiveness. Because this new platform was not implemented until April 2016, we continued to use our legacy single-family performing loan accounting systems and controls in preparing our first quarter 2016 condensed consolidated financial statements included in this report.

126
PART II—OTHER INFORMATION
Item 1. Legal ProceedingsThe information in this item supplements and updates information regarding certain legal proceedings set forth in “Legal Proceedings” in our 2015 Form 10-K. We also provide information regarding material legal proceedings in “Note 16, Commitments and Contingencies,” which is incorporated herein by reference. In addition to the matters specifically described or incorporated by reference in this item, we are involved in a number of legal and regulatory proceedings that arise in the ordinary course of business that do not have a material impact on our business. Litigation claims and proceedings of all types are subject to many factors that generally cannot be predicted accurately.
We record accruals for legal claims when losses associated with those claims become probable and the amounts can be reasonably estimated. The actual costs of resolving legal claims may be substantially higher or lower than the amounts accrued for those claims. For matters where the likelihood or extent of a loss is not probable or cannot be reasonably estimated, we do not recognize in our condensed consolidated financial statements the potential liability that may result from these matters. We presently cannot determine the ultimate resolution of the matters described below or incorporated by reference into this item or in our 2015 Form 10-K. If certain of these matters are determined against us, FHFA or Treasury, it could have a material adverse effect on our results of operations, liquidity and financial condition, including our net worth.
Senior Preferred Stock Purchase Agreements LitigationBetween June 2013 and February 2016, several lawsuits were filed by preferred and common stockholders of Fannie Mae and Freddie Mac in the U.S. Court of Federal Claims, the U.S. District Court for the District of Columbia, the U.S. District Court for the Southern District of Iowa, the U.S. District Court for the Northern District of Iowa, the U.S. District Court for the District of Delaware, the U.S. District Court for the Eastern District of Kentucky and the U.S. District Court for the Northern District of Illinois against one or more of the United States, Treasury and FHFA, challenging actions taken by the defendants relating to the senior preferred stock purchase agreements and the conservatorships of Fannie Mae and Freddie Mac. Some of these lawsuits also contain claims against Fannie Mae and Freddie Mac. The legal claims being advanced by one or more of these lawsuits include challenges to the net worth sweep dividend provisions of the senior preferred stock that were implemented pursuant to the August 2012 amendments to the agreements, the payment of dividends to Treasury under the net worth sweep dividend provisions, and FHFA’s decision to require Fannie Mae and Freddie Mac to draw funds from Treasury in order to pay dividends to Treasury prior to the August 2012 amendments. The plaintiffs seek various forms of equitable and injunctive relief, including rescission of the August 2012 amendments, as well as damages.
On September 30, 2014, the U.S. District Court for the District of Columbia dismissed all but one of the cases pending before that court. The plaintiffs in each of the dismissed cases filed a notice of appeal and on October 27, 2014, the U.S. Court of Appeals for the D.C. Circuit consolidated these appeals. The plaintiffs in the case that was not dismissed by the court voluntarily dismissed their lawsuit on October 31, 2014. On February 3, 2015, the U.S. District Court for the Southern District of Iowa dismissed the case pending before it. On April 15, 2016, the U.S. Court of Appeals for the D.C. Circuit heard oral argument on the consolidated appeals. The matters where Fannie Mae is a named defendant are described below or in “Note 16, Commitments and Contingencies.”
Fannie Mae is a nominal defendant in two actions filed against the United States in the U.S. Court of Federal Claims: Fisher v. United States of America, filed on December 2, 2013, and Rafter v. United States of America, filed on August 14, 2014. Plaintiffs in these cases allege that the net worth sweep dividend provisions of the senior preferred stock that were implemented pursuant to the August 2012 amendment to the senior preferred stock purchase agreement constitute a taking of Fannie Mae’s property without just compensation in violation of the U.S. Constitution. The Fisher plaintiffs are pursuing this claim derivatively on behalf of Fannie Mae, while the Rafter plaintiffs are pursing the claim directly against the United States. Plaintiffs in Rafter also allege a derivative claim that the government breached an implied contract with Fannie Mae’s Board of Directors by implementing the net worth sweep dividend provisions. Plaintiffs in Fisher request just compensation to Fannie Mae in an unspecified amount. Plaintiffs in Rafter seek just compensation for themselves on their constitutional claim and payment of damages to Fannie Mae on their derivative claim for breach of an implied contract. The United States filed a motion to dismiss the Fisher case on January 23, 2014; however, the court has stayed proceedings in this case until discovery in a related case, Fairholme Funds v. United States, is complete and the court sets a date for the Fairholme Funds plaintiffs to respond to the government’s motion to dismiss filed in that case. In the Rafter case, the court has ordered the government to file a response to the complaint within sixty days after discovery is complete in the Fairholme Funds case.
Fannie Mae is also a nominal defendant in a case filed against FHFA and Treasury in the U.S. District Court for the District of Delaware: Jacobs v. FHFA, filed on August 17, 2015. The plaintiffs allege that the net worth sweep dividend provisions of the senior preferred stock that were implemented pursuant to the August 2012 amendments to the agreements violate
127
Delaware law. The plaintiffs are pursuing this claim derivatively on behalf of Fannie Mae and directly against the government. The plaintiffs have also alleged direct breach of contract claims and breach of fiduciary duty claims against the government. The government filed motions to dismiss the case on November 13, 2015.
On March 14, 2016, Timothy Pagliara filed a lawsuit against Fannie Mae in the Delaware Court of Chancery: Pagliara v. Federal National Mortgage Association. The plaintiff owns Fannie Mae preferred stock and seeks access to Fannie Mae’s books and records under a provision of Delaware state law. The plaintiff alleges that he is entitled to inspect Fannie Mae’s books and records in order to investigate potential breaches of duties to stockholders related to the net worth sweep dividend provisions of the senior preferred stock that were implemented pursuant to the August 2012 amendment to the senior preferred stock purchase agreement, as well as Fannie Mae’s involvement in the common securitization platform, Common Securitization Solutions, LLC, and the single GSE security. On March 25, 2016, Fannie Mae and FHFA removed the case to the U.S. District Court for the District of Delaware.
In March 2016, FHFA filed a motion with the Judicial Panel on Multidistrict Litigation requesting that Jacobs, Pagliara and several additional cases filed against the government and others be consolidated before the U.S. District Court for the District of Columbia. All of the cases have been stayed in light of FHFA’s pending motion before the Judicial Panel on Multidistrict Litigation.
Item 1A. Risk FactorsIn addition to the information in this report, you should carefully consider the risks relating to our business that we identify in “Risk Factors” in our 2015 Form 10-K. This section supplements and updates that discussion. For a complete understanding of the subject, you should read both together. Please also refer to “MD&A—Risk Management” in this report and in our 2015 Form 10-K for more detailed descriptions of the primary risks to our business and how we seek to manage those risks.The risks we face could materially adversely affect our business, results of operations, financial condition, liquidity and net worth, and could cause our actual results to differ materially from our past results or the results contemplated by forward-looking statements contained in this report. However, these are not the only risks we face. In addition to the risks we discuss below and in our 2015 Form 10-K, we face risks and uncertainties not currently known to us or that we currently believe are immaterial.
The future of our company is uncertain. There continues to be significant uncertainty regarding the future of our company, including how long the company will continue to exist in its current form, the extent of our role in the market, how long we will be in conservatorship, what form we will have and what ownership interest, if any, our current common and preferred stockholders will hold in us after the conservatorship is terminated, and whether we will continue to exist following conservatorship. The conservatorship is indefinite in duration and the timing, conditions and likelihood of our emerging from conservatorship are uncertain. Termination of the conservatorship, other than in connection with a receivership, requires Treasury’s consent under the senior preferred stock purchase agreement.
In 2011, the Administration released a report to Congress on ending the conservatorships of the GSEs and reforming America’s housing finance market. The report provides that the Administration will work with FHFA to determine the best way to responsibly reduce Fannie Mae and Freddie Mac’s role in the market and ultimately wind down both institutions. The report emphasizes the importance of proceeding with a careful transition plan and providing the necessary financial support to Fannie Mae and Freddie Mac during the transition period. In 2013, the White House released a paper confirming that a core principle of the Administration’s housing policy priorities is to wind down Fannie Mae and Freddie Mac through a responsible transition. In 2015, the White House reaffirmed the Administration’s view that housing finance reform should include ending Fannie Mae and Freddie Mac’s business model.
Last year, Congress continued to consider legislation that could materially affect our business if enacted. We expect that Congress will continue to hold hearings and consider legislation on the future status of Fannie Mae and Freddie Mac, including proposals that would result in Fannie Mae’s liquidation or dissolution. Congress or FHFA may also consider legislation or regulation aimed at increasing the competition we face, reducing our market share, expanding our obligations to provide funds to Treasury or constraining our business operations. We cannot predict the prospects for the enactment, timing or final content of housing finance reform legislation or other legislation related to our activities. See “Business—Housing Finance Reform” in our 2015 Form 10-K for more information about the Administration’s statements and Congressional proposals regarding housing finance reform.
128
Changes in interest rates or our loss of the ability to manage interest rate risk successfully could adversely affect our financial results and condition, and increase interest rate risk. We fund our operations primarily through the issuance of debt and invest our funds primarily in mortgage-related assets that permit mortgage borrowers to prepay their mortgages at any time. These business activities expose us to market risk, which is the risk of adverse changes in the fair value of financial instruments resulting from changes in market conditions. Our most significant market risks are interest rate risk and prepayment risk. We describe these risks in more detail in “MD&A—Risk Management—Market Risk Management, Including Interest Rate Risk Management” in our 2015 Form 10-K and in this report. Changes in interest rates affect both the value of our mortgage assets and prepayment rates on our mortgage loans.
Changes in interest rates could have a material adverse effect on our business, results of operations, financial condition, liquidity and net worth. Our ability to manage interest rate risk depends on our ability to issue debt instruments with a range of maturities and other features, including call provisions, at attractive rates and to engage in derivatives transactions. We must exercise judgment in selecting the amount, type and mix of debt and derivatives instruments that will most effectively manage our interest rate risk. The amount, type and mix of financial instruments that are available to us may not offset possible future changes in the spread between our borrowing costs and the interest we earn on our mortgage assets.
We mark to market changes in the estimated fair value of our derivatives through our earnings on a quarterly basis, but we do not similarly mark to market changes in some of the financial instruments that generate our interest rate risk exposures. As a result, changes in interest rates, particularly significant changes, can have a significant adverse effect on our earnings and net worth for the quarter in which the changes occur, depending on the nature of the changes and the derivatives we hold at that time. We have experienced significant fair value losses in some periods due to changes in interest rates, and we expect to continue to experience volatility from period to period in our financial results as a result of fair value losses or gains on our derivatives.
Changes in interest rates also can affect our credit losses. When interest rates increase, our credit losses from loans with adjustable payment terms may increase as borrower payments increase at their reset dates, which increases the borrower’s risk of default, particularly for adjustable-rate loans with interest-only features. Rising interest rates may also reduce the opportunity for these borrowers to refinance into a fixed-rate loan. Similarly, many borrowers may have additional debt obligations, such as home equity lines of credit and second liens, that also have adjustable payment terms. If a borrower’s payment on his or her other debt obligations increases due to rising interest rates or a change in amortization, it increases the risk that the borrower may default on a loan we own or guarantee.
While we have not experienced negative interest rates in the United States, some central banks in Europe and Asia have cut interest rates below zero. If U.S. interest rates fell below zero, it could result in significant fair value losses on the derivatives we use to manage interest rate risk, reduce our net interest income and increase our operational risk.
Item 2. Unregistered Sales of Equity Securities and Use of Proceeds
Recent Sales of Unregistered SecuritiesUnder the terms of our senior preferred stock purchase agreement with Treasury, we are prohibited from selling or issuing our equity interests, other than as required by (and pursuant to) the terms of a binding agreement in effect on September 7, 2008, without the prior written consent of Treasury. During the quarter ended March 31, 2016, we did not sell any equity securities.
Information about Certain Securities Issuances by Fannie MaePursuant to SEC regulations, public companies are required to disclose certain information when they incur a material direct financial obligation or become directly or contingently liable for a material obligation under an off-balance sheet arrangement. The disclosure must be made in a current report on Form 8-K under Item 2.03 or, if the obligation is incurred in connection with certain types of securities offerings, in prospectuses for that offering that are filed with the SEC.
Because the securities we issue are exempted securities under the Securities Act of 1933, we do not file registration statements or prospectuses with the SEC with respect to our securities offerings. To comply with the disclosure requirements of Form 8-K relating to the incurrence of material financial obligations, we report our incurrence of these types of obligations either in offering circulars or prospectuses (or supplements thereto) that we post on our website or in a current report on Form 8-K that we file with the SEC, in accordance with a “no-action” letter we received from the SEC staff in 2004. In cases where the information is disclosed in a prospectus or offering circular posted on our website, the document will be posted on our website within the same time period that a prospectus for a non-exempt securities offering would be required to be filed with the SEC.

129
The website address for disclosure about our debt securities is www.fanniemae.com/debtsearch. From this address, investors can access the offering circular and related supplements for debt securities offerings under Fannie Mae’s universal debt facility, including pricing supplements for individual issuances of debt securities.
Disclosure about our obligations pursuant to some of the MBS we issue, some of which may be off-balance sheet obligations, can be found at www.fanniemae.com/mbsdisclosure. From this address, investors can access information and documents about our MBS, including prospectuses and related prospectus supplements.
We are providing our website address solely for your information. Information appearing on our website is not incorporated into this report.
Our Purchases of Equity SecuritiesWe did not repurchase any of our equity securities during the first quarter of 2016.
Dividend Restrictions Our payment of dividends is subject to the following restrictions:
Restrictions Relating to Conservatorship. Our conservator announced on September 7, 2008 that we would not pay any dividends on the common stock or on any series of preferred stock, other than the senior preferred stock. In addition, FHFA’s regulations relating to conservatorship and receivership operations prohibit us from paying any dividends while in conservatorship unless authorized by the Director of FHFA. The Director of FHFA has directed us to make dividend payments on the senior preferred stock on a quarterly basis.
Restrictions Under Senior Preferred Stock Purchase Agreement. The senior preferred stock purchase agreement prohibits us from declaring or paying any dividends on Fannie Mae equity securities (other than the senior preferred stock) without the prior written consent of Treasury. In addition, in 2012 the terms of the senior preferred stock purchase agreement and the senior preferred stock were amended to require that we pay Treasury each quarter any dividends declared consisting of the amount, if any, by which our net worth as of the end of the immediately preceding fiscal quarter exceeds an applicable capital reserve amount, which will decrease to zero in 2018. As a result, our net income is not available to common stockholders. For more information on the terms of the senior preferred stock purchase agreement and senior preferred stock, see “Business—Conservatorship and Treasury Agreements—Treasury Agreements—Senior Preferred Stock Purchase Agreement and Related Issuance of Senior Preferred Stock and Common Stock Warrant” in our 2015 Form 10-K.
Additional Restrictions Relating to Preferred Stock. Payment of dividends on our common stock is also subject to the prior payment of dividends on our preferred stock and our senior preferred stock. Payment of dividends on all outstanding preferred stock, other than the senior preferred stock, is also subject to the prior payment of dividends on the senior preferred stock.
Statutory Restrictions. Under GSE Act, FHFA has authority to prohibit capital distributions, including payment of dividends, if we fail to meet our capital requirements. If FHFA classifies us as significantly undercapitalized, approval of the Director of FHFA is required for any dividend payment. Under the GSE Act, we are not permitted to make a capital distribution if, after making the distribution, we would be undercapitalized, except the Director of FHFA may permit us to repurchase shares if the repurchase is made in connection with the issuance of additional shares or obligations in at least an equivalent amount and will reduce our financial obligations or otherwise improve our financial condition.
Item 3. Defaults Upon Senior SecuritiesNone.
Item 4. Mine Safety DisclosuresNone.
Item 5. Other InformationNone.
Item 6. ExhibitsAn index to exhibits has been filed as part of this report beginning on page E-1 and is incorporated herein by reference.

130
SIGNATURES
Pursuant to the requirements of the Securities Exchange Act of 1934, the registrant has duly caused this report to be signed on its behalf by the undersigned thereunto duly authorized.
Federal National Mortgage Association
By: /s/ Timothy J. Mayopoulos
Timothy J. MayopoulosPresident and Chief Executive Officer
Date: May 5, 2016
By: /s/ David C. Benson
David C. BensonExecutive Vice President andChief Financial Officer
Date: May 5, 2016
E-1
INDEX TO EXHIBITS
Item Description
3.1 Fannie Mae Charter Act (12 U.S.C. § 1716 et seq.) as amended through July 21, 2010 (Incorporated byreference to Exhibit 3.1 to Fannie Mae’s Quarterly Report on Form 10-Q (Commission file number000-50231) for the quarter ended June 30, 2015, filed August 6, 2015.)
3.2 Fannie Mae Bylaws, as amended through January 30, 2009 (Incorporated by reference to Exhibit 3.2 toFannie Mae’s Annual Report on Form 10-K (Commission file number 001-34140) for the year endedDecember 31, 2008, filed February 26, 2009.)
31.1 Certification of Chief Executive Officer pursuant to Securities Exchange Act Rule 13a-14(a)31.2 Certification of Chief Financial Officer pursuant to Securities Exchange Act Rule 13a-14(a)32.1 Certification of Chief Executive Officer pursuant to 18 U.S.C. Section 135032.2 Certification of Chief Financial Officer pursuant to 18 U.S.C. Section 1350
101. INS XBRL Instance Document*101. SCH XBRL Taxonomy Extension Schema*101. CAL XBRL Taxonomy Extension Calculation*
101. DEF XBRL Taxonomy Extension Definition*101. LAB XBRL Taxonomy Extension Label*101. PRE XBRL Taxonomy Extension Presentation*
__________
* The financial information contained in these XBRL documents is unaudited.

FR026