family planning and rural fertility decline in iran: a
TRANSCRIPT

Family Planning and Rural Fertility Decline inIran: A Study in Program Evaluation ∗
Djavad Salehi-IsfahaniDepartment of Economics
Virginia Tech
M. Jalal Abbasi-ShavaziDepartment of Sociology
University of Tehran
Meimanat Hosseini-ChavoshiMinistry of Health and Medical Education
Iran
September 21, 2008
Preliminary draft, not for quotation
Abstract
During the first decade of the Islamic Revolution Iranian fertilitywas on the rise, in part because of the revolutionary regime’s pro-natalpolicies. In a policy reversal, in 1989 the government launched an ambi-tious and innovative family planning program specifically aimed at ruralfamilies, which by 2005 had brought the average number of births perrural woman down to about 2 from 8 in the mid 1980s. In this paper weevaluate the impact of this program on fertility in a quasi-experimentalsetting. We use the timing of establishment of rural health houses andvillage-level measures of fertility to identify program impact. Our re-sults indicate only a moderate effect of the program on rural fertility.Villages that received health services earlier had only a slightly greaterdecline in fertility compared to those who received it later. Our re-gression results indicate that initial literacy and availability of schoolsplayed a larger role in fertility decline than family planning.
∗Please send comments to [email protected]. This research has been supported by grantsfrom the Global Development Network and the Bill and Melinda Gates Foundation. This iswork in progress and is not intended for citation. We acknowledge valuable comments fromJeff Smith and Nancy Qian. For able research assistance I am grateful to Ali Hashemi. Thedata for this research was provided the Statistical Center of Iran.
1

1 Introduction
The question of the role of state-provided family planning programs in fertil-
ity transition has long interested demographers, economists and policy makers.
Economists stress the role of demand for children, and hence factors that de-
termine it such as infant mortality and education, as more important than
provision of family planning services (Schultz 2007). There are few rigor-
ous evaluations of family planning programs in developing countries. Joshi
and Schultz (2007) exploit the experimental design of the Matlab program in
Bangladesh to estimate a decline of 15 percent in fertility over more than a
decade. In a non-experimental setting, Angeles et al. (2005a) and (2005b),
and Miller (2007) estimate the effect of family planning programs in Peru and
Columbia using geographic variation in program implementation. This pa-
per contributes to this literature by presenting an evaluation of the impact of
Iran’s family planning program.
During the last two decades Iran’s fertility declined from one of the world’s
highest to replacement level. In a span of 15 years the total fertility rate
(TFR) dropped by about five births reducing fertility in Iran to replacement
level. At the same time, Contraceptive Prevalence Rates (CPR) increased
from 54 percent in urban areas and 20 percent in rural areas in 1976 to 77 and
67, placing Iranian families among the highest users of contraceptives in the
developing world (Mehryar et al. 2001). The existing descriptive literature
on Iran’s fertility decline credits this spectacular decline to an innovative and
ambitious family planning program launched in 1989, immediately after the
end of the war with Iraq, that represented a reversal of the Islamic regime’s pro-
natal stance during its first ten years (Aghajanian 1995, Ladier-Fouladi 1996,
2
Hoodfar and Assadpour 2000, Mehryar et al. 2001, Mehryar et al. 2001).
While early on the leader of the Islamic Revolution, Ayatollah Khomeini, had
declared birth control legitimate, the regime’s policy was pro-natal and actively
discouraged family planning. This policy served the regime well while the war
with Iraq was raging (1980-1988), but by 1989, when the war had ended and the
results of the 1986 census showed that during the preceding decade population
growth had accelerated to 3.9% per year, the regime reversed itself on family
planning.
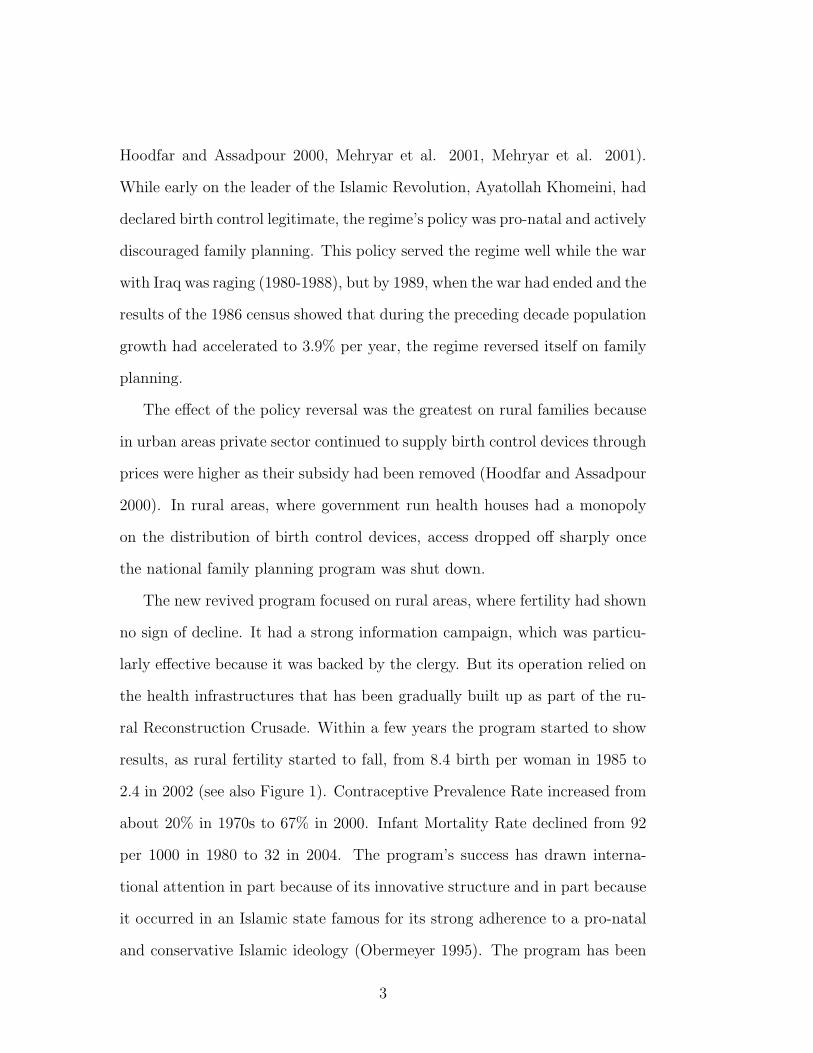
The effect of the policy reversal was the greatest on rural families because
in urban areas private sector continued to supply birth control devices through
prices were higher as their subsidy had been removed (Hoodfar and Assadpour
2000). In rural areas, where government run health houses had a monopoly
on the distribution of birth control devices, access dropped off sharply once
the national family planning program was shut down.
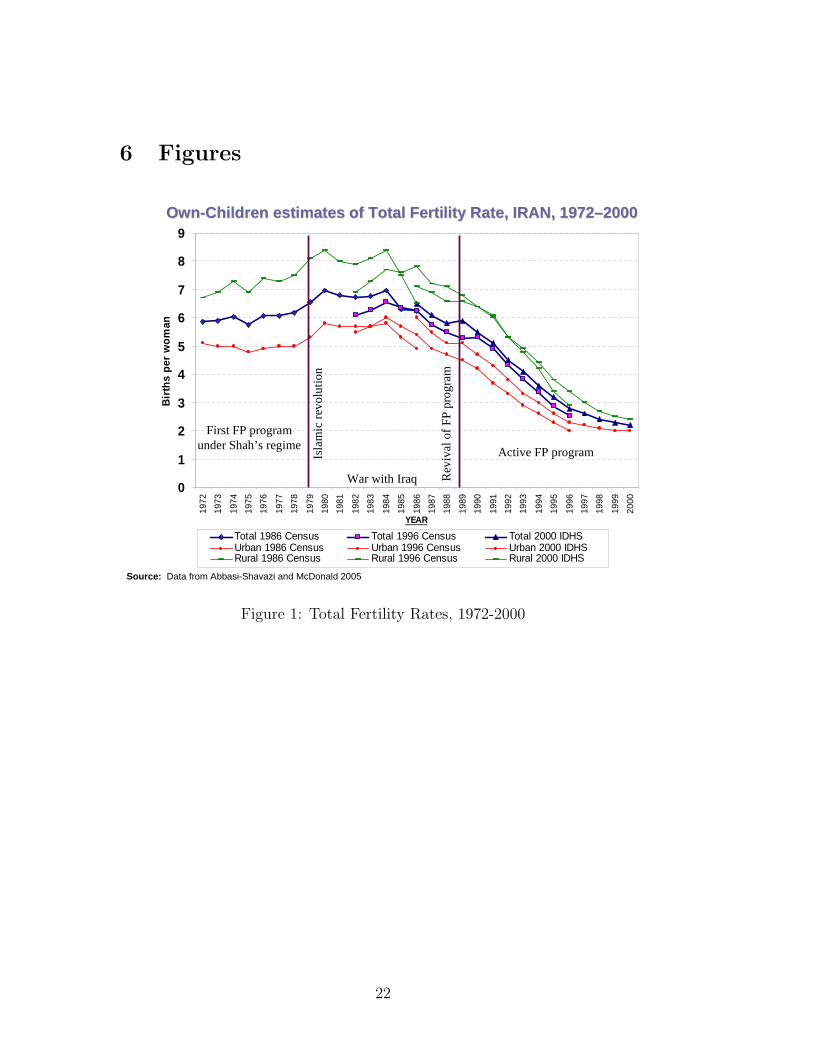
The new revived program focused on rural areas, where fertility had shown
no sign of decline. It had a strong information campaign, which was particu-
larly effective because it was backed by the clergy. But its operation relied on
the health infrastructures that has been gradually built up as part of the ru-
ral Reconstruction Crusade. Within a few years the program started to show
results, as rural fertility started to fall, from 8.4 birth per woman in 1985 to
2.4 in 2002 (see also Figure 1). Contraceptive Prevalence Rate increased from
about 20% in 1970s to 67% in 2000. Infant Mortality Rate declined from 92
per 1000 in 1980 to 32 in 2004. The program’s success has drawn interna-
tional attention in part because of its innovative structure and in part because
it occurred in an Islamic state famous for its strong adherence to a pro-natal
and conservative Islamic ideology (Obermeyer 1995). The program has been
3

labeled as a model of developing countries Boonstra (2001) and has influenced
the design of programs elsewhere (for example, in Pakistan).
Despite such attention, there is no published study that provides evidence
of a causal link between Iran’s family planning program and the decline in
fertility. This paper presents an evaluation for this program in the rural areas
of Iran. The rural component of the program is of special interest for two
reasons. First, the decline in fertility was most spectacular in rural areas,
where previous attempts had failed (Aghajanian 1995). Total fertility fell by
nearly four fold in less than two decades, from 8 to 2 average births per woman
from the late 1980s to 2005. Second, the program was most innovative in its
rural component. During this period, more than 90 percent of rural families
came under the coverage of the Health Network System (HNS), which is a
network of 18,000 Health Houses serving more than 22 million rural people.
The construction of rural health facilities began before the Revolution of 1979,
but really accelerated in the mid 1980s, closely timed with fertility decline (see
Figure 5 for the pace of construction of the the Health Houses).
But the apparent close timing of fertility decline and the program’s initia-
tion does not prove causation. To establish a causal role for the program one
must be able to control for changes in demand factors that could account for
why women and families decided to use the program’s services when it was
offered in the 1990s. Iran had a history of offering family planning with very
modest effect–almost no effect in rural areas. An analysis of the moderate fer-
tility decline before the Revolution by Raftery, Lewis, and Aghajanian (1995)
found in favor of the role of demand for children over ideation that might have
resulted from family planning.
There are other, more fundamental reasons for why fertility would decline
4

in the 1990s as fast as it did besides ideation. Economists, who are often most
skeptical of claims that attribute fertility decline to family planning, emphasize
the role of household characteristics, such as education and women’s opportu-
nity cost of time, in fertility determination (Becker 1992; Schultz 1988; Schultz
1994). Women’s education had been on the rise for some time, in both rural
and urban areas, and could thus account for increased demand for contracep-
tion offered by the program. Reduced form models of fertility for Iran confirm
the role of these factors. The number of children ever born is negatively influ-
enced by women’s education and positively by family income (Salehi-Isfahani
2001). Thus the increase in education and falling income in the 1980s could
explain why families were more eager to adopt family planning when it was
offered in 1989 than they had been in the 1970s (see Figure 2 for fluctuations
in per capita incomes). Infant mortality had been on steady decline in infant
mortality that had started in the 1950s. Figure 3 shows that mortality decline
in Iran was on a downward trend very similar to Turkey, another large Mid-
dle Eastern country that did not have a similar family planning program but
experienced fertility decline in the same order of magnitude as Iran, albeit at
a more gradual pace.
There is also evidence that the post-Revolution fertility decline started
in the mid 1980s before the mandate of the Health Network System had
been to include family planning in 1989 (Abbasi-Shavazi and McDonald 2006).
Finally, the same pressures generated by the fertility boom of the early years
of the Revolution (1979-1984) that had prompted the government to reverse
its position on family planning may have also persuaded individual families
to limit their fertility. A similar argument has been made in the case of
Taiwan where fertility decline appears to have preceded family planning and
5

was more closely correlated with mortality decline (Li 1973). In light of these
observations, as well as the fact that Iran’s program has been hailed as a
model for other developing countries, a rigorous analysis of the effects of Iran’s
program is warranted.
There are several process evaluations that demonstrate the program’s ef-
fectiveness in service delivery but they fall short of evaluating its impact. To
evaluate its impact is to compare the actual outcomes in terms of fertility
decline for women who were exposed to the program services with what they
would have experienced had they not been exposed. This study proposes a
method of doing that. At one level, there is no denying that Iran’s family
planning program was effective in reducing fertility, especially in rural areas.
By lowering the cost of contraception it should have affected fertility out-
comes. So, the question is really about the degree of program effect, which
our quantitative approach to program effect can answer.
2 Program description
Iran’s present rural Health Network System was started in 1984 with a law
that mandated the Ministry of Health and Medical Education (MOHME) to
build the country’s rural health infrastructure. Starting in the capital city
of each province, the Ministry set up a rural Health Center to oversee the
operation of several health Houses each in a “Main” village serving about
1500 households. Health Houses were typically staffed with two behvarz, health
workers, recruited from the village and trained for one year. Health Houses
in Main villages served several Satellite villages that were nearby directly and
those in outer settlements with mobile units. Figure 4 shows the relationship
6

within the Network.
The initial focus of the HNS, before family planning became official policy
in 1989, was the health of mother and child. This feature may have helped
establish the trust of the rural families in that the government’s intention was
to improve their lives rather than merely limit their numbers. Recruitment
and training of local health workers also added to local trust. As a result,
by the time the national communications campaign for family planning was
in full swing, most rural residents had come to believe the second part of its
main slogan — fewer children, better life.
The program adopted an active system of delivery of services. If a woman
did not visit the Health House within a year, the behvarz would pay her
a visit to collect new information and provide needed services. The data
obtained from individual women is entered into a statistical database known
as Zij, which is now a huge data base containing every rural woman’s health
history.
Figure 5 shows the distribution of Health Houses by year of establishment.
There were very few villages with Health Houses in the early 1970s. The last
two years before the Revolution, 1977-78, saw an expansion of the rural health
network, which continued at a slower pace after the Revolution until 1985,
when the law went into effect and the number of Health Houses built each
year more than doubled. The peak rate of construction was reached in 1989,
when family planning was added to the HNS’s mandate. By then roughly half
of the Health Houses were already in existence. We exploit the fact that half of
the villages had access to the HNS at the time of policy reversal as part of our
identification strategy. By 2004, there were 16,560 Health Houses staffed by
26,403 health workers (behvarz ) and linked to 2321 rural Health Centers and
7

serving about 55,000 villages. By then the program’s coverage had reached
about 90% of the country rural population (20.4 million individuals living in
4.2 million households).
2.1 Program placement
An important feature of our identification strategy is the placement of the
Health Houses across the country and over time. While placement was not
random, we believe that it was not compensatory in the sense of villages with
lower health and higher fertility receiving programs earlier. According to in-
terviews with MOHME officials in charge of the program, the mandate to
MOHME in 1984 was to begin the implementation of the heath network in
one district in each of the 25 provinces (now 30 provinces) and then expand
to other districts within each province, eventually covering all districts (about
180 then and 360 now). According to these officials, placement was mainly in-
fluenced by the capability of local administrators (provincial governor, mayors
and town councils), and the availability of educated potential health workers
(initially minimum of primary education, later lower secondary). The principal
concern in estimating program impact is to make sure that program placement
was not endogenous to the outcome being measured. In our case, we are par-
ticularly interested to know if villages who received the program early were
not those with higher fertility. From the account of interviews regarding place-
ment of Health Houses, it is likely that localities with higher education (and
therefore likely lower fertility) would receive the program earlier.
In Iran the largest variation in rural health and fertility is between provinces
rather than inside the same province. As a result, this particular strategy
8

created some degree of independence of program placement from local con-
ditions at the initial phase. In 1996, seven years after the family planning
program had been adopted nationally, the birth rate in the more developed
Esfahan province was less than half that of the least developed Sistan and
Baluchestan (Abbasi-Shavazi and McDonald 2006) (see Figure 6 for variation
in child-woman ratios across districts in Iran). Yet, fertility decline has oc-
curred widely across Iran, indicating the influence of common factors that may
have helped reduce fertility, among them possibly family planning.
Within each province selection of districts may have introduced some en-
dogeneity because the initial districts were picked based on criteria that could
be related to health and fertility. One criterion was availability of local edu-
cated young men and women (with primary education in the early years and
high school later) who could be trained as Health Workers. Another was the
quality of the local administration – whether or not the district governor was
competent and willing to cooperate with setting up the facilities. It is thus
possible that districts chosen earlier, presumably those with greater supply of
educated young people and higher quality administrations, also enjoyed greater
health and lower fertility. We test for the factors that influenced placement
using probit regressions for the year in which villages were brought into the
HNS. The results for placemtn in 1986 and 1989 are presented in Table 3.
The probability of being in the HNS before, say, 1989 is negatively related to
fertility and positively related to literacy rates and the presence of schools in
the village. These estimates corroborate the anecdotal evidence we obtained
during our interviews to the effect that programs were placed first in areas
with better administrative infrastructure and better education.
9

3 Data
Our unit of observation is a village designated as a “Main village” by MOHME.
We obtained information on the year of establishment for 16715 “Main” vil-
lages that had a Health House by 2005. The Health Houses in these village
cover more than 90% of the rural population, but they are less than 30% of
all villages in Iran. In addition, there are another 60,000 smaller hamlets and
collection of houses. Most of these units are served by the Health Houses in
our sample. So, our test is about change in fertility in the “main” villages
rather than all villages and rural settlements in Iran.
We were able to match 15,071 villages with village-level demographic and
facilities data such as schools, electricity, piped water, etc. We use the demo-
graphic data extracted from the censuses of 1986, 1996, and 2006 to calculate
our measure of the fertility outcome as the ratio of children 0-4 to women
15-49, the child-woman ratio (CWR), for each village.
We were able to obtain information about the presence of schools and
basic services for about 14,500 villages in our sample from the Ministry of
Agricultural Reconstruction. For each census year we are able to tell whether
the villages in our sample had schools (primary, lower- or upper-secondary),
electricity, piped water, a mosque, public bath, and the like.
After eliminating villages with unreliable data, we are left with a working
sample of 14,139 villages for 1986-1996 and 13,795 villages for all three years.
Table ?? presents the summary statistics for the sample as a whole. Mean
village population is 854, and the range is very wide, from 6 to more than
10,000. Average literacy rate is 47%, 95% of the villages had a primary school,
29% middles school and only 2% a high school.
10

Average child-woman ratio (CWR) is 725 children 0-4 old per 1000 women
15-49, and the range is from 31 per 100 to 3000. These outlier values of CWR
arise because some villages are quite small making it possible to have extreme
values of the cwr. In our empirical analysis we experiment with dropping the
outliers to see if the results change, but since the sample is large, they do not
seem to matter. Apart from this, there is quite a bit of variation in fertility
across the country that should help to identify program effect (see also Figure
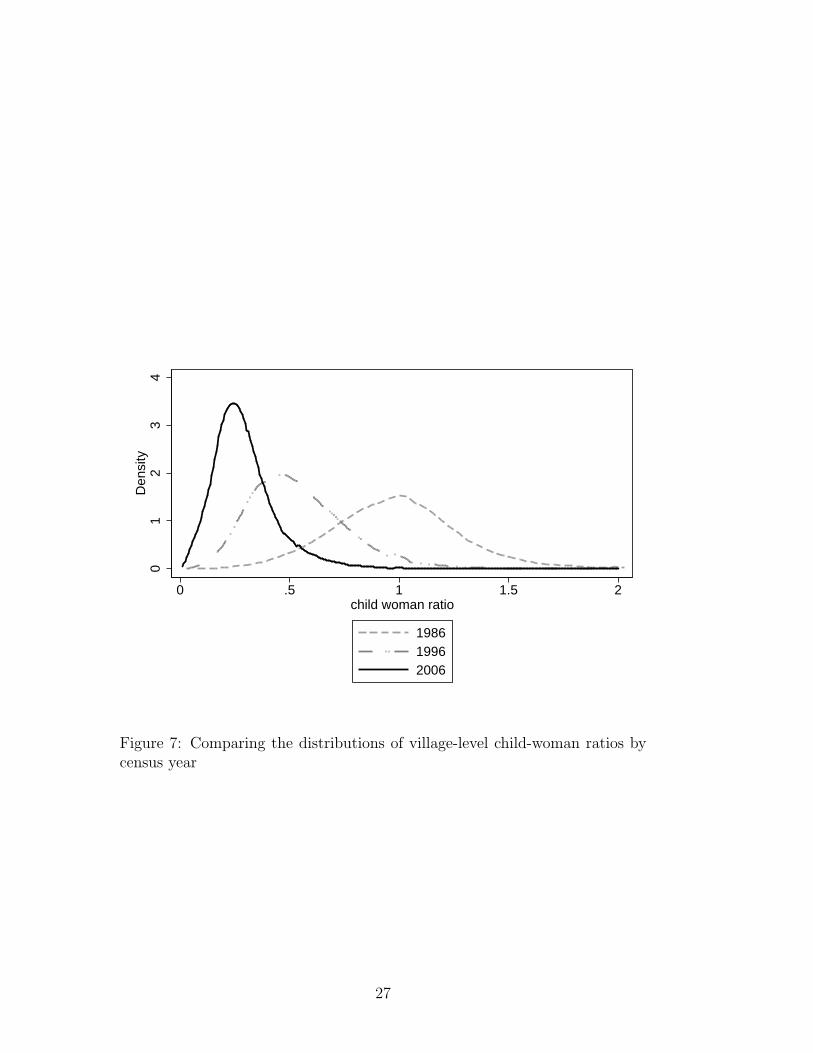
6 for the variation in child woman ratios across districts). The distributions
of CWRs by census year are shown in Figure 7. There is a clear shift to the
left in the distribution of CWR in each ten year period.
4 Identification
Two features of Iran’s rural family planning program offer strategies for iden-
tification of program impact. One is the considerable geographic variation in
the spread of services in villages during 1985-2000, which seems uncorrelated
with demand for contraception services and can therefore potentially identify
program impact. Numerous studies take advantage of geographic variation in
program placement to evaluate their impact (Duflo 2000, 2001, Breierova and
Duflo 2004, Angeles, Guilkey, and Mroz 2005a and 2005b, and Miller 2005).
Another feature is the sudden policy reversal in 1989 from pro- to anti-
natal, which essentially divides the target rural population into two treatment
and comparison groups. In the treatment group are those families who in 1989
resided in villages already served by the rural Heath Network (but no family
planning) and were therefore exposed to family planning services immediately
after 1989. The comparison group consists of those who were not yet integrated
11

into the Health Network System and were therefore not exposed to family
planning.
In what follows we present results of three sets of regressions with different
identification.
4.1 I. A difference-in-difference estimator
In this section we report on a difference-in-difference estimator based on fertil-
ity change in villages between the two census periods of 1986 and 1996. This
method aims to identify the average treatment effect from the difference in
the rate of fertility decline between a group of villages that between 1986 and
1996 went from being outside the HNS to being inside. We call this group the
Program (or treatment) group. Our Comparison (or control) group consists
of those villages that did not have a Health House in neither year.
The DID estimator can be implemented with this equation:
CWRit = α + βHHit + γY eart + δ(HHit ∗ Y eart) + ψX + εit (1)
where CWRit is the child-woman ratio of village i in year t, HH is a dummy
variable which takes the value of one if the village has a Health House in year
t, and X is a list of controls that affect CWR. The value of β is an estimate
of the difference between Program and Comparison villages, γ is the common
time trend, and δ is the program effect (the DID estimator).
As noted earlier, the main concern with the this identification strategy
is that program placement may be endogenous; for example, if the villages
covered early are systematically different from those that receive the services
12

later. In particular, if these differences are not due to observable factors, such
as education, and cannot be included in X, the dummy variable HH may be
correlated with the error term εit.
This would be the case if, for example, program placement had been com-
pensatory in the sense that villages with lower health or higher fertility were
included first, or if people had migrated to these areas to take advantage of
the program (Rosenzweig and Wolpin 1986, 1988; Schultz 1988). Only studies
that take advantage of an experimental design can claim true randomness in
assigning women to treatment and control groups and thus offer a clean test
of program effect (Sinha 2005). Others must rely on ways to reduce the bias
resulting from endogenous program placement.
Table 2 presents the summary statistics for this regression. According to
our definition, approximately 25% of the villages are in the Program group and
the rest are Comparison. The two groups of villages are similar in population
size, 688 and 742, respectively, and CWR, which is slightly higher for the
Comparison group (1.01) compared to Program (0.94). Consistent with their
lower CWR, Program villages have on average a higher literacy rate and a
greater proportion have schools that Comparison villages.
The regression results for equation (1) are presented in Table 4. The aver-
age difference between Program and Comparison villages is rather small and
gets even smaller as we add controls that influence CWR. This is the only
coefficient that changes as we add more variables on the right hand side. The
common time trend is a reduction of 0.44 in the CWR on average, which is
more than a fifty percent decline. The program effect is small relative to the
common trend but it is significant. Program villages on average experienced a
decline if 0.47 compared to 0.44 for Comparison villages. This decline is quite
13

modest and indicates that stronger forces were driving rural fertility down
during the 1986-1996 period.
Adding controls for schooling and religion does not change this finding.
The presence of primary, middle and high school are all significant and neg-
atively influence fertility, as expected. These variables may be endogenous
(villages with lower fertility acquire more schools), so these effects may be bi-
ased. Villages with mosques and those with majority shia populations also had
on average lower fertility. Larger villages (greater population) had on average
slightly higher CWRs. Finally, in the last column we report the fixed-effects
estimators that take out district-level fixed effects. The results are very similar
to OLS.
4.2 II. A difference-in-difference estimator for policy re-
versal
In this section we report on the regression results for a DID estimator that
takes advantage of the policy reversal in 1989 regarding family planning. This
DID estimator compares fertility indicators before and after the policy re-
versal in 1989 for a slightly different definitions of Program and Comparison
villages. The identification strategy here is based on the fact that villages that
received Health House before 1989 did so independently of their demand for
family planning services (and presumably fertility) because at the time family
planning was not considered as part of government policy and therefore the
mandate of the HNS. Thus between 1985-89 many rural Health Houses oper-
ated and offered maternal and child health services but did not offer family
14

planning services.1 In 1989, when the government made its sudden turnabout
on population policy and Health House services expanded to include family
planning, there were over 8000, half of the total, were able to take advantage
of the new services whereas others could not. This observation forms a reason-
able basis for identification of program impact. The difference between this
model and the preceding model is in the increased confidence in the exogeneity
of program placement.
About 11,808 villages in the sample (71%) fall into the Program group
(had a Health House by 1989) and the remaining 4,914 are Comparison. Av-
erage CWR for the Program group was 0.97 in 1986 and 0.51 in 1996; for
the Comparison group these numbers were 1.01 and 0.57, respectively. Both
groups experienced sharp declines in fertility, but was the decline in the Pro-
gram group significantly greater than in the Comparison group? To answer
this question we estimate equation 1, with the new definition of the Health
House dummy variable. The results are presented in Table 5. There is no
noticeable difference between these results and the comparable results for the
previous model in column 1 of Table 4. One reason for the similarity between
these two sets of results may be that fertility decline for those villages that
received their Health House between 1986 and 1989 is the same. This implies
that actual program impact, for what it was worth, may have occurred after
1989, when family planning was added to the HNS mission.
1In visits to several Health Houses we came across one village (Firouzkooh, near Tehran)where health workers recalled givign advice on family planning and services to those whorequested it. So, the policy reversal was not as drastic for all villages as one might assume.
15

4.3 III. The effect of program exposure
This last observation raises the question that exposure to the HNS may matter
and more so for the years after the policy reversal in 1989. To test for this we
distinguish between villages with different years of exposure. This is our third
and final identification strategy.
We define exposure as the difference between the census years 1996 and
2006, when we observe the fertility outcomes, and the year of establishment
of the Health House. This strategy allows us to distinguish between the effect
of the years in the Health Network before and after the policy reversal, which
provides a test for the difference in the effects of having a Health House before
and after the policy reversal in 1989. The results of the regression of CWRs in
1996 and 2006 on the CWR in 1986 along with a set of other exogenous vari-
ables are presented in Table 6. Exposure has a small but significant negative
effect on CWR in 1996 (and even smaller in 2006), but in columns 2 and 4,
where we put the years of program exposure before and after policy reversal in
the regression separately, we note that the former has no effect on CWR. This
result indicates that, for what it was worth, the mother and child well-being
functions of the Health Houses before family planning went into effect does
not seem to have had much effect on fertility.
5 Conclusion
During the 1990s rural fertility in Iran declined sharply. At the same time
an innovative family planning program, known as the rural Health Network
System, was gradually extended across 60,000 villages in Iran. This paper
takes advantage of the timing of when villages were integrated into Iran’s
16

Health Network System to identify the impact of the country’s family planning
program on fertility. Between 1986 and 1996 about 8000 Health Houses were
built serving about 1.2 households. We measure fertility at the village level in
two points in time, in census years 1986 and 1996, and develop a difference-
in-difference (DID) estimator that compares decline in the village-level child-
woman ratios between those villages with no Health House in either point in
time and those that received one by 1996. The DID estimator is shows a very
weak program effect, indicating that the sharp decline in fertility in rural Iran
during this period was mainly caused by other contemporaneous factors. In
particular, we find the role of education to be important.
17
References
Abbasi-Shavazi, M. and P. McDonald (2006). Fertility decline in the islamic
republic of iran, 1972-2000. Asian Population Studies 2 (3), 217–237.
Aghajanian, A. (1995). A new direction in population policy and family
planning in the islamic republic of Iran. Asia-Pacific Population Jour-
nal 10 (1).
Angeles, G., D. K. Guilkey, and T. A. Mroz (2005a). The determinants of
fertility in rural peru: Program effects in the early years of the national
family planning program. Journal of Population Economics 18 (367-389).
Angeles, G., D. K. Guilkey, and T. A. Mroz (2005b). The effects of educa-
tion and family planning programs on fertility in Indonesia. Economic
Devellopment and clultural change 54 (1), 165–201.
Becker, G. S. (1992). Fertility and economy. Journal of Population Eco-
nomics 5 (3), 185–201.
Boonstra, H. (2001). Islam, women and family planning: A primer. The
Guttmacher Report on Public Policy 4 (6).
Breierova, L. and E. Duflo (2004). The impact of education on fertility and
child mortality: Do fathers really matter less than mothers? NBER
working paper 10513.
Duflo, E. (2000). Child health and household resources in South Africa: ev-
idence from the Old Age Pension Program. American Economic Review
Papers and Proceedings .
Duflo, E. (2001). Schooling and labor market consequences of school con-
struction in Indonesia: evidence form an unusual policy experiment.
18

American Economic Review Papers and Proceedings 91 (4), 795–813.
Hoodfar, H. and S. Assadpour (2000). The politics of population policy in
the Islamic Republic of Iran. Studies in Family Planning 31 (1), 19–34.
Joshi, S. and T. P. Schultz (2007). Family planning as an investment
in development: Evaluation of a programs consequences in matlab,
bangladesh. Technical report.
Ladier-Fouladi, M. (1996). La transition de la fecondite en iran. Popula-
tion 51, 1101–1128.
Li, W. L. (1973). Temporal and spatial analysis of fertility decline in taiwan.
Population Studies 27 (1).
Mehryar, A. H., B. Delavar, G. A. Farjadi, M. Hosseini-Chavoshi,
M. Naghavi, and M. Tabibian (2001). Iranian miracle: How to raise
contraceptive prevalence rate to above 70 percent and cut TFR by two-
thirds in less than a decade? Paper presented at the IUSSP World
Congress, Brazil 2001.
Mehryar, A. H., F. Roudi, A. Aghajanian, and F. Tajdini (2001). Repression
and revival of the family planning program and its impact on fertility
levels in the islamic republic of iran. Working Paper 2022, Economic
Research Forum, Cairo, Egypt.
Miller, G. (2005). Contraception as development? new evidence from family
planning in Colombia. NBER working paper w11704.
Miller, G. (2007). Contraception as development? new evidence from family
planning in Colombia. Technical report, Stanford Medical School and
NBER.
19

Obermeyer, C. M. (1995). Reproductive rights in the west and in the middle
east: A cross-cultural perspective. In C. M. Obermeyer (Ed.), Family,
Gender, and Population in the Middle East: Policy in Context. Cairo:
The American University in Cairo Press.
Raftery, A. E., S. M. Lewis, and A. Aghajanian (1995). Demand or ideation?
evidence from the Iranian marital fertility decline. Demography 32 (2),
159–182.
Rosenzweig, M. R. and K. Wolpin (1986). Evaluating the effects of opti-
mally distributed public programs: child health and family planning
interventions. American Economic Review 76 (3), 470–482.
Rosenzweig, M. R. and K. I. Wolpin (1988). Migration selectivity and the
effects of public programs. Journal of Public Economics 37 (3), 265–289.
Salehi-Isfahani, D. (2001). Fertility, education, and household resources in
Iran, 1987-1992. In Research in Middle East Economics, Volume 4. Lon-
don: Elsevier/JAI Press.
Schultz, T. P. (1988). Population programs: measuring their impact on
fertility. Journal of Policy Modeling 10 (1), 113–149.
Schultz, T. P. (1994, May). Human capital, family planning, and their ef-
fects on population growth. The American Economic Review Papers and
Proceedings 84 (2), 255–260.
Schultz, T. P. (2007). Population policies, fertility, womens human capital,
and child quality. Technical report, IZA.
Sinha, N. (2005). Fertility, child work and schooling consequences of family
planning programs: Evidence from an experiment in rural bangladesh.
20

Economic Development and Cultural Change 54 (1), 97–128.
21
6 Figures
0
1
2
3
4
5
6
7
8
9
1972
1973
1974
1975
1976
1977
1978
1979
1980
1981
1982
1983
1984
1985
1986
1987
1988
1989
1990
1991
1992
1993
1994
1995
1996
1997
1998
1999
2000
YEAR
Birt
hs p
er w
oman
Total 1986 Census Total 1996 Census Total 2000 IDHSUrban 1986 Census Urban 1996 Census Urban 2000 IDHSRural 1986 Census Rural 1996 Census Rural 2000 IDHS
First FP program under Shah’s regime
Active FP programIsla
mic
rev
olut
ion
Rev
ival
of
FP
pro
gra
m
War with Iraq
OwnOwn --Children estimates of Total Fertility Rate, IRAN, 1 972Children estimates of Total Fertility Rate, IRAN, 1 972––2000 2000
Source: Data from Abbasi-Shavazi and McDonald 2005
Figure 1: Total Fertility Rates, 1972-2000
22

GDP and private consumption per capita
0
1000
2000
3000
4000
5000
6000
7000
8000
1955
1960
1965
1970
1975
1980
1985
1990
1995
2000
2005
PP
P $
0
1000
2000
3000
4000
5000
6000
7000
1997
ria
ls x
1000
GDPPC_CBI PrivateCPC
GDPPC_WDI GDPPC_Penn
Figure 2: GDP and consumption per capitaSource: World Bank WDI (2005)
23

5010
015
020
025
030
0C
hild
mor
talit
y ra
te
34
56
7B
irths
per
wom
an
1960 1970 1980 1990 2000
Iran
5010
0150
2002
5030
0C
hild
mor
talit
y ra
te
34
56
7B
irths
per
wom
an
1960 1970 1980 1990 2000
Births per woman Child mortality rate
Turkey
Source: Author’s calculation, World Bank(2003)
Figure 3: Decline in fertility and child mortality in Iran and Turkey
District center(Health Center)
Main village(Health House)
S
S
S
Mobile units
Figure 4: The Role of Health Houses in Iran’s Rural Health Network System
24

Policy reversal
Revolution
0.0
2.0
4.0
6.0
8D
ensi
ty
1970 1980 1990 2000 2010healthhouse establishment year
Figure 5: The distribution of Health Houses by year of establishment
25

Figure 6: Child-woman ratios at the district level, 1996
26
01
23
4D
ensi
ty
0 .5 1 1.5 2child woman ratio
198619962006
Figure 7: Comparing the distributions of village-level child-woman ratios bycensus year
27

7 Tables
Table 1: Summary statisticsVariable Mean Std. Dev. Min. Max. N
Population 854 763 6 10,136 27,282Children (aged 0-4) population 127 124 1 2,119 27,282Female (aged 15-49) population 186 170 1 2501 27282Child woamn ratio 0.725 0.313 0.031 3 27,282Literacy 0.474 0.159 0.004 0.895 27,262Ratio of villages with primary school in 1986 0.949 0.219 0 1 27,282Ratio of villages with middle school in 1986 0.289 0.453 0 1 27,282Ratio of villages with high school in 1986 0.024 0.153 0 1 27,282Ratio of villages with mosque school in 1986 0.85 0.357 0 1 27,282Ratio of villages with shia majority in 1986 0.859 0.348 0 1 27,282
Table 2: Summary Statistics for Comparison and Program GroupsMean Std. Dev.
Control Program Control ProgramYear 1986 1996 1986 1996 1986 1996 1986 1996Total population 688 742 874 895 757 870 712 782Child (aged 0-4) population 135 93 162 99 153 106 139 92Female (aged 15-49) population 136 172 175 210 152 206 143 185Child woman raito 1.01 0.57 0.94 0.48 0.24 0.20 0.24 0.18Literacy 0.31 0.54 0.38 0.59 0.14 0.12 0.12 0.10Villages with primary school in 1986 0.91 - 0.96 - 0.29 0.20Villages with middle school in 1986 0.12 - 0.33 - 0.32 0.47Villages with high school in 1986 0.01 - 0.03 - 0.10 0.16Villages with mosque in 1986 0.77 - 0.87 - 0.42 0.34Villages with shia majority in 1986 0.79 - 0.87 - 0.41 0.33# of observations 13,641 13,641
28

Table 3: Program placement: the effect of village characteristics on being inthe Health Network System
(1) (2)1896 child woman ratio -0.095 -0.093
(0.018)** (0.020)**Literacy 0.580 0.722
(0.040)** (0.044)**Dummy for primary school in 1986 0.067 0.082
(0.018)** (0.020)**Dummy for middle school in 1986 0.187 0.248
(0.011)** (0.011)**Dummy for high school in 1986 -0.005 0.039
(0.024) (0.031)Dummy for mosque in 1986 0.005 -0.012
(0.012) (0.013)Dummy for shia majority in 1986 0.040 -0.025
(0.012)** (0.014)Log of population 0.016 0.014
(0.006)** (0.007)*Observations 14138 14138Note: Dependent variable in Col(1) is presence of a Health House in 1986 and in Col(2) presence in 1989;
Standard errors in parentheses;* significant at 5%; ** significant at 1%
29

Table 4: The difference-in-difference estimator for change in fertility 1986-1996(1) (2) (3) (4) (5)
Difference between two groups -0.046 -0.033 -0.025 -0.026 -0.018(Program dummy=1) (0.006)** (0.006)** (0.005)** (0.005)** (0.005)**
Common time trend -0.438 -0.438 -0.438 -0.439 -0.439(Period dummy=1) (0.006)** (0.006)** (0.006)** (0.006)** (0.005)**
Program effect -0.030 -0.030 -0.030 -0.028 -0.028(Program dummy*Period dummy=1) (0.007)** (0.007)** (0.007)** (0.007)** (0.006)**
Dummy for primary school in 1986 -0.052 -0.006 -0.022 -0.041(0.008)** (0.008) (0.008)** (0.007)**
Dummy for middle school in 1986 -0.084 -0.065 -0.087 -0.068(0.004)** (0.003)** (0.004)** (0.004)**
Dummy for high school in 1986 -0.087 -0.083 -0.096 -0.067(0.010)** (0.010)** (0.010)** (0.008)**
Dummy for mosque in 1986 -0.092 -0.111 -0.035(0.004)** (0.005)** (0.005)**
Dummy for shia majority in 1986 -0.093 -0.098 -0.045(0.004)** (0.004)** (0.006)**
Log of population 0.032 0.029(0.003)** (0.003)**
Constant 1.012 1.069 1.171 1.008 0.925(0.005)** (0.009)** (0.010)** (0.018)** (0.019)**
Observations 19374 19374 19374 19374 19374R-squared 0.55 0.56 0.58 0.59 0.70Note: Robust standard errors in parentheses; * significant at 5%; ** significant at 1%;Col(1)-Col(4) regular OLS model; Col(5): district-level fixed effects.
30

Table 5: The difference-in-difference estimator for policy reversal in 1989(1) (2) (3) (4) (5)
Difference between two groups -0.040 -0.030 -0.022 -0.023 -0.015(Program dummy=1) (0.006)** (0.006)** (0.006)** (0.006)** (0.005)**
Common time trend -0.438 -0.438 -0.438 -0.439 -0.439(Period dummy=1) (0.006)** (0.006)** (0.006)** (0.006)** (0.005)**
Program effect -0.027 -0.027 -0.027 -0.026 -0.026(Program dummy*Period dummy=1) (0.007)** (0.007)** (0.007)** (0.007)** (0.006)**
Dummy for primary school in 1986 -0.054 -0.009 -0.025 -0.045(0.009)** (0.009) (0.009)** (0.008)**
Dummy for middle school in 1986 -0.082 -0.063 -0.083 -0.067(0.004)** (0.004)** (0.005)** (0.004)**
Dummy for high school in 1986 -0.095 -0.091 -0.105 -0.064(0.013)** (0.013)** (0.012)** (0.011)**
Dummy for mosque in 1986 -0.093 -0.110 -0.034(0.005)** (0.005)** (0.006)**
Dummy for shia majority in 1986 -0.092 -0.098 -0.040(0.004)** (0.004)** (0.007)**
Log of population 0.030 0.028(0.003)** (0.003)**
Constant 1.012 1.072 1.172 1.020 0.933(0.005)** (0.009)** (0.010)** (0.020)** (0.021)**
Observations 16722 16722 16722 16722 16722R-squared 0.54 0.56 0.58 0.58 0.70Note: Robust standard errors in parentheses; * significant at 5%; ** significant at 1%;Col(1)-Col(4) regular OLS model; Col(5): district-level fixed effects.
31
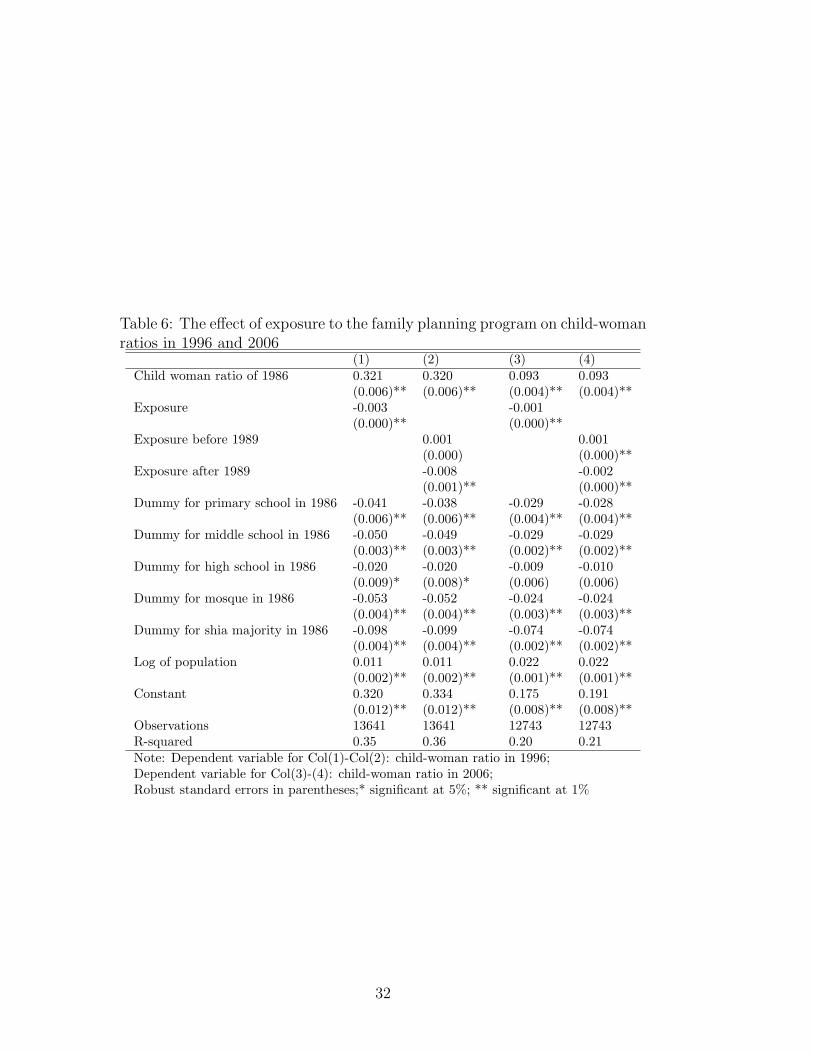
Table 6: The effect of exposure to the family planning program on child-womanratios in 1996 and 2006
(1) (2) (3) (4)Child woman ratio of 1986 0.321 0.320 0.093 0.093
(0.006)** (0.006)** (0.004)** (0.004)**Exposure -0.003 -0.001
(0.000)** (0.000)**Exposure before 1989 0.001 0.001
(0.000) (0.000)**Exposure after 1989 -0.008 -0.002
(0.001)** (0.000)**Dummy for primary school in 1986 -0.041 -0.038 -0.029 -0.028
(0.006)** (0.006)** (0.004)** (0.004)**Dummy for middle school in 1986 -0.050 -0.049 -0.029 -0.029
(0.003)** (0.003)** (0.002)** (0.002)**Dummy for high school in 1986 -0.020 -0.020 -0.009 -0.010
(0.009)* (0.008)* (0.006) (0.006)Dummy for mosque in 1986 -0.053 -0.052 -0.024 -0.024
(0.004)** (0.004)** (0.003)** (0.003)**Dummy for shia majority in 1986 -0.098 -0.099 -0.074 -0.074
(0.004)** (0.004)** (0.002)** (0.002)**Log of population 0.011 0.011 0.022 0.022
(0.002)** (0.002)** (0.001)** (0.001)**Constant 0.320 0.334 0.175 0.191
(0.012)** (0.012)** (0.008)** (0.008)**Observations 13641 13641 12743 12743R-squared 0.35 0.36 0.20 0.21Note: Dependent variable for Col(1)-Col(2): child-woman ratio in 1996;Dependent variable for Col(3)-(4): child-woman ratio in 2006;Robust standard errors in parentheses;* significant at 5%; ** significant at 1%
32