family of funds
TRANSCRIPT
GO PAPERLESS SIGN UP FOR E-DELIVERY
Family of Funds
ANNUAL REPORT OCTOBER 31, 2021
Alternative Calamos Market Neutral Income Fund
Calamos Hedged Equity Fund
Calamos Phineus Long/Short Fund
Convertible Calamos Convertible Fund
Calamos Global Convertible Fund
US EquityCalamos Timpani Small Cap Growth Fund
Calamos Timpani SMID Growth Fund
Calamos Growth Fund
Calamos Growth and Income Fund
Calamos Dividend Growth Fund
Calamos Select Fund
Global Equity Calamos International Growth Fund
Calamos Evolving World Growth Fund
Calamos Global Equity Fund
Calamos Global Opportunities Fund (formerly, Calamos Global Growth and Income Fund)
Fixed Income Calamos Total Return Bond Fund
Calamos High Income Opportunities Fund
Calamos Short-Term Bond Fund
TIMELY INFORMATION INSIDE
Visit www.calamos.com/paperless to enroll. You canview shareholder communications, including fundprospectuses, annual reports and other shareholdermaterials online long before the printed publicationsarrive by traditional mail.

Experience and ForesightAbout Calamos InvestmentsFor over 40 years, we have helped investors like you manage andbuild wealth to meet long-term objectives. Because investors havedifferent time horizons, risk tolerances and goals, we offer funds tosuit a variety of asset allocation needs. Our 18 mutual funds includeequity, fixed income, convertible and alternative funds. We offer USfunds as well as global and international choices.
We are dedicated to helping our clients build and protectwealth. We understand when you entrust us with your assets, youalso entrust us with your achievements, goals and aspirations. Webelieve we best honor this trust by making investment decisionsguided by integrity, discipline and our conscientious research.
We believe an active, risk-conscious approach is essential forwealth creation. In our early years, we pioneered the use ofconvertible securities as a means to control risk in volatile markets.We followed with strategies that combine convertibles and stocks,with the aim of participating in equity market upside with potentiallyless volatility than an all-stock portfolio. In 1990, we introduced ourfirst stock fund, which invests in growth companies both large andsmall. Across our funds, our investment process seeks to managerisk at multiple levels and draws upon our experience investingthrough many market cycles. In a rapidly changing environment, webelieve that this active management is essential.
We are global in our perspective. We believe globalization offerstremendous opportunities for countries and companies all over theworld. In our US, global and international portfolios, we are seekingto capitalize on the potential growth of the global economy.
We believe there are opportunities in all markets. Our historytraces back to the 1970s, a period of significant volatility andeconomic concerns. Since then, we have invested through the ebband flow of multiple markets, each with its own set of challenges.Out of this experience comes our belief that the flipside of volatilityis opportunity.
TABLE OF CONTENTSLetter to Shareholders 1
The Funds
Calamos Market Neutral Income Fund 5
Calamos Hedged Equity Fund 10
Calamos Phineus Long/Short Fund 13
Calamos Convertible Fund 20
Calamos Global Convertible Fund 24
Calamos Timpani Small CapGrowth Fund 27
Calamos Timpani SMID Growth Fund 31
Calamos Growth Fund 34
Calamos Growth and Income Fund 38
Calamos Dividend Growth Fund 42
Calamos Select Fund 45
Calamos International Growth Fund 49
Calamos Evolving World Growth Fund 53
Calamos Global Equity Fund 57
Calamos Global Opportunities Fund(formerly, Calamos Global Growth and Income Fund) 62
Calamos Total Return Bond Fund 67
Calamos High IncomeOpportunities Fund 72
Calamos Short-Term Bond Fund 77
Expense Overview 81
Schedules of Investments 85
Statements of Assets and Liabilities 176
Statements of Operations 181
Statements of Changes In Net Assets 185
Notes to Financial Statements 191
Financial Highlights 225
Report of Independent RegisteredPublic Accounting Firm 283
Trustee Approval of Management Agreement 285
Trustees and Officers 290
Tax Information 293

1www.calamos.com
Letter to Shareholders
JOHN P. CALAMOS, SR.Founder, Chairman, andGlobal Chief InvestmentOfficer
Dear Fellow Shareholder:
Welcome to your annual report for the 12 months ending October 31, 2021. In this
report you will find commentary from the Calamos portfolio management teams, as
well as a listing of portfolio holdings, financial statements and highlights, and detailed
information about the performance and positioning of the Calamos Funds.
Market Review
During the annual period, the global economy continued on its recovery trajectory,
supported by Covid-19 vaccination progress, reopening activity, strong corporate
earnings and consumer activity, and accommodative monetary policy. Equities and
convertible securities posted robust returns, with US markets leading. In fixed-income
markets, high-yield bonds also advanced at a brisk clip, outpacing investment-grade
issues.*
However, markets were choppy and rotational. Market turbulence increased during the
second half of the period as economic recovery showed signs of moderating to a more
sustainable pace. Although economic and company fundamentals remained strong,
investors grappled with a challenging newsfeed. Inflation pressures intensified, supply
chain disruptions persisted, and oil and other energy-related commodity prices soared.
Meanwhile, anxiety around the Covid-19 delta variant temporarily dampened optimism
about vaccination efforts. Fiscal policy uncertainty deepened in the United States as
politicians debated additional stimulus, taxes, regulations, the debt ceiling, and a
massive infrastructure plan.
Investor apprehension about interest rates and monetary policy also increased,
particularly after the Federal Reserve announced in September that it would soon taper
its asset purchase program and indicated it could begin raising short-term interest rates
by late 2022. In the wake of this development, the yield of the 10-year Treasury bond
spiked upward and closed the period nearly double where it started.
Outlook
As our teams will discuss in greater detail in the commentaries that follow, we see many
opportunities across asset classes. However, this is not a period when “a rising tide will

2 CALAMOS OPEN-END FAMILY OF FUNDS ANNUAL REPORT
Letter to Shareholders
lift all boats.” A unique set of crosscurrents is shaping the markets as new growth themes emerge. There
will be winners and losers as the world continues through a period of accelerated disruption and complex
transitions.
Individual security selection will be especially important during this phase of the economic cycle.
We expect saw-toothed and rotational markets to persist given the uncertainties surrounding
inflation, interest rates and the pace of economic expansion. We are closely monitoring fiscal policy
and remain attuned to the far-reaching impacts that spending, regulations and taxes may have on
households, small businesses, large corporations and the economy as a whole.
In this environment, we believe market conditions will favor active managers who can respond to evolving
conditions quickly and with a long-term perspective. Our teams use short-term sell-offs as opportunities to
purchase attractive securities, with the goal of continually improving the risk and return characteristics of
the Funds.
We encourage investors to maintain a similar long-term perspective and to avoid getting caught up in a
single headline or data point. It’s important to remember that every cycle is different. Rising inflation and
slowing growth have historically set the stage for “stagflation,” but this cycle is like no other. The global
economy is in the midst of an extraordinary recovery period, and a moderation of economic growth from
peak levels should come as no surprise. Additionally, although inflation may not be as “transitory” as we
once thought it would be, we do not believe inflation data is signaling an imminent end to the recovery.
There are many positive factors that can sustain economic expansion. Vaccination efforts continue around
the world, and promising results for emerging treatments are welcome news. Although we can never rule
out a policy mistake, we expect the Federal Reserve to pursue a gradual course with the goal of supporting
economic growth. The most recent round of corporate earnings announcements has included many upside
surprises, corporate revenues are strong, and profit margins are improving. Inflation does not appear to have
eroded pricing power for many businesses, which bodes well for earnings growth. Meanwhile, US
unemployment numbers continue to drop, wages are rising, and many households have healthy savings and
low debt. We are seeing encouraging data from other economies outside the United States, which can help
set the stage for a more synchronized global recovery.
Asset Allocation Considerations
Although it is important to maintain long-term focus and avoid making short-term moves to try to time the
markets, periodic asset allocation assessments help ensure your mutual fund portfolio is aligned with evolving

3www.calamos.com
Letter to Shareholders
opportunities and your personal circumstances. Given the many crosscurrents in the markets, you may find
that you need to rebalance your asset allocation to best address your financial goals.
For example, during periods of economic growth and rising inflation, stocks have tended to enjoy tailwinds.
Although stocks have enjoyed good gains, we see additional upside for a wide range of companies, including
a diverse selection of growth-oriented investments. Valuations are attractive in many pockets of the market,
particularly in smaller companies. To learn more about these opportunities, I invite you to review the
commentaries for Calamos Timpani Small Cap Growth Fund, a small-cap growth offering, and Calamos
Growth Fund, which invests in a wide range of growth opportunities.
There’s never a “perfect” time to invest—volatility is always a part of the investing landscape. However, with
a risk-managed portfolio foundation in place, it may be easier to ride out the ups and downs in the market.
For this reason, Calamos offers a range of funds that seek lower-volatility participation in the stock market.
These include Calamos Growth and Income Fund, Calamos Convertible Fund and Calamos Global
Opportunities Fund, all of which provide access to our decades of experience using convertible securities
to pursue enhanced risk/reward. Convertible securities are hybrid instruments that blend stock and
fixed-income characteristics. With active management, they can provide an attractive way to pursue stock
market upside with potentially less exposure to the downside. Additionally, convertible securities have
historically outperformed traditional bonds when interest rates rise, which makes them an especially attractive
choice in the current environment.
In saw-toothed and rotational markets, investors may wish to enhance their overall equity asset allocation
with liquid alternative funds, which can employ a breadth of strategies to capitalize on evolving market
conditions. For example, Calamos Phineus Long/Short Fund follows a flexible approach to seek strong
risk-adjusted and absolute returns across the global equity universe. Meanwhile, Calamos Hedged Equity
Fund employs sophisticated strategies to seek upside equity participation while limiting exposure to downside
equity risk. You can learn more about each fund in this report.
As we’ve discussed in previous letters, fixed-income funds form an important strategic cornerstone for many
investors. However, because rising interest rates tend to create headwinds for traditional fixed-income
securities, many investors may find it prudent to make enhancements to their fixed-income allocations.
Nontraditional strategies such as Calamos Market Neutral Income Fund (a fixed-income liquid alternative
fund) or Calamos High Income Opportunities Fund (a high-yield bond fund) may provide compelling
additions with potentially less interest rate risk than traditional bond investments.

4 CALAMOS OPEN-END FAMILY OF FUNDS ANNUAL REPORT
Letter to Shareholders
Conclusion
On behalf of all of us at Calamos Investments, thank you for your trust. We are honored to serve you and
help you achieve your asset allocation goals. I invite you to visit our website, www.calamos.com, for ongoing
updates about the markets and thought leadership from our teams. We also provide information about asset
allocation strategies for investors seeking income, capital appreciation, or both.
Sincerely,
John P. Calamos, Sr.Founder, Chairman, and Global Chief Investment Officer
Before investing, carefully consider a fund’s investment objectives, risks, charges and expenses. Please see the prospectus containing thisand other information or call 800.582.6959. Please read the prospectus carefully. Performance data represents past performance, whichis no guarantee of future results. Current performance may be lower or higher than the performance quoted.
Diversification and asset allocation do not guarantee a profit or protection against a loss. Investments in alternative strategies may notbe suitable for all investors.
* Returns for the 12 months ended October 31, 2021: The S&P 500 Index, a measure of the US stock market, returned 42.91%. TheMSCI All Country World Index, a measure of global stock market performance, returned 37.86%. The MSCI Emerging Market Index,a measure of emerging market equity performance, returned 17.33%. The ICE BofA All US Convertibles Index, a measure of the USconvertible securities market, returned 32.95%. The Refinitiv Global Convertible Bond Index, a measure of the global convertible bondmarket, returned 22.18%. The Bloomberg US High Yield 2% Issuer Capped Index, a measure of the performance of high-yield corporatebonds with a maximum allocation of 2% to any one issuer, returned 10.53%. The Bloomberg US Aggregate Bond Index, a measureof the US investment-grade bond market, returned -0.48%.
Source: Calamos Advisors LLC.
Unmanaged index returns assume reinvestment of any and all distributions and, unlike fund returns, do not reflect fees, expenses orsales charges. Investors cannot invest directly in an index. Returns are in US dollar terms.
Investments in overseas markets pose special risks, including currency fluctuation and political risks. These risks are generally intensifiedfor investments in emerging markets. Countries, regions, and sectors mentioned are presented to illustrate countries, regions, and sectorsin which a fund may invest. There are certain risks involved with investing in convertible securities in addition to market risk, such as callrisk, dividend risk, liquidity risk and default risk, which should be carefully considered prior to investing.
Investments in alternative strategies may not be suitable for all investors.
Fund holdings are subject to change daily. The Funds are actively managed. The information contained herein is based on internal researchderived from various sources and does not purport to be statements of all material facts relating to the securities mentioned. Theinformation contained herein, while not guaranteed as to accuracy or completeness, has been obtained from sources we believe to bereliable.
Opinions are as of the publication date, subject to change and may not come to pass.
This information is being provided for informational purposes only and should not be considered investment advice or an offer to buy orsell any security in the portfolio.
5www.calamos.com
Calamos Market Neutral Income Fund
OVERVIEWThe Fund combines two complementarystrategies with different responses tovolatility: convertible arbitrage seeksalpha and uncorrelated returns, whilehedged equity provides income fromoptions writing and upside participation.
KEY FEATURESn Generates returns not dependent on
interest rates, a key differentiator fromtraditional bond strategies.
n Employs an absolute-return strategywith historically lower beta tofixed-income and equity markets aswell as lower volatility and limiteddrawdowns.
n As one of the first alternative mutualfunds, capitalizes on more than fourdecades of experience in theconvertible space.
PORTFOLIO FITThe Fund may provide potentialdiversification, particularly in a lowinterest-rate environment.
FUND NASDAQ SYMBOLS
A Shares CVSIX
C Shares CVSCX
I Shares CMNIX
R6 Shares CVSOX
FUND CUSIP NUMBERS
A Shares 128119203
C Shares 128119849
I Shares 128119880
R6 Shares 128120342
CALAMOS MARKET NEUTRAL INCOME FUNDINVESTMENT TEAM DISCUSSION
Please discuss the Fund’s strategy and role within an asset allocation.Launched more than 30 years ago, Calamos Market Neutral Income Fund representsone of the first liquid alternative mutual funds and blends two mainstrategies—convertible arbitrage and hedged equity—with the aim of monetizingvolatility. In addition to offering an attractive historical risk/reward profile, the Fundmay enhance long-term portfolio diversification potential, especially in relation tofixed-income securities.
Recently, bouts of historically elevated equity volatility underscore the value ofdiversification.
Calamos Market Neutral Income Fund is designed to do the following:
n Potentially enhance an investor’s fixed-income allocation.
n Actively pursue equity market upside while hedging downside risk.
The end goal is consistent absolute total return over varying market cycles.
How has the Fund performed?For the 12 months ended October 31, 2021 (“annual period”), Calamos MarketNeutral Income Fund returned 6.92% (Class I Shares at net asset value), stronglyoutperforming a -0.48% loss for the Bloomberg US Government/Credit Index and0.05% increase for the Bloomberg Short Treasury 1-3 Month Index.
What factors influenced performance during the annual period?The equity market posted strong results in response to Covid vaccination rollouts,positive economic data, fiscal stimulus and accommodative monetary policies. Despitethe very strong equity market returns, the annual period saw pockets of elevatedvolatility during several events including the US presidential election, the GeorgiaSenate run-off elections, the storming of the US Capitol, the Covid vaccine rollout,commodity shortages, and supply-chain disruptions. These volatility pockets wereconducive to the Fund’s result despite declining volatility observed in the Cboe VolatilityIndex (VIX) (from 38.02 at the beginning of the period to 16.26 at the end).
The hedged equity strategy within the Fund benefited from strong S&P 500 Indexperformance given that the strategy’s equity basket was able to participate in a portionof the market’s upside, though constrained by the strike price of the portfolio’s use ofwritten calls. The pockets of volatility seen in the market also provided attractive optionrebalancing opportunities, and the strategy benefited from a higher level of impliedvolatility in the options market. Moreover, the use of S&P 500 Index options in thestrategy provided premium capture in addition to the dividends received from theequity basket.
The convertible arbitrage portion benefited from the pockets of volatility, whichprovided opportunities to profit from convertible hedge rebalancing. Additionally, animpressive $83.9 billion of new US convertibles were issued according to Bank ofAmerica. These new convertibles were attractive for convertible arbitrage as they werebrought to the balanced portion of the market which, when combined with elevated

6 CALAMOS OPEN-END FAMILY OF FUNDS ANNUAL REPORT
Calamos Market Neutral Income Fund
SECTOR WEIGHTINGS
Information Technology 30.3%
Consumer Discretionary 13.6
Communication Services 11.3
Health Care 10.7
Financials 7.2
Special Purpose Acquisition Companies 5.6
Industrials 5.5
Other 4.0
Consumer Staples 3.3
Utilities 2.4
Energy 2.2
Real Estate 1.9
Materials 1.5
Sector weightings are subject to change daily andare calculated as a percentage of net assets. Thetable excludes cash or cash equivalents, anygovernment/sovereign bonds or broad basedindex hedging securities the Fund may hold.
A note concerning MorningstarRatings for Calamos MarketNeutral Income Fund Morningstarrecently sought to refine its categorizationof alternative funds, splitting largeheterogeneous categories into smaller,more-focused peer sets. Calamosapplauds Morningstar’s continuouscommitment to improving investorunderstanding of mutual fund offerings.As of April 30, 2021, Morningstarassigned the Fund to a new category,Relative Value Arbitrage, a group of onlyeight funds. With such a small set of datapoints, Morningstar has determined thatfunds in this category will not be assigneda star rating. The Fund’s move to theRelative Value Arbitrage category has nobearing on the management of the funditself, nor was it made in response to achange in the management of the Fund.
volatility, increased opportunities for trade rebalancing (gamma capture). Much of thenew issuance was also offered at a discount to the convertibles’ theoretical valuations,providing an opportunity for pricing arbitrage.
A convertible bond may be thought of as the combination of a bond plus a call option.Although the rising-interest-rate environment was an impediment to the convertible’sbond component, narrowing credit spreads more than offset the impact from risingrates. The 3-year US Treasury yield increased from 0.19% to 0.75%, the 5-year yieldrose from 0.38% to 1.18%, and the 10-year yield jumped from 0.88% to 1.55%.According to Bloomberg, high-yield credit spreads narrowed by 209 basis points to332 basis points over US Treasuries. Near-zero overnight interest rates were aheadwind to the carry on the cash received from short positions (our custodian rebatesus the fed funds rate less our roughly 35 basis points of borrowing costs).
The Fund also held small allocations in special purpose acquisition company (SPAC)arbitrage and merger arbitrage, which contributed positively to the annual periodresult.
In summary, the Fund benefited from the strong equity market performance, as theequity basket used in the hedged equity portion of the portfolio rose. Volatilityprovided attractive rebalancing opportunities for both the hedged equity andconvertible arbitrage strategies. Robust convertible issuance and narrowing creditspreads provided attractive opportunities in convertible arbitrage. The above factorscombined to create a favorable environment that allowed the Calamos Market NeutralIncome Fund to post a consistent, positive return while similar risk investments (likebonds) were challenged during a period of rising and volatile interest rates.
How is the Fund positioned?At the end of the annual period, the Fund had 43.0% in convertible arbitrage and50.2% in hedged equity strategies. The allocation to convertible arbitrage wastrimmed from 57.7% at the beginning of the annual period as we pared convertibleswhose valuations had richened. We rebalanced these proceeds into the hedged equitystrategy as volatility declined. Finally, the Fund had opportunistic positions in SPACarbitrage (5.6%) and merger arbitrage (1.2%).
At the beginning of the annual period, the allocation to convertible arbitrage was nearits 60% peak, which reflected soaring convertible issuance. Although issuance slowedlate in the period, we continued to find many opportunities. We remain active in thenew-issue and secondary markets, and we have replaced existing in-the-moneyconvertibles with new convertible issues when possible. The weighted-average deltaof the convertible arbitrage strategy is near the median of its historic range, althoughit is a bit lower than earlier in the period. We have been reducing our exposure todeep-in-the-money paper and have taken advantage of issuers’ willingness to pay fullprices to encourage the conversion of their bonds.
Calamos Market Neutral Income Fund’s hedged equity strategy is currently positionedwith a higher-than-typical hedge ratio. The higher the hedge ratio, the less exposurethe Fund has to equity-market downside. Steadily declining realized and impliedvolatility and a strong bid in the markets for out-of-the-money puts have sustainedcheapness in put spreads. Consequently, we have been adding more put spreads tothe Fund’s hedged equity book in addition to the outright long-put allocation wealways maintain in the Fund.

7www.calamos.com
Calamos Market Neutral Income Fund
Along with our primary strategies, the Fund also has the flexibility to investopportunistically in SPACs, which are shell companies that raise money to acquirecompanies seeking to go public. The closing of the acquisition is called a de-SPACprocess, at which point the SPAC is usually a small-cap equity. SPACs resembleconvertible securities in many ways. The typical structure of a SPAC is a $10.00 unitissue that includes a five-year warrant struck at $11.50. We have seen the SPACmarket grow briskly, which offers us another way to add value for Fund shareholders.There are many ways to invest in SPACs, and our use of SPACs is designed to supportthe Fund’s historically lower-risk profile and steady returns. Drawing on our long-standing experience in convertible arbitrage, we are employing a SPAC arbitragestrategy at the margin of the portfolio, seeking positive returns with low risk. We arenot investing in the volatile SPACs that often make headlines. In the same vein as howwe seek to isolate cheap options in the Fund’s convertible arbitrage strategy, we areusing the SPAC structure to isolate cheap options with a risk profile that is similarto—and potentially even less risk than—our convertible arbitrage strategy. We’regenerally buying SPACs at $10.00 or less and trading out of them at $10.50 to $11.00,without adding a lot of equity sensitivity to the book.
What are your closing thoughts for Fund shareholders?We believe that the Calamos Market Neutral Income Fund is well positioned for thecurrent market environment. Fiscal and monetary policy uncertainties, including thepotential for tax increases, more regulation, congressional spending, and the timingand magnitude of Federal Reserve tapering are likely to add market volatility. Moreover,the pandemic, potential for inflation, and political divides are likely to fuel volatilityand market rotation.
As rising interest rates put pressure on traditional bond strategies, we believe CalamosMarket Neutral Income Fund can provide especially compelling benefits as a fixed-income alternative. The Fund employs two complementary strategies—convertiblearbitrage and hedged equity—to pursue absolute returns and income that is notdependent on interest rates.

8 CALAMOS OPEN-END FAMILY OF FUNDS ANNUAL REPORT
Calamos Market Neutral Income Fund
ANNUALIZED RETURN: SINCE INCEPTION (5/10/00) THROUGH 10/31/21
Performance data quoted represents past performance, which is no guarantee of future results. Current performance may be lower or higher than theperformance quoted.
The principal value and investment return of an investment will fluctuate so that your shares, when redeemed, may be worth more or less than theiroriginal cost. You can obtain performance data current to the most recent month end by visiting www.calamos.com. Average annual total return measuresnet investment income and capital gain or loss from portfolio investments as an annualized average. All performance shown assumes reinvestment ofdividends and capital gains distributions. Performance is for the Fund’s Class I shares at net asset value. The Fund also offers Class A, Class C andClass R6 shares, the performance of which may vary. Source: State Street Corporation and Morningstar Direct.* Annual returns for Class I shares are provided because Class I shares represent the largest percentage of assets in the Calamos Family of Funds.
Bloomberg Short Treasury1-3 Month Index
Bloomberg US Government/Credit IndexCalamos Market Neutral Income Fund(I Shares at NAV)*
4.40
0.59
3.87
0.91
4.61
1.51
6.92
-0.48
6.27
3.45 3.234.28
5.07
0.05
5.01
1.06
4.82
1.10
10%
8%
6%
4%
2%
-2%
0%
1-YEAR 3-YEAR 5-YEAR 10-YEAR 15-YEAR SINCE INCEPTION(5/10/00) THROUGH
10/31/21
9www.calamos.com
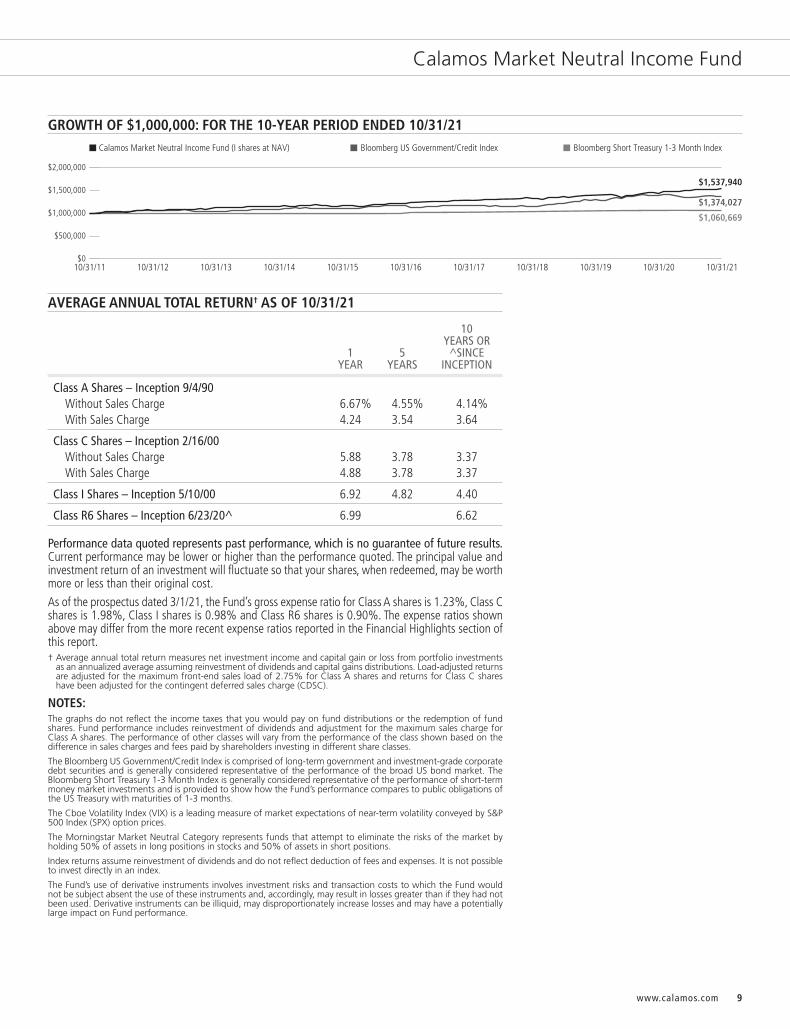
AVERAGE ANNUAL TOTAL RETURN† AS OF 10/31/21
10 YEARS OR
1 5 ^SINCE YEAR YEARS INCEPTION
Class A Shares – Inception 9/4/90Without Sales Charge 6.67% 4.55% 4.14%With Sales Charge 4.24 3.54 3.64
Class C Shares – Inception 2/16/00Without Sales Charge 5.88 3.78 3.37With Sales Charge 4.88 3.78 3.37
Class I Shares – Inception 5/10/00 6.92 4.82 4.40
Class R6 Shares – Inception 6/23/20^ 6.99 6.62
Performance data quoted represents past performance, which is no guarantee of future results.Current performance may be lower or higher than the performance quoted. The principal value andinvestment return of an investment will fluctuate so that your shares, when redeemed, may be worthmore or less than their original cost.
As of the prospectus dated 3/1/21, the Fund’s gross expense ratio for Class A shares is 1.23%, Class Cshares is 1.98%, Class I shares is 0.98% and Class R6 shares is 0.90%. The expense ratios shownabove may differ from the more recent expense ratios reported in the Financial Highlights section ofthis report.† Average annual total return measures net investment income and capital gain or loss from portfolio investments
as an annualized average assuming reinvestment of dividends and capital gains distributions. Load-adjusted returnsare adjusted for the maximum front-end sales load of 2.75% for Class A shares and returns for Class C shareshave been adjusted for the contingent deferred sales charge (CDSC).
NOTES:The graphs do not reflect the income taxes that you would pay on fund distributions or the redemption of fundshares. Fund performance includes reinvestment of dividends and adjustment for the maximum sales charge forClass A shares. The performance of other classes will vary from the performance of the class shown based on thedifference in sales charges and fees paid by shareholders investing in different share classes.
The Bloomberg US Government/Credit Index is comprised of long-term government and investment-grade corporatedebt securities and is generally considered representative of the performance of the broad US bond market. TheBloomberg Short Treasury 1-3 Month Index is generally considered representative of the performance of short-termmoney market investments and is provided to show how the Fund’s performance compares to public obligations ofthe US Treasury with maturities of 1-3 months.
The Cboe Volatility Index (VIX) is a leading measure of market expectations of near-term volatility conveyed by S&P500 Index (SPX) option prices.
The Morningstar Market Neutral Category represents funds that attempt to eliminate the risks of the market byholding 50% of assets in long positions in stocks and 50% of assets in short positions.
Index returns assume reinvestment of dividends and do not reflect deduction of fees and expenses. It is not possibleto invest directly in an index.
The Fund’s use of derivative instruments involves investment risks and transaction costs to which the Fund wouldnot be subject absent the use of these instruments and, accordingly, may result in losses greater than if they had notbeen used. Derivative instruments can be illiquid, may disproportionately increase losses and may have a potentiallylarge impact on Fund performance.
GROWTH OF $1,000,000: FOR THE 10-YEAR PERIOD ENDED 10/31/21
$1,374,027
$1,537,940
$1,060,669
Calamos Market Neutral Income Fund (I shares at NAV) Bloomberg Short Treasury 1-3 Month IndexBloomberg US Government/Credit Index
10/31/11 10/31/12 10/31/13 10/31/14 10/31/15 10/31/16 10/31/17 10/31/18 10/31/20 10/31/2110/31/19$0
$500,000
$1,500,000
$2,000,000
$1,000,000
Calamos Market Neutral Income Fund
10 CALAMOS OPEN-END FAMILY OF FUNDS ANNUAL REPORT
Calamos Hedged Equity Fund
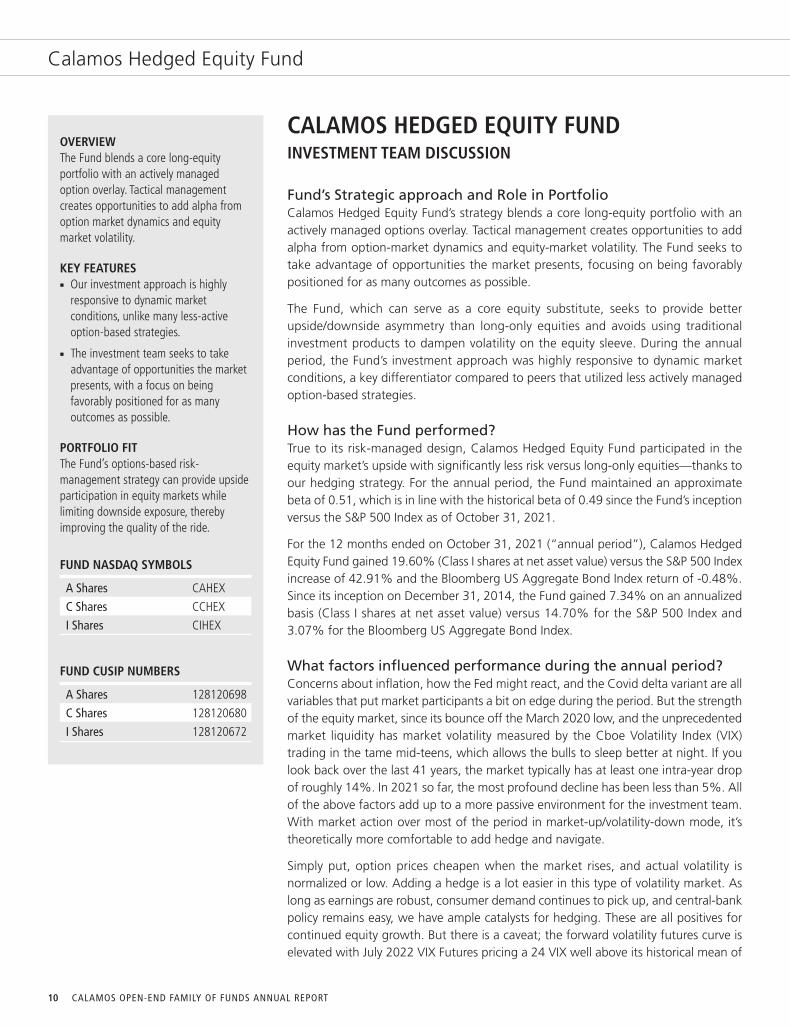
OVERVIEWThe Fund blends a core long-equityportfolio with an actively managedoption overlay. Tactical managementcreates opportunities to add alpha fromoption market dynamics and equitymarket volatility.
KEY FEATURESn Our investment approach is highly
responsive to dynamic marketconditions, unlike many less-activeoption-based strategies.
n The investment team seeks to takeadvantage of opportunities the marketpresents, with a focus on beingfavorably positioned for as manyoutcomes as possible.
PORTFOLIO FITThe Fund’s options-based risk-management strategy can provide upsideparticipation in equity markets whilelimiting downside exposure, therebyimproving the quality of the ride.
FUND NASDAQ SYMBOLS
A Shares CAHEX
C Shares CCHEX
I Shares CIHEX
FUND CUSIP NUMBERS
A Shares 128120698
C Shares 128120680
I Shares 128120672
CALAMOS HEDGED EQUITY FUNDINVESTMENT TEAM DISCUSSION
Fund’s Strategic approach and Role in PortfolioCalamos Hedged Equity Fund’s strategy blends a core long-equity portfolio with anactively managed options overlay. Tactical management creates opportunities to addalpha from option-market dynamics and equity-market volatility. The Fund seeks totake advantage of opportunities the market presents, focusing on being favorablypositioned for as many outcomes as possible.
The Fund, which can serve as a core equity substitute, seeks to provide betterupside/downside asymmetry than long-only equities and avoids using traditionalinvestment products to dampen volatility on the equity sleeve. During the annualperiod, the Fund’s investment approach was highly responsive to dynamic marketconditions, a key differentiator compared to peers that utilized less actively managedoption-based strategies.
How has the Fund performed?True to its risk-managed design, Calamos Hedged Equity Fund participated in theequity market’s upside with significantly less risk versus long-only equities—thanks toour hedging strategy. For the annual period, the Fund maintained an approximatebeta of 0.51, which is in line with the historical beta of 0.49 since the Fund’s inceptionversus the S&P 500 Index as of October 31, 2021.
For the 12 months ended on October 31, 2021 (“annual period”), Calamos HedgedEquity Fund gained 19.60% (Class I shares at net asset value) versus the S&P 500 Indexincrease of 42.91% and the Bloomberg US Aggregate Bond Index return of -0.48%.Since its inception on December 31, 2014, the Fund gained 7.34% on an annualizedbasis (Class I shares at net asset value) versus 14.70% for the S&P 500 Index and3.07% for the Bloomberg US Aggregate Bond Index.
What factors influenced performance during the annual period?Concerns about inflation, how the Fed might react, and the Covid delta variant are allvariables that put market participants a bit on edge during the period. But the strengthof the equity market, since its bounce off the March 2020 low, and the unprecedentedmarket liquidity has market volatility measured by the Cboe Volatility Index (VIX)trading in the tame mid-teens, which allows the bulls to sleep better at night. If youlook back over the last 41 years, the market typically has at least one intra-year dropof roughly 14%. In 2021 so far, the most profound decline has been less than 5%. Allof the above factors add up to a more passive environment for the investment team.With market action over most of the period in market-up/volatility-down mode, it’stheoretically more comfortable to add hedge and navigate.
Simply put, option prices cheapen when the market rises, and actual volatility isnormalized or low. Adding a hedge is a lot easier in this type of volatility market. Aslong as earnings are robust, consumer demand continues to pick up, and central-bankpolicy remains easy, we have ample catalysts for hedging. These are all positives forcontinued equity growth. But there is a caveat; the forward volatility futures curve iselevated with July 2022 VIX Futures pricing a 24 VIX well above its historical mean of

11www.calamos.com
* Skew describes asymmetry from the normal distribution in a set of statistical data. Option skew is thedifference in implied volatility between out-of-the-money options, at-the-money options, and in-the-moneyoptions. Volatility skew, which is affected by sentiment and the supply-and-demand relationship, providesinformation that helps fund managers determine whether to write calls or puts. The Cboe SKEW Index(“SKEW”) is an index derived from the price of S&P 500 tail risk. Similar to the VIX, the price of S&P 500tail risk is calculated from the prices of S&P 500 out-of-the-money options.
SECTOR WEIGHTINGS
Information Technology 28.2%
Consumer Discretionary 13.1
Health Care 13.0
Financials 11.4
Communication Services 10.8
Industrials 8.0
Consumer Staples 5.6
Other 2.9
Energy 2.9
Materials 2.4
Real Estate 2.4
Utilities 2.3
Sector weightings are subject to change daily andare calculated as a percentage of net assets. Thetable excludes cash or cash equivalents, anygovernment/sovereign bonds or broad basedindex hedging securities the Fund may hold.
18.50, which tells us that options markets are currently pricing in or implyingpotentially violent moves well into 2022.
Along with concerns about inflation, how the Fed may react, and additional Covidnegative surprises, the team is looking to layer in downside protection opportunisticallyand cost effectively. If actual volatility does catch up with implied volatility, we stillwant to be in the market, and a disciplined hedge on top of equity exposure can helpus get the sleep we need. The higher volatility and skew* makes put and call spreadsmore appealing as we look to capture 45% to 55% upside and limit downside to30% to 40%, ultimately driving better risk-adjusted returns to the Fund.
How is the Fund positioned?The current landscape in the options market allows us to structure our hedge,emphasizing better performance on the tails. This positioning provides additional riskmitigation over and above our average 40% to 50% put notional minimum while alsoadding upside participation potential. The trade-off is a reduction in net income wereceive from selling calls above our put cost. Given the Fund’s defensive mandate inaddition to the low volatility and high skew in the options market, we feel this trade-off is warranted and opportunistic. With the potential resurgence of market volatility,options pricing now allows us to sell call options at approximately 3% to 5% out ofthe money (OTM), representing more attractive price levels than the protective putsbeing purchased at about 5% OTM. This aligns with our traditional “North Star” trademechanics of selling OTM calls versus buying OTM puts. We continue to use rallies toreplace some of our put hedge with long put spreads, which appeared attractiveduring this move.
At the end of the annual period, the Fund’s net put protection was 40%, with an averagestrike of 3817 on the S&P 500 Index (15% OTM). Our call positioning included a callwrite of 40%, gross short calls of -74% and gross long calls of 34%. Gross long callswere lower than in the past. At the end of the annual period and relative to the S&P 500Index, our sector positioning was slightly overweight to the consumer discretionary andinformation technology sectors. The portfolio had slight underweight positioning to thematerials, financials, consumer staples, real estate, and materials sectors. In terms of theFund’s market-capitalization positioning relative to the S&P 500 Index, the Fundmaintained a heavier relative weight to larger-capitalization (>$25 billion) holdings andlighter weight to small and mid-capitalization ($1 to $25 billion) holdings.
What closing thoughts do you have for Fund shareholders?As the equity markets challenge all-time highs, we have to be conscious of the factthat markets don’t go straight up without a healthy decline now and then. Sometimesthese downturns can enter correction territory (declines >10%), as we saw in Q1 of2020, and sometimes they are less scary pullbacks (declines <10%). From the end ofthe Covid correction on March 23, 2020, to the date of this writing on October 31,2021, the S&P 500 Index gained about 110%. During that time, the most significantdecline has been less than 5%, within the expected intraday range of roughly 1.5%.
Calamos Hedged Equity Fund

12 CALAMOS OPEN-END FAMILY OF FUNDS ANNUAL REPORT
Calamos Hedged Equity Fund
AVERAGE ANNUAL TOTAL RETURN† AS OF 10/31/21
1 5 SINCE YEAR YEARS INCEPTION
Class A Shares – Inception 12/31/2014Without Sales Charge 19.20% 9.00% 7.04%With Sales Charge 13.51 7.95 6.28
Class C Shares – Inception 12/31/2014Without Sales Charge 18.43 8.26 6.29With Sales Charge 17.43 8.26 6.29
Class I Shares – Inception 12/31/2014 19.60 9.32 7.34
Performance data quoted represents past performance, which is no guarantee of future results.Current performance may be lower or higher than the performance quoted. The principal value andinvestment return of an investment will fluctuate so that your shares, when redeemed, may be worthmore or less than their original cost.As of the prospectus dated 3/1/21, the Fund’s gross expense ratio for Class A shares is 1.22%, Class Cshares is 1.97% and Class I shares is 0.97%.† Average annual total return measures net investment income and capital gain or loss from portfolio investments
as an annualized average assuming reinvestment of dividends and capital gains distributions. Performance shownincludes the effects of an expense reimbursement that improved results. Load-adjusted returns are adjusted forthe maximum frontend sales load of 4.75% for Class A shares and returns for Class C shares have been adjustedfor the contingent deferred sales charge (CDSC).
NOTES:The S&P 500 Index is an unmanaged index generally considered representative of the US stock market.The Bloomberg US Aggregate Bond Index is considered generally representative of the investment-grade bondmarket.The Cboe Volatility Index (VIX) is a leading measure of market expectations of near-term volatility conveyed by S&P500 Index (SPX) option prices.The Cboe SKEW Index essentially tracks the willingness of investors to pay up for downside protection on the S&P500 Index.Index returns assume reinvestment of dividends and do not reflect deduction of fees and expenses. It is not possibleto invest directly in an index.The Fund’s use of derivative instruments involves investment risks and transaction costs to which the Fund wouldnot be subject absent the use of these instruments and, accordingly, may result in losses greater than if they had notbeen used. Derivative instruments can be illiquid, may disproportionately increase losses and may have a potentiallylarge impact on Fund performance.
GROWTH OF $1,000,000: SINCE INCEPTION (12/31/14) THROUGH 10/31/21
$1,622,778
$2,553,435
$1,229,440
Calamos Hedged Equity Fund (I shares at NAV) Bloomberg US Aggregate Bond IndexS&P 500 Index
$0
$500,000
$1,500,000
$3,000,000
$2,500,000
$2,000,000
$1,000,000
12/31/14 10/31/2110/31/2010/31/15 10/31/16 10/31/17 10/31/18 10/31/19
With the latest earnings season winding down and vaccine efficacy rates at about90%, we expect normalized volatility but acknowledge that equity markets could pickup volatility 20% to 30% higher well into 2022. This forecast makes us enthusiasticabout our current positioning in the Hedged Equity Fund. Should equity marketsadvance, the Fund is poised to participate in its upside while also providing anenhanced income stream from well-positioned call spreads and our tracking portfolio’sequity dividends. Conversely, should the markets retreat, the dividend income streamand the put protection used in the Fund will provide potential downside risk mitigation.

13www.calamos.com
OVERVIEWThe Fund seeks strong risk-adjusted andabsolute returns across the global equityuniverse. The Fund uses a global long/short strategy to invest in publicly listedequity securities.
KEY FEATURESn Fundamental global approach blends
top-down and bottom-upconsiderations.
n Flexible asset allocation allows for allinvestment styles, market caps andgeographic regions depending on themarket environment.
n Comprehensive approach assessesstock, industry, style, country andmarket factors.
n Knowledge-based industryconcentration includes technology,communications, media, financials andhealth care.
PORTFOLIO FITThe Fund seeks to provide strong risk-adjusted returns via an alternativesolution that complements and diversifiesa global or US equity allocation.
FUND NASDAQ SYMBOLS
A Shares CPLSX
C Shares CPCLX
I Shares CPLIX
FUND CUSIP NUMBERS
A Shares 128120656
C Shares 128120649
I Shares 128120631
CALAMOS PHINEUS LONG/SHORT FUNDINVESTMENT TEAM DISCUSSION
What is the essence of the investment approach?Through a global long/short structure, the Fund invests in publicly listed equitysecurities. Components of the strategy include the following:
n A fundamental global approach that blends top-down and bottom-upconsiderations. Company analysis is integrated with industry, thematic and macroresearch.
n An inclusive framework for identifying potential returns and associated risks. Theframework accounts for company, industry, style, country and market factors.
n Flexible capital allocation allowing for all investment styles, market caps andgeographic regions. The investment universe is global, liquid and scalable. Exposurelevels and investment styles depend upon market conditions and the economic cycle.
How has the Fund performed?For the 12 months ended October 31, 2021 (“annual period”), Calamos PhineusLong/Short Fund returned 38.69% (Class I shares at net asset value). The S&P 500Index returned 42.91%, and the MSCI World Index gained 41.05% over the sameperiod.
Since its inception on May 1, 2002, the Fund has returned 10.77% on an annualizedbasis (Class I shares at net asset value) and, thus, markedly outperformed both theS&P 500 and MSCI World Indexes, which returned 9.91% and 8.92%, respectively,over the same period. As of October 31, 2021, the long/short portion of the portfoliohad a delta-adjusted* net-long position of approximately 55%.
What factors influenced performance over the annual periodunder review?The most significant influence on Fund performance over the past 12 months occurredin November 2020, when breakthroughs in vaccine development encouraged hopesthat the pandemic could be brought to a resolution in 2021. Style performance in thefollowing months witnessed a historic rotation into value, cyclical and small-cap stocks.This rotation continued into May commensurate with a pickup in bond yields andupward earnings revisions for the cyclical cohort. The Fund enjoyed sharpoutperformance during this period, reflecting our positioning in cyclical businesseswith strong operating leverage; in many cases, these stocks had been compressed bythe pandemic impact and, thus, benefited as vaccines drove a rapid reopening.
From May to August, investor nervousness brought on by the delta variant translatedinto a defensive mood that has benefited the health care and technology sectors,largely at the expense of the more cyclical and higher-beta plays. This comeback byone of the most characteristic trends of the post-2008 era was signaled by the declineof US Treasury yields. However, we believe this leadership should not be extrapolated,
Calamos Phineus Long/Short Fund
* Delta-adjusted basis measures the price sensitivity of an option or portfolio to changes in the price of anunderlying security. Delta-adjusted basis exposure is calculated by Calamos Advisors LLC and is specificonly to a point in time since a security’s delta changes continuously with market activity.

14 CALAMOS OPEN-END FAMILY OF FUNDS ANNUAL REPORT
Calamos Phineus Long/Short Fund
SECTOR WEIGHTINGS
Industrials 38.2%
Financials 19.5
Information Technology 12.2
Communication Services 8.8
Consumer Discretionary 7.7
Energy 4.7
Consumer Staples 3.2
Health Care 2.4
Materials 2.2
Other 0.4
Sector weightings are subject to change daily andare calculated as a percentage of net assets. Thetable excludes cash or cash equivalents, anygovernment/sovereign bonds or broad basedindex hedging securities the Fund may hold.
and the Fund remains biased in favor of names perceived as the more cyclical andrecovery positions.
The calendar quarter ended September 30, 2021, was dominated by conflictingnarratives at the macro level. Peaking leading indicators of activity and decliningUS Treasury yields implied a moderating economic cycle and prompted a defensivemood. On the other hand, industrial production accelerated and should remain robustwell into 2022. These crosscurrents reflect the unusual features of this cycle versuspast precedents.
The summer rotation in favor of defensive and quality styles as well as the decline inUS bond yields highlight investors’ conviction that the stagnation of the past decadewill persist. In contrast, we believe it is far too early to be positioning portfolios for“late cycle.” And the Fund’s positioning is anticorrelated to this consensus, partlybecause markets are already priced as if this outcome is certain and partly becausethe post-2008 era is unlikely to be a prologue for what comes next.
What helped and hurt performance over the annual period?The Fund’s largest contributors were long investments in the industrials and financialssectors, whereas short exposure in consumer discretionary and hedges on the SPDRS&P 500 ETF Trust hindered performance. Notable contributors during the periodincluded long positions in an energy sector ETF 0.40% full-year average, Google4.5%* (communication services), and Morgan Stanley 3.6%* (financials). Detractorsincluded short positions in an S&P 500 ETF Trust -32.2%* (market hedge) as well asshort positions in Tesla -2.04%, covered in June 2021 (consumer discretionary), andCostco -2.1%* (consumer staples).
How is the Fund positioned in the context of the global economiccycle?Our broadest cyclical exposure is industrials and transports, and then financials; weavoid the more expensive consumer cyclicals (retailing) and longer-duration consumerequities (food and luxury). This bias toward the industrial portion of the economyreflects our view that industrial production has lagged, while real consumer incomescould be eroded by higher prices. Most consumption categories are above pre-Covidlevels, yet this is less true of the production side of the economy, especially outsidethe US.
We view financials as the ideal hedge for a more reflationary outcome than manyexpect. Banks in particular are highly correlated with rising-inflation expectations. Wealso believe that the non-macro headwinds of the past decade—litigation, taxationand regulation—are largely behind the industry. The Fund has reduced exposure tothose businesses more exposed to capital markets where upside is more limited fromthis point. However, the Fund is biased toward retail banks because they benefit fromrising house prices and face less disintermediation risk. Abroad, UK banks are preferredover their continental peers, as the Bank of England is likely to raise rates moreaggressively than the market expects.
We have traded the energy sector long through 2021; although we reduced ourposition in June, we repurchased at the lows in mid-August. Our exposure is isolatedto the key beneficiaries of the structural underinvestment due to climate politics. We
* 10/31/21 % of NAV

15www.calamos.com
view the sector as a hedge against a more stagnant setting (more inflation, lessgrowth) relative to what we expect. Oil demand estimates for 2022 are too low andthe supply side is hampered by capital discipline and regulatory risk. Oil prices shouldbe fundamentally supported, but the conundrum of robust spot prices combined withlower five-year forward prices gives us pause. We are intrigued by the robust free cashflow yields on both spot and forward oil price assumptions.
Although the broad themes across the portfolio have not changed, we were active atthe stock level, favoring businesses that can navigate the ongoing recovery from thepandemic and, thus, produce material earnings leverage. If our assumption ofsustained economic expansion is correct, the Fund’s bias toward industrials andfinancials will prove rewarding.
Looking at the risks, it is hard not to focus on China. Evergrande is not a “Lehmanmoment” due to liquidity injections and the suppression of market-based pricing,while the government ownership of banks removes counterparty risk. Yet the Chineseeconomy is entering a long period of stagnation more akin to Japan in the 1990s thanthe US post-Lehman. With property accounting for about 25% of the economy, anextended slowdown seems inevitable.
China’s woes underline the risk of viewing emerging markets (EM) as a single assetclass. Of course, many investors do, and capital flows will inevitably come out of Chinaand be reallocated to what are perceived as quality plays elsewhere in EM.
The Fund is underweight in non-US economies and non-US revenues and, thus, morelevered to US domestic demand. This will inevitably shift when the US enters asustained slowdown, perhaps later in 2022. For now, we struggle to allocate the longbook outside the US as long as the opportunity set “closer to home” is robust.
What is your macro perspective heading into 2022?The Fed’s steps toward tapering have led many to assume the boom phase of therecovery has been foreshortened. Deceleration is built into any V-shaped recovery. Weare entering the critical stage when the crutches of policy support drop away, and theprivate sector must pick up the baton and drive the expansion. The good news is thatthe US economy largely decoupled from the virus in late 2020, partly due to stimulusbut also due to adaptability, and that learning curve has not been undone by the deltavariant.
Corporate surveys highlight that the rate of order growth in production across muchof the developed world remains strong. The primary source of economic moderationin the third quarter of 2021 has been the auto sector, which is the epicenter of supplybottlenecks. Demand outside autos has been robust and coincident with vibrantactivity in the rest of the economy. These supply issues will begin to ease as much ofthe world reopens for business.
Most measures of production globally will accelerate as supply-chain disruptions ebb,though the supply chain may not completely normalize until the second half of 2022.New orders versus inventories are no longer extreme and delivery times are no longerlengthening, even for autos. Equities that benefit the most from supply shortages,such as haulage, shipping and auto-related semis are no longer outperforming.
The consensus is too bearish on the economic outlook for both the fourth quarter of2021 and 2022. Fears of a fiscal cliff are overblown, partly because consumers havesaved the vast bulk of their fiscal transfers. Excess savings from the pandemic will
Calamos Phineus Long/Short Fund

16 CALAMOS OPEN-END FAMILY OF FUNDS ANNUAL REPORT
Calamos Phineus Long/Short Fund
inevitably be converted into consumption, supported by the enormous gains in wealthof the past year, growing job security and fear of rising prices.
The post-2008 decade suffered from a chronic shortage of demand. Consumers wereforced to deliver in the wake of the housing collapse, while the corporate sector hadlittle incentive to invest. Circumstances today are starkly reversed. With a recordnumber of job openings and firms struggling to fill them, the consumer is in a goodposition to replace fading stimulus with employment and higher wages.
Covid has been a decisive protagonist for risk assets, yet it can be viewed as incidentalto the secular changes that have been building up for years. One major shift is theretreat of globalization, which is forcing risk assets into distinct regional regimes ofgovernance and profitability. Unconventional policy prescriptions and the inevitablefruits of the long stagnation that pervaded the post-2008 decade are equally obscuringthe horizon.
This is creating an unfamiliar but positive demand setting that coincides with a less-elastic supply of labor and intermediate goods. While the coronavirus is largelyresponsible for the constraints upon supply, the broader reassessment of globalproduction chains in a world fracturing into regional economic zones is unlikely to betransitory.
We see the US 10-year Treasury yield rising to 1.8% by year end, though bond yieldshave not risen to the level implied by global Purchasing Managers’ Indices due to theenormous interventions by the Federal Reserve. Since May, the Fed has purchasedabout 70% of Treasury issuance, but this will diminish as the Fed tapers. Pricingpressures will be persistent because they are increasingly driven by excess demand. Allof this explains our reluctance to be overexposed to the equity derivatives of longduration.
Forecasting the degree and speed of the rise in rates is challenging. On the one hand,US rates reflect the global balance of inflation versus deflation risks more than anyother sovereign debt market. As we write this note, the currency-hedged yield pickupin US Treasuries for German and Japanese investors is large, helping to limit the risein US nominal yields and, in turn, suppressing real yields.
On the other hand, there are numerous reasons to believe that today’s inflationarypressures are not as transitory as some imagine. The reversal of globalization is forcingcompanies to restore and assume greater control over supply chains. Other factorsinclude a structural bull market in oil, higher housing costs, less labor supply due todeteriorating demographics, a rise in minimum wages, and the higher costs of the“environmental” component of ESG.*
Risk assets are well supported if credit conditions remain easy and the Fed stays pro-growth, but short-rate expectations appear too sanguine. For the moment, monetaryconditions are abnormally loose, and by some measures looser than any point sincethe Global Financial Crisis. The real fed funds rate is still near 50-year lows, yet the USoutput gap will approach decade highs by 2023. This “best of all possible worlds” isunlikely to last beyond 2022.
For the past year, the news on corporate profitability has been stunningly positive.Although market action into September 2021 could be interpreted as a deterioration
* ESG stands for Environmental, Social and Governance or the three pillars of sustainability. In a businesscontext, sustainability refers to how well a company’s business model contributes to enduring development.

17www.calamos.com
in the outlook, the key dynamic for equities will be a sustained rise in corporateearnings into 2023. As investors search for reasons to be cautious, we believe concernover earnings is premature as long as the momentum in nominal GDP is above trend,probably into mid-2022. Rising costs, either for intermediate inputs or labor, are anindication of persistent demand and should be manageable as long as revenuemomentum is sufficient to allow margins to expand. The time to worry is whencorporate managements enter an aggressive capital-investment cycle, but we are notthere yet.
Our investment conclusion rests upon the observation that corporate and economicmomentum will continue to be robust well into 2022. Although the monetary andpositioning backdrop can pose difficulties at any stage of the cycle, today’s historicsetting argues for leaning into risk assets for as long as the fundamental momentumis apparent.
What are your closing thoughts for Fund shareholders?Today’s crosscurrents are preventing investors from looking beyond the pandemic.Many investors are concerned that the recovery is fully baked and are convinced thatinflation, the pandemic, fiscal cliff, fed tapering and other factors will short circuit therecovery, returning the world to the essential characteristics of the post-2008 era.
The striking features of the market at the end of the third quarter in 2021—the declinein bond yields and rotation to defensive quality—were propelled by the convictionthat the end of the economic recovery was in sight. To us, this underscores the depthof today’s deflation psychology. It highlights the extent to which investors have becomeprisoners to the direction of bond prices.
While “stagflation” has become a popular term for the bears, it is possible thatfinancial markets are signaling moderately higher inflation but also significantly highereconomic growth. The latter is more analogous to the US experience of the 1950sthan the stagflation of the 1970s. While the outcome will not be known for years, wesee markets gravitating to the more sanguine of the two paths as the inflation datainto 2022 proves tamer than feared.
The wave dynamics of Covid imply improvement for at least three to four months, butpossibly beyond that as well. We believe the summer delta wave was the lastsignificant one of the pandemic and might mark its conclusion. This would echo thepattern of the 1918/1919 flu and others that were characterized by four waves andlasted no more than two years. New treatments and infection penetration levels alsosupport this view.
This final stretch of the pandemic and the uncertainly over inflation imply that longduration should be carefully managed within portfolios. We do not know how rapidlythe supply constraints will ease as the world gradually overcomes the pandemic, butthe secular and cyclical circumstances of today are unprecedented. Although theresponse by central banks will be slow and reluctant, the tide is just beginning to turnfor interest rates in the developed world.
Fundamental momentum will remain above trend into 2022, and the positiveproductivity shock of the pandemic will linger for profits and economic growth. Thiswill eventually wane under the weight of rising indebtedness, taxation and regulation.At some point, risk assets will fully discount recovery and instead start considering thechallenge posed by the collapse of policy discipline.
Calamos Phineus Long/Short Fund

ANNUALIZED RETURN: SINCE INCEPTION (5/1/02) THROUGH 10/31/21
Performance data quoted represents past performance, which is no guarantee of future results. Current performance may be lower or higher than theperformance quoted.
The principal value and investment return of an investment will fluctuate so that your shares, when redeemed, may be worth more or less than their original cost.You can obtain performance data current to the most recent month end by visiting www.calamos.com. Average annual total return measures net investmentincome and capital gain or loss from portfolio investments as an annualized average. All performance shown assumes reinvestment of dividends and capital gainsdistributions. Performance is for the Fund’s Class I shares at net asset value. The Fund also offers Class A and Class C shares, the performance of which may vary.Source: State Street Corporation and Morningstar Direct.
The performance shown for periods prior to April 6, 2016 is the performance of a predecessor investment vehicle (the “Predecessor Fund”). The Predecessor Fundwas reorganized into the Fund on April 6, 2016, the date upon which the Fund commenced operations. On October 1, 2015, the parent company of CalamosAdvisors, purchased Phineus Partners LP, the prior investment adviser to the Predecessor Fund (“Phineus”), and Calamos Advisors served as the Predecessor Fund’sinvestment adviser between October 1, 2015 until it was reorganized into the Fund. Phineus and Calamos Advisors managed the Predecessor Fund using investmentpolicies, objectives, guidelines and restrictions that were in all material respects equivalent to those of the Fund. Phineus and Calamos Advisors managed thePredecessor Fund in this manner either directly or indirectly by investing all of the Predecessor Fund’s assets in a master fund structure. The Predecessor Fundperformance information has been adjusted to reflect Class A, Class C and Class I shares, expenses. However, the Predecessor Fund was not a registered mutualfund and thus was not subject to the same investment and tax restrictions as the Fund. If it had been, the Predecessor Fund’s performance may have been lower.* Annual returns for Class I shares are provided because Class I shares represent the largest percentage of assets in the Calamos Family of Funds.
MSCI World IndexS&P 500 IndexCalamos Phineus Long/Short Fund(I Shares at NAV)*
7.9912.81
10.13 8.2110.77 8.92
38.6942.91
21.4818.93
16.2110.63 9.91
41.05
10.08
18.82
9.04
16.06
50%
20%
30%
40%
10%
0%1-YEAR 3-YEAR 5-YEAR 10-YEAR 15-YEAR SINCE INCEPTION
(5/1/02) THROUGH10/31/21
18 CALAMOS OPEN-END FAMILY OF FUNDS ANNUAL REPORT
Calamos Phineus Long/Short Fund
In the prosaic language of our industry, the pandemic has been the great wall of worryfor risk assets to climb. As long as it dominates, the bull market is not under threat.As we progress through 2022, the mood of central banks will begin to shift moredecisively. At some point, the economic context will be defined by negative growthsurprises and positive inflation surprises.
But we are not there yet. The bullish dynamic that underpins US dollar-based risk assetsis “unfinished business.”

19www.calamos.com
Calamos Phineus Long/Short Fund
AVERAGE ANNUAL TOTAL RETURN† AS OF 10/31/21
1 5 10 YEAR YEARS YEARS
Class A Shares (With Predecessor) – Inception 5/1/2002Without Sales Charge 38.19% 8.78% 7.70%With Sales Charge 31.60 7.72 7.18
Class C Shares (With Predecessor) – Inception 5/1/2002Without Sales Charge 37.31 7.97 6.92With Sales Charge 36.31 7.97 6.92
Class I Shares (With Predecessor) – Inception 5/1/2002 38.69 9.04 7.99
Performance data quoted represents past performance, which is no guarantee of future results.Current performance may be lower or higher than the performance quoted. The principal value andinvestment return of an investment will fluctuate so that your shares, when redeemed, may be worthmore or less than their original cost.
As of the prospectus dated 3/1/21, the Fund’s gross expense ratio for Class A shares is 2.94%, Class Cshares is 3.67% and Class I shares is 2.67%. The expense ratios shown above may differ from themore recent expense ratios reported in the Financial Highlights section of this report.† Average annual total return measures net investment income and capital gain or loss from portfolio investments
as an annualized average assuming reinvestment of dividends and capital gains distributions. Load-adjusted returnsare adjusted for the maximum front-end sales load of 4.75% for Class A shares. Returns for Class C shares havebeen adjusted for the contingent deferred sales charge (CDSC).
NOTES:The graph does not reflect the income taxes that you would pay on fund distributions or the redemption of fundshares. Fund performance includes reinvestment of dividends and adjustment for the maximum sales charge forClass A shares. The performance of other classes will vary from the performance of the class shown based on thedifference in sales charges and fees paid by shareholders investing in different share classes.
The S&P 500 Index is an unmanaged index generally considered representative of the US stock market.
The MSCI World Index (US Dollars) is a market-capitalization weighted index composed of companies representativeof the market structure of developed market countries in North America, Europe and the Asia/Pacific region.
Index returns assume reinvestment of dividends and do not reflect deduction of fees and expenses. It is not possibleto invest directly in an index.
The Fund’s use of derivative instruments involves investment risks and transaction costs to which the Fund wouldnot be subject absent the use of these instruments and, accordingly, may result in losses greater than if they had notbeen used. Derivative instruments can be illiquid, may disproportionately increase losses and may have a potentiallylarge impact on Fund performance.
GROWTH OF $1,000,000: FOR THE 10-YEAR PERIOD ENDED 10/31/21
$3,338,119
$4,493,872
$2,156,678
Calamos Phineus Long/Short Fund (I shares at NAV) MSCI World IndexS&P 500 Index
$0
$1,000,000
$3,000,000
$5,000,000
$4,000,000
$2,000,000
10/31/11 10/31/12 10/31/13 10/31/14 10/31/15 10/31/16 10/31/17 10/31/18 10/31/20 10/31/2110/31/19

20 CALAMOS OPEN-END FAMILY OF FUNDS ANNUAL REPORT
Calamos Convertible Fund
OVERVIEWThe Fund invests primarily in convertiblesecurities of US companies that arediversified across market sectors andcredit quality.
KEY FEATURESn Leverages more than four decades of
research and experience in convertiblesecurity investing.
n Provides diversification across marketsectors and credit quality, emphasizingmidsize companies with higher-qualitybalance sheets.
n Seeks to provide upside participation inequity markets with less exposure todownside than an equity-only portfolioover a full market cycle.
n Takes environmental, social andgovernance (ESG) factors into account,evaluating whether they impact acompany’s cash flow, risk profile andlong-term returns.
PORTFOLIO FITWhen used in conjunction with an equityallocation, the Fund offers a potentialway to manage risk by employingsecurities that engage in upside equitymovements with limited downsideparticipation.
FUND NASDAQ SYMBOLS
A Shares CCVIX
C Shares CCVCX
I Shares CICVX
FUND CUSIP NUMBERS
A Shares 128119401
C Shares 128119823
I Shares 128119864
CALAMOS CONVERTIBLE FUNDINVESTMENT TEAM DISCUSSION
How has the Fund performed?For the 12 months ended October 31, 2021 (“annual period”), Calamos ConvertibleFund had a positive return of 27.40% (Class I shares at net asset value) versus the ICEBofA All US Convertibles Index (VXA0) increase of 32.95%. For the same period, theS&P 500 Index gained 42.91%.
Since its Class I shares inception on June 25, 1997, the Fund returned 9.25% on anannualized basis compared with an annualized gain of 9.31% for the ICE BofA All USConvertibles Index and an 9.03% annualized return for the S&P 500 Index.
What factors influenced performance during the annual period?The equity and convertible markets posted very strong results during the period,responding well to the Covid vaccination rollout, positive economic data, fiscal stimulusand accommodative monetary policies. The Fund’s performance was driven in part byits exposure to technology issuers whose products facilitate working, playing, learningand shopping from home as well as those companies offering the support services—suchas cloud computing, internet security and e-payments—to make it all happen. Thesebusinesses saw demand for and adoption of their products and services accelerate atbreakneck speed as people the world over were forced to communicate remotely. Inaddition, the Fund benefited by including cyclical companies, such as cruise lines,restaurants, airlines, retailers and live-event providers, well poised to participate in theeconomic recovery as Covid numbers continued to drop, and expectations for “gettingback to normal” at last seemed palpable near the end of the period.
Along with strong performance, the convertible and equity markets worked throughperiods of higher volatility. The annual period included the presidential election, a run-off election in Georgia impacting Congressional leadership, volatile interest rates, thestorming of the US Capitol, the vaccine rollout, the Covid delta variant, commodityshortages, supply-chain disruptions, and rising inflation. As these events createdpockets of elevated volatility, our preference has been to focus on convertibles withbalanced risk/reward attributes and to be underweight the most equity-sensitiveconvertibles, which generally lack favorable downside mitigation. This underweightto equity-sensitive convertibles held back the relative return as these issues performedsimilarly to the overall equity market. (Equity-sensitive convertibles were up 53.5%during the annual period as measured by the ICE BofA Equity Alternative USConvertible Index.) Convertibles with more balanced risk/reward profiles were up27.0% (as measured by the ICE BofA Total Return US Convertible Index), while thoseconvertibles displaying more credit sensitivity were up 16.0% (per the ICE BAML YieldAlternative US Convertible index).
From an economic sector attribution perspective, the Fund benefited most from itsaverage underweight position and selection in the financials sector. An averageunderweight and selection within the health care sector as well as an underweightallocation to the utilities sector also supported the period result. In financials, the Fundbenefited from strong selection in the diversified banks, consumer finance and assetmanagement & custody banks industries. In health care, strong performance was noted

21www.calamos.com
Calamos Convertible Fund
in life science tools & services as well as health care technology. In general, names thatexhibited better risk/reward profiles underperformed the most equity-sensitiveconvertibles whose downside mitigation is deficient, specifically within informationtechnology (application software, data processing & outsourced services and intranetservices & infrastructure) and industrials (trucking, airlines, and industrial machinery).
How is the Fund positioned?Our focus in positioning the Calamos Convertible Fund’s portfolio is to optimize theportfolio’s risk/reward tradeoff by providing more exposure to upside in the equitymarkets than potential downside. We seek companies that are growing their intrinsicvalue and whose fundamentals are strengthening. The portfolio is positioned withslightly lower equity sensitivity than the benchmark index but has a more favorablerisk/reward profile. The portfolio’s largest exposures include growth-focused sectors,such as information technology and consumer discretionary, where we are findingsecular opportunities in cloud computing, internet security, e-payments, e-commerceand many others supporting “at-home” trends that accelerated during the pandemic.We believe there are also strong cyclical opportunities that can perform well asconsumers drive the next leg of economic expansion. These span multiple industries,including airlines, cruise lines, retail, entertainment and semiconductors. The portfolio’slargest relative underweight exposures are to more defensive areas, such as thefinancial sector where we believe convertible structures are less attractive.
New convertible issuance was robust during the annual period, as $153.3 billion cameto market globally with $83.9 billion introduced in the US. For some perspective, bothof these amounts were larger than the full calendar year periods dating back to 2008.The new issuance expanded the convertible universe and provided an opportunity forus to rebalance the portfolio into convertibles displaying more attractive risk/rewardprofiles. The improved risk/reward should enable the Fund to participate in a diversepool of equity upside with less susceptibility to downside corrections and volatileperiods. In actively managing the portfolio, we have taken advantage of these periodsby repositioning the portfolio into structurally stronger risk/reward convertibles. Forexample, we sold convertibles that have moved up and exhibit pure equity-likecharacteristics (with limited downside mitigation) or we have sold those that havemoved down and exhibit pure credit-like characteristics (with limited upside potential).We believe this continual portfolio restructuring creates the best opportunity forachieving solid risk-adjusted returns over the long-term.
What closing thoughts do you have for Fund shareholders?We maintain a positive outlook on the convertible securities market based on thebroad economic recovery combined with a fundamentally attractive issuer base. The$153.3 billion in convertibles brought to market globally during the annual periodwere issued by companies seeking capital to take advantage of opportunities forgrowth, expansion, mergers, and increased research and development. We are excitedby this broadening of the convertible market, which included a healthy mix ofinnovative companies—including established convertible market issuers and thoseissuing convertibles for the first time.
We expect that the economy’s underlying strength will lead the Federal Reserve totaper its unprecedented levels of stimulus in the coming months. Although this hasthe potential to add short-term volatility to the markets, we anticipate any changes
SECTOR WEIGHTINGS
Information Technology 30.8%
Consumer Discretionary 23.0
Health Care 15.8
Communication Services 9.9
Industrials 6.7
Utilities 2.8
Financials 2.5
Real Estate 1.4
Materials 1.1
Energy 0.8
Consumer Staples 0.4
Sector weightings are subject to change daily andare calculated as a percentage of net assets. Thetable excludes cash or cash equivalents, anygovernment/sovereign bonds or broad basedindex hedging securities the Fund may hold.

22 CALAMOS OPEN-END FAMILY OF FUNDS ANNUAL REPORT
Calamos Convertible Fund
ANNUALIZED RETURN: SINCE INCEPTION (6/25/97) THROUGH 10/31/21
Performance data quoted represents past performance, which is no guarantee of future results. Current performance may be lower or higher than theperformance quoted.
The principal value and investment return of an investment will fluctuate so that your shares, when redeemed, may be worth more or less than theiroriginal cost. You can obtain performance data current to the most recent month end by visiting www.calamos.com. Average annual total return measuresnet investment income and capital gain or loss from portfolio investments as an annualized average. All performance shown assumes reinvestment ofdividends and capital gains distributions. Performance is for the Fund’s Class I shares at net asset value. The Fund also offers Class A and Class C shares,the performance of which may vary. Source: State Street Corporation and Morningstar Direct.* Annual returns for Class I shares are provided because Class I shares represent the largest percentage of assets in the Calamos Family of Funds.
S&P 500 IndexICE BofA All US Convertibles Index(VXA0)
Calamos Convertible Fund(I Shares at NAV)*
11.2216.21
8.90 10.63 9.25 8.97
27.4032.95
24.19
18.5814.04
10.25 9.29
42.91
22.85 21.4817.64 18.93
50%
40%
30%
20%
10%
0%1-YEAR 3-YEAR 5-YEAR 10-YEAR 15-YEAR SINCE INCEPTION
(6/25/97) THROUGH10/31/21
will be well communicated in advance, and overall policy will remain accommodativeon a historical basis. We believe policy decisions will continue to be made with thegoal of avoiding restrictive outcomes that could cut off economic expansionprematurely.
Our view is that the economy is expanding, but not overheating, and will ultimatelytransition from early expansion to a mid-cycle growth phase. This likely meansheightened volatility for the foreseeable future as market participants scrutinize eachdata point through the transition. However, an environment of real growth withmoderate inflation could be a very attractive backdrop for risk assets, includingconvertibles.
In closing, we believe the fundamentals of the convertible market remain strong.Continued volatility and rotations within the financial markets may occur but are notuncommon as the economy transitions toward the next phase of expansion. Webelieve the strategic case for investing in convertibles to help navigate this volatilitywithout sacrificing upside participation remains intact.

23www.calamos.com
Calamos Convertible Fund
AVERAGE ANNUAL TOTAL RETURN† AS OF 10/31/21
1 5 10YEAR YEARS YEARS
Class A Shares – Inception 6/21/85Without Sales Charge 27.09% 17.33% 10.93%With Sales Charge 24.25 16.20 10.40
Class C Shares – Inception 7/5/96Without Sales Charge 26.16 16.46 10.11With Sales Charge 25.16 16.46 10.11
Class I Shares – Inception 6/25/97 27.40 17.64 11.22
Performance data quoted represents past performance, which is no guarantee of future results.Current performance may be lower or higher than the performance quoted. The principal value andinvestment return of an investment will fluctuate so that your shares, when redeemed, may be worthmore or less than their original cost.
As of the prospectus dated 3/1/21, the Fund’s gross expense ratio for Class A shares is 1.14%, Class Cshares is 1.89% and Class I shares is 0.89%. The expense ratios shown above may differ from themore recent expense ratios reported in the Financial Highlights section of this report.† Average annual total return measures net investment income and capital gain or loss from portfolio investments
as an annualized average assuming reinvestment of dividends and capital gains distributions. Load-adjusted returnsare adjusted for the maximum front-end sales load of 2.25% for Class A shares and returns for Class C shareshave been adjusted for the contingent deferred sales charge (CDSC).
NOTES:The graphs do not reflect the income of taxes that you would pay on fund distributions or the redemption of fundshares. Fund performance includes reinvestment of dividends and adjustment for the maximum sales charge forClass A shares. The performance of other classes will vary from the performance of the class shown based on thedifference in sales charges and fees paid by shareholders investing in different share classes.
The ICE BofA All US Convertibles Index is comprised of approximately 700 issues of only convertible bonds andpreferreds of all qualities. Since inception data for the index is shown from 6/30/97, since data is only available forfull monthly periods.
The S&P 500 Index is an unmanaged index generally considered representative of the US stock market.
Due to their structural complexities, the attributes of convertibles may vary. Therefore, they are typically categorizedas Yield Alternatives represented by the US CV Index (VYLD), Total Return Alternatives represented by the US CVIndex (VTOT), or Equity Alternatives represented by the US CV Index (VEQU).
The ICE BofA Total Return US Convertibles Index is a subset of ICE BofA All US Convertibles Index including securitieswith a delta greater than or equal to 0.4 and less than 0.8 (VTOT).
The ICE BofA Yield Alternative US Convertibles Index (VYLD) is a subset of ICE BofA All US Convertibles Index includingsecurities with a delta less than 0.4 (exhibiting bond-like characteristics).
The ICE BofA Equity Alternative US Convertibles Index (VEQU) is a subset of ICE BofA All US Convertibles Indexincluding securities with a delta of 0.8 and greater (exhibiting stock-like characteristics).
Index returns assume reinvestment of dividends and do not reflect deduction of fees and expenses. It is not possibleto invest directly in an index.
GROWTH OF $1,000,000: FOR THE 10-YEAR PERIOD ENDED 10/31/21
$3,720,756
$4,493,872
$2,895,116
Calamos Convertible Fund (I shares at NAV) S&P 500 IndexICE BofA US Convertibles Index (VXAO)
10/31/11 10/31/12 10/31/13 10/31/14 10/31/15 10/31/16 10/31/17 10/31/18 10/31/20 10/31/2110/31/19$0
$1,000,000
$3,000,000
$5,000,000
$4,000,000
$2,000,000
CALAMOS OPEN-END FAMILY OF FUNDS ANNUAL REPORT24
OVERVIEWThe Fund invests in global convertiblesecurities, striving to balance risk/rewardwhile providing growth and income.
KEY FEATURESn Provides broadly diversified exposure to
the global convertible bond universe.
n Leverages more than 40 years ofresearch in convertible security investing.
n Seeks to provide upside participation inequity markets with less exposure todownside than an equity-only portfolioover a full market cycle.
n Blends global investment themes andfundamental research via activemanagement.
n Takes environmental, social andgovernance (ESG) factors into account,evaluating whether they impact acompany’s cash flow, risk profile andlong-term returns.
PORTFOLIO FITConsisting of convertible securities thatcan participate in upside equitymovements with potentially limiteddownside exposure, the Fund can providea means to manage risk in conjunctionwith an equity allocation. The Fund canalso serve a role within a fixed-incomeallocation, as convertibles haveperformed well during periods of risinginterest rates and inflation.
FUND NASDAQ SYMBOLS
A Shares CAGCX
C Shares CCGCX
I Shares CXGCX
FUND CUSIP NUMBERS
A Shares 128120748
C Shares 128120730
I Shares 128120722
CALAMOS GLOBAL CONVERTIBLE FUNDINVESTMENT TEAM DISCUSSION
How has the Fund performed?For the 12 months ended October 31, 2021 (“annual period”), Calamos GlobalConvertible Fund returned 19.09% (Class I shares at net asset value) versus theRefinitiv Global Convertible Bond Index return of 22.18%. We believe balancedconvertibles offer the most attractive investment opportunity, given their combinationof upside potential and downside resilience. This approach led us to underweight themost equity-sensitive and credit-sensitive convertibles in favor of those with balancedrisk/reward attributes. Although equity-sensitive convertibles outperformed balancedconvertibles during the period, we believe the Fund’s longer-term performance affirmsthe wisdom of this strategy. Since its inception on December 31, 2014, the Fundincreased 9.67% (Class I shares at net asset value) annualized versus a 9.12% gainfor the Refinitiv Global Convertible Bond Index.
What factors influenced performance during the annual period?The global equity and convertible markets responded well to the Covid vaccinationrollout, positive economic data, fiscal stimulus and accommodative monetary policiesand posted very strong period results (+22.18% Refinitiv Global Convertible BondIndex; +41.05% MSCI World Index). The Fund was well positioned for Covid-relatedthemes, as it contained a heavy representation in technology issuers whose productsand services allowed people to work, learn, shop, entertain and receive medicalattention at home during the pandemic. In addition, the portfolio also included cyclicalcompanies well poised to participate in the recovery and reopening including cruiselines, airlines and retailers.
New convertible issuance was robust during the period, as $153.3 billion ofconvertibles were issued globally. The new issuance expanded the convertible universeand provided an opportunity to rebalance convertibles that had become too equitysensitive with those that have more attractive risk/reward profiles. Our preference forthese balanced convertibles led us to be relatively underweight to the most equity-sensitive areas of the convertibles market. Despite the very strong overall period result,the underweight allocation to the most equity-sensitive convertibles held back therelative return. Within the Refinitiv Global Convertible Bond Index, convertibles withmore than 80% equity sensitivity rose 38.8% and strongly outperformed convertibleswith balanced risk/reward attributes (40%—80% equity sensitivity; +19.5%) andconvertibles with more credit sensitivity (<40% equity sensitivity; +7.9%).
From an economic sector attribution perspective, the Fund benefited most from strongsecurity selection in the industrials sector as our holdings in the airlines industryoutperformed. Security selection in energy added value, aided by the strongperformance of names in the oil & gas exploration & production industry. Anunderweight allocation to the lagging utilities industry was also supportive to theportfolio result. Areas that most detracted from performance included materials,information technology and consumer discretionary. Within materials, an underweightallocation and security selection, notably in the steel industry, held back the relativereturn. In information technology, the relative return was hindered by security selection
Calamos Global Convertible Fund
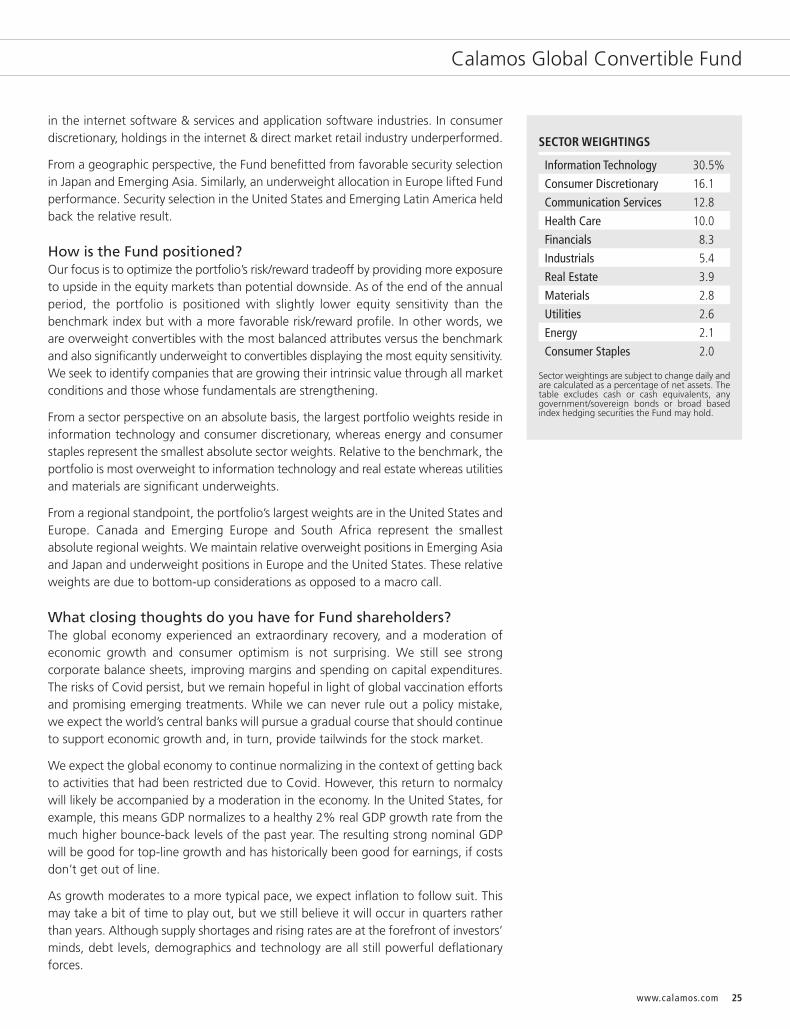
25www.calamos.com
Calamos Global Convertible Fund
in the internet software & services and application software industries. In consumerdiscretionary, holdings in the internet & direct market retail industry underperformed.
From a geographic perspective, the Fund benefitted from favorable security selectionin Japan and Emerging Asia. Similarly, an underweight allocation in Europe lifted Fundperformance. Security selection in the United States and Emerging Latin America heldback the relative result.
How is the Fund positioned?Our focus is to optimize the portfolio’s risk/reward tradeoff by providing more exposureto upside in the equity markets than potential downside. As of the end of the annualperiod, the portfolio is positioned with slightly lower equity sensitivity than thebenchmark index but with a more favorable risk/reward profile. In other words, weare overweight convertibles with the most balanced attributes versus the benchmarkand also significantly underweight to convertibles displaying the most equity sensitivity.We seek to identify companies that are growing their intrinsic value through all marketconditions and those whose fundamentals are strengthening.
From a sector perspective on an absolute basis, the largest portfolio weights reside ininformation technology and consumer discretionary, whereas energy and consumerstaples represent the smallest absolute sector weights. Relative to the benchmark, theportfolio is most overweight to information technology and real estate whereas utilitiesand materials are significant underweights.
From a regional standpoint, the portfolio’s largest weights are in the United States andEurope. Canada and Emerging Europe and South Africa represent the smallestabsolute regional weights. We maintain relative overweight positions in Emerging Asiaand Japan and underweight positions in Europe and the United States. These relativeweights are due to bottom-up considerations as opposed to a macro call.
What closing thoughts do you have for Fund shareholders?The global economy experienced an extraordinary recovery, and a moderation ofeconomic growth and consumer optimism is not surprising. We still see strongcorporate balance sheets, improving margins and spending on capital expenditures.The risks of Covid persist, but we remain hopeful in light of global vaccination effortsand promising emerging treatments. While we can never rule out a policy mistake,we expect the world’s central banks will pursue a gradual course that should continueto support economic growth and, in turn, provide tailwinds for the stock market.
We expect the global economy to continue normalizing in the context of getting backto activities that had been restricted due to Covid. However, this return to normalcywill likely be accompanied by a moderation in the economy. In the United States, forexample, this means GDP normalizes to a healthy 2% real GDP growth rate from themuch higher bounce-back levels of the past year. The resulting strong nominal GDPwill be good for top-line growth and has historically been good for earnings, if costsdon’t get out of line.
As growth moderates to a more typical pace, we expect inflation to follow suit. Thismay take a bit of time to play out, but we still believe it will occur in quarters ratherthan years. Although supply shortages and rising rates are at the forefront of investors’minds, debt levels, demographics and technology are all still powerful deflationaryforces.
SECTOR WEIGHTINGS
Information Technology 30.5%
Consumer Discretionary 16.1
Communication Services 12.8
Health Care 10.0
Financials 8.3
Industrials 5.4
Real Estate 3.9
Materials 2.8
Utilities 2.6
Energy 2.1
Consumer Staples 2.0
Sector weightings are subject to change daily andare calculated as a percentage of net assets. Thetable excludes cash or cash equivalents, anygovernment/sovereign bonds or broad basedindex hedging securities the Fund may hold.

CALAMOS OPEN-END FAMILY OF FUNDS ANNUAL REPORT26
AVERAGE ANNUAL TOTAL RETURN† AS OF 10/31/21
1 5 SINCEYEAR YEARS INCEPTION
Class A Shares – Inception 12/31/2014Without Sales Charge 18.86% 12.77% 9.39%With Sales Charge 16.19 11.69 8.61
Class C Shares – Inception 12/31/2014Without Sales Charge 17.95 11.93 8.59With Sales Charge 16.95 11.93 8.59
Class I Shares – Inception 12/31/2014 19.09 13.03 9.67
Performance data quoted represents past performance, which is no guarantee of future results.Current performance may be lower or higher than the performance quoted. The principal value andinvestment return of an investment will fluctuate so that your shares, when redeemed, may be worthmore or less than their original cost.
As of the prospectus dated 3/1/21, the Fund’s gross expense ratio for Class A shares is 1.35%, Class Cshares is 2.10% and Class I shares is 1.10%. The expense ratios shown above may differ from themore recent expense ratios reported in the Financial Highlights section of this report.† Average annual total return measures net investment income and capital gain or loss from portfolio investments
as an annualized average assuming reinvestment of dividends and capital gains distributions. Performance shownincludes the effects of an expense reimbursement that improved results and was in effect until October 31, 2020.Load-adjusted returns are adjusted for the maximum frontend sales load of 2.25% for Class A shares and returnsfor Class C shares have been adjusted for the contingent deferred sales charge (CDSC).
NOTES:The Refinitiv Global Convertible Bond Index (USD) is designed to represent the global convertible market.
Unmanaged index returns assume reinvestment of any and all distributions and, unlike fund returns, do not reflectfees, expenses or sales charges. Investors cannot invest directly in an index.
GROWTH OF $1,000,000: SINCE INCEPTION (12/31/14) THROUGH 10/31/21
$1,815,917$1,879,977
Calamos Global Convertible Fund (I shares at NAV) Refinitiv Global Convertible Bond Index
12/31/14 10/31/2110/31/20$0
$500,000
$1,500,000
$2,000,000
$1,000,000
10/31/15 10/31/16 10/31/17 10/31/18 10/31/19
Calamos Global Convertible Fund
The Federal Reserve may not be refilling the punch bowl as quickly as it once did, butit does not seem likely to take away the bowl any time soon. Even if short-term ratesrise from 0% to 1%, monetary policy is still quite accommodative. Combined withgood earnings growth, this accommodative policy should propel equities higher, withconvertible securities participating in the upside.
We believe the Calamos Global Convertible Fund is well positioned with risk/rewardcharacteristics that offer an attractive balance of upside equity participation potentialand equity risk mitigation. The Fund’s level of equity sensitivity is a bit below that ofthe overall global convertible market, but we believe this level is appropriate given theimportance we place on managing downside risk.
27www.calamos.com
Calamos Timpani Small Cap Growth Fund
CALAMOS TIMPANI SMALL CAP GROWTH FUNDINVESTMENT TEAM DISCUSSION
How has the Fund performed?For the 12 months ended October 31, 2021 (“annual period”), Calamos Timpani SmallCap Growth Fund posted a return of 50.80% (Class I Shares at net asset value),outperforming the gain of 38.45% for the Russell 2000 Growth Index.
Since Class I shares inception on March 23, 2011, the Fund has returned 16.80% onan annualized basis, while the Russell 2000 Growth Index returned 12.53% over thesame period. We believe these comparisons demonstrate the Fund’s ability tooutdistance its benchmark over full market cycles.
What factors influenced performance during the annual period?As indicated by the performance figures, the US equity markets enjoyed a very strongannual period for risk assets. For the annual period, companies enjoyed recordcorporate earnings as businesses benefited from a re-opening economy, stimulativepolicy and strong consumer spending. Markets started the annual period with a strongmove upward, as investor enthusiasm was lifted by positive data on Covid vaccineefficacy and the prospect of vaccines rolling out in early 2021. Initially, markets broadlyfavored small-cap stocks as well as reopening trades and more value-oriented stocks.This investor enthusiasm toward recovery stocks and value stocks stemmed fromrecognition that businesses in travel, leisure, restaurants, energy and financials allpresented opportunities for the most significant rebound from the negative impactsof the economic and social shutdowns. Near the middle of the annual period, seculargrowth businesses came back in relative favor as investors turned attention backtoward businesses that might be able to generate high and sustainable growth withoutrelying on the benefit of a reopening economy. The specter of additional shutdownsfrom the delta wave of Covid in addition to the loftier valuations associated withrecovery trades and value stocks cooled the relative appeal of those areas.
The Fund was able to generate strong absolute and relative performance due in partto investors’ “risk-on” sentiment at the beginning the period but owes its betterrelative performance to a few key factors: First, the Fund had purposefully added tocyclical growth opportunities prior to the start of the annual period, as our analysisrevealed that companies in this space possessed underestimated growth based uponmarket consensus and market pricing. Second, the portfolio management teamcontinued to focus on businesses that, in our view, had better growth potential inboth cyclical and more secular, or long-term, growth businesses. Because the markettends to extrapolate current dynamics into the future, the team was able to capitalizeon short-term market concerns that afforded entry points in strong secular growthareas, such as software, which benefitted relative performance. For the annual period,small-cap value stocks handily outperformed small-cap growth stocks, as evidencedby the Russell 2000 Value Index’s 64.30% return handily beating theRussell 2000 Growth Index’s 38.45% gain. As mentioned, the Fund outperformed theRussell 2000 Growth Index by 1,235 basis points, largely due to the focus on strongand sustainable growth combined with underestimated growth.
OVERVIEWThe Fund invests in the equity securitiesof small-capitalization companies withhigh, sustainable growth potential, whichmay exceed market expectations.
KEY FEATURESn Combines fundamental research with
the analysis of market estimates toidentify the underestimated growthdifferential between a company’sbusiness strength and marketexpectations of that strength.
n Pursues active management in a less-followed investment space.
n Analyzes secular trends to uncoverexploitable investment opportunitiesspecific to small-cap companies.
PORTFOLIO FITInvesting in small-cap companies is animportant component of a diversifiedinvestment strategy. Smaller companiestend to experience greater growth andoutperform larger companies.
FUND NASDAQ SYMBOLS
A Shares CTASX
C Shares CTCSX
I Shares CTSIX
R6 Shares CTSOX
FUND CUSIP NUMBERS
A Shares 128120417
C Shares 128120318
I Shares 128120391
R6 Shares 128120383

28 CALAMOS OPEN-END FAMILY OF FUNDS ANNUAL REPORT
Calamos Timpani Small Cap Growth Fund
Leadership within the small-cap growth market was represented by a mix of cyclicaland secular growth areas for the annual period. Within the Russell 2000 Growth Index,the smaller energy sector (less than 1% of the index on average over the course ofthe reporting period) led the market with a 185% gain. Industrials (+61%),information technology (+55%), consumer discretionary (+52%), real estate (+49%)and financials (+46%) also all outperformed the growth index. Utilities (+38%),materials (+38%), consumer staples (+32%), communication services (+31%) andhealth care (+14%) all lagged behind the benchmark’s performance.
Security selection and an underweight to the lagging health care sector were eachadditive to relative performance. Although health care was the worst-performingsector within the Russell 2000 Growth Index, the Fund’s health care names collectivelyoutperformed the Russell 2000 Growth Index’s return for the period. Holdings inbiotechnology, health care technology, pharmaceuticals, and life science tools &services each added significant value. Stock selection within information technologyalso boosted relative performance, with notable contributions from semiconductorsand application software holdings.
Selection within communication services lagged that of the overall market, causingthe sector to be a relative detractor. Disappointments within the movies &entertainment industry as well as the advertising industry led to the relativeunderperformance. The financials sector was also a relative hindrance to Fundperformance over the period as selection lagged that of the market, and the Fundwas underweight during intervals of strength for the sector. Fund holdings in insurancebrokers and regional banks also held back relative performance.
How is the Fund positioned?We continue to invest in both long-term secular-growth stocks and certain cyclicalgrowth stocks that should benefit meaningfully from a continued economic uptick. Anoteworthy portfolio change we made later in the annual period was decreasing ourweighting in consumer discretionary stocks. This had been an area of greater emphasis,but given the continued macro murkiness tied to Covid and supply-chain disruptions,we reduced the Fund’s exposure but remain overweight relative to the benchmark.We also increased our investment in technology stocks, especially certain softwarestocks that are riding upon strong secular trends. In addition, we increased ourinvestment in energy holdings, moving from an underweight to an overweight at theend of the period, with notable interest in sustainable energy businesses.
What closing thoughts do you have for Fund shareholders?The outlook remains bright for the small-cap growth asset class. Fundamentals arestrong and valuations relative to large caps are low by most measures. History showswhen relative valuations get to these levels, the probability of small-capoutperformance over the next annual period is high and can be meaningful.Additionally, we believe we are only one year into a sustained, multi-year leadershiprole for small caps. We continue to have an abundance of ideas for the portfolio andhave seen increased M&A activity within the space. While we are always happy toown names that are acquired at a premium to their then current price, we also viewthis as strong indication that the combination of growth and valuation are alsoattractive to outside buyers.
SECTOR WEIGHTINGS
Information Technology 22.1%
Health Care 20.9
Consumer Discretionary 18.1
Industrials 14.0
Energy 6.8
Financials 5.2
Consumer Staples 4.2
Materials 2.9
Communication Services 2.6
Real Estate 0.8
Sector weightings are subject to change daily andare calculated as a percentage of net assets. Thetable excludes cash or cash equivalents, anygovernment/sovereign bonds or broad basedindex hedging securities the Fund may hold.

29www.calamos.com
Calamos Timpani Small Cap Growth Fund
ANNUALIZED RETURN: SINCE INCEPTION (3/23/11) THROUGH 10/31/21
Performance data quoted represents past performance, which is no guarantee of future results. Current performance may be lower or higher than theperformance quoted.
The principal value and investment return of an investment will fluctuate so that your shares, when redeemed, may be worth more or less than theiroriginal cost. You can obtain performance data current to the most recent month end by visiting www.calamos.com. Average annual total return measuresnet investment income and capital gain or loss from portfolio investments as an annualized average. All performance shown assumes reinvestment ofdividends and capital gains distributions. Performance is for the Fund’s Class I shares at net asset value. The Fund also offers Class A, Class C and Class R6shares, the performance of which may vary. Source: State Street Corporation and Morningstar Direct.* Annual returns for Class I shares are provided because Class I shares represent the largest percentage of assets in the Calamos Family of Funds.
Russell 2000 Growth IndexCalamos Timpani Small Cap Growth Fund (I Shares at NAV)*
18.9714.57 16.80
13.05
50.80
38.45
27.97
18.64
27.98
17.90
60%
50%
40%
30%
20%
10%
0%1-YEAR 3-YEAR 5-YEAR 10-YEAR SINCE INCEPTION
(3/23/11) THROUGH10/31/21

30 CALAMOS OPEN-END FAMILY OF FUNDS ANNUAL REPORT
Calamos Timpani Small Cap Growth Fund
AVERAGE ANNUAL TOTAL RETURN† AS OF 10/31/21
10 YEARS OR
1 5 ^SINCEYEAR YEARS INCEPTION
Class A Shares (With Predecessor) – Inception 1/6/14^Without Sales Charge 50.42% 27.56% 15.22%With Sales Charge 43.25 26.33 14.51
Class C Shares – Inception 6/28/21^Without Sales Charge 3.75
Class I Shares (With Predecessor) – Inception 3/23/11Without Sales Charge 50.80 27.98 18.97
Class R6 Shares – Inception 6/1/19^ 50.96 35.13
Performance data quoted represents past performance, which is no guarantee of future results.Current performance may be lower or higher than the performance quoted. The principal value andinvestment return of an investment will fluctuate so that your shares, when redeemed, may be worthmore or less than their original cost.As of the prospectus dated 3/1/21, the Fund’s gross expense ratio for Class A shares is 1.40%, Class Ishares is 1.16% and Class R6 shares is 1.09%. The Fund’s investment adviser has contractually agreedto reimburse Fund expenses through March 1, 2023, to the extent necessary so that Total AnnualFund Operating Expenses of Class A, Class C and Class I shares are limited to 1.30%, 2.05%, 1.05%of average net assets, respectively. The Fund’s investment adviser has contractually agreed to limitthe Fund’s annual ordinary operating expenses for Class R6 shares (as a percentage of average netassets) to 1.05% less the Fund’s annual sub-transfer agency ratio (the aggregate subtransfer agencyfees of the Fund’s other share classes divided by the aggregate average annual net assets of theFund’s other share classes). For purposes of these expense limitations, operating expenses do notinclude taxes, interest, short interest, short dividend expenses, brokerage commissions, acquired fundfees and expenses, and extraordinary expenses, if any. Calamos Advisors may recapture previouslywaived expense amounts within the same fiscal year for any day where the respective share class’sexpense ratio falls below the contractual expense limit up to the expense limit for that day. Thisundertaking is binding on Calamos Advisors and any of its successors and assigns. This agreement isnot terminable by either party. The expense ratios shown above may differ from the more recentexpense ratios reported in the Financial Highlights section of this report.† Average annual total return measures net investment income and capital gain or loss from portfolio investments
as an annualized average assuming reinvestment of dividends and capital gains distributions. Performance shownreflects the effects of an expense reimbursement that improved results. Load-adjusted returns are adjusted for themaximum front-end sales load of 4.75% for Class A shares.
NOTES:Effective as of the close of business on May 31, 2019, the Fund acquired all of the assets, subject to the liabilities,of the Timpani Small Cap Growth Fund (the “Predecessor Fund”) through a tax-free reorganization (the“Reorganization”). Pursuant to the Reorganization of the Predecessor Fund into the Fund, Class Y shareholders ofthe Predecessor Fund received Class A shares of the Fund, and Service Class and Institutional Class shareholders ofthe Predecessor Fund each received Class I shares of the Fund. As a result of the Reorganization, the Fund adoptedthe performance and financial history of the Predecessor Fund. Accordingly, the performance shown in the averageannual total return table above for periods prior to the commencement of the Fund’s operations on June 1, 2019 isthe performance of the Predecessor Fund. The Fund has the same investment objective, strategy and portfoliomanager as the Predecessor Fund. As a result, the performance of the Fund would have been substantially similar tothat of the Predecessor Fund. The graphs do not reflect the income taxes that you would pay on fund distributions or the redemption of fundshares. Fund performance includes reinvestment of dividends and adjustment for the maximum sales charge forClass A shares. The performance of other classes will vary from the performance of the class shown based on thedifference in sales charges and fees paid by shareholders investing in different share classes.The Russell 2000 Growth Index is a composite of small-cap companies located in the US that also exhibit a growthprobability.Index returns assume reinvestment of dividends and do not reflect deduction of fees and expenses. It is not possibleto invest directly in an index.
GROWTH OF $1,000,000: SINCE INCEPTION (3/23/11) THROUGH 10/31/21
$3,897,678
$5,680,648
Calamos Timpani Small Cap Growth Fund (I shares at NAV) Russell 2000 Growth Index
$0
$2,000,000
$3,000,000
$6,000,000
$5,000,000
$4,000,000
$1,000,000
10/31/11 10/31/12 10/31/13 10/31/14 10/31/15 10/31/16 10/31/17 10/31/18 10/31/20 10/31/2110/31/19

31www.calamos.com
Calamos Timpani SMID Growth Fund
CALAMOS TIMPANI SMID GROWTH FUNDINVESTMENT TEAM DISCUSSION
How has the Fund performed?For the 12 months ended October 31, 2021 (“annual period”), Calamos Timpani SMIDGrowth Fund posted a return of 47.46% (Class I Shares at net asset value),outperforming the 37.12% gain for the Russell 2500 Growth Index.
What factors influenced performance during the annual period?As indicated by the performance figures, the US equity markets enjoyed a very strongannual period for risk assets. For the full annual period, companies enjoyed recordcorporate earnings as businesses benefited from a reopening economy, stimulativepolicy and strong consumer spending. Markets started the period with a strong moveupward, as investor enthusiasm was lifted by positive data on Covid vaccine efficacyand the prospect of vaccines rolling out in early 2021. Initially, markets broadly favoredsmall-cap stocks as well as reopening trades and more value-oriented stocks. Thisinvestor enthusiasm toward recovery stocks and value stocks stemmed from therecognition that businesses in travel, leisure, restaurants, energy and financials allpresented opportunities for the most significant rebound from the negative impactsof the economic and social shutdowns. Near the middle of the annual period, seculargrowth businesses came back in relative favor as investors turned attention backtoward businesses that might be able to generate high and sustainable growth withoutrelying on the benefit of a reopening economy. The specter of additional shutdownsfrom the delta wave of Covid in addition to the loftier valuations associated withrecovery trades and value stocks cooled the relative appeal of those areas.
The Fund was able to generate strong absolute and relative performance due in partto investors’ “risk-on” sentiment at the beginning the period, but the Fund owes itsbetter relative performance to a few key factors. First, the Fund had purposefully addedto cyclical growth opportunities prior the start of the annual period, as our analysisrevealed that companies in this space possessed underestimated growth based uponmarket consensus and market pricing. Second, the portfolio management teamcontinued to focus on businesses that, in our view, had better growth potential inboth cyclical and more secular, or long-term, growth businesses. Because the markettends to extrapolate current dynamics into the future, the team was able to capitalizeon short-term market concerns that afforded entry points in strong secular growthareas, such as software, which benefitted relative performance. For the full annualperiod, small-cap value stocks handily outperformed small-cap growth stocks, asevidenced by the Russell 2500 Value Index’s 58.15% return handily beating theRussell 2500 Growth Index’s 37.13% gain. As mentioned, the Fund outperformed theRussell 2500 Growth Index by 1,034 basis points largely due to the focus on strongand sustainable growth combined with underestimated growth.
Leadership within the small-cap growth market was represented by a mix of cyclicaland secular growth areas for the annual period. Within the Russell 2500 Growth Index,the smaller energy sector (less than 1% of the index on average over the course ofthe annual period) was the market leader with a 151% gain. In addition, industrials(+55%), real estate (+51%), information technology (+51%), consumer discretionary
OVERVIEWThe Fund invests in the equity securitiesof small- and mid-capitalization (SMID)companies with high, sustainable growthpotential, which may exceed marketexpectations.
KEY FEATURESn Combines fundamental research with
the analysis of market estimates toidentify the underestimated growthdifferential between a company’sbusiness strength and marketexpectations of that strength.
n Pursues active management in a less-followed investment space.
n Analyzes secular trends to uncoverexploitable investment opportunitiesspecific to small- and mid-capcompanies.
PORTFOLIO FITInvesting in SMID companies is animportant component of a diversifiedinvestment strategy. Small-to-midsizecompanies tend to experience greatergrowth and outperform larger companies,yet this greater potential also raises thepotential for greater volatility—which iswhy we believe active management iscrucial.
FUND NASDAQ SYMBOLS
A Shares CTAGX
I Shares CTIGX
R6 Shares CTOGX
FUND CUSIP NUMBERS
A Shares 128120375
I Shares 128120367
R6 Shares 128120359
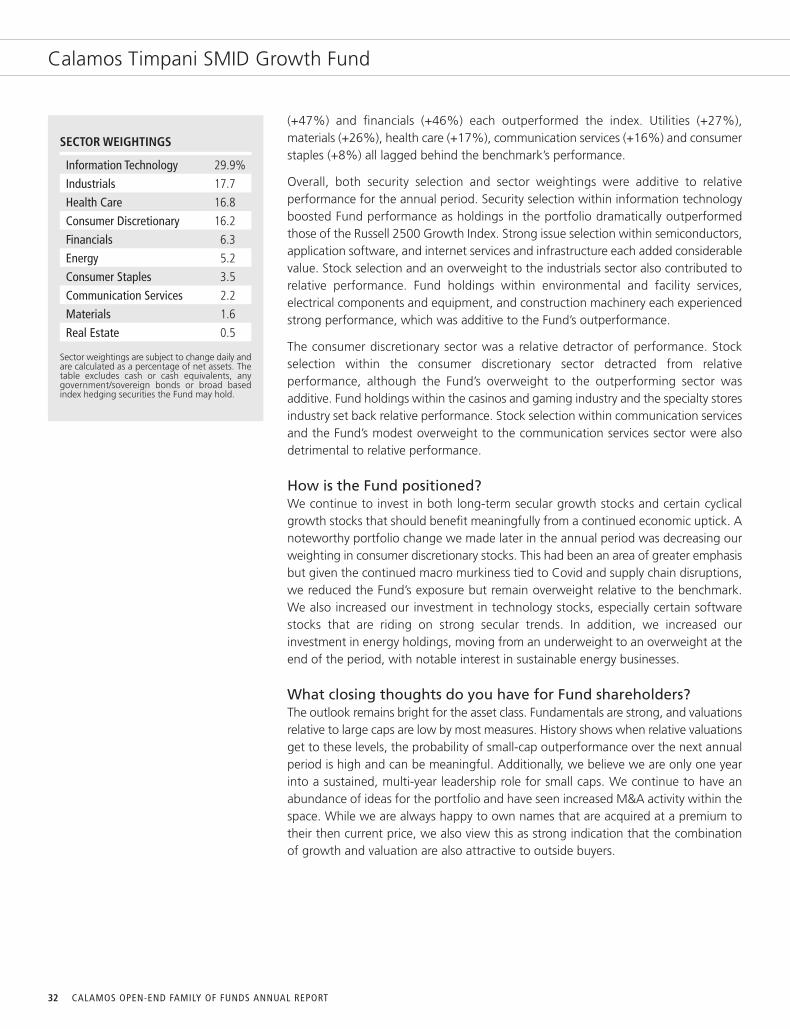
32 CALAMOS OPEN-END FAMILY OF FUNDS ANNUAL REPORT
Calamos Timpani SMID Growth Fund
(+47%) and financials (+46%) each outperformed the index. Utilities (+27%),materials (+26%), health care (+17%), communication services (+16%) and consumerstaples (+8%) all lagged behind the benchmark’s performance.
Overall, both security selection and sector weightings were additive to relativeperformance for the annual period. Security selection within information technologyboosted Fund performance as holdings in the portfolio dramatically outperformedthose of the Russell 2500 Growth Index. Strong issue selection within semiconductors,application software, and internet services and infrastructure each added considerablevalue. Stock selection and an overweight to the industrials sector also contributed torelative performance. Fund holdings within environmental and facility services,electrical components and equipment, and construction machinery each experiencedstrong performance, which was additive to the Fund’s outperformance.
The consumer discretionary sector was a relative detractor of performance. Stockselection within the consumer discretionary sector detracted from relativeperformance, although the Fund’s overweight to the outperforming sector wasadditive. Fund holdings within the casinos and gaming industry and the specialty storesindustry set back relative performance. Stock selection within communication servicesand the Fund’s modest overweight to the communication services sector were alsodetrimental to relative performance.
How is the Fund positioned?We continue to invest in both long-term secular growth stocks and certain cyclicalgrowth stocks that should benefit meaningfully from a continued economic uptick. Anoteworthy portfolio change we made later in the annual period was decreasing ourweighting in consumer discretionary stocks. This had been an area of greater emphasisbut given the continued macro murkiness tied to Covid and supply chain disruptions,we reduced the Fund’s exposure but remain overweight relative to the benchmark.We also increased our investment in technology stocks, especially certain softwarestocks that are riding on strong secular trends. In addition, we increased ourinvestment in energy holdings, moving from an underweight to an overweight at theend of the period, with notable interest in sustainable energy businesses.
What closing thoughts do you have for Fund shareholders?The outlook remains bright for the asset class. Fundamentals are strong, and valuationsrelative to large caps are low by most measures. History shows when relative valuationsget to these levels, the probability of small-cap outperformance over the next annualperiod is high and can be meaningful. Additionally, we believe we are only one yearinto a sustained, multi-year leadership role for small caps. We continue to have anabundance of ideas for the portfolio and have seen increased M&A activity within thespace. While we are always happy to own names that are acquired at a premium totheir then current price, we also view this as strong indication that the combinationof growth and valuation are also attractive to outside buyers.
SECTOR WEIGHTINGS
Information Technology 29.9%
Industrials 17.7
Health Care 16.8
Consumer Discretionary 16.2
Financials 6.3
Energy 5.2
Consumer Staples 3.5
Communication Services 2.2
Materials 1.6
Real Estate 0.5
Sector weightings are subject to change daily andare calculated as a percentage of net assets. Thetable excludes cash or cash equivalents, anygovernment/sovereign bonds or broad basedindex hedging securities the Fund may hold.

33www.calamos.com
Calamos Timpani SMID Growth Fund
AVERAGE ANNUAL TOTAL RETURN† AS OF 10/31/21
1 SINCEYEAR INCEPTION
Class A Shares – Inception 7/31/19Without Sales Charge 47.04% 30.33%With Sales Charge 40.02 27.54
Class I Shares – Inception 7/31/19Without Sales Charge 47.46 30.68
Class R6 Shares – Inception 7/31/19 47.46 30.68
Performance data quoted represents past performance, which is no guarantee of future results.Current performance may be lower or higher than the performance quoted. The principal value andinvestment return of an investment will fluctuate so that your shares, when redeemed, may be worthmore or less than their original cost.
As of the prospectus dated 3/1/21, the Fund’s gross expense ratio for Class A shares is 2.45%, Class Ishares is 2.25% and Class R6 shares is 2.25%. The Fund’s investment adviser has contractually agreedto reimburse Fund expenses through March 1, 2023 to the extent necessary so that Total AnnualFund Operating Expenses of Class A shares and Class I shares are limited to 1.35% and 1.10% ofaverage net assets, respectively. The Fund’s investment adviser has contractually agreed to limit theFund’s annual ordinary operating expenses for Class R6 shares (as a percentage of average net assets)to 1.10% less the Fund’s annual sub-transfer agency ratio (the aggregate subtransfer agency fees ofthe Fund’s other share classes divided by the aggregate average annual net assets of the Fund’s othershare classes). For purposes of these expense limitations, operating expenses do not include taxes,interest, short interest, short dividend expenses, brokerage commissions, acquired fund fees andexpenses, and extraordinary expenses, if any. Calamos Advisors may recapture previously waivedexpense amounts within the same fiscal year for any day where the respective share class’s expenseratio falls below the contractual expense limit up to the expense limit for that day. This undertakingis binding on Calamos Advisors and any of its successors and assigns. This agreement is not terminableby either party. The expense ratios shown above may differ from the more recent expense ratiosreported in the Financial Highlights section of this report.† Average annual total return measures net investment income and capital gain or loss from portfolio investments
as an annualized average assuming reinvestment of dividends and capital gains distributions. Performance shownreflects the effects of an expense reimbursement that improved results. Load-adjusted returns are adjusted for themaximum front-end sales load of 4.75% for Class A shares.
NOTES:The graphs do not reflect the income taxes that you would pay on fund distributions or the redemption of fundshares. Fund performance includes reinvestment of dividends and adjustment for the maximum sales charge forClass A shares. The performance of other classes will vary from the performance of the class shown based on thedifference in sales charges and fees paid by shareholders investing in different share classes.
The Russell 2500 Growth Index measures the performance of the small to mid-cap growth segment of the US equityuniverse. It includes those Russell 2500 companies with higher growth earning potential. The Russell 2500 GrowthIndex is published and maintained by FTSE Russell.
Index returns assume reinvestment of dividends and do not reflect deduction of fees and expenses. It is not possibleto invest directly in an index.
GROWTH OF $1,000,000: SINCE INCEPTION (7/31/19) THROUGH 10/31/21
$1,631,831
$1,827,000
Calamos Timpani SMID Growth Fund (I shares at NAV) Russell 2500 Growth Index
$0
$500,000
$1,500,000
$2,000,000
$1,000,000
7/31/19 10/31/19 1/31/20 4/30/20 7/31/20 7/31/21 10/31/214/30/211/31/2110/31/20
CALAMOS OPEN-END FAMILY OF FUNDS ANNUAL REPORT34
Calamos Growth Fund
CALAMOS GROWTH FUNDINVESTMENT TEAM DISCUSSION
How has the Fund performed?For the 12 months ended October 31, 2021 (“annual period”), Calamos Growth Fundreturned 46.40% (Class I Shares at net asset value), outperforming the S&P 1500Growth Index return of 45.07%. By way of comparison, the broad equity market, asmeasured by the S&P 500 Index, advanced with a return of 42.91% for the sameperiod.
Since Class I shares inception on September 18, 1997, the Fund has returned 12.49%on an annualized basis. The S&P 1500 Growth Index, the primary benchmark, returned9.81% over the same period, and the S&P 500 Index returned 8.80%. We believethese comparisons demonstrate the Fund’s ability to outpace the growth and broadindices over full market cycles.
What factors influenced performance over the annual period?As indicated by the performance figures, the US equity markets enjoyed a very strong12-month period for risk assets. For the annual period, companies enjoyed recordcorporate earnings as businesses benefited from a reopening economy, stimulativepolicy and strong consumer spending. Markets started the period with a strong moveupward, as investor enthusiasm was lifted by positive data on Covid vaccine efficacyand the prospect of vaccines rolling out in early 2021. Initially, markets favoredreopening trades, recognizing businesses that had the opportunity to rebound mostfrom the negative impacts of the economic and social shutdowns, notably in travel,leisure, and restaurants as well as the energy and financials sectors more broadly. Nearthe middle of the annual period, secular growth businesses caught favor as investorsturned their attention back to businesses that might be able to generate high andsustainable growth without relying on the benefits of a reopening economy.
The Fund benefitted from adjusting the portfolio to increase cyclical growth namesearlier in the annual period and then shifting more investment toward secular growthlater in the annual period. For the annual period, growth stocks and value stocks hadsimilar returns, as noted by the S&P 1500 Growth Index return of 45.07% comparedwith the S&P 1500 Value Index return of 42.51%, although the path to thatperformance for each was quite different. The more cyclically oriented value index hadaccumulated a 40% return in approximately the first seven months of the period ascyclical and reopening stocks were in favor. The growth index then took overleadership, outperforming the value index by approximately 20% over the last fivemonths of the annual period. Rotations and changes in market leadership are typicallythought of as healthy indicators of a rising market.
Within the S&P 1500 Growth Index, the smaller energy sector (less than 0.5% of theindex on average over the course of the annual period) was the market leader with a126% gain. Financials, also a smaller part of the growth market, gained 60% withcommunication services (+53%) and information technology (+51%) also outpacingthe overall benchmark return. Industrials (+42%), consumer discretionary (+39%), realestate (+36%), health care (+35%), materials (+34%), utilities (+20%) and consumerstaples (+19%) all lagged the benchmark’s performance.
OVERVIEWA broad, flexible strategy enables theFund to invest in the equities of UScompanies across all marketcapitalizations and sectors in order toattain the best potential for long-termcapital growth.
KEY FEATURESn Seeks to provide attractive returns
through an emphasis on higher-growthUS companies spanning the full rangeof market capitalizations and sectors.Draws on more than three decades ofexperience in growth investing.
n The portfolio reflects top-down, secularthematic views along with high-conviction, fundamentally researchedstocks of companies with advantagedbusiness models, high returns oncapital, solid free-cash-flow generation,and stewardship-minded management.
n Combines secular and cyclical growthto help manage the dynamics of theeconomy.
PORTFOLIO FITMay be an attractive option for investorsseeking higher growth and diversificationthat spans all caps of US companiesacross sectors and industries.
FUND NASDAQ SYMBOLS
A Shares CVGRX
C Shares CVGCX
I Shares CGRIX
FUND CUSIP NUMBERS
A Shares 128119302
C Shares 128119856
I Shares 128119807

35www.calamos.com
Calamos Growth Fund
Information technology holdings were the Fund’s top contributor. While owing mostlyto superior security selection, the Fund’s overweight position added value as well.Semiconductors and semiconductor equipment names were the strongestoutperforming industries. In addition, the Fund benefitted from a slight overweightas well as superior stock selection within the strong-performing financials sector. Theportfolio increased its investment during the period to participate in strong cyclicalgrowth opportunities and saw significant performance from investment banking &brokerage and consumer finance holdings.
Holdings in the communication services sector slightly lagged those of the market anddetracted from the Fund’s relative performance for the period. Fund names withininteractive media and services as well as the movies and entertainment industriesunderperformed those of the market. Investments in the energy sector were also aslight detractor to relative performance, as names within oil & gas equipment &services lagged those of the overall market.
How is the Fund positioned?The portfolio remains broadly diversified with a focus on a mix of durable, secularthemes as well as more cyclical growth opportunities. We believe long-term seculargrowth stocks with strong balance sheets and dominant market positions will thrivein this environment. At the same time, cyclical growth companies that are moreexposed to the ongoing global reopening should also do well. During the annualperiod, the Fund increased its investment in financials, shifting from an underweightto an overweight early in the period. We also added some higher-growth opportunitiesin communication services. The biggest decrease in relative positioning occurred inthe consumer discretionary sector. The portfolio remains overweight as of period end,but the relative weight was reduced largely around names with higher valuations.
What closing thoughts do you have for Fund shareholders?After a strong run of performance since the pandemic lows in early 2020, thebackdrop for equities has become decidedly more complicated, but the longer-termunderpinnings of the US economy and corporate profitability remain strong enoughto support further gains. The most recent US GDP growth measure was notablydisappointing, but we believe that this soft patch can be attributed to the midsummerdelta-induced spike in Covid cases. As Covid cases have come down and vaccinationshave scaled up globally, we have seen a return to stronger growth. US consumersremain in good financial standing with healthy household balance sheets and plentifuljob opportunities. As a result, we anticipate at least another year or two of above-trend growth. Attention will deservedly be on Federal Reserve policy and the Fed’stapering of bond purchases, as well as the potential for changes in Fed Boardmembership. Moreover, questions around whether inflation and supply-chain issuesare transitory or more entrenched will weigh on investors’ minds going forward.Markets always present challenges, and sometimes they seem to come all at once.Nevertheless, above-trend economic growth, low interest rates, healthy consumerbalance sheets, and a resilient and productive corporate sector continue to form aconstructive backdrop for US equity markets.
SECTOR WEIGHTINGS
Information Technology 38.9%
Consumer Discretionary 17.5
Communication Services 14.7
Health Care 10.8
Industrials 7.9
Financials 4.2
Consumer Staples 1.7
Materials 1.3
Energy 0.5
Real Estate 0.1
Sector weightings are subject to change daily andare calculated as a percentage of net assets. Thetable excludes cash or cash equivalents, anygovernment/sovereign bonds or broad basedindex hedging securities the Fund may hold.

CALAMOS OPEN-END FAMILY OF FUNDS ANNUAL REPORT36
Calamos Growth Fund
ANNUALIZED RETURN: SINCE INCEPTION (9/18/97) THROUGH 10/31/21
Performance data quoted represents past performance, which is no guarantee of future results. Current performance may be lower or higher than theperformance quoted.
The principal value and investment return of an investment will fluctuate so that your shares, when redeemed, may be worth more or less than theiroriginal cost. You can obtain performance data current to the most recent month end by visiting www.calamos.com. Average annual total return measuresnet investment income and capital gain or loss from portfolio investments as an annualized average. All performance shown assumes reinvestment ofdividends and capital gains distributions. Performance is for the Fund’s Class I shares at net asset value. The Fund also offers Class A and Class C shares,the performance of which may vary. Source: State Street Corporation and Morningstar Direct.* Annual returns for Class I shares are provided because Class I shares represent the largest percentage of assets in the Calamos Family of Funds.
S&P 500 IndexS&P 1500 Growth IndexCalamos Growth Fund(I Shares at NAV)*
14.79 16.2110.34 10.63
12.498.81
46.40 45.07
26.5223.19
18.4113.10 10.02
42.91
25.9221.48 21.20 18.93
60%
20%
30%
40%
50%
10%
0%1-YEAR 3-YEAR 5-YEAR 10-YEAR 15-YEAR SINCE INCEPTION
(9/18/97) THROUGH10/31/21
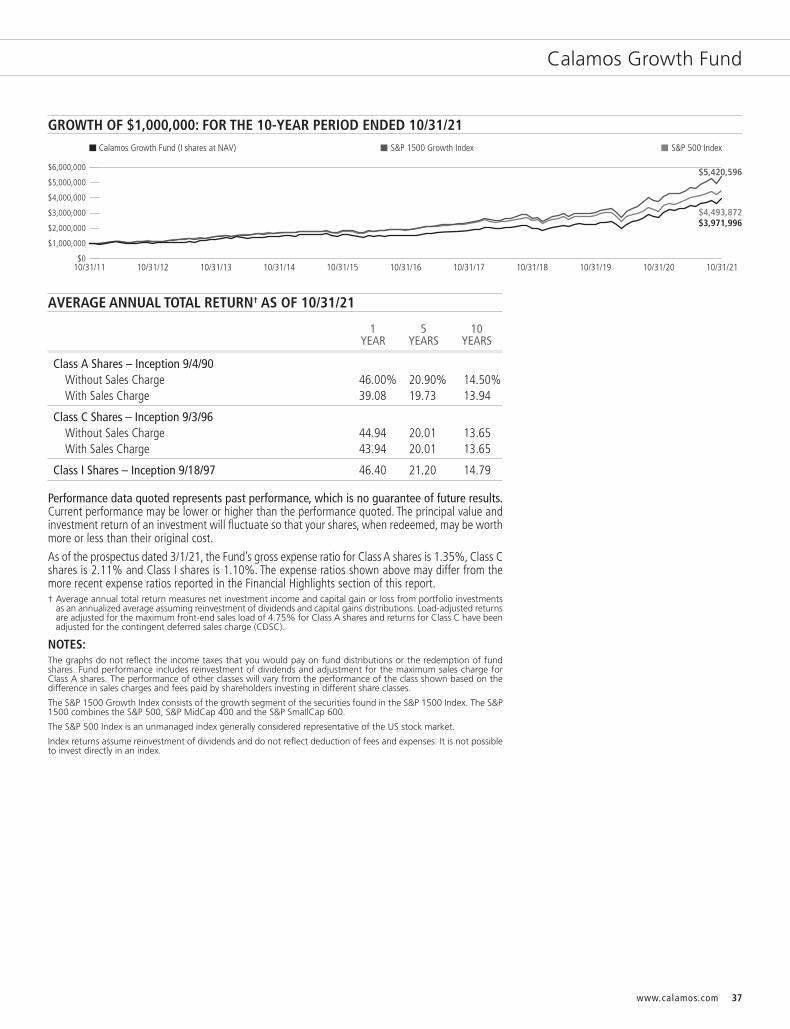
37www.calamos.com
Calamos Growth Fund
AVERAGE ANNUAL TOTAL RETURN† AS OF 10/31/21
1 5 10YEAR YEARS YEARS
Class A Shares – Inception 9/4/90Without Sales Charge 46.00% 20.90% 14.50%With Sales Charge 39.08 19.73 13.94
Class C Shares – Inception 9/3/96Without Sales Charge 44.94 20.01 13.65With Sales Charge 43.94 20.01 13.65
Class I Shares – Inception 9/18/97 46.40 21.20 14.79
Performance data quoted represents past performance, which is no guarantee of future results.Current performance may be lower or higher than the performance quoted. The principal value andinvestment return of an investment will fluctuate so that your shares, when redeemed, may be worthmore or less than their original cost.
As of the prospectus dated 3/1/21, the Fund’s gross expense ratio for Class A shares is 1.35%, Class Cshares is 2.11% and Class I shares is 1.10%. The expense ratios shown above may differ from themore recent expense ratios reported in the Financial Highlights section of this report.† Average annual total return measures net investment income and capital gain or loss from portfolio investments
as an annualized average assuming reinvestment of dividends and capital gains distributions. Load-adjusted returnsare adjusted for the maximum front-end sales load of 4.75% for Class A shares and returns for Class C have beenadjusted for the contingent deferred sales charge (CDSC).
NOTES:The graphs do not reflect the income taxes that you would pay on fund distributions or the redemption of fundshares. Fund performance includes reinvestment of dividends and adjustment for the maximum sales charge forClass A shares. The performance of other classes will vary from the performance of the class shown based on thedifference in sales charges and fees paid by shareholders investing in different share classes.
The S&P 1500 Growth Index consists of the growth segment of the securities found in the S&P 1500 Index. The S&P1500 combines the S&P 500, S&P MidCap 400 and the S&P SmallCap 600.
The S&P 500 Index is an unmanaged index generally considered representative of the US stock market.
Index returns assume reinvestment of dividends and do not reflect deduction of fees and expenses. It is not possibleto invest directly in an index.
GROWTH OF $1,000,000: FOR THE 10-YEAR PERIOD ENDED 10/31/21
$3,971,996
$5,420,596
$4,493,872
Calamos Growth Fund (I shares at NAV) S&P 500 IndexS&P 1500 Growth Index
10/31/11 10/31/12 10/31/13 10/31/14 10/31/15 10/31/16 10/31/17 10/31/18 10/31/20 10/31/2110/31/19$0
$1,000,000
$3,000,000
$4,000,000
$6,000,000
$5,000,000
$2,000,000

38 CALAMOS OPEN-END FAMILY OF FUNDS ANNUAL REPORT
Calamos Growth and Income Fund
CALAMOS GROWTH AND INCOME FUNDINVESTMENT TEAM DISCUSSION
How has the Fund performed?For the 12 months ended October 31, 2021 (“annual period”), Calamos Growth andIncome Fund posted strong returns with a gain of 37.02% (Class I Shares at net assetvalue). Comparatively, the S&P 500 Index returned 42.91% for the period and the ICEBofA All US Convertibles ex Mandatory Index registered a gain of 34.01% for theperiod. We manage this Fund with the goal of achieving upside equity participationand potential downside risk mitigation over full market cycles. For the annual period,the Growth and Income Fund captured 86% of the all-equity index’s returns. Since itsClass I shares inception on September 18, 1997, the Fund returned 10.56% on anannualized basis versus an 8.80% gain for the S&P 500 Index and 9.49% return forthe ICE BofA All US Convertibles ex Mandatory Index.
Please discuss the Fund’s lower-volatility characteristics.We believe the Fund’s historical lower-volatility characteristics are a by-product of ourinvestment style and focus on participating in equity market upside with less volatilitythan the market as a whole. Beta is one popular statistic for measuring volatility. Betaconsiders a fund’s historic volatility versus the market, which is assigned a beta of 1.0.A fund with half the volatility of the market would have a beta of 0.5, while a fundwith a beta of 2.0 would have been twice as volatile as the market. Since its inception,the Fund has had a beta of 0.75 (Class I shares) versus the S&P 500 Index. The Fund,therefore, outperformed the broader equity market, as measured by the S&P 500Index, with less volatility than the equity market. Please note that past performancedoes not indicate future results and that beta is one of many measures of risk.
What factors influenced performance during the annual period?As indicated by the performance figures, the US equity markets and risk markets ingeneral enjoyed a very strong annual period. Companies reaped record corporateearnings as businesses benefited from a reopening economy, stimulative policy andstrong consumer spending. Markets started the period with a strong move upward,as investor enthusiasm was buoyed by positive data on Covid vaccine efficacy and theprospect of vaccines rolling out in early 2021. Initially, markets favored reopeningtrades, recognizing businesses that had the opportunity to rebound most from thenegative impacts of the economic and social shutdowns, notably in travel, leisure, andrestaurants as well as the energy and financials sectors more broadly. Near the middleof the annual period, secular growth businesses caught favor as investors turned theirattention to businesses that might be able to generate high and sustainable growthwithout relying on a reopening economy.
The Fund benefitted from owning a mix of cyclical and secular growth businesses asmarket leadership rotated abruptly. All told, cyclically oriented names generallyoutperformed in various waves over the beginning of the annual period, whereas moresecular growth names outperformed at points during the second half of the period.As an example, for the annual period, growth stocks and value stocks had similar
OVERVIEWThe Fund invests primarily in US equityand convertible securities in an attemptto balance risk/reward while providinggrowth and income.
KEY FEATURESn Leverages more than four decades of
research experience combining equitiesand convertible holdings to provideequity-like participation.
n Provides a core holding option thataims to maintain a consistent riskposture throughout the market cycle.
n Research-driven approach identifiesopportunities by combining top-downanalysis with a focus on key growthcharacteristics.
PORTFOLIO FITThe Fund can provide a long-term coreequity allocation, which exhibitspotentially lower volatility and deliversattractive income.
FUND NASDAQ SYMBOLS
A Shares CVTRX
C Shares CVTCX
I Shares CGIIX
R6 Shares CGIOX
FUND CUSIP NUMBERS
A Shares 128119104
C Shares 128119831
I Shares 128119872
R6 Shares 128120326

39www.calamos.com
Calamos Growth and Income Fund
returns, as the S&P 500 Growth Index returned of 45.07% compared with theS&P 500 Value Index return of 41.01%, but the path to that performance was quitedifferent between the two styles. The more cyclically oriented value index hadaccumulated a 37% return during the first seven months of the period as cyclical andreopening stocks were in favor, while the growth index was up “only” 23% duringthat time. The growth index then took over leadership, outperforming the value indexby 15% during the last five months of the annual period. Rotations and changes inmarket leadership are typically thought of as healthy indicators for a rising market.
Looking at the all-equity market, within the S&P 500 Index, the smaller energy sector(less than 3% of the index on average over the course of the annual period) led themarket with a 112% gain. Financials at 73%, information technology at 47%, andreal estate at 46% also all outperformed the benchmark. Communication services(+42%), industrials (+40%), materials (+37%), consumer discretionary (+37%), healthcare (+34%), consumer staples (+19%), and utilities (+11%) each lagged behind thebenchmark’s performance.
For the annual period, the Fund was able to deliver significant equity marketparticipation, even while utilizing convertible securities and options to reduce overallequity risk. The biggest benefactor to the Fund’s relative performance was theconsumer staples sector. Strong issue selection generated better performance thanthat of the all-equity S&P 500 Index, and the Fund’s underweight to a more defensivearea of the market was also additive. Specifically, strong issue selection in the materialssector was additive to relative performance, with notable contributions from copperand industrial gases. In industrials, select convertible securities offered goodperformance—and better risk management in our view—but did not keep pace withoutright equity performance for the sector. Information technology is another sectorin which the Fund had strong performance but lagged behind the all-equity S&P 500Index sector constituents. The use of convertible securities offered attractive access toareas such as application software and data processing, but returns lagged behindthose of the common stocks.
How is the Fund positioned?From an asset class perspective, our positioning continues to favor equities over fixedincome, with convertible securities being the most favored fixed-income security. Witha decline in equity volatility over the last six months, we favor option strategies tomanage risk, including creating synthetic convertibles with call options and buyingput options for downside mitigation.
What closing thoughts do you have for Fund shareholders?The transition from the recovery period of the Covid-induced economic cycle to themid-cycle continues, as we discussed in our mid-year outlook. However, the transitionhas been volatile and will take longer than we originally thought. The demand side ofthe economy is still positive, as consumer and corporate spending should remain atabove-trend levels as the Covid crisis abates; demand levels for services improve; andcompanies rebuild inventories, expand capacity, and improve productivity.
SECTOR WEIGHTINGS
Information Technology 25.5%
Consumer Discretionary 14.2
Health Care 11.5
Communication Services 11.1
Financials 10.8
Industrials 9.5
Consumer Staples 4.4
Energy 3.1
Utilities 2.6
Materials 2.4
Real Estate 1.7
Other 0.1
Sector weightings are subject to change daily andare calculated as a percentage of net assets. Thetable excludes cash or cash equivalents, anygovernment/sovereign bonds or broad basedindex hedging securities the Fund may hold.

40 CALAMOS OPEN-END FAMILY OF FUNDS ANNUAL REPORT
Calamos Growth and Income Fund
This change in the economic cycle and growth drivers should result in positive equityreturns over the next 12 to 18 months but at more muted levels than the prior annualperiod. This investment regime change in the short term should indicate marketleadership transitioning away from higher-risk equities (in both cyclical and growthareas) toward companies with higher return on capital, improved margins and less-volatile earnings. Third- and fourth-quarter 2021 earnings will highlight the severityof many of the issues described above, and the equity market may be volatile duringthis time. Once the market gets past these near-term issues, we expect better progresstoward a more normalized environment in 2022.
ANNUALIZED RETURN: SINCE INCEPTION (9/18/97) THROUGH 10/31/21
Performance data quoted represents past performance, which is no guarantee of future results. Current performance may be lower or higher than theperformance quoted.
The principal value and investment return of an investment will fluctuate so that your shares, when redeemed, may be worth more or less than their original cost.You can obtain performance data current to the most recent month end by visiting www.calamos.com. Average annual total return measures net investmentincome and capital gain or loss from portfolio investments as an annualized average. All performance shown assumes reinvestment of dividends and capital gainsdistributions. Performance is for the Fund’s Class I shares at net asset value. The Fund also offers Class A, Class C and Class R6 shares, the performance of whichmay vary. Source: State Street Corporation and Morningstar Direct.* Annual returns for Class I shares are provided because Class I shares represent the largest percentage of assets in the Calamos Family of Funds.
ICE BofA All US ConvertiblesEX Mandatory Index
S&P 500 IndexCalamos Growth and Income Fund(I Shares at NAV)*
11.5714.81
9.10 10.99 10.56 9.60
37.02
42.91
21.4818.93 16.21
10.63 8.81
34.01
19.9825.48
16.4719.92
50%
30%
40%
20%
10%
0%1-YEAR 3-YEAR 5-YEAR 10-YEAR 15-YEAR SINCE INCEPTION
(9/18/97) THROUGH10/31/21

41www.calamos.com
Calamos Growth and Income Fund
AVERAGE ANNUAL TOTAL RETURN† AS OF 10/31/21
10 YEARS OR
1 5 ^SINCE YEAR YEARS INCEPTION
Class A Shares – Inception 9/22/88Without Sales Charge 36.68% 16.17% 11.29%With Sales Charge 30.18 15.05 10.75
Class C Shares – Inception 8/5/96Without Sales Charge 35.66 15.32 10.46With Sales Charge 34.66 15.32 10.46
Class I Shares – Inception 9/18/97 37.02 16.47 11.57
Class R6 Shares – Inception 6/23/20^ 37.14 30.51
Performance data quoted represents past performance, which is no guarantee of future results.Current performance may be lower or higher than the performance quoted. The principal value andinvestment return of an investment will fluctuate so that your shares, when redeemed, may be worthmore or less than their original cost.
As of the prospectus dated 3/1/21, the Fund’s gross expense ratio for Class A shares is 1.08%, Class Cshares is 1.84%, Class I shares is 0.83% and Class R6 shares is 0.75%. The expense ratios shownabove may differ from the more recent expense ratios reported in the Financial Highlights section ofthis report.† Average annual total return measures net investment income and capital gain or loss from portfolio investments
as an annualized average assuming reinvestment of dividends and capital gains distributions. Load-adjusted returnsare adjusted for the maximum front-end sales load of 4.75% for Class A shares and returns for Class C shareshave been adjusted for the contingent deferred sales charge (CDSC).
NOTES:The graphs do not reflect the income taxes that you would pay on fund distributions or the redemption of fundshares. Fund performance includes reinvestment of dividends and adjustment for the maximum sales charge forClass A shares. The performance of other classes will vary from the performance of the class shown based on thedifference in sales charges and fees paid by shareholders investing in different share classes.
The S&P 500 Index is an unmanaged index generally considered representative of the US stock market.
The ICE BofA All US Convertibles EX Mandatory Index represents the US convertibles securities market excludingmandatory convertibles.
Index returns assume reinvestment of dividends and do not reflect deduction of fees and expenses. It is not possibleto invest directly in an index.
The Fund’s use of derivative instruments involves investment risks and transaction costs to which the Fund wouldnot be subject absent the use of these instruments and, accordingly, may result in losses greater than if they had notbeen used. Derivative instruments can be illiquid, may disproportionately increase losses and may have a potentiallylarge impact on Fund performance.
GROWTH OF $1,000,000: FOR THE 10-YEAR PERIOD ENDED 10/31/21
$3,980,787
$4,493,872
$2,988,304
Calamos Growth and Income Fund (I shares at NAV) ICE BofA All US Convertibles EX Mandatory IndexS&P 500 Index
10/31/11 10/31/12 10/31/13 10/31/14 10/31/15 10/31/16 10/31/17 10/31/18 10/31/20 10/31/2110/31/19$0
$1,000,000
$3,000,000
$5,000,000
$4,000,000
$2,000,000
CALAMOS OPEN-END FAMILY OF FUNDS ANNUAL REPORT42
Calamos Dividend Growth Fund
CALAMOS DIVIDEND GROWTH FUNDINVESTMENT TEAM DISCUSSION
How has the Fund performed?For the 12 months ended October 31, 2021 (“annual period”), Calamos DividendGrowth Fund returned 42.73% (Class I shares at net asset value), in line with theS&P 500 Index return of 42.91%.
What factors influenced performance during the annual period?As indicated by the performance figures, the US equity markets and risk markets ingeneral enjoyed a very strong annual period. Companies enjoyed record corporateearnings as businesses benefited from a reopening economy, stimulative policy andstrong consumer spending. Markets started the period with a strong move upward,as investor enthusiasm was buoyed by positive data on Covid vaccine efficacy and theprospect of vaccines rolling out in early 2021. Initially, markets favored reopeningtrades, recognizing businesses that had the opportunity to rebound most from thenegative impacts of the economic and social shutdowns, notably in travel, leisure, andrestaurants as well as the energy and financials sectors more broadly. Near the middleof the annual period, secular growth businesses caught favor as investors turned theirattention back to businesses that might be able to generate high and sustainablegrowth without relying on a reopening economy.
The Fund benefitted from owning a mix of larger cap stocks among cyclical and seculargrowth businesses, as market leadership rotated abruptly. All told, cyclically orientednames generally outperformed in various waves over the beginning of the annualperiod, whereas more secular growth names outperformed at points during thesecond half of the period. As an example, for the annual period, growth stocks andvalue stocks had similar returns, as the S&P 500 Growth Index returned 45.07%compared with the S&P 500 Value Index return of 41.01%, but the path to thatperformance was quite different between the two styles. The more cyclically orientedvalue index had accumulated a 37% return during the first seven months of the periodas cyclical and reopening stocks were in favor, whereas the growth index was up“only” 23% during that time. The growth index then took over leadership,outperforming the value index by 15% during the last five months of the annualperiod. Rotations and changes in market leadership are typically thought of as healthyindicators of a rising market.
Within the S&P 500 Index, the smaller energy sector (less than 3% of the index onaverage over the course of the annual period) led the market with a 112% gain.Financials (+73%), information technology (+47%), and real estate (+46%) also alloutperformed the benchmark. Communication services (+42%), industrials (+40%),materials (+37%), consumer discretionary (+37%), health care (+34%), consumerstaples (+19%), and utilities (+11%) each lagged behind the benchmark’sperformance.
The Fund benefitted from strong stock selection as well as an overweight to thestrongly performing financials sector. Although financials was the second-leadingsector within the benchmark, the Fund’s selection significantly outperformed the sectoroverall. Fund investments in banking & brokerage and diversified banks were especially
OVERVIEWThe Fund invests in companies that webelieve have the ability to increasedividends over time, either throughincreasing profits or more efficient use ofcapital.
KEY FEATURESn Employs bottom-up stock picking and
a benchmark-agnostic approach.
n Focuses on good businesses with solidcash flows and value prices.
PORTFOLIO FITThe Fund may be suitable for investorsseeking a regular stream of income anddividend-paying equity investments thattend to be less volatile than non-dividendpayers.
FUND NASDAQ SYMBOLS
A Shares CADVX
C Shares CCDVX
I Shares CIDVX
FUND CUSIP NUMBERS
A Shares 128120839
C Shares 128120821
I Shares 128120813
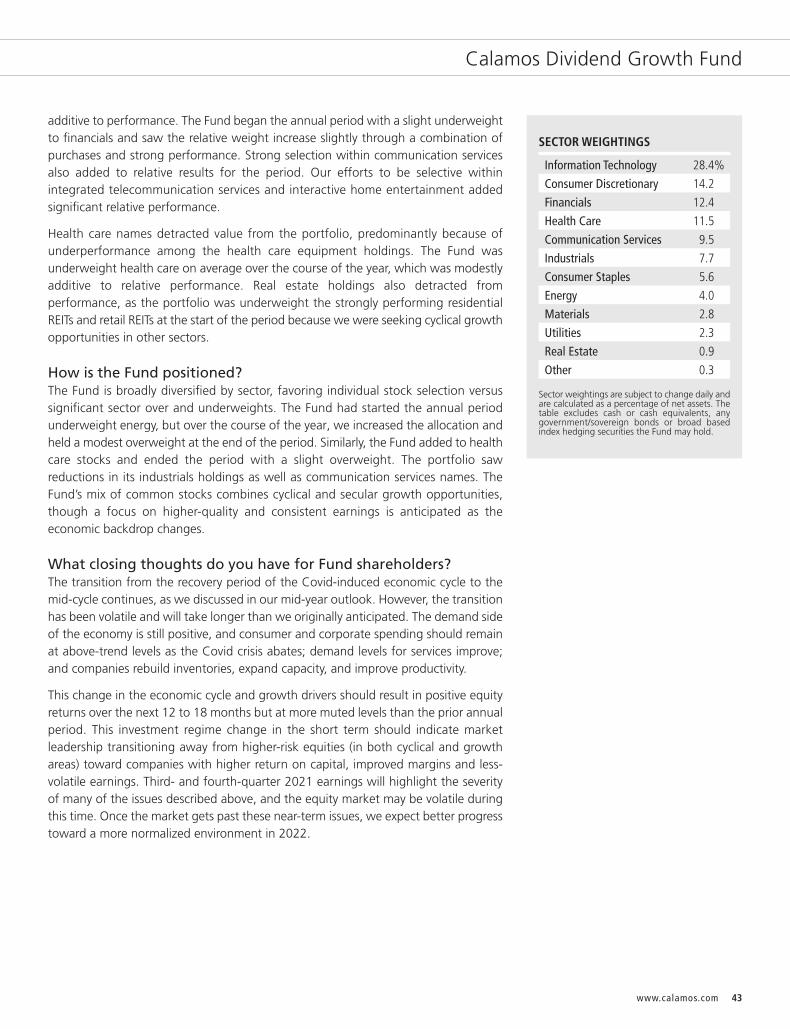
43www.calamos.com
Calamos Dividend Growth Fund
additive to performance. The Fund began the annual period with a slight underweightto financials and saw the relative weight increase slightly through a combination ofpurchases and strong performance. Strong selection within communication servicesalso added to relative results for the period. Our efforts to be selective withinintegrated telecommunication services and interactive home entertainment addedsignificant relative performance.
Health care names detracted value from the portfolio, predominantly because ofunderperformance among the health care equipment holdings. The Fund wasunderweight health care on average over the course of the year, which was modestlyadditive to relative performance. Real estate holdings also detracted fromperformance, as the portfolio was underweight the strongly performing residentialREITs and retail REITs at the start of the period because we were seeking cyclical growthopportunities in other sectors.
How is the Fund positioned?The Fund is broadly diversified by sector, favoring individual stock selection versussignificant sector over and underweights. The Fund had started the annual periodunderweight energy, but over the course of the year, we increased the allocation andheld a modest overweight at the end of the period. Similarly, the Fund added to healthcare stocks and ended the period with a slight overweight. The portfolio sawreductions in its industrials holdings as well as communication services names. TheFund’s mix of common stocks combines cyclical and secular growth opportunities,though a focus on higher-quality and consistent earnings is anticipated as theeconomic backdrop changes.
What closing thoughts do you have for Fund shareholders?The transition from the recovery period of the Covid-induced economic cycle to themid-cycle continues, as we discussed in our mid-year outlook. However, the transitionhas been volatile and will take longer than we originally anticipated. The demand sideof the economy is still positive, and consumer and corporate spending should remainat above-trend levels as the Covid crisis abates; demand levels for services improve;and companies rebuild inventories, expand capacity, and improve productivity.
This change in the economic cycle and growth drivers should result in positive equityreturns over the next 12 to 18 months but at more muted levels than the prior annualperiod. This investment regime change in the short term should indicate marketleadership transitioning away from higher-risk equities (in both cyclical and growthareas) toward companies with higher return on capital, improved margins and less-volatile earnings. Third- and fourth-quarter 2021 earnings will highlight the severityof many of the issues described above, and the equity market may be volatile duringthis time. Once the market gets past these near-term issues, we expect better progresstoward a more normalized environment in 2022.
SECTOR WEIGHTINGS
Information Technology 28.4%
Consumer Discretionary 14.2
Financials 12.4
Health Care 11.5
Communication Services 9.5
Industrials 7.7
Consumer Staples 5.6
Energy 4.0
Materials 2.8
Utilities 2.3
Real Estate 0.9
Other 0.3
Sector weightings are subject to change daily andare calculated as a percentage of net assets. Thetable excludes cash or cash equivalents, anygovernment/sovereign bonds or broad basedindex hedging securities the Fund may hold.

CALAMOS OPEN-END FAMILY OF FUNDS ANNUAL REPORT44
Calamos Dividend Growth Fund
AVERAGE ANNUAL TOTAL RETURN† AS OF 10/31/21
1 5 SINCEYEAR YEARS INCEPTION
Class A Shares – Inception 8/5/2013Without Sales Charge 42.42% 18.04% 12.18%With Sales Charge 35.66 16.89 11.52
Class C Shares – Inception 8/5/2013Without Sales Charge 41.37 17.16 11.35With Sales Charge 40.37 17.16 11.35
Class I Shares – Inception 8/5/2013 42.73 18.34 12.46
Performance data quoted represents past performance, which is no guarantee of future results.Current performance may be lower or higher than the performance quoted. The principal value andinvestment return of an investment will fluctuate so that your shares, when redeemed, may be worthmore or less than their original cost.
As of the prospectus dated 3/1/21, the Fund’s gross expense ratio for Class A shares is 2.16%, Class Cshares is 2.92% and Class I shares is 1.89%. The Fund’s Investment Adviser has contractually agreedto reimburse Fund expenses through 3/1/23 to the extent necessary so that Total Annual FundOperating Expenses (excluding taxes, interest, short interest, short dividend expenses, brokeragecommissions, acquired fund fees and expenses and extraordinary expenses, if any) of Class A, Class Cand Class I shares are limited to 1.35%, 2.10%,1.10% of average net assets, respectively. CalamosAdvisors may recapture previously waived expense amounts within the same fiscal year for any daywhere the respective Fund’s expense ratio falls below the contractual expense limit up to the expenselimit for that day. This undertaking is binding on Calamos Advisors and any of its successors andassigns. This agreement is not terminable by either party. The expense ratios shown above may differfrom the more recent expense ratios reported in the Financial Highlights section of this report.† Average annual total return measures net investment income and capital gain or loss from portfolio investments
as an annualized average assuming reinvestment of dividends and capital gains distributions. Performance shownreflects the effects of an expense reimbursement that improved results. Load-adjusted returns are adjusted for themaximum frontend sales load of 4.75% for Class A shares. Returns for Class C shares have been adjusted for thecontingent deferred sales charge (CDSC).
NOTES:The graph does not reflect the income taxes that you would pay on fund distributions or the redemption of fundshares. Fund performance includes reinvestment of dividends and adjustment for the maximum sales charge forClass A shares. The performance of other classes will vary from the performance of the class shown based on thedifference in sales charges and fees paid by shareholders investing in different share classes.
The S&P 500 Index is an unmanaged index generally considered representative of the US stock market.
Index returns assume reinvestment of dividends and do not reflect deduction of fees and expenses. It is not possibleto invest directly in an index.
GROWTH OF $1,000,000: SINCE INCEPTION (8/05/13) THROUGH 10/31/21
$2,632,455
$3,212,929
Calamos Dividend Growth Fund (I shares at NAV) S&P 500 Index
8/05/13 10/31/2110/31/20$0
$500,000
$1,500,000
$3,500,000
$3,000,000
$2,500,000
$2,000,000
$1,000,000
10/31/1510/31/1410/31/13 10/31/16 10/31/17 10/31/18 10/31/19

45www.calamos.com
Calamos Select Fund
CALAMOS SELECT FUNDINVESTMENT TEAM DISCUSSION
How has the Fund performed?For the 12 months ended October 31, 2021 (“annual period”), Calamos Select Fundreturned 44.28% (Class I shares at net asset value), outperforming the S&P 500 Indexreturn of 42.91%.
What factors influenced performance during the annual period?As indicated by the performance figures, the US equity markets and risk markets ingeneral enjoyed a very strong annual period. Companies reaped record corporateearnings as businesses benefited from a reopening economy, stimulative policy andstrong consumer spending. Markets started the period with a strong move upward,as investor enthusiasm was buoyed by positive data on Covid vaccine efficacy and theprospect of vaccines rolling out in early 2021. Initially, markets favored reopeningtrades, recognizing businesses that had the opportunity to rebound most from thenegative impacts of the economic and social shutdowns, notably in travel, leisure, andrestaurants as well as the energy and financials sectors more broadly. Near the middleof the period, secular growth businesses caught favor as investors turned theirattention back to businesses that might be able to generate high and sustainablegrowth without relying on a reopening economy.
The Fund benefitted by increasing its allocation to cyclical growth names earlier in theannual period, and then shifting more investment toward secular growth later in theperiod. For the annual period, growth stocks and value stocks had similar returns, asthe S&P 500 Growth Index returned of 45.07% compared with the S&P 500 ValueIndex return of 41.01%, but the path to that performance was quite different betweenthe two styles. The more cyclically oriented value index had accumulated a 37% returnduring the first seven months of the annual period as cyclical and reopening stockswere in favor, whereas the growth index was up “only” 23% during that time. Thegrowth index then took over leadership, outperforming the value index by 15% duringthe last five months of the annual period. Rotations and changes in market leadershipare typically thought of as healthy indicators of a rising market.
Within the S&P 500 Index, the smaller energy sector (less than 3% of the index onaverage over the course of the reporting period) led the market with a 112% gain.Financials (+73%), information technology (+47%), and real estate at (+46%) also alloutperformed the benchmark. Communication services (+42%), industrials (+40%),materials (+37%), consumer discretionary (+37%), health care (+34%), consumerstaples (+19%), and utilities (+11%) each lagged the benchmark’s performance.
On the whole, stock selection was additive to relative performance over the course ofthe annual period, as the Fund outperformed the S&P 500 Index. Sector allocationsfor the Fund were a detractor largely due to an underweight to the small, yet strongperforming energy sector.
Specifically, the Fund benefitted from strong stock selection within the financials sectoras well as an overweight to the strongly performing sector. Although financials wasthe second leading sector within the benchmark, Fund selections significantly
OVERVIEWThe Fund primarily invests in aconcentrated portfolio of large-cap USequities with broad representation acrosssectors and industries. In addition, theFund can invest across investment stylesin the US equity market.
KEY FEATURESn Security selection is based mainly on
Calamos analysts’ highest convictionideas. We leverage the collectiveexpertise of the firm’s researchanalysts, who average 15+ years ofexperience in their areas of expertise.
n The investment process is driven byrigorous fundamental and sector-specific research. The goal is tomaximize exposure to opportunitiesthe team believes are compelling.
n Quantitative tools help minimizesystematic risks across both sectors andfactors. We use quantitative tools tominimize unintended bets and maximizethe impact of security selection.
PORTFOLIO FITBecause the Fund pairs a high-convictionapproach with a broad investmentuniverse, we believe it is an attractivechoice for investors seeking a long-termcore equity allocation to US stocks.
FUND NASDAQ SYMBOLS
A Shares CVAAX
C Shares CVACX
I Shares CVAIX
FUND CUSIP NUMBERS
A Shares 128119666
C Shares 128119641
I Shares 128119633
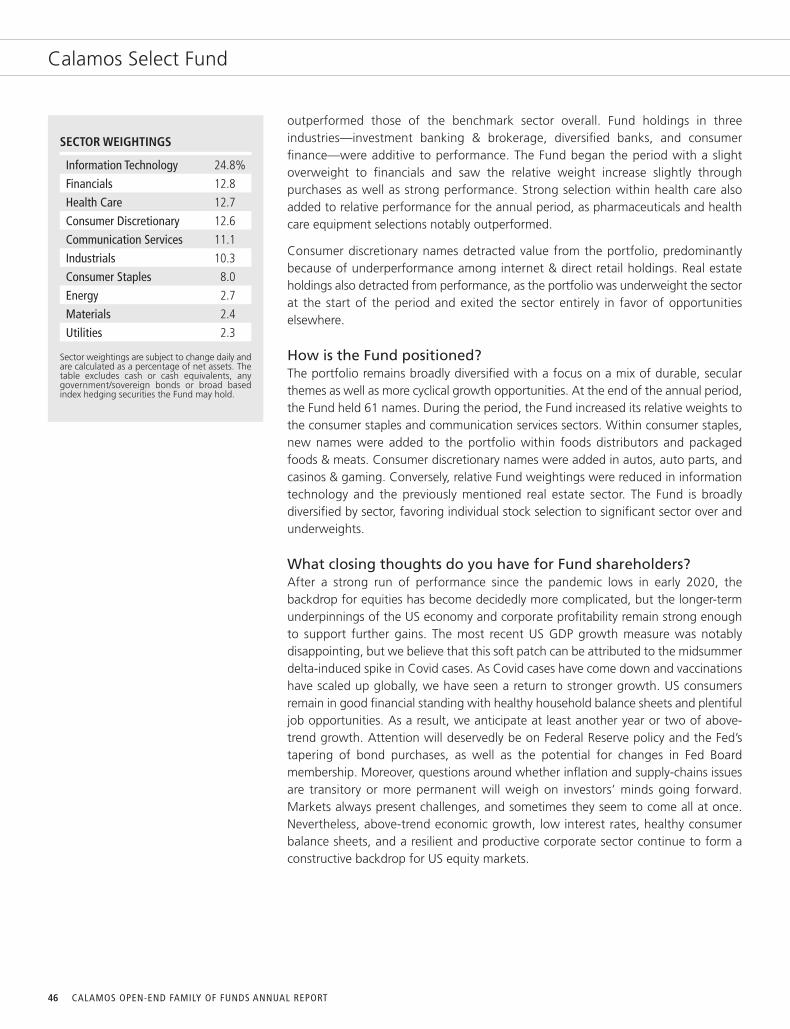
CALAMOS OPEN-END FAMILY OF FUNDS ANNUAL REPORT46
Calamos Select Fund
outperformed those of the benchmark sector overall. Fund holdings in threeindustries—investment banking & brokerage, diversified banks, and consumerfinance—were additive to performance. The Fund began the period with a slightoverweight to financials and saw the relative weight increase slightly throughpurchases as well as strong performance. Strong selection within health care alsoadded to relative performance for the annual period, as pharmaceuticals and healthcare equipment selections notably outperformed.
Consumer discretionary names detracted value from the portfolio, predominantlybecause of underperformance among internet & direct retail holdings. Real estateholdings also detracted from performance, as the portfolio was underweight the sectorat the start of the period and exited the sector entirely in favor of opportunitieselsewhere.
How is the Fund positioned?The portfolio remains broadly diversified with a focus on a mix of durable, secularthemes as well as more cyclical growth opportunities. At the end of the annual period,the Fund held 61 names. During the period, the Fund increased its relative weights tothe consumer staples and communication services sectors. Within consumer staples,new names were added to the portfolio within foods distributors and packagedfoods & meats. Consumer discretionary names were added in autos, auto parts, andcasinos & gaming. Conversely, relative Fund weightings were reduced in informationtechnology and the previously mentioned real estate sector. The Fund is broadlydiversified by sector, favoring individual stock selection to significant sector over andunderweights.
What closing thoughts do you have for Fund shareholders?After a strong run of performance since the pandemic lows in early 2020, thebackdrop for equities has become decidedly more complicated, but the longer-termunderpinnings of the US economy and corporate profitability remain strong enoughto support further gains. The most recent US GDP growth measure was notablydisappointing, but we believe that this soft patch can be attributed to the midsummerdelta-induced spike in Covid cases. As Covid cases have come down and vaccinationshave scaled up globally, we have seen a return to stronger growth. US consumersremain in good financial standing with healthy household balance sheets and plentifuljob opportunities. As a result, we anticipate at least another year or two of above-trend growth. Attention will deservedly be on Federal Reserve policy and the Fed’stapering of bond purchases, as well as the potential for changes in Fed Boardmembership. Moreover, questions around whether inflation and supply-chains issuesare transitory or more permanent will weigh on investors’ minds going forward.Markets always present challenges, and sometimes they seem to come all at once.Nevertheless, above-trend economic growth, low interest rates, healthy consumerbalance sheets, and a resilient and productive corporate sector continue to form aconstructive backdrop for US equity markets.
SECTOR WEIGHTINGS
Information Technology 24.8%
Financials 12.8
Health Care 12.7
Consumer Discretionary 12.6
Communication Services 11.1
Industrials 10.3
Consumer Staples 8.0
Energy 2.7
Materials 2.4
Utilities 2.3
Sector weightings are subject to change daily andare calculated as a percentage of net assets. Thetable excludes cash or cash equivalents, anygovernment/sovereign bonds or broad basedindex hedging securities the Fund may hold.
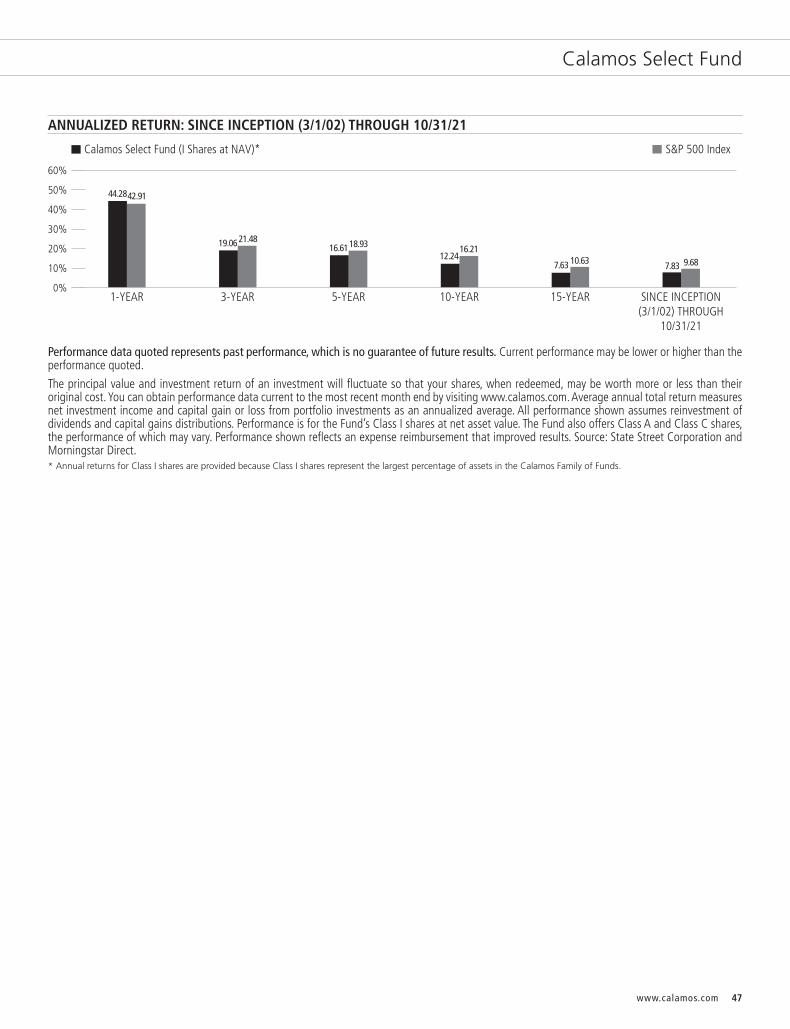
47www.calamos.com
Calamos Select Fund
ANNUALIZED RETURN: SINCE INCEPTION (3/1/02) THROUGH 10/31/21
Performance data quoted represents past performance, which is no guarantee of future results. Current performance may be lower or higher than theperformance quoted.
The principal value and investment return of an investment will fluctuate so that your shares, when redeemed, may be worth more or less than theiroriginal cost. You can obtain performance data current to the most recent month end by visiting www.calamos.com. Average annual total return measuresnet investment income and capital gain or loss from portfolio investments as an annualized average. All performance shown assumes reinvestment ofdividends and capital gains distributions. Performance is for the Fund’s Class I shares at net asset value. The Fund also offers Class A and Class C shares,the performance of which may vary. Performance shown reflects an expense reimbursement that improved results. Source: State Street Corporation andMorningstar Direct.* Annual returns for Class I shares are provided because Class I shares represent the largest percentage of assets in the Calamos Family of Funds.
S&P 500 IndexCalamos Select Fund (I Shares at NAV)*
12.2416.21
7.63 10.63 7.83 9.68
42.9144.28
21.4819.06 16.6118.93
60%
10%
20%
30%
40%
50%
0%1-YEAR 3-YEAR 5-YEAR 10-YEAR 15-YEAR SINCE INCEPTION
(3/1/02) THROUGH10/31/21

CALAMOS OPEN-END FAMILY OF FUNDS ANNUAL REPORT48
Calamos Select Fund
AVERAGE ANNUAL TOTAL RETURN† AS OF 10/31/21
1 5 10 YEAR YEARS YEARS
Class A Shares – Inception 1/2/02Without Sales Charge 43.93% 16.32% 11.97%With Sales Charge 37.14 15.19 11.43
Class C Shares – Inception 1/2/02Without Sales Charge 42.92 15.46 11.14With Sales Charge 41.92 15.46 11.14
Class I Shares – Inception 3/1/02 44.28 16.61 12.24
Performance data quoted represents past performance, which is no guarantee of future results.Current performance may be lower or higher than the performance quoted. The principal value andinvestment return of an investment will fluctuate so that your shares, when redeemed, may be worthmore or less than their original cost.
As of the prospectus dated 3/1/21, the Fund’s gross expense ratio for Class A shares is 1.64%, Class Cshares is 2.40% and Class I shares is 1.39%. The Fund’s investment adviser has contractually agreedto reimburse Fund expenses through March 1, 2023, to the extent necessary so that Total AnnualFund Operating Expenses (excluding taxes, interest, short interest, short dividend expenses, brokeragecommissions, acquired fund fees and expenses, and extraordinary expenses, if any) of Class A, ClassC, and Class I are limited to 1.15%, 1.90%, and 0.90% of average net assets, respectively. CalamosAdvisors may recapture previously waived expense amounts within the same fiscal year for any daywhere the respective Fund’s expense ratio falls below the contractual expense limit up to the expenselimit for that day. This undertaking is binding on Calamos Advisors and any of its successors andassigns. This agreement is not terminable by either party. The expense ratios shown above may differfrom the more recent expense ratios reported in the Financial Highlights section of this report.† Average annual total return measures net investment income and capital gain or loss from portfolio investments
as an annualized average assuming reinvestment of dividends and capital gains distributions. Performance shownreflects the effects of an expense reimbursement that improved results. Load-adjusted returns are adjusted for themaximum front-end sales load of 4.75% for Class A shares and returns for Class C shares have been adjusted forthe contingent deferred sales charge (CDSC).
NOTES:The graphs do not reflect the income taxes that you would pay on fund distributions or the redemption of fundshares. Fund performance includes reinvestment of dividends and adjustment for the maximum sales charge forClass A shares. The performance of other classes will vary from the performance of the class shown based on thedifference in sales charges and fees paid by shareholders investing in different share classes.
The S&P 500 Index is an unmanaged index generally considered representative of the US stock market.
Index returns assume reinvestment of dividends and do not reflect deduction of fees and expenses. It is not possibleto invest directly in an index.
GROWTH OF $1,000,000: FOR THE 10-YEAR PERIOD ENDED 10/31/21
$4,493,872
$3,173,900
Calamos Select Fund (I shares at NAV) S&P 500 Index
10/31/11 10/31/12 10/31/13 10/31/14 10/31/15 10/31/16 10/31/17 10/31/18 10/31/20 10/31/2110/31/19$0
$1,000,000
$3,000,000
$5,000,000
$4,000,000
$2,000,000

49www.calamos.com
Calamos International Growth Fund
OVERVIEWThe Fund offers a dynamic approach toaccessing international growthopportunities. We apply our activeinvestment approach to build a portfolioof companies with superior growth andquality attributes across developed andemerging market.
KEY FEATURESn Identifies companies with compelling
growth, competitive advantages andfinancial strength.
n Identifies durable secular themes thatprovide a tailwind for sustainablegrowth and a franchise premium.
n Investment universe spans geographiesand market caps, providing a widebreadth of opportunities.
n Takes environmental, social andgovernance (ESG) factors into account,evaluating the effects on a company’srisk profile, cash flow and long-termreturns.
PORTFOLIO FITAs an active, true growth offering with adifferentiated return profile, the Fund canpotentially help investors optimize capitalappreciation within their internationalallocation.
FUND NASDAQ SYMBOLS
A Shares CIGRX
C Shares CIGCX
I Shares CIGIX
R6 Shares CIGOX
FUND CUSIP NUMBERS
A Shares 128119575
C Shares 128119559
I Shares 128119542
R6 Shares 128120425
CALAMOS INTERNATIONAL GROWTH FUNDINVESTMENT TEAM DISCUSSION
How has the Fund performed?For the 12 months ended October 31, 2021 (“annual period”), Calamos InternationalGrowth Fund returned 33.13% (Class I shares at net asset value) versus a 30.38%gain for the MSCI EAFE Growth Index. The Fund’s one-year return was in the top 20thpercentile of the Morningstar Foreign Large Growth category*, reflecting the benefitof our active investment approach. The Fund navigated highly rotational marketsduring the Covid recovery phase and captured leading returns in international stocksover the period.
Since its inception on March 17, 2005, the Fund has returned 9.46% on an annualizedbasis (Class I shares at net asset value) compared with a 7.41% return for the MSCIEAFE Growth Index. We believe this long-term record demonstrates the Fund’s abilityto generate excess returns in international growth equities over complete marketcycles.
What factors influenced performance during the reportingperiod?International equities advanced over the annual period as markets reflected theeconomic recovery and Covid vaccination progress, while also confronting the impactof supply chain disruptions and rising inflation. The Fund generated strong returnsover the annual period due to a combination of favorable top-down positioning andrelative security selection.
Fund positioning benefited from a relative overweight in developed markets, includingEurope, and a blend of secular growth and more cyclical opportunities. From a bottom-up perspective, many of the Fund’s holdings in companies with advantaged businessmodels, effective pricing power and growing market share performed well over theannual period.
The Fund’s average overweight position and leading security selection in informationtechnology positively contributed to relative performance. Our holdings insemiconductor equipment and application software notably propelled relative returns.Favorable security selection and an average overweight position in financials alsoadded to the Fund’s performance, especially in the diversified banks and regional banksindustries.
Over the annual period, selection within the consumer discretionary sector held backrelative results, as holdings in the internet & direct marketing retail industry andapparel, accessories & luxury goods industry curbed return. Security selection and anaverage underweight position in industrials, specifically in the trading companies &distributors and building products industries, also hurt relative results.
* Data is as of 10/31/21. Morningstar category percentile ranking is based on annualized total return forthe 1-year, 3-year, 5-year and 10-year periods. In the Morningstar Foreign Large Growth category, CalamosInternational Growth Fund Class I shares were in the 20th, 11th, 13th and 37th percentiles of 447, 385,326 and 223 funds for the 1-year, 3-year, 5-year and 10-year periods, respectively.

50 CALAMOS OPEN-END FAMILY OF FUNDS ANNUAL REPORT
Calamos International Growth Fund
SECTOR WEIGHTINGS
Information Technology 25.1%
Consumer Discretionary 17.5
Industrials 14.4
Financials 13.4
Health Care 10.4
Communication Services 5.9
Materials 5.3
Energy 3.2
Consumer Staples 2.5
Real Estate 1.1
Sector weightings are subject to change daily andare calculated as a percentage of net assets. Thetable excludes cash or cash equivalents, anygovernment/sovereign bonds or broad basedindex hedging securities the Fund may hold.
From a regional standpoint, the Fund’s overweight allocation and security selection inthe United States aided results. Similarly, an underweight stance and security selectionin Japan added value to Fund performance.
Conversely, an overweight allocation in Emerging Asia lagged on a relative basis.Specifically, positions in China and South Korea held back relative performance.Moreover, an overweight stance and selection in Emerging Latin America dampenedresults. In particular, our holdings in Brazil and Argentina represented detractors.
How is the Fund positioned?The Fund’s regional and country positioning reflects the combined inputs from ourtop-down global framework and our bottom-up security analysis. Our investment teamevaluates macroeconomic factors and growth opportunities and actively integratesthese into the investment decision-making process.
We have positioned the portfolio with a combination of secular-growth companiesand increased cyclical opportunities whose economically sensitive businesses arepositioned to benefit from more synchronized global growth in the quarters ahead.
Technology, consumer discretionary, industrials and financials are the largest sectorweights in the Fund. We hold key industry positions in semiconductors, diversifiedbanks, apparel & luxury goods, industrial machinery, and health care supplies. We havean underweight stance in more defensive areas including utilities, real estate, consumerstaples and more traditional telecoms.
From a geographic perspective, we own diversified holdings in Europe, investing in ablend of end markets and business types. Positioning is largely in global seculardemand areas and in cyclical opportunities leveraged to the next stages of theeconomic recovery and expansion. In Japan, we hold a set of higher-quality companieswith leading business models that are positioned to benefit from rising global demandas the recovery broadens in the months ahead. Within emerging markets, we alsohold a blend of secular growth and more cyclical businesses that are well positionedto take advantage of reopening opportunities. We own positions in key demand areassuch as semiconductors, interactive media & services, branded apparel, life sciencestools, and higher-quality financials.
What closing thoughts do you have for Fund shareholders?International stocks continue to navigate a range of shifting crosscurrents. We areanalyzing the global economic recovery, alongside policy actions and the path ofcorporate earnings. Global monetary policy remains supportive overall, thoughmultiple central banks have edged toward a less-accommodative stance. We see manyopportunities in international markets, reflective of strong earnings, reasonablevaluations, and substantial progress in vaccinations. Despite these potential tailwinds,we are mindful that markets will experience volatility and we remain closely attunedto risks.
From a thematic and sector perspective, we see opportunities in technology, consumerdiscretionary, industrials, health care and financials with competitive advantages thattarget critical demand areas. Our active investment approach and long-termperspective positions us to take advantage of opportunities in foreign markets.

51www.calamos.com
Calamos International Growth Fund
ANNUALIZED RETURN: SINCE INCEPTION (3/16/05) THROUGH 10/31/21
Performance data quoted represents past performance, which is no guarantee of future results. Current performance may be lower or higher than theperformance quoted.
The principal value and investment return of an investment will fluctuate so that your shares, when redeemed, may be worth more or less than theiroriginal cost. You can obtain performance data current to the most recent month end by visiting www.calamos.com. Average annual total return measuresnet investment income and capital gain or loss from portfolio investments as an annualized average. All performance shown assumes reinvestment ofdividends and capital gains distributions. Performance is for the Fund’s Class I shares at net asset value. The Fund also offers Class A, Class C and Class R6shares, the performance of which may vary. Source: State Street Corporation and Morningstar Direct.* Annual returns for Class I shares are provided because Class I shares represent the largest percentage of assets in the Calamos Family of Funds.
MSCI ACWI ex US IndexMSCI EAFE Growth IndexCalamos International Growth Fund(I Shares at NAV)*
9.917.15 8.37
4.74
9.466.15
30.2230.38
17.2313.53
9.756.20 7.20
33.13
24.55
12.5217.02
10.28
40%
30%
20%
10%
0%1-YEAR 3-YEAR 5-YEAR 10-YEAR 15-YEAR SINCE INCEPTION
(3/16/05) THROUGH10/31/21

52 CALAMOS OPEN-END FAMILY OF FUNDS ANNUAL REPORT
Calamos International Growth Fund
AVERAGE ANNUAL TOTAL RETURN† AS OF 10/31/21
10 YEARS OR
1 5 ^SINCE YEAR YEARS INCEPTION
Class A Shares – Inception 3/16/05Without Sales Charge 32.76% 16.72% 9.63%With Sales Charge 26.43 15.59 9.10
Class C Shares – Inception 3/16/05Without Sales Charge 31.79 15.86 8.82With Sales Charge 30.79 15.86 8.82
Class I Shares – Inception 3/16/05 33.13 17.02 9.91Class R6 Shares – Inception 9/17/18^ 33.24 19.20
Performance data quoted represents past performance, which is no guarantee of future results.Current performance may be lower or higher than the performance quoted. The principal value andinvestment return of an investment will fluctuate so that your shares, when redeemed, may be worthmore or less than their original cost.As of the prospectus dated 3/1/21, the Fund’s gross expense ratio for Class A shares is 1.52%, Class Cshares is 2.27%, Class I shares is 1.28% and Class R6 shares is 1.17%. The Fund’s investment adviserhas contractually agreed to reimburse Fund expenses through March 1, 2023 to the extent necessary sothat Total Annual Fund Operating Expenses (excluding taxes, interest, short interest, short dividendexpenses, brokerage commissions, acquired fund fees and expenses, and extraordinary expenses, if any)of Class A, Class C, and Class I are limited to 1.10%, 1.85%, and 0.85% of average net assets, respectively.The Fund’s investment adviser has contractually agreed to limit the Fund’s annual ordinary operatingexpenses for Class R6 shares (as a percentage of average net assets) to 0.85% less the annual sub-transfer agency ratio for the Fund. The annual sub-transfer agency ratio is equal to the aggregatesub-transfer agency expenses common to the other share classes of the Fund divided by the aggregateaverage annual net assets of the Fund’s other share classes. For purposes of these expense limitations,operating expenses do not include taxes, interest, short interest, short dividend expenses, all commissionsand other normal charges incident to the purchase and sale of portfolio securities, and extraordinaryexpenses, if any. Calamos Advisors may recapture previously waived expense amounts within the samefiscal year for any day where the respective Fund’s expense ratio falls below the contractual expense limitup to the expense limit for that day. This undertaking is binding on Calamos Advisors and any of itssuccessors and assigns. This agreement is not terminable by either party. The expense ratios shown abovemay differ from the more recent expense ratios reported in the Financial Highlights section of this report.† Average annual total return measures net investment income and capital gain or loss from portfolio investments
as an annualized average assuming reinvestment of dividends and capital gains distributions. Performance shownreflects the effects of an expense reimbursement that improved results. Load-adjusted returns are adjusted for themaximum front-end sales load of 4.75% for Class A shares and returns for Class C shares have been adjusted forthe contingent deferred sales charge (CDSC).
NOTES:The graphs do not reflect the income taxes that you would pay on fund distributions or the redemption of fund shares.Fund performance includes reinvestment of dividends and adjustment for the maximum sales charge for Class A shares.The performance of other classes will vary from the performance of the class shown based on the difference in salescharges and fees paid by shareholders investing in different share classes.The MSCI EAFE Growth Index measures developed market growth equity performance (excluding the US andCanada).The MSCI ACWI ex US Index represents the performance of large- and mid-cap stocks across developed and emergingmarkets excluding the United States. The MSCI ACWI ex US Index is provided to show how the Fund’s performancecompares with the returns of an index of securities similar to those in which the Fund invests.Index returns assume reinvestment of dividends and do not reflect deduction of fees and expenses. It is not possibleto invest directly in an index.The Fund’s use of derivative instruments involves investment risks and transaction costs to which the Fund wouldnot be subject absent the use of these instruments and, accordingly, may result in losses greater than if they had notbeen used. Derivative instruments can be illiquid, may disproportionately increase losses and may have a potentiallylarge impact on Fund performance.
GROWTH OF $1,000,000: FOR THE 10-YEAR PERIOD ENDED 10/31/21
$2,535,825
$2,572,979
$1,995,275
Calamos International Growth Fund (I shares at NAV) MSCI ACWI ex US IndexMSCI EAFE Growth Index
10/31/11 10/31/12 10/31/13 10/31/14 10/31/15 10/31/16 10/31/17 10/31/18 10/31/2010/31/19$0
$500,000
$1,000,000
$2,000,000
$3,000,000
$2,500,000
$1,500,000
10/31/21

53
Calamos Evolving World Growth Fund
www.calamos.com
OVERVIEWThe Fund offers an active, risk-managedstrategy to access growth opportunitiesin emerging markets. The Fund invests inemerging market-domiciled anddeveloped market-domiciled companieswith significant revenue exposuresattributable to emerging markets.
KEY FEATURESn Focuses on higher-quality companies
with compelling growth attributes.
n Conducts research across the capitalstructure and utilizes Calamos’experience in convertible securities todynamically manage the risk profile.
n Emphasizes countries enactingstructural reforms and improvingeconomic freedoms, which we believeenhances growth prospects andmitigates risk.
n Identifies durable secular themes thatprovide a tailwind for sustainablegrowth and a franchise premium.
PORTFOLIO FITBecause of its focus on risk management,the fund can serve as a long-termemerging-market allocation.
FUND NASDAQ SYMBOLS
A Shares CNWGX
C Shares CNWDX
I Shares CNWIX
FUND CUSIP NUMBERS
A Shares 128119161
C Shares 128119146
I Shares 128119138
CALAMOS EVOLVING WORLD GROWTH FUNDINVESTMENT TEAM DISCUSSION
How has the Fund performed?For the annual period ended October 31, 2021, Calamos Evolving World Growth Fundreturned 16.17% (Class I shares at net asset value), capturing most of the upside inemerging markets versus the 17.33% return for the MSCI Emerging Market Index.The Fund’s returns over the extended pandemic cycle reflected the benefit of our risk-managed investment approach, which was instrumental in dampening volatility andnavigating through highly rotational global markets.
Since its inception on August 15, 2008, the Fund has returned 7.16% on anannualized basis (Class I shares at net asset value) compared with a 4.26% return forthe MSCI Emerging Markets Index. We believe this demonstrates the Fund’s ability togenerate competitive long-term returns while pursuing an active, risk-managedapproach to emerging markets over multiple market cycles.
What factors influenced performance during the annual period?Emerging markets saw a choppy return environment over the annual period, reflectingmixed progress in economic recoveries and Covid vaccination numbers across regions,while also navigating the impact of supply-chain disruptions and rising inflation. TheFund’s attractive total return over the annual period was attributable to active riskmanagement tactics, including holdings in convertible bonds, which contributed to afavorable risk/reward profile and strong upside capture over the period. In addition,the Fund return benefited from favorable bottom-up security selection and top-downpositioning across sectors. Many of the Fund’s holdings in companies with advantagedbusiness models and secular demand tailwinds performed well amid a volatile andhighly rotational market environment.
From a sector perspective, the Fund added value in terms of sector positioning andsecurity selection. The Fund’s security selection in technology and communicationservices added value over the annual period due to a combination of resilient businessmodels and better growth prospects. Specifically, names in semiconductors andsemiconductor equipment were sources of strength in information technology, andholdings in the interactive home entertainment and movies & entertainment industriesespecially helped in communication services.
Over the annual period, an average underweight position and selection within theenergy sector detracted from relative results, as holdings in the oil & gas refining &marketing and integrated oil & gas industries underperformed. Security selection infinancials, specifically in the diversified banks and investment banking & brokerageindustries, also lagged on a relative basis.

54 CALAMOS OPEN-END FAMILY OF FUNDS ANNUAL REPORT
Calamos Evolving World Growth Fund
SECTOR WEIGHTINGS
Financials 26.7%
Information Technology 16.5
Consumer Discretionary 16.2
Communication Services 14.3
Industrials 6.2
Energy 5.1
Materials 5.0
Real Estate 3.7
Consumer Staples 3.6
Other 1.4
Health Care 1.1
Sector weightings are subject to change daily andare calculated as a percentage of net assets. Thetable excludes cash or cash equivalents, anygovernment/sovereign bonds or broad basedindex hedging securities the Fund may hold.
In terms of geographic returns, the Fund’s relative overweight in India and underweightin China over the annual period added value. The Fund’s security selection withinTaiwan and Mexico also contributed to returns, while the Fund’s holdings in Koreaand Russia trailed the index return.
How is the Fund positioned?We maintain a constructive view on opportunities in emerging markets. Our Fundpositioning favors a blend of secular growth and more cyclical businesses, withincreased opportunities in reopening beneficiaries. From a sector perspective, thelargest weights are in financials, consumer discretionary, technology andcommunication services. We own holdings within key demand areas includingsemiconductors, higher-quality financials, interactive media & services, brandedapparel, and internet retail. We hold a low weight or underweight in the consumerstaples and utilities sectors, reflecting our view of more attractive opportunities in thesectors noted above.
At the individual company level, we favor businesses with growth catalysts, attractivecapital efficiency and stronger balance sheets that are supported by solid competitivepositioning. In line with our process, we emphasize companies benefiting from secularthemes that provide a tailwind for sustainable growth into the future. From ageographic perspective, we favor investments in markets including India, Taiwan,Mexico, select names in China, and increased opportunities in Southeast Asia.
What closing thoughts do you have for Fund shareholders?Emerging markets continue to navigate a range of crosscurrents and highly disparateconditions depending on the region. We are analyzing many aspects of economicactivity, alongside key policy actions and corporate earnings. Global monetary policyremains supportive overall, while multiple central banks have edged toward a less-accommodative stance. We see opportunities in emerging markets, reflecting our viewof a more synchronized recovery ahead due to increasing vaccination numbers andimproving supply-chain dynamics. Despite these potential tailwinds, we are mindfulthat markets will experience volatility, and we remain closely attuned to risks.
We own a blend of investments in secular growth companies, more cyclicalopportunities leveraged to the global economy and select reopening businesses. Wefavor investments in companies with advantaged business models, flexible balancesheets, and the ability to compound growth over the medium to long term. From athematic and sector perspective, we see opportunities in consumer discretionary,communications services, higher quality financials, technology and cyclicals withcompetitive advantages that target in-demand areas. Our active investment approachand long-term perspective positions us to take advantage of the volatility andopportunities in emerging markets.

55www.calamos.com
ANNUALIZED RETURN: SINCE INCEPTION (8/15/08) THROUGH 10/31/21
Performance data quoted represents past performance, which is no guarantee of future results. Current performance may be lower or higher than theperformance quoted.
The principal value and investment return of an investment will fluctuate so that your shares, when redeemed, may be worth more or less than their?originalcost. You can obtain performance data current to the most recent month end by visiting www.calamos.com. Average annual total return measures netinvestment income and capital gain or loss from portfolio investments as an annualized average. All performance shown assumes reinvestment of dividendsand capital gains distributions. Performance is for the Fund’s Class I shares at net asset value. The Fund also offers Class A and Class C shares, theperformance of which may vary. Source: State Street Corporation and Morningstar Direct.* Annual returns for Class I shares are provided because Class I shares represent the largest percentage of assets in the Calamos Family of Funds.
MSCI Emerging Markets IndexCalamos Evolving World Growth Fund(I Shares at NAV)*
6.895.25
7.164.71
16.1717.33
22.50
12.69 13.85
9.79
30%
20%
10%
0%1-YEAR 3-YEAR 5-YEAR 10-YEAR SINCE INCEPTION
(8/15/08) THROUGH10/31/21
Calamos Evolving World Growth Fund

56 CALAMOS OPEN-END FAMILY OF FUNDS ANNUAL REPORT
Calamos Evolving World Growth Fund
AVERAGE ANNUAL TOTAL RETURN† AS OF 10/31/21
1 5 10 YEAR YEARS YEARS
Class A Shares – Inception 8/15/08Without Sales Charge 15.87% 13.57% 6.63%With Sales Charge 10.35 12.48 6.11
Class C Shares – Inception 8/15/08Without Sales Charge 15.05 12.71 5.83With Sales Charge 14.05 12.71 5.83
Class I Shares – Inception 8/15/08 16.17 13.85 6.89
Performance data quoted represents past performance, which is no guarantee of future results.Current performance may be lower or higher than the performance quoted. The principal value andinvestment return of an investment will fluctuate so that your shares, when redeemed, may be worthmore or less than their original cost.
As of the prospectus dated 3/1/21, the Fund’s gross expense ratio for Class A shares is 1.64%, Class Cshares is 2.39% and Class I shares is 1.39%. The Fund’s investment adviser has contractually agreedto reimburse Fund expenses through March 1, 2023 to the extent necessary so that Total AnnualFund Operating Expenses (excluding taxes, interest, short interest, short dividend expenses, brokeragecommissions, acquired fund fees and expenses, and extraordinary expenses, if any) of Class A, Class C,and Class I are limited to 1.30%, 2.05%, and 1.05% of average net assets, respectively. CalamosAdvisors may recapture previously waived expense amounts within the same fiscal year for any daywhere the respective Fund’s expense ratio falls below the contractual expense limit up to the expenselimit for that day. This undertaking is binding on Calamos Advisors and any of its successors andassigns. This agreement is not terminable by either party. The expense ratios shown above may differfrom the more recent expense ratios reported in the Financial Highlights section of this report.† Average annual total return measures net investment income and capital gain or loss from portfolio investments
as an annualized average assuming reinvestment of dividends and capital gains distributions. Performance shownreflects the effects of an expense reimbursement that improved results. Load-adjusted returns are adjusted for themaximum front-end sales load of 4.75% for Class A shares and returns for Class C shares have been adjusted forthe contingent deferred sales charge (CDSC).
NOTES:The graph does not reflect the income taxes that you would pay on fund distributions or the redemption of fundshares. Fund performance includes reinvestment of dividends and adjustment for the maximum sales charge forClass A shares. The performance of other classes will vary from the performance of the class shown based on thedifference in sales charges and fees paid by shareholders investing in different share classes.
The MSCI Emerging Markets Index is a free float-adjusted market capitalization index considered broadlyrepresentative of emerging market equity performance. The index represents companies within the constituentemerging markets that are available to investors worldwide. The index is calculated on a total return basis, whichincludes reinvestment of gross dividends before deduction of withholding taxes.
Index returns assume reinvestment of dividends and do not reflect deduction of fees and expenses. It is not possibleto invest directly in an index.
The Fund’s use of derivative instruments involves investment risks and transaction costs to which the Fund wouldnot be subject absent the use of these instruments and, accordingly, may result in losses greater than if they had notbeen used. Derivative instruments can be illiquid, may disproportionately increase losses and may have a potentiallylarge impact on Fund performance.
GROWTH OF $1,000,000: FOR THE 10-YEAR PERIOD ENDED 10/31/21
$1,667,908
$1,947,372
Calamos Evolving World Growth Fund (I shares at NAV) MSCI Emerging Markets Index
$0
$500,000
$1,500,000
$2,500,000
$2,000,000
$1,000,000
10/31/11 10/31/12 10/31/13 10/31/14 10/31/15 10/31/16 10/31/17 10/31/18 10/31/20 10/31/2110/31/19
57www.calamos.com
Calamos Global Equity Fund
OVERVIEWThe Fund invests in equities of companiesaround the globe. We seek firmsdemonstrating what we believe to be keygrowth characteristics, includingincreasing profit margins and highreturns on invested capital.
KEY FEATURESn Flexibly seeks growth globally,
searching for the best risk/rewardopportunities across countries, marketcapitalizations and sectors.
n Seeks global growth companies thatmay benefit from long-term secularthemes, including a burgeoning globalmiddle class and increasing demandfor information and entertainment.
PORTFOLIO FITThe Fund can serve as a growth-orientedaddition to a strategic global equityallocation and may complement orprovide an alternative to value orblended styles.
FUND NASDAQ SYMBOLS
A Shares CAGEX
C Shares CCGEX
I Shares CIGEX
R6 Shares CGEOX
FUND CUSIP NUMBERS
A Shares 128119484
C Shares 128119468
I Shares 128119450
R6 Shares 128120334
CALAMOS GLOBAL EQUITYINVESTMENT TEAM DISCUSSION
How has the Fund performed?For the 12 months ended October 31, 2021 (“annual period”), Calamos Global EquityFund returned 40.29% (Class I shares at net asset value) versus a 41.05% gain for theMSCI World Index and a 37.86% return for the MSCI ACWI Index. The Fund’s one-year return was in the top 15th percentile of the Morningstar World Large StockGrowth category*. The return reflected the benefit of our active investment approach,which was instrumental in adapting to highly rotational markets through the Covidmarket recovery and capturing the upside in global stocks over the annual period.
Since its inception on March 2, 2007, the Fund has returned 10.78% on an annualizedbasis (Class I shares at net asset value) compared with an 8.01% increase in the MSCIWorld Index and 7.64% return in the MSCI ACWI Index. We believe this demonstratesthe Fund’s ability to generate long-term excess returns over complete market cyclesand varied investment environments.
What factors influenced performance during the annual period?Global stocks advanced over the annual period as markets reflected the economicrecovery and Covid vaccination progress, while also confronting the impact of supply-chain disruptions and rising inflation. The Fund generated strong returns over theannual period due to a combination of leading security selection and favorable sectorpositioning. Many of the Fund’s holdings in global companies with advantagedbusiness models performed well, and the Fund’s positioning benefited from a blendof secular growth and more cyclical opportunities.
From a sector perspective, the Fund’s security selection and an average overweightposition in information technology helped drive relative returns. Specifically,semiconductors and semiconductor equipment bolstered relative results. An averageunderweight allocation in consumer staples also contributed to performance. Notably,soft drinks and our lack of representation in household products promoted return.
Over the annual period, security selection and an average overweight stance withinthe consumer discretionary sector dampened return, as holdings in the internet &direct marketing retail and automobile manufacturers industries hurt relativeperformance. Selection within the oil & gas, refining & marketing and integrated oil &gas industries of the energy sector also lagged.
From a geographic standpoint, the Fund’s security selection in the United States droverelative results. Favorable security selection in Europe also added value to Fundperformance. Specifically, holdings in the Netherlands and Luxembourg were leadingcontributors.
Conversely, the Fund’s overweight allocation in Emerging Asia dragged on return.Particularly, holdings in China and Australia hindered return. In addition, securityselection and an underweight stance in Canada weakened relative performance.
* Data is as of 10/31/21. Morningstar category percentile ranking is based on annualized total return forthe 1-year, 3-year, 5-year and 10-year periods. For the Morningstar World Large-Stock category, CalamosGlobal Equity Fund Class I shares were in the 15th, 24th, 31st and 58th percentiles of 354, 307, 262 and166 funds for the 1-year, 3-year, 5-year and 10-year periods, respectively.

58 CALAMOS OPEN-END FAMILY OF FUNDS ANNUAL REPORT
Calamos Global Equity Fund
SECTOR WEIGHTINGS
Information Technology 31.5%
Consumer Discretionary 15.5
Financials 13.3
Health Care 11.4
Communication Services 8.9
Industrials 7.2
Materials 4.8
Energy 2.7
Consumer Staples 2.3
Real Estate 1.3
Sector weightings are subject to change daily andare calculated as a percentage of net assets. Thetable excludes cash or cash equivalents, anygovernment/sovereign bonds or broad basedindex hedging securities the Fund may hold.
How is the Fund positioned?The Fund’s regional and country positioning reflects the combined inputs from ourtop-down global framework and our bottom-up security analysis. Our investment teamevaluates macroeconomic factors and growth opportunities, and actively integratesthem into the investment decision-making process. We have positioned the Fund witha combination of secular growth leaders and increased cyclical exposures in moreeconomically sensitive and reopening opportunities. Technology, consumerdiscretionary, financials, health care and communication services are the largest sectorweights in the Fund. We hold key industry positions in semiconductors, diversifiedbanks, internet retail, interactive media & services, systems software, and life sciencestools. We hold selective weight in materials and energy, with holdings in companiespositioned to benefit from strong global demand and higher commodity prices. Weare underweight to more defensive sectors including utilities, real estate, consumerstaples and traditional telecoms, given the unattractive relative valuations and growthpotential.
Through a geographic lens, we own a set of secular growth businesses and cyclicalopportunities in the United States with its positive economic backdrop and wider setof opportunities. In Europe, we own a diversified set of holdings with a blend of endmarkets and business types. Positioning is largely in global secular demand areas andcyclical opportunities leveraged to a recovery. We have a relatively even-weight positionin Japan. We own several high-quality companies with leading business models thatare positioned to benefit from rising global demand. We own positions in emergingmarkets within key demand areas such as semiconductors, branded apparel, healthcare and higher-quality banks.
What closing thoughts do you have for Fund shareholders?Global stocks continue to navigate a range of shifting crosscurrents. We are analyzingthe global recovery and many aspects of economic activity, alongside policy actionsand the path of corporate earnings. Global monetary policy remains supportive overall,while multiple central banks have edged toward a less-accommodative stance. Wesee many opportunities in global stocks, reflective of strong earnings and substantialprogress in global vaccine rollouts and reopenings. Despite these potential tailwinds,we are mindful that markets will experience volatility, and we remain closely attunedto risks.
From a thematic and sector perspective, we see opportunities in technology, consumerdiscretionary, financials, and health care with competitive advantages that targetcritical demand areas. Our active investment approach and long-term perspectivepositions us to take advantage of the volatility and opportunities in global markets.

Calamos Global Equity Fund
59www.calamos.com
ANNUALIZED RETURN: SINCE INCEPTION (3/1/07) THROUGH 10/31/21
Performance data quoted represents past performance, which is no guarantee of future results. Current performance may be lower or higher than theperformance quoted.
The principal value and investment return of an investment will fluctuate so that your shares, when redeemed, may be worth more or less than theiroriginal cost. You can obtain performance data current to the most recent month end by visiting www.calamos.com. Average annual total return measuresnet investment income and capital gain or loss from portfolio investments as an annualized average. All performance shown assumes reinvestment ofdividends and capital gains distributions. Performance is for the Fund’s Class I shares at net asset value. The Fund also offers Class A, Class C andClass R6 shares, the performance of which may vary. Source: State Street Corporation and Morningstar Direct.* Annual returns for Class I shares are provided because Class I shares represent the largest percentage of assets in the Calamos Family of Funds.
MSCI ACWI IndexMSCI World IndexCalamos Global Equity Fund(I Shares at NAV)*
13.23 11.91 10.787.64
18.8216.06
12.818.01
40.29 41.0537.86
26.47
18.06 20.0315.31
50%
30%
40%
20%
10%
0%1-YEAR 3-YEAR 5-YEAR 10-YEAR SINCE INCEPTION
(3/1/07) THROUGH10/31/21

60 CALAMOS OPEN-END FAMILY OF FUNDS ANNUAL REPORT
Calamos Global Equity Fund
AVERAGE ANNUAL TOTAL RETURN† AS OF 10/31/21
10YEARS OR
1 5 ^SINCE YEAR YEARS INCEPTION
Class A Shares – Inception 3/1/07Without Sales Charge 39.89% 19.71% 12.95%With Sales Charge 33.25 18.54 12.40
Class C Shares – Inception 3/1/07Without Sales Charge 38.88 18.83 12.11With Sales Charge 37.88 18.83 12.11
Class I Shares – Inception 3/1/07 40.29 20.03 13.23
Class R6 Shares – Inception 6/23/20^ 40.36 38.32
Performance data quoted represents past performance, which is no guarantee of future results.Current performance may be lower or higher than the performance quoted. The principal value andinvestment return of an investment will fluctuate so that your shares, when redeemed, may be worthmore or less than their original cost.
As of the prospectus dated 3/1/21, the Fund’s gross expense ratio for Class A shares is 1.65%, Class Cshares is 2.40%, Class I shares is 1.40% and Class R6 shares 1.34%. The Fund’s investment adviserhas contractually agreed to reimburse Fund expenses through March 1, 2023 to the extent necessaryso that Total Annual Fund Operating Expenses (excluding taxes, interest, short interest, short dividendexpenses, brokerage commissions, acquired fund fees and expenses, and extraordinary expenses, ifany) of Class A, Class C, and Class I are limited to 1.40%, 2.15%, and 1.15% of average net assets,respectively. The Fund’s investment advisor has contractually agreed to limit the Fund’s annual ordinaryoperating expenses for Class R6 shares (as a percentage of average net assets) to 1.15% less theannual sub-transfer agency ratio for the Fund. The annual sub-transfer agency ratio is equal to theaggregate sub-transfer agency expenses common to the other share classes of the Fund divided bythe aggregate average annual net assets of the Fund’s other share classes. For purposes of thisexpense limitation, operating expenses do not include taxes, interest, short interest, short dividendexpenses, brokerage commissions, acquired fund fees and expenses, and extraordinary expenses, ifany. Calamos Advisors may recapture previously waived expense amounts within the same fiscal yearfor any day where the respective Fund’s expense ratio falls below the contractual expense limit up tothe expense limit for that day. This undertaking is binding on Calamos Advisors and any of itssuccessors and assigns. This agreement is not terminable by either party. The expense ratios shownabove may differ from the more recent expense ratios reported in the Financial Highlights section ofthis report.† Average annual total return measures net investment income and capital gain or loss from portfolio investments
as an annualized average assuming reinvestment of dividends and capital gains distributions. Performance shownreflects the effects of an expense reimbursement that improved results. Load-adjusted returns are adjusted for themaximum front-end sales load of 4.75% for Class A shares and returns for Class C shares have been adjusted forthe contingent deferred sales charge (CDSC).
NOTES:The graph does not reflect the income taxes that you would pay on fund distributions or the redemption of fundshares. Fund performance includes reinvestment of dividends and adjustment for the maximum sales charge forClass A shares. The performance of other classes will vary from the performance of the class shown based on thedifference in sales charges and fees paid by shareholders investing in different share classes.
GROWTH OF $1,000,000: FOR THE 10-YEAR PERIOD ENDED 10/31/21
$3,338,119$3,081,523
Calamos Global Equity Fund (I shares at NAV) MSCI ACWI IndexMSCI World Index
10/31/11 10/31/12 10/31/13 10/31/14 10/31/15 10/31/16 10/31/17 10/31/18 10/31/20 10/31/2110/31/19$0
$1,000,000
$2,000,000
$4,000,000
$3,000,000
$3,464,392

61www.calamos.com
Calamos Global Equity Fund
The MSCI World Index (USD) is a free float-adjusted market-capitalization-weighted index composed of companiesrepresentative of the market structure of developed market countries in North America, Europe and the Asia/Pacificregion.
The MSCI ACWI (USD) Index is a free float-adjusted market-capitalization-weighted index that is designed to measurethe equity market performance of companies in developed and emerging markets. The MSCI ACWI (USD) Index isprovided to show how the Fund’s performance compares with the returns of an index of securities similar to thosein which the Fund invests.
Index returns assume reinvestment of dividends and do not reflect deduction of fees and expenses. It is not possibleto invest directly in an index.
CALAMOS OPEN-END FAMILY OF FUNDS ANNUAL REPORT
Calamos Global Opportunities Fund
62
OVERVIEWThe Fund invests primarily in globalequity and convertible securities with anaim to balance risk/reward whileproviding growth and income.
KEY FEATURESn Combines equity and convertible
holdings in order to limit downside riskwhile potentially capturing upsideequity participation.
n Provides a core holding option thatstrives to maintain a consistent riskposture throughout the market cycle.
n Seeks to participate in the upsidemovements of the global equity marketwhile lessening the impact of downperiods.
PORTFOLIO FITThe Fund can provide a long-term coreallocation to global equities with thepotential for lower volatility over fullmarket cycles.
FUND NASDAQ SYMBOLS
A Shares CVLOX
C Shares CVLCX
I Shares CGCIX
FUND CUSIP NUMBERS
A Shares 128119500
C Shares 128119708
I Shares 128119609
CALAMOS GLOBAL OPPORTUNITIES FUND(formerly Calamos Global Growth and Income Fund)
INVESTMENT TEAM DISCUSSION
How has the Fund performed?For the 12 months ended October 31, 2021 (“annual period”), Calamos GlobalOpportunities Fund returned 35.16% (Class I shares at net asset value) versus a37.86% gain for the MSCI ACWI Index. The Fund’s one-year return was in the top10th percentile of the Morningstar World Allocation category,* reflecting the benefitof our active risk-managed global approach, which was instrumental in navigating asignificant market rotation and volatility during the Covid recovery phase of the globaleconomy.
Since Class I shares inception on September 18, 1997, the Fund has returned 8.50%on an annualized basis (Class I shares at net asset value) compared with a 7.32%return for the MSCI ACWI Index. We believe this demonstrates the Fund’s ability togenerate attractive long-term returns while pursuing an active, risk-managedinvestment approach over complete market cycles.
What factors influenced performance during the annual period?Global markets rose over the annual period, reflecting progress in the economicrecovery and Covid vaccinations, while demonstrating resiliency in the face of supply-chain disruptions and rising inflation. The Fund’s excellent risk-adjusted performancewas attributable to the benefit of active risk management tactics, including holdingsin convertible bonds that contributed to a favorable risk/reward profile and strongupside capture this year. In addition, the Fund benefited from favorable top-downpositioning across regions and contributions from relative security selection. Many ofthe Fund’s core holdings in global companies with advantaged business models andsecular demand tailwinds performed well amid a volatile and highly rotational marketenvironment.
The Fund’s security selection and an average overweight position in informationtechnology boosted relative performance. In particular, our holdings in semiconductorequipment and data processing & outsourced services were sources of strength. Inaddition, security selection in financials added to the Fund’s performance. The maincontributors within this sector were diversified banks and investment banking &brokerage.
Over the period, selection and an average overweight position within the consumerdiscretionary sector detracted from relative returns, as holdings in the internet & directmarketing retail and apparel, accessories & luxury goods industries lagged. Securityselection in energy hurt relative results, especially in the oil & gas refining & marketingand integrated oil & gas industries.
* Data is as of 10/31/21. Morningstar category percentile ranking is based on annualized total return forthe 1-year, 3-year, 5-year and 10-year periods. For the Morningstar World Allocation category, CalamosGlobal Opportunities Fund Class I shares were in the 10th, 1st, 1st and 6th percentiles of 439, 401, 351and 233 funds for the 1-year, 3-year, 5-year and 10-year periods, respectively.
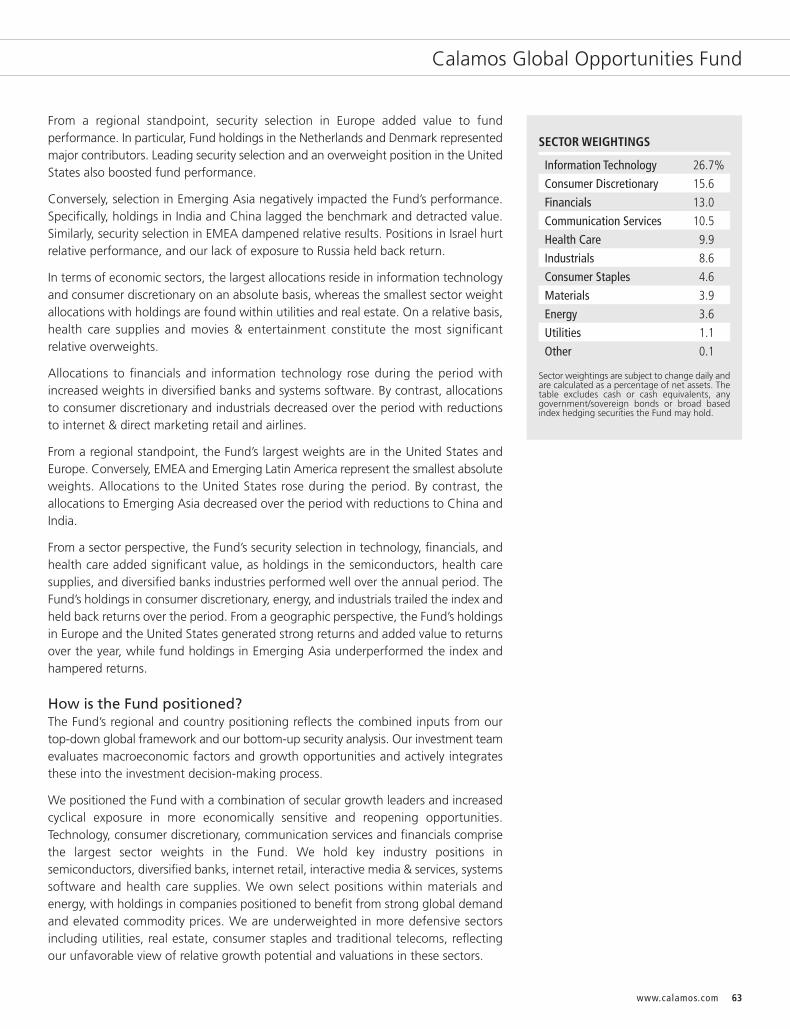
Calamos Global Opportunities Fund
63www.calamos.com
SECTOR WEIGHTINGS
Information Technology 26.7%
Consumer Discretionary 15.6
Financials 13.0
Communication Services 10.5
Health Care 9.9
Industrials 8.6
Consumer Staples 4.6
Materials 3.9
Energy 3.6
Utilities 1.1
Other 0.1
Sector weightings are subject to change daily andare calculated as a percentage of net assets. Thetable excludes cash or cash equivalents, anygovernment/sovereign bonds or broad basedindex hedging securities the Fund may hold.
From a regional standpoint, security selection in Europe added value to fundperformance. In particular, Fund holdings in the Netherlands and Denmark representedmajor contributors. Leading security selection and an overweight position in the UnitedStates also boosted fund performance.
Conversely, selection in Emerging Asia negatively impacted the Fund’s performance.Specifically, holdings in India and China lagged the benchmark and detracted value.Similarly, security selection in EMEA dampened relative results. Positions in Israel hurtrelative performance, and our lack of exposure to Russia held back return.
In terms of economic sectors, the largest allocations reside in information technologyand consumer discretionary on an absolute basis, whereas the smallest sector weightallocations with holdings are found within utilities and real estate. On a relative basis,health care supplies and movies & entertainment constitute the most significantrelative overweights.
Allocations to financials and information technology rose during the period withincreased weights in diversified banks and systems software. By contrast, allocationsto consumer discretionary and industrials decreased over the period with reductionsto internet & direct marketing retail and airlines.
From a regional standpoint, the Fund’s largest weights are in the United States andEurope. Conversely, EMEA and Emerging Latin America represent the smallest absoluteweights. Allocations to the United States rose during the period. By contrast, theallocations to Emerging Asia decreased over the period with reductions to China andIndia.
From a sector perspective, the Fund’s security selection in technology, financials, andhealth care added significant value, as holdings in the semiconductors, health caresupplies, and diversified banks industries performed well over the annual period. TheFund’s holdings in consumer discretionary, energy, and industrials trailed the index andheld back returns over the period. From a geographic perspective, the Fund’s holdingsin Europe and the United States generated strong returns and added value to returnsover the year, while fund holdings in Emerging Asia underperformed the index andhampered returns.
How is the Fund positioned?The Fund’s regional and country positioning reflects the combined inputs from ourtop-down global framework and our bottom-up security analysis. Our investment teamevaluates macroeconomic factors and growth opportunities and actively integratesthese into the investment decision-making process.
We positioned the Fund with a combination of secular growth leaders and increasedcyclical exposure in more economically sensitive and reopening opportunities.Technology, consumer discretionary, communication services and financials comprisethe largest sector weights in the Fund. We hold key industry positions insemiconductors, diversified banks, internet retail, interactive media & services, systemssoftware and health care supplies. We own select positions within materials andenergy, with holdings in companies positioned to benefit from strong global demandand elevated commodity prices. We are underweighted in more defensive sectorsincluding utilities, real estate, consumer staples and traditional telecoms, reflectingour unfavorable view of relative growth potential and valuations in these sectors.
64 CALAMOS OPEN-END FAMILY OF FUNDS ANNUAL REPORT
Calamos Global Opportunities Fund
From a geographic perspective, we own a set of secular growth businesses and cyclicalopportunities in the United States with its positive economic backdrop and wider setof opportunities. In Europe, we own a diversified set of holdings with a blend of endmarkets and business types. Positioning is largely in global secular demand areas andin cyclical opportunities leveraged to a recovery. We have a relatively even-weightposition in Japan. We own several high-quality companies with leading businessmodels positioned to benefit from rising global demand and domestic stimulusmeasures. We own positions in emerging markets within key demand areas such assemiconductors, branded apparel, health care and higher-quality banks.
What closing thoughts do you have for Fund shareholders?Global markets continue to navigate a range of shifting crosscurrents. We areanalyzing the global recovery and many aspects of economic activity alongside policyactions and the path of corporate earnings. Global monetary policy remains supportiveoverall, while multiple central banks have edged toward a less-accommodative stance.We see many opportunities in global stocks and convertibles, reflective of strongearnings and substantial progress in global vaccinations and reopening. Despite thesepotential tailwinds, we are mindful that markets will experience volatility and weremain closely attuned to risks.
From a thematic and sector perspective, we see opportunities in technology, consumerdiscretionary, financials, and health care with competitive advantages that targetcritical demand areas. Our active, risk-managed investment approach and long-termperspective positions us to take advantage of volatility and opportunities in globalmarkets.

65www.calamos.com
Calamos Global Opportunities Fund
ANNUALIZED RETURN: SINCE INCEPTION (9/18/97) THROUGH 10/31/21
Performance data quoted represents past performance, which is no guarantee of future results. Current performance may be lower or higher than theperformance quoted.
The principal value and investment return of an investment will fluctuate so that your shares, when redeemed, may be worth more or less than theiroriginal cost. You can obtain performance data current to the most recent month end by visiting www.calamos.com. Average annual total return measuresnet investment income and capital gain or loss from portfolio investments as an annualized average. All performance shown assumes reinvestment ofdividends and capital gains distributions. Performance is for the Fund’s Class I shares at net asset value. The Fund also offers Class A and Class C shares,the performance of which may vary. Source: State Street Corporation and Morningstar Direct.* Annual returns for Class I shares are provided because Class I shares represent the largest percentage of assets in the Calamos Family of Funds.
MSCI World IndexMSCI ACWI IndexCalamos Global Opportunities Fund(I Shares at NAV)*
9.3312.81
7.42 8.21 8.50 7.72
35.1637.86
18.0615.31
11.917.87 7.54
41.05
19.93 18.8214.56 16.06
50%
20%
30%
40%
10%
0%1-YEAR 3-YEAR 5-YEAR 10-YEAR 15-YEAR SINCE INCEPTION
(9/18/97) THROUGH10/31/21

66 CALAMOS OPEN-END FAMILY OF FUNDS ANNUAL REPORT
Calamos Global Opportunities Fund
AVERAGE ANNUAL TOTAL RETURN† AS OF 10/31/21
1 5 10 YEAR YEARS YEARS
Class A Shares – Inception 9/9/96Without Sales Charge 34.84% 14.27% 9.06%With Sales Charge 28.43 13.17 8.53
Class C Shares – Inception 9/24/96Without Sales Charge 33.77 13.44 8.25With Sales Charge 32.77 13.44 8.25
Class I Shares – Inception 9/18/97 35.16 14.56 9.33
Performance data quoted represents past performance, which is no guarantee of future results.Current performance may be lower or higher than the performance quoted. The principal value andinvestment return of an investment will fluctuate so that your shares, when redeemed, may be worthmore or less than their original cost.
As of the prospectus dated 3/1/21, the Fund’s gross expense ratio for Class A shares is 1.53%, Class Cshares is 2.28% and Class I shares is 1.28%. The Fund’s investment adviser has contractually agreedto reimburse Fund expenses through March 1, 2023 to the extent necessary so that Total AnnualFund Operating Expenses (excluding taxes, interest, short interest, short dividend expenses, brokeragecommissions, acquired fund fees and expenses, and extraordinary expenses, if any) of Class A, Class C,and Class I are limited to 1.22%, 1.97%, and 0.97% of average net assets, respectively. CalamosAdvisors may recapture previously waived expense amounts within the same fiscal year for any daywhere the respective Fund’s expense ratio falls below the contractual expense limit up to the expenselimit for that day. This undertaking is binding on Calamos Advisors and any of its successors andassigns. This agreement is not terminable by either party. The expense ratios shown above may differfrom the more recent expense ratios reported in the Financial Highlights section of this report.† Average annual total return measures net investment income and capital gain or loss from portfolio investments
as an annualized average assuming reinvestment of dividends and capital gains distributions. Performance shownreflects the effects of an expense reimbursement that improved results. Load-adjusted returns are adjusted for themaximum front-end sales load of 4.75% for Class A shares and returns for Class C shares have been adjusted forthe contingent deferred sales charge (CDSC).
NOTES:The graphs do not reflect the income taxes that you would pay on fund distributions or the redemption of fundshares. Fund performance includes reinvestment of dividends and adjustment for the maximum sales charge forClass A shares. The performance of other classes will vary from the performance of the class shown based on thedifference in sales charges and fees paid by shareholders investing in different share classes.
The MSCI ACWI Index is a free float-adjusted market-capitalization-weighted index that is designed to measure theequity market performance of developed and emerging markets.
The MSCI World Index (US Dollars) is a market-capitalization-weighted index composed of companies representativeof the market structure of developed market countries in North America, Europe and the Asia/Pacific region. Sinceinception data for the index is shown from 9/30/97 since data is only available for full monthly periods.
Index returns assume reinvestment of dividends and do not reflect deduction of fees and expenses. It is not possibleto invest directly in an index.
GROWTH OF $1,000,000: FOR THE 10-YEAR PERIOD ENDED 10/31/21
$3,081,523
$3,338,119
$2,440,135
Calamos Global Opportunities Fund (I shares at NAV) MSCI World IndexMSCI ACWI Index
10/31/11 10/31/12 10/31/13 10/31/14 10/31/15 10/31/16 10/31/17 10/31/18 10/31/20 10/31/2110/31/19$0
$1,000,000
$2,000,000
$4,000,000
$3,000,000
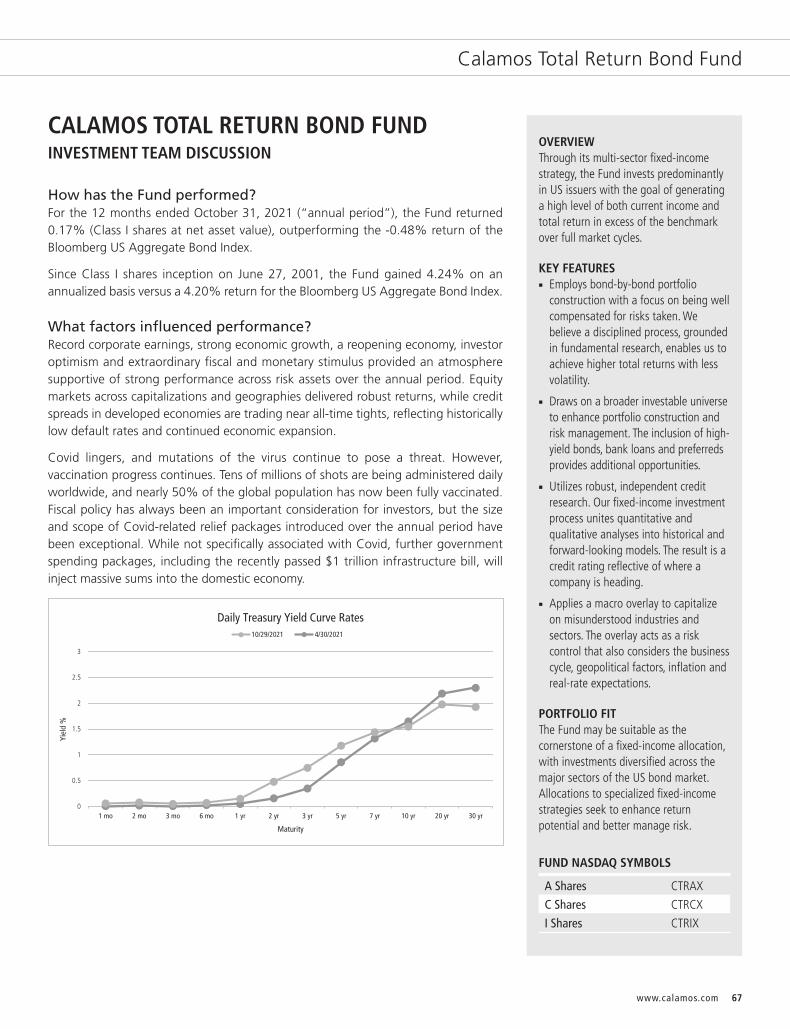
67www.calamos.com
Calamos Total Return Bond Fund
CALAMOS TOTAL RETURN BOND FUNDINVESTMENT TEAM DISCUSSION
How has the Fund performed?For the 12 months ended October 31, 2021 (“annual period”), the Fund returned0.17% (Class I shares at net asset value), outperforming the -0.48% return of theBloomberg US Aggregate Bond Index.
Since Class I shares inception on June 27, 2001, the Fund gained 4.24% on anannualized basis versus a 4.20% return for the Bloomberg US Aggregate Bond Index.
What factors influenced performance?Record corporate earnings, strong economic growth, a reopening economy, investoroptimism and extraordinary fiscal and monetary stimulus provided an atmospheresupportive of strong performance across risk assets over the annual period. Equitymarkets across capitalizations and geographies delivered robust returns, while creditspreads in developed economies are trading near all-time tights, reflecting historicallylow default rates and continued economic expansion.
Covid lingers, and mutations of the virus continue to pose a threat. However,vaccination progress continues. Tens of millions of shots are being administered dailyworldwide, and nearly 50% of the global population has now been fully vaccinated.Fiscal policy has always been an important consideration for investors, but the sizeand scope of Covid-related relief packages introduced over the annual period havebeen exceptional. While not specifically associated with Covid, further governmentspending packages, including the recently passed $1 trillion infrastructure bill, willinject massive sums into the domestic economy.
3
2
1.5
2.5
1
0.5
Yiel
d %
Daily Treasury Yield Curve Rates
01 mo 2 mo 3 mo 6 mo 30 yr20 yr10 yr7 yr5 yr3 yr2 yr1 yr
Maturity
10/29/2021 4/30/2021
OVERVIEWThrough its multi-sector fixed-incomestrategy, the Fund invests predominantlyin US issuers with the goal of generatinga high level of both current income andtotal return in excess of the benchmarkover full market cycles.
KEY FEATURESn Employs bond-by-bond portfolio
construction with a focus on being wellcompensated for risks taken. Webelieve a disciplined process, groundedin fundamental research, enables us toachieve higher total returns with lessvolatility.
n Draws on a broader investable universeto enhance portfolio construction andrisk management. The inclusion of high-yield bonds, bank loans and preferredsprovides additional opportunities.
n Utilizes robust, independent creditresearch. Our fixed-income investmentprocess unites quantitative andqualitative analyses into historical andforward-looking models. The result is acredit rating reflective of where acompany is heading.
n Applies a macro overlay to capitalizeon misunderstood industries andsectors. The overlay acts as a riskcontrol that also considers the businesscycle, geopolitical factors, inflation andreal-rate expectations.
PORTFOLIO FITThe Fund may be suitable as thecornerstone of a fixed-income allocation,with investments diversified across themajor sectors of the US bond market.Allocations to specialized fixed-incomestrategies seek to enhance returnpotential and better manage risk.
FUND NASDAQ SYMBOLS
A Shares CTRAX
C Shares CTRCX
I Shares CTRIX

68 CALAMOS OPEN-END FAMILY OF FUNDS ANNUAL REPORT
Calamos Total Return Bond Fund
Over the course of the annual period, the Federal Reserve has also continued toprovide a remarkable level of monetary stimulus by holding its overnight borrowingrate at 0.0% while purchasing over $1 trillion of Treasury and mortgage-backedsecurities to maintain easy financial conditions. Continued progress toward the Fed’sgoal of full employment is drawing us closer to a reduction of monetary stimulus, withthe Fed expected to announce a taper of its asset purchases beginning in late 2021.Real interest rates, which measure the risk-free compensation an investor receives afterinflation, have been negative since January 2020, providing support for risk assets. In2010, real interest rates also crossed into negative territory, and remained there for42 consecutive months, which helped fuel the longest economic expansion in post-WWII history. If real rates were to remain negative for a similar duration now, thisscenario would extend into the middle of 2023. This consideration is one of the factorscontributing to the market’s optimism for continued above-trend expansion.
To be sure, challenges exist, and inflation is primary among them. Higher inflation eatsinto the financial benefit of economic growth, impacting the amount of realconsumption by consumers. Headline inflation (inclusive of energy and food prices) ismeasuring above 5%, the highest rate in 30 years. Inflation related to wages andhousing, which have historically been signals of stickier inflation, are also climbinghigher indicating that inflation may not be as transitory as many hoped. One sourceof inflation has been ongoing supply-chain challenges stemming from the globaleconomic shutdown that occurred at the onset of the Covid pandemic. The reopeningof several industries has been stymied as component parts must be manufactured anddelivered via congested ports and understaffed trucking companies. Despite thesechallenges, consumer demand, as measured by personal spending and GDP growth,is expanding at healthy levels, informing the market’s expectations for continuedstrength.
During the first half of the annual period, investment-grade corporate-credit marketscontinued to enjoy a rapid recovery from the height of the pandemic, collapsing frommore than 125 basis points over like-maturity Treasuries to inside of 90 basis points.A tight trading range has been established since April, with spreads fluctuating in a10-basis-points range between 80 and 90 basis points. 2020 was a record year forissuance volume in the investment-grade market, and while 2021 volumes are trackingroughly 20% below 2020, this year is likely to close with the second-highest volumeever. The Bloomberg US Corporate Index closed the annual period with optionadjusted spreads at 87 basis points over like maturity Treasuries.
Treasury yields moved substantially higher with two, five, ten and thirty-year maturitiesclimbing by 35, 80, 68 and 27 basis points, respectively, with most of the Treasurymarket move occurring in the first half of the annual period. In fact, if measured as astandalone period, the second half of the annual period resulted in lower Treasuryyields across long-maturity terms. This is, in part, driven by lower long-term growthand inflation expectations. Although the Fed has changed its methodology on inflationtargeting, inflation has been running well above its “2% over time” target for months,and policy tightening is expected to lead to slower growth potential. The corporatecomponents of the Bloomberg US Aggregate Bond Index led with a 2.2% return,government-related securities returned 0.0%, securitized products delivered a -0.5%return, and Treasuries trailed other sectors returning -2.5%.
FUND CUSIP NUMBERS
A Shares 128119310
C Shares 128119286
I Shares 128119278
ASSET ALLOCATION
Corporate Bonds 50.4%
US Government and Agency Securities 26.8
Bank Loans 9.9
Residential Mortgage Backed Securities 6.4
Asset Backed Securities 4.9
Sovereign Bond 0.6
Convertible Bonds 0.2
Asset Allocation weightings are subject to changedaily and are calculated as a percentage of netassets. The table excludes cash or cashequivalents, any government/sovereign bonds orbroad based index hedging securities the Fundmay hold.
69www.calamos.com
Calamos Total Return Bond Fund
The Fund held an overweight in corporate debt over the annual review period. Theoverweight allocation to corporate bonds in industrial sectors was a contributor toperformance, as was the security selection among the same issuers. Security selectionamong the Fund’s positions in both Treasury and mortgage-backed securities weighedon performance. The team increased the corporate-bond allocation during the annualperiod, and over the long-term, we continue to favor an overweight to corporatebonds and asset-backed securities in the Calamos Total Return Bond Fund becausethe additional yield has historically helped generate superior long-term returns.
How is the Fund positioned?The Fund has a duration of 6.1 years, short of the 6.7-year duration of the BloombergUS Aggregate Bond Index.
The Fund continues to hold an overweight in corporate bonds in both the investment-grade and out-of-benchmark high-yield ratings categories. These overweights lead toa lower overall credit quality of A when compared with the AA- quality of thebenchmark. The sell-off in Treasury rates coupled with the tightening of spreads inrisk assets led to slightly positive returns during the annual period, behind the peer-group average and ahead of the Bloomberg US Aggregate Bond Index. The Fundcontinues to hold overweight positions in corporate and asset-backed securities andunderweight positions in Treasuries and Agencies following the changes. Within thecorporate-bond allocation, our largest overweight allocations are found in theconsumer non-cyclical and REITs sectors.
What are your closing thoughts for Fund shareholders?In some ways, fixed-income markets at the end of the annual period look quite similarto the environment from earlier this year, but there are significant changes at playimpacting our outlook on where interest rates and credit markets are headed into thelast months of 2021, not least of which is our expectation of greater volatility,particularly in Treasury yields, in coming months and quarters.
One source of potential volatility was related to the leadership of the Federal Reserve.Jerome Powell’s first term as Chair ends in early 2022 and following the resignationof two Federal Reserve presidents over ethical concerns related to personal trading,President Biden was pressured not to renominate Powell. A change at the helm of theFed could have led to unknown shifts in policy or forward guidance. At the time ofthis writing in November, however, the president did renominate Powell to anotherfour-year term, citing Powell’s deft leadership in guiding the economy through thepandemic-induced recession and subsequent recovery. Uncertainty around fiscal policyis another potential driver of fourth-quarter 2021 interest-rate volatility. With anunknown price tag or timeline for approval of a social spending package, the marketis left to hypothesize what the related inflationary pressure might be. One thing iscertain: even in a much-reduced form, no one will characterize the budget as austere.
Inflation will drive nominal GDP growth significantly higher as the economy movesfrom above-trend inflation driven by transitory factors to stickier components, namelyshelter and wages. Despite higher-than-trend inflation expectations, we believe realinterest rates will remain in negative or very low territory, which will support risk assetsincluding investment-grade and high-yield credit markets.
Spreads in risk assets are trading near all-time tights, and although we do not see acatalyst for materially wider levels from here, further tightening at a broad level willprove more difficult. Our base case anticipates tight trading ranges in the comingquarter or two, emphasizing the need for active management and our bond-by-bond-driven investment philosophy.

70
Calamos Total Return Bond Fund
ANNUALIZED RETURN: SINCE INCEPTION (6/27/07) THROUGH 10/31/21
Performance data quoted represents past performance, which is no guarantee of future results. Current performance may be lower or higher than theperformance quoted.
The principal value and investment return of an investment will fluctuate so that your shares, when redeemed, may be worth more or less than theiroriginal cost. You can obtain performance data current to the most recent month end by visiting www.calamos.com. Average annual total return measurenet investment income and capital gain or loss from portfolio investments as an annualized average. All performance shown assumes reinvestment ofdividends and capital gains distributions. Performance is for the Fund’s Class I shares at net asset value. The Fund also offers Class A and Class C shares,the performance of which may vary. Source: State Street Corporation and Morningstar Direct.
Duration is useful in measuring a bond fund’s sensitivity to changes in interest rates. The longer the duration, the more a bond fund’s price will fluctuatewhen interest rates change.* Annual returns for Class I shares are provided because Class I shares represent the largest percentage of assets in the Calamos Family of Funds.
Bloomberg US Aggregate Bond IndexCalamos Total Return Bond Fund(I Shares at NAV)*
3.01 3.00
4.24 4.22
0.17
-0.48
5.32 5.63
2.97 3.10
8%
6%
4%
2%
-2%
0%
1-YEAR 3-YEAR 5-YEAR 10-YEAR SINCE INCEPTION(6/27/07) THROUGH
10/31/21
CALAMOS OPEN-END FAMILY OF FUNDS ANNUAL REPORT

GROWTH OF $1,000,000: FOR THE 10-YEAR PERIOD ENDED 10/31/21
$1,345,308$1,343,671
Calamos Total Return Bond Fund (I shares at NAV) Bloomberg US Aggregate Bond Index
$0
$1,500,000
$500,000
$1,000,000
10/31/11 10/31/12 10/31/13 10/31/14 10/31/15 10/31/16 10/31/17 10/31/18 10/31/20 10/31/2110/31/19
71www.calamos.com
AVERAGE ANNUAL TOTAL RETURN† AS OF 10/31/21
1 5 10 YEAR YEARS YEARS
Class A Shares – Inception 6/27/07Without Sales Charge 0.01% 2.72% 2.75%With Sales Charge -2.24 1.94 2.36
Class C Shares – Inception 6/27/07Without Sales Charge -0.74 1.95 1.99With Sales Charge -1.71 1.95 1.99
Class I Shares – Inception 6/27/07 0.17 2.97 3.01
Performance data quoted represents past performance, which is no guarantee of future results.Current performance may be lower or higher than the performance quoted. The principal value andinvestment return of an investment will fluctuate so that your shares, when redeemed, may be worthmore or less than their original cost.
As of the prospectus dated 3/1/21, the Fund’s gross expense ratio for Class A shares is 1.04%, Class Cshares is 1.78% and Class I shares is 0.78%. The Fund’s investment adviser has contractually agreedto reimburse Fund expenses through March 1, 2023 to the extent necessary so that Total AnnualFund Operating Expenses (excluding taxes, interest, short interest, short dividend expenses, brokeragecommissions, acquired fund fees and expenses, and extraordinary expenses, if any) of Class A, Class C,and Class I are limited to 0.90%, 1.65%, and 0.65% of average net assets, respectively. CalamosAdvisors may recapture previously waived expense amounts within the same fiscal year for any daywhere the respective Fund’s expense ratio falls below the contractual expense limit up to the expenselimit for that day. This undertaking is binding on Calamos Advisors and any of its successors andassigns. This agreement is not terminable by either party. The expense ratios shown above may differfrom the more recent expense ratios reported in the Financial Highlights section of this report.† Average annual total return measures net investment income and capital gain or loss from portfolio investments
as an annualized average assuming reinvestment of dividends and capital gains distributions. Performance shownreflects the effects of an expense reimbursement that improved results. Load-adjusted returns are adjusted for themaximum front-end sales load of 2.25% for Class A shares and returns for Class C shares have been adjusted forthe contingent deferred sales charge (CDSC).
NOTES:The graph does not reflect the income taxes that you would pay on fund distributions or the redemption of fundshares. Fund performance includes reinvestment of dividends and adjustment for the maximum sales charge forClass A shares. The performance of other classes will vary from the performance of the class shown based on thedifference in sales charges and fees paid by shareholders investing in different share classes.
The Bloomberg US Aggregate Bond Index is considered generally representative of the investment-grade bondmarket.
Index returns assume reinvestment of dividends and do not reflect deduction of fees and expenses. It is not possibleto invest directly in an index.
Calamos Total Return Bond Fund
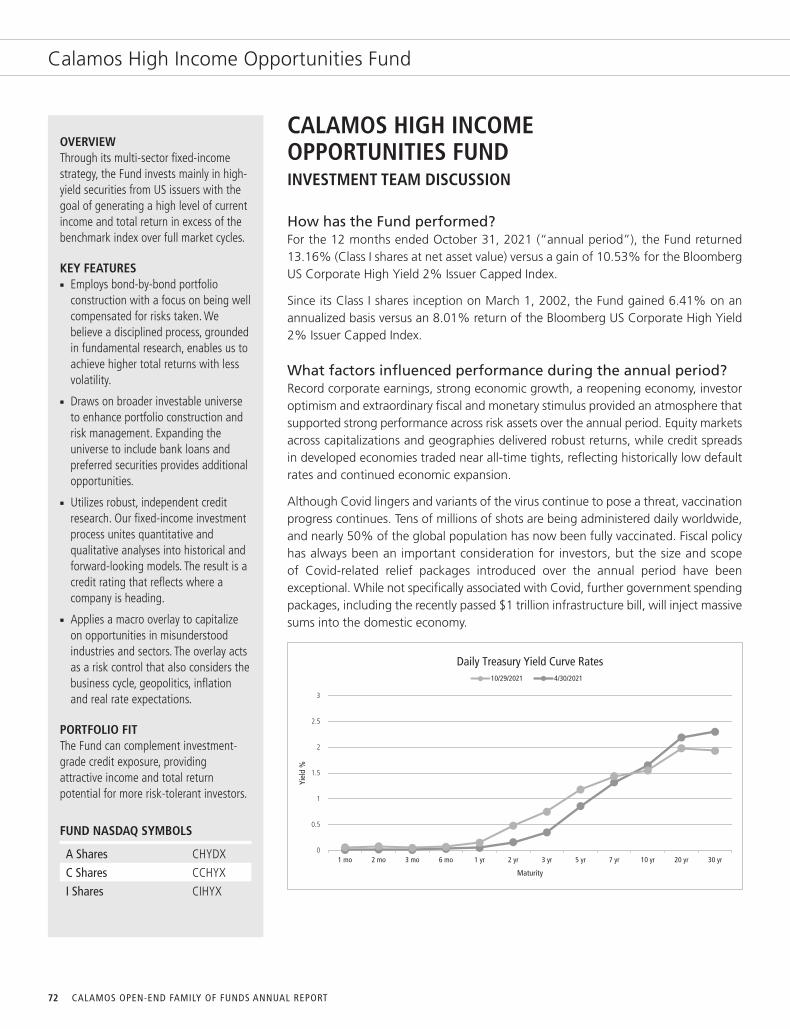
CALAMOS OPEN-END FAMILY OF FUNDS ANNUAL REPORT72
Calamos High Income Opportunities Fund
CALAMOS HIGH INCOME OPPORTUNITIES FUNDINVESTMENT TEAM DISCUSSION
How has the Fund performed?For the 12 months ended October 31, 2021 (“annual period”), the Fund returned13.16% (Class I shares at net asset value) versus a gain of 10.53% for the BloombergUS Corporate High Yield 2% Issuer Capped Index.
Since its Class I shares inception on March 1, 2002, the Fund gained 6.41% on anannualized basis versus an 8.01% return of the Bloomberg US Corporate High Yield2% Issuer Capped Index.
What factors influenced performance during the annual period?Record corporate earnings, strong economic growth, a reopening economy, investoroptimism and extraordinary fiscal and monetary stimulus provided an atmosphere thatsupported strong performance across risk assets over the annual period. Equity marketsacross capitalizations and geographies delivered robust returns, while credit spreadsin developed economies traded near all-time tights, reflecting historically low defaultrates and continued economic expansion.
Although Covid lingers and variants of the virus continue to pose a threat, vaccinationprogress continues. Tens of millions of shots are being administered daily worldwide,and nearly 50% of the global population has now been fully vaccinated. Fiscal policyhas always been an important consideration for investors, but the size and scopeof Covid-related relief packages introduced over the annual period have beenexceptional. While not specifically associated with Covid, further government spendingpackages, including the recently passed $1 trillion infrastructure bill, will inject massivesums into the domestic economy.
3
2
1.5
2.5
1
0.5
Yiel
d %
Daily Treasury Yield Curve Rates
01 mo 2 mo 3 mo 6 mo 30 yr20 yr10 yr7 yr5 yr3 yr2 yr1 yr
Maturity
10/29/2021 4/30/2021
OVERVIEWThrough its multi-sector fixed-incomestrategy, the Fund invests mainly in high-yield securities from US issuers with thegoal of generating a high level of currentincome and total return in excess of thebenchmark index over full market cycles.
KEY FEATURESn Employs bond-by-bond portfolio
construction with a focus on being wellcompensated for risks taken. Webelieve a disciplined process, groundedin fundamental research, enables us toachieve higher total returns with lessvolatility.
n Draws on broader investable universeto enhance portfolio construction andrisk management. Expanding theuniverse to include bank loans andpreferred securities provides additionalopportunities.
n Utilizes robust, independent creditresearch. Our fixed-income investmentprocess unites quantitative andqualitative analyses into historical andforward-looking models. The result is acredit rating that reflects where acompany is heading.
n Applies a macro overlay to capitalizeon opportunities in misunderstoodindustries and sectors. The overlay actsas a risk control that also considers thebusiness cycle, geopolitics, inflationand real rate expectations.
PORTFOLIO FITThe Fund can complement investment-grade credit exposure, providingattractive income and total returnpotential for more risk-tolerant investors.
FUND NASDAQ SYMBOLS
A Shares CHYDX
C Shares CCHYX
I Shares CIHYX

73www.calamos.com
FUND CUSIP NUMBERS
A Shares 128119815
C Shares 128119799
I Shares 128119781
SECTOR WEIGHTINGS
Consumer Discretionary 15.8%
Financials 15.3
Industrials 14.3
Communication Services 13.2
Health Care 9.9
Energy 9.5
Information Technology 5.0
Materials 4.3
Consumer Staples 4.0
Airlines 2.5
Other 1.0
Real Estate 1.0
Utilities 0.7
Sector weightings are subject to change daily andare calculated as a percentage of net assets. Thetable excludes cash or cash equivalents, anygovernment/sovereign bonds or broad basedindex hedging securities the Fund may hold.
Calamos High Income Opportunities Fund
Over the course of the annual period, the Federal Reserve also provided a remarkablelevel of monetary stimulus by holding its overnight borrowing rate at 0.0% whilepurchasing over $1 trillion of Treasury and mortgage-backed securities to maintaineasy financial conditions. Continued progress toward the Fed’s goal of full employmentis drawing us closer to a reduction of monetary stimulus, with the Fed expected toannounce a taper of its asset purchases beginning in late 2021. Real interest rates,which measure the risk-free compensation an investor receives after inflation, havebeen negative since January 2020, providing support for risk assets. In 2010, realinterest rates also crossed into negative territory, and remained there for42 consecutive months, which helped fuel the longest economic expansion in post-WWII history. If real rates were to remain negative for a similar duration now, thisscenario would extend into the middle of 2023. This consideration is one of the factorscontributing to the market’s optimism for continued above-trend expansion.
To be sure, challenges exist, and inflation is primary among them. Higher inflation eatsinto the financial benefit of economic growth, impacting the amount of realconsumption by consumers. Headline inflation (inclusive of energy and food prices) ismeasuring above 5%, the highest rate in 30 years. Inflation related to wages andhousing, which have historically been signals of stickier inflation, are also climbinghigher indicating that inflation may not be as transitory as many hoped. One sourceof inflation has been ongoing supply-chain challenges stemming from the globaleconomic shutdown that occurred at the onset of the Covid pandemic. The reopeningof several industries has been stymied as component parts must be manufactured anddelivered via congested ports and understaffed trucking companies. Despite thesechallenges, consumer demand, as measured by personal spending and GDP growth,is expanding at healthy levels, informing the market’s expectations for continuedstrength.
During the first half of the annual period, corporate-credit markets continued to enjoya rapid recovery from the height of the pandemic, collapsing from more than 500basis points over like-maturity Treasuries to inside of 300 basis points. A tight tradingrange has been established since April, with spreads fluctuating in a 50-basis-pointsrange between 265 and 315 basis points. Issuance volumes have trended lower inrecent months but remain historically high with 2021 poised to be the largest volumeyear on record. The Bloomberg US High Yield 2% Issuer Capped Index closed theannual period with option-adjusted spreads at 288 basis points over like-maturityTreasuries, and a yield of 4.24%.
Performance during the annual period was directional, with lower quality CCC-ratedissuers delivering returns of 18.2%, trailed by B-rated issuers at 9.2% and BBcompanies returning 9.1%. At the beginning of the annual period, the trailing12-month default rate was 6.3%, largely driven by energy-related businesses in bothexploration and production and oil field services. At the end of the period, defaultrates had declined to 0.4%, the second lowest level in history followingDecember 2007. Regarding our credit-quality positioning, our underweight to BB-ratedbonds positively contributed to performance, while security selection among ourCCC-rated holdings was a detractor.

CALAMOS OPEN-END FAMILY OF FUNDS ANNUAL REPORT74
Calamos High Income Opportunities Fund
From a sector perspective, security selection within the energy and consumer non-cyclical sectors contributed to return. Conversely, the Fund’s underweight to the energysector and overweight to the insurance sector weighed on performance.
How is the Fund positioned?The Fund is currently overweight to the property and casualty insurance,pharmaceuticals, and other REITs industries. The property and casualty insuranceoverweight is correlated to favorable consolidation trends in the industry. Thepharmaceuticals overweight is a result of the team’s idiosyncratic positioning amonga small number of companies with improving fundamental results. Our largestunderweights are found in the wireless, electric utilities and independent energyindustries. The wireless sector underweight is largely the result of relative valuedecisions in favor of higher-income opportunities in other industries.
From a credit-quality perspective, the Fund is positioned with a relative underweightin the BB category, while currently overweight toward both B-rated and CCC-ratedissuers. The Fund is positioned short (3.4 years) in comparison with the option-adjustedduration of the Bloomberg US High Yield 2% Issuer Capped Index (4.0 years).
Over the annual period, the team has added to positions in the media entertainment,airlines, and technology industries. Also, we reduced the portfolio’s exposure to healthcare, wireless and independent energy industries. The increases in mediaentertainment and airlines represent what we believe to be strong relative valuepositions emerging from the Covid pandemic. The reduction in health care wasprimarily due to closing a profitable trade that had reached our target valuation.
What are your closing thoughts for Fund shareholders?In some ways, fixed-income markets at the end of the annual period look quite similarto the environment from earlier this year, but there are significant changes at playimpacting our outlook on where interest rates and credit markets are headed into thelast months of 2021, not least of which is our expectation of volatility, particularly inTreasury yields, in coming months and quarters.
One source of potential volatility was related to the leadership of the Federal Reserve.Jerome Powell’s first term as Chair ends in early 2022 and following the resignation oftwo Federal Reserve presidents over ethical concerns related to personal trading,President Biden was pressured not to renominate Powell. A change at the helm of theFed could have led to unknown shifts in policy or forward guidance. At the time of thiswriting in November, however, the president did renominate Powell to another four-year term, citing Powell’s deft leadership in guiding the economy through thepandemic-induced recession and subsequent recovery. Uncertainty around fiscal policyis another potential driver of fourth-quarter 2021 interest-rate volatility. With anunknown price tag or timeline for approval of a social/climate spending package, themarket is left to hypothesize what the related inflationary pressure might be. One thingis certain: even in a much-reduced form, no one will characterize the budget as austere.
Inflation will drive nominal GDP growth significantly higher as the economy movesfrom above-trend inflation driven by transitory factors to stickier components, namelyshelter and wages. Despite higher-than-trend inflation expectations, we believe realinterest rates will remain in negative or very low territory, which will support risk assetsincluding investment-grade and high-yield credit markets.

75www.calamos.com
Calamos High Income Opportunities Fund
ANNUALIZED RETURN: SINCE INCEPTION (3/1/02) THROUGH 10/31/21
Performance data quoted represents past performance, which is no guarantee of future results. Current performance may be lower or higher than theperformance quoted.
The principal value and investment return of an investment will fluctuate so that your shares, when redeemed, may be worth more or less than theiroriginal cost. You can obtain performance data current to the most recent month end by visiting www.calamos.com. Average annual total return measuresnet investment income and capital gain or loss from portfolio investments as an annualized average. All performance shown assumes reinvestment ofdividends and capital gains distributions. Performance is for the Fund’s Class I shares at net asset value. The Fund also offers Class A and Class C shares,the performance of which may vary. Source: State Street Corporation and Morningstar Direct.* Annual returns for Class I shares are provided because Class I shares represent the largest percentage of assets in the Calamos Family of Funds.
Bloomberg US Corporate High Yield 2% Issuer Capped IndexCalamos High Income Opportunities Fund(I Shares at NAV)*
6.78 7.25 8.01
13.16
6.785.77 5.33 5.45
6.41
10.53
7.406.38
20%
15%
10%
5%
0%1-YEAR 3-YEAR 5-YEAR 10-YEAR 15-YEAR SINCE INCEPTION
(3/1/02) THROUGH10/31/21
Spreads in risk assets are trading near all-time tights, and while we do not see a catalystfor materially wider levels from here, further tightening at a broad level will provemore difficult. Our base case anticipates tight trading ranges in the coming quarter ortwo, emphasizing the need for active management and our bond-by-bond-driveninvestment philosophy.

76
Calamos High Income Opportunities Fund
AVERAGE ANNUAL TOTAL RETURN† AS OF 10/31/21
1 5 10 YEAR YEARS YEARS
Class A Shares – Inception 8/2/99Without Sales Charge 12.88% 5.49% 5.07%With Sales Charge 10.39 4.47 4.56
Class C Shares – Inception 12/21/00Without Sales Charge 12.11 4.72 4.29With Sales Charge 11.11 4.72 4.29
Class I Shares – Inception 3/1/02 13.16 5.77 5.33
Performance data quoted represents past performance, which is no guarantee of future results.Current performance may be lower or higher than the performance quoted. The principal value andinvestment return of an investment will fluctuate so that your shares, when redeemed, may be worthmore or less than their original cost.
As of the prospectus dated 3/1/21, the Fund’s gross expense ratio for Class A shares is 1.37%, Class Cshares is 2.11% and Class I shares is 1.12%. The Fund’s investment adviser has contractually agreedto reimburse Fund expenses through March 1, 2023, to the extent necessary so that Total AnnualFund Operating Expenses (excluding taxes, interest, short interest, short dividend expenses, brokeragecommissions, acquired fund fees and expenses, and extraordinary expenses, if any) of Class A, Class C,and Class I are limited to 1.00%, 1.75%, and 0.75% of average net assets, respectively. CalamosAdvisors may recapture previously waived expense amounts within the same fiscal year for any daywhere the respective Fund’s expense ratio falls below the contractual expenses limit up to the expenselimit for that day. This undertaking is binding on Calamos Advisors and any of its successors andassigns. This agreement is not terminable by either party. The expense ratios shown above may differfrom the more recent expense ratios reported in the Financial Highlights section of this report.† Average annual total return measures net investment income and capital gain or loss from portfolio investments
as an annualized average assuming reinvestment of dividends and capital gains distributions. Performance shownreflects the effects of an expense reimbursement that improved results. Load-adjusted returns are adjusted for themaximum front-end sales load of 2.25% for Class A shares and returns for Class C shares have been adjusted forthe contingent deferred sales charge (CDSC).
NOTES:The graphs do not reflect the income taxes that you would pay on fund distributions or the redemption of fundshares. Fund performance includes reinvestment of dividends and adjustment for the maximum sales charge forClass A shares. The performance of other classes will vary from the performance of the class shown based on thedifference in sales charges and fees paid by shareholders investing in different share classes.
The Bloomberg US Corporate High Yield 2% Issuer Capped Index measures the performance of high-yield corporatebonds with a maximum allocation of 2% to any one issuer.
Index returns assume reinvestment of dividends and do not reflect deduction of fees and expenses. It is not possibleto invest directly in an index.
GROWTH OF $1,000,000: FOR THE 10-YEAR PERIOD ENDED 10/31/21
$1,926,212$1,681,134
Calamos High Income Opportunities Fund (I shares at NAV) Bloomberg US Corporate High Yield 2% Issuer Capped Index
10/31/11 10/31/12 10/31/13 10/31/14 10/31/15 10/31/16 10/31/17 10/31/18 10/31/20 10/31/2110/31/19$0
$2,000,000
$1,000,000
$500,000
$1,500,000
CALAMOS OPEN-END FAMILY OF FUNDS ANNUAL REPORT

77www.calamos.com
CALAMOS SHORT-TERM BOND FUNDINVESTMENT TEAM DISCUSSION
How has the Fund performed?For the 12 months ended October 31, 2021 (“annual period”), the Fund returned1.11% (Class I shares at net asset value) outperforming the -0.05% return of theBloomberg 1-3 Year Government/Credit Bond Index.
Since its inception on September 19, 2018, the Fund has returned 3.15% on anannualized basis (Class I share at net asset value) versus the 2.68% return of theBloomberg 1-3 Year Government/Credit Bond Index.
What factors influenced performance during the annual period?Record corporate earnings, strong economic growth, a reopening economy, investoroptimism, and extraordinary fiscal and monetary stimulus provided an atmospheresupportive of strong performance across risk assets over the annual period. Equitymarkets across capitalizations and geographies delivered robust returns, while creditspreads in developed economies traded near all-time tights, reflecting historically lowdefault rates and continued economic expansion.
Although Covid lingers and variants of the virus continue to pose a threat, vaccinationprogress continues. Tens of millions of shots are being administered daily worldwide,and nearly 50% of the global population has now been fully vaccinated. Fiscal policyhas always been an important consideration for investors, but the size and scopeof Covid-related relief packages introduced over the annual period have beenexceptional. While not specifically associated with Covid, further government spendingpackages, including the recently passed $1 trillion infrastructure bill, will inject massivesums into the domestic economy.
Over the course of the annual period, the Federal Reserve also provided a remarkablelevel of monetary stimulus by holding its overnight borrowing rate at 0.0% whilepurchasing over $1 trillion of Treasury and mortgage-backed securities to maintaineasy financial conditions. Continued progress toward the Fed’s goal of full employmentis drawing us closer to a reduction of monetary stimulus, with the Fed expected toannounce a taper of its asset purchases beginning in late 2021. Real interest rates,which measure the risk-free compensation an investor receives after inflation, havebeen negative since January 2020, providing support for risk assets. In 2010, realinterest rates also crossed into negative territory, and remained there for42 consecutive months, which helped fuel the longest economic expansion in post-WWII history. If real rates were to remain negative for now, this scenario would extendinto the middle of 2023. This consideration is one of the factors contributing to themarket’s optimism for continued above-trend expansion.
To be sure, challenges exist, and inflation is primary among them. Higher inflation eatsinto the financial benefit of economic growth, impacting the amount of realconsumption increases experienced by consumers. Headline inflation (inclusive of
Calamos Short-Term Bond Fund
OVERVIEWThrough its multi-sector fixed-incomestrategy, the fund invests predominantlyin US issuers with the goal of generatinga high level of current income and totalreturn in excess of the benchmark overfull market cycles.
KEY FEATURESn Employs bond-by-bond portfolio
construction with a focus on being wellcompensated for risks taken. Webelieve a disciplined process, groundedin fundamental research, enables us toachieve higher total returns with lessvolatility.
n Draws on a broader investable universeto enhance portfolio construction andrisk management. Expanding theuniverse to include high-yield bonds,bank loans and preferreds providesadditional opportunities.
n Utilizes robust, independent creditresearch. Our fixed-income investmentprocess unites quantitative andqualitative analyses into historical andforward-looking models. The result is acredit rating reflective of where acompany is heading.
n Applies a macro overlay to capitalizeon misunderstood industries andsectors. The overlay acts as a riskcontrol that also considers the businesscycle, geopolitics, inflation and real rateexpectations.
PORTFOLIO FITThe Fund may be suitable for investorsseeking current income accompanied bylower volatility over a one-year to two-year time horizon.
FUND NASDAQ SYMBOLS
A Shares CSTBX
I Shares CSTIX

78
Calamos Short-Term Bond Fund
FUND CUSIP NUMBERS
A Shares 128120441
I Shares 128120433
ASSET ALLOCATION
Corporate Bonds 60.0%
Asset Backed Securities 11.9
Bank Loans 7.7
Municipal Obligations 4.7
US Government and Agency Securities 4.6
Residential Mortgage Backed Securities 1.5
Sovereign Bonds 0.4
Asset Allocation weightings are subject to changedaily and are calculated as a percentage of netassets. The table excludes cash or cashequivalents, any government/sovereign bonds orbroad based index hedging securities the Fundmay hold.
energy and food prices) is measuring above 5%, the highest rate in 30 years. Inflationrelated to wages and housing, which have historically been signals of stickier inflation,are also climbing higher indicating that inflation may not be as transitory as manyhoped. One source of inflation has been ongoing supply chain challenges stemmingfrom the global economic shutdown that occurred at the onset of the Covid pandemic.The reopening of several industries has been stymied as component parts must bemanufactured and delivered via congested ports and understaffed trucking companies.Despite these challenges, consumer demand as measured by personal spending andGDP growth is expanding at healthy levels, informing the market’s expectations forcontinued strength.
Short-duration Treasury yields out to two years were relatively unchanged over thecourse of the annual period, although two-year rates increased by 35 basis points.This move occurred almost entirely in the last two months of the annual period, asexpectations for a more aggressive taper and tightening path for the Fed took hold inthe market, though no Fed communication would indicate a change from its latestprojections indicating a 2023 liftoff for overnight rates.
The corporate component of the Bloomberg 1-3 Year Government/Credit Bond Indexled with a 0.6% return, while the government-related sector returned 0.0%, andTreasury sectors trailed at -0.3%. The Fund held an overweight in corporate debt overthe annual period. As a result, the overweight allocations to corporate bonds acrossfinancial, industrial and utility-related sectors were positive contributors toperformance. The out-of-benchmark allocation to below-investment-grade credit alsoboosted performance as the short-duration, high-yield market recovered quickly fromthe spike in spreads during the first calendar quarter of 2020. Over the long-term, wecontinue to favor an overweight to corporate bonds, asset-backed securities, andtaxable municipal bonds in the Calamos Short-Term Bond Fund because the additionalyield in short-duration securities has historically helped generate superior long-termreturns.
How is the Fund positioned?The Fund has a duration of 2.0 years versus the 1.9 years duration of the Bloomberg1-3 Year Government/Credit Bond Index.
The Fund continues to hold an overweight in corporate bonds in both the investment-grade and out-of-benchmark high-yield ratings categories. These overweights lead toa lower overall credit quality of A- when compared with the AA quality of thebenchmark. The selloff in two- and three-year Treasury rates coupled with the recoveryof credit spreads in risk assets since March 2021 led to positive Fund returns duringthe annual period. The Fund remains overweight to corporate bonds and asset-backedsecurities. However, the weighting of corporate bonds was decreased during the mostrecent six-month period, as the team has moved into higher-yielding opportunities interm loans and taxable municipal bonds. The term-loan positions are floating rate innature, which helps mitigate exposure to increases in short-term interest rates. TheFund continues to hold underweight positions in both Treasuries and Agencies. Withinthe corporate bond allocation, our largest overweight allocations are found in theconsumer non-cyclical and technology sectors.
CALAMOS OPEN-END FAMILY OF FUNDS ANNUAL REPORT

79www.calamos.com
Calamos Short-Term Bond Fund
What are your closing thoughts for Fund shareholders?In some ways, fixed-income markets at the end of the annual period look quite similarto the environment from earlier this year, but there are significant changes at playimpacting our outlook on where interest rates and credit markets are headed into thelast months of 2021, not least of which is our expectation of greater volatility,particularly in Treasury yields, in coming months and quarters.
One source of potential volatility was related to the leadership of the Federal Reserve.Jerome Powell’s first term as Chair ends in early 2022 and following the resignationof two Federal Reserve presidents over ethical concerns related to personal trading,President Biden was pressured not to renominate Powell. A change at the helm of theFed could have led to unknown shifts in policy or forward guidance. At the time ofthis writing in November, however, the president did renominate Powell to anotherfour-year term, citing Powell’s deft leadership in guiding the economy through thepandemic-induced recession and subsequent recovery. Uncertainty around fiscal policyis another potential driver of fourth-quarter 2021 interest-rate volatility. With anunknown price tag or timeline for approval of a social/climate spending package, themarket is left to hypothesize what the related inflationary pressure might be. Onething is certain: even in a much-reduced form, no one will characterize the budget asaustere.
Inflation will drive nominal GDP growth significantly higher as the economy movesfrom above-trend inflation driven by transitory factors to stickier components, namelyshelter and wages. Despite higher-than-trend inflation expectations, we believe realinterest rates will remain in negative or very low territory, which will support risk assetsincluding investment-grade and high-yield credit markets.
Spreads in risk assets are trading near all-time tights, and while we do not see a catalystfor materially wider levels from here, further tightening at a broad level will provemore difficult. Our base case anticipates tight trading ranges in the coming quarter ortwo, emphasizing the need for active management and our bond-by-bond-driveninvestment philosophy.

80
Calamos Short-Term Bond Fund
AVERAGE ANNUAL TOTAL RETURN† AS OF 10/31/21
1 SINCEYEAR INCEPTION
Class A Shares – Inception 9/19/18Without Sales Charge 0.85% 2.89%With Sales Charge -1.46 2.14
Class I Shares – Inception 9/19/18 1.11 3.15
Performance data quoted represents past performance, which is no guarantee of future results.Current performance may be lower or higher than the performance quoted. The principal value andinvestment return of an investment will fluctuate so that your shares, when redeemed, may be worthmore or less than their original cost.
As of the prospectus dated 3/1/21, the Fund’s gross expense ratio for Class A shares is 0.68% andClass I shares is 0.42%. The Fund’s investment adviser has contractually agreed to reimburse Fundexpenses through 3/1/23 to the extent necessary so that Total Annual Fund Operating Expenses(excluding taxes, interest, short interest, short dividend expenses, brokerage commissions, acquiredfund fees and expenses, and extraordinary expenses, if any) of Class A and Class I are limited to0.65% and 0.40% of average net assets, respectively. Calamos Advisors may recapture previouslywaived expense amounts within the same fiscal year for any day where the respective Fund’s expenseratio falls below the contractual expense limit up to the expense limit for that day. This undertakingis binding on Calamos Advisors and any of its successors and assigns. This agreement is not terminableby either party. The expense ratios shown above may differ from the more recent expense ratiosreported in the Financial Highlights section of this report.† Average annual total return measures net investment income and capital gain or loss from portfolio investments
as an annualized average assuming reinvestment of dividends and capital gains distributions. Performance shownreflects the effects of an expense reimbursement that improved results. Load-adjusted returns are adjusted for themaximum front-end sales load of 2.25% for Class A shares.
NOTES:The Bloomberg 1-3 Year Government/Credit Index includes all medium and larger issues of US government,investment-grade corporate, and investment-grade international dollar-denominated bonds that have maturities ofbetween 1 and 3 years and are publicly issued.
The Bloomberg US 1-3 Year Credit Index measures the investment-grade, US dollar-denominated, fixed-rate, taxablecorporate and government-related bond markets. It is composed of the US Corporate Index and a non-corporatecomponent that includes foreign agencies, sovereigns, supranationals and local authorities that have maturities ofbetween 1 and 3 years.
Index returns assume reinvestment of dividends and do not reflect deduction of fees and expenses. It is not possibleto invest directly in an index.
GROWTH OF $1,000,000: SINCE INCEPTION (9/18/18) THROUGH 10/31/21Calamos Short Term Bond Fund (I shares at NAV) Bloomberg 1-3 Year Government/Credit Index Bloomberg US 1-3 Year Credit Index
$1,098,747
$1,085,053
$1,101,455
$0
$2,000,000
$1,000,000
$500,000
$1,500,000
9/18/18 10/31/18 1/31/19 1/31/204/30/19 7/31/19 7/31/20 7/31/2110/31/19 4/30/20 4/30/21 10/31/211/31/2110/31/20
CALAMOS OPEN-END FAMILY OF FUNDS ANNUAL REPORT

81www.calamos.com
Expense Overview
EXPENSE OVERVIEWAs a shareholder of a mutual fund, you incur two types of costs. You incur:
1) Transaction costs, including sales charges, or loads, on purchase payment and redemption fees.
2) Ongoing costs, including management fees, distribution and/or service (12b-1) fees and other fund expenses.
The examples in this report are based on an investment of $1,000 made at the beginning of the period and
held for the entire period from May 1, 2021 to October 31, 2021. It is intended to help you understand the
ongoing costs associated with investing in each mutual fund and to compare these costs with the ongoing
costs of investing in other mutual funds.
There are two parts of each Fund’s chart:
Actual
In this part of the chart, you’ll see the actual expenses you would have paid on a $1,000 investment made at
the beginning of the period and held for the entire period in each fund from May 1, 2021 to October 31,
2021, the period covered by this report. This chart also shows the actual returns, after expenses, you would
have earned during that time. This chart can help you estimate your own expenses. For example, if you invested
$8,600 in Class A shares of the fund, simply divide $8,600 by $1,000, then multiply that result by the figure
in the Actual Expenses per $1,000 row. In this example, you would multiply 8.6 times the figure.
Hypothetical
In this part of the chart, you’ll see the hypothetical expenses you would have paid on a $1,000 investment
from May 1, 2021 to October 31, 2021, and the hypothetical returns, after expenses, you would have earned
during that time. The Securities and Exchange Commission (SEC) has established the guidelines for this chart,
including the assumed 5% annual rate of return before expenses, which is what you’ll see in the chart.
Note that this chart will not help you determine your own expenses, but will help you compare expenses of
the fund you own to the expenses of another fund since the information for that fund should be calculated
using the same assumptions.
Please note that the expenses shown in the chart are meant to highlight your ongoing costs only and do not
include any transactional costs, such as sales charges (loads), redemption fees or exchange fees. Therefore,
the second line of the chart is useful in comparing ongoing costs only and will not help you determine the
relative total costs of owning different funds. In addition, if these transaction costs were included, your costs
would have been higher.

82 CALAMOS OPEN-END FAMILY OF FUNDS ANNUAL REPORT
Expense Example
The actual and hypothetical examples shown assume a $1,000 investment at the beginning of the period, April 1, 2021and held through October 31, 2021. CLASS A CLASS C CLASS I CLASS R6 SHARES SHARES SHARES SHARESCALAMOS MARKET NEUTRAL INCOME FUND
Actual Expenses per $1,000* $ 5.86 $ 9.66 $ 4.59 $ 4.23Actual – Ending Balance $1,021.90 $1,018.00 $1,022.70 $1,023.00
Hypothetical Expenses per $1,000* $ 5.85 $ 9.65 $ 4.58 $ 4.23Hypothetical – Ending Value $1,019.41 $1,015.63 $1,020.67 $1,021.02
Annualized expense ratio(1),(2) 1.15% 1.90% 0.90% 0.83%CALAMOS HEDGED EQUITY FUND
Actual Expenses per $1,000** $ 6.05 $ 9.92 $ 4.76 $ —Actual – Ending Balance $1,051.80 $1,048.80 $1,053.70 $ —
Hypothetical Expenses per $1,000** $ 5.96 $ 9.75 $ 4.69 $ —Hypothetical – Ending Value $1,019.31 $1,015.53 $1,020.57 $ —
Annualized expense ratio 1.17% 1.92% 0.92% —CALAMOS PHINEUS LONG/SHORT FUND
Actual Expenses per $1,000** $ 11.40 $ 15.07 $ 10.17 $ —Actual – Ending Balance $ 957.20 $ 953.70 $ 958.30 $ —
Hypothetical Expenses per $1,000** $ 11.72 $ 15.50 $ 10.46 $ —Hypothetical – Ending Value $1,013.56 $1,009.78 $1,014.82 $ —
Annualized expense ratio(1),(2) 2.31% 3.06% 2.06% —CALAMOS CONVERTIBLE FUND
Actual Expenses per $1,000** $ 5.58 $ 9.40 $ 4.30 $ —Actual – Ending Balance $1,029.90 $1,026.10 $1,031.30 $ —
Hypothetical Expenses per $1,000** $ 5.55 $ 9.35 $ 4.28 $ —Hypothetical – Ending Value $1,019.71 $1,015.93 $1,020.97 $ —
Annualized expense ratio 1.09% 1.84% 0.84% —CALAMOS GLOBAL CONVERTIBLE FUND
Actual Expenses per $1,000** $ 6.33 $ 10.10 $ 5.06 $ —Actual – Ending Balance $1,008.10 $1,004.20 $1,009.40 $ —
Hypothetical Expenses per $1,000** $ 6.36 $ 10.16 $ 5.09 $ —Hypothetical – Ending Value $1,018.90 $1,015.12 $1,020.16 $ —
Annualized expense ratio 1.25% 2.00% 1.00% —CALAMOS TIMPANI SMALL CAP GROWTH FUND(a)
Actual Expenses per $1,000* $ 6.68 $ 7.38 $ 5.40 $ 4.89Actual – Ending Balance $1,039.60 $1,037.50 $1,040.80 $1,041.20
Hypothetical Expenses per $1,000* $ 6.61 $ 7.28 $ 5.35 $ 4.84Hypothetical – Ending Value $1,018.65 $1,010.60 $1,019.91 $1,020.42
Annualized expense ratio(3) 1.30% 2.05% 1.05% 0.95%
* Expenses for all Fund Classes A, C, I, and R6, are equal to the Fund’s annualized expense ratio, multiplied by the average account value over the period, multiplied by 184/365.
** Expenses for all Fund Classes A, C, and I are equal to the Fund’s annualized expense ratio, multiplied by the average account value over the period, multiplied by 184/365.
(a) June 25, 2021 (commencement of operations) through October 31, 2021. Expenses for Class C of the Timpani Small Cap Growth Fund are equal to the Fund’s annualizedexpense ratio, multiplied by the average account value from inception to period end, multiplied by 129/365.
(1) Annualized Expense Ratios for Market Neutral Income Fund are adjusted to reflect fee waiver related to its investment in an affiliated fund.
(2) Includes 0.11% and 0.67% related to dividend expense on short positions for Market Neutral Income Fund and Phineus Long/Short Fund, respectively.
(3) Annualized Expense Ratios for Hedged Equity Fund and Timpani Small Cap Growth Fund are adjusted to reflect an expense limitation agreement.

83www.calamos.com
Expense Example
The actual and hypothetical examples shown assume a $1,000 investment at the beginning of the period, April 1, 2021and held through October 31, 2021. CLASS A CLASS C CLASS I CLASS R6 SHARES SHARES SHARES SHARESCALAMOS TIMPANI SMID GROWTH FUND
Actual Expenses per $1,000*** $ 7.08 $ — $ 5.77 $ 5.67Actual – Ending Balance $1,081.00 $ — $1,082.30 $1,082.30
Hypothetical Expenses per $1,000*** $ 6.87 $ — $ 5.60 $ 5.50Hypothetical – Ending Value $1,018.40 $ — $1,019.66 $1,019.76
Annualized expense ratio(4) 1.35% — 1.10% 1.08%CALAMOS GROWTH FUND
Actual Expenses per $1,000** $ 6.82 $ 10.82 $ 5.48 $ —Actual – Ending Balance $1,129.80 $1,125.80 $1,131.20 $ —
Hypothetical Expenses per $1,000** $ 6.46 $ 10.26 $ 5.19 $ —Hypothetical – Ending Value $1,018.80 $1,015.02 $1,020.06 $ —
Annualized expense ratio 1.27% 2.02% 1.02% —CALAMOS GROWTH AND INCOME FUND
Actual Expenses per $1,000* $ 5.50 $ 9.41 $ 4.20 $ 3.78Actual – Ending Balance $1,079.10 $1,075.10 $1,080.50 $1,081.10
Hypothetical Expenses per $1,000* $ 5.35 $ 9.15 $ 4.08 $ 3.67Hypothetical – Ending Value $1,019.91 $1,016.13 $1,021.17 $1,021.58
Annualized expense ratio 1.05% 1.80% 0.80% 0.72%CALAMOS DIVIDEND GROWTH FUND
Actual Expenses per $1,000** $ 7.21 $ 11.16 $ 5.89 $ —Actual – Ending Balance $1,102.30 $1,097.90 $1,103.60 $ —
Hypothetical Expenses per $1,000** $ 6.92 $ 10.71 $ 5.65 $ —Hypothetical – Ending Value $1,018.35 $1,014.57 $1,019.61 $ —
Annualized expense ratio(4) 1.36% 2.11% 1.11% —CALAMOS SELECT FUND
Actual Expenses per $1,000** $ 6.10 $ 10.06 $ 4.78 $ —Actual – Ending Balance $1,104.60 $1,099.80 $1,105.60 $ —
Hypothetical Expenses per $1,000** $ 5.85 $ 9.65 $ 4.58 $ —Hypothetical – Ending Value $1,019.41 $1,015.63 $1,020.67 $ —
Annualized expense ratio(4) 1.15% 1.90% 0.90% —CALAMOS INTERNATIONAL GROWTH FUND
Actual Expenses per $1,000* $ 5.67 $ 9.53 $ 4.39 $ 3.93Actual – Ending Balance $1,046.80 $1,043.10 $1,048.40 $1,049.00
Hypothetical Expenses per $1,000* $ 5.60 $ 9.40 $ 4.33 $ 3.87Hypothetical – Ending Value $1,019.66 $1,015.88 $1,020.92 $1,021.37
Annualized expense ratio(4) 1.10% 1.85% 0.85% 0.76%
* Expenses for all Fund Classes A, C, I, and R6, are equal to the Fund’s annualized expense ratio, multiplied by the average account value over the period, multiplied by 184/365.
** Expenses for all Fund Classes A, C, and I are equal to the Fund’s annualized expense ratio, multiplied by the average account value over the period, multiplied by 184/365.
*** Expenses for all Fund Classes A, I, and R6 are equal to the Fund’s annualized expense ratio, multiplied by the average account value over the period, multiplied by 184/365.
(4) Annualized Expense Ratios for Timpani SMID Growth Fund, Dividend Growth Fund, Select Fund, and International Growth Fund are adjusted to reflect an expense limitationagreement.

84 CALAMOS OPEN-END FAMILY OF FUNDS ANNUAL REPORT
Expense Example
The actual and hypothetical examples shown assume a $1,000 investment at the beginning of the period, April 1, 2021and held through October 31, 2021. CLASS A CLASS C CLASS I CLASS R6 SHARES SHARES SHARES SHARESCALAMOS EVOLVING WORLD GROWTH FUND
Actual Expenses per $1,000** $ 6.50 $ 10.21 $ 5.27 $ —Actual – Ending Balance $ 969.50 $ 966.20 $ 971.10 $ —
Hypothetical Expenses per $1,000** $ 6.67 $ 10.46 $ 5.40 $ —Hypothetical – Ending Value $1,018.60 $1,014.82 $1,019.86 $ —
Annualized expense ratio(5) 1.31% 2.06% 1.06% —CALAMOS GLOBAL EQUITY FUND
Actual Expenses per $1,000* $ 7.37 $ 11.30 $ 6.06 $ 5.69Actual – Ending Balance $1,088.20 $1,085.00 $1,090.30 $1,090.20
Hypothetical Expenses per $1,000* $ 7.12 $ 10.92 $ 5.85 $ 5.50Hypothetical – Ending Value $1,018.15 $1,014.37 $1,019.41 $1,019.76
Annualized expense ratio(5) 1.40% 2.15% 1.15% 1.08%CALAMOS GLOBAL OPPORTUNITIES FUND (formerly, Calamos Global Growth and Income Fund)
Actual Expenses per $1,000** $ 6.39 $ 10.29 $ 5.08 $ —Actual – Ending Balance $1,076.40 $1,071.60 $1,076.50 $ —
Hypothetical Expenses per $1,000** $ 6.21 $ 10.01 $ 4.94 $ —Hypothetical – Ending Value $1,019.05 $1,015.27 $1,020.32 $ —
Annualized expense ratio(6) 1.22% 1.97% 0.97% —CALAMOS TOTAL RETURN BOND FUND
Actual Expenses per $1,000** $ 4.56 $ 8.35 $ 3.30 $ —Actual – Ending Balance $1,009.90 $1,007.10 $1,011.20 $ —
Hypothetical Expenses per $1,000** $ 4.58 $ 8.39 $ 3.31 $ —Hypothetical – Ending Value $1,020.67 $1,016.89 $1,021.93 $ —
Annualized expense ratio(6) 0.90% 1.65% 0.65% —CALAMOS HIGH INCOME OPPORTUNITIES FUND
Actual Expenses per $1,000** $ 5.10 $ 8.91 $ 3.83 $ —Actual – Ending Balance $1,023.40 $1,020.30 $1,024.60 $ —
Hypothetical Expenses per $1,000** $ 5.09 $ 8.89 $ 3.82 $ —Hypothetical – Ending Value $1,020.16 $1,016.38 $1,021.42 $ —
Annualized expense ratio(6) 1.00% 1.75% 0.75% —CALAMOS SHORT-TERM BOND FUND
Actual Expenses per $1,000**** $ 3.27 $ — $ 2.02 $ —Actual – Ending Balance $ 998.40 $ — $1,000.70 $ —
Hypothetical Expenses per $1,000**** $ 3.31 $ — $ 2.04 $ —Hypothetical – Ending Value $1,021.93 $ — $1,023.19 $ —
Annualized expense ratio(6) 0.65% — 0.40% —
* Expenses for all Fund Classes A, C, I, and R6, are equal to the Fund’s annualized expense ratio, multiplied by the average account value over the period, multiplied by184/365.
** Expenses for all Fund Classes A, C, and I are equal to the Fund’s annualized expense ratio, multiplied by the average account value over the period, multiplied by 184/365.
**** Expenses for all Fund Classes A and I are equal to the Fund’s annualized expense ratio, multiplied by the average account value over the period, multiplied by 184/365.
(5) Annualized Expense Ratios for Evolving World Growth Fund and Global Equity Fund are adjusted to reflect an expense limitation agreement.
(6) Annualized Expense Ratios for Global Opportunities Fund (formerly, Global Growth and Income Fund), Total Return Bond Fund, High Income Opportunities Fund and Short-Term Bond Fund are adjusted to reflect fee waiver.

85www.calamos.com
Market Neutral Income Fund Schedule of Investments October 31, 2021
PRINCIPAL AMOUNT VALUE
PRINCIPAL AMOUNT VALUE
CONVERTIBLE BONDS (36.5%)Communication Services (5.7%)
25,000,000 EUR America Movil, BV 0.000%, 03/02/24 $ 29,533,485 Bandwidth, Inc. 15,000,000 0.250%, 03/01/26^~ 17,451,000 7,500,000 0.500%, 04/01/28* 6,275,775 Bilibili, Inc. 12,000,000 1.375%, 04/01/26~ 36,424,680 5,000,000 1.250%, 06/15/27 9,767,550 15,000,000 EUR Cellnex Telecom, SA 1.500%, 01/16/26 31,610,123 1,000,000,000 JPY CyberAgent, Inc. 0.000%, 02/19/25 11,740,118 Eventbrite, Inc. 2,500,000 5.000%, 12/01/25 4,557,875 1,953,000 0.750%, 09/15/26* 2,010,067 12,500,000 Hello Group, Inc. 1.250%, 07/01/25 11,173,250 iQIYI, Inc.^ 20,000,000 2.000%, 04/01/25~ 17,871,200 19,667,000 4.000%, 12/15/26 17,225,735 JOYY, Inc. 10,000,000 1.375%, 06/15/26 9,085,700 10,000,000 0.750%, 06/15/25 9,233,100 5,000,000 Liberty Media Corp. / Liberty Formula One 1.000%, 01/30/23 7,655,800 15,500,000 Lyft, Inc.~ 1.500%, 05/15/25 21,602,505 18,000,000 Magnite, Inc.* 0.250%, 03/15/26 15,011,820 10,000,000 Match Group Financeco 2, Inc.* 0.875%, 06/15/26 18,168,300 15,000,000 Match Group Financeco 3, Inc.^~* 2.000%, 01/15/30 29,388,000 2,500,000 Radius Global Infrastructure, Inc.* 2.500%, 09/15/26 2,586,050 Sea, Ltd.~ 38,790,000 0.250%, 09/15/26 40,836,173 15,000,000 2.375%, 12/01/25 57,241,950 10,000,000 1.000%, 12/01/24 68,483,500 Snap, Inc.~ 27,897,000 0.000%, 05/01/27* 28,292,579 24,970,000 0.750%, 08/01/26^ 59,693,282 10,000,000 0.250%, 05/01/25 24,696,400 55,000,000 Spotify USA, Inc.^~* 0.000%, 03/15/26 52,427,100 7,500,000 TechTarget, Inc.* 0.125%, 12/15/25 10,977,600 10,000,000 TripAdvisor, Inc.* 0.250%, 04/01/26 9,012,800
Twitter, Inc.~ 67,500,000 0.000%, 03/15/26* $ 61,871,175 39,000,000 0.250%, 06/15/24 46,028,580 19,250,000 World Wrestling Entertainment, Inc.~ 3.375%, 12/15/23 48,134,817 Zillow Group, Inc. 18,000,000 0.750%, 09/01/24~ 43,203,060 7,500,000 1.375%, 09/01/26 18,340,950 Zynga, Inc. 32,500,000 0.250%, 06/01/24~ 36,921,625 17,500,000 0.000%, 12/15/26^* 16,898,175 931,431,899
Consumer Discretionary (7.8%) 8,625,000 2U, Inc. 2.250%, 05/01/25 11,047,763 56,393,000 Airbnb, Inc.^~* 0.000%, 03/15/26 55,459,696 5,000,000 American Eagle Outfitters, Inc.^ 3.750%, 04/15/25 14,234,450 15,000,000 Carnival Corp.^~ 5.750%, 04/01/23 34,560,000 3,009,000 Cheesecake Factory, Inc.^ 0.375%, 06/15/26 2,744,148 Chegg, Inc. 13,457,000 0.125%, 03/15/25^~ 17,785,579 12,500,000 0.000%, 09/01/26 11,651,750 7,500,000 Cracker Barrel Old Country Store, Inc.* 0.625%, 06/15/26 7,359,675 Delivery Hero, SE 15,000,000 EUR 1.000%, 01/23/27 22,374,840 10,000,000 EUR 1.500%, 01/15/28 11,714,093 19,200,000 Dick’s Sporting Goods, Inc.~ 3.250%, 04/15/25 73,086,144 49,456,000 DraftKings, Inc.~* 0.000%, 03/15/28 43,218,609 Etsy, Inc.~ 35,000,000 0.250%, 06/15/28* 44,533,650 30,000,000 0.125%, 10/01/26 86,804,400 7,941,000 Expedia Group, Inc.^* 0.000%, 02/15/26 8,570,960 10,000,000 Farfetch, Ltd.^~ 3.750%, 05/01/27 25,904,200 15,000,000 Fiverr International, Ltd.^ 0.000%, 11/01/25 16,599,450 6,500,000 Groupon, Inc.* 1.125%, 03/15/26 5,073,055 15,000,000 Guess?, Inc. 2.000%, 04/15/24 16,658,700 10,000,000 Li Auto, Inc.* 0.250%, 05/01/28 13,400,900
See accompanying Notes to Schedule of Investments

86 CALAMOS OPEN-END FAMILY OF FUNDS ANNUAL REPORT
Market Neutral Income Fund Schedule of Investments October 31, 2021
PRINCIPAL AMOUNT VALUE
PRINCIPAL AMOUNT VALUE
7,000,000 Marriott Vacations Worldwide Corp.*
0.000%, 01/15/26 $ 7,891,660 10,000,000 Meituan 0.000%, 04/27/27 10,058,600 12,500,000 MercadoLibre, Inc.^~ 2.000%, 08/15/28 42,291,500 7,500,000 National Vision Holdings, Inc. 2.500%, 05/15/25 15,478,500 27,500,000 NCL Corp. Ltd.~ 6.000%, 05/15/24 56,818,575 NIO, Inc.* 10,199,000 0.500%, 02/01/27 8,697,095 10,000,000 0.000%, 02/01/26^ 8,931,700 10,000,000 GBP Ocado Group, PLC 0.750%, 01/18/27 13,257,151 37,500,000 Peloton Interactive, Inc.~* 0.000%, 02/15/26 33,510,375 Pinduoduo, Inc. 10,000,000 0.000%, 12/01/25^ 9,388,600 6,750,000 0.000%, 10/01/24~ 14,133,082 5,000,000 Porch Group, Inc.^* 0.750%, 09/15/26 5,507,600 3,500,000 Quotient Technology, Inc. 1.750%, 12/01/22 3,429,685 Royal Caribbean Cruises, Ltd. 22,916,000 4.250%, 06/15/23~ 30,913,913 5,000,000 2.875%, 11/15/23^* 6,270,900 10,245,000 Shake Shack, Inc.* 0.000%, 03/01/28 8,413,501 10,833,000 Stride, Inc. 1.125%, 09/01/27 10,916,089 16,822,000 Tesla, Inc.~ 2.000%, 05/15/24 301,872,136 7,764,000 Vail Resorts, Inc.^* 0.000%, 01/01/26 8,534,422 11,632,000 Vroom, Inc.* 0.750%, 07/01/26 9,001,074 Wayfair, Inc.~ 35,000,000 1.000%, 08/15/26 63,731,150 29,821,000 1.125%, 11/01/24 65,632,741 12,590,000 0.625%, 10/01/25 12,421,923 7,000,000 Winnebago Industries, Inc. 1.500%, 04/01/25 8,943,200 1,278,827,234
Consumer Staples (0.4%) 11,500,000 Beauty Health Company^* 1.250%, 10/01/26 13,079,065 36,755,000 Beyond Meat, Inc.~* 0.000%, 03/15/27 30,757,319 15,000,000 Herbalife Nutrition, Ltd. 2.625%, 03/15/24 15,620,550
4,000,000 Turning Point Brands, Inc. 2.500%, 07/15/24 $ 4,126,240 610,000,000 JPY Yaoko Company, Ltd. 0.000%, 06/20/24 6,264,469 69,847,643
Energy (0.7%) 15,000,000 Chesapeake Energy Corp. 5.500%, 09/15/26 951,600 66,500,000 Pioneer Natural Resources Company~ 0.250%, 05/15/25 118,070,085 119,021,685
Financials (1.1%) 60,000,000 Coinbase Global, Inc.^~* 0.500%, 06/01/26 71,065,800 8,052,000 GSK Finance No 3, PLC* 0.000%, 06/22/23 7,914,713 5,000,000 Hope Bancorp, Inc. 2.000%, 05/15/38 4,891,550 25,000,000 JPMorgan Chase Bank NA 0.000%, 12/28/23 24,949,000 10,467,000 JPMorgan Chase Financial Company, LLC (Voya Financial, Inc.)§ 0.250%, 05/01/23 11,667,146 LendingTree, Inc. 15,000,000 0.500%, 07/15/25^ 12,813,150 12,500,000 0.625%, 06/01/22~ 12,859,125 5,000,000 Realogy Group, LLC / Realogy Co-Issuer Corp.* 0.250%, 06/15/26 5,089,800 10,000,000 SoFi Technologies, Inc.* 0.000%, 10/15/26 11,732,600 10,000,000 Upstart Holdings, Inc.* 0.250%, 08/15/26 13,982,000 176,964,884
Health Care (3.1%) 5,000,000 Accolade, Inc.* 0.500%, 04/01/26 5,337,550 10,500,000 Allscripts Healthcare Solutions, Inc. 0.875%, 01/01/27 12,659,745 4,000,000 Alphatec Holdings, Inc.* 0.750%, 08/01/26 3,838,920 Bridgebio Pharma, Inc. 10,000,000 2.500%, 03/15/27 14,405,300 10,000,000 2.250%, 02/01/29* 8,970,600 3,759,000 Coherus Biosciences, Inc. 1.500%, 04/15/26 4,273,946 3,500,000 Collegium Pharmaceutical, Inc. 2.625%, 02/15/26 3,490,830 10,000,000 CONMED Corp. 2.625%, 02/01/24 17,168,900
See accompanying Notes to Schedule of Investments

87www.calamos.com
Market Neutral Income Fund Schedule of Investments October 31, 2021
PRINCIPAL AMOUNT VALUE
PRINCIPAL AMOUNT VALUE
15,000,000 Dexcom, Inc.~ 0.750%, 12/01/23 $ 56,728,050 5,000,000 Evolent Health, Inc. 1.500%, 10/15/25 5,634,700 4,000,000 Flexion Therapeutics, Inc. 3.375%, 05/01/24 3,967,720 5,000,000 Haemonetics Corp.* 0.000%, 03/01/26 4,390,100 Halozyme Therapeutics, Inc. 19,000,000 0.250%, 03/01/27* 16,788,020 10,000,000 1.250%, 12/01/24 16,813,000 17,000,000 Innoviva, Inc.~ 2.500%, 08/15/25 20,930,230 9,000,000 Insmed, Inc.^ 0.750%, 06/01/28 10,471,950 10,000,000 Insulet Corp. 0.375%, 09/01/26 14,830,700 5,000,000 Intercept Pharmaceuticals, Inc. 2.000%, 05/15/26 3,076,000 11,243,000 Ionis Pharmaceuticals, Inc. 0.125%, 12/15/24 10,200,324 Ironwood Pharmaceuticals, Inc. 9,500,000 1.500%, 06/15/26 11,397,530 7,500,000 0.750%, 06/15/24 8,793,525 2,423,000 2.250%, 06/15/22 2,589,242 22,500,000 Jazz Investments I, Ltd.~ 2.000%, 06/15/26 26,228,925 20,000,000 Livongo Health, Inc.^ 0.875%, 06/01/25 29,221,000 5,000,000 Mesa Laboratories, Inc. 1.375%, 08/15/25 6,151,800 7,000,000 Natera, Inc.^~ 2.250%, 05/01/27 21,510,370 10,000,000 NeoGenomics, Inc.^ 0.250%, 01/15/28 10,100,400 7,500,000 Neurocrine Biosciences, Inc.~ 2.250%, 05/15/24 10,616,475 15,000,000 Novocure, Ltd.~* 0.000%, 11/01/25 15,354,600 10,000,000 NuVasive, Inc.^ 0.375%, 03/15/25 9,484,200 27,500,000 Oak Street Health, Inc.* 0.000%, 03/15/26 25,725,150 12,500,000 Omnicell, Inc. 0.250%, 09/15/25 23,356,750 2,500,000 OPKO Health, Inc. 4.500%, 02/15/25 3,114,500 11,233,000 Pacira BioSciences, Inc.^ 0.750%, 08/01/25 11,856,319 4,000,000 Revance Therapeutics, Inc. 1.750%, 02/15/27 3,303,080 20,000,000 Sarepta Therapeutics, Inc.~ 1.500%, 11/15/24 27,053,400
12,500,000 SmileDirectClub, Inc.* 0.000%, 02/01/26 $ 8,686,875 10,000,000 Supernus Pharmaceuticals, Inc. 0.625%, 04/01/23 9,933,900 5,000,000 Tabula Rasa HealthCare, Inc. 1.750%, 02/15/26 4,189,650 7,400,000 Tilray, Inc. 5.000%, 10/01/23 7,274,052 5,000,000 Travere Therapeutics, Inc. 2.500%, 09/15/25 5,320,700 2,000,000 Vocera Communications, Inc.* 0.500%, 09/15/26 2,293,080 517,532,108
Industrials (0.8%) 4,750,000 Aerojet Rocketdyne Holdings, Inc.~ 2.250%, 12/15/23 8,147,295 10,285,000 Air Canada 4.000%, 07/01/25 14,570,760 10,000,000 American Airlines Group, Inc.^ 6.500%, 07/01/25 14,629,000 11,250,000 FTI Consulting, Inc.^ 2.000%, 08/15/23 16,620,525 6,600,000 Greenbrier Companies, Inc.^* 2.875%, 04/15/28 6,871,458 5,000,000 John Bean Technologies Corp.* 0.250%, 05/15/26 5,463,300 8,467,000 Middleby Corp. 1.000%, 09/01/25 12,755,281 30,000,000 Southwest Airlines Company~ 1.250%, 05/01/25 42,194,700 10,000,000 Spirit Airlines, Inc.^ 1.000%, 05/15/26 9,102,600 9,500,000 Upwork, Inc.* 0.250%, 08/15/26 10,182,195 140,537,114
Information Technology (15.7%) 7,500,000 8x8, Inc.^ 0.500%, 02/01/24 8,360,175 Akamai Technologies, Inc.~ 43,500,000 0.375%, 09/01/27 47,882,190 40,000,000 0.125%, 05/01/25 49,006,000 10,000,000 Altair Engineering, Inc.~ 0.250%, 06/01/24 17,142,800 Alteryx, Inc. 10,000,000 1.000%, 08/01/26^ 9,373,200 10,000,000 0.500%, 08/01/24 9,489,700 29,000,000 Avalara, Inc.~* 0.250%, 08/01/26 30,403,600 5,000,000 Avaya Holdings Corp. 2.250%, 06/15/23 5,177,650 7,500,000 Benefitfocus, Inc. 1.250%, 12/15/23 7,162,050
See accompanying Notes to Schedule of Investments
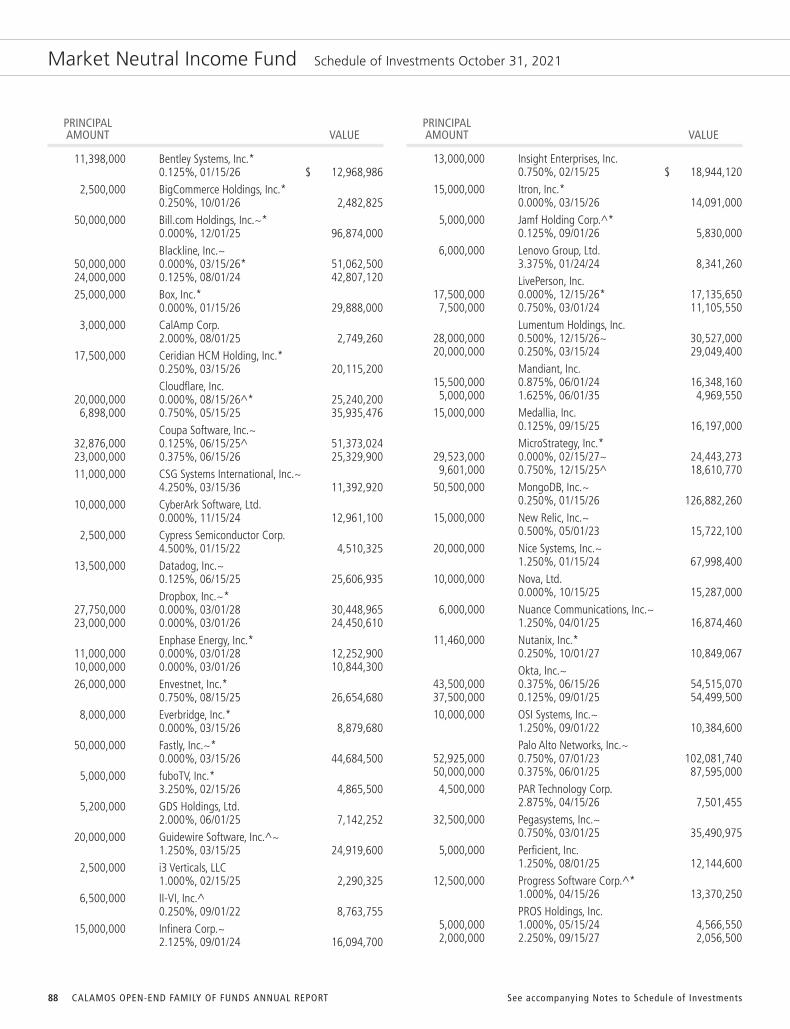
88 CALAMOS OPEN-END FAMILY OF FUNDS ANNUAL REPORT
Market Neutral Income Fund Schedule of Investments October 31, 2021
PRINCIPAL AMOUNT VALUE
PRINCIPAL AMOUNT VALUE
11,398,000 Bentley Systems, Inc.* 0.125%, 01/15/26 $ 12,968,986 2,500,000 BigCommerce Holdings, Inc.* 0.250%, 10/01/26 2,482,825 50,000,000 Bill.com Holdings, Inc.~* 0.000%, 12/01/25 96,874,000 Blackline, Inc.~ 50,000,000 0.000%, 03/15/26* 51,062,500 24,000,000 0.125%, 08/01/24 42,807,120 25,000,000 Box, Inc.* 0.000%, 01/15/26 29,888,000 3,000,000 CalAmp Corp. 2.000%, 08/01/25 2,749,260 17,500,000 Ceridian HCM Holding, Inc.* 0.250%, 03/15/26 20,115,200 Cloudflare, Inc. 20,000,000 0.000%, 08/15/26^* 25,240,200 6,898,000 0.750%, 05/15/25 35,935,476 Coupa Software, Inc.~ 32,876,000 0.125%, 06/15/25^ 51,373,024 23,000,000 0.375%, 06/15/26 25,329,900 11,000,000 CSG Systems International, Inc.~ 4.250%, 03/15/36 11,392,920 10,000,000 CyberArk Software, Ltd. 0.000%, 11/15/24 12,961,100 2,500,000 Cypress Semiconductor Corp. 4.500%, 01/15/22 4,510,325 13,500,000 Datadog, Inc.~ 0.125%, 06/15/25 25,606,935 Dropbox, Inc.~* 27,750,000 0.000%, 03/01/28 30,448,965 23,000,000 0.000%, 03/01/26 24,450,610 Enphase Energy, Inc.* 11,000,000 0.000%, 03/01/28 12,252,900 10,000,000 0.000%, 03/01/26 10,844,300 26,000,000 Envestnet, Inc.* 0.750%, 08/15/25 26,654,680 8,000,000 Everbridge, Inc.* 0.000%, 03/15/26 8,879,680 50,000,000 Fastly, Inc.~* 0.000%, 03/15/26 44,684,500 5,000,000 fuboTV, Inc.* 3.250%, 02/15/26 4,865,500 5,200,000 GDS Holdings, Ltd. 2.000%, 06/01/25 7,142,252 20,000,000 Guidewire Software, Inc.^~ 1.250%, 03/15/25 24,919,600 2,500,000 i3 Verticals, LLC 1.000%, 02/15/25 2,290,325 6,500,000 II-VI, Inc.^ 0.250%, 09/01/22 8,763,755 15,000,000 Infinera Corp.~ 2.125%, 09/01/24 16,094,700
13,000,000 Insight Enterprises, Inc. 0.750%, 02/15/25 $ 18,944,120 15,000,000 Itron, Inc.* 0.000%, 03/15/26 14,091,000 5,000,000 Jamf Holding Corp.^* 0.125%, 09/01/26 5,830,000 6,000,000 Lenovo Group, Ltd. 3.375%, 01/24/24 8,341,260 LivePerson, Inc. 17,500,000 0.000%, 12/15/26* 17,135,650 7,500,000 0.750%, 03/01/24 11,105,550 Lumentum Holdings, Inc. 28,000,000 0.500%, 12/15/26~ 30,527,000 20,000,000 0.250%, 03/15/24 29,049,400 Mandiant, Inc. 15,500,000 0.875%, 06/01/24 16,348,160 5,000,000 1.625%, 06/01/35 4,969,550 15,000,000 Medallia, Inc. 0.125%, 09/15/25 16,197,000 MicroStrategy, Inc.* 29,523,000 0.000%, 02/15/27~ 24,443,273 9,601,000 0.750%, 12/15/25^ 18,610,770 50,500,000 MongoDB, Inc.~ 0.250%, 01/15/26 126,882,260 15,000,000 New Relic, Inc.~ 0.500%, 05/01/23 15,722,100 20,000,000 Nice Systems, Inc.~ 1.250%, 01/15/24 67,998,400 10,000,000 Nova, Ltd. 0.000%, 10/15/25 15,287,000 6,000,000 Nuance Communications, Inc.~ 1.250%, 04/01/25 16,874,460 11,460,000 Nutanix, Inc.* 0.250%, 10/01/27 10,849,067 Okta, Inc.~ 43,500,000 0.375%, 06/15/26 54,515,070 37,500,000 0.125%, 09/01/25 54,499,500 10,000,000 OSI Systems, Inc.~ 1.250%, 09/01/22 10,384,600 Palo Alto Networks, Inc.~ 52,925,000 0.750%, 07/01/23 102,081,740 50,000,000 0.375%, 06/01/25 87,595,000 4,500,000 PAR Technology Corp. 2.875%, 04/15/26 7,501,455 32,500,000 Pegasystems, Inc.~ 0.750%, 03/01/25 35,490,975 5,000,000 Perficient, Inc. 1.250%, 08/01/25 12,144,600 12,500,000 Progress Software Corp.^* 1.000%, 04/15/26 13,370,250 PROS Holdings, Inc. 5,000,000 1.000%, 05/15/24 4,566,550 2,000,000 2.250%, 09/15/27 2,056,500
See accompanying Notes to Schedule of Investments

89www.calamos.com
Market Neutral Income Fund Schedule of Investments October 31, 2021
PRINCIPAL AMOUNT VALUE
PRINCIPAL AMOUNT VALUE
Q2 Holdings, Inc. 20,000,000 0.125%, 11/15/25* $ 18,305,000 5,625,000 0.750%, 06/01/26 6,278,569 12,500,000 Rapid7, Inc.* 0.250%, 03/15/27 17,186,875 7,500,000 Repay Holdings Corp.* 0.000%, 02/01/26 6,962,475 24,500,000 RingCentral, Inc. 0.000%, 03/15/26 23,903,670 17,500,000 Sailpoint Technologies Holdings, Inc.~ 0.125%, 09/15/24 30,881,550 Shift4 Payments, Inc.* 17,500,000 0.500%, 08/01/27^ 16,300,025 15,000,000 0.000%, 12/15/25 16,265,400 10,426,000 Shopify, Inc.^ 0.125%, 11/01/25 13,207,970 30,000,000 Silicon Laboratories, Inc.~ 0.625%, 06/15/25 48,242,700 5,000,000 SMART Global Holdings, Inc. 2.250%, 02/15/26 7,441,800 Splunk, Inc. 40,000,000 0.500%, 09/15/23~ 50,028,800 27,500,000 1.125%, 09/15/25~ 35,929,850 10,000,000 1.125%, 06/15/27 10,436,000 Square, Inc. 35,000,000 0.500%, 05/15/23~ 114,357,250 20,000,000 0.125%, 03/01/25^~ 42,897,600 10,000,000 0.000%, 05/01/26^* 11,811,900 15,000,000 Teradyne, Inc.~ 1.250%, 12/15/23 64,519,500 22,000,000 Tyler Technologies, Inc.~* 0.250%, 03/15/26 26,804,360 10,000,000 Verint Systems, Inc.^* 0.250%, 04/15/26 9,947,100 10,000,000 Vishay Intertechnology, Inc. 2.250%, 06/15/25 10,190,800 3,058,000 Vnet Group, Inc.^* 0.000%, 02/01/26 2,534,593 10,000,000 Weibo Corp.^ 1.250%, 11/15/22 9,806,300 4,217,000 Wix.com, Ltd. 0.000%, 07/01/23 5,997,375 10,000,000 Wolfspeed, Inc.^ 1.750%, 05/01/26 26,090,300 50,000,000 Workday, Inc.~ 0.250%, 10/01/22 98,916,000 17,500,000 Workiva, Inc.~ 1.125%, 08/15/26 34,636,175 Zendesk, Inc.~ 36,000,000 0.625%, 06/15/25 42,227,640 10,000,000 0.250%, 03/15/23 16,725,000 22,500,000 Zscaler, Inc.~ 0.125%, 07/01/25 48,609,450 2,578,441,190
Materials (0.3%) 10,000,000 Allegheny Technologies, Inc. 3.500%, 06/15/25 $ 13,234,100 20,000,000 CHF Sika, AG 0.150%, 06/05/25 35,934,906 49,169,006
Real Estate (0.7%) 17,700,000 IH Merger Sub, LLC~ 3.500%, 01/15/22 32,152,050 10,500,000 EUR IMMOFINANZ, AG 1.500%, 01/24/24 13,559,601 7,500,000 iStar, Inc. 3.125%, 09/15/22 13,739,100 12,500,000 Opendoor Technologies, Inc.* 0.250%, 08/15/26 17,428,625 Redfin Corp.^ 20,000,000 0.500%, 04/01/27* 18,182,600 15,000,000 0.000%, 10/15/25 15,302,700 110,364,676
Utilities (0.2%) 12,500,000 NextEra Energy Partners, LP^* 0.000%, 06/15/24 13,106,000 10,000,000 Sunnova Energy International, Inc.* 0.250%, 12/01/26 14,254,800 27,360,800
TOTAL CONVERTIBLE BONDS(Cost $4,594,408,292) 5,999,498,239
NUMBER OF SHARES VALUE
CONVERTIBLE PREFERRED STOCKS (2.5%)Communication Services (0.1%)
21,292 2020 Cash Mandatory Exchangeable Trust~*5.250%, 06/01/23 22,327,920
Consumer Discretionary (0.1%) 116,491 Aptiv, PLC
5.500%, 06/15/23 22,506,061
Consumer Staples (0.0%) 100,000 Energizer Holdings, Inc.^
7.500%, 01/15/22 7,987,000
Financials (0.2%) 15,000 2020 Mandatory Exchangeable
Trust^~*6.500%, 05/16/23 25,650,960
Health Care (0.5%) 590,000 Avantor, Inc.~ 6.250%, 05/15/22 73,030,200 3,500 Danaher Corp. 4.750%, 04/15/22 7,298,375 80,328,575
See accompanying Notes to Schedule of Investments

90 CALAMOS OPEN-END FAMILY OF FUNDS ANNUAL REPORT
Market Neutral Income Fund Schedule of Investments October 31, 2021
NUMBER OF SHARES VALUE
NUMBER OF SHARES VALUE
Industrials (0.5%) 178,572 Clarivate, PLC 5.250%, 06/01/24 $ 16,419,696 230,000 Colfax Corp.~ 5.750%, 01/15/22 48,001,000 47,143 RBC Bearings, Inc. 5.000%, 10/15/24 5,637,831 104,200 Stanley Black & Decker, Inc.^~ 5.250%, 11/15/22 11,245,264 81,303,791
Information Technology (0.1%) 50,000 II-VI, Inc.^
6.000%, 07/01/23 12,835,000
Utilities (1.0%) American Electric Power Company, Inc. 400,000 6.125%, 08/15/23~ 20,656,000 99,780 6.125%, 03/15/22^ 4,962,059 300,000 DTE Energy Company^ 6.250%, 11/01/22 15,144,000 308,881 Essential Utilities, Inc.~ 6.000%, 04/30/22 17,840,967 NextEra Energy, Inc. 650,000 4.872%, 09/01/22^~ 41,093,000 300,000 6.219%, 09/01/23 16,440,000 205,000 5.279%, 03/01/23 11,166,350 150,000 PG&E Corp. 5.500%, 08/16/23 16,965,000 400,000 Southern Company^~ 6.750%, 08/01/22 20,476,000 164,743,376
TOTAL CONVERTIBLE PREFERRED STOCKS(Cost $319,948,175) 417,682,683
COMMON STOCKS (56.4%)Communication Services (5.5%)
148,051 Activision Blizzard, Inc. 11,576,108 56,367 Alphabet, Inc. - Class A~# 166,898,177 65,241 Alphabet, Inc. - Class C~# 193,466,314 1,457,974 AT&T, Inc.~ 36,828,423 30,474 Charter Communications, Inc.# 20,566,598 1,004,840 Comcast Corp. - Class A~ 51,678,921 181,632 Fox Corp. - Class A 7,218,056 633,014 Meta Platforms, Inc. - Class A~# 204,824,340 111,746 Netflix, Inc.# 77,139,381 173,673 Twitter, Inc.# 9,298,452 935,331 Verizon Communications, Inc.~ 49,563,190 453,669 Walt Disney Company~# 76,701,818 905,759,778
Consumer Discretionary (5.7%) 100,491 Amazon.com, Inc.~# $ 338,898,863 147,002 Aptiv, PLC# 25,415,176 8,418 Booking Holdings, Inc.~# 20,378,126 10,695 Chipotle Mexican Grill, Inc. - Class A# 19,026,726 64,210 Darden Restaurants, Inc.~ 9,255,229 55,695 Dollar General Corp.~ 12,337,556 195,061 DR Horton, Inc.~ 17,413,095 182,914 eBay, Inc. 14,033,162 59,962 Expedia Group, Inc.# 9,858,352 644,462 Ford Motor Company~ 11,007,411 232,302 General Motors Company# 12,644,198 242,835 Home Depot, Inc.~ 90,271,483 131,710 Leggett & Platt, Inc. 6,170,614 196,452 Lowe’s Companies, Inc.~ 45,934,407 171,969 McDonald’s Corp. 42,226,988 213,056 MGM Resorts International 10,047,721 53,188 Mohawk Industries, Inc.~# 9,425,446 362,373 NIKE, Inc. - Class B~ 60,621,379 26,403 O’Reilly Automotive, Inc.# 16,431,115 53,069 PVH Corp.~# 5,802,034 110,876 Ross Stores, Inc.~ 12,551,163 167,016 Royal Caribbean Cruises, Ltd.# 14,101,161 269,284 Starbucks Corp.~ 28,562,954 121,820 Target Corp.~ 31,626,908 24,499 Tesla, Inc.# 27,291,886 304,712 TJX Companies, Inc.~ 19,955,589 33,521 Ulta Beauty, Inc.# 12,314,275 238,866 VF Corp. 17,408,554 941,011,571
Consumer Staples (2.9%) 451,381 Altria Group, Inc.~ 19,910,416 183,601 Archer-Daniels-Midland Company~ 11,794,528 117,993 Church & Dwight Company, Inc. 10,307,869 782,894 Coca-Cola Company 44,131,735 181,929 Colgate-Palmolive Company~ 13,861,171 91,195 Constellation Brands, Inc. - Class A 19,771,988 72,254 Costco Wholesale Corp.~ 35,515,731 198,995 General Mills, Inc. 12,297,891 146,668 Kellogg Company~ 8,990,748 109,313 Kimberly-Clark Corp. 14,154,940 252,805 Kraft Heinz Company 9,073,171 262,023 Kroger Company 10,486,160 516,052 Mondelez International, Inc. - Class A 31,344,999
See accompanying Notes to Schedule of Investments
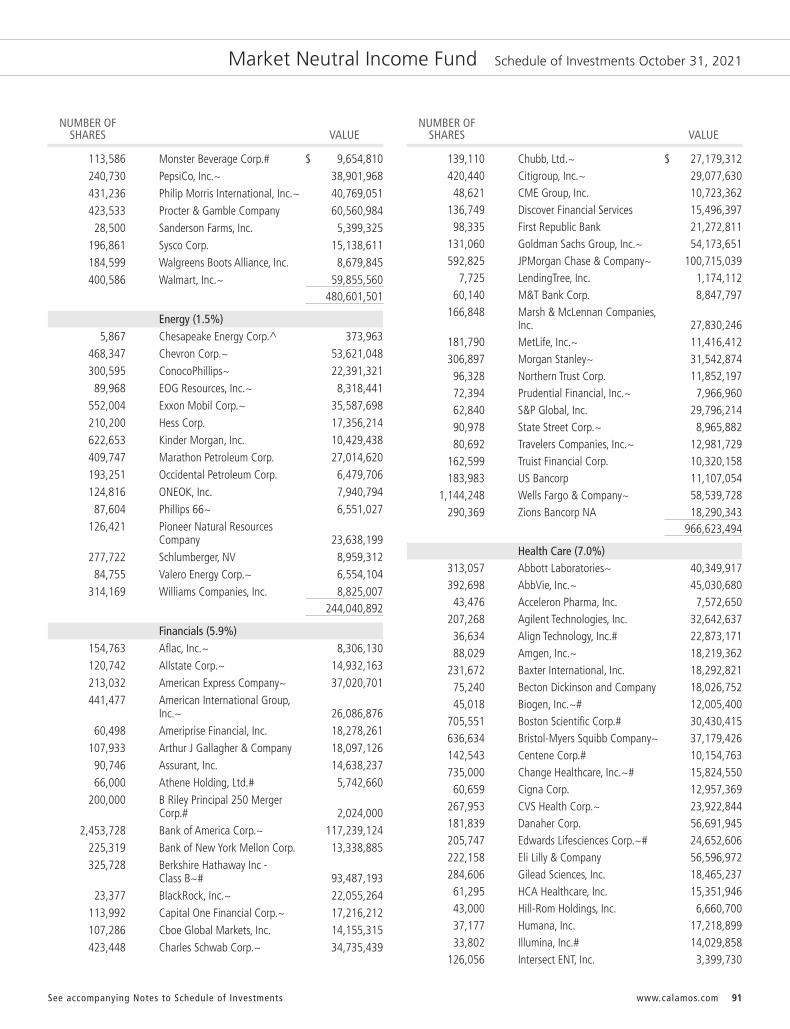
91www.calamos.com
Market Neutral Income Fund Schedule of Investments October 31, 2021
NUMBER OF SHARES VALUE
NUMBER OF SHARES VALUE
113,586 Monster Beverage Corp.# $ 9,654,810 240,730 PepsiCo, Inc.~ 38,901,968 431,236 Philip Morris International, Inc.~ 40,769,051 423,533 Procter & Gamble Company 60,560,984 28,500 Sanderson Farms, Inc. 5,399,325 196,861 Sysco Corp. 15,138,611 184,599 Walgreens Boots Alliance, Inc. 8,679,845 400,586 Walmart, Inc.~ 59,855,560 480,601,501
Energy (1.5%) 5,867 Chesapeake Energy Corp.^ 373,963 468,347 Chevron Corp.~ 53,621,048 300,595 ConocoPhillips~ 22,391,321 89,968 EOG Resources, Inc.~ 8,318,441 552,004 Exxon Mobil Corp.~ 35,587,698 210,200 Hess Corp. 17,356,214 622,653 Kinder Morgan, Inc. 10,429,438 409,747 Marathon Petroleum Corp. 27,014,620 193,251 Occidental Petroleum Corp. 6,479,706 124,816 ONEOK, Inc. 7,940,794 87,604 Phillips 66~ 6,551,027 126,421 Pioneer Natural Resources Company 23,638,199 277,722 Schlumberger, NV 8,959,312 84,755 Valero Energy Corp.~ 6,554,104 314,169 Williams Companies, Inc. 8,825,007 244,040,892
Financials (5.9%) 154,763 Aflac, Inc.~ 8,306,130 120,742 Allstate Corp.~ 14,932,163 213,032 American Express Company~ 37,020,701 441,477 American International Group, Inc.~ 26,086,876 60,498 Ameriprise Financial, Inc. 18,278,261 107,933 Arthur J Gallagher & Company 18,097,126 90,746 Assurant, Inc. 14,638,237 66,000 Athene Holding, Ltd.# 5,742,660 200,000 B Riley Principal 250 Merger Corp.# 2,024,000 2,453,728 Bank of America Corp.~ 117,239,124 225,319 Bank of New York Mellon Corp. 13,338,885 325,728 Berkshire Hathaway Inc - Class B~# 93,487,193 23,377 BlackRock, Inc.~ 22,055,264 113,992 Capital One Financial Corp.~ 17,216,212 107,286 Cboe Global Markets, Inc. 14,155,315 423,448 Charles Schwab Corp.~ 34,735,439
139,110 Chubb, Ltd.~ $ 27,179,312 420,440 Citigroup, Inc.~ 29,077,630 48,621 CME Group, Inc. 10,723,362 136,749 Discover Financial Services 15,496,397 98,335 First Republic Bank 21,272,811 131,060 Goldman Sachs Group, Inc.~ 54,173,651 592,825 JPMorgan Chase & Company~ 100,715,039 7,725 LendingTree, Inc. 1,174,112 60,140 M&T Bank Corp. 8,847,797 166,848 Marsh & McLennan Companies, Inc. 27,830,246 181,790 MetLife, Inc.~ 11,416,412 306,897 Morgan Stanley~ 31,542,874 96,328 Northern Trust Corp. 11,852,197 72,394 Prudential Financial, Inc.~ 7,966,960 62,840 S&P Global, Inc. 29,796,214 90,978 State Street Corp.~ 8,965,882 80,692 Travelers Companies, Inc.~ 12,981,729 162,599 Truist Financial Corp. 10,320,158 183,983 US Bancorp 11,107,054 1,144,248 Wells Fargo & Company~ 58,539,728 290,369 Zions Bancorp NA 18,290,343 966,623,494
Health Care (7.0%) 313,057 Abbott Laboratories~ 40,349,917 392,698 AbbVie, Inc.~ 45,030,680 43,476 Acceleron Pharma, Inc. 7,572,650 207,268 Agilent Technologies, Inc. 32,642,637 36,634 Align Technology, Inc.# 22,873,171 88,029 Amgen, Inc.~ 18,219,362 231,672 Baxter International, Inc. 18,292,821 75,240 Becton Dickinson and Company 18,026,752 45,018 Biogen, Inc.~# 12,005,400 705,551 Boston Scientific Corp.# 30,430,415 636,634 Bristol-Myers Squibb Company~ 37,179,426 142,543 Centene Corp.# 10,154,763 735,000 Change Healthcare, Inc.~# 15,824,550 60,659 Cigna Corp. 12,957,369 267,953 CVS Health Corp.~ 23,922,844 181,839 Danaher Corp. 56,691,945 205,747 Edwards Lifesciences Corp.~# 24,652,606 222,158 Eli Lilly & Company 56,596,972 284,606 Gilead Sciences, Inc. 18,465,237 61,295 HCA Healthcare, Inc. 15,351,946 43,000 Hill-Rom Holdings, Inc. 6,660,700 37,177 Humana, Inc. 17,218,899 33,802 Illumina, Inc.# 14,029,858 126,056 Intersect ENT, Inc. 3,399,730
See accompanying Notes to Schedule of Investments
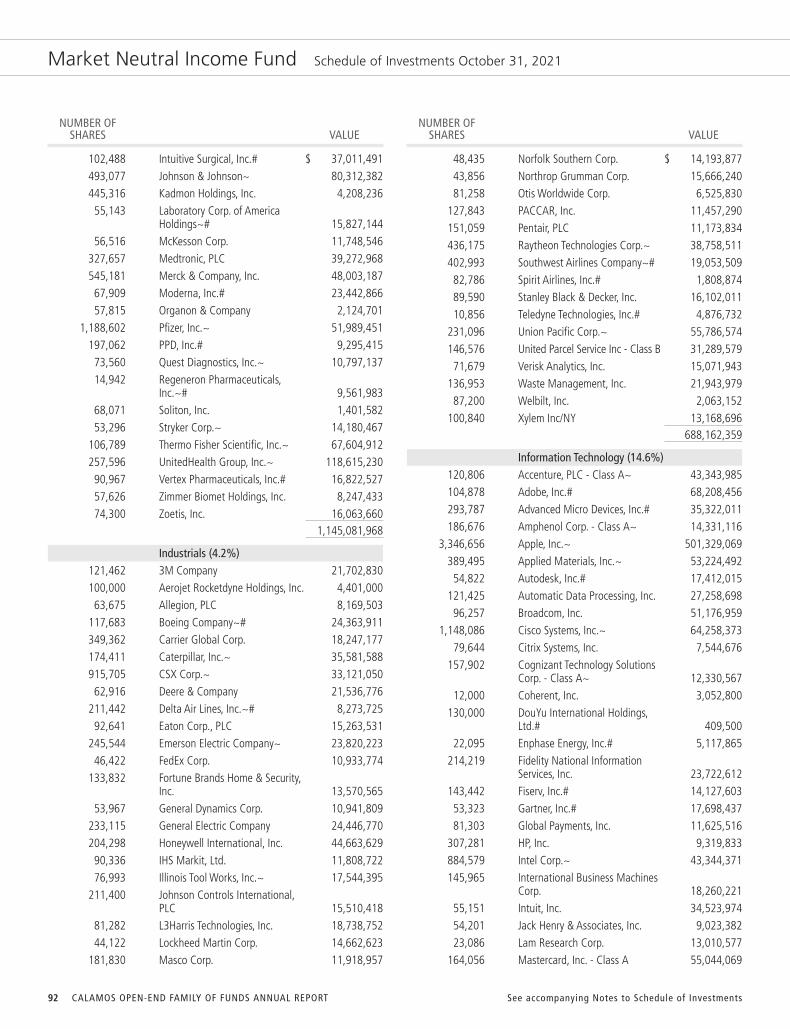
92 CALAMOS OPEN-END FAMILY OF FUNDS ANNUAL REPORT
Market Neutral Income Fund Schedule of Investments October 31, 2021
NUMBER OF SHARES VALUE
NUMBER OF SHARES VALUE
102,488 Intuitive Surgical, Inc.# $ 37,011,491 493,077 Johnson & Johnson~ 80,312,382 445,316 Kadmon Holdings, Inc. 4,208,236 55,143 Laboratory Corp. of America Holdings~# 15,827,144 56,516 McKesson Corp. 11,748,546 327,657 Medtronic, PLC 39,272,968 545,181 Merck & Company, Inc. 48,003,187 67,909 Moderna, Inc.# 23,442,866 57,815 Organon & Company 2,124,701 1,188,602 Pfizer, Inc.~ 51,989,451 197,062 PPD, Inc.# 9,295,415 73,560 Quest Diagnostics, Inc.~ 10,797,137 14,942 Regeneron Pharmaceuticals, Inc.~# 9,561,983 68,071 Soliton, Inc. 1,401,582 53,296 Stryker Corp.~ 14,180,467 106,789 Thermo Fisher Scientific, Inc.~ 67,604,912 257,596 UnitedHealth Group, Inc.~ 118,615,230 90,967 Vertex Pharmaceuticals, Inc.# 16,822,527 57,626 Zimmer Biomet Holdings, Inc. 8,247,433 74,300 Zoetis, Inc. 16,063,660 1,145,081,968
Industrials (4.2%) 121,462 3M Company 21,702,830 100,000 Aerojet Rocketdyne Holdings, Inc. 4,401,000 63,675 Allegion, PLC 8,169,503 117,683 Boeing Company~# 24,363,911 349,362 Carrier Global Corp. 18,247,177 174,411 Caterpillar, Inc.~ 35,581,588 915,705 CSX Corp.~ 33,121,050 62,916 Deere & Company 21,536,776 211,442 Delta Air Lines, Inc.~# 8,273,725 92,641 Eaton Corp., PLC 15,263,531 245,544 Emerson Electric Company~ 23,820,223 46,422 FedEx Corp. 10,933,774 133,832 Fortune Brands Home & Security, Inc. 13,570,565 53,967 General Dynamics Corp. 10,941,809 233,115 General Electric Company 24,446,770 204,298 Honeywell International, Inc. 44,663,629 90,336 IHS Markit, Ltd. 11,808,722 76,993 Illinois Tool Works, Inc.~ 17,544,395 211,400 Johnson Controls International, PLC 15,510,418 81,282 L3Harris Technologies, Inc. 18,738,752 44,122 Lockheed Martin Corp. 14,662,623 181,830 Masco Corp. 11,918,957
48,435 Norfolk Southern Corp. $ 14,193,877 43,856 Northrop Grumman Corp. 15,666,240 81,258 Otis Worldwide Corp. 6,525,830 127,843 PACCAR, Inc. 11,457,290 151,059 Pentair, PLC 11,173,834 436,175 Raytheon Technologies Corp.~ 38,758,511 402,993 Southwest Airlines Company~# 19,053,509 82,786 Spirit Airlines, Inc.# 1,808,874 89,590 Stanley Black & Decker, Inc. 16,102,011 10,856 Teledyne Technologies, Inc.# 4,876,732 231,096 Union Pacific Corp.~ 55,786,574 146,576 United Parcel Service Inc - Class B 31,289,579 71,679 Verisk Analytics, Inc. 15,071,943 136,953 Waste Management, Inc. 21,943,979 87,200 Welbilt, Inc. 2,063,152 100,840 Xylem Inc/NY 13,168,696 688,162,359
Information Technology (14.6%) 120,806 Accenture, PLC - Class A~ 43,343,985 104,878 Adobe, Inc.# 68,208,456 293,787 Advanced Micro Devices, Inc.# 35,322,011 186,676 Amphenol Corp. - Class A~ 14,331,116 3,346,656 Apple, Inc.~ 501,329,069 389,495 Applied Materials, Inc.~ 53,224,492 54,822 Autodesk, Inc.# 17,412,015 121,425 Automatic Data Processing, Inc. 27,258,698 96,257 Broadcom, Inc. 51,176,959 1,148,086 Cisco Systems, Inc.~ 64,258,373 79,644 Citrix Systems, Inc. 7,544,676 157,902 Cognizant Technology Solutions Corp. - Class A~ 12,330,567 12,000 Coherent, Inc. 3,052,800 130,000 DouYu International Holdings, Ltd.# 409,500 22,095 Enphase Energy, Inc.# 5,117,865 214,219 Fidelity National Information Services, Inc. 23,722,612 143,442 Fiserv, Inc.# 14,127,603 53,323 Gartner, Inc.# 17,698,437 81,303 Global Payments, Inc. 11,625,516 307,281 HP, Inc. 9,319,833 884,579 Intel Corp.~ 43,344,371 145,965 International Business Machines Corp. 18,260,221 55,151 Intuit, Inc. 34,523,974 54,201 Jack Henry & Associates, Inc. 9,023,382 23,086 Lam Research Corp. 13,010,577 164,056 Mastercard, Inc. - Class A 55,044,069
See accompanying Notes to Schedule of Investments

93www.calamos.com
Market Neutral Income Fund Schedule of Investments October 31, 2021
NUMBER OF SHARES VALUE
NUMBER OF SHARES VALUE
368,816 Micron Technology, Inc.~ $ 25,485,186 1,702,091 Microsoft Corp.~ 564,447,417 87,667 NetApp, Inc. 7,828,663 637,023 NVIDIA Corp. 162,867,670 309,688 Oracle Corp. 29,711,467 113,963 Paychex, Inc. 14,049,359 45,478 Paycom Software, Inc.# 24,915,122 314,547 PayPal Holdings, Inc.# 73,160,487 262,870 QUALCOMM, Inc. 34,972,225 249,662 salesforce.com, Inc.# 74,821,205 38,551 ServiceNow, Inc.# 26,899,346 207,000 STMicroelectronics, NV 9,072,810 9,683 Synaptics, Inc. 1,884,021 79,129 TE Connectivity, Ltd. 11,552,834 142,195 Texas Instruments, Inc.~ 26,658,719 440,753 Visa, Inc. - Class A^~ 93,338,263 79,854 Western Digital Corp.# 4,175,566 366,194 Western Union Company 6,672,055 300,110 Xilinx, Inc.~ 54,019,800 2,400,553,392
Materials (1.2%) 72,399 Air Products and Chemicals, Inc.~ 21,705,944 59,026 Avery Dennison Corp. 12,851,141 163,777 Ball Corp. 14,982,320 205,752 Corteva, Inc. 8,878,199 205,751 Dow, Inc. 11,515,883 185,279 DuPont de Nemours, Inc. 12,895,418 78,353 Forterra, Inc.# 1,866,368 563,795 Freeport-McMoRan, Inc. 21,266,347 14,697 International Flavors & Fragrances, Inc. 2,167,073 158,163 Linde, PLC 50,485,630 184,750 Newmont Corp. 9,976,500 88,900 PPG Industries, Inc. 14,274,673 53,250 Sherwin-Williams Company 16,859,483 199,724,979
Real Estate (1.2%) 61,392 Alexandria Real Estate Equities, Inc. 12,532,563 84,707 American Tower Corp.~ 23,884,833 56,476 AvalonBay Communities, Inc.~ 13,366,740 78,258 Crown Castle International Corp. 14,109,917 67,006 Digital Realty Trust, Inc. 10,574,217 16,227 Equinix, Inc. 13,583,135 54,524 Federal Realty Investment Trust 6,561,963 73,186 Mid-America Apartment Communities, Inc. 14,945,313 115,023 Prologis, Inc.~ 16,673,734 40,302 Public Storage~ 13,387,518
139,723 Realty Income Corp. $ 9,980,414 113,964 Regency Centers Corp. 8,024,205 92,443 Simon Property Group, Inc. 13,550,295 177,300 UDR, Inc. 9,845,469 143,389 Welltower, Inc. 11,528,476 273,858 Weyerhaeuser Company 9,782,208 202,331,000
Special Purpose Acquisition Companies (5.6%)# 500,000 10X Capital Venture Acquisition Corp. II 5,040,000 65,000 ABG Acquisition Corp. I 634,725 500,000 Accelerate Acquisition Corp. 5,040,000 160,000 Accretion Acquisition Corp. 1,622,400 616,403 Acropolis Infrastructure Acquisition Corp. 6,145,538 50,000 Advanced Merger Partners, Inc. 493,500 125,000 Aesther Healthcare Acquisition Corp. 1,268,750 750,000 AF Acquisition Corp. 7,451,250 500,000 African Gold Acquisition Corp. 5,055,000 550,000 Agile Growth Corp. 5,513,750 10,000 Alpha Capital Acquisition Company 100,550 750,000 Alpha Partners Technology Merger Corp. 7,451,250 1,000,000 AltC Acquisition Corp - Class A 10,160,000 1,500,000 Altenergy Acquisition Corp. 15,075,000 10,000 Altimar Acquisition Corp. III 99,900 600,000 AMCI Acquisition Corp. II 5,973,000 500,000 Angel Pond Holdings Corp. 4,975,000 485,000 Anthemis Digital Acquisitions I Corp. 4,874,250 300,000 Anzu Special Acquisition Corp. I 2,991,000 10,000 Apollo Strategic Growth Capital II 99,600 350,000 Arbor Rapha Capital Bioholdi 3,528,000 25,100 Arctos NorthStar Acquisition Corp. 249,494 100,000 Ares Acquisition Corp. 1,005,000 150,000 Argus Capital Corp. 1,525,500 125,000 Aries I Acquisition Corp. 1,295,000 100,000 Arrowroot Acquisition Corp. 1,002,000 600,000 Artisan Acquisition Corp. 6,108,000 511,397 Astrea Acquisition Corp. 5,280,174 300,000 Athena Consumer Acquisition Corp. 3,052,500 400,000 Athena Technology Acquisition Corp. 4,000,000 240,000 Atlantic Coastal Acquisition Corp. 2,383,200 25,000 Atlas Crest Investment Corp. II 249,250
See accompanying Notes to Schedule of Investments
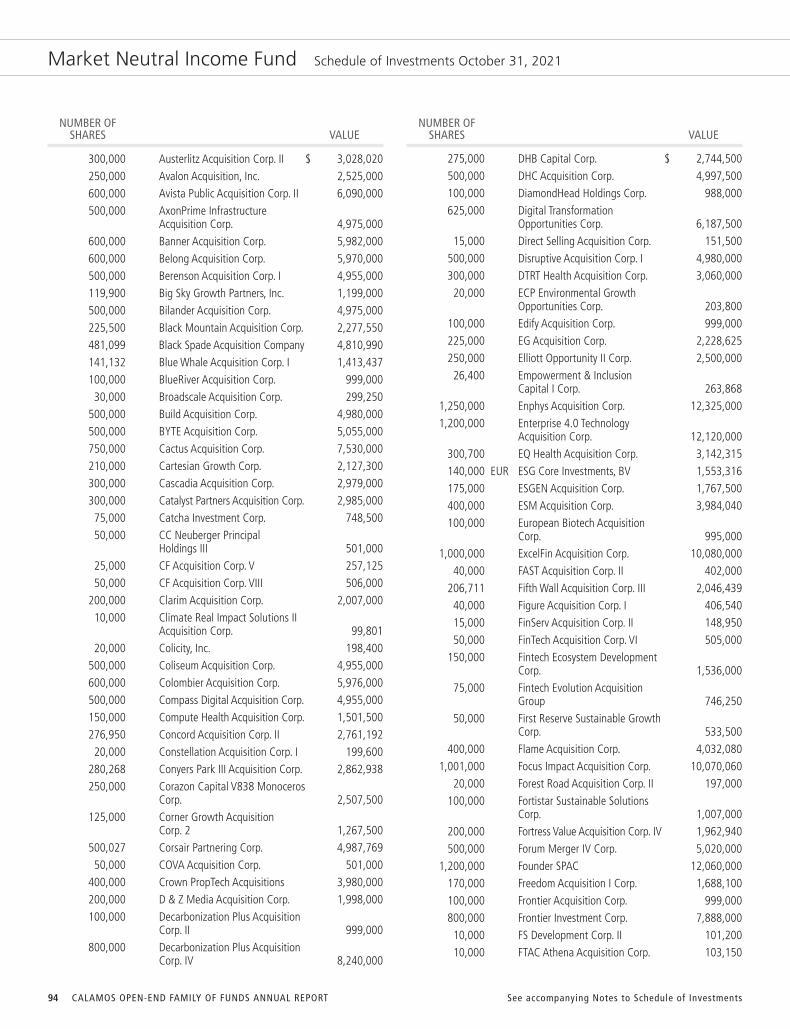
94 CALAMOS OPEN-END FAMILY OF FUNDS ANNUAL REPORT
Market Neutral Income Fund Schedule of Investments October 31, 2021
NUMBER OF SHARES VALUE
NUMBER OF SHARES VALUE
300,000 Austerlitz Acquisition Corp. II $ 3,028,020 250,000 Avalon Acquisition, Inc. 2,525,000 600,000 Avista Public Acquisition Corp. II 6,090,000 500,000 AxonPrime Infrastructure Acquisition Corp. 4,975,000 600,000 Banner Acquisition Corp. 5,982,000 600,000 Belong Acquisition Corp. 5,970,000 500,000 Berenson Acquisition Corp. I 4,955,000 119,900 Big Sky Growth Partners, Inc. 1,199,000 500,000 Bilander Acquisition Corp. 4,975,000 225,500 Black Mountain Acquisition Corp. 2,277,550 481,099 Black Spade Acquisition Company 4,810,990 141,132 Blue Whale Acquisition Corp. I 1,413,437 100,000 BlueRiver Acquisition Corp. 999,000 30,000 Broadscale Acquisition Corp. 299,250 500,000 Build Acquisition Corp. 4,980,000 500,000 BYTE Acquisition Corp. 5,055,000 750,000 Cactus Acquisition Corp. 7,530,000 210,000 Cartesian Growth Corp. 2,127,300 300,000 Cascadia Acquisition Corp. 2,979,000 300,000 Catalyst Partners Acquisition Corp. 2,985,000 75,000 Catcha Investment Corp. 748,500 50,000 CC Neuberger Principal Holdings III 501,000 25,000 CF Acquisition Corp. V 257,125 50,000 CF Acquisition Corp. VIII 506,000 200,000 Clarim Acquisition Corp. 2,007,000 10,000 Climate Real Impact Solutions II Acquisition Corp. 99,801 20,000 Colicity, Inc. 198,400 500,000 Coliseum Acquisition Corp. 4,955,000 600,000 Colombier Acquisition Corp. 5,976,000 500,000 Compass Digital Acquisition Corp. 4,955,000 150,000 Compute Health Acquisition Corp. 1,501,500 276,950 Concord Acquisition Corp. II 2,761,192 20,000 Constellation Acquisition Corp. I 199,600 280,268 Conyers Park III Acquisition Corp. 2,862,938 250,000 Corazon Capital V838 Monoceros Corp. 2,507,500 125,000 Corner Growth Acquisition Corp. 2 1,267,500 500,027 Corsair Partnering Corp. 4,987,769 50,000 COVA Acquisition Corp. 501,000 400,000 Crown PropTech Acquisitions 3,980,000 200,000 D & Z Media Acquisition Corp. 1,998,000 100,000 Decarbonization Plus Acquisition Corp. II 999,000 800,000 Decarbonization Plus Acquisition Corp. IV 8,240,000
275,000 DHB Capital Corp. $ 2,744,500 500,000 DHC Acquisition Corp. 4,997,500 100,000 DiamondHead Holdings Corp. 988,000 625,000 Digital Transformation Opportunities Corp. 6,187,500 15,000 Direct Selling Acquisition Corp. 151,500 500,000 Disruptive Acquisition Corp. I 4,980,000 300,000 DTRT Health Acquisition Corp. 3,060,000 20,000 ECP Environmental Growth Opportunities Corp. 203,800 100,000 Edify Acquisition Corp. 999,000 225,000 EG Acquisition Corp. 2,228,625 250,000 Elliott Opportunity II Corp. 2,500,000 26,400 Empowerment & Inclusion Capital I Corp. 263,868 1,250,000 Enphys Acquisition Corp. 12,325,000 1,200,000 Enterprise 4.0 Technology Acquisition Corp. 12,120,000 300,700 EQ Health Acquisition Corp. 3,142,315 140,000 EUR ESG Core Investments, BV 1,553,316 175,000 ESGEN Acquisition Corp. 1,767,500 400,000 ESM Acquisition Corp. 3,984,040 100,000 European Biotech Acquisition Corp. 995,000 1,000,000 ExcelFin Acquisition Corp. 10,080,000 40,000 FAST Acquisition Corp. II 402,000 206,711 Fifth Wall Acquisition Corp. III 2,046,439 40,000 Figure Acquisition Corp. I 406,540 15,000 FinServ Acquisition Corp. II 148,950 50,000 FinTech Acquisition Corp. VI 505,000 150,000 Fintech Ecosystem Development Corp. 1,536,000 75,000 Fintech Evolution Acquisition Group 746,250 50,000 First Reserve Sustainable Growth Corp. 533,500 400,000 Flame Acquisition Corp. 4,032,080 1,001,000 Focus Impact Acquisition Corp. 10,070,060 20,000 Forest Road Acquisition Corp. II 197,000 100,000 Fortistar Sustainable Solutions Corp. 1,007,000 200,000 Fortress Value Acquisition Corp. IV 1,962,940 500,000 Forum Merger IV Corp. 5,020,000 1,200,000 Founder SPAC 12,060,000 170,000 Freedom Acquisition I Corp. 1,688,100 100,000 Frontier Acquisition Corp. 999,000 800,000 Frontier Investment Corp. 7,888,000 10,000 FS Development Corp. II 101,200 10,000 FTAC Athena Acquisition Corp. 103,150
See accompanying Notes to Schedule of Investments

95www.calamos.com
Market Neutral Income Fund Schedule of Investments October 31, 2021
NUMBER OF SHARES VALUE
NUMBER OF SHARES VALUE
500,000 FTAC Hera Acquisition Corp. $ 5,025,000 425,000 Fusion Acquisition Corp. II 4,245,750 400,000 Future Health ESG Corp. 3,996,000 25,000 G Squared Ascend I, Inc. 253,750 700,000 G&P Acquisition Corp. 7,038,500 200,000 Galata Acquisition Corp. 2,058,000 425,000 GigCapital5, Inc. 4,362,625 443,787 GigInternational1, Inc. 4,568,787 400,000 Gladstone Acquisition Corp. 4,168,000 250,000 Glenfarne Merger Corp. 2,485,000 50,000 Global Technology Acquisition Corp. I 504,000 1,000,000 GoGreen Investments Corp. 10,120,000 380,000 Golden Arrow Merger Corp. 3,754,400 40,000 Gores Holdings VII, Inc. 399,600 20,000 Gores Holdings VIII, Inc. 200,000 40,000 Gores Technology Partners II, Inc. 401,800 20,000 Gores Technology Partners, Inc. 201,800 100,000 Group Nine Acquisition Corp. 997,000 401,201 Growth Capital Acquisition Corp. 4,132,370 533,506 GX Acquisition Corp. II 5,303,050 150,000 Hamilton Lane Alliance Holdings I, Inc. 1,497,000 500,000 Hawks Acquisition Corp. 4,945,000 18,326 Haymaker Acquisition Corp. III 181,061 5,000 HealthCor Catalio Acquisition Corp. 49,900 512,066 Healthwell Acquisition Corp. I 5,089,936 13,540 Home Plate Acquisition Corp. 134,385 35,000 Hudson Executive Investment Corp. II 348,950 150,000 Hudson Executive Investment Corp. III 1,482,000 250,000 Ibere Pharmaceuticals 2,480,000 200,000 Iconic Sports Acquisition Corp. 2,024,000 100,000 Independence Holdings Corp. 999,500 1,000,000 Inflection Point Acquisition Corp. 10,000,000 400,000 Innovative International Acquisition Corp. 4,028,000 700,000 Insight Acquisition Corp/DE 7,000,000 20,000 ION Acquisition Corp. 2, Ltd. 202,400 99,503 Isos Acquisition Corp. 1,000,005 441,806 ITHAX Acquisition Corp. 4,431,314 220,000 Itiquira Acquisition Corp. 2,200,000 500,000 IX Acquisition Corp. 4,960,000 50,000 Jack Creek Investment Corp. 506,000 400,000 Jatt Acquisition Corp. 4,030,000 100,000 Jaws Hurricane Acquisition Corp. 1,000,000
100,000 Jaws Juggernaut Acquisition Corp. $ 1,030,000 175,000 Jaws Mustang Acquisition Corp. 1,764,000 100,000 JOFF Fintech Acquisition Corp. 1,002,000 479,487 Kensington Capital Acquisition Corp. V 5,010,639 50,120 Kernel Group Holdings, Inc. 503,957 250,000 Kernel Group Holdings, Inc. - Class A 2,437,500 20,000 Khosla Ventures Acquisition Company 199,800 500,000 Kismet Acquisition Three Corp. 4,947,500 500,000 Kismet Acquisition Two Corp. 4,960,000 150,000 KKR Acquisition Holdings I Corp. 1,507,425 100,000 L Catterton Asia Acquisition Corp. 1,001,500 500,000 Landcadia Holdings IV, Inc. 5,055,000 25,000 LAVA Medtech Acquisition Corp. 252,750 5,000 LDH Growth Corp. I 49,850 825,000 Learn CW Investment Corp. 8,311,875 150,000 Levere Holdings Corp. 1,507,500 20,000 Liberty Media Acquisition Corp. 207,800 800,000 Live Oak Crestview Climate Acquisition Corp. 7,880,000 100,000 Live Oak Mobility Acquisition Corp. 994,500 75,000 Longview Acquisition Corp. II 798,750 150,000 M3-Brigade Acquisition II Corp. 1,640,250 1,250,000 M3-Brigade Acquisition III Corp. 12,500,000 850,450 Macondray Capital Acquisition Corp. I 8,521,509 233,522 Maquia Capital Acquisition Corp. 2,450,813 456,321 Marblegate Acquisition Corp. 4,549,520 400,000 Mason Industrial Technology, Inc. 3,992,000 500,000 Mercury Ecommerce Acquisition Corp. 5,075,000 500,000 Metals Acquisition Corp. 5,215,000 225,000 Mission Advancement Corp. 2,234,250 100,000 Monument Circle Acquisition Corp. 1,006,000 50,000 Music Acquisition Corp. 501,750 5,000 New Vista Acquisition Corp. 50,050 1,000,000 Newcourt Acquisition Corp. 10,090,000 800,000 NewHold Investment Corp. II 7,984,000 132,319 NextGen Acquisition Corp. II 1,368,178 18,129 Northern Genesis Acquisition Corp. III 183,103 20,000 Northern Star Investment Corp. III 198,800 20,000 Northern Star Investment Corp. IV 198,300 100,000 OceanTech Acquisitions I Corp. 1,037,000 100,000 One Equity Partners Open Water I Corp. 996,000
See accompanying Notes to Schedule of Investments
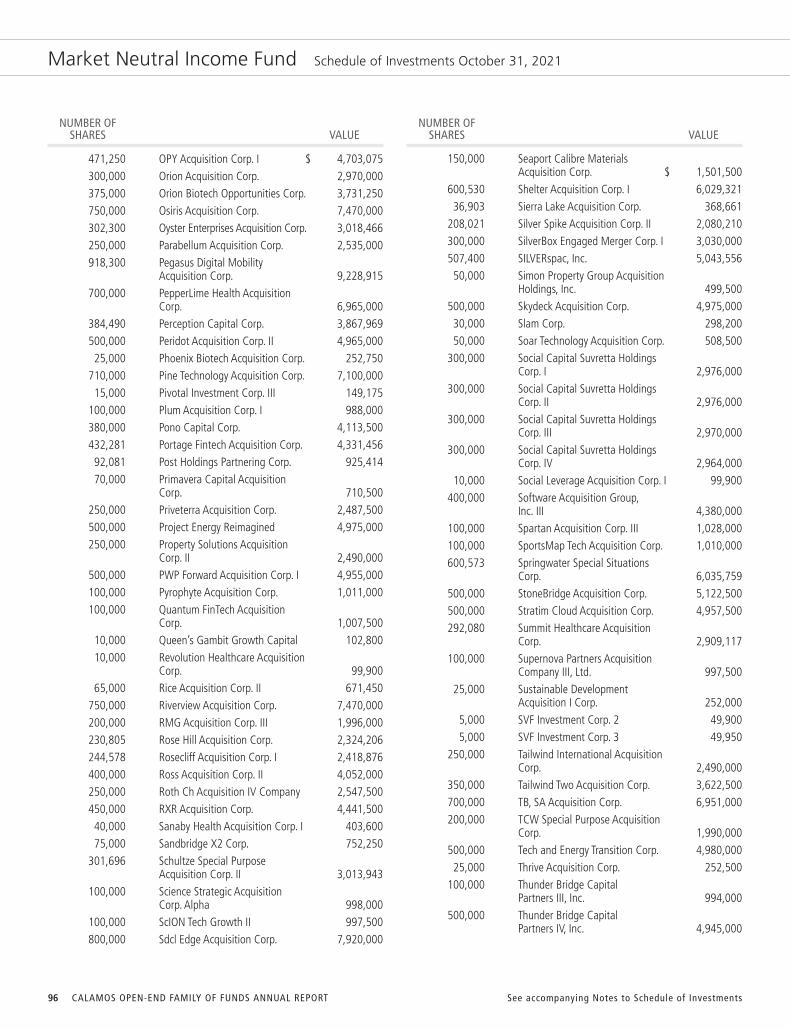
96 CALAMOS OPEN-END FAMILY OF FUNDS ANNUAL REPORT
Market Neutral Income Fund Schedule of Investments October 31, 2021
NUMBER OF SHARES VALUE
NUMBER OF SHARES VALUE
471,250 OPY Acquisition Corp. I $ 4,703,075 300,000 Orion Acquisition Corp. 2,970,000 375,000 Orion Biotech Opportunities Corp. 3,731,250 750,000 Osiris Acquisition Corp. 7,470,000 302,300 Oyster Enterprises Acquisition Corp. 3,018,466 250,000 Parabellum Acquisition Corp. 2,535,000 918,300 Pegasus Digital Mobility Acquisition Corp. 9,228,915 700,000 PepperLime Health Acquisition Corp. 6,965,000 384,490 Perception Capital Corp. 3,867,969 500,000 Peridot Acquisition Corp. II 4,965,000 25,000 Phoenix Biotech Acquisition Corp. 252,750 710,000 Pine Technology Acquisition Corp. 7,100,000 15,000 Pivotal Investment Corp. III 149,175 100,000 Plum Acquisition Corp. I 988,000 380,000 Pono Capital Corp. 4,113,500 432,281 Portage Fintech Acquisition Corp. 4,331,456 92,081 Post Holdings Partnering Corp. 925,414 70,000 Primavera Capital Acquisition Corp. 710,500 250,000 Priveterra Acquisition Corp. 2,487,500 500,000 Project Energy Reimagined 4,975,000 250,000 Property Solutions Acquisition Corp. II 2,490,000 500,000 PWP Forward Acquisition Corp. I 4,955,000 100,000 Pyrophyte Acquisition Corp. 1,011,000 100,000 Quantum FinTech Acquisition Corp. 1,007,500 10,000 Queen’s Gambit Growth Capital 102,800 10,000 Revolution Healthcare Acquisition Corp. 99,900 65,000 Rice Acquisition Corp. II 671,450 750,000 Riverview Acquisition Corp. 7,470,000 200,000 RMG Acquisition Corp. III 1,996,000 230,805 Rose Hill Acquisition Corp. 2,324,206 244,578 Rosecliff Acquisition Corp. I 2,418,876 400,000 Ross Acquisition Corp. II 4,052,000 250,000 Roth Ch Acquisition IV Company 2,547,500 450,000 RXR Acquisition Corp. 4,441,500 40,000 Sanaby Health Acquisition Corp. I 403,600 75,000 Sandbridge X2 Corp. 752,250 301,696 Schultze Special Purpose Acquisition Corp. II 3,013,943 100,000 Science Strategic Acquisition Corp. Alpha 998,000 100,000 ScION Tech Growth II 997,500 800,000 Sdcl Edge Acquisition Corp. 7,920,000
150,000 Seaport Calibre Materials Acquisition Corp. $ 1,501,500 600,530 Shelter Acquisition Corp. I 6,029,321 36,903 Sierra Lake Acquisition Corp. 368,661 208,021 Silver Spike Acquisition Corp. II 2,080,210 300,000 SilverBox Engaged Merger Corp. I 3,030,000 507,400 SILVERspac, Inc. 5,043,556 50,000 Simon Property Group Acquisition Holdings, Inc. 499,500 500,000 Skydeck Acquisition Corp. 4,975,000 30,000 Slam Corp. 298,200 50,000 Soar Technology Acquisition Corp. 508,500 300,000 Social Capital Suvretta Holdings Corp. I 2,976,000 300,000 Social Capital Suvretta Holdings Corp. II 2,976,000 300,000 Social Capital Suvretta Holdings Corp. III 2,970,000 300,000 Social Capital Suvretta Holdings Corp. IV 2,964,000 10,000 Social Leverage Acquisition Corp. I 99,900 400,000 Software Acquisition Group, Inc. III 4,380,000 100,000 Spartan Acquisition Corp. III 1,028,000 100,000 SportsMap Tech Acquisition Corp. 1,010,000 600,573 Springwater Special Situations Corp. 6,035,759 500,000 StoneBridge Acquisition Corp. 5,122,500 500,000 Stratim Cloud Acquisition Corp. 4,957,500 292,080 Summit Healthcare Acquisition Corp. 2,909,117 100,000 Supernova Partners Acquisition Company III, Ltd. 997,500 25,000 Sustainable Development Acquisition I Corp. 252,000 5,000 SVF Investment Corp. 2 49,900 5,000 SVF Investment Corp. 3 49,950 250,000 Tailwind International Acquisition Corp. 2,490,000 350,000 Tailwind Two Acquisition Corp. 3,622,500 700,000 TB, SA Acquisition Corp. 6,951,000 200,000 TCW Special Purpose Acquisition Corp. 1,990,000 500,000 Tech and Energy Transition Corp. 4,980,000 25,000 Thrive Acquisition Corp. 252,500 100,000 Thunder Bridge Capital Partners III, Inc. 994,000 500,000 Thunder Bridge Capital Partners IV, Inc. 4,945,000
See accompanying Notes to Schedule of Investments
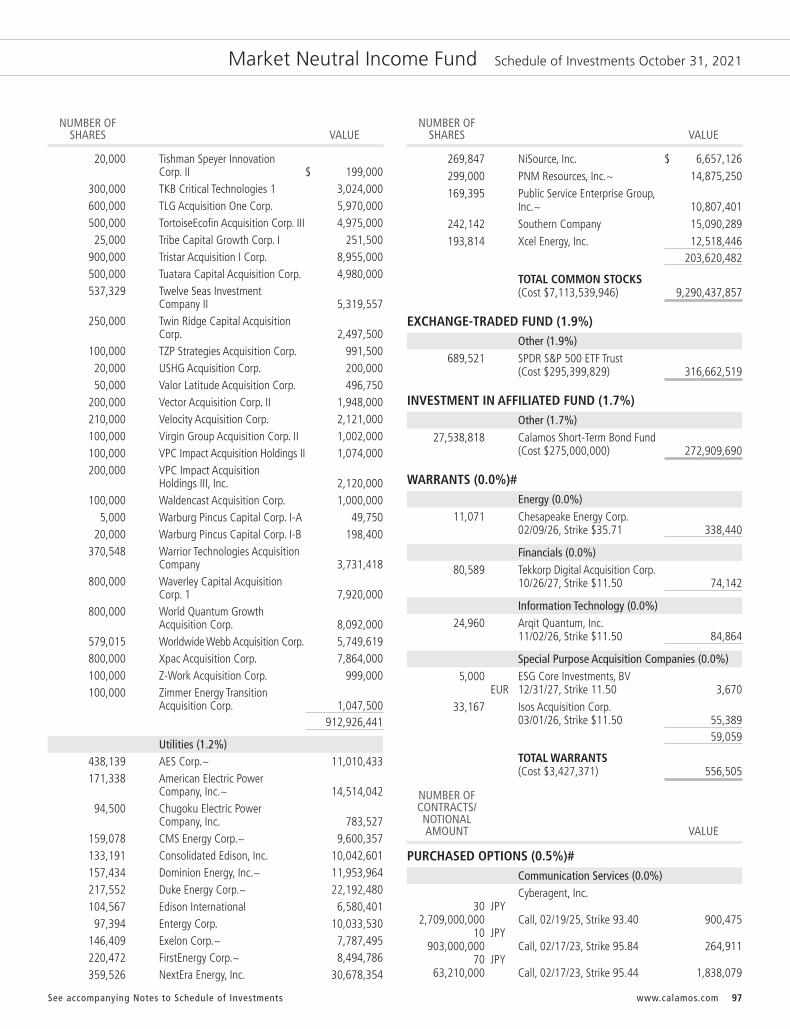
97www.calamos.com
Market Neutral Income Fund Schedule of Investments October 31, 2021
NUMBER OF SHARES VALUE
20,000 Tishman Speyer Innovation Corp. II $ 199,000 300,000 TKB Critical Technologies 1 3,024,000 600,000 TLG Acquisition One Corp. 5,970,000 500,000 TortoiseEcofin Acquisition Corp. III 4,975,000 25,000 Tribe Capital Growth Corp. I 251,500 900,000 Tristar Acquisition I Corp. 8,955,000 500,000 Tuatara Capital Acquisition Corp. 4,980,000 537,329 Twelve Seas Investment Company II 5,319,557 250,000 Twin Ridge Capital Acquisition Corp. 2,497,500 100,000 TZP Strategies Acquisition Corp. 991,500 20,000 USHG Acquisition Corp. 200,000 50,000 Valor Latitude Acquisition Corp. 496,750 200,000 Vector Acquisition Corp. II 1,948,000 210,000 Velocity Acquisition Corp. 2,121,000 100,000 Virgin Group Acquisition Corp. II 1,002,000 100,000 VPC Impact Acquisition Holdings II 1,074,000 200,000 VPC Impact Acquisition Holdings III, Inc. 2,120,000 100,000 Waldencast Acquisition Corp. 1,000,000 5,000 Warburg Pincus Capital Corp. I-A 49,750 20,000 Warburg Pincus Capital Corp. I-B 198,400 370,548 Warrior Technologies Acquisition Company 3,731,418 800,000 Waverley Capital Acquisition Corp. 1 7,920,000 800,000 World Quantum Growth Acquisition Corp. 8,092,000 579,015 Worldwide Webb Acquisition Corp. 5,749,619 800,000 Xpac Acquisition Corp. 7,864,000 100,000 Z-Work Acquisition Corp. 999,000 100,000 Zimmer Energy Transition Acquisition Corp. 1,047,500 912,926,441
Utilities (1.2%) 438,139 AES Corp.~ 11,010,433 171,338 American Electric Power Company, Inc.~ 14,514,042 94,500 Chugoku Electric Power Company, Inc. 783,527 159,078 CMS Energy Corp.~ 9,600,357 133,191 Consolidated Edison, Inc. 10,042,601 157,434 Dominion Energy, Inc.~ 11,953,964 217,552 Duke Energy Corp.~ 22,192,480 104,567 Edison International 6,580,401 97,394 Entergy Corp. 10,033,530 146,409 Exelon Corp.~ 7,787,495 220,472 FirstEnergy Corp.~ 8,494,786 359,526 NextEra Energy, Inc. 30,678,354
NUMBER OF SHARES VALUE
269,847 NiSource, Inc. $ 6,657,126 299,000 PNM Resources, Inc.~ 14,875,250 169,395 Public Service Enterprise Group, Inc.~ 10,807,401 242,142 Southern Company 15,090,289 193,814 Xcel Energy, Inc. 12,518,446 203,620,482
TOTAL COMMON STOCKS (Cost $7,113,539,946) 9,290,437,857
EXCHANGE-TRADED FUND (1.9%)Other (1.9%)
689,521 SPDR S&P 500 ETF Trust(Cost $295,399,829) 316,662,519
INVESTMENT IN AFFILIATED FUND (1.7%)Other (1.7%)
27,538,818 Calamos Short-Term Bond Fund(Cost $275,000,000) 272,909,690
WARRANTS (0.0%)#Energy (0.0%)
11,071 Chesapeake Energy Corp.02/09/26, Strike $35.71 338,440
Financials (0.0%) 80,589 Tekkorp Digital Acquisition Corp.
10/26/27, Strike $11.50 74,142
Information Technology (0.0%) 24,960 Arqit Quantum, Inc.
11/02/26, Strike $11.50 84,864
Special Purpose Acquisition Companies (0.0%) 5,000 ESG Core Investments, BV EUR 12/31/27, Strike 11.50 3,670 33,167 Isos Acquisition Corp. 03/01/26, Strike $11.50 55,389 59,059
TOTAL WARRANTS (Cost $3,427,371) 556,505
NUMBER OF CONTRACTS/ NOTIONAL AMOUNT VALUE
PURCHASED OPTIONS (0.5%)#Communication Services (0.0%)
Cyberagent, Inc. 30 JPY 2,709,000,000 Call, 02/19/25, Strike 93.40 900,475 10 JPY 903,000,000 Call, 02/17/23, Strike 95.84 264,911 70 JPY 63,210,000 Call, 02/17/23, Strike 95.44 1,838,079
See accompanying Notes to Schedule of Investments

98 CALAMOS OPEN-END FAMILY OF FUNDS ANNUAL REPORT
Market Neutral Income Fund Schedule of Investments October 31, 2021
NUMBER OF CONTRACTS/ NOTIONAL AMOUNT VALUE
NUMBER OF CONTRACTS/ NOTIONAL AMOUNT VALUE
320 Pinterest, Inc. - Class A 1,428,480 Call, 11/26/21, Strike $70.00 $ 3,040 50 JPY Zenrin Company, Ltd. 4,592,865,000 Call, 03/31/23, Strike 96.21 — 3,006,505
Consumer Discretionary (0.0%) Edion Corp. 60 JPY 64,857,000,000 Call, 06/19/25, Strike 99.51 528,537 50 JPY 54,047,500,000 Call, 06/19/25, Strike 95.45 441,899 50 JPY 540,475,000 Call, 06/19/25, Strike 94.30 441,899 100 JPY His Company, Ltd. 22,429,660,000 Call, 11/15/24, Strike 96.54 — 100 JPY Kyoritsu Maintenance Company, Ltd. 37,338,940,000 Call, 01/29/26, Strike 94.89 743,370 Takashimaya Company, Ltd. 100 JPY 1,006,880,000 Call, 12/06/23, Strike 97.28 105,029 50 JPY 503,440,000 Call, 12/06/23, Strike 97.29 52,515 50 JPY 503,440,000 Call, 12/06/23, Strike 97.18 52,515 2,365,764
Consumer Staples (0.0%) Ezaki Glico Company, Ltd. 100 JPY 996,830,000 Call, 01/30/24, Strike 97.57 72,858 50 JPY 498,415,000 Call, 01/30/24, Strike 96.89 41,471 50 JPY Nippn Corp. 7,147,865,000 06/20/25, Strike 98.27 123,306 237,635
Health Care (0.1%) 100 JPY Medipal Holdings Corp. 18,012,100,000 Call, 10/07/22, Strike 98.52 306,262 Ship Healthcare Holdings, Inc. 72 JPY 18,850,384,800 Call, 12/13/23, Strike 97.95 1,359,161 50 JPY 13,090,545,000 Call, 12/13/23, Strike 97.68 943,862 25 JPY 6,545,272,500 Call, 12/13/23, Strike 98.32 471,931 100 JPY Toho Holdings Company, Ltd. 16,101,320,000 Call, 06/23/23, Strike 98.43 19,052 3,100,268
Industrials (0.0%) 100 JPY Ana Holdings, Inc. 47,350,000 Call, 09/19/24, Strike 96.53 — 100 Asashi Refining US, Inc. 452,011,600 Call, 03/16/26, Strike $88.78 1,164,000
Nagoya Railroad Company, Ltd. 100 JPY 103,358,000,000 Call, 12/09/22, Strike 98.92 $ 257,421 28 JPY 28,940,240,000 Call, 12/09/22, Strike 98.77 75,992 22 JPY 22,738,760,000 Call, 12/09/22, Strike 98.94 56,633 67 JPY 692,498,600 Call, 12/09/22, Strike 97.53 134,617 50 JPY 516,790,000 Call, 12/09/22, Strike 98.07 91,696 160 JPY Seino Holdings Company, Ltd. 161,163,200,000 Call, 03/31/26, Strike 97.31 415,086 54 JPY Senko Company, Ltd. 9,624,317,400 Call, 03/28/22, Strike 98.82 558,122 2,753,567
Information Technology (0.0%) Digital Garage, Inc. 150 JPY 1,604,655,000 Call, 09/14/23, Strike 94.68 1,854,892 50 JPY 534,885,000 Call, 09/14/23, Strike 94.80 618,298 2,473,190
Materials (0.0%) 50 JPY Kansai Paint Company, Ltd. 11,500,000,000 Call, 06/17/22, Strike 98.95 61,732 45 JPY Maeda Kosen Company, Ltd. 12,996,319,500 Call, 04/18/22, Strike 97.72 39 100 JPY Mitsubishi Chemical Holdings Corp. 8,262,780,000 Call, 03/30/22, Strike 98.83 68,975 100 JPY Nippon Steel Corp. 17,485,000,000 Call, 10/05/26, Strike 97.61 614,170 Teijin, Ltd. 100 JPY 99,983,000,000 Call, 12/10/21, Strike 99.18 — 100 JPY 99,983,000,000 Call, 12/10/21, Strike 99.19 — 744,916
Other (0.4%) 150 JPY Lxil Corp. 219,600,000,000 Call, 03/04/22, Strike 99.52 48,489 4,000 S&P 500 Index 1,758,104,000 Put, 03/31/22, Strike $3,000.00 6,240,000 S&P 500 Index 6,000 2,637,156,000 Put, 12/31/21, Strike $4,000.00 12,720,000 4,500 1,977,867,000 Put, 11/30/21, Strike $4,100.00 3,780,000 3,500 1,538,341,000 Call, 03/31/22, Strike $5,000.00 9,905,000 2,500 1,098,815,000 Put, 12/31/21, Strike $4,400.00 14,775,000
See accompanying Notes to Schedule of Investments

99www.calamos.com
Market Neutral Income Fund Schedule of Investments October 31, 2021
NUMBER OF CONTRACTS/ NOTIONAL AMOUNT VALUE
NUMBER OF SHARES VALUE
2,250 988,933,500 Put, 12/31/21, Strike $3,800.00 $ 2,913,750 1,000 439,526,000 Put, 12/31/21, Strike $3,950.00 1,870,000 1,000 439,526,000 Put, 01/31/22, Strike $3,900.00 3,125,000 500 219,763,000 Call, 06/30/22, Strike $5,000.00 3,450,000 58,827,239
Utilities (0.0%) Chugoku Electric Power Company, Inc. 100 JPY 104,321,000,000 Call, 01/25/22, Strike 98.54 799 100 JPY 104,321,000,000 Call, 01/25/22, Strike 98.97 799 50 JPY 521,605,000 Call, 01/25/22, Strike 98.22 400 100 JPY Kyushu Electric Power Company, Inc. 1,052,470,000 Call, 03/31/22, Strike 98.05 13,829 15,827
TOTAL PURCHASED OPTIONS (Cost $143,410,667) 73,524,911
NUMBER OF SHARES/ PRINCIPAL AMOUNT VALUE
INVESTMENT OF CASH COLLATERAL FOR SECURITIES LOANED (0.8%)
74,966,114 JPMorgan Prime Money Market Fund - Capital Class, 0.070%***† 74,966,114 62,072,939 State Street Navigator Securities
Lending Government Money Market Portfolio† 62,072,939
TOTAL INVESTMENT OF CASH COLLATERAL FOR SECURITIES LOANED (Cost $137,039,053) 137,039,053
TOTAL INVESTMENTS (100.3%)(Cost $12,882,173,333) 16,508,311,458
PAYABLE UPON RETURN OF SECURITIES ON LOAN (-0.8%) (137,039,053)
OTHER ASSETS, LESS LIABILITIES (0.5%) 75,627,388
NET ASSETS (100.0%) $16,446,899,793
COMMON STOCKS SOLD SHORT (-26.2%)#Communication Services (-3.8%)
(148,800) Bandwidth, Inc. - Class A $ (12,689,664) (586,648) Bilibili, Inc. (43,001,298) (489,500) EUR Cellnex Telecom, SA* (30,092,538) (971,800) JPY CyberAgent, Inc. (16,200,219) (216,600) Eventbrite, Inc. - Class A (4,383,984) (371,357) iQIYI, Inc. (3,074,836) (132,800) JOYY, Inc. (6,691,792) (2,004,169) EUR Koninklijke KPN, NV (5,988,977) (110,500) Liberty Media Corp-Liberty Formula One (6,165,900) (336,100) Lyft, Inc. - Class A (15,416,907) (117,900) Magnite, Inc. (3,186,837) (264,547) Match Group, Inc. (39,888,397) (37,700) Radius Global Infrastructure, Inc. (653,341) (406,338) Sea, Ltd. (139,605,547) (1,669,027) Snap, Inc. - Class A (87,757,440) (44,700) Spotify Technology, SA (12,936,180) (158,500) T-Mobile US, Inc. (18,232,255) (86,092) TechTarget, Inc. (8,119,336) (67,470) TripAdvisor, Inc. (2,224,486) (621,000) Twitter, Inc. (33,248,340) (735,200) World Wrestling Entertainment, Inc. (44,913,368) (573,000) Zillow Group, Inc. - Class C (59,379,990) (3,444,700) Zynga Inc. - Class A (25,421,886) (619,273,518)
Consumer Discretionary (-5.1%) (254,400) 2U, Inc. (7,514,976) (79,100) Airbnb, Inc. - Class A (13,499,206) (567,500) American Eagle Outfitters, Inc. (13,472,450) (118,000) Aptiv, PLC (20,401,020) (716,631) Carnival Corp. (15,880,543) (20,000) Cheesecake Factory, Inc. (812,800) (271,898) Chegg, Inc. (16,161,617) (300,000) Chewy, Inc. - Class A (22,740,000) (21,323) Cracker Barrel Old Country Store, Inc. (2,839,584) (166,400) EUR Delivery Hero, SE* (20,688,144) (549,900) Dick’s Sporting Goods, Inc. (68,303,079) (304,600) DraftKings Inc - Class A (14,191,314) (660,100) JPY EDION Corp. (6,254,951) (427,259) Etsy, Inc. (107,109,559) (14,400) Expedia Group, Inc. (2,367,504) (595,333) Farfetch, Ltd. - Class A (23,343,007) (50,600) Fiverr International, Ltd. (8,619,710)
See accompanying Notes to Schedule of Investments

100 CALAMOS OPEN-END FAMILY OF FUNDS ANNUAL REPORT
Market Neutral Income Fund Schedule of Investments October 31, 2021
NUMBER OF SHARES VALUE
NUMBER OF SHARES VALUE
(34,000) Groupon, Inc. $ (721,480) (339,080) Guess?, Inc. (7,022,347) (106,100) JPY Kyoritsu Maintenance Company, Ltd. (3,965,659) (287,400) Li Auto, Inc. (9,377,862) (29,000) Marriott Vacations Worldwide Corp. (4,559,380) (81,000) HKD Meituan - Class B* (2,806,709) (27,254) MercadoLibre, Inc. (40,363,719) (211,700) National Vision Holdings, Inc. (13,049,188) (102,128) NIO, Inc. (4,024,864) (1,877,500) Norwegian Cruise Line Holdings, Ltd. (48,289,300) (272,636) GBP Ocado Group, PLC (6,727,285) (50,800) Peloton Interactive, Inc. - Class A (4,645,152) (168,050) Pinduoduo, Inc. (14,943,006) (120,000) Porch Group, Inc. (2,523,600) (287,500) Royal Caribbean Cruises, Ltd. (24,273,625) (33,000) Shake Shack, Inc. - Class A (2,282,610) (140,355) Stride, Inc. (4,982,602) (40,000) JPY Takashimaya Company, Ltd. (369,555) (138,786) Tesla, Inc. (154,607,604) (11,800) Vail Resorts, Inc. (4,067,578) (90,300) Vroom, Inc. (1,727,439) (477,002) Wayfair, Inc. - Class A (118,821,198) (82,400) Winnebago Industries, Inc. (5,577,656) (843,928,882)
Consumer Staples (-0.2%) (248,100) Beauty Health Company (6,815,307) (85,500) Beyond Meat, Inc. (8,462,790) (170,108) Energizer Holdings, Inc. (6,203,839) (33,800) JPY Ezaki Glico Company, Ltd. (1,224,777) (135,100) Herbalife Nutrition, Ltd. (6,268,640) (47,000) JPY Nippn Corp. (672,577) (44,561) Turning Point Brands, Inc. (1,700,894) (69,400) JPY Yaoko Company, Ltd. (4,122,290) (35,471,114)
Energy (-0.6%) (530,806) Pioneer Natural Resources
Company (99,250,106)
Financials (-0.5%) (75,834) Apollo Global Management, Inc. (5,835,426) (108,100) Coinbase Global, Inc. - Class A (34,529,302) (34,000) Hope Bancorp, Inc. (496,060) (38,704) LendingTree, Inc. (6,246,439) (25,637) S&P Global, Inc. (12,156,040) (307,000) SoFi Technologies, Inc. (6,167,630)
(27,000) Upstart Holdings, Inc. $ (8,695,080) (103,500) Voya Financial, Inc. (7,221,195) (81,347,172)
Health Care (-2.3%) (65,000) Accolade, Inc. (2,586,350) (642,149) Allscripts Healthcare Solutions, Inc. (8,848,813) (136,300) Alphatec Holdings, Inc. (1,598,799) (1,715,900) Avantor, Inc. (69,288,042) (270,066) Bridgebio Pharma, Inc. (13,335,859) (147,790) Coherus Biosciences, Inc. (2,472,527) (84,000) Collegium Pharmaceutical, Inc. (1,648,920) (101,500) CONMED Corp. (14,847,420) (22,800) Danaher Corp. (7,108,356) (91,303) Dexcom, Inc. (56,900,943) (97,500) Evolent Health, Inc. - Class A (2,853,825) (475,625) Halozyme Therapeutics, Inc. (18,107,044) (763,600) Innoviva, Inc. (13,324,820) (170,531) Insmed, Inc. (5,141,510) (34,000) Insulet Corp. (10,540,680) (1,005,487) Ironwood Pharmaceuticals, Inc. (12,840,069) (95,000) Jazz Pharmaceuticals, PLC (12,638,800) (189,900) JPY Medipal Holdings Corp. (3,423,948) (14,300) Mesa Laboratories, Inc. (4,371,510) (172,200) Natera, Inc. (19,728,954) (96,233) NeoGenomics, Inc. (4,426,718) (64,521) Neurocrine Biosciences, Inc. (6,801,159) (52,400) Novocure, Ltd. (5,374,668) (52,048) NuVasive, Inc. (2,777,281) (167,200) Oak Street Health, Inc. (7,896,856) (115,000) Omnicell, Inc. (20,487,250) (396,000) OPKO Health, Inc. (1,500,840) (91,800) Pacira BioSciences, Inc. (4,799,304) (74,000) Revance Therapeutics, Inc. (1,017,500) (207,500) Sarepta Therapeutics, Inc. (16,419,475) (352,400) JPY Ship Healthcare Holdings, Inc. (9,235,523) (36,000) Supernus Pharmaceuticals, Inc. (1,074,600) (30,000) Tabula Rasa HealthCare, Inc. (814,500) (124,283) Teladoc Health, Inc. (18,591,494) (33,900) JPY Toho Holdings Company, Ltd. (546,385) (63,137) Travere Therapeutics, Inc. (1,818,977) (23,800) Vocera Communications, Inc. (1,346,604) (386,536,323)
Industrials (-1.0%) (580,000) CAD Air Canada (10,399,321) (524,000) American Airlines Group, Inc. (10,060,800) (513,000) Clarivate, PLC (12,029,850) (920,000) Colfax Corp. (47,490,400)
See accompanying Notes to Schedule of Investments

101www.calamos.com
Market Neutral Income Fund Schedule of Investments October 31, 2021
NUMBER OF SHARES VALUE
NUMBER OF SHARES VALUE
(96,050) FTI Consulting, Inc. $ (13,823,516) (74,380) Greenbrier Companies, Inc. (3,051,068) (17,900) John Bean Technologies Corp. (2,644,725) (99,700) JPY Lixil Corp. (2,557,778) (55,500) Middleby Corp. (10,125,420) (89,000) JPY Nagoya Railroad Company, Ltd. (1,466,480) (19,000) RBC Bearings, Inc. (4,444,670) (221,300) JPY Seino Holdings Company, Ltd. (2,673,657) (480,800) JPY Senko Group Holdings Company, Ltd. (4,260,654) (465,100) Southwest Airlines Company (21,989,928) (48,992) Stanley Black & Decker, Inc. (8,805,332) (92,201) Upwork, Inc. (4,344,511) (160,168,110)
Information Technology (-11.2%) (201,000) 8x8, Inc. (4,554,660) (233,947) Advanced Micro Devices, Inc. (28,127,448) (569,300) Akamai Technologies, Inc. (60,038,378) (196,395) Altair Engineering, Inc. - Class A (15,277,567) (33,835) Alteryx, Inc. - Class A (2,476,384) (71,136) Avalara, Inc. (12,778,871) (90,000) Avaya Holdings Corp. (1,675,800) (108,000) Bentley Systems, Inc. - Class B (6,388,200) (20,500) BigCommerce Holdings, Inc. (947,305) (274,259) Bill.com Holdings, Inc. (80,717,166) (475,341) Blackline, Inc. (60,306,513) (690,000) Box, Inc. - Class A (17,822,700) (87,700) Ceridian HCM Holding, Inc. (10,984,425) (254,994) Cloudflare, Inc. - Class A (49,652,432) (229,060) Coupa Software, Inc. (52,156,962) (65,000) CSG Systems International, Inc. (3,253,250) (45,000) CyberArk Software, Ltd. (8,104,950) (126,500) Datadog, Inc. - Class A (21,131,825) (167,800) JPY Digital Garage, Inc. (7,802,939) (882,200) Dropbox, Inc. - Class A (26,898,278) (46,034) Enphase Energy, Inc. (10,662,855) (139,400) Envestnet, Inc. (11,639,900) (27,000) Everbridge, Inc. (4,301,370) (223,900) Fastly, Inc. - Class A (11,331,579) (21,000) fuboTV, Inc. (626,010) (87,800) GDS Holdings, Ltd. (5,215,320) (112,333) Guidewire Software, Inc. (14,123,628) (30,000) i3 Verticals, Inc. - Class A (671,700) (292,020) II-VI, Inc. (17,670,130) (888,000) Infinera Corp. (6,739,920) (152,400) Insight Enterprises, Inc. (14,432,280) (62,916) Itron, Inc. (4,892,977)
(41,600) Jamf Holding Corp. $ (1,982,240) (4,762,000) HKD Lenovo Group, Ltd. (5,177,883) (302,400) LivePerson, Inc. (15,576,624) (466,800) Lumentum Holdings, Inc. (38,548,344) (346,300) Mandiant, Inc. (6,039,472) (31,949) MicroStrategy Inc - Class A (22,845,452) (226,829) MongoDB, Inc. (118,243,689) (51,000) New Relic, Inc. (4,139,160) (237,100) Nice, Ltd. (67,104,042) (108,350) Nova, Ltd. (11,768,977) (109,087) Nutanix, Inc. - Class A (3,742,775) (303,162) Okta, Inc. (74,935,583) (50,100) OSI Systems, Inc. (4,664,811) (344,941) Palo Alto Networks, Inc. (175,606,014) (91,674) PAR Technology Corp. (5,758,961) (156,300) Pegasystems, Inc. (18,555,936) (93,100) Perficient, Inc. (11,507,160) (116,500) Progress Software Corp. (5,989,265) (51,500) PROS Holdings, Inc. (1,545,000) (111,230) Q2 Holdings, Inc. (8,727,106) (92,100) Rapid7, Inc. (11,857,875) (130,600) Repay Holdings Corp. (2,743,906) (34,111) RingCentral, Inc. - Class A (8,315,580) (553,500) Sailpoint Technologies Holdings, Inc. (26,556,930) (196,300) Shift4 Payments, Inc. - Class A (12,392,419) (5,100) Shopify, Inc. - Class A (7,480,323) (200,950) Silicon Laboratories, Inc. (37,931,322) (104,200) SMART Global Holdings, Inc. (5,570,532) (317,200) Splunk, Inc. (52,280,904) (616,600) Square, Inc. - Class A (156,924,700) (207,000) STMicroelectronics, NV (9,072,810) (9,683) Synaptics, Inc. (1,884,021) (473,975) Teradyne, Inc. (65,522,304) (34,400) Tyler Technologies, Inc. (18,686,768) (98,300) Verint Systems, Inc. (4,580,780) (131,000) Vishay Intertechnology, Inc. (2,517,820) (14,000) Vnet Group, Inc. (219,520) (24,400) Wix.com, Ltd. (4,537,424) (200,000) Wolfspeed, Inc. (24,022,000) (330,912) Workday, Inc. - Class A (95,957,862) (200,700) Workiva, Inc. (30,014,685) (363,050) Zendesk, Inc. (36,958,490) (140,000) Zscaler, Inc. (44,640,400) (1,836,531,591)
Materials (-0.3%) (527,021) Allegheny Technologies, Inc. (8,485,038) (256,100) JPY Asahi Holdings, Inc. (4,568,118) (44,300) JPY Kansai Paint Company, Ltd. (1,023,399)
See accompanying Notes to Schedule of Investments
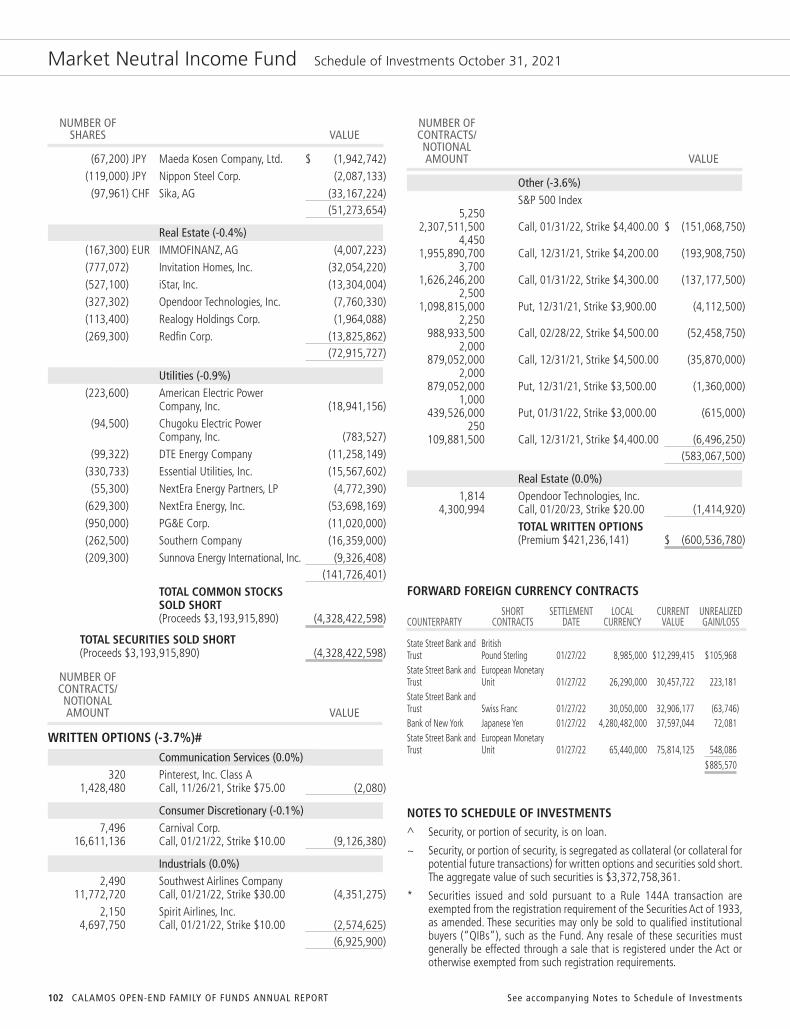
102 CALAMOS OPEN-END FAMILY OF FUNDS ANNUAL REPORT
Market Neutral Income Fund Schedule of Investments October 31, 2021
NUMBER OF SHARES VALUE
NUMBER OF CONTRACTS/ NOTIONAL AMOUNT VALUE (67,200) JPY Maeda Kosen Company, Ltd. $ (1,942,742)
(119,000) JPY Nippon Steel Corp. (2,087,133) (97,961) CHF Sika, AG (33,167,224) (51,273,654)
Real Estate (-0.4%) (167,300) EUR IMMOFINANZ, AG (4,007,223) (777,072) Invitation Homes, Inc. (32,054,220) (527,100) iStar, Inc. (13,304,004) (327,302) Opendoor Technologies, Inc. (7,760,330) (113,400) Realogy Holdings Corp. (1,964,088) (269,300) Redfin Corp. (13,825,862) (72,915,727)
Utilities (-0.9%) (223,600) American Electric Power Company, Inc. (18,941,156) (94,500) Chugoku Electric Power Company, Inc. (783,527) (99,322) DTE Energy Company (11,258,149) (330,733) Essential Utilities, Inc. (15,567,602) (55,300) NextEra Energy Partners, LP (4,772,390) (629,300) NextEra Energy, Inc. (53,698,169) (950,000) PG&E Corp. (11,020,000) (262,500) Southern Company (16,359,000) (209,300) Sunnova Energy International, Inc. (9,326,408) (141,726,401)
TOTAL COMMON STOCKS SOLD SHORT(Proceeds $3,193,915,890) (4,328,422,598)
TOTAL SECURITIES SOLD SHORT(Proceeds $3,193,915,890) (4,328,422,598)
NUMBER OF CONTRACTS/ NOTIONAL AMOUNT VALUE
WRITTEN OPTIONS (-3.7%)#Communication Services (0.0%)
320 Pinterest, Inc. Class A 1,428,480 Call, 11/26/21, Strike $75.00 (2,080)
Consumer Discretionary (-0.1%) 7,496 Carnival Corp.
16,611,136 Call, 01/21/22, Strike $10.00 (9,126,380)
Industrials (0.0%) 2,490 Southwest Airlines Company 11,772,720 Call, 01/21/22, Strike $30.00 (4,351,275) 2,150 Spirit Airlines, Inc. 4,697,750 Call, 01/21/22, Strike $10.00 (2,574,625) (6,925,900)
Other (-3.6%) S&P 500 Index 5,250 2,307,511,500 Call, 01/31/22, Strike $4,400.00 $ (151,068,750) 4,450 1,955,890,700 Call, 12/31/21, Strike $4,200.00 (193,908,750) 3,700 1,626,246,200 Call, 01/31/22, Strike $4,300.00 (137,177,500) 2,500 1,098,815,000 Put, 12/31/21, Strike $3,900.00 (4,112,500) 2,250 988,933,500 Call, 02/28/22, Strike $4,500.00 (52,458,750) 2,000 879,052,000 Call, 12/31/21, Strike $4,500.00 (35,870,000) 2,000 879,052,000 Put, 12/31/21, Strike $3,500.00 (1,360,000) 1,000 439,526,000 Put, 01/31/22, Strike $3,000.00 (615,000) 250 109,881,500 Call, 12/31/21, Strike $4,400.00 (6,496,250) (583,067,500)
Real Estate (0.0%) 1,814 Opendoor Technologies, Inc.
4,300,994 Call, 01/20/23, Strike $20.00 (1,414,920) TOTAL WRITTEN OPTIONS
(Premium $421,236,141) $ (600,536,780)
FORWARD FOREIGN CURRENCY CONTRACTS
SHORT SETTLEMENT LOCAL CURRENT UNREALIZEDCOUNTERPARTY CONTRACTS DATE CURRENCY VALUE GAIN/LOSS
State Street Bank and British Trust Pound Sterling 01/27/22 8,985,000 $12,299,415 $105,968State Street Bank and European Monetary Trust Unit 01/27/22 26,290,000 30,457,722 223,181State Street Bank and Trust Swiss Franc 01/27/22 30,050,000 32,906,177 (63,746)Bank of New York Japanese Yen 01/27/22 4,280,482,000 37,597,044 72,081State Street Bank and European Monetary Trust Unit 01/27/22 65,440,000 75,814,125 548,086
$885,570
NOTES TO SCHEDULE OF INVESTMENTS^ Security, or portion of security, is on loan.
~ Security, or portion of security, is segregated as collateral (or collateral forpotential future transactions) for written options and securities sold short.The aggregate value of such securities is $3,372,758,361.
* Securities issued and sold pursuant to a Rule 144A transaction areexempted from the registration requirement of the Securities Act of 1933,as amended. These securities may only be sold to qualified institutionalbuyers (“QIBs”), such as the Fund. Any resale of these securities mustgenerally be effected through a sale that is registered under the Act orotherwise exempted from such registration requirements.
See accompanying Notes to Schedule of Investments

103www.calamos.com
Market Neutral Income Fund Schedule of Investments October 31, 2021
See accompanying Notes to Schedule of Investments
§ Securities exchangeable or convertible into securities of one or moreentities that are different than the issuer. Each entity is identified in theparenthetical.
# Non-income producing security.
*** The rate disclosed is the 7 day net yield as of October 31, 2021.
† Represents investment of cash collateral received from securities on loanas of October 31, 2021.
TOTAL RETURN SWAPS
UPFRONT UNDERLYING PERIODIC PAYMENTS UNREALIZED REFERENCE FIXED RATE FLOATING RATE TERMINATION PAYMENT NOTIONAL (PAID)/ MARKET APPRECIATION/COUNTERPARTY INSTRUMENT (FUND PAYS) (FUND RECEIVES) DATE FREQUENCY AMOUNT RECEIVED VALUE (DEPRECIATION)
JPMorgan Chase JAMF Holding Equity returns on Bank N.A. Corp. 52,000 shares of JAMF Holding Corp. 1 mo. LIBOR Flat 11/11/21 Monthly $1,856,920 $— $(620,687) $(620,687)Morgan Stanley & Co. Radius Global Equity returns on 31,900 shares of Radius Global Fed Funds Effective Flat 11/15/21 Monthly 554,103 — 5,003 5,003 $— $(615,684) $(615,684)
FOREIGN CURRENCY ABBREVIATIONCAD Canadian DollarCHF Swiss FrancEUR European Monetary UnitGBP British Pound SterlingHKD Hong Kong DollarJPY Japanese Yen
Note: Value for securities denominated in foreign currencies is shown in U.S. dollars. Theprincipal amount for such securities is shown in the respective foreign currency. The date onoptions represents the expiration date of the option contract. The option contract may beexercised at any date on or before the date shown. For purchased options denominated inJPY, the strike price shown is a percentage of the par value of the underlying.

104 CALAMOS OPEN-END FAMILY OF FUNDS ANNUAL REPORT
Hedged Equity Fund Schedule of Investments October 31, 2021
PRINCIPAL AMOUNT VALUE
NUMBER OF SHARES VALUE
CONVERTIBLE BOND (2.0%)Consumer Discretionary (2.0%)
616,000 Tesla, Inc.2.000%, 05/15/24(Cost $6,587,300) $ 11,054,169
NUMBER OF SHARES VALUE
COMMON STOCKS (98.1%)Communication Services (10.8%)
9,764 Activision Blizzard, Inc. 763,447 3,833 Alphabet, Inc. - Class A#~ 11,349,206 4,300 Alphabet, Inc. - Class C#~ 12,751,263 95,676 AT&T, Inc.~ 2,416,776 2,045 Charter Communications, Inc. - Class A#~ 1,380,150 66,368 Comcast Corp. - Class A 3,413,306 12,273 Fox Corp. - Class A 487,729 42,178 Meta Platforms, Inc. - Class A#~ 13,647,536 7,005 Netflix, Inc.#~ 4,835,622 11,754 Twitter, Inc.# 629,309 63,347 Verizon Communications, Inc.~ 3,356,758 30,776 Walt Disney Company#~ 5,203,298 60,234,400
Consumer Discretionary (11.1%) 6,781 Amazon.com, Inc.#~ 22,868,448 9,669 Aptiv, PLC# 1,671,673 546 Booking Holdings, Inc.#~ 1,321,746 656 Chipotle Mexican Grill, Inc.# 1,167,044 4,246 Darden Restaurants, Inc. 612,018 3,836 Dollar General Corp. 849,751 13,192 DR Horton, Inc. 1,177,650 11,509 eBay, Inc. 882,970 4,233 Expedia Group, Inc.# 695,948 42,473 Ford Motor Company 725,439 15,343 General Motors Company# 835,119 16,148 Home Depot, Inc.~ 6,002,858 8,951 Leggett & Platt, Inc. 419,354 13,185 Lowe’s Companies, Inc. 3,082,917 11,541 McDonald’s Corp.~ 2,833,893 14,739 MGM Resorts International 695,091 3,613 Mohawk Industries, Inc.# 640,260 23,983 NIKE, Inc. - Class B~ 4,012,116 1,737 O’Reilly Automotive, Inc.# 1,080,970 3,522 PVH Corp.# 385,060 7,319 Ross Stores, Inc. 828,511 10,550 Royal Caribbean Cruises, Ltd.# 890,736 17,739 Starbucks Corp.~ 1,881,576 8,176 Target Corp. 2,122,653
755 Tesla, Inc.# $ 841,070 20,450 TJX Companies, Inc.~ 1,339,270 2,250 Ulta Beauty, Inc.# 826,560 16,032 VF Corp. 1,168,412 61,859,113
Consumer Staples (5.6%) 28,192 Altria Group, Inc.~ 1,243,549 12,429 Archer-Daniels-Midland Company 798,439 7,973 Church & Dwight Company, Inc. 696,521 51,551 Coca-Cola Company~ 2,905,930 12,008 Colgate-Palmolive Company 914,890 5,666 Constellation Brands, Inc. - Class A 1,228,445 4,902 Costco Wholesale Corp.~ 2,409,529 13,112 General Mills, Inc. 810,322 9,948 Kellogg Company 609,812 7,414 Kimberly-Clark Corp. 960,039 17,131 Kraft Heinz Company 614,832 17,257 Kroger Company 690,625 34,635 Mondelez International, Inc. - Class A~ 2,103,730 7,488 Monster Beverage Corp.# 636,480 15,812 PepsiCo, Inc.~ 2,555,219 28,943 Philip Morris International, Inc.~ 2,736,271 28,425 Procter & Gamble Company~ 4,064,491 12,915 Sysco Corp. 993,164 12,168 Walgreens Boots Alliance, Inc.~ 572,139 24,385 Walmart, Inc.~ 3,643,607 31,188,034
Energy (2.9%) 31,924 Chevron Corp.~ 3,654,979 21,662 ConocoPhillips~ 1,613,602 6,108 EOG Resources, Inc. 564,746 37,157 Exxon Mobil Corp. 2,395,512 14,062 Hess Corp. 1,161,099 41,092 Kinder Morgan, Inc. 688,291 24,999 Marathon Petroleum Corp. 1,648,184 12,202 Occidental Petroleum Corp. 409,133 8,237 ONEOK, Inc. 524,038 5,771 Phillips 66 431,555 8,192 Pioneer Natural Resources Company 1,531,740 17,383 Schlumberger, NV 560,776 5,742 Valero Energy Corp.~ 444,029 20,739 Williams Companies, Inc. 582,559 16,210,243
Financials (11.4%) 8,519 Aflac, Inc. 457,215 6,542 Allstate Corp. 809,049 14,625 American Express Company~ 2,541,532
See accompanying Notes to Schedule of Investments
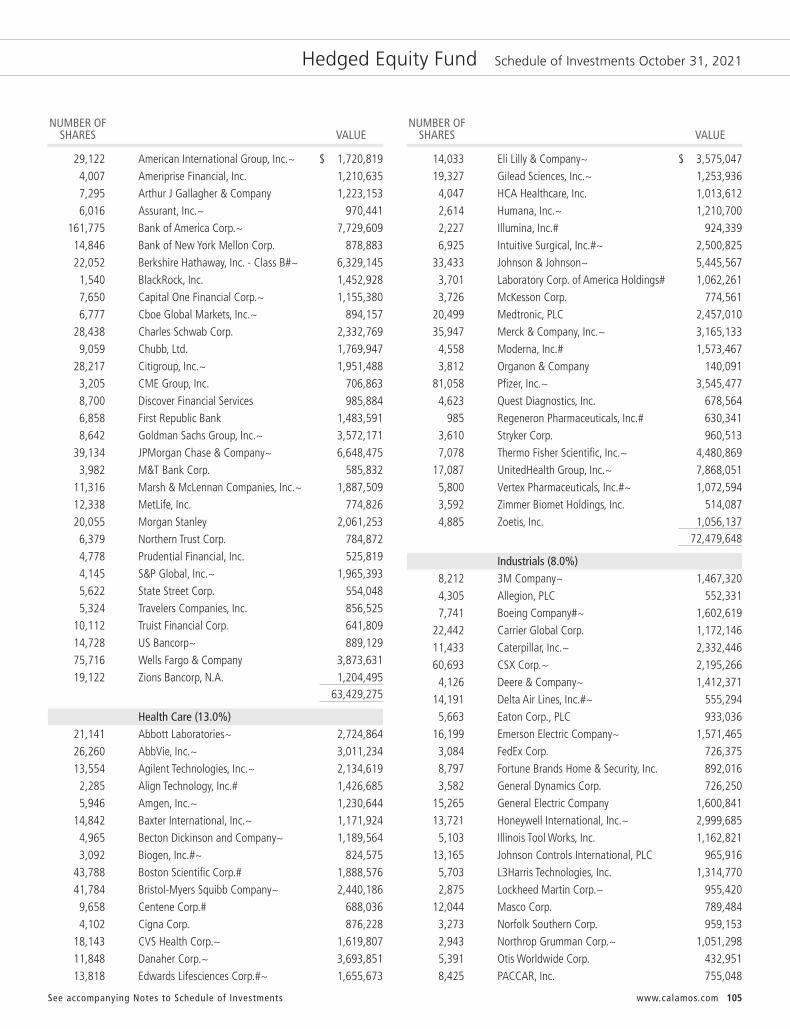
105www.calamos.com
Hedged Equity Fund Schedule of Investments October 31, 2021
NUMBER OF SHARES VALUE
NUMBER OF SHARES VALUE
29,122 American International Group, Inc.~ $ 1,720,819 4,007 Ameriprise Financial, Inc. 1,210,635 7,295 Arthur J Gallagher & Company 1,223,153 6,016 Assurant, Inc.~ 970,441 161,775 Bank of America Corp.~ 7,729,609 14,846 Bank of New York Mellon Corp. 878,883 22,052 Berkshire Hathaway, Inc. - Class B#~ 6,329,145 1,540 BlackRock, Inc. 1,452,928 7,650 Capital One Financial Corp.~ 1,155,380 6,777 Cboe Global Markets, Inc.~ 894,157 28,438 Charles Schwab Corp. 2,332,769 9,059 Chubb, Ltd. 1,769,947 28,217 Citigroup, Inc.~ 1,951,488 3,205 CME Group, Inc. 706,863 8,700 Discover Financial Services 985,884 6,858 First Republic Bank 1,483,591 8,642 Goldman Sachs Group, Inc.~ 3,572,171 39,134 JPMorgan Chase & Company~ 6,648,475 3,982 M&T Bank Corp. 585,832 11,316 Marsh & McLennan Companies, Inc.~ 1,887,509 12,338 MetLife, Inc. 774,826 20,055 Morgan Stanley 2,061,253 6,379 Northern Trust Corp. 784,872 4,778 Prudential Financial, Inc. 525,819 4,145 S&P Global, Inc.~ 1,965,393 5,622 State Street Corp. 554,048 5,324 Travelers Companies, Inc. 856,525 10,112 Truist Financial Corp. 641,809 14,728 US Bancorp~ 889,129 75,716 Wells Fargo & Company 3,873,631 19,122 Zions Bancorp, N.A. 1,204,495 63,429,275
Health Care (13.0%) 21,141 Abbott Laboratories~ 2,724,864 26,260 AbbVie, Inc.~ 3,011,234 13,554 Agilent Technologies, Inc.~ 2,134,619 2,285 Align Technology, Inc.# 1,426,685 5,946 Amgen, Inc.~ 1,230,644 14,842 Baxter International, Inc.~ 1,171,924 4,965 Becton Dickinson and Company~ 1,189,564 3,092 Biogen, Inc.#~ 824,575 43,788 Boston Scientific Corp.# 1,888,576 41,784 Bristol-Myers Squibb Company~ 2,440,186 9,658 Centene Corp.# 688,036 4,102 Cigna Corp. 876,228 18,143 CVS Health Corp.~ 1,619,807 11,848 Danaher Corp.~ 3,693,851 13,818 Edwards Lifesciences Corp.#~ 1,655,673
14,033 Eli Lilly & Company~ $ 3,575,047 19,327 Gilead Sciences, Inc.~ 1,253,936 4,047 HCA Healthcare, Inc. 1,013,612 2,614 Humana, Inc.~ 1,210,700 2,227 Illumina, Inc.# 924,339 6,925 Intuitive Surgical, Inc.#~ 2,500,825 33,433 Johnson & Johnson~ 5,445,567 3,701 Laboratory Corp. of America Holdings# 1,062,261 3,726 McKesson Corp. 774,561 20,499 Medtronic, PLC 2,457,010 35,947 Merck & Company, Inc.~ 3,165,133 4,558 Moderna, Inc.# 1,573,467 3,812 Organon & Company 140,091 81,058 Pfizer, Inc.~ 3,545,477 4,623 Quest Diagnostics, Inc. 678,564 985 Regeneron Pharmaceuticals, Inc.# 630,341 3,610 Stryker Corp. 960,513 7,078 Thermo Fisher Scientific, Inc.~ 4,480,869 17,087 UnitedHealth Group, Inc.~ 7,868,051 5,800 Vertex Pharmaceuticals, Inc.#~ 1,072,594 3,592 Zimmer Biomet Holdings, Inc. 514,087 4,885 Zoetis, Inc. 1,056,137 72,479,648
Industrials (8.0%) 8,212 3M Company~ 1,467,320 4,305 Allegion, PLC 552,331 7,741 Boeing Company#~ 1,602,619 22,442 Carrier Global Corp. 1,172,146 11,433 Caterpillar, Inc.~ 2,332,446 60,693 CSX Corp.~ 2,195,266 4,126 Deere & Company~ 1,412,371 14,191 Delta Air Lines, Inc.#~ 555,294 5,663 Eaton Corp., PLC 933,036 16,199 Emerson Electric Company~ 1,571,465 3,084 FedEx Corp. 726,375 8,797 Fortune Brands Home & Security, Inc. 892,016 3,582 General Dynamics Corp. 726,250 15,265 General Electric Company 1,600,841 13,721 Honeywell International, Inc.~ 2,999,685 5,103 Illinois Tool Works, Inc. 1,162,821 13,165 Johnson Controls International, PLC 965,916 5,703 L3Harris Technologies, Inc. 1,314,770 2,875 Lockheed Martin Corp.~ 955,420 12,044 Masco Corp. 789,484 3,273 Norfolk Southern Corp. 959,153 2,943 Northrop Grumman Corp.~ 1,051,298 5,391 Otis Worldwide Corp. 432,951 8,425 PACCAR, Inc. 755,048
See accompanying Notes to Schedule of Investments

106 CALAMOS OPEN-END FAMILY OF FUNDS ANNUAL REPORT
Hedged Equity Fund Schedule of Investments October 31, 2021
NUMBER OF SHARES VALUE
NUMBER OF SHARES VALUE
10,212 Pentair, PLC $ 755,382 29,275 Raytheon Technologies Corp.~ 2,601,376 25,871 Southwest Airlines Company# 1,223,181 5,916 Stanley Black & Decker, Inc. 1,063,283 782 Teledyne Technologies, Inc.# 351,290 15,144 Union Pacific Corp.~ 3,655,762 9,658 United Parcel Service, Inc. - Class B~ 2,061,693 4,847 Verisk Analytics, Inc. 1,019,179 9,276 Waste Management, Inc.~ 1,486,293 6,666 Xylem, Inc.~ 870,513 44,214,274
Information Technology (28.2%) 8,108 Accenture, PLC - Class A 2,909,069 6,934 Adobe, Inc.#~ 4,509,596 21,551 Advanced Micro Devices, Inc.#~ 2,591,077 12,592 Amphenol Corp. - Class A 966,688 217,591 Apple, Inc.~ 32,595,132 25,732 Applied Materials, Inc.~ 3,516,278 3,504 Autodesk, Inc.# 1,112,905 8,203 Automatic Data Processing, Inc.~ 1,841,491 6,474 Broadcom, Inc.~ 3,442,032 77,052 Cisco Systems, Inc.~ 4,312,600 5,395 Citrix Systems, Inc. 511,068 9,832 Cognizant Technology Solutions Corp. - Class A 767,781 1,484 Enphase Energy, Inc.# 343,739 13,891 Fidelity National Information Services, Inc. 1,538,289 9,723 Fiserv, Inc.#~ 957,618 3,623 Gartner, Inc.# 1,202,510 5,386 Global Payments, Inc. 770,144 20,209 HP, Inc. 612,939 59,946 Intel Corp.~ 2,937,354 9,887 International Business Machines Corp. 1,236,864 3,792 Intuit, Inc.~ 2,373,754 3,675 Jack Henry & Associates, Inc. 611,814 1,840 Lam Research Corp.~ 1,036,969 10,843 Mastercard, Inc. - Class A 3,638,043 23,954 Micron Technology, Inc.~ 1,655,221 114,582 Microsoft Corp.~ 37,997,683 5,444 NetApp, Inc. 486,149 41,967 NVIDIA Corp.~ 10,729,703 20,784 Oracle Corp.~ 1,994,017 7,712 Paychex, Inc. 950,735 2,767 Paycom Software, Inc.# 1,515,901 21,111 PayPal Holdings, Inc.# 4,910,208 17,312 QUALCOMM, Inc.~ 2,303,189 16,384 salesforce.com, Inc.#~ 4,910,121
2,358 ServiceNow, Inc.# $ 1,645,318 5,256 TE Connectivity, Ltd. 767,376 9,639 Texas Instruments, Inc.~ 1,807,120 29,217 Visa, Inc. - Class A~ 6,187,284 5,338 Western Digital Corp.# 279,124 24,730 Western Union Company 450,581 10,685 Xilinx, Inc. 1,923,300 156,848,784
Materials (2.4%) 4,758 Air Products and Chemicals, Inc.~ 1,426,496 3,887 Avery Dennison Corp. 846,278 11,060 Ball Corp. 1,011,769 13,561 Corteva, Inc. 585,157 13,559 Dow, Inc. 758,897 12,188 DuPont de Nemours, Inc. 848,285 38,225 Freeport-McMoRan, Inc. 1,441,847 982 International Flavors & Fragrances, Inc. 144,796 10,632 Linde, PLC 3,393,734 12,349 Newmont Corp. 666,846 6,027 PPG Industries, Inc. 967,755 3,688 Sherwin-Williams Company 1,167,658 13,259,518
Real Estate (2.4%) 4,145 Alexandria Real Estate Equities, Inc. 846,160 5,208 American Tower Corp. 1,468,500 3,810 AvalonBay Communities, Inc. 901,751 5,170 Crown Castle International Corp. 932,151 4,122 Digital Realty Trust, Inc. 650,493 954 Equinix, Inc. 798,565 3,688 Federal Realty Investment Trust 443,851 4,959 Mid-America Apartment Communities, Inc. 1,012,677 7,143 Prologis, Inc. 1,035,449 2,729 Public Storage 906,519 9,486 Realty Income Corp. 677,585 7,732 Regency Centers Corp. 544,410 5,727 Simon Property Group, Inc. 839,464 12,005 UDR, Inc. 666,638 9,711 Welltower, Inc. 780,764 18,074 Weyerhaeuser Company 645,603 13,150,580
Utilities (2.3%) 29,578 AES Corp. 743,295 11,581 American Electric Power Company, Inc.~ 981,026 10,775 CMS Energy Corp. 650,271 9,020 Consolidated Edison, Inc. 680,108
See accompanying Notes to Schedule of Investments
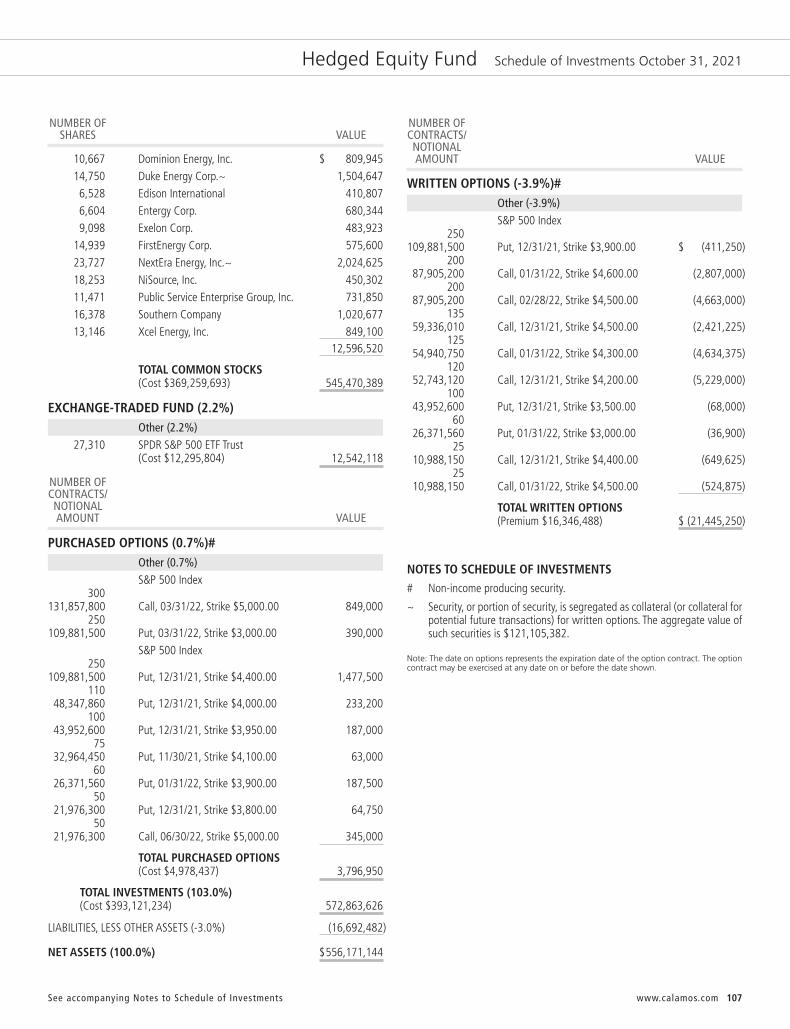
107www.calamos.com
Hedged Equity Fund Schedule of Investments October 31, 2021
NUMBER OF SHARES VALUE
NUMBER OFCONTRACTS/ NOTIONAL AMOUNT VALUE 10,667 Dominion Energy, Inc. $ 809,945
14,750 Duke Energy Corp.~ 1,504,647 6,528 Edison International 410,807 6,604 Entergy Corp. 680,344 9,098 Exelon Corp. 483,923 14,939 FirstEnergy Corp. 575,600 23,727 NextEra Energy, Inc.~ 2,024,625 18,253 NiSource, Inc. 450,302 11,471 Public Service Enterprise Group, Inc. 731,850 16,378 Southern Company 1,020,677 13,146 Xcel Energy, Inc. 849,100 12,596,520
TOTAL COMMON STOCKS(Cost $369,259,693) 545,470,389
EXCHANGE-TRADED FUND (2.2%)Other (2.2%)
27,310 SPDR S&P 500 ETF Trust(Cost $12,295,804) 12,542,118
NUMBER OFCONTRACTS/ NOTIONAL AMOUNT VALUE
PURCHASED OPTIONS (0.7%)#Other (0.7%)
S&P 500 Index 300 131,857,800 Call, 03/31/22, Strike $5,000.00 849,000 250 109,881,500 Put, 03/31/22, Strike $3,000.00 390,000 S&P 500 Index 250 109,881,500 Put, 12/31/21, Strike $4,400.00 1,477,500 110 48,347,860 Put, 12/31/21, Strike $4,000.00 233,200 100 43,952,600 Put, 12/31/21, Strike $3,950.00 187,000 75 32,964,450 Put, 11/30/21, Strike $4,100.00 63,000 60 26,371,560 Put, 01/31/22, Strike $3,900.00 187,500 50 21,976,300 Put, 12/31/21, Strike $3,800.00 64,750 50 21,976,300 Call, 06/30/22, Strike $5,000.00 345,000
TOTAL PURCHASED OPTIONS(Cost $4,978,437) 3,796,950
TOTAL INVESTMENTS (103.0%)(Cost $393,121,234) 572,863,626
LIABILITIES, LESS OTHER ASSETS (-3.0%) (16,692,482)
NET ASSETS (100.0%) $556,171,144
WRITTEN OPTIONS (-3.9%)#Other (-3.9%)
S&P 500 Index 250 109,881,500 Put, 12/31/21, Strike $3,900.00 $ (411,250) 200 87,905,200 Call, 01/31/22, Strike $4,600.00 (2,807,000) 200 87,905,200 Call, 02/28/22, Strike $4,500.00 (4,663,000) 135 59,336,010 Call, 12/31/21, Strike $4,500.00 (2,421,225) 125 54,940,750 Call, 01/31/22, Strike $4,300.00 (4,634,375) 120 52,743,120 Call, 12/31/21, Strike $4,200.00 (5,229,000) 100 43,952,600 Put, 12/31/21, Strike $3,500.00 (68,000) 60 26,371,560 Put, 01/31/22, Strike $3,000.00 (36,900) 25 10,988,150 Call, 12/31/21, Strike $4,400.00 (649,625) 25 10,988,150 Call, 01/31/22, Strike $4,500.00 (524,875)
TOTAL WRITTEN OPTIONS(Premium $16,346,488) $ (21,445,250)
NOTES TO SCHEDULE OF INVESTMENTS# Non-income producing security.
~ Security, or portion of security, is segregated as collateral (or collateral forpotential future transactions) for written options. The aggregate value ofsuch securities is $121,105,382.
Note: The date on options represents the expiration date of the option contract. The optioncontract may be exercised at any date on or before the date shown.
See accompanying Notes to Schedule of Investments

108 CALAMOS OPEN-END FAMILY OF FUNDS ANNUAL REPORT
Phineus Long/Short Fund Schedule of Investments October 31, 2021
NUMBER OF SHARES VALUE
NUMBER OF SHARES VALUE
COMMON STOCKS (97.9%)Communication Services (8.8%)
8,400 Alphabet, Inc. - Class A#~ $ 24,871,728 74,700 Meta Platforms, Inc. - Class A#~ 24,170,679 49,042,407
Consumer Discretionary (7.7%) 159,000 EUR Accor, SA# 5,690,039 109,000 EUR Bayerische Motoren Werke, AG 11,012,924 142,000 Caesars Entertainment, Inc.#~ 15,543,320 282,000 Las Vegas Sands Corp.# 10,944,420 43,190,703
Consumer Staples (3.2%) 236,000 Sysco Corp.~ 18,148,400
Energy (4.7%) 360,000 Canadian Natural Resources, Ltd.^ 15,303,600 233,500 Royal Dutch Shell, PLC - Class A 10,722,320 26,025,920
Financials (19.1%) 331,000 Bank of America Corp. 15,815,180 1,075,000 Huntington Bancshares, Inc. 16,920,500 1,325,700 Itau Unibanco Holding, SA^ 5,395,599 4,415,000 GBP Legal & General Group, PLC 17,411,800 193,300 Morgan Stanley~ 19,867,374 5,480,000 GBP Natwest Group, PLC 16,523,156 193,000 Truist Financial Corp.~ 12,249,710 83,607 XP, Inc. - Class A#^ 2,743,146 106,926,465
Health Care (2.4%) 313,500 Boston Scientific Corp.#~ 13,521,255
Industrials (38.1%) 276,000 AerCap Holdings, NV#~ 16,295,040 748,000 Air Lease Corp. - Class A~ 29,957,400 52,000 Boeing Company# 10,765,560 500,000 CSX Corp.~ 18,085,000 450,000 Delta Air Lines, Inc.#~ 17,608,500 86,500 Honeywell International, Inc.~ 18,910,630 3,875,000 GBP International Consolidated Airlines Group, SA# 8,678,616 74,700 L3Harris Technologies, Inc.~ 17,221,338 240,500 Raytheon Technologies Corp.~ 21,370,830 70,000 EUR Siemens, AG 11,380,732 182,000 Southwest Airlines Company#~ 8,604,960 381,000 Uber Technologies, Inc.# 16,695,420 72,000 Union Pacific Corp.~ 17,380,800 212,954,826
Information Technology (11.7%) 123,000 Anaplan, Inc.# $ 8,020,830 41,000 Paycom Software, Inc.#~ 22,461,850 38,500 salesforce.com, Inc.#~ 11,538,065 49,900 Twilio, Inc. - Class A#~ 14,538,864 87,000 Zendesk, Inc.# 8,856,600 65,416,209
Materials (2.2%) 38,600 Linde, PLC~ 12,321,120
TOTAL COMMON STOCKS (Cost $474,920,784) 547,547,305
NUMBER OFCONTRACTS/ NOTIONAL AMOUNT VALUE
PURCHASED OPTIONS (1.4%)#Communication Services (0.0%)
84 Alphabet, Inc. 24,871,728 Put, 11/05/21, Strike $2,700.00 Meta Platforms, Inc. 8,820 747 24,170,679 Put, 11/05/21, Strike $300.00 35,856 377 12,198,589 Put, 11/05/21, Strike $317.50 121,583 166,259
Financials (0.4%) 27,000 Itau Unibanco Holding, SA 10,989,000 Call, 12/17/21, Strike $5.00 540,000 17,800 GBP Lloyds Banking Group, PLC 8,901,371 Call, 12/17/21, Strike 0.46 1,169,290 11,600 US Global Jets ETF 25,775,200 Call, 11/19/21, Strike $23.00 330,600 2,039,890
Health Care (0.0%) 1,420 BioMarin Pharmaceutical, Inc. 11,250,660 Call, 11/19/21, Strike $85.00 209,450
Industrials (0.1%) 520 Boeing Company 10,765,560 Call, 03/18/22, Strike $230.00 447,200 1,800 GBP International Consolidated Air 6,514,674 Call, 12/17/21, Strike 1.75 228,898 676,098
Information Technology (0.5%) 400 Affirm Holdings, Inc. 6,500,000 Call, 11/19/21, Strike $140.00 1,062,000 1,975 Fidelity National Information Services, Inc. 21,871,150 Call, 01/21/22, Strike $115.00 908,500 1,500 Zendesk, Inc. 15,270,000 Call, 12/17/21, Strike $110.00 570,000 2,540,500
See accompanying Notes to Schedule of Investments

109www.calamos.com
Phineus Long/Short Fund Schedule of Investments October 31, 2021
NUMBER OFCONTRACTS/ NOTIONAL AMOUNT VALUE
NUMBER OFCONTRACTS/ NOTIONAL AMOUNT VALUE
Other (0.4%) SPDR S&P 500 ETF Trust 4,100 188,292,500 Put, 11/01/21, Strike $415.00 $ 6,150 3,900 179,107,500 Put, 11/05/21, Strike $445.00 150,150 3,800 174,515,000 Put, 12/03/21, Strike $450.00 1,757,500 1,860 85,420,500 Put, 11/01/21, Strike $455.00 39,990 3,700 Technology Select Sector SPDR Fund 59,766,100 Put, 11/05/21, Strike $155.00 62,900 2,016,690
TOTAL PURCHASED OPTIONS (Cost $16,217,164) 7,648,887
NUMBER OF SHARES VALUE
INVESTMENT OF CASH COLLATERAL FOR SECURITIES LOANED (3.0%) 16,657,550 State Street Navigator Securities
Lending Government Money Market Portfolio†(Cost $16,657,550) 16,657,550
TOTAL INVESTMENTS (102.3%) (Cost $507,795,498) 571,853,742
PAYABLE UPON RETURN OF SECURITIES ON LOAN (-3.0%) (16,657,550)
OTHER ASSETS, LESS LIABILITIES (0.7%) 3,720,112
NET ASSETS (100.0%) $ 558,916,304
COMMON STOCKS SOLD SHORT (-3.2%)#Consumer Staples (-2.2%)
(24,400) Costco Wholesale Corp. (11,993,576)
Industrials (-1.0%) (35,000) Waste Management, Inc. (5,608,050)
TOTAL COMMON STOCKS SOLD SHORT (Proceeds $16,513,390) (17,601,626)
EXCHANGE-TRADED FUNDS SOLD SHORT (-33.3%)#Other (-33.3%)
(53,200) ARK Innovation ETF (6,452,096) (391,500) SPDR S&P 500 ETF Trust (179,796,375)
TOTAL EXCHANGE-TRADED FUNDS SOLD SHORT (Proceeds $179,941,756) (186,248,471)
TOTAL SECURITIES SOLD SHORT(Proceeds $196,455,146) (203,850,097)
WRITTEN OPTIONS (-1.6%)#Communication Services (0.0%)
84 Alphabet, Inc. 24,871,728 Put, 12/17/21, Strike $2,400.00 $ (43,260) 1,450 Meta Platforms, Inc. 46,917,650 Put, 12/17/21, Strike $250.00 (126,150) (169,410)
Consumer Discretionary (0.0%) 100 Amazon.com, Inc. 33,724,300 Put, 11/19/21, Strike $3,100.00 (91,250)
Health Care (0.0%) 355 BioMarin Pharmaceutical, Inc. 2,812,665 Put, 11/19/21, Strike $80.00 (131,350)
Industrials (-0.1%) International Consolidated Air 1,800 6,514,674 GBP Call, 12/17/21, Strike 2.00 (49,761) 1,800 6,514,674 GBP Put, 12/17/21, Strike 1.40 (129,377) (179,138)
Information Technology (-1.0%) 800 Affirm Holdings, Inc. 13,000,000 Call, 11/19/21, Strike $160.00 (1,120,000) 530 Paycom Software, Inc. 29,036,050 Call, 11/19/21, Strike $470.00 (4,242,650) 195 Twilio, Inc. 5,681,520 Put, 11/19/21, Strike $290.00 (203,775) 335 Zendesk, Inc. 3,410,300 Put, 12/17/21, Strike $100.00 (199,325) (5,765,750)
Other (-0.5%) SPDR S&P 500 ETF Trust 7,800 358,215,000 Put, 11/19/21, Strike $415.00 (448,500) 4,750 218,143,750 Put, 12/31/21, Strike $420.00 (1,752,750) 2,725 125,145,625 Put, 12/17/21, Strike $375.00 (211,187) 620 28,473,500 Call, 11/03/21, Strike $457.00 (234,670) 7,400 Technology Select Sector SPDR Fund 119,532,200 Put, 11/19/21, Strike $145.00 (166,500) (2,813,607)
TOTAL WRITTEN OPTIONS (Premium $7,085,511) $ (9,150,505)
See accompanying Notes to Schedule of Investments
110 CALAMOS OPEN-END FAMILY OF FUNDS ANNUAL REPORT
Phineus Long/Short Fund Schedule of Investments October 31, 2021
NOTES TO SCHEDULE OF INVESTMENTS# Non-income producing security.
~ Security, or portion of security, is segregated as collateral (or collateral forpotential future transactions) for written options and securities sold short.The aggregate value of such securities is $219,253,404.
^ Security, or portion of security, is on loan.
† Represents investment of cash collateral received from securities on loanas of October 31, 2021.
FOREIGN CURRENCY ABBREVIATIONSEUR European Monetary UnitGBP British Pound Sterling
Note: Value for securities denominated in foreign currencies is shown in U.S. dollars. Thedate on options represents the expiration date of the option contract. The option contractmay be exercised at any date on or before the date shown.
See accompanying Notes to Schedule of Investments
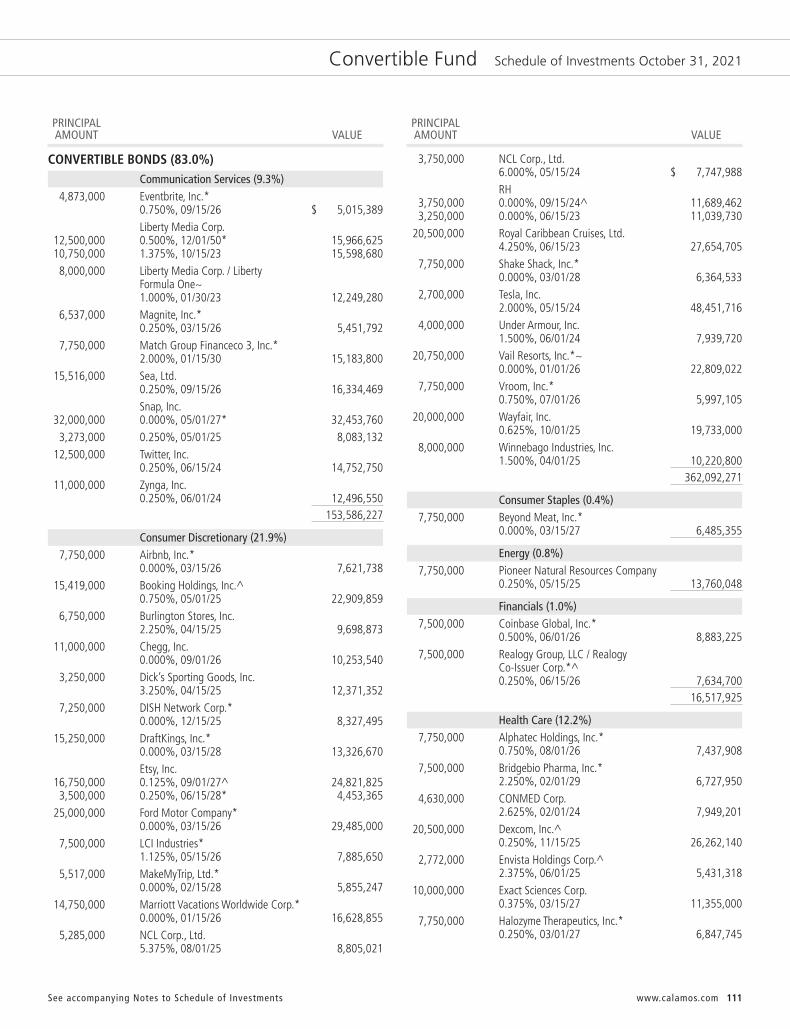
111www.calamos.com
Convertible Fund Schedule of Investments October 31, 2021
PRINCIPAL AMOUNT VALUE
PRINCIPAL AMOUNT VALUE
CONVERTIBLE BONDS (83.0%)Communication Services (9.3%)
4,873,000 Eventbrite, Inc.*0.750%, 09/15/26 $ 5,015,389
Liberty Media Corp. 12,500,000 0.500%, 12/01/50* 15,966,625 10,750,000 1.375%, 10/15/23 15,598,680 8,000,000 Liberty Media Corp. / Liberty Formula One~ 1.000%, 01/30/23 12,249,280 6,537,000 Magnite, Inc.* 0.250%, 03/15/26 5,451,792 7,750,000 Match Group Financeco 3, Inc.* 2.000%, 01/15/30 15,183,800 15,516,000 Sea, Ltd. 0.250%, 09/15/26 16,334,469 Snap, Inc. 32,000,000 0.000%, 05/01/27* 32,453,760 3,273,000 0.250%, 05/01/25 8,083,132 12,500,000 Twitter, Inc. 0.250%, 06/15/24 14,752,750 11,000,000 Zynga, Inc. 0.250%, 06/01/24 12,496,550 153,586,227
Consumer Discretionary (21.9%) 7,750,000 Airbnb, Inc.* 0.000%, 03/15/26 7,621,738 15,419,000 Booking Holdings, Inc.^ 0.750%, 05/01/25 22,909,859 6,750,000 Burlington Stores, Inc. 2.250%, 04/15/25 9,698,873 11,000,000 Chegg, Inc. 0.000%, 09/01/26 10,253,540 3,250,000 Dick’s Sporting Goods, Inc. 3.250%, 04/15/25 12,371,352 7,250,000 DISH Network Corp.* 0.000%, 12/15/25 8,327,495 15,250,000 DraftKings, Inc.* 0.000%, 03/15/28 13,326,670 Etsy, Inc. 16,750,000 0.125%, 09/01/27^ 24,821,825 3,500,000 0.250%, 06/15/28* 4,453,365 25,000,000 Ford Motor Company* 0.000%, 03/15/26 29,485,000 7,500,000 LCI Industries* 1.125%, 05/15/26 7,885,650 5,517,000 MakeMyTrip, Ltd.* 0.000%, 02/15/28 5,855,247 14,750,000 Marriott Vacations Worldwide Corp.* 0.000%, 01/15/26 16,628,855 5,285,000 NCL Corp., Ltd. 5.375%, 08/01/25 8,805,021
3,750,000 NCL Corp., Ltd.6.000%, 05/15/24 $ 7,747,988
RH 3,750,000 0.000%, 09/15/24^ 11,689,462 3,250,000 0.000%, 06/15/23 11,039,730 20,500,000 Royal Caribbean Cruises, Ltd. 4.250%, 06/15/23 27,654,705 7,750,000 Shake Shack, Inc.* 0.000%, 03/01/28 6,364,533 2,700,000 Tesla, Inc. 2.000%, 05/15/24 48,451,716 4,000,000 Under Armour, Inc. 1.500%, 06/01/24 7,939,720 20,750,000 Vail Resorts, Inc.*~ 0.000%, 01/01/26 22,809,022 7,750,000 Vroom, Inc.* 0.750%, 07/01/26 5,997,105 20,000,000 Wayfair, Inc. 0.625%, 10/01/25 19,733,000 8,000,000 Winnebago Industries, Inc. 1.500%, 04/01/25 10,220,800 362,092,271
Consumer Staples (0.4%) 7,750,000 Beyond Meat, Inc.* 0.000%, 03/15/27 6,485,355
Energy (0.8%) 7,750,000 Pioneer Natural Resources Company 0.250%, 05/15/25 13,760,048
Financials (1.0%) 7,500,000 Coinbase Global, Inc.* 0.500%, 06/01/26 8,883,225 7,500,000 Realogy Group, LLC / Realogy Co-Issuer Corp.*^ 0.250%, 06/15/26 7,634,700 16,517,925
Health Care (12.2%) 7,750,000 Alphatec Holdings, Inc.* 0.750%, 08/01/26 7,437,908 7,500,000 Bridgebio Pharma, Inc.* 2.250%, 02/01/29 6,727,950 4,630,000 CONMED Corp. 2.625%, 02/01/24 7,949,201 20,500,000 Dexcom, Inc.^ 0.250%, 11/15/25 26,262,140 2,772,000 Envista Holdings Corp.^ 2.375%, 06/01/25 5,431,318 10,000,000 Exact Sciences Corp. 0.375%, 03/15/27 11,355,000 7,750,000 Halozyme Therapeutics, Inc.* 0.250%, 03/01/27 6,847,745
See accompanying Notes to Schedule of Investments

112
Convertible Fund Schedule of Investments October 31, 2021
PRINCIPAL AMOUNT VALUE
PRINCIPAL AMOUNT VALUE
16,975,000 Insulet Corp.0.375%, 09/01/26 $ 25,175,113
13,500,000 Integra LifeSciences Holdings Corp. 0.500%, 08/15/25 14,703,660 10,000,000 Jazz Investments I, Ltd. 2.000%, 06/15/26 11,657,300 14,000,000 NeoGenomics, Inc.^ 0.250%, 01/15/28 14,140,560 5,600,000 NuVasive, Inc. 0.375%, 03/15/25 5,311,152 7,500,000 Oak Street Health, Inc.* 0.000%, 03/15/26 7,015,950 11,250,000 Omnicell, Inc. 0.250%, 09/15/25 21,021,075 10,000,000 Pacira BioSciences, Inc.^ 0.750%, 08/01/25 10,554,900 6,805,000 Repligen Corp. 0.375%, 07/15/24 17,297,289 2,000,000 Sarepta Therapeutics, Inc. 1.500%, 11/15/24 2,705,340 201,593,601
Industrials (5.8%) 4,500,000 Air Canada 4.000%, 07/01/25 6,375,150 7,000,000 Air Transport Services Group, Inc.~ 1.125%, 10/15/24 7,458,920 15,000,000 JetBlue Airways Corp.*^ 0.500%, 04/01/26 14,510,550 7,500,000 John Bean Technologies Corp.* 0.250%, 05/15/26 8,194,950 5,500,000 Middleby Corp. 1.000%, 09/01/25 8,285,585 13,250,000 Southwest Airlines Company~ 1.250%, 05/01/25 18,635,992 7,500,000 Sunrun, Inc.*^ 0.000%, 02/01/26 6,841,500 27,500,000 Uber Technologies, Inc.*^ 0.000%, 12/15/25 26,575,175 96,877,822
Information Technology (29.1%) 9,500,000 Akamai Technologies, Inc. 0.125%, 05/01/25 11,638,925 11,500,000 Bentley Systems, Inc.* 0.125%, 01/15/26 13,085,045 Bill.com Holdings, Inc.* 7,864,000 0.000%, 04/01/27^ 8,452,699 7,125,000 0.000%, 12/01/25 13,804,545 19,000,000 Coupa Software, Inc.^ 0.375%, 06/15/26 20,924,700 6,250,000 CyberArk Software, Ltd. 0.000%, 11/15/24 8,100,688
8,500,000 Datadog, Inc.0.125%, 06/15/25 $ 16,122,885
Enphase Energy, Inc.* 7,750,000 0.000%, 03/01/26 8,404,333 7,750,000 0.000%, 03/01/28 8,632,725 2,750,000 Everbridge, Inc. 0.125%, 12/15/24 4,188,718 11,000,000 Five9, Inc. 0.500%, 06/01/25 14,757,380 6,500,000 LivePerson, Inc.* 0.000%, 12/15/26 6,364,670 28,525,000 Microchip Technology, Inc.^ 0.125%, 11/15/24 31,961,977 7,500,000 MongoDB, Inc.^ 0.250%, 01/15/26 18,843,900 7,575,000 Nova, Ltd. 0.000%, 10/15/25 11,579,902 Okta, Inc. 8,000,000 0.125%, 09/01/25 11,626,560 4,750,000 0.375%, 06/15/26 5,952,795 15,000,000 ON Semiconductor Corp.*^ 0.000%, 05/01/27 18,196,650 Palo Alto Networks, Inc. 9,500,000 0.750%, 07/01/23~ 18,323,600 6,250,000 0.375%, 06/01/25 10,949,375 3,500,000 Q2 Holdings, Inc. 0.750%, 06/01/26 3,906,665 14,500,000 Repay Holdings Corp.* 0.000%, 02/01/26 13,460,785 25,250,000 RingCentral, Inc. 0.000%, 03/01/25 25,945,890 21,750,000 Shift4 Payments, Inc.* 0.000%, 12/15/25 23,584,830 8,898,000 Shopify, Inc.^ 0.125%, 11/01/25 11,272,253 10,750,000 Silicon Laboratories, Inc. 0.625%, 06/15/25 17,286,967 20,000,000 Splunk, Inc. 1.125%, 06/15/27 20,872,000 Square, Inc.*^ 16,000,000 0.250%, 11/01/27 19,570,400 12,500,000 0.000%, 05/01/26 14,764,875 7,500,000 Tyler Technologies, Inc.* 0.250%, 03/15/26 9,137,850 3,250,000 Viavi Solutions, Inc.^ 1.000%, 03/01/24 4,194,938 10,500,000 Wix.com, Ltd.^ 0.000%, 08/15/25 9,947,700 7,000,000 Workday, Inc. 0.250%, 10/01/22 13,848,240 12,250,000 Zendesk, Inc. 0.625%, 06/15/25 14,369,127
See accompanying Notes to Schedule of InvestmentsCALAMOS OPEN-END FAMILY OF FUNDS ANNUAL REPORT

113www.calamos.com
Convertible Fund Schedule of Investments October 31, 2021
PRINCIPAL AMOUNT VALUE
NUMBER OF SHARES VALUE
8,653,000 Zscaler, Inc.0.125%, 07/01/25 $ 18,694,114
482,768,706
Materials (1.1%) 7,500,000 Ivanhoe Mines, Ltd.* 2.500%, 04/15/26 9,763,725 8,241,000 MP Materials Corp.* 0.250%, 04/01/26 8,709,254 18,472,979
Real Estate (1.4%) 6,000,000 IH Merger Sub, LLC 3.500%, 01/15/22 10,899,000 12,000,000 Redfin Corp. 0.000%, 10/15/25 12,242,160 23,141,160
TOTAL CONVERTIBLE BONDS (Cost $1,096,619,946) 1,375,296,094
NUMBER OF SHARES VALUE
CONVERTIBLE PREFERRED STOCKS (12.1%)Communication Services (0.6%)
9,250 2020 Cash Mandatory Exchangeable Trust* 5.250%, 06/01/23 9,700,040
Consumer Discretionary (1.1%) 92,520 Aptiv, PLC 5.500%, 06/15/23 17,874,864
Financials (1.5%) 10,300 Bank of America Corp.~‡‡ 7.250% 14,751,866 107,870 KKR & Company, Inc.^ 6.000%, 09/15/23 10,791,315 25,543,181
Health Care (3.6%) 157,130 Avantor, Inc. 6.250%, 05/15/22 19,449,552 115,360 Boston Scientific Corp. 5.500%, 06/01/23 13,501,734 12,375 Danaher Corp.^ 4.750%, 04/15/22 25,804,969 58,756,255
Industrials (0.8%) 129,110 Stanley Black & Decker, Inc.^ 5.250%, 11/15/22 13,933,551
Information Technology (1.7%) 16,605 Broadcom, Inc. 8.000%, 09/30/22 27,852,231
Utilities (2.8%) 74,990 AES Corp.^
6.875%, 02/15/24 $ 7,574,740 152,490 Dominion Energy, Inc. 7.250%, 06/01/22 15,274,923 NextEra Energy, Inc. 174,515 6.219%, 09/01/23 9,563,422 149,730 4.872%, 09/01/22 9,465,931 86,590 5.279%, 03/01/23 4,716,557 46,595,573
TOTAL CONVERTIBLE PREFERRED STOCKS(Cost $152,754,617) 200,255,695
NUMBER OFCONTRACTS/ NOTIONAL AMOUNT VALUE
PURCHASED OPTIONS (0.1%)#Consumer Discretionary (0.0%)
Tesla, Inc. 400 44,560,000 Put, 11/05/21, Strike $850.00 137,000 250 27,850,000 Put, 11/05/21, Strike $1,000.00 273,750 410,750
Health Care (0.1%) 450 Repligen Corp. 13,072,500 Put, 12/17/21, Strike $300.00 940,500
TOTAL PURCHASED OPTIONS(Cost $2,544,524) 1,351,250
NUMBER OF SHARES/ PRINCIPAL AMOUNT VALUE
INVESTMENT OF CASH COLLATERAL FOR SECURITIES LOANED (11.4%)
100,822,833 JPMorgan Prime Money Market Fund - Capital Class, 0.070%***† 100,822,833 87,669,947 State Street Navigator Securities Lending Government Money Market Portfolio† 87,669,947
TOTAL INVESTMENT OF CASH COLLATERAL FOR SECURITIES LOANED(Cost $188,492,780) 188,492,780
TOTAL INVESTMENTS (106.6%)(Cost $1,440,411,867) 1,765,395,819
PAYABLE UPON RETURN OF SECURITIES ON LOAN (-11.4%) (188,492,780)
OTHER ASSETS, LESS LIABILITIES (4.8%) 78,527,577
NET ASSETS (100.0%) $1,655,430,616
See accompanying Notes to Schedule of Investments

114
Convertible Fund Schedule of Investments October 31, 2021
FORWARD FOREIGN CURRENCY CONTRACTS
SHORT SETTLEMENT LOCAL CURRENT UNREALIZEDCOUNTERPARTY CONTRACTS DATE CURRENCY VALUE GAIN/LOSS
Bank of New York Canadian Dollar 01/27/22 15,136,000 $12,231,496 $59,736$59,736
NOTES TO SCHEDULE OF INVESTMENTS* Securities issued and sold pursuant to a Rule 144A transaction are
exempted from the registration requirement of the Securities Act of 1933,as amended. These securities may only be sold to qualified institutionalbuyers (“QIBs”), such as the Fund. Any resale of these securities mustgenerally be effected through a sale that is registered under the Act orotherwise exempted from such registration requirements.
~ Security, or portion of security, is segregated as collateral (or collateral forpotential future transactions) for written options. The aggregate value ofsuch securities is $44,795,946.
^ Security, or portion of security, is on loan.
‡‡ Perpetual maturity.
# Non-income producing security.
*** The rate disclosed is the 7 day net yield as of October 31, 2021.
† Represents investment of cash collateral received from securities on loanas of October 31, 2021.
Note: The date on options represents the expiration date of the option contract. The optioncontract may be exercised at any date on or before the date shown.
See accompanying Notes to Schedule of InvestmentsCALAMOS OPEN-END FAMILY OF FUNDS ANNUAL REPORT
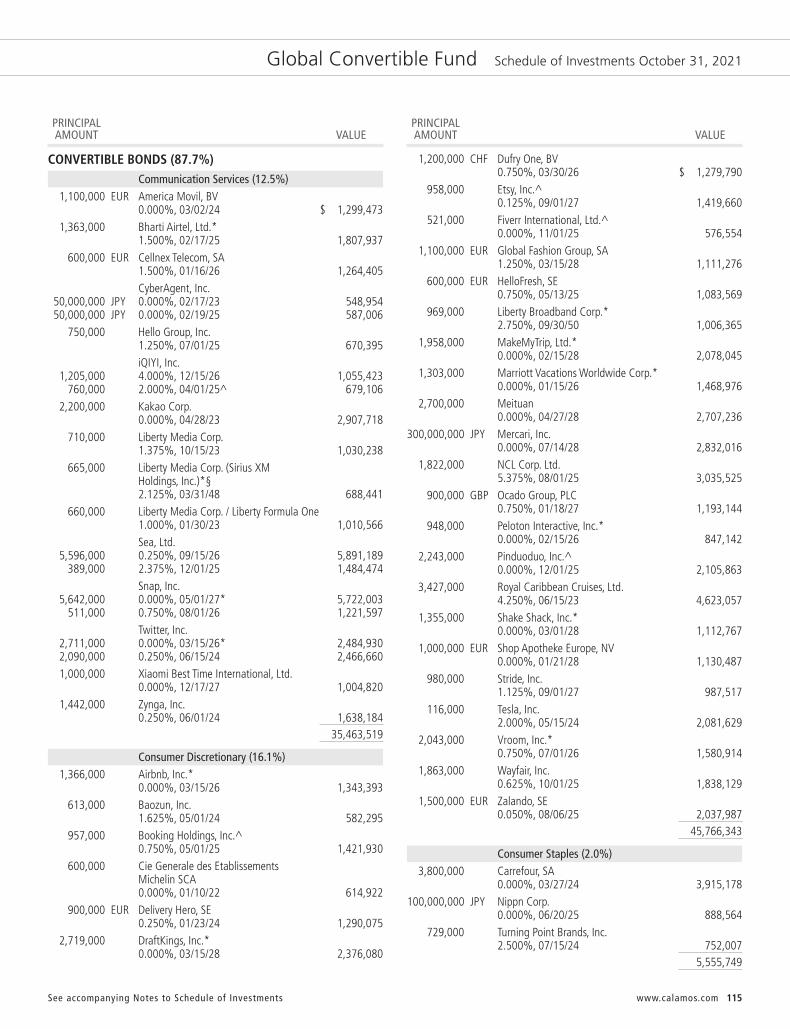
115www.calamos.com
Global Convertible Fund Schedule of Investments October 31, 2021
See accompanying Notes to Schedule of Investments
PRINCIPAL AMOUNT VALUE
PRINCIPAL AMOUNT VALUE
CONVERTIBLE BONDS (87.7%)Communication Services (12.5%)
1,100,000 EUR America Movil, BV 0.000%, 03/02/24 $ 1,299,473 1,363,000 Bharti Airtel, Ltd.* 1.500%, 02/17/25 1,807,937 600,000 EUR Cellnex Telecom, SA 1.500%, 01/16/26 1,264,405 CyberAgent, Inc. 50,000,000 JPY 0.000%, 02/17/23 548,954 50,000,000 JPY 0.000%, 02/19/25 587,006 750,000 Hello Group, Inc. 1.250%, 07/01/25 670,395 iQIYI, Inc. 1,205,000 4.000%, 12/15/26 1,055,423 760,000 2.000%, 04/01/25^ 679,106 2,200,000 Kakao Corp. 0.000%, 04/28/23 2,907,718 710,000 Liberty Media Corp. 1.375%, 10/15/23 1,030,238 665,000 Liberty Media Corp. (Sirius XM Holdings, Inc.)*§ 2.125%, 03/31/48 688,441 660,000 Liberty Media Corp. / Liberty Formula One 1.000%, 01/30/23 1,010,566 Sea, Ltd. 5,596,000 0.250%, 09/15/26 5,891,189 389,000 2.375%, 12/01/25 1,484,474 Snap, Inc. 5,642,000 0.000%, 05/01/27* 5,722,003 511,000 0.750%, 08/01/26 1,221,597 Twitter, Inc. 2,711,000 0.000%, 03/15/26* 2,484,930 2,090,000 0.250%, 06/15/24 2,466,660 1,000,000 Xiaomi Best Time International, Ltd. 0.000%, 12/17/27 1,004,820 1,442,000 Zynga, Inc. 0.250%, 06/01/24 1,638,184
35,463,519
Consumer Discretionary (16.1%) 1,366,000 Airbnb, Inc.* 0.000%, 03/15/26 1,343,393 613,000 Baozun, Inc. 1.625%, 05/01/24 582,295 957,000 Booking Holdings, Inc.^ 0.750%, 05/01/25 1,421,930 600,000 Cie Generale des Etablissements Michelin SCA 0.000%, 01/10/22 614,922 900,000 EUR Delivery Hero, SE 0.250%, 01/23/24 1,290,075 2,719,000 DraftKings, Inc.* 0.000%, 03/15/28 2,376,080
1,200,000 CHF Dufry One, BV 0.750%, 03/30/26 $ 1,279,790 958,000 Etsy, Inc.^ 0.125%, 09/01/27 1,419,660 521,000 Fiverr International, Ltd.^ 0.000%, 11/01/25 576,554 1,100,000 EUR Global Fashion Group, SA 1.250%, 03/15/28 1,111,276 600,000 EUR HelloFresh, SE 0.750%, 05/13/25 1,083,569 969,000 Liberty Broadband Corp.* 2.750%, 09/30/50 1,006,365 1,958,000 MakeMyTrip, Ltd.* 0.000%, 02/15/28 2,078,045 1,303,000 Marriott Vacations Worldwide Corp.* 0.000%, 01/15/26 1,468,976 2,700,000 Meituan 0.000%, 04/27/28 2,707,236300,000,000 JPY Mercari, Inc. 0.000%, 07/14/28 2,832,016 1,822,000 NCL Corp. Ltd. 5.375%, 08/01/25 3,035,525 900,000 GBP Ocado Group, PLC 0.750%, 01/18/27 1,193,144 948,000 Peloton Interactive, Inc.* 0.000%, 02/15/26 847,142 2,243,000 Pinduoduo, Inc.^ 0.000%, 12/01/25 2,105,863 3,427,000 Royal Caribbean Cruises, Ltd. 4.250%, 06/15/23 4,623,057 1,355,000 Shake Shack, Inc.* 0.000%, 03/01/28 1,112,767 1,000,000 EUR Shop Apotheke Europe, NV 0.000%, 01/21/28 1,130,487 980,000 Stride, Inc. 1.125%, 09/01/27 987,517 116,000 Tesla, Inc. 2.000%, 05/15/24 2,081,629 2,043,000 Vroom, Inc.* 0.750%, 07/01/26 1,580,914 1,863,000 Wayfair, Inc. 0.625%, 10/01/25 1,838,129 1,500,000 EUR Zalando, SE 0.050%, 08/06/25 2,037,987
45,766,343
Consumer Staples (2.0%) 3,800,000 Carrefour, SA 0.000%, 03/27/24 3,915,178100,000,000 JPY Nippn Corp. 0.000%, 06/20/25 888,564 729,000 Turning Point Brands, Inc. 2.500%, 07/15/24 752,007 5,555,749

116 CALAMOS OPEN-END FAMILY OF FUNDS ANNUAL REPORT
Global Convertible Fund Schedule of Investments October 31, 2021
PRINCIPAL AMOUNT VALUE
PRINCIPAL AMOUNT VALUE
Energy (2.1%) 2,141,000 Pioneer Natural Resources Company 0.250%, 05/15/25 $ 3,801,324 2,000,000 TotalEnergies, SE 0.500%, 12/02/22 2,052,400 5,853,724
Financials (5.1%) 1,312,000 Coinbase Global, Inc.* 0.500%, 06/01/26 1,553,972 2,700,000 EUR Corestate Capital Holding, SA 1.375%, 11/28/22 2,750,932 1,000,000 GBP Cornwall Jersey, Ltd. 0.750%, 04/16/26 1,205,844 1,670,000 GSK Finance No 3, PLC* 0.000%, 06/22/23 1,641,526 2,300,000 JPMorgan Chase Bank NA 0.000%, 08/07/22 2,688,608 900,000 EUR LEG Immobilien, SE 0.875%, 09/01/25 1,296,526 1,700,000 EUR Oliver Capital Sarl 0.000%, 12/29/23 2,277,942130,000,000 JPY SBI Holdings, Inc. 0.000%, 09/13/23 1,205,341
14,620,691
Health Care (8.8%) 1,312,000 Bridgebio Pharma, Inc.* 2.250%, 02/01/29 1,176,943 650,000 Coherus Biosciences, Inc. 1.500%, 04/15/26 739,044 1,140,000 Dexcom, Inc.^ 0.250%, 11/15/25 1,460,431 1,100,000 EUR GN Store Nord AS 0.000%, 05/21/24 1,372,946 1,372,000 Haemonetics Corp.* 0.000%, 03/01/26 1,204,643 1,372,000 Halozyme Therapeutics, Inc.* 0.250%, 03/01/27 1,212,272 702,000 Innoviva, Inc. 2.500%, 08/15/25 864,295 970,000 Insulet Corp. 0.375%, 09/01/26 1,438,578 1,088,000 Integra LifeSciences Holdings Corp. 0.500%, 08/15/25 1,185,006 1,295,000 Jazz Investments I, Ltd. 2.000%, 06/15/26 1,509,620240,000,000 JPY Menicon Company, Ltd. 0.000%, 01/29/25 2,612,573 1,241,000 NeoGenomics, Inc. 0.250%, 01/15/28 1,253,460 926,000 Novocure, Ltd.* 0.000%, 11/01/25 947,891 710,000 NuVasive, Inc.^ 0.375%, 03/15/25 673,378
2,561,000 Oak Street Health, Inc.* 0.000%, 03/15/26 $ 2,395,713 950,000 Omnicell, Inc. 0.250%, 09/15/25 1,775,113 Pacira BioSciences, Inc. 1,045,000 0.750%, 08/01/25 1,102,987 113,000 2.375%, 04/01/22 116,809130,000,000 JPY Ship Healthcare Holdings, Inc. 0.000%, 12/13/23 1,369,052 630,000 Tabula Rasa HealthCare, Inc. 1.750%, 02/15/26 527,896
24,938,650
Industrials (5.1%) 1,676,000 Air Canada 4.000%, 07/01/25 2,374,389 900,000 EUR Duerr, AG 0.750%, 01/15/26 1,369,895 1,331,000 John Bean Technologies Corp.* 0.250%, 05/15/26 1,454,330 952,000 Middleby Corp. 1.000%, 09/01/25 1,434,159 1,173,000 Southwest Airlines Company 1.250%, 05/01/25 1,649,813 2,624,000 Sunrun, Inc.*^ 0.000%, 02/01/26 2,393,613 2,378,000 Uber Technologies, Inc.*^ 0.000%, 12/15/25 2,298,028 1,400,000 Vinci, SA^ 0.375%, 02/16/22 1,561,504
14,535,731
Information Technology (29.3%) 2,800,000 AUD Afterpay, Ltd. 0.000%, 03/12/26 2,113,399 1,310,000 Akamai Technologies, Inc. 0.125%, 05/01/25 1,604,947 Alteryx, Inc. 664,000 0.500%, 08/01/24 630,116 655,000 1.000%, 08/01/26 613,945 Bill.com Holdings, Inc.* 1,391,000 0.000%, 04/01/27^ 1,495,130 625,000 0.000%, 12/01/25 1,210,925 2,690,000 Coupa Software, Inc. 0.375%, 06/15/26 2,962,497 1,573,000 CyberArk Software, Ltd. 0.000%, 11/15/24 2,038,781 746,000 Datadog, Inc. 0.125%, 06/15/25 1,415,020 1,374,000 Dropbox, Inc.* 0.000%, 03/01/28 1,507,635 3,348,000 CAD Dye & Durham, Ltd.* 3.750%, 03/01/26 2,664,657 1,372,000 Enphase Energy, Inc.* 0.000%, 03/01/28 1,528,271
See accompanying Notes to Schedule of Investments

117www.calamos.com
Global Convertible Fund Schedule of Investments October 31, 2021
See accompanying Notes to Schedule of Investments
PRINCIPAL AMOUNT VALUE
PRINCIPAL AMOUNT VALUE
2,744,000 Fastly, Inc.* 0.000%, 03/15/26 $ 2,452,285 1,126,000 Five9, Inc. 0.500%, 06/01/25 1,510,619 1,200,000 Globalwafers Company, Ltd. 0.000%, 06/01/26 1,246,680 9,000,000 HKD Kingsoft Corp, Ltd. 0.625%, 04/29/25 1,373,881 1,163,000 LivePerson, Inc.* 0.000%, 12/15/26 1,138,786 1,761,000 Lumentum Holdings, Inc. 0.500%, 12/15/26 1,919,930 330,000 Mandiant, Inc. 1.625%, 06/01/35 327,990 2,967,000 Microchip Technology, Inc.^ 0.125%, 11/15/24 3,324,494 2,764,000 MicroStrategy, Inc.* 0.000%, 02/15/27 2,288,426 1,362,000 New Relic, Inc. 0.500%, 05/01/23 1,427,567 Nexi S.p.A 2,300,000 EUR 0.000%, 02/24/28 2,514,773 1,400,000 EUR 1.750%, 04/24/27 1,823,985 969,000 Nice, Ltd.^ 0.000%, 09/15/25 1,138,497 1,325,000 Okta, Inc. 0.125%, 09/01/25 1,925,649 2,756,000 ON Semiconductor Corp.*^ 0.000%, 05/01/27 3,343,331 Palo Alto Networks, Inc. 770,000 0.375%, 06/01/25 1,348,963 650,000 0.750%, 07/01/23 1,253,720 729,000 Pegasystems, Inc. 0.750%, 03/01/25 796,090 1,930,000 Repay Holdings Corp.* 0.000%, 02/01/26 1,791,677 1,960,000 RingCentral, Inc. 0.000%, 03/15/26 1,912,294130,000,000 JPY SCREEN Holdings Company, Ltd. 0.000%, 06/11/25 1,291,674 929,000 Shift4 Payments, Inc.* 0.000%, 12/15/25 1,007,370 417,000 Shopify, Inc. 0.125%, 11/01/25 528,268 742,000 Silicon Laboratories, Inc. 0.625%, 06/15/25 1,193,203 983,200 EUR SOITEC 0.000%, 10/01/25 2,907,312 1,430,000 Splunk, Inc.^ 1.125%, 09/15/25 1,868,352 2,190,000 Square, Inc.*^ 0.250%, 11/01/27 2,678,699
1,346,000 Tyler Technologies, Inc.* 0.250%, 03/15/26 $ 1,639,939 1,307,000 Vnet Group, Inc.* 0.000%, 02/01/26 1,083,294 1,200,000 Win Semiconductors Corp. 0.000%, 01/14/26 1,230,612 1,862,000 Wix.com, Ltd.^ 0.000%, 08/15/25 1,764,059 1,870,000 Workday, Inc. 0.250%, 10/01/22 3,699,458 1,146,000 Workiva, Inc. 1.125%, 08/15/26 2,268,175 1,735,000 Xero Investments, Ltd. 0.000%, 12/02/25 1,785,159 1,649,000 Zendesk, Inc. 0.625%, 06/15/25 1,934,261 790,000 Zscaler, Inc. 0.125%, 07/01/25 1,706,732
83,231,527
Materials (2.8%) 4,000,000 BASF, SE 0.925%, 03/09/23 4,014,440 50,000,000 JPY Mitsubishi Chemical Holdings Corp. 0.000%, 03/29/24 462,861 2,400,000 EUR POSCO 0.000%, 09/01/26 2,811,188 60,000,000 JPY Teijin, Ltd. 0.000%, 12/10/21 526,210 7,814,699
Real Estate (3.9%) 700,000 EUR ANLLIAN Capital, Ltd. 0.000%, 02/05/25 1,033,737 1,990,000 ESR Cayman, Ltd. 1.500%, 09/30/25 2,055,789 1,900,000 EUR Grand City Properties, SA 0.250%, 03/02/22 2,240,855 525,000 IH Merger Sub, LLC 3.500%, 01/15/22 953,662 2,135,000 Redfin Corp. 0.000%, 10/15/25 2,178,084140,000,000 JPY Relo Group, Inc. 0.000%, 12/17/27 1,253,177 1,400,000 Vingroup, JSC 3.000%, 04/20/26 1,493,954
11,209,258TOTAL CONVERTIBLE BONDS(Cost $224,313,233) 248,989,891

118 CALAMOS OPEN-END FAMILY OF FUNDS ANNUAL REPORT
Global Convertible Fund Schedule of Investments October 31, 2021
NUMBER OF SHARES VALUE
CONVERTIBLE PREFERRED STOCKS (8.5%)Communication Services (0.3%)
845 2020 Cash Mandatory Exchangeable Trust* 5.250%, 06/01/23 $ 886,112
Financials (3.2%) 2,487 Bank of America Corp.‡‡ 7.250% 3,561,931 18,628 KKR & Company, Inc.^ 6.000%, 09/15/23 1,863,545 2,530 Wells Fargo & Company‡‡ 7.500% 3,845,524 9,271,000
Health Care (1.2%) 13,930 Avantor, Inc. 6.250%, 05/15/22 1,724,256 772 Danaher Corp. 4.750%, 04/15/22 1,609,813 3,334,069
Information Technology (1.2%) 1,995 Broadcom, Inc. 8.000%, 09/30/22 3,346,293
Utilities (2.6%) 13,463 AES Corp.^ 6.875%, 02/15/24 1,359,898 12,955 American Electric Power Company, Inc. 6.125%, 03/15/22 644,252 39,250 DTE Energy Company 6.250%, 11/01/22 1,981,340 28,565 Essential Utilities, Inc. 6.000%, 04/30/22 1,649,914 31,000 NextEra Energy, Inc. 6.219%, 09/01/23 1,698,800 7,334,204
TOTAL CONVERTIBLE PREFERRED STOCKS(Cost $19,012,388) 24,171,678
PRINCIPAL AMOUNT VALUE
U.S. GOVERNMENT AND AGENCY SECURITY (0.8%)
2,297,000 United States Treasury Note1.750%, 07/15/22(Cost $2,323,089) 2,323,694
See accompanying Notes to Schedule of Investments
NUMBER OFCONTRACTS/ NOTIONAL AMOUNT VALUE
PURCHASED OPTIONS (0.3%)#Consumer Discretionary (0.0%)
Alibaba Group Holding, Ltd. 167 2,754,498 Call, 11/19/21, Strike $250.00 $ 752 81 1,336,014 Call, 11/19/21, Strike $220.00 1,498
Industrials (0.3%) 348 EUR Schneider Electric, SE 5,190,441 Call, 12/17/21, Strike 130.00 795,927
TOTAL PURCHASED OPTIONS(Cost $910,290) 798,177
NUMBER OF SHARES/ PRINCIPAL AMOUNT VALUE
INVESTMENT OF CASH COLLATERAL FOR SECURITIES LOANED (10.0%)
28,485,735 State Street Navigator Securities Lending Government Money Market Portfolio†(Cost $28,485,735) 28,485,735
TOTAL INVESTMENTS (107.3%)(Cost $275,044,735) 304,769,175
PAYABLE UPON RETURN OF SECURITIES ON LOAN (-10.0%) (28,485,735)
OTHER ASSETS, LESS LIABILITIES (2.7%) 7,718,226
NET ASSETS (100.0%) $284,001,666
NOTES TO SCHEDULE OF INVESTMENTS* Securities issued and sold pursuant to a Rule 144A transaction are
exempted from the registration requirement of the Securities Act of 1933,as amended. These securities may only be sold to qualified institutionalbuyers (“QIBs”), such as the Fund. Any resale of these securities mustgenerally be effected through a sale that is registered under the Act orotherwise exempted from such registration requirements.
^ Security, or portion of security, is on loan.
§ Securities exchangeable or convertible into securities of one or moreentities that are different than the issuer. Each entity is identified in theparenthetical.
# Non-income producing security.
‡‡ Perpetual maturity.
† Represents investment of cash collateral received from securities on loanas of October 31, 2021.

119www.calamos.com
Global Convertible Fund Schedule of Investments October 31, 2021
See accompanying Notes to Schedule of Investments
FOREIGN CURRENCY ABBREVIATIONSAUD Australian DollarCAD Canadian DollarCHF Swiss FrancEUR European Monetary UnitGBP British Pound SterlingHKD Hong Kong DollarJPY Japanese Yen
Note: Value for securities denominated in foreign currencies is shown in U.S. dollars. Theprincipal amount for such securities is shown in the respective foreign currency. The date onoptions represents the expiration date of the option contract. The option contract may beexercised at any date on or before the date shown.
CURRENCY EXPOSURE OCTOBER 31, 2021 % OF TOTAL VALUE INVESTMENTS
US Dollar $248,947,742 81.7%
European Monetary Unit 32,413,290 10.6%
Japanese Yen 13,577,428 4.5%
Canadian Dollar 2,664,657 0.9%
British Pound Sterling 2,398,988 0.8%
Australian Dollar 2,113,399 0.7%
Hong Kong Dollar 1,373,881 0.4%
Swiss Franc 1,279,790 0.4%
Total Investments $304,769,175 100.0%
Currency exposure may vary over time.

120 CALAMOS OPEN-END FAMILY OF FUNDS ANNUAL REPORT
Timpani Small Cap Growth Fund Schedule of Investments October 31, 2021
NUMBER OF SHARES VALUE
NUMBER OF SHARES VALUE
COMMON STOCKS (97.6%)Communication Services (2.6%)
83,934 Integral Ad Science Holding Corp.# $ 2,062,258 35,789 Magnite, Inc.# 967,377 58,459 Tremor International, Ltd.# 1,107,798 269,922 ZipRecruiter, Inc. - Class A# 7,498,433 11,635,866
Consumer Discretionary (18.1%) 66,450 Boot Barn Holdings, Inc.# 6,943,361 66,090 Century Communities, Inc. 4,431,995 14,545 Citi Trends, Inc.# 1,125,201 21,454 Crocs, Inc.# 3,463,748 12,605 Deckers Outdoor Corp.# 4,982,883 193,897 Everi Holdings, Inc.# 4,653,528 65,130 Figs, Inc.# 2,189,019 302,193 Full House Resorts, Inc.# 3,006,820 24,601 Lithia Motors, Inc. - Class A 7,853,131 96,974 Lovesac Company# 7,564,942 87,989 ONE Group Hospitality, Inc.# 1,163,215 79,540 OneWater Marine, Inc. - Class A 3,526,804 283,711 Porch Group, Inc.# 5,966,442 6,848 Portillo’s Inc - Class A# 260,224 56,330 RumbleON, Inc.# 2,197,433 33,089 Skyline Champion Corp.# 2,095,195 67,268 Steven Madden, Ltd. 3,033,787 50,633 TopBuild Corp.# 13,011,162 51,572 YETI Holdings, Inc.# 5,071,075 82,539,965
Consumer Staples (4.2%) 218,410 Beauty Health Company# 5,999,723 135,719 Celsius Holdings, Inc.# 13,099,598 19,099,321
Energy (6.8%) 149,544 Aspen Aerogels, Inc.# 8,144,166 72,723 Cactus, Inc. 3,163,451 133,240 California Resources Corp.# 6,146,361 151,295 ChampionX Corp.# 3,968,468 81,661 Denbury, Inc.# 6,913,420 95,418 SilverBow Resources, Inc.# 2,633,537 30,969,403
Financials (5.2%) 225,410 BRP Group, Inc. - Class A# 8,227,465 51,451 Focus Financial Partners, Inc. - Class A# 3,234,210 65,187 LPL Financial Holdings, Inc. 10,691,971 10,545 Silvergate Capital Corp - Class A# 1,651,558 23,805,204
Health Care (20.9%) 200,442 Apyx Medical Corp.# $ 2,866,321 131,901 Axonics, Inc.# 9,674,938 54,269 BioLife Solutions, Inc.# 2,884,397 80,901 Castle Biosciences, Inc.# 5,044,177 126,053 Codexis, Inc.# 4,382,863 17,090 CryoPort, Inc.# 1,393,519 61,991 Cutera, Inc.# 2,665,613 74,995 Establishment Labs Holdings, Inc.# 6,115,092 177,080 Inotiv, Inc.# 8,568,901 37,452 Inspire Medical Systems, Inc.# 10,096,310 60,155 iRadimed Corp.# 2,244,985 69,181 Itamar Medical, Ltd.# 2,110,020 24,558 Natera, Inc.# 2,813,610 84,964 OptimizeRx Corp.# 8,216,019 186,231 Oramed Pharmaceuticals, Inc.# 4,359,668 58,087 Paragon 28, Inc.# 1,222,150 40,755 Phreesia, Inc.# 2,874,858 47,179 RadNet, Inc.# 1,466,795 27,483 Shockwave Medical, Inc.# 5,873,117 25,590 Staar Surgical Company# 3,031,391 40,454 Veracyte, Inc.# 1,936,938 37,712 Vericel Corp.# 1,735,506 461,092 ViewRay, Inc.# 3,370,583 94,947,771
Industrials (14.0%) 27,397 Advanced Drainage Systems, Inc. 3,090,382 140,227 Agrify Corp.# 2,243,632 14,120 ArcBest Corp. 1,268,682 73,874 Driven Brands Holdings, Inc.# 2,398,689 456 Fluence Energy, Inc.# 16,220 17,272 Generac Holdings, Inc.# 8,611,128 183,534 Montrose Environmental Group, Inc.# 12,581,256 13,999 RBC Bearings, Inc.# 3,274,786 27,483 Saia, Inc.# 8,592,285 93,691 Shyft Group, Inc. 3,861,006 228,985 Tecnoglass, Inc. 6,613,087 36,331 Tetra Tech, Inc. 6,381,904 24,251 Trex Company, Inc.# 2,580,306 13,986 Upwork, Inc.# 659,020 8,878 Vicor Corp.# 1,345,816 63,518,199
Information Technology (22.1%) 50,845 ACM Research, Inc. - Class A# 5,398,214 75,662 Asana, Inc. - Class A# 10,274,900 59,451 Brooks Automation, Inc. 6,923,069 36,790 CS Disco, Inc.# 2,109,907
See accompanying Notes to Schedule of Investments

121www.calamos.com
Timpani Small Cap Growth Fund Schedule of Investments October 31, 2021
See accompanying Notes to Schedule of Investments
NUMBER OF SHARES VALUE
NUMBER OF SHARES VALUE
35,331 CyberArk Software, Ltd.# $ 6,363,466 30,483 Diodes, Inc.# 2,929,111 26,756 ExlService Holdings, Inc.# 3,281,088 187,655 Harmonic, Inc.# 1,702,031 45,633 Lattice Semiconductor Corp.# 3,168,756 57,390 Rapid7, Inc.# 7,388,963 4,763 RingCentral, Inc. - Class A# 1,161,124 44,937 SimilarWeb, Ltd.# 864,588 63,390 SiTime Corp.# 16,791,377 81,722 Sprout Social, Inc. - Class A# 10,434,265 127,265 Stratasys, Ltd.# 4,013,938 49,603 Stronghold Digital Mining, Inc.# 1,362,098 73,329 Tenable Holdings, Inc.# 3,904,769 176,868 Varonis Systems, Inc.# 11,450,434 41,543 Zuora, Inc.# 908,130 100,430,228
Materials (2.9%) 263,620 Ranpak Holdings Corp.# $ 9,084,345 114,690 Summit Materials, Inc. - Class A# 4,088,699 13,173,044
Real Estate (0.8%) 69,753 eXp World Holdings, Inc. 3,599,255
TOTAL COMMON STOCKS(Cost $308,191,792) 443,718,256
TOTAL INVESTMENTS (97.6%)(Cost $308,191,792) 443,718,256
OTHER ASSETS, LESS LIABILITIES (2.4%) 10,989,511
NET ASSETS (100.0%) $454,707,767
NOTES TO SCHEDULE OF INVESTMENTS# Non-income producing security.

122 CALAMOS OPEN-END FAMILY OF FUNDS ANNUAL REPORT
Timpani SMID Growth Fund Schedule of Investments October 31, 2021
NUMBER OF SHARES VALUE
NUMBER OF SHARES VALUE
COMMON STOCKS (99.9%)Communication Services (2.2%)
3,481 Integral Ad Science Holding Corp.# $ 85,528 1,732 Magnite, Inc.# 46,816 2,787 Tremor International, Ltd.# 52,814 13,980 ZipRecruiter, Inc. - Class A# 388,364 573,522
Consumer Discretionary (16.2%) 2,824 Boot Barn Holdings, Inc.# 295,080 1,582 Century Communities, Inc. 106,089 821 Crocs, Inc.# 132,550 1,076 Deckers Outdoor Corp.# 425,354 1,667 DraftKings, Inc. - Class A# 77,666 865 Etsy, Inc.# 216,847 7,131 Everi Holdings, Inc.# 171,144 2,058 Floor & Decor Holdings, Inc. - Class A# 279,723 1,798 Lithia Motors, Inc. - Class A 573,958 3,713 Lovesac Company# 289,651 222 Pool Corp. 114,366 13,815 Porch Group, Inc.# 290,529 404 Portillo’s, Inc. - Class A# 15,352 948 Skyline Champion Corp.# 60,027 3,417 Steven Madden, Ltd. 154,107 3,222 TopBuild Corp.# 827,957 2,640 YETI Holdings, Inc.# 259,591 4,289,991
Consumer Staples (3.5%) 10,683 Beauty Health Company# 293,462 6,505 Celsius Holdings, Inc.# 627,862 921,324
Energy (5.2%) 7,127 Aspen Aerogels, Inc.# 388,136 3,383 Cactus, Inc. - Class A 147,161 6,894 California Resources Corp.# 318,020 7,518 ChampionX Corp.# 197,197 3,988 Denbury, Inc.# 337,624 1,388,138
Financials (6.3%) 5,963 Brown & Brown, Inc. 376,325 11,688 BRP Group, Inc. - Class A# 426,612 2,367 Focus Financial Partners, Inc. - Class A# 148,789 4,336 LPL Financial Holdings, Inc. 711,191 1,662,917
Health Care (16.8%) 6,199 Axonics, Inc.# $ 454,697 1,807 BioLife Solutions, Inc.# 96,042 4,215 Castle Biosciences, Inc.# 262,805 6,265 Codexis, Inc.# 217,834 677 CryoPort, Inc.# 55,203 1,863 Cutera, Inc.# 80,109 2,478 Establishment Labs Holdings, Inc.# 202,056 6,256 Horizon Therapeutics, PLC# 750,157 6,043 Inotiv, Inc.# 292,421 1,910 Inspire Medical Systems, Inc.# 514,898 1,815 Natera, Inc.# 207,945 3,776 OptimizeRx Corp.# 365,139 3,413 Paragon 28, Inc.# 71,810 1,221 Repligen Corp.# 354,700 1,201 Shockwave Medical, Inc.# 256,654 761 Staar Surgical Company# 90,148 1,675 Vericel Corp.# 77,083 13,598 ViewRay, Inc.# 99,401 4,449,102
Industrials (17.7%) 1,646 Advanced Drainage Systems, Inc. 185,669 3,407 Axon Enterprise, Inc.# 613,124 2,523 Driven Brands Holdings, Inc.# 81,922 27 Fluence Energy, Inc.# 960 1,694 Generac Holdings, Inc.# 844,561 3,484 GXO Logistics, Inc.# 309,379 9,718 Montrose Environmental Group, Inc.# 666,169 848 Old Dominion Freight Line, Inc. 289,465 635 RBC Bearings, Inc.# 148,545 1,450 Saia, Inc.# 453,328 3,770 Shyft Group, Inc. 155,362 10,724 Tecnoglass, Inc. 309,709 1,836 Tetra Tech, Inc. 322,512 2,113 Trex Company, Inc.# 224,823 438 Vicor Corp.# 66,396 4,671,924
Information Technology (29.9%) 3,988 Asana, Inc. - Class A# 541,570 969 Bill.com Holdings, Inc.# 285,186 4,161 Brooks Automation, Inc. 484,548 2,998 Cloudflare, Inc. - Class A# 583,771 1,815 CyberArk Software, Ltd.# 326,900 1,221 Diodes, Inc.# 117,326 8,347 Dynatrace, Inc.# 626,025 618 Elastic, NV# 107,229
See accompanying Notes to Schedule of Investments

123www.calamos.com
Timpani SMID Growth Fund Schedule of Investments October 31, 2021
NUMBER OF SHARES VALUE
NUMBER OF SHARES VALUE
1,177 ExlService Holdings, Inc.# $ 144,336 8,346 Harmonic, Inc.# 75,698 1,734 Lattice Semiconductor Corp.# 120,409 3,333 Lightspeed Commerce, Inc.# 325,601 1,014 MongoDB, Inc. - Class A# 528,588 358 Monolithic Power Systems, Inc. 188,115 2,148 Qualtrics International Inc - Class A# 99,495 2,459 Rapid7, Inc.# 316,596 517 RingCentral, Inc. - Class A# 126,034 3,374 SiTime Corp.# 893,739 4,307 Sprout Social, Inc. - Class A# 549,918 5,852 Stratasys, Ltd.# 184,572 2,939 Stronghold Digital Mining, Inc. - Class A# 80,705 3,605 Tenable Holdings, Inc.# 191,966 9,340 Varonis Systems, Inc. - Class B# 604,672 1,300 Zscaler, Inc.# 414,518 7,917,517
Materials (1.6%) 12,334 Ranpak Holdings Corp. - Class A# $ 425,030
Real Estate (0.5%) 2,400 eXp World Holdings, Inc. 123,840
TOTAL COMMON STOCKS(Cost $16,877,251) 26,423,305
TOTAL INVESTMENTS (99.9%)(Cost $16,877,251) 26,423,305
OTHER ASSETS, LESS LIABILITIES (0.1%) 30,038
NET ASSETS (100.0%) $26,453,343
NOTES TO SCHEDULE OF INVESTMENTS# Non-income producing security.
See accompanying Notes to Schedule of Investments

124 CALAMOS OPEN-END FAMILY OF FUNDS ANNUAL REPORT
Growth Fund Schedule of Investments October 31, 2021
NUMBER OF SHARES VALUE
NUMBER OF SHARES VALUE
COMMON STOCKS (97.6%)Communication Services (14.7%)
40,838 Alphabet, Inc. - Class A#~ $ 120,918,051 24,708 Integral Ad Science Holding Corp.# 607,076 333,627 Lyft, Inc. - Class A# 15,303,470 12,435 Magnite, Inc.#^ 336,118 254,104 Meta Platforms, Inc. - Class A#~ 82,220,431 30,487 Netflix, Inc.# 21,045,481 59,740 ROBLOX Corp. - Class A#^ 5,019,355 40,900 Roku, Inc.# 12,470,410 19,780 Tremor International, Ltd.# 374,831 70,624 Walt Disney Company# 11,940,400 99,276 ZipRecruiter, Inc. - Class A#^ 2,757,887
272,993,510
Consumer Discretionary (17.5%) 4,650 Airbnb, Inc. - Class A# 793,569 37,936 Amazon.com, Inc.#~ 127,936,504 20,046 Boot Barn Holdings, Inc.# 2,094,606 125,388 Caesars Entertainment, Inc.# 13,724,970 11,225 Century Communities, Inc. 752,748 5,686 Chipotle Mexican Grill, Inc. - Class A# 10,115,565 5,895 Crocs, Inc.# 951,748 7,635 Deckers Outdoor Corp.# 3,018,192 11,832 DraftKings, Inc. - Class A#^ 551,253 6,140 Etsy, Inc.# 1,539,237 50,617 Everi Holdings, Inc.# 1,214,808 14,604 Floor & Decor Holdings, Inc. - Class A# 1,984,976 12,767 Lithia Motors, Inc. - Class A 4,075,482 26,368 Lovesac Company#^ 2,056,968 30,524 Lululemon Athletica, Inc.# 14,224,489 158,506 NIKE, Inc. - Class B~ 26,516,469 1,579 Pool Corp. 813,438 99,228 Porch Group, Inc.# 2,086,765 2,870 Portillo’s, Inc. - Class A# 109,060 78,305 Royal Caribbean Cruises, Ltd.# 6,611,291 6,732 Skyline Champion Corp.# 426,270 24,250 Steven Madden, Ltd. 1,093,675 75,227 Tesla, Inc.# 83,802,878 22,866 TopBuild Corp.# 5,875,876 31,023 Ulta Beauty, Inc.# 11,396,609 18,737 YETI Holdings, Inc.# 1,842,409
325,609,855
Consumer Staples (1.7%) 75,821 Beauty Health Company#^ 2,082,803 46,172 Celsius Holdings, Inc.#^ 4,456,521 43,193 Constellation Brands, Inc. - Class A 9,364,674
24,639 Estee Lauder Companies Inc. - Class A $ 7,991,167 53,268 Walmart, Inc. 7,959,305
31,854,470
Energy (0.5%) 50,614 Aspen Aerogels, Inc.# 2,756,438 24,012 Cactus, Inc. - Class A 1,044,522 48,960 California Resources Corp.# 2,258,525 53,394 ChampionX Corp.# 1,400,525 28,305 Denbury, Inc.# 2,396,301 9,856,311
Financials (4.2%) 53,268 American Express Company 9,256,913 42,321 Brown & Brown, Inc. 2,670,878 82,956 BRP Group, Inc. - Class A# 3,027,894 109,528 Charles Schwab Corp. 8,984,582 2,800 Coinbase Global, Inc. - Class A# 894,376 16,799 Focus Financial Partners, Inc. - Class A# 1,055,985 22,444 Goldman Sachs Group, Inc. 9,277,227 497,563 Huntington Bancshares, Inc. 7,831,642 30,792 LPL Financial Holdings, Inc. 5,050,504 54,564 Marsh & McLennan Companies, Inc. 9,101,275 540,656 SLM Corp. 9,921,038 200,501 Wells Fargo & Company 10,257,631
77,329,945
Health Care (10.8%) 18,703 Align Technology, Inc.# 11,677,592 43,997 Axonics, Inc.#^ 3,227,180 12,822 BioLife Solutions, Inc.# 681,489 190,028 Boston Scientific Corp.# 8,195,908 128,250 Bristol-Myers Squibb Company 7,489,800 29,929 Castle Biosciences, Inc.# 1,866,073 44,485 Codexis, Inc.# 1,546,743 4,803 CryoPort, Inc.#^ 391,637 13,222 Cutera, Inc.#^ 568,546 44,090 Danaher Corp. 13,745,939 41,414 Dexcom, Inc.# 25,809,619 95,762 Edwards Lifesciences Corp.# 11,474,203 89,260 Eli Lilly & Company 22,739,878 17,589 Establishment Labs Holdings, Inc.# 1,434,207 44,404 Horizon Therapeutics, PLC# 5,324,484 42,894 Inotiv, Inc.#^ 2,075,641 13,555 Inspire Medical Systems, Inc.# 3,654,157 46,685 IQVIA Holdings, Inc.# 12,204,393 12,883 Natera, Inc.# 1,476,005 26,804 OptimizeRx Corp.#^ 2,591,947 24,222 Paragon 28, Inc.# 509,631
See accompanying Notes to Schedule of Investments

125www.calamos.com
Growth Fund Schedule of Investments October 31, 2021
NUMBER OF SHARES VALUE
NUMBER OF SHARES VALUE
8,671 Repligen Corp.# $ 2,518,925 8,523 Shockwave Medical, Inc.# 1,821,365 5,401 Staar Surgical Company# 639,802 42,195 Thermo Fisher Scientific, Inc. 26,712,389 64,939 UnitedHealth Group, Inc.~ 29,902,461 11,877 Vericel Corp.#^ 546,580 96,514 ViewRay, Inc.# 705,517
201,532,111
Industrials (7.9%) 11,694 Advanced Drainage Systems, Inc. 1,319,083 367,287 Air Lease Corp. - Class A 14,709,844 24,179 Axon Enterprise, Inc.# 4,351,253 510,930 CSX Corp. 18,480,338 18,122 Driven Brands Holdings, Inc.# 588,421 193 Fluence Energy, Inc.# 6,865 12,026 Generac Holdings, Inc.# 5,995,683 24,727 GXO Logistics, Inc.# 2,195,758 64,340 Honeywell International, Inc. 14,066,011 45,088 L3Harris Technologies, Inc. 10,394,588 68,975 Montrose Environmental Group, Inc.#^ 4,728,236 6,018 Old Dominion Freight Line, Inc. 2,054,244 192,621 Raytheon Technologies Corp. 17,116,302 4,509 RBC Bearings, Inc.# 1,054,790 10,294 Saia, Inc.# 3,218,316 26,989 Shyft Group, Inc. 1,112,217 76,117 Tecnoglass, Inc. 2,198,259 13,034 Tetra Tech, Inc. 2,289,552 15,012 Trex Company, Inc.# 1,597,277 467,095 Uber Technologies, Inc.# 20,468,103 76,410 Union Pacific Corp. 18,445,374 3,108 Vicor Corp.# 471,142
146,861,656
Information Technology (38.9%) 25,250 Adobe, Inc.# 16,421,590 770,528 Apple, Inc. 115,425,095 124,428 Applied Materials, Inc. 17,003,086 28,308 Asana, Inc. - Class A# 3,844,226 5,020 ASML Holding, NV^ 4,080,658 14,528 Bill.com Holdings, Inc.# 4,275,736 29,547 Brooks Automation, Inc. 3,440,748 21,280 Cloudflare, Inc. - Class A# 4,143,642 12,882 CyberArk Software, Ltd.# 2,320,177 8,767 Diodes, Inc.# 842,421 59,244 Dynatrace, Inc.# 4,443,300 4,388 Elastic, NV# 761,362 8,353 ExlService Holdings, Inc.# 1,024,328
36,400 Fidelity National Information Services, Inc. $ 4,030,936 59,234 Harmonic, Inc.# 537,252 12,305 Lattice Semiconductor Corp.# 854,459 23,986 Lightspeed Commerce, Inc.#^ 2,343,192 201,156 Marvell Technology, Inc. 13,779,186 130,247 Micron Technology, Inc. 9,000,068 597,350 Microsoft Corp.~ 198,093,207 7,197 MongoDB, Inc. - Class A#^ 3,751,724 2,569 Monolithic Power Systems, Inc. 1,349,907 288,990 NVIDIA Corp. 73,886,073 43,663 Paycom Software, Inc.# 23,920,775 80,100 PayPal Holdings, Inc.#~ 18,630,459 15,248 Qualtrics International Inc - Class A#^ 706,287 17,451 Rapid7, Inc.#^ 2,246,816 3,672 RingCentral, Inc. - Class A# 895,160 150,775 salesforce.com, Inc.# 45,185,760 32,171 ServiceNow, Inc.# 22,447,637 23,947 SiTime Corp.# 6,343,321 82,414 Snowflake, Inc.- Class A# 29,161,370 30,568 Sprout Social, Inc. - Class A# 3,902,922 19,650 Square, Inc. - Class A#^ 5,000,925 41,558 Stratasys, Ltd.# 1,310,739 20,863 Stronghold Digital Mining, Inc. - Class A# 572,898 25,599 Tenable Holdings, Inc.# 1,363,147 80,700 Trade Desk, Inc. - Class A# 6,045,237 98,803 Twilio, Inc. - Class A# 28,787,242 16,500 Unity Software, Inc.#^ 2,496,615 66,295 Varonis Systems, Inc. - Class B#^ 4,291,938 124,000 Visa, Inc. - Class A~ 26,259,480 22,530 Zscaler, Inc.#^ 7,183,916
722,405,017
Materials (1.3%) 47,233 Celanese Corp. 7,628,602 43,641 Linde, PLC 13,930,207 87,546 Ranpak Holdings Corp. - Class A# 3,016,835
24,575,644
Real Estate (0.1%) 17,226 eXp World Holdings, Inc. 888,862
TOTAL COMMON STOCKS(Cost $994,559,211) 1,813,907,381
See accompanying Notes to Schedule of Investments

126 CALAMOS OPEN-END FAMILY OF FUNDS ANNUAL REPORT
Growth Fund Schedule of Investments October 31, 2021
NUMBER OFCONTRACTS/ NOTIONAL AMOUNT VALUE
PURCHASED OPTION (0.0%)#Information Technology (0.0%)
70 Twilio, Inc. 2,039,520 Call, 01/20/23, Strike $400.00 (Cost $170,661) $ 170,625
NUMBER OF SHARES VALUE
INVESTMENT OF CASH COLLATERAL FOR SECURITIES LOANED (1.3%)
23,479,460 State Street Navigator Securities Lending Government Money Market Portfolio† (Cost $23,479,460) 23,479,460
TOTAL INVESTMENTS (98.9%)(Cost $1,018,209,332) 1,837,557,466
PAYABLE UPON RETURN OF SECURITIES ON LOAN (-1.3%) (23,479,460)
OTHER ASSETS, LESS LIABILITIES (2.4%) 44,026,738
NET ASSETS (100.0%) $1,858,104,744
See accompanying Notes to Schedule of Investments
NUMBER OFCONTRACTS/ NOTIONAL AMOUNT VALUE
WRITTEN OPTION (0.0%)#Information Technology (0.0%)
70 Twilio, Inc. 2,039,520 Put, 12/17/21, Strike $270.00 (Premium $75,878) $ (56,700)
NOTES TO SCHEDULE OF INVESTMENTS# Non-income producing security.
~ Security, or portion of security, is segregated as collateral (or potentialcollateral for future transactions) for written options. The aggregate valueof such securities is $6,545,445.
^ Security, or portion of security, is on loan.
† Represents investment of cash collateral received from securities on loanas of October 31, 2021.
Note: The date on options represents the expiration date of the option contract. The optioncontract may be exercised at any date on or before the date shown.
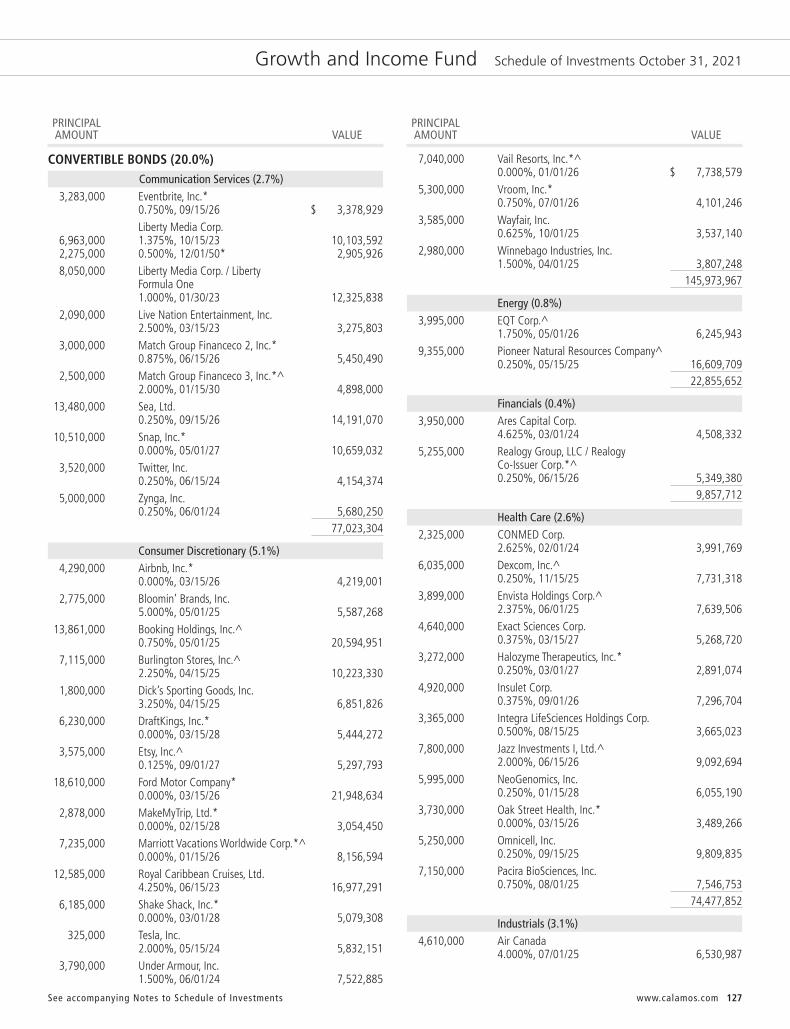
See accompanying Notes to Schedule of Investments 127www.calamos.com
PRINCIPAL AMOUNT VALUE
PRINCIPAL AMOUNT VALUE
CONVERTIBLE BONDS (20.0%)Communication Services (2.7%)
3,283,000 Eventbrite, Inc.* 0.750%, 09/15/26 $ 3,378,929 Liberty Media Corp. 6,963,000 1.375%, 10/15/23 10,103,592 2,275,000 0.500%, 12/01/50* 2,905,926 8,050,000 Liberty Media Corp. / Liberty Formula One 1.000%, 01/30/23 12,325,838 2,090,000 Live Nation Entertainment, Inc. 2.500%, 03/15/23 3,275,803 3,000,000 Match Group Financeco 2, Inc.* 0.875%, 06/15/26 5,450,490 2,500,000 Match Group Financeco 3, Inc.*^ 2.000%, 01/15/30 4,898,000 13,480,000 Sea, Ltd. 0.250%, 09/15/26 14,191,070 10,510,000 Snap, Inc.* 0.000%, 05/01/27 10,659,032 3,520,000 Twitter, Inc. 0.250%, 06/15/24 4,154,374 5,000,000 Zynga, Inc. 0.250%, 06/01/24 5,680,250
77,023,304
Consumer Discretionary (5.1%) 4,290,000 Airbnb, Inc.* 0.000%, 03/15/26 4,219,001 2,775,000 Bloomin’ Brands, Inc. 5.000%, 05/01/25 5,587,268 13,861,000 Booking Holdings, Inc.^ 0.750%, 05/01/25 20,594,951 7,115,000 Burlington Stores, Inc.^ 2.250%, 04/15/25 10,223,330 1,800,000 Dick’s Sporting Goods, Inc. 3.250%, 04/15/25 6,851,826 6,230,000 DraftKings, Inc.* 0.000%, 03/15/28 5,444,272 3,575,000 Etsy, Inc.^ 0.125%, 09/01/27 5,297,793 18,610,000 Ford Motor Company* 0.000%, 03/15/26 21,948,634 2,878,000 MakeMyTrip, Ltd.* 0.000%, 02/15/28 3,054,450 7,235,000 Marriott Vacations Worldwide Corp.*^ 0.000%, 01/15/26 8,156,594 12,585,000 Royal Caribbean Cruises, Ltd. 4.250%, 06/15/23 16,977,291 6,185,000 Shake Shack, Inc.* 0.000%, 03/01/28 5,079,308 325,000 Tesla, Inc. 2.000%, 05/15/24 5,832,151 3,790,000 Under Armour, Inc. 1.500%, 06/01/24 7,522,885
7,040,000 Vail Resorts, Inc.*^ 0.000%, 01/01/26 $ 7,738,579 5,300,000 Vroom, Inc.* 0.750%, 07/01/26 4,101,246 3,585,000 Wayfair, Inc. 0.625%, 10/01/25 3,537,140 2,980,000 Winnebago Industries, Inc. 1.500%, 04/01/25 3,807,248
145,973,967
Energy (0.8%) 3,995,000 EQT Corp.^ 1.750%, 05/01/26 6,245,943 9,355,000 Pioneer Natural Resources Company^ 0.250%, 05/15/25 16,609,709
22,855,652
Financials (0.4%) 3,950,000 Ares Capital Corp. 4.625%, 03/01/24 4,508,332 5,255,000 Realogy Group, LLC / Realogy Co-Issuer Corp.*^ 0.250%, 06/15/26 5,349,380 9,857,712
Health Care (2.6%) 2,325,000 CONMED Corp. 2.625%, 02/01/24 3,991,769 6,035,000 Dexcom, Inc.^ 0.250%, 11/15/25 7,731,318 3,899,000 Envista Holdings Corp.^ 2.375%, 06/01/25 7,639,506 4,640,000 Exact Sciences Corp. 0.375%, 03/15/27 5,268,720 3,272,000 Halozyme Therapeutics, Inc.* 0.250%, 03/01/27 2,891,074 4,920,000 Insulet Corp. 0.375%, 09/01/26 7,296,704 3,365,000 Integra LifeSciences Holdings Corp. 0.500%, 08/15/25 3,665,023 7,800,000 Jazz Investments I, Ltd.^ 2.000%, 06/15/26 9,092,694 5,995,000 NeoGenomics, Inc. 0.250%, 01/15/28 6,055,190 3,730,000 Oak Street Health, Inc.* 0.000%, 03/15/26 3,489,266 5,250,000 Omnicell, Inc. 0.250%, 09/15/25 9,809,835 7,150,000 Pacira BioSciences, Inc. 0.750%, 08/01/25 7,546,753
74,477,852
Industrials (3.1%) 4,610,000 Air Canada 4.000%, 07/01/25 6,530,987
Growth and Income Fund Schedule of Investments October 31, 2021

CALAMOS OPEN-END FAMILY OF FUNDS ANNUAL REPORT
Growth and Income Fund Schedule of Investments October 31, 2021
PRINCIPAL AMOUNT VALUE
PRINCIPAL AMOUNT VALUE
3,950,000 Air Transport Services Group, Inc.^ 1.125%, 10/15/24 $ 4,208,962 1,300,000 Chart Industries, Inc.*^ 1.000%, 11/15/24 3,952,819 7,460,000 JetBlue Airways Corp.*^ 0.500%, 04/01/26 7,216,580 10,465,000 John Bean Technologies Corp.* 0.250%, 05/15/26 11,434,687 8,645,000 Middleby Corp. 1.000%, 09/01/25 13,023,433 20,125,000 Southwest Airlines Company 1.250%, 05/01/25 28,305,611 13,615,000 Uber Technologies, Inc.*^ 0.000%, 12/15/25 13,157,128
87,830,207
Information Technology (4.5%) Bill.com Holdings, Inc.* 3,991,000 0.000%, 04/01/27^ 4,289,766 3,154,000 0.000%, 12/01/25 6,110,812 5,530,000 Coupa Software, Inc. 0.375%, 06/15/26 6,090,189 1,960,000 Datadog, Inc. 0.125%, 06/15/25 3,717,748 Enphase Energy, Inc.* 4,990,000 0.000%, 03/01/28 5,558,361 2,207,000 0.000%, 03/01/26 2,393,337 3,810,000 Five9, Inc. 0.500%, 06/01/25 5,111,420 4,895,000 Itron, Inc.* 0.000%, 03/15/26 4,598,363 3,870,000 LivePerson, Inc.* 0.000%, 12/15/26 3,789,427 11,597,000 Microchip Technology, Inc.^ 0.125%, 11/15/24 12,994,322 2,235,000 Nova, Ltd. 0.000%, 10/15/25 3,416,644 4,920,000 Okta, Inc. 0.125%, 09/01/25 7,150,334 ON Semiconductor Corp. 6,480,000 0.000%, 05/01/27*^ 7,860,953 2,230,000 1.625%, 10/15/23 5,259,745 3,825,000 Palo Alto Networks, Inc. 0.375%, 06/01/25 6,701,017 7,310,000 Repay Holdings Corp.* 0.000%, 02/01/26 6,786,092 6,495,000 RingCentral, Inc. 0.000%, 03/01/25 6,674,002 4,638,000 Shift4 Payments, Inc.* 0.000%, 12/15/25 5,029,262 1,358,000 Shopify, Inc.^ 0.125%, 11/01/25 1,720,355 3,322,000 Silicon Laboratories, Inc. 0.625%, 06/15/25 5,342,075 4,585,000 Square, Inc.*^ 0.000%, 05/01/26 5,415,756
2,282,000 Wix.com, Ltd.^ 0.000%, 08/15/25 $ 2,161,967 2,255,000 Workday, Inc. 0.250%, 10/01/22 4,461,112 2,907,000 Zscaler, Inc. 0.125%, 07/01/25 6,280,341
128,913,400
Materials (0.1%) 2,485,000 MP Materials Corp.*
0.250%, 04/01/26 2,626,198
Real Estate (0.7%) 5,340,000 IH Merger Sub, LLC 3.500%, 01/15/22 9,700,110 3,315,000 Pebblebrook Hotel Trust 1.750%, 12/15/26 3,708,424 5,495,000 Redfin Corp. 0.000%, 10/15/25 5,605,889
19,014,423
TOTAL CONVERTIBLE BONDS(Cost $456,258,697) 568,572,715
NUMBER OF SHARES VALUE
CONVERTIBLE PREFERRED STOCKS (8.2%)Communication Services (0.6%)
15,280 2020 Cash Mandatory Exchangeable Trust*5.250%, 06/01/23 16,023,418
Consumer Discretionary (0.7%) 106,325 Aptiv, PLC
5.500%, 06/15/23 20,541,990
Financials (0.9%) 80,250 AMG Capital Trust II^ 5.150%, 10/15/37 4,756,257 214,825 KKR & Company, Inc.^ 6.000%, 09/15/23 21,491,093
26,247,350
Health Care (1.6%) 81,055 Avantor, Inc. 6.250%, 05/15/22 10,032,988 118,375 Boston Scientific Corp. 5.500%, 06/01/23 13,854,610 9,890 Danaher Corp. 4.750%, 04/15/22 20,623,122
44,510,720
Industrials (1.1%) 59,310 Colfax Corp.^ 5.750%, 01/15/22 12,377,997 176,425 Stanley Black & Decker, Inc.^ 5.250%, 11/15/22 19,039,786
31,417,783
See accompanying Notes to Schedule of Investments128

See accompanying Notes to Schedule of Investments 129www.calamos.com
Growth and Income Fund Schedule of Investments October 31, 2021
NUMBER OF SHARES VALUE
NUMBER OF SHARES VALUE
Information Technology (0.7%) 12,805 Broadcom, Inc.
8.000%, 09/30/22 $ 21,478,339
Utilities (2.6%) 73,905 AES Corp.^ 6.875%, 02/15/24 7,465,144 80,675 CenterPoint Energy, Inc. (Warner Media, LLC, Charter Communications Time, Inc.)§** 4.566%, 09/15/29 4,902,055 140,435 Dominion Energy, Inc. 7.250%, 06/01/22 14,067,374 273,280 DTE Energy Company 6.250%, 11/01/22 13,795,175 141,390 Essential Utilities, Inc. 6.000%, 04/30/22 8,166,686 NextEra Energy, Inc. 326,000 4.872%, 09/01/22 20,609,720 88,405 6.219%, 09/01/23 4,844,594
73,850,748
TOTAL CONVERTIBLE PREFERRED STOCKS(Cost $176,586,330) 234,070,348
COMMON STOCKS (68.2%)Communication Services (7.8%)
39,080 Alphabet, Inc. - Class A#~ 115,712,754 321,635 Comcast Corp. - Class A 16,541,688 152,330 Meta Platforms, Inc. - Class A# 49,289,418 27,710 Netflix, Inc.# 19,128,490 126,745 Walt Disney Company# 21,428,777
222,101,127
Consumer Discretionary (8.0%) 28,060 Amazon.com, Inc.# 94,630,386 165,770 General Motors Company# 9,022,861 84,115 Home Depot, Inc. 31,268,910 58,410 Lowe’s Companies, Inc. 13,657,426 47,685 McDonald’s Corp. 11,709,052 207,960 MGM Resorts International 9,807,394 100,640 NIKE, Inc. - Class B 16,836,065 66,830 Starbucks Corp. 7,088,658 47,470 Target Corp. 12,324,161 12,620 Tesla, Inc.# 14,058,680 100,120 TJX Companies, Inc. 6,556,859
226,960,452
Consumer Staples (4.4%) 408,935 Coca-Cola Company 23,051,666 28,785 Costco Wholesale Corp. 14,148,979 215,050 Mondelez International, Inc. - Class A 13,062,137 98,075 PepsiCo, Inc. 15,848,920
129,500 Philip Morris International, Inc. $ 12,242,930 152,560 Procter & Gamble Company 21,814,554 109,455 Sysco Corp. 8,417,090 117,332 Walmart, Inc. 17,531,747
126,118,023
Energy (2.3%) 216,685 Chevron Corp. 24,808,266 77,510 ConocoPhillips 5,773,720 258,910 Exxon Mobil Corp. 16,691,928 141,960 Hess Corp. 11,721,637 111,565 Marathon Petroleum Corp. 7,355,480
66,351,031
Financials (9.5%) 39,170 American Express Company 6,806,963 99,710 American International Group, Inc. 5,891,864 43,888 Assurant, Inc. 7,079,573 727,315 Bank of America Corp.~ 34,751,111 9,110 BlackRock, Inc. 8,594,921 240,040 Charles Schwab Corp. 19,690,481 64,430 Chubb, Ltd. 12,588,333 176,040 Citigroup, Inc. 12,174,926 84,145 Discover Financial Services 9,535,311 43,170 Goldman Sachs Group, Inc. 17,844,320 363,495 Huntington Bancshares, Inc. 5,721,411 111,325 Intercontinental Exchange, Inc. 15,414,060 232,540 JPMorgan Chase & Company~ 39,506,221 419,245 KeyCorp 9,755,831 122,180 Marsh & McLennan Companies, Inc. 20,379,624 284,810 Morgan Stanley 29,272,772 37,360 Northern Trust Corp. 4,596,774 222,045 Wells Fargo & Company~ 11,359,822
270,964,318
Health Care (7.3%) 130,020 Abbott Laboratories 16,758,278 102,725 AbbVie, Inc. 11,779,476 64,705 Agilent Technologies, Inc. 10,190,390 15,820 Anthem, Inc. 6,883,757 128,820 Bristol-Myers Squibb Company 7,523,088 72,300 Edwards Lifesciences Corp.# 8,662,986 42,885 Eli Lilly & Company 10,925,383 19,455 Intuitive Surgical, Inc.# 7,025,784 129,370 Johnson & Johnson~ 21,071,786 156,780 Medtronic, PLC~ 18,791,651 222,685 Merck & Company, Inc. 19,607,414 244,925 Pfizer, Inc. 10,713,019 17,665 Stryker Corp. 4,700,126

CALAMOS OPEN-END FAMILY OF FUNDS ANNUAL REPORT
Growth and Income Fund Schedule of Investments October 31, 2021
NUMBER OF SHARES VALUE
NUMBER OFCONTRACTS/ NOTIONAL AMOUNT VALUE 17,705 Thermo Fisher Scientific, Inc. $ 11,208,504
92,715 UnitedHealth Group, Inc. 42,692,476 208,534,118
Industrials (5.3%) 365,945 Carrier Global Corp. 19,113,307 813,840 CSX Corp. 29,436,593 12,540 FedEx Corp. 2,953,546 120,840 Honeywell International, Inc. 26,418,041 87,210 JB Hunt Transport Services, Inc. 17,196,940 35,670 Northrop Grumman Corp. 12,742,037 353,765 Raytheon Technologies Corp. 31,435,558 42,150 Union Pacific Corp. 10,175,010
149,471,032
Information Technology (20.3%) 57,015 Accenture, PLC - Class A 20,456,412 31,970 Adobe, Inc.# 20,792,009 37,580 Advanced Micro Devices, Inc.# 4,518,243 982,945 Apple, Inc.~ 147,245,161 185,485 Cisco Systems, Inc. 10,381,596 100,905 Fidelity National Information Services, Inc. 11,174,220 40,850 Lam Research Corp. 23,021,835 102,200 Marvell Technology, Inc. 7,000,700 61,095 Mastercard, Inc. - Class A 20,498,594 78,250 Micron Technology, Inc. 5,407,075 486,955 Microsoft Corp.~ 161,484,017 196,720 NVIDIA Corp. 50,295,402 23,310 PayPal Holdings, Inc.# 5,421,673 42,205 QUALCOMM, Inc. 5,614,953 72,820 salesforce.com, Inc.# 21,823,426 18,370 ServiceNow, Inc.# 12,817,851 27,515 Skyworks Solutions, Inc. 4,598,582 73,010 Taiwan Semiconductor Manufacturing Company, Ltd. (ADR) 8,301,237 168,980 Visa, Inc. - Class A 35,784,895
576,637,881
Materials (2.3%) 67,965 Celanese Corp. 10,977,027 414,490 Freeport-McMoRan, Inc. 15,634,563 72,650 Linde, PLC 23,189,880 81,855 PPG Industries, Inc. 13,143,458 17,435 Vulcan Materials Company 3,314,742
66,259,670
Real Estate (1.0%) 60,195 American Tower Corp. 16,973,184 61,825 Crown Castle International Corp. 11,147,048
28,120,232
TOTAL COMMON STOCKS(Cost $813,619,079) 1,941,517,884
PURCHASED OPTIONS (0.6%)#Consumer Discretionary (0.4%)
Tesla, Inc. 170 18,938,000 Call, 03/18/22, Strike $820.00 $ 5,748,125 140 1,559,600 Call, 01/21/22, Strike $750.00 5,355,350
11,103,475
Other (0.2%) 1,400 Invesco QQQ Trust Series 54,055,400 Put, 11/19/21, Strike $380.00 522,900 iShares MSCI EAFE ETF 24,000 193,176,000 Call, 01/21/22, Strike $83.00 1,728,000 5,100 41,049,900 Call, 03/18/22, Strike $80.00 1,547,850 7,800 iShares MSCI Emerging Markets 39,717,600 Call, 03/18/22, Strike $53.00 998,400 1,700 SPDR S&P 500 ETF Trust 78,072,500 Put, 02/18/22, Strike $440.00 1,831,750 6,628,900
TOTAL PURCHASED OPTIONS(Cost $9,069,627) 17,732,375
NUMBER OF SHARES/ PRINCIPAL AMOUNT VALUE
INVESTMENT OF CASH COLLATERAL FOR SECURITIES LOANED (4.5%)
66,600,465 JPMorgan Prime Money Market Fund - Capital Class, 0.070%***† 66,600,465 61,229,462 State Street Navigator Securities Lending Government Money Market Portfolio† 61,229,462
TOTAL INVESTMENT OF CASH COLLATERAL FOR SECURITIES LOANED(Cost $127,829,927) 127,829,927
TOTAL INVESTMENTS (101.5%)(Cost $1,583,363,660) 2,889,723,249
PAYABLE UPON RETURN OF SECURITIES ON LOAN (-4.5%) (127,829,927)
OTHER ASSETS, LESS LIABILITIES (3.0%) 86,151,828
NET ASSETS (100.0%) $2,848,045,150
See accompanying Notes to Schedule of Investments130

See accompanying Notes to Schedule of Investments 131www.calamos.com
Growth and Income Fund Schedule of Investments October 31, 2021
NUMBER OFCONTRACTS/ NOTIONAL AMOUNT VALUE
WRITTEN OPTIONS (0.0%)#Consumer Discretionary (0.0%)
Tesla, Inc. 170 18,938,000 Put, 03/18/22, Strike $600.00 $ (213,775) 140 15,596,000 Put, 01/21/22, Strike $500.00 (55,300) (269,075)
Energy (0.0%) 760 Conocophillips 5,661,240 Call, 05/20/22, Strike $85.00 (267,900)
TOTAL WRITTEN OPTIONS(Premium $1,312,486) $ (536,975)
FORWARD FOREIGN CURRENCY CONTRACTS
SHORT SETTLEMENT LOCAL CURRENT UNREALIZEDCOUNTERPARTY CONTRACTS DATE CURRENCY VALUE GAIN/LOSS
Bank of New York Canadian Dollar 01/27/22 6,508,000 $5,259,155 $25,684State Street Bank and Trust New Taiwanese Dollar 01/27/22 223,695,000 8,046,942 26,212
$51,896
NOTES TO SCHEDULE OF INVESTMENTS* Securities issued and sold pursuant to a Rule 144A transaction are
exempted from the registration requirement of the Securities Act of 1933,as amended. These securities may only be sold to qualified institutionalbuyers (“QIBs”), such as the Fund. Any resale of these securities mustgenerally be effected through a sale that is registered under the Act orotherwise exempted from such registration requirements.
^ Security, or portion of security, is on loan.
§ Securities exchangeable or convertible into securities of one or moreentities that are different than the issuer. Each entity is identified in theparenthetical.
** Step coupon security. Coupon changes periodically based upon apredetermined schedule. The rate shown is the rate in effect at October 31,2021.
# Non-income producing security.
~ Security, or portion of security, is segregated as collateral (or collateral forpotential future transactions) for written options. The aggregate value ofsuch securities is $11,368,638.
*** The rate disclosed is the 7 day net yield as of October 31, 2021.
† Represents investment of cash collateral received from securities on loanas of October 31, 2021.
Note: The date on options represents the expiration date of the option contract. The optioncontract may be exercised at any date on or before the date shown.

132 CALAMOS OPEN-END FAMILY OF FUNDS ANNUAL REPORT
Dividend Growth Fund Schedule of Investments October 31, 2021
NUMBER OF SHARES VALUE
NUMBER OF SHARES VALUE
CONVERTIBLE PREFERRED STOCK (0.5%)Health Care (0.5%)
730 Boston Scientific Corp.^ 5.500%, 06/01/23
(Cost $87,568) $ 85,439
COMMON STOCKS (98.8%)Communication Services (9.5%)
275 Alphabet, Inc. - Class C# 815,488 1,316 AT&T, Inc. 33,242 3,025 Comcast Corp. - Class A 155,576 1,020 Meta Platforms, Inc. - Class A# 330,041 200 Netflix, Inc.# 138,062 490 T-Mobile US, Inc.# 56,365 835 Walt Disney Company# 141,173 1,669,947
Consumer Discretionary (14.2%) 200 Amazon.com, Inc.# 674,486 705 Aptiv, PLC# 121,887 40 Booking Holdings, Inc.# 96,831 525 Dick’s Sporting Goods, Inc.^ 65,210 3,970 Ford Motor Company 67,808 1,050 General Motors Company# 57,152 560 Home Depot, Inc. 208,174 535 Lowe’s Companies, Inc. 125,094 425 McDonald’s Corp. 104,359 2,590 MGM Resorts International 122,144 1,195 NIKE, Inc. - Class B 199,912 970 Royal Caribbean Cruises, Ltd.# 81,897 690 Starbucks Corp. 73,188 655 Target Corp. 170,051 140 Tesla, Inc.# 155,960 2,160 TJX Companies, Inc. 141,458 1,185 Under Armour, Inc. - Class A# 26,023 2,491,634
Consumer Staples (5.6%) 2,945 Coca-Cola Company 166,010 225 Costco Wholesale Corp. 110,596 1,440 Mondelez International, Inc. - Class A 87,466 630 PepsiCo, Inc. 101,808 1,025 Philip Morris International, Inc. 96,903 1,065 Procter & Gamble Company 152,284 1,520 Sysco Corp. 116,888 1,030 Walmart, Inc. 153,903 985,858
Energy (4.0%) 1,390 Chevron Corp. 159,141 1,320 ConocoPhillips 98,327
2,390 Exxon Mobil Corp. $ 154,083 1,370 Hess Corp. 113,121 1,190 Marathon Petroleum Corp. 78,457 525 Pioneer Natural Resources Company 98,164 701,293
Financials (12.4%) 395 American Express Company 68,643 360 American International Group, Inc. 21,272 495 Assurant, Inc. 79,849 5,200 Bank of America Corp. 248,456 60 BlackRock, Inc. 56,608 2,050 Charles Schwab Corp. 168,162 495 Chubb, Ltd. 96,713 1,390 Citigroup, Inc. 96,133 670 Discover Financial Services 75,924 435 Goldman Sachs Group, Inc. 179,807 2,330 Huntington Bancshares, Inc. 36,674 900 Intercontinental Exchange, Inc. 124,614 1,700 JPMorgan Chase & Company 288,813 3,195 KeyCorp 74,348 760 Marsh & McLennan Companies, Inc. 126,768 2,090 Morgan Stanley 214,810 400 Northern Trust Corp. 49,216 3,120 Wells Fargo & Company 159,619 2,166,429
Health Care (11.0%) 1,605 Abbott Laboratories 206,868 1,355 AbbVie, Inc. 155,378 475 Agilent Technologies, Inc. 74,808 120 Amgen, Inc. 24,836 110 Anthem, Inc. 47,864 1,745 Bristol-Myers Squibb Company 101,908 380 Danaher Corp. 118,473 530 Eli Lilly & Company 135,023 905 Johnson & Johnson 147,406 1,380 Medtronic, PLC 165,407 1,720 Merck & Company, Inc. 151,446 2,740 Pfizer, Inc. 119,847 215 Stryker Corp. 57,205 180 Thermo Fisher Scientific, Inc. 113,953 655 UnitedHealth Group, Inc. 301,608 1,922,030
Industrials (7.7%) 2,900 Carrier Global Corp. 151,467 6,150 CSX Corp. 222,446 170 FedEx Corp. 40,040
See accompanying Notes to Schedule of Investments

133www.calamos.com
Dividend Growth Fund Schedule of Investments October 31, 2021
NUMBER OF SHARES VALUE
NUMBER OF SHARES VALUE
735 Fortive Corp. $ 55,647 800 Honeywell International, Inc. 174,896 550 JB Hunt Transport Services, Inc. 108,455 220 Northrop Grumman Corp. 78,588 2,220 Raytheon Technologies Corp. 197,269 3,010 Southwest Airlines Company# 142,313 495 Stanley Black & Decker, Inc. 88,966 355 Union Pacific Corp. 85,697 1,345,784
Information Technology (28.4%) 510 Accenture, PLC - Class A 182,983 210 Adobe, Inc.# 136,576 7,685 Apple, Inc. 1,151,213 700 Applied Materials, Inc. 95,655 390 Broadcom, Inc. 207,351 1,995 Cisco Systems, Inc. 111,660 820 Fidelity National Information Services, Inc. 90,807 970 Intel Corp. 47,530 255 Intuit, Inc. 159,627 205 Lam Research Corp. 115,532 740 Marvell Technology, Inc. 50,690 540 Mastercard, Inc. - Class A 181,181 1,000 Microchip Technology, Inc. 74,090 485 Micron Technology, Inc. 33,514 3,525 Microsoft Corp. 1,168,960 1,500 NVIDIA Corp. 383,505 1,365 Oracle Corp. 130,958 190 PayPal Holdings, Inc.# 44,192 390 QUALCOMM, Inc. 51,886 385 salesforce.com, Inc.# 115,381 120 ServiceNow, Inc.# 83,731 215 Skyworks Solutions, Inc. 35,933 490 Texas Instruments, Inc. 91,865 1,135 Visa, Inc. - Class A 240,359 4,985,179
Materials (2.8%) 375 Celanese Corp. 60,566 2,630 Freeport-McMoRan, Inc. 99,204 470 Linde, PLC 150,024 530 PPG Industries, Inc. 85,102 60 Sherwin-Williams Company 18,997 360 Vulcan Materials Company 68,443 482,336
Real Estate (0.9%) 330 American Tower Corp. $ 93,050 395 Crown Castle International Corp. 71,219 164,269
Utilities (2.3%) 2,510 AES Corp. 63,076 915 Dominion Energy, Inc. 69,476 685 DTE Energy Company 77,645 2,160 NextEra Energy, Inc. 184,313 394,510
TOTAL COMMON STOCKS(Cost $8,916,295) 17,309,269
EXCHANGE-TRADED FUND (0.3%)Other (0.3%)
340 iShares Nasdaq Biotechnology ETF (Cost $48,313) 54,264
NUMBER OF SHARES/ PRINCIPAL AMOUNT VALUE
INVESTMENT OF CASH COLLATERAL FOR SECURITIES LOANED (0.3%)
57,360 State Street Navigator Securities Lending Government Money Market Portfolio†
(Cost $57,360) 57,360
TOTAL INVESTMENTS (99.9%)(Cost $9,109,536) 17,506,332
PAYABLE UPON RETURN OF SECURITIES ON LOAN (-0.3%) (57,360)
OTHER ASSETS, LESS LIABILITIES (0.4%) 80,929
NET ASSETS (100.0%) $17,529,901
NOTES TO SCHEDULE OF INVESTMENTS^ Security, or portion of security, is on loan.
# Non-income producing security.
† Represents investment of cash collateral received from securities on loanas of October 31, 2021.
See accompanying Notes to Schedule of Investments

134 CALAMOS OPEN-END FAMILY OF FUNDS ANNUAL REPORT
Select Fund Schedule of Investments October 31, 2021
NUMBER OF SHARES VALUE
NUMBER OF SHARES VALUE
COMMON STOCKS (99.7%)Communication Services (11.1%)
1,006 Alphabet, Inc. - Class A# $ 2,978,686 5,155 Meta Platforms, Inc. - Class A# 1,668,003 675 Netflix, Inc.# 465,959 3,019 T-Mobile US, Inc.# 347,276 3,072 Walt Disney Company# 519,383 5,979,307
Consumer Discretionary (12.6%) 764 Amazon.com, Inc.# 2,576,537 3,450 Aptiv, PLC# 596,471 1,328 Lululemon Athletica, Inc.# 618,861 5,766 NIKE, Inc. - Class B 964,594 4,506 Starbucks Corp. 477,951 950 Tesla, Inc.# 1,058,300 6,827 TJX Companies, Inc. 447,100 6,739,814
Consumer Staples (8.0%) 12,196 Coca-Cola Company 687,489 4,097 Constellation Brands, Inc. - Class A 888,271 1,910 Estee Lauder Companies, Inc. - Class A 619,470 8,300 Mondelez International, Inc. - Class A 504,142 5,965 Sysco Corp. 458,708 7,438 Walmart, Inc. 1,111,386 4,269,466
Energy (2.7%) 4,180 Chevron Corp. 478,568 11,687 Hess Corp. 964,996 1,443,564
Financials (12.8%) 5,060 American Express Company 879,327 14,352 Bank of America Corp. 685,739 7,765 Charles Schwab Corp. 636,963 2,274 Chubb, Ltd. 444,294 5,427 Discover Financial Services 614,988 1,305 Goldman Sachs Group, Inc. 539,422 5,495 JPMorgan Chase & Company 933,545 9,450 Morgan Stanley 971,271 22,590 Wells Fargo & Company 1,155,704 6,861,253
Health Care (12.7%) 12,122 Boston Scientific Corp.# 522,822 9,498 Bristol-Myers Squibb Company 554,683 3,918 Danaher Corp. 1,221,515 853 Dexcom, Inc.# 531,598 4,355 Edwards Lifesciences Corp.# 521,816
4,778 Eli Lilly & Company $ 1,217,243 2,021 IQVIA Holdings, Inc.# 528,330 2,894 Jazz Pharmaceuticals, PLC# 385,018 2,885 UnitedHealth Group, Inc. 1,328,456 6,811,481
Industrials (10.3%) 10,400 Air Lease Corp. - Class A 416,520 11,300 Carrier Global Corp. 590,199 23,778 CSX Corp. 860,050 3,146 Honeywell International, Inc. 687,778 7,324 Raytheon Technologies Corp. 650,811 10,371 Southwest Airlines Company# 490,341 12,312 Uber Technologies, Inc.# 539,512 2,049 Union Pacific Corp. 494,629 4,940 Waste Management, Inc. 791,536 5,521,376
Information Technology (24.8%) 21,989 Apple, Inc. 3,293,952 4,040 Applied Materials, Inc. 552,066 4,271 Fidelity National Information Services, Inc. 472,971 11,117 Microsoft Corp. 3,686,619 5,766 NVIDIA Corp. 1,474,193 1,349 Paycom Software, Inc.# 739,050 2,840 PayPal Holdings, Inc.# 660,556 3,671 salesforce.com, Inc.# 1,100,162 1,470 Twilio, Inc. - Class A# 428,299 4,295 Visa, Inc. - Class A 909,552 13,317,420
Materials (2.4%) 3,360 Celanese Corp. 542,673 2,400 Linde, PLC 766,080 1,308,753
Utilities (2.3%) 6,728 Dominion Energy, Inc. 510,857 8,601 NextEra Energy, Inc. 733,923 1,244,780
TOTAL COMMON STOCKS(Cost $34,045,054) 53,497,214
TOTAL INVESTMENTS (99.7%)(Cost $34,045,054) 53,497,214
OTHER ASSETS, LESS LIABILITIES (0.3%) 185,619
NET ASSETS (100.0%) $53,682,833
NOTES TO SCHEDULE OF INVESTMENTS# Non-income producing security.
See accompanying Notes to Schedule of Investments
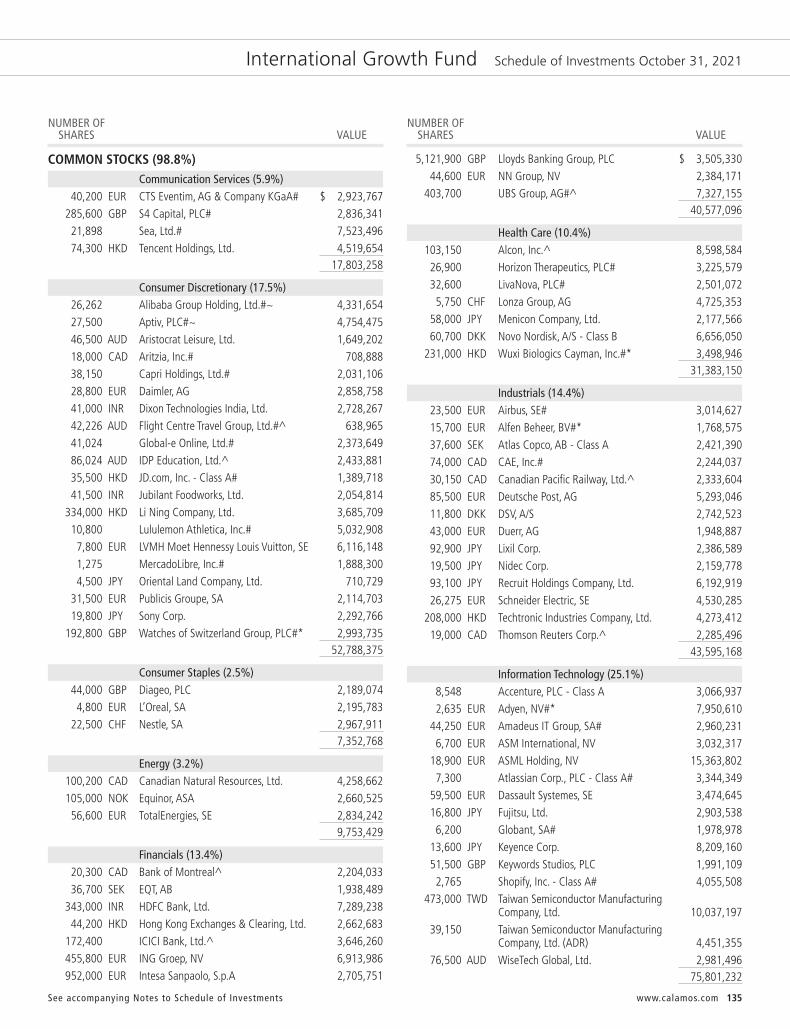
www.calamos.com 135
International Growth Fund Schedule of Investments October 31, 2021
NUMBER OF SHARES VALUE
NUMBER OF SHARES VALUE
COMMON STOCKS (98.8%)Communication Services (5.9%)
40,200 EUR CTS Eventim, AG & Company KGaA# $ 2,923,767 285,600 GBP S4 Capital, PLC# 2,836,341 21,898 Sea, Ltd.# 7,523,496 74,300 HKD Tencent Holdings, Ltd. 4,519,654
17,803,258
Consumer Discretionary (17.5%) 26,262 Alibaba Group Holding, Ltd.#~ 4,331,654 27,500 Aptiv, PLC#~ 4,754,475 46,500 AUD Aristocrat Leisure, Ltd. 1,649,202 18,000 CAD Aritzia, Inc.# 708,888 38,150 Capri Holdings, Ltd.# 2,031,106 28,800 EUR Daimler, AG 2,858,758 41,000 INR Dixon Technologies India, Ltd. 2,728,267 42,226 AUD Flight Centre Travel Group, Ltd.#^ 638,965 41,024 Global-e Online, Ltd.# 2,373,649 86,024 AUD IDP Education, Ltd.^ 2,433,881 35,500 HKD JD.com, Inc. - Class A# 1,389,718 41,500 INR Jubilant Foodworks, Ltd. 2,054,814 334,000 HKD Li Ning Company, Ltd. 3,685,709 10,800 Lululemon Athletica, Inc.# 5,032,908 7,800 EUR LVMH Moet Hennessy Louis Vuitton, SE 6,116,148 1,275 MercadoLibre, Inc.# 1,888,300 4,500 JPY Oriental Land Company, Ltd. 710,729 31,500 EUR Publicis Groupe, SA 2,114,703 19,800 JPY Sony Corp. 2,292,766 192,800 GBP Watches of Switzerland Group, PLC#* 2,993,735
52,788,375
Consumer Staples (2.5%) 44,000 GBP Diageo, PLC 2,189,074 4,800 EUR L’Oreal, SA 2,195,783 22,500 CHF Nestle, SA 2,967,911 7,352,768
Energy (3.2%) 100,200 CAD Canadian Natural Resources, Ltd. 4,258,662 105,000 NOK Equinor, ASA 2,660,525 56,600 EUR TotalEnergies, SE 2,834,242 9,753,429
Financials (13.4%) 20,300 CAD Bank of Montreal^ 2,204,033 36,700 SEK EQT, AB 1,938,489 343,000 INR HDFC Bank, Ltd. 7,289,238 44,200 HKD Hong Kong Exchanges & Clearing, Ltd. 2,662,683 172,400 ICICI Bank, Ltd.^ 3,646,260 455,800 EUR ING Groep, NV 6,913,986 952,000 EUR Intesa Sanpaolo, S.p.A 2,705,751
5,121,900 GBP Lloyds Banking Group, PLC $ 3,505,330 44,600 EUR NN Group, NV 2,384,171 403,700 UBS Group, AG#^ 7,327,155
40,577,096
Health Care (10.4%) 103,150 Alcon, Inc.^ 8,598,584 26,900 Horizon Therapeutics, PLC# 3,225,579 32,600 LivaNova, PLC# 2,501,072 5,750 CHF Lonza Group, AG 4,725,353 58,000 JPY Menicon Company, Ltd. 2,177,566 60,700 DKK Novo Nordisk, A/S - Class B 6,656,050 231,000 HKD Wuxi Biologics Cayman, Inc.#* 3,498,946
31,383,150
Industrials (14.4%) 23,500 EUR Airbus, SE# 3,014,627 15,700 EUR Alfen Beheer, BV#* 1,768,575 37,600 SEK Atlas Copco, AB - Class A 2,421,390 74,000 CAD CAE, Inc.# 2,244,037 30,150 CAD Canadian Pacific Railway, Ltd.^ 2,333,604 85,500 EUR Deutsche Post, AG 5,293,046 11,800 DKK DSV, A/S 2,742,523 43,000 EUR Duerr, AG 1,948,887 92,900 JPY Lixil Corp. 2,386,589 19,500 JPY Nidec Corp. 2,159,778 93,100 JPY Recruit Holdings Company, Ltd. 6,192,919 26,275 EUR Schneider Electric, SE 4,530,285 208,000 HKD Techtronic Industries Company, Ltd. 4,273,412 19,000 CAD Thomson Reuters Corp.^ 2,285,496
43,595,168
Information Technology (25.1%) 8,548 Accenture, PLC - Class A 3,066,937 2,635 EUR Adyen, NV#* 7,950,610 44,250 EUR Amadeus IT Group, SA# 2,960,231 6,700 EUR ASM International, NV 3,032,317 18,900 EUR ASML Holding, NV 15,363,802 7,300 Atlassian Corp., PLC - Class A# 3,344,349 59,500 EUR Dassault Systemes, SE 3,474,645 16,800 JPY Fujitsu, Ltd. 2,903,538 6,200 Globant, SA# 1,978,978 13,600 JPY Keyence Corp. 8,209,160 51,500 GBP Keywords Studios, PLC 1,991,109 2,765 Shopify, Inc. - Class A# 4,055,508 473,000 TWD Taiwan Semiconductor Manufacturing Company, Ltd. 10,037,197 39,150 Taiwan Semiconductor Manufacturing Company, Ltd. (ADR) 4,451,355 76,500 AUD WiseTech Global, Ltd. 2,981,496
75,801,232
See accompanying Notes to Schedule of Investments
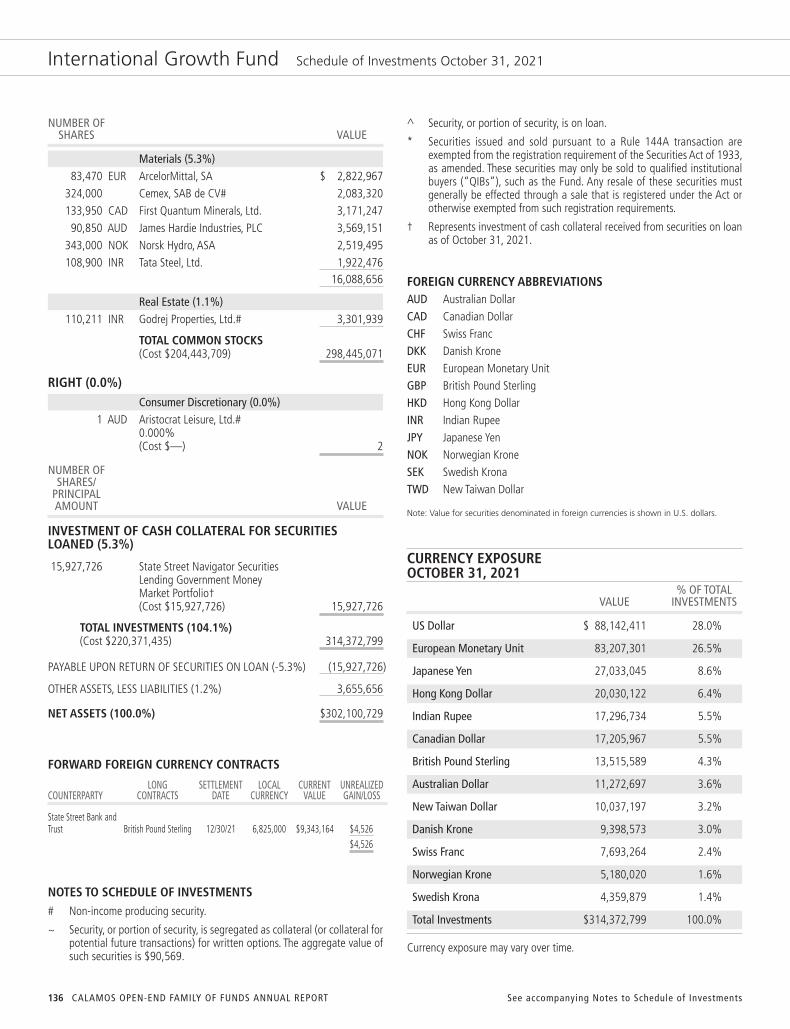
136 CALAMOS OPEN-END FAMILY OF FUNDS ANNUAL REPORT
International Growth Fund Schedule of Investments October 31, 2021
NUMBER OF SHARES VALUE
Materials (5.3%) 83,470 EUR ArcelorMittal, SA $ 2,822,967 324,000 Cemex, SAB de CV# 2,083,320 133,950 CAD First Quantum Minerals, Ltd. 3,171,247 90,850 AUD James Hardie Industries, PLC 3,569,151 343,000 NOK Norsk Hydro, ASA 2,519,495 108,900 INR Tata Steel, Ltd. 1,922,476
16,088,656
Real Estate (1.1%) 110,211 INR Godrej Properties, Ltd.# 3,301,939
TOTAL COMMON STOCKS(Cost $204,443,709) 298,445,071
RIGHT (0.0%)Consumer Discretionary (0.0%)
1 AUD Aristocrat Leisure, Ltd.# 0.000% (Cost $—) 2
NUMBER OF SHARES/ PRINCIPAL AMOUNT VALUE
INVESTMENT OF CASH COLLATERAL FOR SECURITIES LOANED (5.3%)
15,927,726 State Street Navigator Securities Lending Government Money Market Portfolio†(Cost $15,927,726) 15,927,726
TOTAL INVESTMENTS (104.1%)(Cost $220,371,435) 314,372,799
PAYABLE UPON RETURN OF SECURITIES ON LOAN (-5.3%) (15,927,726)
OTHER ASSETS, LESS LIABILITIES (1.2%) 3,655,656
NET ASSETS (100.0%) $302,100,729
FORWARD FOREIGN CURRENCY CONTRACTS
LONG SETTLEMENT LOCAL CURRENT UNREALIZEDCOUNTERPARTY CONTRACTS DATE CURRENCY VALUE GAIN/LOSS
State Street Bank and Trust British Pound Sterling 12/30/21 6,825,000 $9,343,164 $4,526
$4,526
NOTES TO SCHEDULE OF INVESTMENTS# Non-income producing security.
~ Security, or portion of security, is segregated as collateral (or collateral forpotential future transactions) for written options. The aggregate value ofsuch securities is $90,569.
^ Security, or portion of security, is on loan.
* Securities issued and sold pursuant to a Rule 144A transaction areexempted from the registration requirement of the Securities Act of 1933,as amended. These securities may only be sold to qualified institutionalbuyers (“QIBs”), such as the Fund. Any resale of these securities mustgenerally be effected through a sale that is registered under the Act orotherwise exempted from such registration requirements.
† Represents investment of cash collateral received from securities on loanas of October 31, 2021.
FOREIGN CURRENCY ABBREVIATIONSAUD Australian DollarCAD Canadian DollarCHF Swiss FrancDKK Danish KroneEUR European Monetary UnitGBP British Pound SterlingHKD Hong Kong DollarINR Indian RupeeJPY Japanese YenNOK Norwegian KroneSEK Swedish KronaTWD New Taiwan Dollar
Note: Value for securities denominated in foreign currencies is shown in U.S. dollars.
CURRENCY EXPOSURE OCTOBER 31, 2021 % OF TOTAL VALUE INVESTMENTS
US Dollar $ 88,142,411 28.0%
European Monetary Unit 83,207,301 26.5%
Japanese Yen 27,033,045 8.6%
Hong Kong Dollar 20,030,122 6.4%
Indian Rupee 17,296,734 5.5%
Canadian Dollar 17,205,967 5.5%
British Pound Sterling 13,515,589 4.3%
Australian Dollar 11,272,697 3.6%
New Taiwan Dollar 10,037,197 3.2%
Danish Krone 9,398,573 3.0%
Swiss Franc 7,693,264 2.4%
Norwegian Krone 5,180,020 1.6%
Swedish Krona 4,359,879 1.4%
Total Investments $314,372,799 100.0%
Currency exposure may vary over time.
See accompanying Notes to Schedule of Investments

137www.calamos.com
Evolving World Growth Fund Schedule of Investments October 31, 2021
PRINCIPAL AMOUNT VALUE
NUMBER OF SHARES VALUE
CONVERTIBLE BONDS (14.2%)Communication Services (5.9%)
4,800,000 Kakao Corp.0.000%, 04/28/23 $ 6,344,112
26,498,000 Sea, Ltd.0.250%, 09/15/26 27,895,769
34,239,881
Consumer Discretionary (2.2%)12,900,000 Meituan
0.000%, 04/27/28 12,934,572
Financials (4.9%) Citigroup Global Markets Funding Luxembourg SCA 69,000,000 HKD 0.000%, 05/28/24 9,664,96745,000,000 HKD 0.000%, 07/25/24 6,293,17510,600,000 JPMorgan Chase Bank NA
0.000%, 08/07/22 12,390,976 28,349,118
Real Estate (1.2%) 6,600,000 Vingroup, JSC
3.000%, 04/20/26 7,042,926
TOTAL CONVERTIBLE BONDS(Cost $80,764,680) 82,566,497
NUMBER OF SHARES VALUE
COMMON STOCKS (83.0%)Communication Services (7.4%)
70,400 PHP Globe Telecom, Inc. 4,184,059 59,000 INR Info Edge India, Ltd. 4,820,772 324,500 ZAR MTN Group, Ltd.# 2,909,833 14,555 KRW NAVER Corp. 5,060,520 84,482 INR Nazara Technologies, Ltd.# 3,015,435 375,300 HKD Tencent Holdings, Ltd. 22,829,421 42,820,040
Consumer Discretionary (14.0%) 473,100 HKD Alibaba Group Holding, Ltd.# 9,728,193 62,935 Alibaba Group Holding, Ltd.# 10,380,499 2,973,900 MXN Alsea, SAB de CV# 6,283,498 100,000 CNY BYD Company, Ltd. - Class A 4,887,571 86,250 INR Dixon Technologies India, Ltd. 5,739,343 2,248,500 INR Indian Hotels Company, Ltd. 6,011,300 212,250 HKD JD.com, Inc. - Class A# 8,308,947 73,300 INR Jubilant Foodworks, Ltd. 3,629,345 869,100 HKD Li Ning Company, Ltd. 9,590,568 4,076 MercadoLibre, Inc.# 6,036,638 3,110,700 HKD Samsonite International, SA#* 6,691,146 131,800 INR Titan Company, Ltd. 4,225,588 81,512,636
Consumer Staples (3.6%) 48,300 PLN Dino Polska, SA#* $ 4,314,694 675,000 BRL JBS, SA 4,670,391 380,100 INR Varun Beverages, Ltd. 4,316,171 2,222,000 MXN Wal-Mart de Mexico, SAB de CV 7,741,600 21,042,856
Energy (5.1%) 1,713,800 INR Coal India, Ltd. 3,777,351 89,000 Lukoil, PJSC 9,071,845 2,122,900 INR Oil & Natural Gas Corp, Ltd. 4,251,360 248,660 INR Reliance Industries, Ltd. 8,450,793 2,436,200 IDR United Tractors Tbk PT 4,052,643 29,603,992
Financials (21.8%)13,984,500 IDR Bank Central Asia, Tbk PT 7,394,686 4,118,000 IDR Bank Jago, Tbk PT# 4,506,573 2,958,000 TWD Cathay Financial Holding Company, Ltd. 6,165,928 560,200 TWD Chailease Holding Company, Ltd. 5,365,343 849,500 HKD China Merchants Bank Company,
Ltd. - Class H 7,118,928 1,868,700 ZAR FirstRand, Ltd.^ 7,098,581 785,000 MXN Grupo Financiero Banorte,
SAB de CV - Class O 4,962,109 126,500 KRW Hana Financial Group, Inc. 4,877,818 949,800 INR HDFC Bank, Ltd. 20,184,601 177,500 INR Housing Development Finance
Corp., Ltd. 6,759,870 681,675 ICICI Bank, Ltd.^ 14,417,426 128,000 INR ICICI Securities, Ltd.* 1,270,754 1,596,300 Itau Unibanco Holding, SA^ 6,496,941 1,552,000 THB Kasikornbank PCL 6,557,852 94,500 HUF OTP Bank Nyrt# 5,678,260 421,800 Sberbank of Russia, PJSC 8,469,744 359,400 INR SBI Cards & Payment Services, Ltd.# 5,121,345 121,500 KRW Shinhan Financial Group
Company, Ltd. 3,966,600 126,413,359
Health Care (1.1%) 410,000 HKD Wuxi Biologics Cayman, Inc.#* 6,210,250
Industrials (6.2%) 65,700 CNY Contemporary Amperex Technology
Company, Ltd. - Class A 6,581,303 1,817,500 PHP International Container Terminal
Services, Inc. 6,489,784 1,066,101 CNY NARI Technology Company, Ltd. - Class A 6,491,406 165,375 CNY Sungrow Power Supply Company,
Ltd. - Class A 4,250,723
See accompanying Notes to Schedule of Investments

138 CALAMOS OPEN-END FAMILY OF FUNDS ANNUAL REPORT
Evolving World Growth Fund Schedule of Investments October 31, 2021
NUMBER OF SHARES VALUE
NUMBER OF CONTRACTS/ NOTIONAL AMOUNT VALUE 388,500 HKD Techtronic Industries Company, Ltd. $ 7,981,830
261,300 INR Voltas, Ltd. 4,201,740 35,996,786
Information Technology (16.3%) 7,360 EUR ASML Holding, NV 5,982,941 62,000 TWD eMemory Technology, Inc. 5,150,061 24,075 Globant, SA# 7,684,499 280,300 Infosys, Ltd. 6,245,084 146,000 TWD MediaTek, Inc. 4,805,252 29,090 NVIDIA Corp. 7,437,440 41,000 TWD Silergy Corp. 6,773,410 1,933,649 TWD Taiwan Semiconductor
Manufacturing Company, Ltd. 41,032,592 56,075 Taiwan Semiconductor Manufacturing
Company, Ltd. (ADR) 6,375,728 488,125 BRL TOTVS, SA 2,833,370 94,320,377
Materials (5.0%) 112,000 INR Asian Paints, Ltd. 4,653,480 591,200 Cemex, SAB de CV# 3,801,416 278,400 CAD First Quantum Minerals, Ltd.^ 6,591,080 712,700 NOK Norsk Hydro, ASA 5,235,113 11,300 KRW POSCO 2,866,037 336,200 INR Tata Steel, Ltd. 5,935,138 29,082,264
Real Estate (2.5%) 7,140,800 PHP Ayala Land, Inc. 4,972,071 618,200 INR DLF, Ltd. 3,309,130 208,400 INR Godrej Properties, Ltd.# 6,243,697 14,524,898
TOTAL COMMON STOCKS(Cost $388,067,278) 481,527,458
NUMBER OF CONTRACTS/ NOTIONAL AMOUNT VALUE
PURCHASED OPTIONS (2.6%)#Communication Services (1.0%)
845 Sea, Ltd. 29,031,665 Call, 06/17/22, Strike $340.00 4,273,588 1,895 Yandex, NV 15,698,180 Call, 05/20/22, Strike $80.00 1,762,350 6,035,938
Information Technology (0.2%) 6,270 Kraneshares Csi China Internet 29,932,980 Call, 01/21/22, Strike $52.00 1,319,835
Other (1.4%) 15,570 iShares China Large-Cap ETF 62,793,810 Call, 01/21/22, Strike $42.00 $ 1,502,505 11,670 iShares MSCI Emerging Markets 59,423,640 Put, 01/21/22, Strike $51.00 2,433,195 12,300 iShares MSCI India ETF 60,073,200 Put, 11/19/21, Strike $50.00 1,906,500 4,585 iShares MSCI South Korea ETF 36,446,165 Call, 01/21/22, Strike $82.00 882,612 12,000 Xtrackers Harvest CSI 300 China A ETF 46,512,000 Call, 01/21/22, Strike $40.00 1,092,000 7,816,812
TOTAL PURCHASED OPTIONS(Cost $16,519,910) 15,172,585
NUMBER OF SHARES/ PRINCIPAL AMOUNT VALUE
INVESTMENT OF CASH COLLATERAL FOR SECURITIES LOANED (2.7%)
15,402,702 State Street Navigator Securities Lending Government Money Market Portfolio†(Cost $15,402,702) 15,402,702
TOTAL INVESTMENTS (102.5%)(Cost $500,754,570) 594,669,242
PAYABLE UPON RETURN OF SECURITIES ON LOAN (-2.7%) (15,402,702)
OTHER ASSETS, LESS LIABILITIES (0.2%) 730,552
NET ASSETS (100.0%) $579,997,092
NOTES TO SCHEDULE OF INVESTMENTS# Non-income producing security.
* Securities issued and sold pursuant to a Rule 144A transaction areexempted from the registration requirement of the Securities Act of 1933,as amended. These securities may only be sold to qualified institutionalbuyers (“QIBs”), such as the Fund. Any resale of these securities mustgenerally be effected through a sale that is registered under the Act orotherwise exempted from such registration requirements.
^ Security, or portion of security, is on loan.
† Represents investment of cash collateral received from securities on loanas of October 31, 2021.
See accompanying Notes to Schedule of Investments

139www.calamos.com
Evolving World Growth Fund Schedule of Investments October 31, 2021
FOREIGN CURRENCY ABBREVIATIONSBRL Brazilian RealCAD Canadian DollarCNY Chinese Yuan RenminbiEUR European Monetary UnitHKD Hong Kong DollarHUF Hungarian ForintIDR Indonesian RupiahINR Indian RupeeKRW South Korean WonMXN Mexican PesoNOK Norwegian KronePHP Philippine PesoPLN Polish ZlotyTHB Thai BahtTWD New Taiwan DollarZAR South African Rand
Note: Value for securities denominated in foreign currencies is shown in U.S. dollars. Theprincipal amount for such securities is shown in the respective foreign currency. The date onoptions represents the expiration date of the option contract. The option contract may beexercised at any date on or before the date shown.
CURRENCY EXPOSURE OCTOBER 31, 2021 % OF TOTAL VALUE INVESTMENTS
US Dollar $183,600,902 30.9%
Indian Rupee 105,917,213 17.8%
Hong Kong Dollar 94,417,425 15.9%
New Taiwan Dollar 69,292,586 11.6%
Chinese Yuan Renminbi 22,211,003 3.7%
Mexican Peso 18,987,207 3.2%
South Korean Won 16,770,975 2.8%
Indonesian Rupiah 15,953,902 2.7%
Philippine Peso 15,645,914 2.6%
South African Rand 10,008,414 1.7%
Brazilian Real 7,503,761 1.3%
Canadian Dollar 6,591,080 1.1%
Thai Baht 6,557,852 1.1%
European Monetary Unit 5,982,941 1.0%
Hungarian Forint 5,678,260 1.0%
Norwegian Krone 5,235,113 0.9%
Polish Zloty 4,314,694 0.7%
Total Investments $594,669,242 100.0%
Currency exposure may vary over time.
See accompanying Notes to Schedule of Investments

140 CALAMOS OPEN-END FAMILY OF FUNDS ANNUAL REPORT
Global Equity Fund Schedule of Investments October 31, 2021
NUMBER OF SHARES VALUE
NUMBER OF SHARES VALUE
COMMON STOCKS (98.9%)Communication Services (8.9%)
1,210 Alphabet, Inc. - Class A# $ 3,582,713 4,885 Meta Platforms, Inc. - Class A# 1,580,640 8,227 Sea, Ltd.# 2,826,550 35,000 HKD Tencent Holdings, Ltd. 2,129,043 12,539 Walt Disney Company# 2,119,969 12,238,915
Consumer Discretionary (15.5%) 8,785 Alibaba Group Holding, Ltd.# 1,448,998 1,275 Amazon.com, Inc.#~ 4,299,848 12,655 Aptiv, PLC# 2,187,923 17,280 Caesars Entertainment, Inc.# 1,891,469 1,265 Chipotle Mexican Grill, Inc. - Class A# 2,250,473 14,650 DR Horton, Inc. 1,307,806 33,000 European Wax Center, Inc. - Class A# 1,052,040 31,400 General Motors Company# 1,709,102 157,500 HKD Li Ning Company, Ltd. 1,738,021 4,445 Lululemon Athletica, Inc.# 2,071,414 13,713 Portillo’s, Inc. - Class A# 521,094 710 Tesla, Inc.# 790,940 21,269,128
Consumer Staples (2.3%) 16,100 Celsius Holdings, Inc.# 1,553,972 3,230 Costco Wholesale Corp. 1,587,674 3,141,646
Energy (2.7%) 25,500 CAD Canadian Natural Resources, Ltd. 1,083,791 15,850 Chevron Corp. 1,814,667 4,450 Pioneer Natural Resources Company 832,061 3,730,519
Financials (13.3%) 53,025 Bank of America Corp. 2,533,534 108,290 INR HDFC Bank, Ltd. 2,301,316 15,400 HKD Hong Kong Exchanges & Clearing, Ltd. 927,722 53,000 ICICI Bank, Ltd.^ 1,120,950 134,900 EUR ING Groep, NV 2,046,285 13,250 JPMorgan Chase & Company 2,251,0432,159,933 GBP Lloyds Banking Group, PLC 1,478,217 14,050 Morgan Stanley 1,444,059 1,100 MSCI, Inc. - Class A 731,368 94,800 UBS Group, AG#^ 1,720,620 34,200 Wells Fargo & Company 1,749,672 18,304,786
Health Care (11.4%) 47,475 Alcon, Inc.^ $ 3,957,516 4,600 Danaher Corp. 1,434,142 6,700 Eli Lilly & Company 1,706,892 12,400 Horizon Therapeutics, PLC# 1,486,884 4,000 IQVIA Holdings, Inc.# 1,045,680 2,220 CHF Lonza Group, AG 1,824,397 18,750 Novo Nordisk, A/S 2,064,938 1,920 UnitedHealth Group, Inc. 884,102 79,000 HKD Wuxi Biologics Cayman, Inc.#* 1,196,609 15,601,160
Industrials (7.2%) 29,400 EUR Deutsche Post, AG 1,820,065 9,000 JPY Nidec Corp. 996,821 26,600 Quanta Services, Inc. 3,226,048 29,600 JPY Recruit Holdings Company, Ltd. 1,968,962 10,750 EUR Schneider Electric, SE 1,853,494 9,865,390
Information Technology (31.5%) 4,650 Accenture, PLC - Class A 1,668,373 2,780 Adobe, Inc.# 1,808,001 879 EUR Adyen, NV#* 2,652,215 21,050 Apple, Inc. 3,153,290 5,678 EUR ASML Holding, NV 4,615,644 2,550 Bill.com Holdings, Inc.# 750,491 8,200 JPY Fujitsu, Ltd. 1,417,203 4,700 JPY Keyence Corp. 2,836,989 1,730 Lam Research Corp. 974,976 4,090 Mastercard, Inc. - Class A 1,372,277 14,320 Microsoft Corp. 4,748,798 21,480 NVIDIA Corp. 5,491,792 6,085 PayPal Holdings, Inc.# 1,415,310 2,090 ServiceNow, Inc.# 1,458,318 1,180 Shopify, Inc. - Class A# 1,730,741 4,750 SiTime Corp.# 1,258,228 124,000 TWD Taiwan Semiconductor Manufacturing Company, Ltd. 2,631,316 20,800 Taiwan Semiconductor Manufacturing Company, Ltd. (ADR) 2,364,960 24,000 AUD WiseTech Global, Ltd. 935,371 43,284,293
Materials (4.8%) 4,350 Albemarle Corp. 1,089,545 39,375 EUR ArcelorMittal, SA 1,331,668 199,000 Cemex, SAB de CV# 1,279,570
See accompanying Notes to Schedule of Investments

www.calamos.com 141
Global Equity Fund Schedule of Investments October 31, 2021
NUMBER OF SHARES VALUE
36,100 Freeport-McMoRan, Inc. $ 1,361,692 27,800 AUD James Hardie Industries, PLC 1,092,156 28,400 INR Tata Steel, Ltd. 501,362 6,655,993
Real Estate (1.3%) 59,750 INR Godrej Properties, Ltd.# 1,790,120
TOTAL COMMON STOCKS(Cost $80,552,868) 135,881,950
NUMBER OF SHARES/ PRINCIPAL AMOUNT VALUE
INVESTMENT OF CASH COLLATERAL FOR SECURITIES LOANED (1.8%)
2,471,810 State Street Navigator Securities Lending Government Money Market Portfolio† (Cost $2,471,810) 2,471,810
TOTAL INVESTMENTS (100.7%)(Cost $83,024,678) 138,353,760
PAYABLE UPON RETURN OF SECURITIES ON LOAN (-1.8%) (2,471,810)
OTHER ASSETS, LESS LIABILITIES (1.1%) 1,544,270
NET ASSETS (100.0%) $137,426,220
FORWARD FOREIGN CURRENCY CONTRACTS
LONG SETTLEMENT LOCAL CURRENT UNREALIZEDCOUNTERPARTY CONTRACTS DATE CURRENCY VALUE GAIN/LOSS
State Street Bank and British Trust Pound Sterling 12/30/21 2,035,000 $2,785,837 $1,350
$1,350
NOTES TO SCHEDULE OF INVESTMENTS# Non-income producing security.
~ Security, or portion of security, is segregated as collateral (or collateral forpotential future transactions) for written options. The aggregate value ofsuch securities is $16,862.
^ Security, or portion of security, is on loan.
* Securities issued and sold pursuant to a Rule 144A transaction areexempted from the registration requirement of the Securities Act of 1933,as amended. These securities may only be sold to qualified institutionalbuyers (“QIBs”), such as the Fund. Any resale of these securities mustgenerally be effected through a sale that is registered under the Act orotherwise exempted from such registration requirements.
† Represents investment of cash collateral received from securities on loanas of October 31, 2021.
FOREIGN CURRENCY ABBREVIATIONSAUD Australian DollarCAD Canadian DollarCHF Swiss FrancEUR European Monetary UnitGBP British Pound SterlingHKD Hong Kong DollarINR Indian RupeeJPY Japanese YenTWD New Taiwan Dollar
Note: Value for securities denominated in foreign currencies is shown in U.S. dollars.
CURRENCY EXPOSURE OCTOBER 31, 2021 % OF TOTAL VALUE INVESTMENTS
US Dollar $ 97,184,973 70.2%
European Monetary Unit 14,319,371 10.4%
Japanese Yen 7,219,975 5.2%
Hong Kong Dollar 5,991,395 4.3%
Indian Rupee 4,592,798 3.3%
New Taiwan Dollar 2,631,316 1.9%
Australian Dollar 2,027,527 1.5%
Swiss Franc 1,824,397 1.3%
British Pound Sterling 1,478,217 1.1%
Canadian Dollar 1,083,791 0.8%
Total Investments $138,353,760 100.0%
Currency exposure may vary over time.
See accompanying Notes to Schedule of Investments

142 CALAMOS OPEN-END FAMILY OF FUNDS ANNUAL REPORT
PRINCIPAL AMOUNT VALUE
PRINCIPAL AMOUNT VALUE
CONVERTIBLE BONDS (26.0%)Communication Services (5.4%)
1,333,000 Eventbrite, Inc.* 0.750%, 09/15/26 $ 1,371,950 2,460,000 Liberty Media Corp.* 0.500%, 12/01/50 3,142,232 Live Nation Entertainment, Inc. 1,100,000 2.000%, 02/15/25 1,338,634 735,000 2.500%, 03/15/23 1,152,017 Sea, Ltd. 5,125,000 0.250%, 09/15/26 5,395,344 710,000 2.375%, 12/01/25 2,709,452 15,109,629
Consumer Discretionary (9.1%) 1,320,000 Airbnb, Inc.* 0.000%, 03/15/26 1,298,154 1,265,000 Booking Holdings, Inc.^ 0.750%, 05/01/25 1,879,562 9,931,000 Ford Motor Company* 0.000%, 03/15/26 11,712,621 2,875,000 Marriott Vacations Worldwide Corp.* 0.000%, 01/15/26 3,241,218 139,000 Tesla, Inc. 2.375%, 03/15/22 2,361,382 4,791,000 Vail Resorts, Inc.* 0.000%, 01/01/26 5,266,411 25,759,348
Consumer Staples (0.8%) Premium Brands Holdings Corp. 1,330,000 CAD 4.200%, 09/30/27 1,210,702 918,000 CAD 4.600%, 12/31/23 936,114 2,146,816
Energy (0.9%) 2,600,000 TotalEnergies, SE
0.500%, 12/02/22 2,668,120
Financials (1.5%) 18,000,000 HKD Citigroup Global Markets Funding Luxembourg SCA 0.000%, 05/28/24 2,521,296 1,840,000 Realogy Group, LLC / Realogy Co-Issuer Corp.*^ 0.250%, 06/15/26 1,873,046 4,394,342
Health Care (0.7%)180,000,000 JPY Menicon Company, Ltd.
0.000%, 01/29/25 1,959,430
Industrials (2.2%)200,000,000 JPY DMG Mori Company, Ltd. 0.000%, 07/16/24 1,865,497
1,300,000 EUR Duerr, AG 0.750%, 01/15/26 $ 1,978,736 2,365,000 JetBlue Airways Corp.* 0.500%, 04/01/26 2,287,830 6,132,063
Information Technology (4.9%) 1,898,000 Bill.com Holdings, Inc.* 0.000%, 04/01/27 2,040,084 3,540,000 Cloudflare, Inc.* 0.000%, 08/15/26 4,467,516 1,555,000 CyberArk Software, Ltd. 0.000%, 11/15/24 2,015,451 1,185,000 ON Semiconductor Corp.*^ 0.000%, 05/01/27 1,437,535 1,055,000 Shopify, Inc. 0.125%, 11/01/25 1,336,506 2,015,000 Square, Inc.*^ 0.250%, 11/01/27 2,464,647 13,761,739
Materials (0.5%) 1,050,000 Ivanhoe Mines, Ltd.*
2.500%, 04/15/26 1,366,921
TOTAL CONVERTIBLE BONDS(Cost $64,568,975) 73,298,408
NUMBER OF SHARES VALUE
CONVERTIBLE PREFERRED STOCKS (6.2%)Consumer Discretionary (1.5%)
22,122 Aptiv, PLC5.500%, 06/15/23 4,273,970
Financials (0.9%) 24,300 KKR & Company, Inc.^
6.000%, 09/15/23 2,430,972
Health Care (1.9%) 2,620 Danaher Corp.
4.750%, 04/15/22 5,463,355
Information Technology (0.8%) 1,255 Broadcom, Inc.
8.000%, 09/30/22 2,105,062
Utilities (1.1%) 11,700 AES Corp. 6.875%, 02/15/24 1,181,817 32,389 NextEra Energy, Inc. 4.872%, 09/01/22 2,047,633 3,229,450
TOTAL CONVERTIBLE PREFERRED STOCKS(Cost $11,074,602) 17,502,809
See accompanying Notes to Schedule of Investments
Global Opportunities Fund Schedule of Investments October 31, 2021
(formerly, Global Growth and Income Fund)

143www.calamos.com
NUMBER OF SHARES VALUE
NUMBER OF SHARES VALUE
COMMON STOCKS (62.7%)Communication Services (3.5%)
7,300 Meta Platforms, Inc.# $ 2,362,061 56,300 HKD Tencent Holdings, Ltd. 3,424,717 24,280 Walt Disney Company#~ 4,105,020 9,891,798
Consumer Discretionary (4.3%) 8,500 Alibaba Group Holding, Ltd.# 1,401,990 400 Amazon.com, Inc.# 1,348,972 1,400 Chipotle Mexican Grill, Inc.# 2,490,642 21,232 DR Horton, Inc. 1,895,381 17,400 Global-e Online, Ltd.# 1,006,764 6,200 Lululemon Athletica, Inc.# 2,889,262 27,384 Portillo’s Inc - Class A# 1,040,592 12,073,603
Consumer Staples (3.8%) 20,000 Celsius Holdings, Inc.# 1,930,400 58,250 Coca-Cola Company~ 3,283,552 6,090 Costco Wholesale Corp. 2,993,479 40,300 Mondelez International, Inc. - Class A 2,447,822 10,655,253
Energy (2.7%) 65,900 CAD Canadian Natural Resources, Ltd. 2,800,857 29,500 Chevron Corp. 3,377,455 57,400 GBP Royal Dutch Shell, PLC 1,314,969 7,493,281
Financials (10.6%) 100,510 Bank of America Corp.~ 4,802,368 174,800 INR HDFC Bank, Ltd. 3,714,748 264,300 EUR ING Groep, NV 4,009,141 32,525 JPMorgan Chase & Company~ 5,525,672 34,550 Morgan Stanley 3,551,049 188,000 UBS Group, AG^# 3,412,200 96,300 Wells Fargo & Company 4,926,708 29,941,886
Health Care (7.2%) 101,986 Alcon, Inc.^ 8,501,553 11,500 Eli Lilly & Company 2,929,740 2,500 CHF Lonza Group, AG 2,054,501 42,100 Novo Nordisk, A/S 4,636,473 4,650 UnitedHealth Group, Inc. 2,141,185 20,263,452
Industrials (6.4%) 41,000 CAE, Inc.^# 1,245,170 8,500 Caterpillar, Inc. 1,734,085 31,300 EUR Deutsche Post, AG 1,937,688
29,500 Quanta Services, Inc. $ 3,577,760 34,300 JPY Recruit Holdings Company, Ltd. 2,281,602 24,850 EUR Schneider Electric, SE 4,284,589 18,700 Waste Management, Inc. 2,996,301 18,057,195
Information Technology (20.8%) 8,600 Accenture, PLC - Class A 3,085,594 1,350 EUR Adyen, NV*# 4,073,367 40,040 Apple, Inc. 5,997,992 10,830 EUR ASML Holding, NV 8,803,703 15,300 JPY Fujitsu, Ltd. 2,644,294 9,000 JPY Keyence Corp. 5,432,533 27,980 Microsoft Corp.~ 9,278,728 24,800 NVIDIA Corp. 6,340,616 31,010 Oracle Corp. 2,975,099 374,000 TWD Taiwan Semiconductor Manufacturing Company, Ltd. 7,936,388 6,000 Taiwan Semiconductor Manufacturing Company, Ltd. (ADR) 682,200 33,500 AUD WiseTech Global, Ltd. 1,305,622 58,556,136
Materials (3.4%) 82,300 EUR ArcelorMittal, SA 2,783,397 254,800 Cemex, SAB de CV# 1,638,364 49,900 EUR CRH, PLC 2,387,906 74,700 Freeport-McMoRan, Inc. 2,817,684 9,627,351
TOTAL COMMON STOCKS(Cost $117,025,539) 176,559,955
NUMBER OFCONTRACTS/ NOTIONAL AMOUNT VALUE
PURCHASED OPTIONS (2.7%)#Communication Services (1.6%)
28 Alphabet, Inc. 8,290,576 Call, 01/21/22, Strike $1,500.00 4,093,040 37 Netflix, Inc. 2,554,147 Call, 03/18/22, Strike $640.00 301,642 4,394,682
Consumer Discretionary (0.7%) 21 Amazon.com, Inc. 7,082,103 Call, 01/21/22, Strike $2,500.00 1,852,358
Health Care (0.1%) 170 Horizon Therapeutics, PLC 2,038,470 Call, 01/21/22, Strike $110.00 240,550
See accompanying Notes to Schedule of Investments
Global Opportunities Fund Schedule of Investments October 31, 2021
(formerly, Global Growth and Income Fund)

144 CALAMOS OPEN-END FAMILY OF FUNDS ANNUAL REPORT
Global Opportunities Fund Schedule of Investments October 31, 2021
(formerly, Global Growth and Income Fund)
See accompanying Notes to Schedule of Investments
NUMBER OFCONTRACTS/ NOTIONAL AMOUNT VALUE
Information Technology (0.2%) 45 Adobe, Inc. 2,926,620 Call, 01/21/22, Strike $600.00 $ 295,313 40 ServiceNow, Inc. 2,791,040 Call, 01/21/22, Strike $620.00 358,600 653,913
Other (0.1%) 355 Invesco QQQ Trust Series 13,706,905 Put, 12/31/21, Strike $360.00 165,430 595 iShares Russell 2000 ETF 13,568,975 Put, 12/31/21, Strike $216.00 234,430 399,860
TOTAL PURCHASED OPTIONS(Cost $2,955,926) 7,541,363
NUMBER OF SHARES/ PRINCIPAL AMOUNT VALUE
INVESTMENT OF CASH COLLATERAL FOR SECURITIES LOANED (5.4%)
15,303,187 State Street Navigator Securities Lending Government Money Market Portfolio†(Cost $15,303,187) 15,303,187
TOTAL INVESTMENTS (103.0%)(Cost $210,928,229) 290,205,722
PAYABLE UPON RETURN OF SECURITIES ON LOAN (-5.4%) (15,303,187)
OTHER ASSETS, LESS LIABILITIES (2.4%) 6,986,305
NET ASSETS (100.0%) $281,888,840
NOTES TO SCHEDULE OF INVESTMENTS* Securities issued and sold pursuant to a Rule 144A transaction are
exempted from the registration requirement of the Securities Act of 1933,as amended. These securities may only be sold to qualified institutionalbuyers (“QIBs”), such as the Fund. Any resale of these securities mustgenerally be effected through a sale that is registered under the Act orotherwise exempted from such registration requirements.
^ Security, or portion of security, is on loan.
# Non-income producing security.
~ Security, or portion of security, is segregated as collateral (or collateral forpotential future transactions) for written options. The aggregate value ofsuch securities is $3,342,808.
† Represents investment of cash collateral received from securities on loanas of October 31, 2021.
FOREIGN CURRENCY ABBREVIATIONSAUD Australian DollarCAD Canadian DollarCHF Swiss FrancEUR European Monetary UnitGBP British Pound SterlingHKD Hong Kong DollarINR Indian RupeeJPY Japanese YenTWD New Taiwan Dollar
Note: Value for securities denominated in foreign currencies is shown in U.S. dollars. Theprincipal amount for such securities is shown in the respective foreign currency. The date onoptions represents the expiration date of the option contract. The option contract may beexercised at any date on or before the date shown.
CURRENCY EXPOSURE OCTOBER 31, 2021 % OF TOTAL VALUE INVESTMENTS
US Dollar $218,543,925 75.3%
European Monetary Unit 30,258,527 10.4%
Japanese Yen 14,183,356 4.9%
New Taiwan Dollar 7,936,388 2.7%
Hong Kong Dollar 5,946,013 2.0%
Canadian Dollar 4,947,673 1.7%
Indian Rupee 3,714,748 1.3%
Swiss Franc 2,054,501 0.7%
British Pound Sterling 1,314,969 0.5%
Australian Dollar 1,305,622 0.5%
Total Investments $290,205,722 100.0%
Currency exposure may vary over time.

145www.calamos.com
Total Return Bond Fund Schedule of Investments October 31, 2021
PRINCIPAL AMOUNT VALUE
PRINCIPAL AMOUNT VALUE
CORPORATE BONDS (50.4%)Airlines (2.3%)
218,914 Air Canada Pass Through Trust Series 2015-1, Class B* 3.875%, 09/15/24 $ 220,766 113,834 Air Canada Pass Through Trust Series 2015-2, Class AA* 3.750%, 06/15/29 118,715 198,147 Alaska Airlines Pass Through Trust Series 2020-1, Class A* 4.800%, 02/15/29 220,161 86,473 Alaska Airlines Pass Through Trust Series 2020-1, Class B* 8.000%, 02/15/27 97,470 130,149 British Airways Pass Through Trust Series 2019-1, Class A* 3.350%, 12/15/30 129,774 140,855 JetBlue Pass Through Trust Series 2019-1, Class AA 2.750%, 11/15/33 144,113 166,818 JetBlue Pass Through Trust Series 2020-1, Class B 7.750%, 05/15/30 196,162 75,000 Spirit Loyalty Cayman, Ltd. / Spirit IP Cayman, Ltd.* 8.000%, 09/20/25 84,035 69,569 United Airlines Pass Through Trust Series 2007-1 6.636%, 01/02/24 71,425 111,169 United Airlines Pass Through Trust Series 2014-2, Class B 4.625%, 03/03/24 113,871 145,624 United Airlines Pass Through Trust Series 2018-1, Class B 4.600%, 09/01/27 149,353 1,545,845
Communication Services (2.4%) 150,000 Cogent Communications Group, Inc.* 3.500%, 05/01/26 152,148 250,000 Comcast Corp. 3.900%, 03/01/38 283,945 110,000 Crown Castle Towers, LLC* 3.720%, 07/15/43 112,509 175,000 Electronic Arts, Inc. 4.800%, 03/01/26 197,640 110,000 Hughes Satellite Systems Corp. 5.250%, 08/01/26 122,991 250,000 NTT Finance Corp.* 1.591%, 04/03/28 245,608 105,000 Sirius XM Radio, Inc.* 3.125%, 09/01/26 105,344 100,000 United States Cellular Corp. 6.700%, 12/15/33 124,500
255,000 Verizon Communications, Inc. 4.016%, 12/03/29 $ 286,429 1,631,114
Consumer Discretionary (3.0%) 150,000 American Honda Finance Corp. 2.350%, 01/08/27 155,309 130,000 Delta Air Lines Pass Through Trust Series 2019-1, Class AA 3.204%, 10/25/25 135,387 200,000 Ford Motor Credit Company, LLC 4.000%, 11/13/30 208,990 100,000 goeasy, Ltd.*^ 4.375%, 05/01/26 102,954 250,000 Home Depot, Inc.^ 2.800%, 09/14/27 266,415 100,000 M/I Homes, Inc.* 3.950%, 02/15/30 98,871 250,000 Mattel, Inc.* 3.375%, 04/01/26 258,122 125,000 MGM Resorts International 6.000%, 03/15/23 132,235 200,000 Newell Brands, Inc. 4.700%, 04/01/26 219,222 100,000 NIKE, Inc. 2.850%, 03/27/30 107,207 125,000 Nordstrom, Inc. 2.300%, 04/08/24 125,710 200,000 Toll Brothers Finance Corp. 4.350%, 02/15/28 218,712 2,029,134
Consumer Staples (2.1%) 250,000 Anheuser-Busch InBev Worldwide, Inc. 3.500%, 06/01/30 273,932 250,000 Archer-Daniels-Midland Company 3.250%, 03/27/30 273,145 250,000 Costco Wholesale Corp. 1.600%, 04/20/30 243,603 175,000 Edgewell Personal Care Company* 4.125%, 04/01/29 172,907 250,000 Hershey Company^ 1.700%, 06/01/30 245,950 200,000 Kimberly-Clark Corp.^ 3.100%, 03/26/30 217,556 1,427,093
Energy (0.4%) 175,000 Energy Transfer, LP‡ 3.149%, 11/01/66 3 mo. USD LIBOR + 3.02% 144,240 150,000 EQT Corp.* 3.125%, 05/15/26 151,389 295,629
See accompanying Notes to Schedule of Investments

146
Total Return Bond Fund Schedule of Investments October 31, 2021
PRINCIPAL AMOUNT VALUE
PRINCIPAL AMOUNT VALUE
Financials (20.0%) 115,000 Ally Financial, Inc.‡ 4.700%, 05/15/26 5 year CMT + 3.87% $ 119,338 250,000 American Express Company 3.000%, 10/30/24 264,385 200,000 American Finance Trust, Inc. / American Finance Operating Partner, LP* 4.500%, 09/30/28 200,258 150,000 Ares Capital Corp. 3.250%, 07/15/25 156,077 200,000 Aviation Capital Group, LLC* 3.500%, 11/01/27 208,936 250,000 AXIS Specialty Finance, PLC 4.000%, 12/06/27 276,237 200,000 Bank of America Corp.‡ 2.087%, 06/14/29 SOFR + 1.06% 197,772 75,000 Bank of Montreal‡ 4.800%, 08/25/24 5 year CMT + 2.98% 78,584 150,000 Berkshire Hathaway Finance Corp. 4.250%, 01/15/49 187,446 125,000 BP Capital Markets, PLC^‡ 4.875%, 03/22/30 5 year CMT + 4.40% 135,933 175,000 Brookfield Finance, Inc. 2.724%, 04/15/31 177,616 150,000 Capital One Financial Corp.‡ 2.359%, 07/29/32 SOFR + 1.34% 144,558 150,000 Caterpillar Financial Services Corp. 2.150%, 11/08/24 155,508 200,000 Charles Schwab Corp.^‡ 4.000%, 06/01/26 5 year CMT + 3.17% 206,190 250,000 Citigroup, Inc.‡ 3.875%, 02/18/26 5 year CMT + 3.42% 253,320 250,000 Credit Suisse Group, AG*‡ 1.305%, 02/02/27 SOFR + 0.98% 242,420 200,000 Danske Bank, A/S*‡ 0.976%, 09/10/25 1 year CMT + 0.55% 198,534 150,000 Duke Realty, LP 2.875%, 11/15/29 157,370 200,000 Essential Properties, LP 2.950%, 07/15/31 199,740 200,000 Essex Portfolio, LP 1.700%, 03/01/28 195,156 200,000 Federation des Caisses Desjardins du Quebec* 2.050%, 02/10/25 204,324
200,000 Fifth Third Bancorp 2.550%, 05/05/27 $ 207,618 125,000 Franklin Resources, Inc. 2.850%, 03/30/25 131,831 182,000 Global Net Lease, Inc. / Global Net Lease Operating Partnership, LP* 3.750%, 12/15/27 179,632 125,000 Globe Life, Inc. 4.550%, 09/15/28 143,864 Goldman Sachs Group, Inc.‡ 150,000 3.800%, 05/10/26^ 5 year CMT + 2.97% 150,153 125,000 3.814%, 04/23/29 3 mo. USD LIBOR + 1.16% 136,931 150,000 HAT Holdings I, LLC / HAT Holdings II, LLC* 3.375%, 06/15/26 149,685 250,000 HSBC Holdings, PLC^‡ 4.000%, 03/09/26 5 year CMT + 3.22% 250,652 125,000 Huntington Bancshares, Inc.^‡ 4.450%, 10/15/27 7 year CMT + 4.05% 133,965 200,000 Hyundai Capital America* 1.500%, 06/15/26 195,704 250,000 ILFC E-Capital Trust II*‡ 3.710%, 12/21/65 3 mo. USD LIBOR + 1.80% 214,730 175,000 Iron Mountain, Inc.* 5.250%, 03/15/28 182,872 200,000 Jaguar Holding Company II / Pharmaceutical Product Development, LLC* 4.625%, 06/15/25 208,396 JPMorgan Chase & Company‡ 150,000 3.220%, 03/01/25 3 mo. USD LIBOR + 1.16% 157,295 125,000 3.650%, 06/01/26^ 5 year CMT + 2.85% 124,804 125,000 Life Storage, LP 4.000%, 06/15/29 139,059 200,000 Lloyds Banking Group, PLC‡ 1.627%, 05/11/27 1 year CMT + 0.85% 197,678 125,000 LPL Holdings, Inc.* 4.000%, 03/15/29 127,953 200,000 LSEGA Financing, PLC* 2.000%, 04/06/28 199,046 300,000 Macquarie Bank, Ltd.*‡ 3.052%, 03/03/36 5 year CMT + 1.70% 296,400 250,000 Markel Corp. 3.500%, 11/01/27 270,592 200,000 MetLife, Inc. 6.400%, 12/15/66 253,854
See accompanying Notes to Schedule of InvestmentsCALAMOS OPEN-END FAMILY OF FUNDS ANNUAL REPORT

147www.calamos.com
Total Return Bond Fund Schedule of Investments October 31, 2021
PRINCIPAL AMOUNT VALUE
PRINCIPAL AMOUNT VALUE
200,000 Morgan Stanley‡ 1.593%, 05/04/27 SOFR + 0.88% $ 198,238 250,000 National Securities Clearing Corp.* 1.500%, 04/23/25 252,432 200,000 NatWest Markets, PLC* 1.600%, 09/29/26 197,550 200,000 Nippon Life Insurance Company*‡ 2.750%, 01/21/51 5 year CMT + 2.65% 194,942 200,000 Nordea Bank Abp*‡ 3.750%, 03/01/29 5 year CMT + 2.60% 194,336 150,000 Oaktree Specialty Lending Corp. 2.700%, 01/15/27 149,019 118,000 PartnerRe Finance B, LLC‡ 4.500%, 10/01/50 5 year CMT + 3.82% 126,138 150,000 PNC Financial Services Group, Inc. 2.200%, 11/01/24 155,850 250,000 Prologis, LP 2.250%, 04/15/30 252,490 200,000 Prospect Capital Corp. 3.706%, 01/22/26 203,560 125,000 Reinsurance Group of America, Inc. 3.900%, 05/15/29 138,783 250,000 RenaissanceRe Finance, Inc. 3.450%, 07/01/27 269,232 150,000 Rocket Mortgage, LLC / Rocket Mortgage Co-Issuer, Inc.* 2.875%, 10/15/26 149,001 250,000 Royal Bank of Canada 0.875%, 01/20/26 244,087 300,000 SBA Tower Trust* 1.631%, 05/15/51 296,253 200,000 Skandinaviska Enskilda Banken, AB* 1.200%, 09/09/26 197,226 SLM Corp. 250,000 3.125%, 11/02/26 247,962 69,000 4.200%, 10/29/25 73,026 150,000 State Street Corp.‡ 2.354%, 11/01/25 SOFR + 0.94% 155,735 SVB Financial Group 200,000 2.100%, 05/15/28 200,178 125,000 4.000%, 05/15/26‡ 5 year CMT + 3.20% 125,369 250,000 Toronto-Dominion Bank 1.250%, 09/10/26 245,462 250,000 Travelers Companies, Inc. 2.550%, 04/27/50 244,702 150,000 US Bancorp 3.600%, 09/11/24 161,001
200,000 USAA Capital Corp.* 2.125%, 05/01/30 $ 200,442 125,000 Ventas Realty, LP 4.000%, 03/01/28 138,625 150,000 VICI Properties, LP / VICI Note Company, Inc.*^ 3.500%, 02/15/25 153,084 Wells Fargo & Company 125,000 4.400%, 06/14/46 151,493 125,000 3.900%, 03/15/26‡ 5 year CMT + 3.45% 127,495 13,456,127
Health Care (4.0%) 200,000 AbbVie, Inc. 3.800%, 03/15/25 215,460 100,000 Bausch Health Companies, Inc.* 5.500%, 11/01/25 101,795 200,000 Bristol-Myers Squibb Company 3.200%, 06/15/26 216,058 175,000 Charles River Laboratories International, Inc.* 3.750%, 03/15/29 176,935 150,000 CVS Health Corp. 4.780%, 03/25/38 183,876 DaVita, Inc.* 100,000 4.625%, 06/01/30 100,626 23,000 3.750%, 02/15/31 21,818 175,000 Elanco Animal Health, Inc. 5.900%, 08/28/28 204,697 250,000 Health Care Service Corp. A Mutual Legal Reserve Company* 1.500%, 06/01/25 253,300 150,000 Johnson & Johnson 3.400%, 01/15/38 170,053 200,000 Pfizer, Inc. 2.625%, 04/01/30 210,114 200,000 Royalty Pharma, PLC^ 2.200%, 09/02/30 193,920 125,000 Tenet Healthcare Corp.* 4.625%, 09/01/24 128,008 150,000 Teva Pharmaceutical Finance Netherlands III, BV 2.800%, 07/21/23 151,169 120,000 Thermo Fisher Scientific, Inc. 4.133%, 03/25/25 131,064 200,000 Universal Health Services, Inc.* 2.650%, 10/15/30 198,806 2,657,699
Industrials (5.3%) 250,000 3M Company^ 3.700%, 04/15/50 296,092
See accompanying Notes to Schedule of Investments

148
Total Return Bond Fund Schedule of Investments October 31, 2021
PRINCIPAL AMOUNT VALUE
PRINCIPAL AMOUNT VALUE
125,000 Air Lease Corp.^‡ 4.650%, 06/15/26 5 year CMT + 4.08% $ 129,944 150,000 Albertsons Companies, Inc. / Safeway, Inc. / New Albertsons, LP / Albertsons, LLC* 4.625%, 01/15/27 157,152 Avolon Holdings Funding, Ltd.* 250,000 2.125%, 02/21/26 247,203 14,000 2.528%, 11/18/27 13,749 125,000 Beacon Roofing Supply, Inc.* 4.500%, 11/15/26 129,664 175,000 EnerSys* 4.375%, 12/15/27 183,967 150,000 FedEx Corp.^ 2.400%, 05/15/31 150,590 80,000 GXO Logistics, Inc.* 1.650%, 07/15/26 78,670 48,472 Hawaiian Airlines Pass Through Certificates Series 2013-1, Class B 4.950%, 07/15/23 48,488 100,000 Hawaiian Brand Intellectual Property, Ltd. / HawaiianMiles Loyalty, Ltd.* 5.750%, 01/20/26 105,096 250,000 Honeywell International, Inc. 1.950%, 06/01/30 249,722 250,000 Infor, Inc.* 1.750%, 07/15/25 251,590 200,000 Mars, Inc.* 0.875%, 07/16/26 195,218 150,000 Moog, Inc.* 4.250%, 12/15/27 154,880 175,000 QVC, Inc. 4.375%, 09/01/28 179,130 250,000 Roper Technologies, Inc. 1.400%, 09/15/27 243,020 100,000 Sensata Technologies, BV* 5.625%, 11/01/24 110,449 250,000 SMBC Aviation Capital Finance DAC* 1.900%, 10/15/26 249,005 125,000 TransDigm, Inc.* 6.250%, 03/15/26 130,704 250,000 Verisk Analytics, Inc.^ 4.125%, 09/12/22 257,517 3,561,850
Information Technology (4.6%) 250,000 Apple, Inc. 4.375%, 05/13/45 320,160 250,000 Broadcom, Inc. 4.700%, 04/15/25 276,085 125,000 CGI, Inc.* 1.450%, 09/14/26 122,406
250,000 Fortinet, Inc. 2.200%, 03/15/31 $ 247,340 125,000 Hewlett Packard Enterprise Company 4.900%, 10/15/25 140,055 200,000 Intuit, Inc. 0.950%, 07/15/25 198,132 250,000 Mastercard, Inc.^ 3.350%, 03/26/30 276,677 Microsoft Corp. 157,000 4.100%, 02/06/37 192,287 93,000 2.525%, 06/01/50 91,797 250,000 NVIDIA Corp. 3.500%, 04/01/40 279,967 150,000 Square, Inc.* 2.750%, 06/01/26 151,911 175,000 TTM Technologies, Inc.*^ 4.000%, 03/01/29 173,616 200,000 Twilio, Inc. 3.625%, 03/15/29 202,132 250,000 Visa, Inc. 2.050%, 04/15/30 253,628 150,000 VMware, Inc. - Class A 1.800%, 08/15/28 146,267 3,072,460
Materials (0.8%) Clearwater Paper Corp.* 150,000 5.375%, 02/01/25 162,518 100,000 4.750%, 08/15/28 101,837 250,000 Georgia-Pacific, LLC* 3.600%, 03/01/25 268,185 532,540
Real Estate (2.6%) 150,000 EPR Properties 4.950%, 04/15/28 164,593 200,000 Federal Realty Investment Trust 1.250%, 02/15/26 197,868 125,000 Forestar Group, Inc.* 3.850%, 05/15/26 125,154 190,000 Healthpeak Properties, Inc. 3.250%, 07/15/26 203,313 200,000 Public Storage 2.300%, 05/01/31 202,220 200,000 Realty Income Corp. 3.250%, 01/15/31 215,794 Service Properties Trust 125,000 3.950%, 01/15/28 116,950 100,000 5.250%, 02/15/26 101,163 250,000 Simon Property Group, LP 1.375%, 01/15/27 245,665
See accompanying Notes to Schedule of InvestmentsCALAMOS OPEN-END FAMILY OF FUNDS ANNUAL REPORT

149www.calamos.com
Total Return Bond Fund Schedule of Investments October 31, 2021
PRINCIPAL AMOUNT VALUE
PRINCIPAL AMOUNT VALUE
125,000 Tanger Properties, LP^ 3.875%, 07/15/27 $ 134,993 1,707,713
Utilities (2.9%) 150,000 Berkshire Hathaway Energy Company 3.800%, 07/15/48 172,016 200,000 Consolidated Edison Company of New York, Inc. 3.350%, 04/01/30 217,608 200,000 DPL, Inc. 4.125%, 07/01/25 212,142 150,000 Duke Energy Carolinas, LLC 3.700%, 12/01/47 170,397 250,000 Entergy Texas, Inc. 1.500%, 09/01/26 244,462 250,000 Florida Power & Light Company 2.850%, 04/01/25 263,322 175,000 Monongahela Power Company* 3.550%, 05/15/27 189,565 150,000 Northern States Power Company 3.750%, 12/01/47 170,469 150,000 Public Service Electric and Gas Company 3.600%, 12/01/47 172,605 125,000 Southern Company‡ 3.750%, 09/15/51 5 year CMT + 2.92% 127,318 1,939,904
TOTAL CORPORATE BONDS (Cost $32,588,686) 33,857,108
CONVERTIBLE BOND (0.2%)Consumer Discretionary (0.2%)
125,000 DISH Network Corp. 2.375%, 03/15/24 (Cost $118,635) 121,630
BANK LOANS (9.9%)¡Airlines (0.3%)
185,000 AAdvantage Loyalty IP, Ltd.‡ 5.500%, 04/20/28 3 mo. LIBOR + 4.75% 192,921
Communication Services (1.2%) 296,891 Go Daddy Operating Company, LLC‡ 1.837%, 02/15/24 1 mo. LIBOR + 1.75% 295,055 250,000 Nexstar Broadcasting, Inc.‡ 2.582%, 09/18/26 1 mo. LIBOR + 2.50% 249,906
297,692 SBA Senior Finance II, LLC‡ 1.840%, 04/11/25 1 mo. LIBOR + 1.75% $ 295,677 840,638
Consumer Discretionary (0.7%) 247,941 Meredith Corp.‡ 5.250%, 01/31/25 3 mo. LIBOR + 4.25% 253,494 248,750 Murphy USA, Inc.‡ 2.250%, 01/31/28 1 mo. LIBOR + 1.75% 249,566 503,060
Consumer Staples (0.7%) 297,750 Energizer Holdings, Inc.‡ 2.750%, 12/22/27 1 mo. LIBOR + 2.25% 297,610 147,332 United Natural Foods, Inc.‡ 3.587%, 10/22/25 1 mo. LIBOR + 3.50% 147,642 445,252
Energy (0.2%) 124,688 DT Midstream, Inc.‡ 2.500%, 06/26/28 6 mo. LIBOR + 2.00% 125,111
Financials (0.5%) 149,625 Jazz Financing Lux Sarl‡ 4.000%, 05/05/28 1 mo. LIBOR + 3.50% 150,018 168,664 Level 3 Financing, Inc.‡ 1.837%, 03/01/27 1 mo. LIBOR + 1.75% 166,646 316,664
Health Care (2.0%) 264,573 Amneal Pharmaceuticals, LLC‡ 3.625%, 05/04/25 1 mo. LIBOR + 3.50% 262,728 211,777 Avantor, Inc.‡ 2.500%, 11/21/24 1 mo. LIBOR + 2.00% 211,943 298,500 Catalent Pharma Solutions, Inc.‡ 2.500%, 02/22/28 1 mo. LIBOR + 2.00% 299,284 64,838 HCA, Inc.‡ 1.837%, 06/30/28 1 mo. LIBOR + 1.75% 65,317 199,636 Icon Luxembourg Sarl‡ 3.000%, 07/03/28 3 mo. LIBOR + 2.50% 199,885 49,739 Icon Luxembourg Sarl‡ 3.000%, 07/03/28 3 mo. LIBOR + 2.50% 49,801
See accompanying Notes to Schedule of Investments
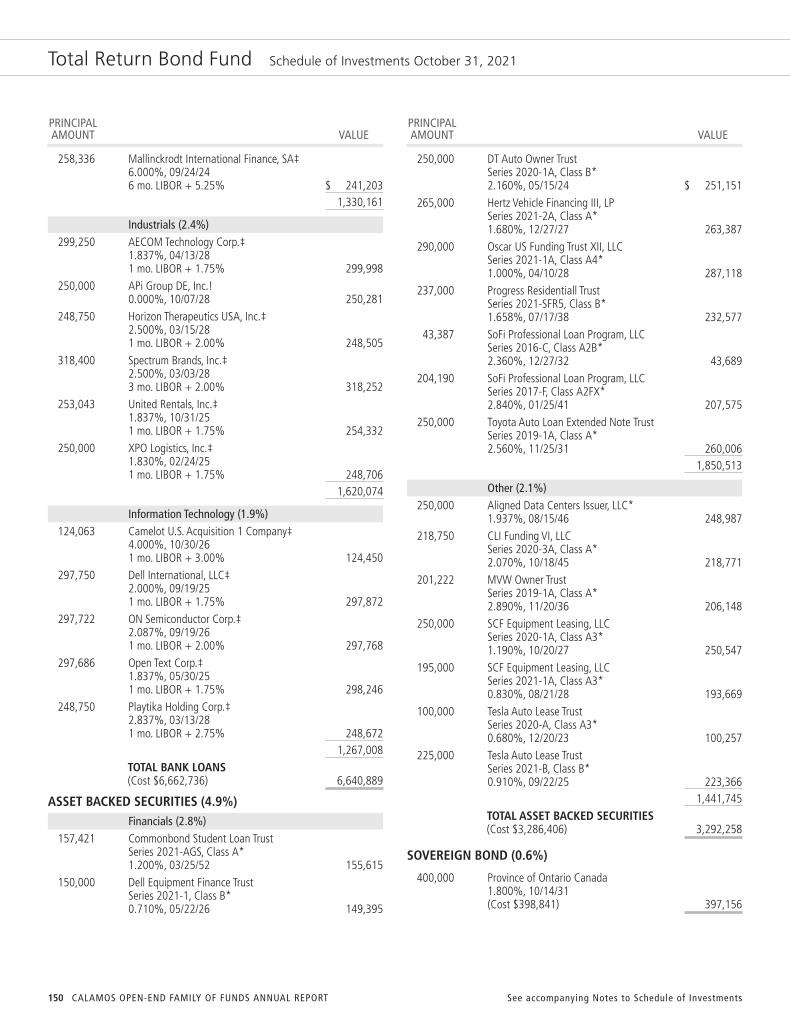
150
Total Return Bond Fund Schedule of Investments October 31, 2021
PRINCIPAL AMOUNT VALUE
PRINCIPAL AMOUNT VALUE
258,336 Mallinckrodt International Finance, SA‡ 6.000%, 09/24/24 6 mo. LIBOR + 5.25% $ 241,203 1,330,161
Industrials (2.4%) 299,250 AECOM Technology Corp.‡ 1.837%, 04/13/28 1 mo. LIBOR + 1.75% 299,998 250,000 APi Group DE, Inc.! 0.000%, 10/07/28 250,281 248,750 Horizon Therapeutics USA, Inc.‡ 2.500%, 03/15/28 1 mo. LIBOR + 2.00% 248,505 318,400 Spectrum Brands, Inc.‡ 2.500%, 03/03/28 3 mo. LIBOR + 2.00% 318,252 253,043 United Rentals, Inc.‡ 1.837%, 10/31/25 1 mo. LIBOR + 1.75% 254,332 250,000 XPO Logistics, Inc.‡ 1.830%, 02/24/25 1 mo. LIBOR + 1.75% 248,706 1,620,074
Information Technology (1.9%) 124,063 Camelot U.S. Acquisition 1 Company‡ 4.000%, 10/30/26 1 mo. LIBOR + 3.00% 124,450 297,750 Dell International, LLC‡ 2.000%, 09/19/25 1 mo. LIBOR + 1.75% 297,872 297,722 ON Semiconductor Corp.‡ 2.087%, 09/19/26 1 mo. LIBOR + 2.00% 297,768 297,686 Open Text Corp.‡ 1.837%, 05/30/25 1 mo. LIBOR + 1.75% 298,246 248,750 Playtika Holding Corp.‡ 2.837%, 03/13/28 1 mo. LIBOR + 2.75% 248,672 1,267,008
TOTAL BANK LOANS(Cost $6,662,736) 6,640,889
ASSET BACKED SECURITIES (4.9%)Financials (2.8%)
157,421 Commonbond Student Loan Trust Series 2021-AGS, Class A* 1.200%, 03/25/52 155,615 150,000 Dell Equipment Finance Trust Series 2021-1, Class B* 0.710%, 05/22/26 149,395
250,000 DT Auto Owner Trust Series 2020-1A, Class B* 2.160%, 05/15/24 $ 251,151 265,000 Hertz Vehicle Financing III, LP Series 2021-2A, Class A* 1.680%, 12/27/27 263,387 290,000 Oscar US Funding Trust XII, LLC Series 2021-1A, Class A4* 1.000%, 04/10/28 287,118 237,000 Progress Residentiall Trust Series 2021-SFR5, Class B* 1.658%, 07/17/38 232,577 43,387 SoFi Professional Loan Program, LLC Series 2016-C, Class A2B* 2.360%, 12/27/32 43,689 204,190 SoFi Professional Loan Program, LLC Series 2017-F, Class A2FX* 2.840%, 01/25/41 207,575 250,000 Toyota Auto Loan Extended Note Trust Series 2019-1A, Class A* 2.560%, 11/25/31 260,006 1,850,513
Other (2.1%) 250,000 Aligned Data Centers Issuer, LLC* 1.937%, 08/15/46 248,987 218,750 CLI Funding VI, LLC Series 2020-3A, Class A* 2.070%, 10/18/45 218,771 201,222 MVW Owner Trust Series 2019-1A, Class A* 2.890%, 11/20/36 206,148 250,000 SCF Equipment Leasing, LLC Series 2020-1A, Class A3* 1.190%, 10/20/27 250,547 195,000 SCF Equipment Leasing, LLC Series 2021-1A, Class A3* 0.830%, 08/21/28 193,669 100,000 Tesla Auto Lease Trust Series 2020-A, Class A3* 0.680%, 12/20/23 100,257 225,000 Tesla Auto Lease Trust Series 2021-B, Class B* 0.910%, 09/22/25 223,366 1,441,745
TOTAL ASSET BACKED SECURITIES(Cost $3,286,406) 3,292,258
SOVEREIGN BOND (0.6%)
400,000 Province of Ontario Canada1.800%, 10/14/31(Cost $398,841) 397,156
See accompanying Notes to Schedule of InvestmentsCALAMOS OPEN-END FAMILY OF FUNDS ANNUAL REPORT

151www.calamos.com
Total Return Bond Fund Schedule of Investments October 31, 2021
PRINCIPAL AMOUNT VALUE
PRINCIPAL AMOUNT VALUE
U.S. GOVERNMENT AND AGENCY SECURITIES (29.8%)
Federal Home Loan Mortgage Corp. Pool 213,681 4.000%, 05/01/49 $ 228,413 127,086 2.500%, 02/01/35 132,100 Federal National Mortgage Association 974,881 2.500%, 07/01/51 1,001,920 963,283 2.000%, 07/01/36 989,342 822,211 2.500%, 04/01/50 844,954 768,665 3.000%, 04/01/50 801,281 715,187 3.500%, 04/01/50 754,954 366,445 3.000%, 07/01/46 386,249 223,814 3.000%, 03/01/47 235,910 216,118 3.500%, 08/01/47 229,671 214,252 3.500%, 11/01/49 226,013 192,592 2.500%, 09/01/31 201,395 168,590 4.000%, 06/01/48 180,375 154,266 3.000%, 02/01/33 162,037 134,477 4.500%, 04/01/48 145,364 117,941 3.500%, 02/01/49 124,857 96,505 3.000%, 07/01/49 100,626 83,297 4.000%, 03/01/47 89,780 82,330 3.000%, 01/01/35 86,358 Government National Mortgage Association II Pool 230,302 3.500%, 10/20/47 242,793 167,125 3.000%, 10/20/47 174,600 U.S. Treasury Bond 1,000,000 2.250%, 08/15/49 1,066,250 750,000 2.875%, 11/15/46 888,281 600,000 1.875%, 02/15/41 590,391 600,000 1.125%, 05/15/40 520,172 500,000 3.500%, 02/15/39 625,391 500,000 3.000%, 05/15/47 607,656 500,000 2.000%, 02/15/50 505,859 500,000 1.125%, 08/15/40 432,656 300,000 3.000%, 02/15/49 367,664 200,000 1.375%, 08/15/50 174,453 125,000 2.375%, 11/15/49 136,855 U.S. Treasury Inflation Indexed Note 1,108,990 0.500%, 01/15/28 1,248,242 U.S. Treasury Note 1,550,000 0.750%, 01/31/28 1,490,543 630,000 1.500%, 02/15/30^ 630,787 500,000 2.875%, 11/30/25 536,660 500,000 2.500%, 02/28/26 529,824 500,000 1.125%, 02/28/27^ 497,090 500,000 0.500%, 04/30/27^ 479,395 500,000 0.375%, 09/30/27 472,793 400,000 0.625%, 05/15/30^ 371,750 400,000 0.625%, 08/15/30 370,813 125,000 0.250%, 05/31/25 121,953
TOTAL U.S. GOVERNMENT AND AGENCY SECURITIES(Cost $19,521,795) 20,004,470
RESIDENTIAL MORTGAGE BACKED SECURITIES (3.4%)
250,000 BX Trust Series 2019-OC11, Class A* 3.202%, 12/09/41 $ 265,558 Freddie Mac Multifamily Structured Pass Through Certificates Class A2 500,000 3.990%, 05/25/33‡ 582,409 460,000 3.350%, 01/25/28 510,144 995,843 Government National Mortgage Association II Pool Series 2021-134, Class KP 1.350%, 03/16/60 973,522
TOTAL RESIDENTIAL MORTGAGE BACKED SECURITIES (Cost $2,312,258) 2,331,633
NUMBER OF SHARES/ PRINCIPAL AMOUNT VALUE
INVESTMENT OF CASH COLLATERAL FOR SECURITIES LOANED (7.6%)
5,136,960 State Street Navigator Securities Lending Government Money Market Portfolio†(Cost $5,136,960) 5,136,960
TOTAL INVESTMENTS (106.8%)(Cost $70,026,317) 71,782,104
PAYABLE UPON RETURN OF SECURITIES ON LOAN (-7.6%) (5,136,960)
OTHER ASSETS, LESS LIABILITIES (0.8%) 528,084
NET ASSETS (100.0%) $67,173,228
NOTES TO SCHEDULE OF INVESTMENTS* Securities issued and sold pursuant to a Rule 144A transaction are
exempted from the registration requirement of the Securities Act of 1933,as amended. These securities may only be sold to qualified institutionalbuyers (“QIBs”), such as the Fund. Any resale of these securities mustgenerally be effected through a sale that is registered under the Act orotherwise exempted from such registration requirements.
^ Security, or portion of security, is on loan.
‡ Variable rate security. The rate shown is the rate in effect at October 31,2021.
¡ Bank loans generally are subject to mandatory and/or optionalprepayment. As a result, the actual remaining maturity of bank loans maybe substantially less than the stated maturities shown.
! This position represents an unsettled loan commitment at period end.Certain details associated with this purchase are not known prior to thesettlement date, including coupon rate, which will be adjusted onsettlement date.
† Represents investment of cash collateral received from securities on loanas of October 31, 2021.
See accompanying Notes to Schedule of Investments

152
Total Return Bond Fund Schedule of Investments October 31, 2021
FUTURES CONTRACTS
MARKET VALUE/ UNREALIZEDNUMBER OF EXPIRATION NOTIONAL APPRECIATIONCONTRACTS DESCRIPTION DATE VALUE (DEPRECIATION)
Sales10 U.S. Treasury Note 5-Year Dec 2021 $1,217,500 $(18,928)
See accompanying Notes to Schedule of InvestmentsCALAMOS OPEN-END FAMILY OF FUNDS ANNUAL REPORT
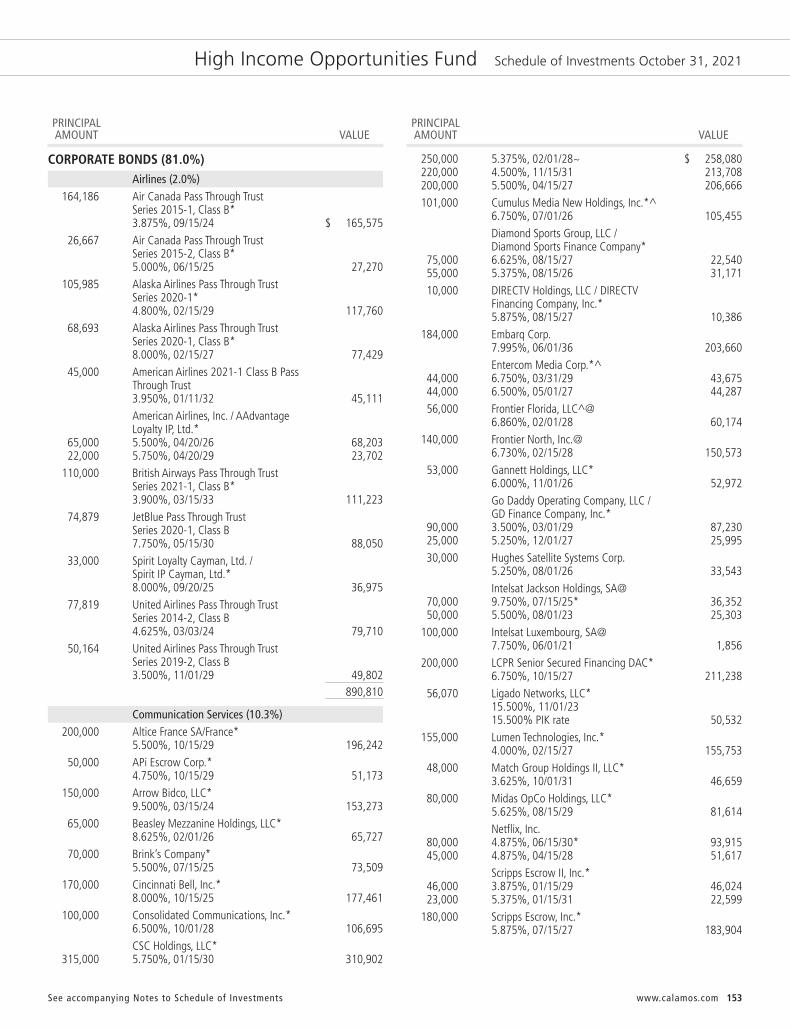
153www.calamos.com
High Income Opportunities Fund Schedule of Investments October 31, 2021
PRINCIPAL AMOUNT VALUE
PRINCIPAL AMOUNT VALUE
CORPORATE BONDS (81.0%)Airlines (2.0%)
164,186 Air Canada Pass Through Trust Series 2015-1, Class B* 3.875%, 09/15/24 $ 165,575 26,667 Air Canada Pass Through Trust Series 2015-2, Class B* 5.000%, 06/15/25 27,270 105,985 Alaska Airlines Pass Through Trust Series 2020-1* 4.800%, 02/15/29 117,760 68,693 Alaska Airlines Pass Through Trust Series 2020-1, Class B* 8.000%, 02/15/27 77,429 45,000 American Airlines 2021-1 Class B Pass Through Trust 3.950%, 01/11/32 45,111 American Airlines, Inc. / AAdvantage Loyalty IP, Ltd.* 65,000 5.500%, 04/20/26 68,203 22,000 5.750%, 04/20/29 23,702 110,000 British Airways Pass Through Trust Series 2021-1, Class B* 3.900%, 03/15/33 111,223 74,879 JetBlue Pass Through Trust Series 2020-1, Class B 7.750%, 05/15/30 88,050 33,000 Spirit Loyalty Cayman, Ltd. / Spirit IP Cayman, Ltd.* 8.000%, 09/20/25 36,975 77,819 United Airlines Pass Through Trust Series 2014-2, Class B 4.625%, 03/03/24 79,710 50,164 United Airlines Pass Through Trust Series 2019-2, Class B 3.500%, 11/01/29 49,802 890,810
Communication Services (10.3%) 200,000 Altice France SA/France* 5.500%, 10/15/29 196,242 50,000 APi Escrow Corp.* 4.750%, 10/15/29 51,173 150,000 Arrow Bidco, LLC* 9.500%, 03/15/24 153,273 65,000 Beasley Mezzanine Holdings, LLC* 8.625%, 02/01/26 65,727 70,000 Brink’s Company* 5.500%, 07/15/25 73,509 170,000 Cincinnati Bell, Inc.* 8.000%, 10/15/25 177,461 100,000 Consolidated Communications, Inc.* 6.500%, 10/01/28 106,695 CSC Holdings, LLC* 315,000 5.750%, 01/15/30 310,902
250,000 5.375%, 02/01/28~ $ 258,080 220,000 4.500%, 11/15/31 213,708 200,000 5.500%, 04/15/27 206,666 101,000 Cumulus Media New Holdings, Inc.*^ 6.750%, 07/01/26 105,455 Diamond Sports Group, LLC / Diamond Sports Finance Company* 75,000 6.625%, 08/15/27 22,540 55,000 5.375%, 08/15/26 31,171 10,000 DIRECTV Holdings, LLC / DIRECTV Financing Company, Inc.* 5.875%, 08/15/27 10,386 184,000 Embarq Corp. 7.995%, 06/01/36 203,660 Entercom Media Corp.*^ 44,000 6.750%, 03/31/29 43,675 44,000 6.500%, 05/01/27 44,287 56,000 Frontier Florida, LLC^@ 6.860%, 02/01/28 60,174 140,000 Frontier North, Inc.@ 6.730%, 02/15/28 150,573 53,000 Gannett Holdings, LLC* 6.000%, 11/01/26 52,972 Go Daddy Operating Company, LLC / GD Finance Company, Inc.* 90,000 3.500%, 03/01/29 87,230 25,000 5.250%, 12/01/27 25,995 30,000 Hughes Satellite Systems Corp. 5.250%, 08/01/26 33,543 Intelsat Jackson Holdings, SA@ 70,000 9.750%, 07/15/25* 36,352 50,000 5.500%, 08/01/23 25,303 100,000 Intelsat Luxembourg, SA@ 7.750%, 06/01/21 1,856 200,000 LCPR Senior Secured Financing DAC* 6.750%, 10/15/27 211,238 56,070 Ligado Networks, LLC* 15.500%, 11/01/23 15.500% PIK rate 50,532 155,000 Lumen Technologies, Inc.* 4.000%, 02/15/27 155,753 48,000 Match Group Holdings II, LLC* 3.625%, 10/01/31 46,659 80,000 Midas OpCo Holdings, LLC* 5.625%, 08/15/29 81,614 Netflix, Inc. 80,000 4.875%, 06/15/30* 93,915 45,000 4.875%, 04/15/28 51,617 Scripps Escrow II, Inc.* 46,000 3.875%, 01/15/29 46,024 23,000 5.375%, 01/15/31 22,599 180,000 Scripps Escrow, Inc.* 5.875%, 07/15/27 183,904
See accompanying Notes to Schedule of Investments

154
High Income Opportunities Fund Schedule of Investments October 31, 2021
PRINCIPAL AMOUNT VALUE
PRINCIPAL AMOUNT VALUE
46,000 Shift4 Payments, LLC / Shift4 Payments Finance Sub, Inc.* 4.625%, 11/01/26 $ 47,875 Sirius XM Radio, Inc.* 125,000 5.500%, 07/01/29 134,984 72,000 4.000%, 07/15/28 72,572 50,000 3.125%, 09/01/26 50,164 24,000 3.875%, 09/01/31 23,093 65,000 Spanish Broadcasting System, Inc.* 9.750%, 03/01/26 68,160 230,000 Sprint Corp.~ 7.125%, 06/15/24 260,162 80,000 Telecom Italia Capital, SA 6.000%, 09/30/34 89,091 126,000 United States Cellular Corp. 6.700%, 12/15/33 156,870 4,595,434
Consumer Discretionary (12.8%) 96,000 American Axle & Manufacturing, Inc.^ 6.875%, 07/01/28 102,010 Ashton Woods USA, LLC / Ashton Woods Finance Company* 72,000 6.625%, 01/15/28 76,648 60,000 4.625%, 08/01/29 59,936 24,000 4.625%, 04/01/30 23,743 28,000 Avis Budget Car Rental, LLC / Avis Budget Finance, Inc.*^ 5.375%, 03/01/29 29,588 Bath & Body Works, Inc. 123,000 6.694%, 01/15/27 141,230 67,000 6.875%, 11/01/35 81,520 Caesars Entertainment, Inc.* 61,000 4.625%, 10/15/29 61,442 46,000 8.125%, 07/01/27^ 51,583 46,000 6.250%, 07/01/25 48,452 Carnival Corp.* 44,000 10.500%, 02/01/26 51,149 23,000 7.625%, 03/01/26 24,264 110,000 Carriage Services, Inc.* 4.250%, 05/15/29 110,321 65,000 Carvana Company* 5.625%, 10/01/25 66,506 CCO Holdings, LLC / CCO Holdings Capital Corp.* 200,000 5.125%, 05/01/27 207,632 151,000 4.250%, 02/01/31 150,511 100,000 4.750%, 03/01/30 103,392 55,000 5.000%, 02/01/28 57,245 35,000 4.250%, 01/15/34 34,000 75,000 Cedar Fair, LP 5.250%, 07/15/29 77,804 Century Communities, Inc. 125,000 6.750%, 06/01/27^ 132,934 25,000 3.875%, 08/15/29* 24,992
DISH DBS Corp. 77,000 7.750%, 07/01/26 $ 85,843 60,000 7.375%, 07/01/28^ 63,188 72,000 Everi Holdings, Inc.* 5.000%, 07/15/29 73,831 55,000 Ford Motor Company 8.500%, 04/21/23 60,315 Ford Motor Credit Company, LLC 200,000 4.389%, 01/08/26 214,024 200,000 4.000%, 11/13/30 208,990 200,000 3.664%, 09/08/24 207,880 Gap, Inc.* 36,000 3.875%, 10/01/31 35,349 5,000 3.625%, 10/01/29 4,909 goeasy, Ltd.* 160,000 5.375%, 12/01/24 164,686 80,000 4.375%, 05/01/26^ 82,363 44,000 Goodyear Tire & Rubber Company* 5.000%, 07/15/29 46,445 47,000 Group 1 Automotive, Inc.* 4.000%, 08/15/28 47,036 95,000 Guitar Center, Inc.* 8.500%, 01/15/26 101,734 200,000 International Game Technology, PLC* 6.250%, 01/15/27 225,584 Liberty Interactive, LLC 95,000 8.250%, 02/01/30^ 103,920 50,000 8.500%, 07/15/29 55,975 65,000 Life Time, Inc.* 8.000%, 04/15/26 68,332 M/I Homes, Inc. 70,000 4.950%, 02/01/28 73,034 65,000 3.950%, 02/15/30* 64,266 Macy’s Retail Holdings, LLC 99,000 6.700%, 07/15/34* 113,589 25,000 5.125%, 01/15/42 23,577 Mattel, Inc.*^ 125,000 5.875%, 12/15/27 134,910 11,000 3.750%, 04/01/29 11,439 200,000 Mclaren Finance, PLC* 7.500%, 08/01/26 200,374 100,000 Midwest Gaming Borrower, LLC / Midwest Gaming Finance Corp.* 4.875%, 05/01/29 100,946 105,000 Mohegan Gaming & Entertainment* 8.000%, 02/01/26 108,648 92,000 Newell Brands, Inc. 4.700%, 04/01/26 100,842 48,000 Papa John’s International, Inc.* 3.875%, 09/15/29 47,039 110,000 Penn National Gaming, Inc.* 4.125%, 07/01/29 107,930 110,000 Premier Entertainment Sub, LLC / Premier Entertainment Finance Corp.* 5.625%, 09/01/29 112,254
See accompanying Notes to Schedule of InvestmentsCALAMOS OPEN-END FAMILY OF FUNDS ANNUAL REPORT

155www.calamos.com
High Income Opportunities Fund Schedule of Investments October 31, 2021
PRINCIPAL AMOUNT VALUE
PRINCIPAL AMOUNT VALUE
224,000 Rite Aid Corp.* 8.000%, 11/15/26 $ 226,574 Royal Caribbean Cruises, Ltd.* 27,000 11.500%, 06/01/25 30,774 23,000 10.875%, 06/01/23 25,765 105,000 Simmons Foods, Inc. / Simmons Prepared Foods, Inc. / Simmons Pet Food, Inc. / Simmons Feed* 4.625%, 03/01/29 106,169 60,000 Sonic Automotive, Inc.* 4.625%, 11/15/29 60,215 125,000 Speedway Motorsports, LLC / Speedway Funding II, Inc.* 4.875%, 11/01/27 127,787 75,000 Taylor Morrison Communities, Inc.* 5.750%, 01/15/28 82,590 24,000 Thor Industries, Inc.* 4.000%, 10/15/29 23,795 23,000 Viking Cruises, Ltd.* 13.000%, 05/15/25 26,414 100,000 Vista Outdoor, Inc.* 4.500%, 03/15/29 100,224 105,000 VOC Escrow, Ltd.* 5.000%, 02/15/28 104,624 23,000 Williams Scotsman International, Inc.* 4.625%, 08/15/28 23,794 5,704,879
Consumer Staples (3.9%) 107,000 Central Garden & Pet Company* 4.125%, 04/30/31 107,727 Edgewell Personal Care Company* 65,000 4.125%, 04/01/29 64,223 45,000 5.500%, 06/01/28 47,121 127,000 Energizer Holdings, Inc.* 4.375%, 03/31/29 121,803 70,000 Fresh Market, Inc.* 9.750%, 05/01/23 72,155 105,000 JBS USA LUX, SA / JBS USA Finance, Inc.* 6.750%, 02/15/28 113,573 42,000 JBS USA LUX, SA / JBS USA Food Company / JBS USA Finance, Inc.* 6.500%, 04/15/29 46,713 Kraft Heinz Foods Company 140,000 4.375%, 06/01/46 163,636 23,000 4.250%, 03/01/31 25,948 23,000 3.875%, 05/15/27 24,981 63,000 New Albertsons, LP 7.750%, 06/15/26 72,527 96,000 Performance Food Group, Inc.* 4.250%, 08/01/29 96,280 145,000 Pilgrim’s Pride Corp.* 5.875%, 09/30/27 152,940 Post Holdings, Inc.* 110,000 5.750%, 03/01/27 114,229
110,000 4.625%, 04/15/30 $ 110,770 90,000 Prestige Brands, Inc.* 3.750%, 04/01/31 87,092 100,000 United Natural Foods, Inc.*^ 6.750%, 10/15/28 108,405 Vector Group, Ltd.* 145,000 5.750%, 02/01/29 144,810 55,000 10.500%, 11/01/26 58,128 1,733,061
Energy (7.1%) Antero Resources Corp.* 29,000 7.625%, 02/01/29 32,152 22,000 5.375%, 03/01/30 23,324 Apache Corp. 90,000 5.100%, 09/01/40 100,936 46,000 4.625%, 11/15/25 49,607 Buckeye Partners, LP 75,000 3.950%, 12/01/26 76,989 50,000 5.850%, 11/15/43 49,346 40,000 ChampionX Corp. 6.375%, 05/01/26 41,869 Cheniere Energy Partners, LP* 48,000 3.250%, 01/31/32 47,656 23,000 4.000%, 03/01/31 23,956 45,000 Cheniere Energy, Inc. 4.625%, 10/15/28 47,290 Continental Resources, Inc. 90,000 3.800%, 06/01/24 94,643 70,000 4.375%, 01/15/28 76,471 125,000 DCP Midstream Operating, LP*‡ 5.850%, 05/21/43 3 mo. USD LIBOR + 3.85% 118,899 1,745 Diamond Foreign Asset Company / Diamond Finance, LLC 9.000%, 04/22/27 13.000% PIK rate 1,758 51,000 DT Midstream, Inc.* 4.125%, 06/15/29 51,445 Energy Transfer, LP‡ 140,000 3.149%, 11/01/66 3 mo. USD LIBOR + 3.02% 115,392 70,000 6.500%, 11/15/26 5 year CMT + 5.69 72,675 EnLink Midstream Partners, LP 120,000 6.000%, 12/15/22‡ 3 mo. USD LIBOR + 4.11% 96,534 100,000 4.850%, 07/15/26 104,169 EQT Corp. 57,000 7.500%, 02/01/30 73,119 40,000 6.625%, 02/01/25 45,086 23,000 5.000%, 01/15/29 25,602 117,000 Genesis Energy, LP / Genesis Energy Finance Corp. 6.250%, 05/15/26 113,479
See accompanying Notes to Schedule of Investments

156
High Income Opportunities Fund Schedule of Investments October 31, 2021
PRINCIPAL AMOUNT VALUE
PRINCIPAL AMOUNT VALUE
Gulfport Energy Operating Corp. 90,000 6.375%, 05/15/25 $ 5,175 26,334 8.000%, 05/17/26^ 29,181 Laredo Petroleum, Inc. 76,000 10.125%, 01/15/28 81,438 23,000 7.750%, 07/31/29*^ 22,803 100,000 Magnolia Oil & Gas Operating, LLC / Magnolia Oil & Gas Finance Corp.* 6.000%, 08/01/26 102,694 Moss Creek Resources Holdings, Inc.* 50,000 7.500%, 01/15/26 45,523 45,000 10.500%, 05/15/27 44,700 44,000 Murphy Oil Corp. 6.375%, 07/15/28 46,534 New Fortress Energy, Inc.* 46,000 6.750%, 09/15/25 44,860 45,000 6.500%, 09/30/26 43,803 24,000 Oasis Midstream Partners, LP / OMP Finance Corp.* 8.000%, 04/01/29 26,123 Occidental Petroleum Corp. 280,000 4.300%, 08/15/39 281,442 203,000 2.900%, 08/15/24 206,932 46,000 5.875%, 09/01/25 51,117 25,000 Ovintiv, Inc. 6.500%, 08/15/34 33,617 90,000 Par Petroleum, LLC / Par Petroleum Finance Corp.* 7.750%, 12/15/25 90,778 75,000 Parkland Corp. / Canada* 5.875%, 07/15/27 79,321 100,000 Plains All American Pipeline, LP‡ 6.125%, 11/15/22 3 mo. USD LIBOR + 4.11% 90,819 39,000 Rockcliff Energy II, LLC* 5.500%, 10/15/29 40,170 12,000 Summit Midstream Holdings, LLC / Summit Midstream Finance Corp.* 8.500%, 10/15/26 12,094 24,000 Sunoco, LP / Sunoco Finance Corp.* 4.500%, 04/30/30 24,229 Venture Global Calcasieu Pass, LLC* 25,000 4.125%, 08/15/31 25,918 25,000 3.875%, 08/15/29 25,486 47,000 Vine Energy Holdings, LLC* 6.750%, 04/15/29 50,595 50,000 Viper Energy Partners, LP* 5.375%, 11/01/27 52,145 70,000 W&T Offshore, Inc.* 9.750%, 11/01/23 68,254 48,000 Weatherford International, Ltd.* 8.625%, 04/30/30 49,402 3,157,550
Financials (15.2%) Acrisure, LLC / Acrisure Finance, Inc.* 144,000 6.000%, 08/01/29 $ 141,755 127,000 7.000%, 11/15/25 128,652 63,000 Aethon United BR, LP / Aethon United Finance Corp.* 8.250%, 02/15/26 67,744 97,000 AG Issuer, LLC* 6.250%, 03/01/28 101,279 Alliant Holdings Intermediate, LLC / Alliant Holdings Co-Issuer* 205,000 6.750%, 10/15/27 212,454 25,000 5.875%, 11/01/29 25,187 25,000 4.250%, 10/15/27 25,021 Ally Financial, Inc. 76,000 4.700%, 05/15/26^‡ 5 year CMT + 3.87% 78,867 75,000 8.000%, 11/01/31 107,434 45,000 4.700%, 05/15/28‡ 7 year CMT + 3.48% 45,925 110,000 American Finance Trust, Inc. / American Finance Operating Partner, LP* 4.500%, 09/30/28 110,142 193,000 AmWINS Group, Inc.* 4.875%, 06/30/29 192,610 215,000 AssuredPartners, Inc.* 7.000%, 08/15/25 218,094 98,000 Aviation Capital Group, LLC* 3.500%, 11/01/27 102,379 139,000 BroadStreet Partners, Inc.* 5.875%, 04/15/29 136,738 Brookfield Property REIT, Inc. / BPR Cumulus, LLC / BPR Nimbus, LLC / GGSI Sellco LLC* 195,000 4.500%, 04/01/27 190,494 116,000 5.750%, 05/15/26 120,066 Credit Acceptance Corp. 130,000 6.625%, 03/15/26^ 135,838 89,000 5.125%, 12/31/24* 91,205 29,000 Cushman & Wakefield US Borrower, LLC* 6.750%, 05/15/28 31,130 96,000 Enact Holdings, Inc.* 6.500%, 08/15/25 105,675 138,000 Global Net Lease, Inc. / Global Net Lease Operating Partnership, LP* 3.750%, 12/15/27 136,205 156,000 Greystar Real Estate Partners, LLC* 5.750%, 12/01/25 158,839 420,000 HUB International, Ltd.* 7.000%, 05/01/26 434,566 Icahn Enterprises, LP / Icahn Enterprises Finance Corp. 115,000 5.250%, 05/15/27 119,797 68,000 4.375%, 02/01/29 68,380
See accompanying Notes to Schedule of InvestmentsCALAMOS OPEN-END FAMILY OF FUNDS ANNUAL REPORT

157www.calamos.com
High Income Opportunities Fund Schedule of Investments October 31, 2021
PRINCIPAL AMOUNT VALUE
PRINCIPAL AMOUNT VALUE
160,000 ILFC E-Capital Trust II*‡ 3.710%, 12/21/65 3 mo. USD LIBOR + 1.80% $ 137,427 230,000 Iron Mountain, Inc.* 5.250%, 03/15/28 240,345 260,000 Jefferies Finance, LLC / JFIN Co-Issuer Corp.* 5.000%, 08/15/28 263,910 Ladder Capital Finance Holdings LLLP / Ladder Capital Finance Corp.* 182,000 5.250%, 10/01/25 184,526 48,000 4.750%, 06/15/29 48,462 113,000 LD Holdings Group, LLC* 6.125%, 04/01/28 103,679 200,000 Level 3 Financing, Inc.* 4.250%, 07/01/28 198,200 115,000 LPL Holdings, Inc.* 4.000%, 03/15/29 117,716 193,000 MetLife, Inc. 6.400%, 12/15/66 244,969 Navient Corp. 202,000 5.000%, 03/15/27 206,278 100,000 4.875%, 03/15/28 100,524 OneMain Finance Corp. 85,000 7.125%, 03/15/26 96,683 65,000 3.875%, 09/15/28 63,501 Park Intermediate Holdings, LLC / PK Domestic Property, LLC / PK Finance Co-Issuer* 55,000 7.500%, 06/01/25 58,492 45,000 5.875%, 10/01/28 47,306 107,000 PHH Mortgage Corp.*^ 7.875%, 03/15/26 108,724 100,000 Prospect Capital Corp. 3.706%, 01/22/26 101,780 125,000 Radian Group, Inc. 4.875%, 03/15/27 136,495 100,000 RHP Hotel Properties, LP / RHP Finance Corp.* 4.500%, 02/15/29 99,586 RLJ Lodging Trust, LP* 72,000 3.750%, 07/01/26 72,787 46,000 4.000%, 09/15/29 45,955 Rocket Mortgage, LLC / Rocket Mortgage Co-Issuer, Inc.* 45,000 3.875%, 03/01/31 44,510 45,000 3.625%, 03/01/29 44,791 20,000 2.875%, 10/15/26 19,867 55,000 SLM Corp. 4.200%, 10/29/25 58,209 150,000 Starwood Property Trust, Inc. 4.750%, 03/15/25 157,804 90,000 StoneX Group, Inc.* 8.625%, 06/15/25 95,956
111,000 United Wholesale Mortgage, LLC* 5.500%, 04/15/29 $ 108,709 96,000 VICI Properties, LP / VICI Note Company, Inc.* 3.750%, 02/15/27 98,869 XHR, LP* 98,000 6.375%, 08/15/25 103,453 48,000 4.875%, 06/01/29 49,264 6,745,253
Health Care (7.7%) 46,000 Acadia Healthcare Company, Inc.* 5.000%, 04/15/29 46,988 330,000 Bausch Health Americas, Inc.* 8.500%, 01/31/27 351,321 Bausch Health Companies, Inc.* 125,000 5.250%, 02/15/31 112,659 100,000 5.000%, 01/30/28 92,683 39,000 5.000%, 02/15/29 35,823 Centene Corp. 63,000 4.250%, 12/15/27 66,030 46,000 3.000%, 10/15/30 46,780 44,000 Charles River Laboratories International, Inc.* 3.750%, 03/15/29 44,487 CHS/Community Health Systems, Inc.* 183,000 6.125%, 04/01/30 180,101 110,000 8.000%, 03/15/26 116,267 49,000 6.875%, 04/15/29 50,468 DaVita, Inc.* 137,000 4.625%, 06/01/30 137,858 112,000 3.750%, 02/15/31 106,243 Encompass Health Corp. 45,000 4.750%, 02/01/30 46,374 45,000 4.500%, 02/01/28 45,862 124,000 HCA, Inc. 7.500%, 11/06/33 178,651 36,000 HealthEquity, Inc.* 4.500%, 10/01/29 36,473 210,000 Jazz Securities DAC* 4.375%, 01/15/29 216,220 80,000 Mallinckrodt International Finance, SA / Mallinckrodt CB, LLC*@ 5.625%, 10/15/23 36,054 Mozart Debt Merger Sub, Inc.* 120,000 3.875%, 04/01/29 119,452 72,000 5.250%, 10/01/29 73,215 200,000 Organon & Company / Organon Foreign Debt Co-Issuer, BV* 5.125%, 04/30/31 206,512 107,000 Team Health Holdings, Inc.*^ 6.375%, 02/01/25 95,599 Tenet Healthcare Corp. 220,000 6.250%, 02/01/27* 228,712 130,000 6.875%, 11/15/31 150,337
See accompanying Notes to Schedule of Investments
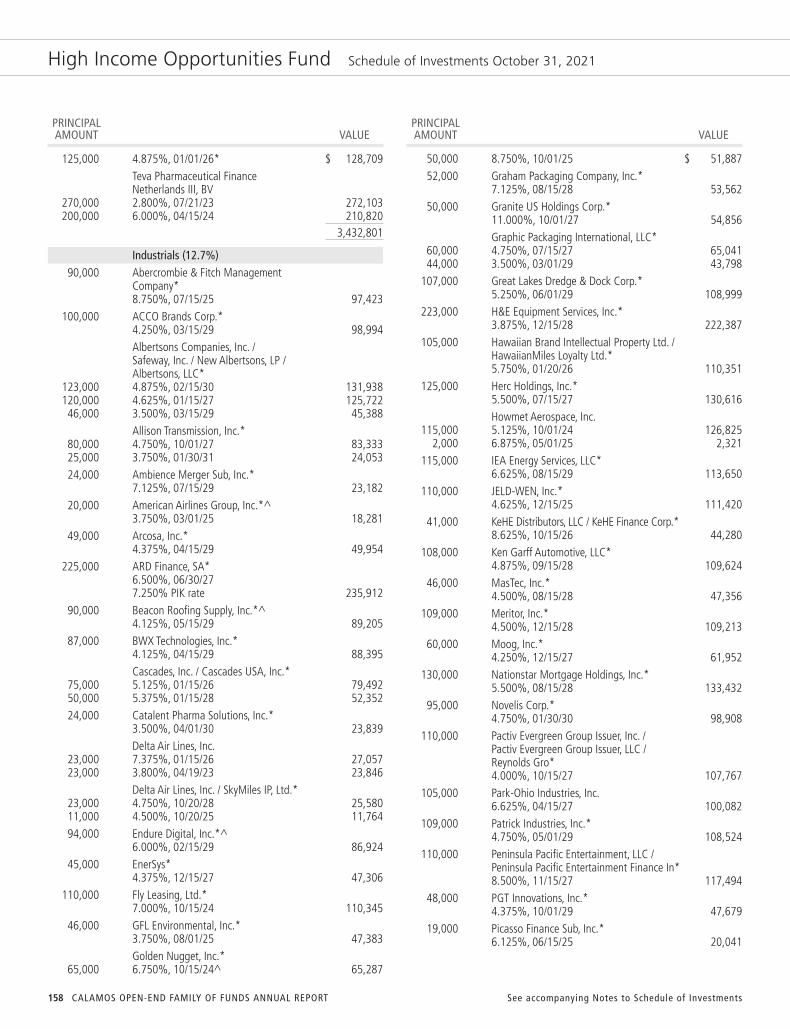
158
High Income Opportunities Fund Schedule of Investments October 31, 2021
PRINCIPAL AMOUNT VALUE
PRINCIPAL AMOUNT VALUE
125,000 4.875%, 01/01/26* $ 128,709 Teva Pharmaceutical Finance Netherlands III, BV 270,000 2.800%, 07/21/23 272,103 200,000 6.000%, 04/15/24 210,820 3,432,801
Industrials (12.7%) 90,000 Abercrombie & Fitch Management Company* 8.750%, 07/15/25 97,423 100,000 ACCO Brands Corp.* 4.250%, 03/15/29 98,994 Albertsons Companies, Inc. / Safeway, Inc. / New Albertsons, LP / Albertsons, LLC* 123,000 4.875%, 02/15/30 131,938 120,000 4.625%, 01/15/27 125,722 46,000 3.500%, 03/15/29 45,388 Allison Transmission, Inc.* 80,000 4.750%, 10/01/27 83,333 25,000 3.750%, 01/30/31 24,053 24,000 Ambience Merger Sub, Inc.* 7.125%, 07/15/29 23,182 20,000 American Airlines Group, Inc.*^ 3.750%, 03/01/25 18,281 49,000 Arcosa, Inc.* 4.375%, 04/15/29 49,954 225,000 ARD Finance, SA* 6.500%, 06/30/27 7.250% PIK rate 235,912 90,000 Beacon Roofing Supply, Inc.*^ 4.125%, 05/15/29 89,205 87,000 BWX Technologies, Inc.* 4.125%, 04/15/29 88,395 Cascades, Inc. / Cascades USA, Inc.* 75,000 5.125%, 01/15/26 79,492 50,000 5.375%, 01/15/28 52,352 24,000 Catalent Pharma Solutions, Inc.* 3.500%, 04/01/30 23,839 Delta Air Lines, Inc. 23,000 7.375%, 01/15/26 27,057 23,000 3.800%, 04/19/23 23,846 Delta Air Lines, Inc. / SkyMiles IP, Ltd.* 23,000 4.750%, 10/20/28 25,580 11,000 4.500%, 10/20/25 11,764 94,000 Endure Digital, Inc.*^ 6.000%, 02/15/29 86,924 45,000 EnerSys* 4.375%, 12/15/27 47,306 110,000 Fly Leasing, Ltd.* 7.000%, 10/15/24 110,345 46,000 GFL Environmental, Inc.* 3.750%, 08/01/25 47,383 Golden Nugget, Inc.* 65,000 6.750%, 10/15/24^ 65,287
50,000 8.750%, 10/01/25 $ 51,887 52,000 Graham Packaging Company, Inc.* 7.125%, 08/15/28 53,562 50,000 Granite US Holdings Corp.* 11.000%, 10/01/27 54,856 Graphic Packaging International, LLC* 60,000 4.750%, 07/15/27 65,041 44,000 3.500%, 03/01/29 43,798 107,000 Great Lakes Dredge & Dock Corp.* 5.250%, 06/01/29 108,999 223,000 H&E Equipment Services, Inc.* 3.875%, 12/15/28 222,387 105,000 Hawaiian Brand Intellectual Property Ltd. / HawaiianMiles Loyalty Ltd.* 5.750%, 01/20/26 110,351 125,000 Herc Holdings, Inc.* 5.500%, 07/15/27 130,616 Howmet Aerospace, Inc. 115,000 5.125%, 10/01/24 126,825 2,000 6.875%, 05/01/25 2,321 115,000 IEA Energy Services, LLC* 6.625%, 08/15/29 113,650 110,000 JELD-WEN, Inc.* 4.625%, 12/15/25 111,420 41,000 KeHE Distributors, LLC / KeHE Finance Corp.* 8.625%, 10/15/26 44,280 108,000 Ken Garff Automotive, LLC* 4.875%, 09/15/28 109,624 46,000 MasTec, Inc.* 4.500%, 08/15/28 47,356 109,000 Meritor, Inc.* 4.500%, 12/15/28 109,213 60,000 Moog, Inc.* 4.250%, 12/15/27 61,952 130,000 Nationstar Mortgage Holdings, Inc.* 5.500%, 08/15/28 133,432 95,000 Novelis Corp.* 4.750%, 01/30/30 98,908 110,000 Pactiv Evergreen Group Issuer, Inc. / Pactiv Evergreen Group Issuer, LLC / Reynolds Gro* 4.000%, 10/15/27 107,767 105,000 Park-Ohio Industries, Inc. 6.625%, 04/15/27 100,082 109,000 Patrick Industries, Inc.* 4.750%, 05/01/29 108,524 110,000 Peninsula Pacific Entertainment, LLC / Peninsula Pacific Entertainment Finance In* 8.500%, 11/15/27 117,494 48,000 PGT Innovations, Inc.* 4.375%, 10/01/29 47,679 19,000 Picasso Finance Sub, Inc.* 6.125%, 06/15/25 20,041
See accompanying Notes to Schedule of InvestmentsCALAMOS OPEN-END FAMILY OF FUNDS ANNUAL REPORT

159www.calamos.com
High Income Opportunities Fund Schedule of Investments October 31, 2021
PRINCIPAL AMOUNT VALUE
PRINCIPAL AMOUNT VALUE
100,000 QVC, Inc. 4.375%, 09/01/28 $ 102,360 80,000 Scientific Games International, Inc.* 5.000%, 10/15/25 82,490 44,000 SEG Holding, LLC / SEG Finance Corp.*^ 5.625%, 10/15/28 46,521 86,000 Sensata Technologies, Inc.* 3.750%, 02/15/31 85,164 Sinclair Television Group, Inc.* 46,000 4.125%, 12/01/30 43,968 45,000 5.500%, 03/01/30^ 43,083 Standard Industries, Inc.* 90,000 5.000%, 02/15/27 92,431 23,000 4.375%, 07/15/30 23,094 185,000 Station Casinos, LLC* 4.500%, 02/15/28 186,665 45,000 Stericycle, Inc.* 3.875%, 01/15/29 44,312 69,000 STL Holding Company, LLC* 7.500%, 02/15/26 72,889 TransDigm, Inc. 195,000 7.500%, 03/15/27 205,181 125,000 6.250%, 03/15/26* 130,704 44,000 Tronox, Inc.* 4.625%, 03/15/29 43,187 United Rentals North America, Inc. 50,000 3.750%, 01/15/32 49,974 22,000 3.875%, 02/15/31 22,195 96,000 Vertiv Group Corp.* 4.125%, 11/15/28 95,811 101,000 Wabash National Corp.* 4.500%, 10/15/28 98,332 75,000 Waste Pro USA, Inc.* 5.500%, 02/15/26 74,353 WESCO Distribution, Inc.* 47,000 7.125%, 06/15/25 50,040 25,000 7.250%, 06/15/28 27,615 5,635,389
Information Technology (3.6%) 48,000 Booz Allen Hamilton, Inc.* 4.000%, 07/01/29 48,634 50,000 CDK Global, Inc.* 5.250%, 05/15/29 53,713 65,000 Clarivate Science Holdings Corp.* 3.875%, 07/01/28 64,342 112,000 CommScope Technologies, LLC* 6.000%, 06/15/25 110,910 90,000 CommScope, Inc.* 4.750%, 09/01/29 88,387 Dell International, LLC / EMC Corp. 70,000 6.100%, 07/15/27 85,147 40,000 5.850%, 07/15/25 46,088
48,000 Fair Isaac Corp.* 4.000%, 06/15/28 $ 48,722 100,000 KBR, Inc.* 4.750%, 09/30/28 102,441 MPH Acquisition Holdings, LLC* 100,000 5.750%, 11/01/28^ 91,346 50,000 5.500%, 09/01/28 49,734 44,000 NCR Corp.* 5.125%, 04/15/29 45,058 112,000 Nielsen Finance, LLC / Nielsen Finance Company* 4.500%, 07/15/29 109,636 68,000 ON Semiconductor Corp.* 3.875%, 09/01/28 69,027 72,000 Open Text Corp.* 3.875%, 02/15/28 72,696 44,000 Playtika Holding Corp.* 4.250%, 03/15/29 44,156 66,000 PTC, Inc.* 4.000%, 02/15/28 67,157 100,000 TTM Technologies, Inc.*^ 4.000%, 03/01/29 99,209 Twilio, Inc. 65,000 3.625%, 03/15/29 65,693 23,000 3.875%, 03/15/31 23,236 130,000 Viavi Solutions, Inc.* 3.750%, 10/01/29 129,180 100,000 ZoomInfo Technologies, LLC / ZoomInfo Finance Corp.*^ 3.875%, 02/01/29 99,449 1,613,961
Materials (4.0%) 200,000 Alcoa Nederland Holding, BV*^ 4.125%, 03/31/29 208,252 47,000 Allegheny Technologies, Inc.^ 5.875%, 12/01/27 49,409 52,000 ArcelorMittal, SA 7.000%, 10/15/39 72,603 70,000 Chemours Company* 4.625%, 11/15/29 67,462 145,000 Clearwater Paper Corp.*^ 4.750%, 08/15/28 147,664 250,000 Constellium, SE*^ 3.750%, 04/15/29 242,135 Freeport-McMoRan, Inc. 65,000 5.000%, 09/01/27 67,906 48,000 5.450%, 03/15/43 60,423 45,000 5.400%, 11/14/34 54,998 68,000 HB Fuller Company 4.250%, 10/15/28 69,296 87,000 Intertape Polymer Group, Inc.* 4.375%, 06/15/29 87,674
See accompanying Notes to Schedule of Investments

160
High Income Opportunities Fund Schedule of Investments October 31, 2021
PRINCIPAL AMOUNT VALUE
PRINCIPAL AMOUNT VALUE
85,000 JW Aluminum Continuous Cast Company* 10.250%, 06/01/26 $ 91,025 Kaiser Aluminum Corp.* 50,000 4.625%, 03/01/28 50,506 11,000 4.500%, 06/01/31 10,838 48,000 LSF11 A5 HoldCo, LLC* 6.625%, 10/15/29 48,117 96,000 Mercer International, Inc. 5.125%, 02/01/29 95,565 45,000 Owens-Brockway Glass Container, Inc.* 6.625%, 05/13/27 48,102 46,000 PBF Holding Company, LLC / PBF Finance Corp. 7.250%, 06/15/25 36,102 110,000 Silgan Holdings, Inc. 4.125%, 02/01/28 112,126 44,000 Trinseo Materials Operating SCA / Trinseo Materials Finance, Inc.* 5.125%, 04/01/29 44,138 75,000 Univar Solutions USA, Inc.* 5.125%, 12/01/27 78,709 46,000 Valvoline, Inc.* 3.625%, 06/15/31 45,069 1,788,119
Real Estate (1.0%) 71,000 EPR Properties 3.750%, 08/15/29 72,904 Forestar Group, Inc.* 67,000 5.000%, 03/01/28 69,358 48,000 3.850%, 05/15/26 48,059 68,000 iStar, Inc. 5.500%, 02/15/26 70,986 Service Properties Trust 125,000 4.350%, 10/01/24 126,125 45,000 5.250%, 02/15/26 45,523 432,955
Utilities (0.7%) 72,000 Calpine Corp.* 4.500%, 02/15/28 72,986 34,000 PPL Capital Funding, Inc.‡ 2.797%, 03/30/67 3 mo. USD LIBOR + 2.67% 32,658 25,000 Talen Energy Supply, LLC* 7.250%, 05/15/27 23,971 100,000 TerraForm Power Operating, LLC* 5.000%, 01/31/28 107,137 50,000 Vistra Corp.*‡ 8.000%, 10/15/26 5 year CMT + 6.93 52,562 289,314 TOTAL CORPORATE BONDS (Cost $34,919,328) 36,019,526
CONVERTIBLE BONDS (0.7%)Consumer Discretionary (0.6%)
179,000 DISH Network Corp. 2.375%, 03/15/24 $ 174,174 90,000 Peloton Interactive, Inc.* 0.000%, 02/15/26 80,425 254,599
Information Technology (0.1%) 75,000 Shift4 Payments, Inc.* 0.500%, 08/01/27 69,857
TOTAL CONVERTIBLE BONDS (Cost $308,395) 324,456
BANK LOANS (11.0%)¡Airlines (0.5%)
95,000 AAdvantage Loyalty IP, Ltd.‡ 5.500%, 04/20/28 3 mo. LIBOR + 4.75% 99,068 124,375 United Airlines, Inc.‡ 4.500%, 04/21/28 3 mo. LIBOR + 3.75% 126,307 225,375
Communication Services (2.8%) 122,500 Clear Channel Outdoor Holdings, Inc.‡ 3.629%, 08/21/26 3 mo. LIBOR + 3.50% 120,726 270,000 DIRECTV Financing, LLC‡ 5.750%, 07/22/27 3 mo. LIBOR + 5.00% 270,506 224,087 Frontier Communications Corp.‡ 4.500%, 10/08/27 3 mo. LIBOR + 3.75% 224,311 84,274 iHeartCommunications, Inc.‡ 3.087%, 05/01/26 1 mo. LIBOR + 3.00% 83,748 233,900 Intelsat Jackson Holdings S.A.‡ 8.625%, 01/02/24 1 mo. LIBOR + 8.63% 237,366 190,000 Intelsat Jackson Holdings, SA‡ 8.750%, 01/02/24 3 mo. PRIME + 5.50% 192,698 125,000 Nexstar Broadcasting, Inc.‡ 2.582%, 09/18/26 1 mo. LIBOR + 2.25% 124,953 1,254,308
Consumer Discretionary (2.2%) 75,000 At Home Group, Inc.‡ 4.750%, 07/24/28 3 mo. LIBOR + 4.25% 74,828
See accompanying Notes to Schedule of InvestmentsCALAMOS OPEN-END FAMILY OF FUNDS ANNUAL REPORT
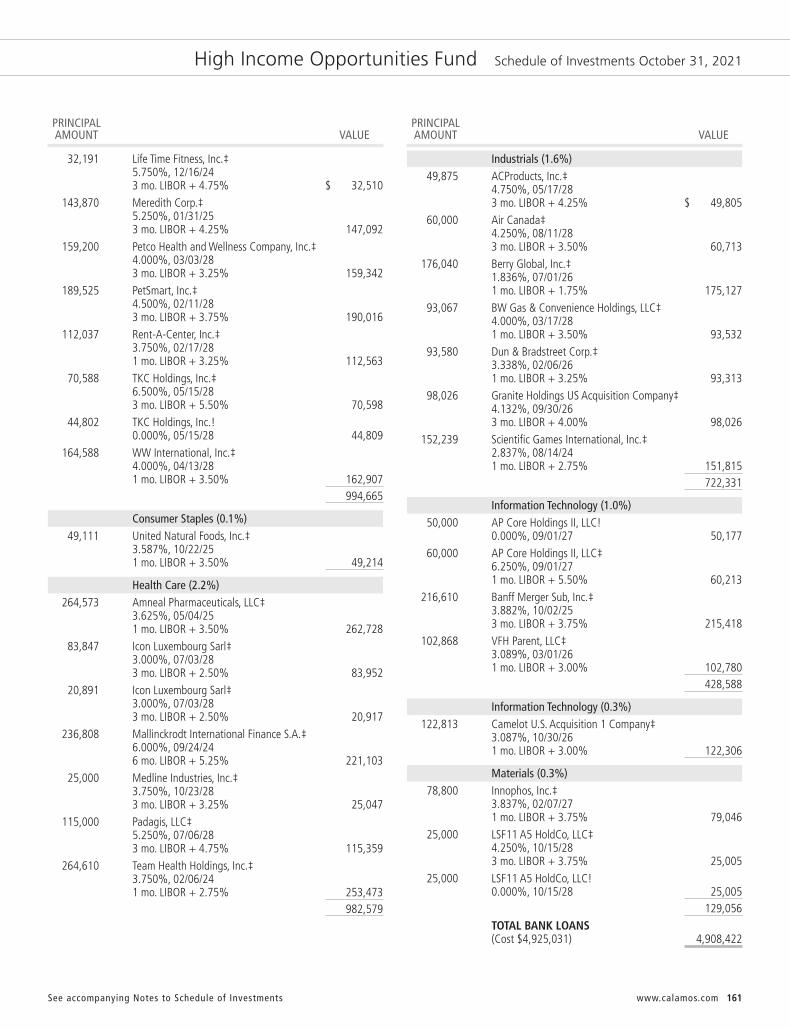
161www.calamos.com
High Income Opportunities Fund Schedule of Investments October 31, 2021
PRINCIPAL AMOUNT VALUE
PRINCIPAL AMOUNT VALUE
32,191 Life Time Fitness, Inc.‡ 5.750%, 12/16/24 3 mo. LIBOR + 4.75% $ 32,510 143,870 Meredith Corp.‡ 5.250%, 01/31/25 3 mo. LIBOR + 4.25% 147,092 159,200 Petco Health and Wellness Company, Inc.‡ 4.000%, 03/03/28 3 mo. LIBOR + 3.25% 159,342 189,525 PetSmart, Inc.‡ 4.500%, 02/11/28 3 mo. LIBOR + 3.75% 190,016 112,037 Rent-A-Center, Inc.‡ 3.750%, 02/17/28 1 mo. LIBOR + 3.25% 112,563 70,588 TKC Holdings, Inc.‡ 6.500%, 05/15/28 3 mo. LIBOR + 5.50% 70,598 44,802 TKC Holdings, Inc.! 0.000%, 05/15/28 44,809 164,588 WW International, Inc.‡ 4.000%, 04/13/28 1 mo. LIBOR + 3.50% 162,907 994,665
Consumer Staples (0.1%) 49,111 United Natural Foods, Inc.‡
3.587%, 10/22/251 mo. LIBOR + 3.50% 49,214
Health Care (2.2%) 264,573 Amneal Pharmaceuticals, LLC‡ 3.625%, 05/04/25 1 mo. LIBOR + 3.50% 262,728 83,847 Icon Luxembourg Sarl‡ 3.000%, 07/03/28 3 mo. LIBOR + 2.50% 83,952 20,891 Icon Luxembourg Sarl‡ 3.000%, 07/03/28 3 mo. LIBOR + 2.50% 20,917 236,808 Mallinckrodt International Finance S.A.‡ 6.000%, 09/24/24 6 mo. LIBOR + 5.25% 221,103 25,000 Medline Industries, Inc.‡ 3.750%, 10/23/28 3 mo. LIBOR + 3.25% 25,047 115,000 Padagis, LLC‡ 5.250%, 07/06/28 3 mo. LIBOR + 4.75% 115,359 264,610 Team Health Holdings, Inc.‡ 3.750%, 02/06/24 1 mo. LIBOR + 2.75% 253,473 982,579
Industrials (1.6%) 49,875 ACProducts, Inc.‡ 4.750%, 05/17/28 3 mo. LIBOR + 4.25% $ 49,805 60,000 Air Canada‡ 4.250%, 08/11/28 3 mo. LIBOR + 3.50% 60,713 176,040 Berry Global, Inc.‡ 1.836%, 07/01/26 1 mo. LIBOR + 1.75% 175,127 93,067 BW Gas & Convenience Holdings, LLC‡ 4.000%, 03/17/28 1 mo. LIBOR + 3.50% 93,532 93,580 Dun & Bradstreet Corp.‡ 3.338%, 02/06/26 1 mo. LIBOR + 3.25% 93,313 98,026 Granite Holdings US Acquisition Company‡ 4.132%, 09/30/26 3 mo. LIBOR + 4.00% 98,026 152,239 Scientific Games International, Inc.‡ 2.837%, 08/14/24 1 mo. LIBOR + 2.75% 151,815 722,331
Information Technology (1.0%) 50,000 AP Core Holdings II, LLC! 0.000%, 09/01/27 50,177 60,000 AP Core Holdings II, LLC‡ 6.250%, 09/01/27 1 mo. LIBOR + 5.50% 60,213 216,610 Banff Merger Sub, Inc.‡ 3.882%, 10/02/25 3 mo. LIBOR + 3.75% 215,418 102,868 VFH Parent, LLC‡ 3.089%, 03/01/26 1 mo. LIBOR + 3.00% 102,780 428,588
Information Technology (0.3%) 122,813 Camelot U.S. Acquisition 1 Company‡
3.087%, 10/30/261 mo. LIBOR + 3.00% 122,306
Materials (0.3%) 78,800 Innophos, Inc.‡ 3.837%, 02/07/27 1 mo. LIBOR + 3.75% 79,046 25,000 LSF11 A5 HoldCo, LLC‡ 4.250%, 10/15/28 3 mo. LIBOR + 3.75% 25,005 25,000 LSF11 A5 HoldCo, LLC! 0.000%, 10/15/28 25,005 129,056 TOTAL BANK LOANS (Cost $4,925,031) 4,908,422
See accompanying Notes to Schedule of Investments
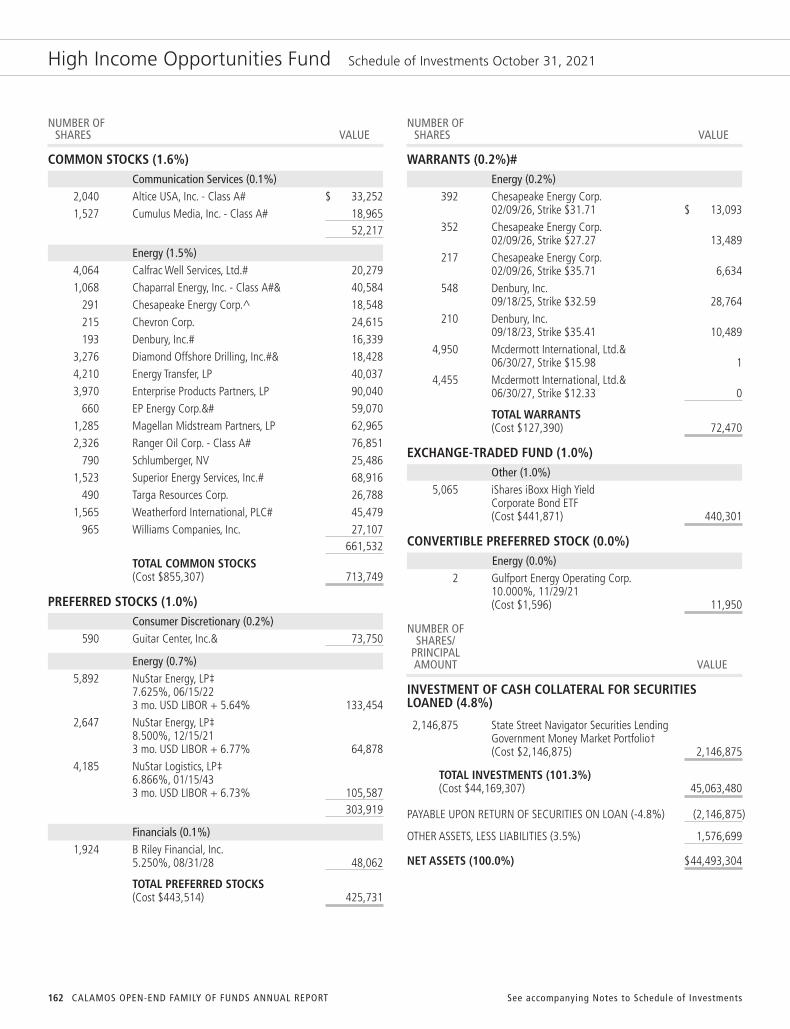
162
High Income Opportunities Fund Schedule of Investments October 31, 2021
NUMBER OF SHARES VALUE
NUMBER OF SHARES VALUE
COMMON STOCKS (1.6%)Communication Services (0.1%)
2,040 Altice USA, Inc. - Class A# $ 33,252 1,527 Cumulus Media, Inc. - Class A# 18,965 52,217
Energy (1.5%) 4,064 Calfrac Well Services, Ltd.# 20,279 1,068 Chaparral Energy, Inc. - Class A#& 40,584 291 Chesapeake Energy Corp.^ 18,548 215 Chevron Corp. 24,615 193 Denbury, Inc.# 16,339 3,276 Diamond Offshore Drilling, Inc.#& 18,428 4,210 Energy Transfer, LP 40,037 3,970 Enterprise Products Partners, LP 90,040 660 EP Energy Corp.&# 59,070 1,285 Magellan Midstream Partners, LP 62,965 2,326 Ranger Oil Corp. - Class A# 76,851 790 Schlumberger, NV 25,486 1,523 Superior Energy Services, Inc.# 68,916 490 Targa Resources Corp. 26,788 1,565 Weatherford International, PLC# 45,479 965 Williams Companies, Inc. 27,107 661,532 TOTAL COMMON STOCKS (Cost $855,307) 713,749
PREFERRED STOCKS (1.0%)Consumer Discretionary (0.2%)
590 Guitar Center, Inc.& 73,750
Energy (0.7%) 5,892 NuStar Energy, LP‡ 7.625%, 06/15/22 3 mo. USD LIBOR + 5.64% 133,454 2,647 NuStar Energy, LP‡ 8.500%, 12/15/21 3 mo. USD LIBOR + 6.77% 64,878 4,185 NuStar Logistics, LP‡ 6.866%, 01/15/43 3 mo. USD LIBOR + 6.73% 105,587 303,919
Financials (0.1%) 1,924 B Riley Financial, Inc. 5.250%, 08/31/28 48,062
TOTAL PREFERRED STOCKS(Cost $443,514) 425,731
WARRANTS (0.2%)#Energy (0.2%)
392 Chesapeake Energy Corp. 02/09/26, Strike $31.71 $ 13,093 352 Chesapeake Energy Corp. 02/09/26, Strike $27.27 13,489 217 Chesapeake Energy Corp. 02/09/26, Strike $35.71 6,634 548 Denbury, Inc. 09/18/25, Strike $32.59 28,764 210 Denbury, Inc. 09/18/23, Strike $35.41 10,489 4,950 Mcdermott International, Ltd.& 06/30/27, Strike $15.98 1 4,455 Mcdermott International, Ltd.& 06/30/27, Strike $12.33 0
TOTAL WARRANTS (Cost $127,390) 72,470
EXCHANGE-TRADED FUND (1.0%)Other (1.0%)
5,065 iShares iBoxx High Yield Corporate Bond ETF(Cost $441,871) 440,301
CONVERTIBLE PREFERRED STOCK (0.0%)Energy (0.0%)
2 Gulfport Energy Operating Corp.10.000%, 11/29/21(Cost $1,596) 11,950
NUMBER OF SHARES/ PRINCIPAL AMOUNT VALUE
INVESTMENT OF CASH COLLATERAL FOR SECURITIES LOANED (4.8%)
2,146,875 State Street Navigator Securities Lending Government Money Market Portfolio†(Cost $2,146,875) 2,146,875
TOTAL INVESTMENTS (101.3%)(Cost $44,169,307) 45,063,480
PAYABLE UPON RETURN OF SECURITIES ON LOAN (-4.8%) (2,146,875)
OTHER ASSETS, LESS LIABILITIES (3.5%) 1,576,699
NET ASSETS (100.0%) $44,493,304
See accompanying Notes to Schedule of InvestmentsCALAMOS OPEN-END FAMILY OF FUNDS ANNUAL REPORT
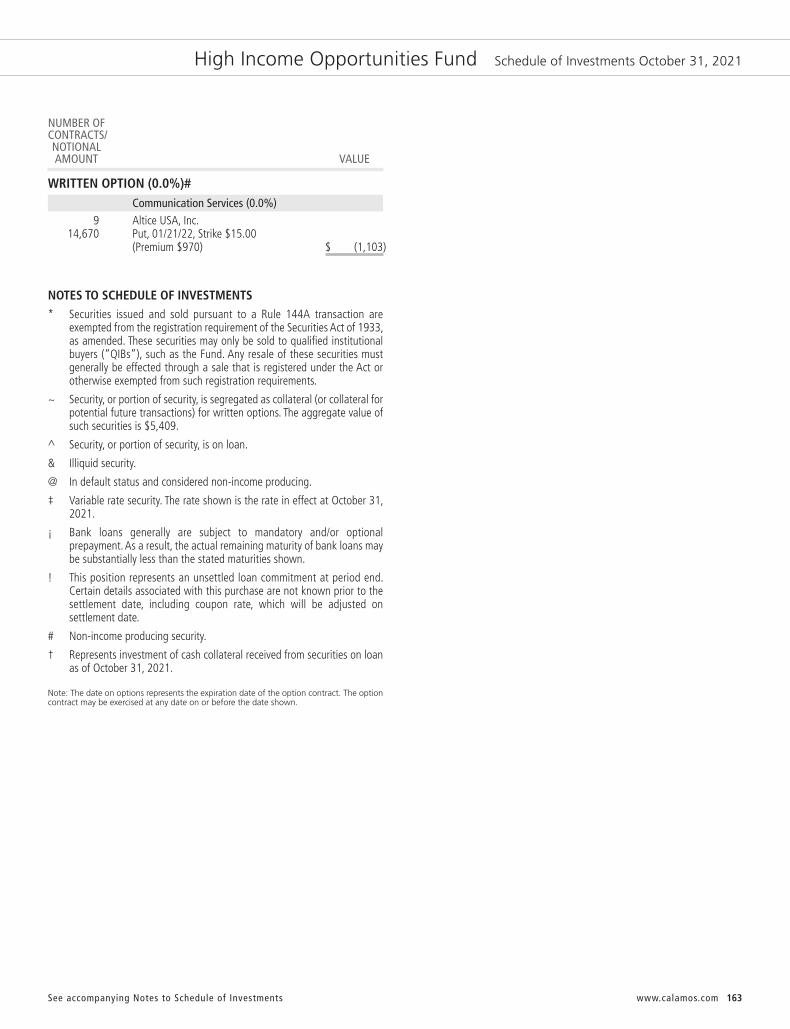
163www.calamos.com
High Income Opportunities Fund Schedule of Investments October 31, 2021
NUMBER OFCONTRACTS/ NOTIONAL AMOUNT VALUE
WRITTEN OPTION (0.0%)#Communication Services (0.0%)
9 Altice USA, Inc. 14,670 Put, 01/21/22, Strike $15.00 (Premium $970) $ (1,103)
NOTES TO SCHEDULE OF INVESTMENTS* Securities issued and sold pursuant to a Rule 144A transaction are
exempted from the registration requirement of the Securities Act of 1933,as amended. These securities may only be sold to qualified institutionalbuyers (“QIBs”), such as the Fund. Any resale of these securities mustgenerally be effected through a sale that is registered under the Act orotherwise exempted from such registration requirements.
~ Security, or portion of security, is segregated as collateral (or collateral forpotential future transactions) for written options. The aggregate value ofsuch securities is $5,409.
^ Security, or portion of security, is on loan.
& Illiquid security.
@ In default status and considered non-income producing.
‡ Variable rate security. The rate shown is the rate in effect at October 31,2021.
¡ Bank loans generally are subject to mandatory and/or optionalprepayment. As a result, the actual remaining maturity of bank loans maybe substantially less than the stated maturities shown.
! This position represents an unsettled loan commitment at period end.Certain details associated with this purchase are not known prior to thesettlement date, including coupon rate, which will be adjusted onsettlement date.
# Non-income producing security.
† Represents investment of cash collateral received from securities on loanas of October 31, 2021.
Note: The date on options represents the expiration date of the option contract. The optioncontract may be exercised at any date on or before the date shown.
See accompanying Notes to Schedule of Investments

CALAMOS OPEN-END FAMILY OF FUNDS ANNUAL REPORT
Short-Term Bond Fund Schedule of Investments October 31, 2021
PRINCIPAL AMOUNT VALUE
164
PRINCIPAL AMOUNT VALUE
CORPORATE BONDS (59.4%)Airlines (0.9%)
519,921 Air Canada Pass Through Trust Series 2015-1, Class B* 3.875%, 09/15/24 $ 524,320 366,399 Air Canada Pass Through Trust Series 2015-2, Class B* 5.000%, 06/15/25 374,691 343,467 Alaska Airlines Pass Through Trust Series 2020-1, Class B* 8.000%, 02/15/27 387,145 239,642 British Airways Pass Through Trust Series 2013-1, Class A* 4.625%, 12/20/25 252,453 133,060 Southwest Airlines Company Pass Through Trust Series 2007-1 6.650%, 08/01/22 135,606 500,000 Spirit Loyalty Cayman, Ltd. / Spirit IP Cayman, Ltd.* 8.000%, 09/20/25 560,235 326,973 UAL Pass Through Trust Series 2007-1 6.636%, 01/02/24 335,699 222,339 United Airlines Pass Through Trust Series 2014-2, Class B 4.625%, 03/03/24 227,742 2,797,891
Communication Services (3.0%) 700,000 Ashtead Capital, Inc.* 4.375%, 08/15/27 731,661 AT&T, Inc. 1,000,000 1.700%, 03/25/26 1,004,710 250,000 0.900%, 03/25/24 250,073 500,000 Bell Canada 0.750%, 03/17/24 497,590 750,000 Cogent Communications Group, Inc.* 3.500%, 05/01/26 760,740 1,000,000 Comcast Corp. 3.700%, 04/15/24 1,066,820 300,000 Crown Castle Towers, LLC* 3.720%, 07/15/43 306,843 Netflix, Inc. 500,000 3.625%, 06/15/25* 532,205 250,000 5.500%, 02/15/22 253,510 500,000 NTT Finance Corp.* 0.583%, 03/01/24 496,595 250,000 Qwest Corp. 6.750%, 12/01/21 251,093 1,000,000 Rogers Communications, Inc. 3.625%, 12/15/25 1,077,750 500,000 Sirius XM Radio, Inc.* 3.125%, 09/01/26 501,640 750,000 Sprint Corp. 7.875%, 09/15/23 833,685
T-Mobile USA, Inc. 250,000 4.000%, 04/15/22 $ 252,935 250,000 2.625%, 04/15/26 254,242 250,000 2.250%, 02/15/26 251,622 9,323,714
Consumer Discretionary (5.4%) American Honda Finance Corp. 500,000 0.650%, 09/08/23^ 500,235 250,000 1.300%, 09/09/26 248,155 250,000 0.750%, 08/09/24 248,523 250,000 0.550%, 07/12/24^ 247,308 BMW US Capital, LLC*^ 500,000 3.900%, 04/09/25 543,115 250,000 2.950%, 04/14/22 252,985 750,000 Brunswick Corp. 0.850%, 08/18/24 742,860 500,000 Cargill, Inc.* 3.250%, 11/15/21 500,550 Daimler Finance North America, LLC* 1,000,000 2.125%, 03/10/25 1,025,250 250,000 3.400%, 02/22/22 252,330 500,000 DISH DBS Corp. 5.875%, 07/15/22 513,785 1,000,000 Dollar General Corp. 3.250%, 04/15/23 1,031,460 1,000,000 Dollar Tree, Inc. 3.700%, 05/15/23 1,042,530 Ford Motor Credit Company, LLC 500,000 3.370%, 11/17/23 513,575 250,000 3.350%, 11/01/22 253,960 250,000 3.339%, 03/28/22^ 251,758 250,000 General Motors Company 5.400%, 10/02/23 270,725 1,000,000 General Motors Financial Company, Inc. 1.200%, 10/15/24 996,140 goeasy, Ltd.* 750,000 5.375%, 12/01/24 771,967 200,000 4.375%, 05/01/26 205,908 Lennar Corp. 500,000 4.750%, 11/15/22 516,860 250,000 4.500%, 04/30/24 268,500 750,000 Mattel, Inc.* 3.375%, 04/01/26 774,367 250,000 MGM Resorts International 6.000%, 03/15/23 264,470 500,000 Newell Brands, Inc. 4.350%, 04/01/23 521,445 250,000 Nissan Motor Acceptance Corp.* 1.050%, 03/08/24 248,528 500,000 Nordstrom, Inc.^ 2.300%, 04/08/24 502,840 500,000 Panasonic Corp.* 2.536%, 07/19/22 506,360
See accompanying Notes to Schedule of Investments

165www.calamos.com
Short-Term Bond Fund Schedule of Investments October 31, 2021
PRINCIPAL AMOUNT VALUE
PRINCIPAL AMOUNT VALUE
250,000 Target Corp. 2.250%, 04/15/25 $ 259,457 605,000 Taylor Morrison Communities, Inc. / Taylor Morrison Holdings II, Inc.* 5.875%, 04/15/23 633,441 Toll Brothers Finance Corp. 500,000 4.375%, 04/15/23 518,700 250,000 4.875%, 11/15/25 277,007 1,000,000 VF Corp. 2.400%, 04/23/25 1,035,240 16,740,334
Consumer Staples (1.3%) 200,000 Conagra Brands, Inc. 0.500%, 08/11/23 199,180 1,000,000 Constellation Brands, Inc. 4.250%, 05/01/23 1,052,150 200,000 Hormel Foods Corp.^ 0.650%, 06/03/24 199,436 750,000 Keurig Dr Pepper, Inc. 0.750%, 03/15/24 747,187 653,000 Land O’ Lakes, Inc.* 6.000%, 11/15/22 679,218 McCormick & Company Inc/MD 350,000 2.700%, 08/15/22 355,677 300,000 0.900%, 02/15/26 291,804 250,000 Mondelez International Holdings Netherlands, BV*^ 2.125%, 09/19/22 253,798 250,000 PepsiCo, Inc. 2.250%, 03/19/25 259,667 4,038,117
Energy (2.1%) 750,000 Baltimore Gas and Electric Company^ 2.800%, 08/15/22 759,060 1,000,000 BP Capital Markets America, Inc. 3.790%, 02/06/24 1,063,610 500,000 Continental Resources, Inc. 4.500%, 04/15/23 521,100 750,000 EQT Corp.* 3.125%, 05/15/26 756,945 1,000,000 Kinder Morgan Energy Partners, LP 3.500%, 09/01/23 1,041,640 250,000 ONEOK, Inc. 2.750%, 09/01/24 260,147 500,000 Phillips 66 4.300%, 04/01/22 508,230 750,000 Pioneer Natural Resources Company 0.750%, 01/15/24 745,785 500,000 Saudi Arabian Oil Company* 2.750%, 04/16/22 504,855 500,000 TransCanada PipeLines, Ltd.^ 1.000%, 10/12/24 497,900 6,659,272
Financials (23.1%) AerCap Ireland Capital DAC / AerCap Global Aviation Trust 500,000 2.875%, 08/14/24^ $ 518,055 500,000 1.750%, 10/29/24 500,510 500,000 1.650%, 10/29/24 501,190 500,000 1.150%, 10/29/23 500,300 150,000 4.450%, 12/16/21 150,242 55,000 Aflac, Inc.^ 1.125%, 03/15/26 54,486 Ally Financial, Inc. 250,000 3.050%, 06/05/23 258,050 250,000 1.450%, 10/02/23 252,488 250,000 American Express Company^ 2.750%, 05/20/22 252,815 750,000 Ameriprise Financial, Inc. 3.000%, 03/22/22 757,785 500,000 Aon Corp. 2.200%, 11/15/22 508,505 680,000 Ares Capital Corp.^ 3.500%, 02/10/23 701,080 Aviation Capital Group, LLC* 750,000 2.875%, 01/20/22^ 752,317 500,000 1.950%, 09/20/26 490,910 250,000 3.875%, 05/01/23 259,852 Bank of America Corp.‡ 500,000 2.456%, 10/22/25 3 mo. USD LIBOR + 0.87% 516,995 250,000 1.658%, 03/11/27 SOFR + 0.91% 248,903 250,000 0.981%, 09/25/25 SOFR + 0.91% 248,433 Bank of Montreal^ 500,000 1.250%, 09/15/26 490,820 500,000 0.625%, 07/09/24 495,480 Bank of New York Mellon Corp. 750,000 0.850%, 10/25/24 748,470 500,000 1.950%, 08/23/22 506,585 Bank of Nova Scotia 500,000 0.700%, 04/15/24 497,145 200,000 0.650%, 07/31/24^ 198,262 1,000,000 Barclays, PLC‡ 1.007%, 12/10/24 1 year CMT + 0.80% 999,560 300,000 Blackstone Private Credit Fund* 1.750%, 09/15/24 297,303 1,000,000 Brookfield Finance, Inc. 4.000%, 04/01/24 1,065,880 Buffalo State College Foundation Housing Corp. 450,000 2.100%, 11/01/22 454,757 400,000 2.000%, 11/01/21 400,000 500,000 Capital One Financial Company Sr Unsecured 11/27 Var 1.878%, 11/02/27 498,850
See accompanying Notes to Schedule of Investments

166
Short-Term Bond Fund Schedule of Investments October 31, 2021
PRINCIPAL AMOUNT VALUE
PRINCIPAL AMOUNT VALUE
Capital One Financial Corp. 500,000 3.900%, 01/29/24 $ 531,005 500,000 2.600%, 05/11/23 513,965 250,000 Caterpillar Financial Services Corp. 2.950%, 02/26/22 252,108 Charles Schwab Corp. 250,000 0.900%, 03/11/26^ 245,465 250,000 0.750%, 03/18/24 249,638 Citigroup, Inc.‡ 1,000,000 0.981%, 05/01/25 SOFR + 0.67% 996,170 500,000 1.281%, 11/03/25 SOFR + 0.53% 500,465 250,000 Citizens Bank NA/Providence RI 3.250%, 02/14/22 251,520 475,000 Credit Acceptance Corp.* 5.125%, 12/31/24 486,766 Credit Suisse AG/New York NY 500,000 1.000%, 05/05/23 502,750 250,000 0.495%, 02/02/24^ 247,970 1,000,000 CyrusOne, LP / CyrusOne Finance Corp. 2.900%, 11/15/24 1,043,390 1,500,000 Danske Bank, A/S*‡ 0.976%, 09/10/25 1 year CMT + 0.55% 1,489,005 1,250,000 Discover Bank 2.450%, 09/12/24 1,293,112 500,000 DNB Bank, ASA*‡ 0.856%, 09/30/25 1 year CMT + 0.33% 496,890 1,000,000 Duke Realty, LP 3.750%, 12/01/24 1,072,830 1,250,000 European Bank for Reconstruction & Development^ 0.500%, 11/25/25 1,221,312 1,000,000 European Investment Bank^ 0.250%, 09/15/23 995,490 Fifth Third Bancorp 500,000 4.300%, 01/16/24 534,395 500,000 1.707%, 11/01/27 499,550 500,000 FNB Corp/PA 2.200%, 02/24/23 506,045 500,000 Franklin Resources, Inc. 2.800%, 09/15/22 510,615 Goldman Sachs Group, Inc. 750,000 0.855%, 02/12/26‡ SOFR + 0.61% 736,132 500,000 0.925%, 10/21/24‡ SOFR + 0.49% 499,475 250,000 0.627%, 11/17/23‡ SOFR + 0.54% 249,735 150,000 5.750%, 01/24/22 151,868 350,000 HAT Holdings I, LLC / HAT Holdings II, LLC* 3.375%, 06/15/26 349,265
750,000 HSBC Holdings, PLC‡ 0.732%, 08/17/24 SOFR + 0.53% $ 747,045 500,000 Huntington National Bank 1.800%, 02/03/23 507,320 Hyundai Capital America* 500,000 0.875%, 06/14/24 494,600 250,000 3.950%, 02/01/22 251,980 250,000 3.000%, 06/20/22^ 253,583 250,000 2.375%, 02/10/23 254,622 Inter-American Development Bank 1,000,000 1.750%, 04/14/22 1,007,090 1,000,000 1.750%, 03/14/25^ 1,027,740 1,000,000 0.146%, 03/15/22‡ 3 mo. USD LIBOR + 0.03% 1,000,130 333,000 Intercontinental Exchange, Inc. 0.700%, 06/15/23 333,376 International Bank for Reconstruction & Development 1,000,000 1.625%, 02/10/22 1,003,850 1,000,000 1.625%, 01/15/25 1,024,060 300,000 Jaguar Holding Company II / Pharmaceutical Product Development, LLC* 4.625%, 06/15/25 312,594 JPMorgan Chase & Company‡ 500,000 0.824%, 06/01/25 SOFR + 0.54% 496,145 250,000 1.578%, 04/22/27 SOFR + 0.89% 247,858 250,000 0.768%, 08/09/25 SOFR + 0.49% 247,193 250,000 KeyBank NA/Cleveland OH‡ 0.423%, 01/03/24 SOFR + 0.34% 249,540 Kreditanstalt fuer Wiederaufbau 2,000,000 2.500%, 02/15/22 2,013,640 300,000 1.000%, 10/01/26 296,772 750,000 Ladder Capital Finance Holdings LLLP / Ladder Capital Finance Corp.* 5.250%, 10/01/25 760,410 750,000 Lloyds Banking Group, PLC‡ 0.695%, 05/11/24 1 year CMT + 0.55% 749,452 750,000 LSEGA Financing, PLC*^ 0.650%, 04/06/24 743,250 250,000 Macquarie Bank, Ltd.*^ 2.100%, 10/17/22 254,077 650,000 Macquarie Group, Ltd.*‡ 4.150%, 03/27/24 3 mo. USD LIBOR + 1.33% 679,107 335,000 Metropolitan Life Global Funding I*^ 0.700%, 09/27/24 332,849 750,000 Mizuho Financial Group, Inc.‡ 2.721%, 07/16/23 3 mo. USD LIBOR + 0.84% 761,025
See accompanying Notes to Schedule of InvestmentsCALAMOS OPEN-END FAMILY OF FUNDS ANNUAL REPORT

167www.calamos.com
Short-Term Bond Fund Schedule of Investments October 31, 2021
PRINCIPAL AMOUNT VALUE
PRINCIPAL AMOUNT VALUE
Morgan Stanley‡ 750,000 0.790%, 05/30/25 SOFR + 0.53% $ 742,417 750,000 0.731%, 04/05/24 SOFR + 0.62% 749,370 National Bank of Canada 500,000 2.150%, 10/07/22* 508,070 250,000 2.100%, 02/01/23 254,597 500,000 National Securities Clearing Corp.* 1.200%, 04/23/23 505,375 500,000 NatWest Group, PLC‡ 2.359%, 05/22/24 1 year CMT + 2.15% 511,455 500,000 NatWest Markets, PLC* 1.600%, 09/29/26 493,875 1,000,000 New York Life Global Funding* 0.900%, 10/29/24 999,320 500,000 Nordea Bank Abp* 1.500%, 09/30/26 492,970 1,000,000 Nordic Investment Bank 0.375%, 09/11/25 975,260 1,000,000 Oesterreichische Kontrollbank, AG^ 1.500%, 02/12/25 1,018,550 OneMain Finance Corp. 500,000 6.125%, 03/15/24 532,280 200,000 6.125%, 05/15/22 205,410 500,000 Pacific Life Global Funding II*^ 0.500%, 09/23/23 498,820 250,000 PNC Financial Services Group, Inc. 2.200%, 11/01/24 259,750 500,000 Pricoa Global Funding I*^ 1.200%, 09/01/26 492,490 250,000 Prudential Financial, Inc.^ 4.500%, 11/16/21 250,418 500,000 Reliance Standard Life Global Funding II* 3.850%, 09/19/23 528,200 500,000 Rocket Mortgage, LLC / Rocket Mortgage Co-Issuer, Inc.* 2.875%, 10/15/26 496,670 Royal Bank of Canada^ 250,000 1.950%, 01/17/23 254,470 250,000 0.875%, 01/20/26 244,088 750,000 Santander Holdings USA, Inc. 3.700%, 03/28/22 757,687 SBA Tower Trust* 500,000 1.631%, 05/15/51 493,755 250,000 1.840%, 04/15/27 249,317 200,000 1.884%, 07/15/50 202,815 190,000 2.836%, 01/15/50 197,213 Shell International Finance, BV 500,000 2.375%, 04/06/25 519,295 250,000 2.000%, 11/07/24^ 257,482 Skandinaviska Enskilda Banken, AB* 500,000 0.650%, 09/09/24^ 495,600 300,000 1.200%, 09/09/26 295,839
500,000 SLM Corp. 3.125%, 11/02/26 $ 495,925 State Street Corp.‡ 500,000 2.354%, 11/01/25^ SOFR + 0.94% 519,115 250,000 2.825%, 03/30/23 SOFR + 2.69% 252,435 500,000 StoneX Group, Inc.* 8.625%, 06/15/25 533,090 1,500,000 SVB Financial Group 3.500%, 01/29/25 1,599,690 Toronto-Dominion Bank 500,000 0.750%, 06/12/23^ 501,595 250,000 1.200%, 06/03/26 246,940 250,000 0.750%, 09/11/25 244,830 250,000 0.750%, 01/06/26^ 243,723 Truist Financial Corp. 250,000 3.050%, 06/20/22 253,750 250,000 2.200%, 03/16/23 255,450 UBS AG/London* 500,000 0.450%, 02/09/24 494,590 250,000 0.700%, 08/09/24 248,215 500,000 USAA Capital Corp.* 1.500%, 05/01/23 507,315 Ventas Realty, LP 1,000,000 3.500%, 04/15/24 1,058,630 1,000,000 3.500%, 02/01/25 1,062,270 500,000 VICI Properties, LP / VICI Note Company, Inc.*^ 3.500%, 02/15/25 510,280 500,000 Wells Fargo & Company‡ 1.654%, 06/02/24 SOFR + 1.60% 507,175 500,000 Zions Bancorp NA 3.350%, 03/04/22 503,725 71,123,868
Health Care (4.7%) AbbVie, Inc. 250,000 3.375%, 11/14/21 250,245 250,000 2.300%, 11/21/22 254,635 750,000 Anthem, Inc. 2.375%, 01/15/25 776,430 AstraZeneca, PLC 250,000 2.375%, 06/12/22 252,688 250,000 0.700%, 04/08/26 242,665 250,000 Bausch Health Companies, Inc.* 5.500%, 11/01/25 254,488 Bristol-Myers Squibb Company 1,000,000 2.900%, 07/26/24 1,052,730 250,000 3.550%, 08/15/22 256,115 474,000 Centene Corp. 4.250%, 12/15/27 496,799 250,000 Cigna Corp. 0.613%, 03/15/24 248,300
See accompanying Notes to Schedule of Investments
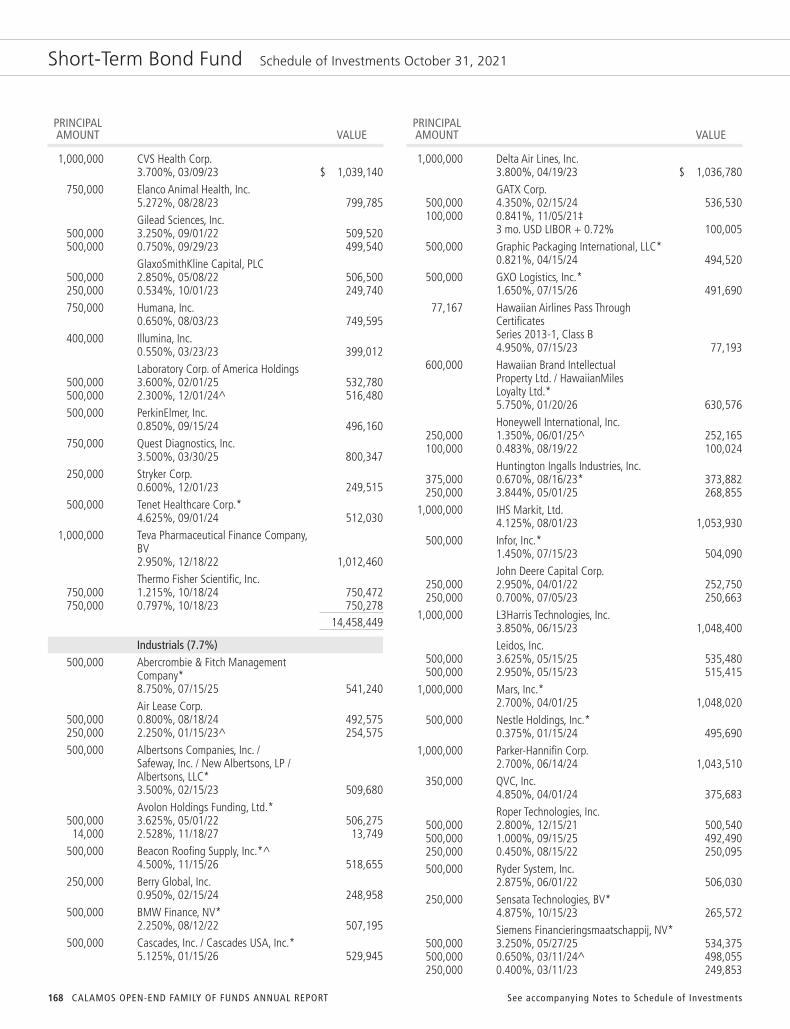
168
Short-Term Bond Fund Schedule of Investments October 31, 2021
PRINCIPAL AMOUNT VALUE
PRINCIPAL AMOUNT VALUE
1,000,000 CVS Health Corp. 3.700%, 03/09/23 $ 1,039,140 750,000 Elanco Animal Health, Inc. 5.272%, 08/28/23 799,785 Gilead Sciences, Inc. 500,000 3.250%, 09/01/22 509,520 500,000 0.750%, 09/29/23 499,540 GlaxoSmithKline Capital, PLC 500,000 2.850%, 05/08/22 506,500 250,000 0.534%, 10/01/23 249,740 750,000 Humana, Inc. 0.650%, 08/03/23 749,595 400,000 Illumina, Inc. 0.550%, 03/23/23 399,012 Laboratory Corp. of America Holdings 500,000 3.600%, 02/01/25 532,780 500,000 2.300%, 12/01/24^ 516,480 500,000 PerkinElmer, Inc. 0.850%, 09/15/24 496,160 750,000 Quest Diagnostics, Inc. 3.500%, 03/30/25 800,347 250,000 Stryker Corp. 0.600%, 12/01/23 249,515 500,000 Tenet Healthcare Corp.* 4.625%, 09/01/24 512,030 1,000,000 Teva Pharmaceutical Finance Company, BV 2.950%, 12/18/22 1,012,460 Thermo Fisher Scientific, Inc. 750,000 1.215%, 10/18/24 750,472 750,000 0.797%, 10/18/23 750,278 14,458,449
Industrials (7.7%) 500,000 Abercrombie & Fitch Management Company* 8.750%, 07/15/25 541,240 Air Lease Corp. 500,000 0.800%, 08/18/24 492,575 250,000 2.250%, 01/15/23^ 254,575 500,000 Albertsons Companies, Inc. / Safeway, Inc. / New Albertsons, LP / Albertsons, LLC* 3.500%, 02/15/23 509,680 Avolon Holdings Funding, Ltd.* 500,000 3.625%, 05/01/22 506,275 14,000 2.528%, 11/18/27 13,749 500,000 Beacon Roofing Supply, Inc.*^ 4.500%, 11/15/26 518,655 250,000 Berry Global, Inc. 0.950%, 02/15/24 248,958 500,000 BMW Finance, NV* 2.250%, 08/12/22 507,195 500,000 Cascades, Inc. / Cascades USA, Inc.* 5.125%, 01/15/26 529,945
1,000,000 Delta Air Lines, Inc. 3.800%, 04/19/23 $ 1,036,780 GATX Corp. 500,000 4.350%, 02/15/24 536,530 100,000 0.841%, 11/05/21‡ 3 mo. USD LIBOR + 0.72% 100,005 500,000 Graphic Packaging International, LLC* 0.821%, 04/15/24 494,520 500,000 GXO Logistics, Inc.* 1.650%, 07/15/26 491,690 77,167 Hawaiian Airlines Pass Through Certificates Series 2013-1, Class B 4.950%, 07/15/23 77,193 600,000 Hawaiian Brand Intellectual Property Ltd. / HawaiianMiles Loyalty Ltd.* 5.750%, 01/20/26 630,576 Honeywell International, Inc. 250,000 1.350%, 06/01/25^ 252,165 100,000 0.483%, 08/19/22 100,024 Huntington Ingalls Industries, Inc. 375,000 0.670%, 08/16/23* 373,882 250,000 3.844%, 05/01/25 268,855 1,000,000 IHS Markit, Ltd. 4.125%, 08/01/23 1,053,930 500,000 Infor, Inc.* 1.450%, 07/15/23 504,090 John Deere Capital Corp. 250,000 2.950%, 04/01/22 252,750 250,000 0.700%, 07/05/23 250,663 1,000,000 L3Harris Technologies, Inc. 3.850%, 06/15/23 1,048,400 Leidos, Inc. 500,000 3.625%, 05/15/25 535,480 500,000 2.950%, 05/15/23 515,415 1,000,000 Mars, Inc.* 2.700%, 04/01/25 1,048,020 500,000 Nestle Holdings, Inc.* 0.375%, 01/15/24 495,690 1,000,000 Parker-Hannifin Corp. 2.700%, 06/14/24 1,043,510 350,000 QVC, Inc. 4.850%, 04/01/24 375,683 Roper Technologies, Inc. 500,000 2.800%, 12/15/21 500,540 500,000 1.000%, 09/15/25 492,490 250,000 0.450%, 08/15/22 250,095 500,000 Ryder System, Inc. 2.875%, 06/01/22 506,030 250,000 Sensata Technologies, BV* 4.875%, 10/15/23 265,572 Siemens Financieringsmaatschappij, NV* 500,000 3.250%, 05/27/25 534,375 500,000 0.650%, 03/11/24^ 498,055 250,000 0.400%, 03/11/23 249,853
See accompanying Notes to Schedule of InvestmentsCALAMOS OPEN-END FAMILY OF FUNDS ANNUAL REPORT

169www.calamos.com
Short-Term Bond Fund Schedule of Investments October 31, 2021
PRINCIPAL AMOUNT VALUE
PRINCIPAL AMOUNT VALUE
SMBC Aviation Capital Finance DAC* 1,000,000 4.125%, 07/15/23^ $ 1,052,110 500,000 1.900%, 10/15/26 498,010 1,000,000 Southwest Airlines Company 4.750%, 05/04/23 1,058,200 750,000 Teledyne Technologies, Inc. 0.950%, 04/01/24 749,595 1,000,000 Waste Management, Inc. 3.500%, 05/15/24 1,055,150 600,000 WESCO Distribution, Inc.* 7.125%, 06/15/25 638,814 23,957,587
Information Technology (4.5%) 1,500,000 Apple, Inc. 2.850%, 05/11/24 1,572,210 1,000,000 Autodesk, Inc. 4.375%, 06/15/25 1,097,510 300,000 CDW, LLC / CDW Finance Corp. 4.125%, 05/01/25 309,696 500,000 CGI, Inc.* 1.450%, 09/14/26 489,625 500,000 Fidelity National Information Services, Inc. 0.600%, 03/01/24 496,035 500,000 Fortinet, Inc. 1.000%, 03/15/26 487,545 Hewlett Packard Enterprise Company 750,000 1.450%, 04/01/24 757,987 300,000 2.250%, 04/01/23 306,129 500,000 HP, Inc.* 1.450%, 06/17/26 493,440 500,000 Intuit, Inc. 0.650%, 07/15/23 500,820 500,000 KLA Corp.^ 4.650%, 11/01/24 547,695 1,000,000 Microchip Technology, Inc.* 0.972%, 02/15/24 994,560 500,000 NetApp, Inc. 1.875%, 06/22/25 508,385 750,000 NXP, BV / NXP Funding, LLC* 4.625%, 06/01/23 793,650 500,000 Oracle Corp. 2.400%, 09/15/23 513,850 750,000 PayPal Holdings, Inc. 2.200%, 09/26/22 762,495 750,000 PTC, Inc.* 3.625%, 02/15/25 763,290 Seagate HDD Cayman 400,000 4.250%, 03/01/22 402,828 350,000 4.750%, 06/01/23 366,877 500,000 Square, Inc.* 2.750%, 06/01/26 506,370
250,000 Texas Instruments, Inc.^ 1.125%, 09/15/26 $ 248,210 200,000 TSMC Arizona Corp. 1.750%, 10/25/26 201,138 750,000 VMware, Inc. - Class A 1.000%, 08/15/24 751,313 13,871,658
Materials (0.8%) 250,000 Avery Dennison Corp. 0.850%, 08/15/24 248,518 250,000 Ball Corp. 4.000%, 11/15/23 263,235 350,000 Clearwater Paper Corp.* 5.375%, 02/01/25 379,207 250,000 Georgia-Pacific, LLC* 0.625%, 05/15/24 248,303 500,000 Martin Marietta Materials, Inc. 0.650%, 07/15/23 500,060 750,000 Sealed Air Corp.* 5.250%, 04/01/23 784,672 2,423,995
Other (0.1%) 250,000 Toyota Motor Credit Corp.^ 0.800%, 01/09/26 244,450
Real Estate (2.2%) 250,000 American Tower Corp. 0.600%, 01/15/24 248,323 EPR Properties 750,000 5.250%, 07/15/23 797,182 500,000 4.500%, 04/01/25 536,030 Equinix, Inc. 500,000 1.000%, 09/15/25 490,290 250,000 1.250%, 07/15/25^ 248,075 500,000 Federal Realty Investment Trust 1.250%, 02/15/26 494,670 500,000 Forestar Group, Inc.* 3.850%, 05/15/26 500,615 1,000,000 Healthpeak Properties, Inc. 3.400%, 02/01/25 1,059,170 500,000 Kimco Realty Corp. 3.125%, 06/01/23 516,010 500,000 Service Properties Trust 5.000%, 08/15/22 503,600 Simon Property Group, LP 500,000 1.375%, 01/15/27 491,330 250,000 2.000%, 09/13/24^ 256,595 Welltower, Inc. 500,000 3.625%, 03/15/24 530,495 250,000 4.000%, 06/01/25 271,025 6,943,410
See accompanying Notes to Schedule of Investments

170
Short-Term Bond Fund Schedule of Investments October 31, 2021
PRINCIPAL AMOUNT VALUE
PRINCIPAL AMOUNT VALUE
Utilities (3.6%) 250,000 AES Corp. 1.375%, 01/15/26 $ 245,278 500,000 Alexander Funding Trust* 1.841%, 11/15/23 507,610 American Electric Power Company, Inc. 510,000 3.650%, 12/01/21^ 511,326 500,000 0.750%, 11/01/23 499,525 1,000,000 CMS Energy Corp. 3.600%, 11/15/25 1,073,120 250,000 Consolidated Edison, Inc. 0.650%, 12/01/23 249,595 300,000 DPL, Inc. 4.125%, 07/01/25 318,213 250,000 DTE Energy Company 2.250%, 11/01/22 254,105 500,000 Duke Energy Carolinas, LLC 3.350%, 05/15/22 508,240 750,000 Enel Finance International, NV* 2.650%, 09/10/24 780,697 250,000 Entergy Arkansas, LLC 3.500%, 04/01/26 270,830 300,000 Entergy Corp. 0.900%, 09/15/25 292,443 250,000 Entergy Louisiana, LLC 0.620%, 11/17/23 249,673 500,000 Entergy Texas, Inc. 1.500%, 09/01/26 488,925 500,000 Florida Power & Light Company 2.850%, 04/01/25 526,645 750,000 Georgia Power Company 2.100%, 07/30/23 768,202 National Rural Utilities Cooperative Finance Corp. 500,000 2.850%, 01/27/25 525,415 250,000 1.000%, 06/15/26 245,928 NextEra Energy Capital Holdings, Inc. 500,000 2.900%, 04/01/22 505,300 167,000 0.650%, 03/01/23 167,190 500,000 Pacific Gas and Electric Company 1.750%, 06/16/22 499,925 25,000 PPL Capital Funding, Inc.‡ 2.797%, 03/30/67 3 mo. USD LIBOR + 2.67% 24,013 250,000 Public Service Electric and Gas Company^ 0.950%, 03/15/26 246,838 250,000 Southern Company^ 0.600%, 02/26/24 248,065 250,000 Southern Power Company 0.900%, 01/15/26 243,365 500,000 WEC Energy Group, Inc. 0.800%, 03/15/24 498,600
250,000 Wisconsin Public Service Corp. 3.350%, 11/21/21 $ 250,417 10,999,483 TOTAL CORPORATE BONDS (Cost $182,881,734) 183,582,228
U.S. GOVERNMENT AND AGENCY SECURITIES (4.6%)
United States Treasury Note 8,000,000 0.250%, 09/30/23 7,968,750 2,000,000 2.000%, 05/31/24 2,068,281 2,000,000 1.750%, 07/31/24^ 2,057,500 2,000,000 0.125%, 02/15/24^ 1,979,766
TOTAL U.S. GOVERNMENT AND AGENCY SECURITIES (Cost $13,993,691) 14,074,297
SOVEREIGN BONDS (1.0%)
500,000 Kommunalbanken, AS* 0.500%, 01/13/26 486,930 750,000 Korea Development Bank 0.750%, 01/25/25 742,417 Svensk Exportkredit, AB 1,000,000 2.375%, 03/09/22 1,007,800 500,000 0.500%, 08/26/25 489,440 500,000 0.375%, 07/30/24 494,110
TOTAL SOVEREIGN BONDS (Cost $3,242,984) 3,220,697
BANK LOANS (7.7%)¡Airlines (0.2%)
470,000 AAdvantage Loyalty IP, Ltd.‡ 5.500%, 04/20/28 3 mo. LIBOR + 4.75% 490,123
Communication Services (1.5%) 1,500,000 Charter Communications Operating, LLC! 0.000%, 04/30/25 1,499,625 692,745 Go Daddy Operating Company, LLC‡ 1.837%, 02/15/24 1 mo. LIBOR + 1.75% 688,461 500,000 Go Daddy Operating Company, LLC! 0.000%, 02/15/24 496,908 500,000 Nexstar Broadcasting, Inc.‡ 2.582%, 09/18/26 1 mo. LIBOR + 2.50% 499,812 500,000 Nexstar Broadcasting, Inc.! 0.000%, 09/18/26 499,812 694,615 SBA Senior Finance II, LLC‡ 1.840%, 04/11/25 1 mo. LIBOR + 1.75% 689,913 250,000 SBA Senior Finance II, LLC! 0.000%, 04/11/25 248,308 4,622,839
See accompanying Notes to Schedule of InvestmentsCALAMOS OPEN-END FAMILY OF FUNDS ANNUAL REPORT

171www.calamos.com
Short-Term Bond Fund Schedule of Investments October 31, 2021
PRINCIPAL AMOUNT VALUE
PRINCIPAL AMOUNT VALUE
Consumer Discretionary (0.2%) 746,250 Murphy USA, Inc.‡ 2.250%, 01/31/28 1 mo. LIBOR + 1.75% $ 748,698
Consumer Staples (0.9%) 694,750 Energizer Holdings, Inc.‡ 2.750%, 12/22/27 1 mo. LIBOR + 2.25% 694,423 250,000 Energizer Holdings, Inc.! 0.000%, 12/22/27 249,883 1,449,730 JBS USA LUX, SA! 0.000%, 05/01/26 1,446,519 343,776 United Natural Foods, Inc.‡ 3.587%, 10/22/25 1 mo. LIBOR + 3.50% 344,498 2,735,323
Energy (0.4%) 1,000,000 DT Midstream, Inc.! 0.000%, 06/26/28 1,003,400 337,500 DT Midstream, Inc.‡ 2.500%, 06/26/28 6 mo. LIBOR + 2.00% 338,648 36,563 DT Midstream, Inc.‡ 2.500%, 06/26/28 3 mo. LIBOR + 2.00% 36,686 1,378,734
Financials (0.5%) 998,750 Jazz Financing Lux Sarl‡ 4.000%, 05/05/28 1 mo. LIBOR + 3.50% 1,001,372 505,992 Level 3 Financing, Inc.‡ 1.837%, 03/01/27 1 mo. LIBOR + 1.75% 499,937 1,501,309
Health Care (0.9%) 635,330 Avantor Funding, Inc.‡ 2.500%, 11/21/24 1 mo. LIBOR + 2.00% 635,829 500,000 Avantor Funding, Inc.! 0.000%, 11/08/27 500,418 946,500 Catalent Pharma Solutions Inc.‡ 2.500%, 02/22/28 1 mo. LIBOR + 2.00% 948,985 184,538 HCA, Inc.‡ 1.837%, 06/30/28 1 mo. LIBOR + 1.75% 185,902 399,271 Icon Luxembourg Sarl‡ 3.000%, 07/03/28 3 mo. LIBOR + 2.50% 399,770 99,479 Icon Luxembourg Sarl‡ 3.000%, 07/03/28 3 mo. LIBOR + 2.50% 99,603 2,770,507
Industrials (1.9%) 698,250 AECOM Technology Corp.‡ 1.837%, 04/13/28 1 mo. LIBOR + 1.75% $ 699,996 1,000,000 APi Group DE, Inc.! 0.000%, 10/07/28 1,001,125 996,250 Horizon Therapeutics USA, Inc.‡ 2.500%, 03/15/28 1 mo. LIBOR + 2.00% 995,269 676,600 Spectrum Brands, Inc.‡ 2.500%, 03/03/28 3 mo. LIBOR + 2.00% 676,285 250,000 Spectrum Brands, Inc.! 0.000%, 03/03/28 249,884 487,528 TransDigm, Inc.‡ 2.337%, 12/09/25 1 mo. LIBOR + 2.25% 482,114 1,090,454 United Rentals, Inc.‡ 1.837%, 10/31/25 1 mo. LIBOR + 1.75% 1,096,004 750,000 XPO Logistics, Inc.‡ 1.830%, 02/24/25 1 mo. LIBOR + 1.75% 746,119 5,946,796
Information Technology (1.2%) 248,125 Camelot U.S. Acquisition 1 Company‡ 4.000%, 10/30/26 1 mo. LIBOR + 3.00% 248,900 245,625 Camelot U.S. Acquisition 1 Company‡ 3.087%, 10/30/26 1 mo. LIBOR + 3.00% 244,612 694,750 Dell International, LLC‡ 2.000%, 09/19/25 1 mo. LIBOR + 1.75% 695,035 944,684 ON Semiconductor Corporation‡ 2.087%, 09/19/26 1 mo. LIBOR + 2.00% 944,830 694,602 Open Text Corporation‡ 1.837%, 05/30/25 1 mo. LIBOR + 1.75% 695,907 746,250 Playtika Holding Corp.‡ 2.837%, 03/13/28 1 mo. LIBOR + 2.75% 746,015 3,575,299
TOTAL BANK LOANS (Cost $23,787,808) 23,769,628
ASSET BACKED SECURITIES (11.9%)Communication Services (0.5%)
1,000,000 Verizon Owner Trust 2020-A 1.980%, 07/22/24 1,019,300 500,000 Verizon Owner Trust 2020-B 0.470%, 02/20/25 499,887 1,519,187
See accompanying Notes to Schedule of Investments
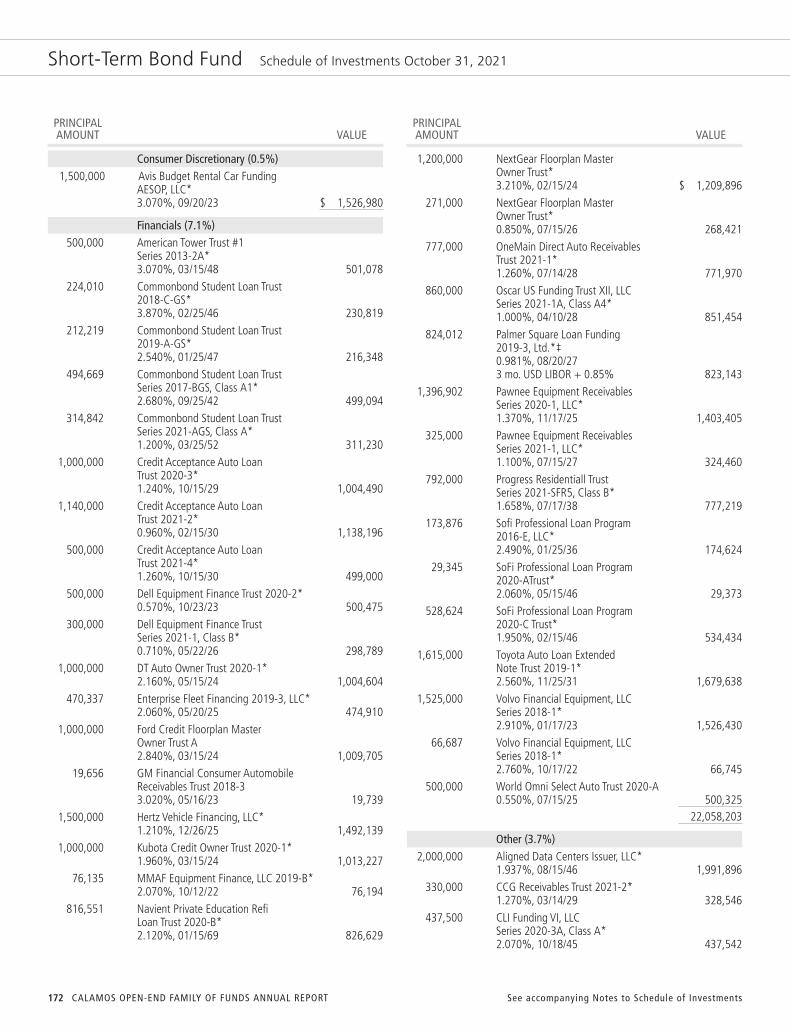
172
Short-Term Bond Fund Schedule of Investments October 31, 2021
PRINCIPAL AMOUNT VALUE
PRINCIPAL AMOUNT VALUE
Consumer Discretionary (0.5%) 1,500,000 Avis Budget Rental Car Funding AESOP, LLC* 3.070%, 09/20/23 $ 1,526,980
Financials (7.1%) 500,000 American Tower Trust #1 Series 2013-2A* 3.070%, 03/15/48 501,078 224,010 Commonbond Student Loan Trust 2018-C-GS* 3.870%, 02/25/46 230,819 212,219 Commonbond Student Loan Trust 2019-A-GS* 2.540%, 01/25/47 216,348 494,669 Commonbond Student Loan Trust Series 2017-BGS, Class A1* 2.680%, 09/25/42 499,094 314,842 Commonbond Student Loan Trust Series 2021-AGS, Class A* 1.200%, 03/25/52 311,230 1,000,000 Credit Acceptance Auto Loan Trust 2020-3* 1.240%, 10/15/29 1,004,490 1,140,000 Credit Acceptance Auto Loan Trust 2021-2* 0.960%, 02/15/30 1,138,196 500,000 Credit Acceptance Auto Loan Trust 2021-4* 1.260%, 10/15/30 499,000 500,000 Dell Equipment Finance Trust 2020-2* 0.570%, 10/23/23 500,475 300,000 Dell Equipment Finance Trust Series 2021-1, Class B* 0.710%, 05/22/26 298,789 1,000,000 DT Auto Owner Trust 2020-1* 2.160%, 05/15/24 1,004,604 470,337 Enterprise Fleet Financing 2019-3, LLC* 2.060%, 05/20/25 474,910 1,000,000 Ford Credit Floorplan Master Owner Trust A 2.840%, 03/15/24 1,009,705 19,656 GM Financial Consumer Automobile Receivables Trust 2018-3 3.020%, 05/16/23 19,739 1,500,000 Hertz Vehicle Financing, LLC* 1.210%, 12/26/25 1,492,139 1,000,000 Kubota Credit Owner Trust 2020-1* 1.960%, 03/15/24 1,013,227 76,135 MMAF Equipment Finance, LLC 2019-B* 2.070%, 10/12/22 76,194 816,551 Navient Private Education Refi Loan Trust 2020-B* 2.120%, 01/15/69 826,629
1,200,000 NextGear Floorplan Master Owner Trust* 3.210%, 02/15/24 $ 1,209,896 271,000 NextGear Floorplan Master Owner Trust* 0.850%, 07/15/26 268,421 777,000 OneMain Direct Auto Receivables Trust 2021-1* 1.260%, 07/14/28 771,970 860,000 Oscar US Funding Trust XII, LLC Series 2021-1A, Class A4* 1.000%, 04/10/28 851,454 824,012 Palmer Square Loan Funding 2019-3, Ltd.*‡ 0.981%, 08/20/27 3 mo. USD LIBOR + 0.85% 823,143 1,396,902 Pawnee Equipment Receivables Series 2020-1, LLC* 1.370%, 11/17/25 1,403,405 325,000 Pawnee Equipment Receivables Series 2021-1, LLC* 1.100%, 07/15/27 324,460 792,000 Progress Residentiall Trust Series 2021-SFR5, Class B* 1.658%, 07/17/38 777,219 173,876 Sofi Professional Loan Program 2016-E, LLC* 2.490%, 01/25/36 174,624 29,345 SoFi Professional Loan Program 2020-ATrust* 2.060%, 05/15/46 29,373 528,624 SoFi Professional Loan Program 2020-C Trust* 1.950%, 02/15/46 534,434 1,615,000 Toyota Auto Loan Extended Note Trust 2019-1* 2.560%, 11/25/31 1,679,638 1,525,000 Volvo Financial Equipment, LLC Series 2018-1* 2.910%, 01/17/23 1,526,430 66,687 Volvo Financial Equipment, LLC Series 2018-1* 2.760%, 10/17/22 66,745 500,000 World Omni Select Auto Trust 2020-A 0.550%, 07/15/25 500,325 22,058,203
Other (3.7%) 2,000,000 Aligned Data Centers Issuer, LLC* 1.937%, 08/15/46 1,991,896 330,000 CCG Receivables Trust 2021-2* 1.270%, 03/14/29 328,546 437,500 CLI Funding VI, LLC Series 2020-3A, Class A* 2.070%, 10/18/45 437,542
See accompanying Notes to Schedule of InvestmentsCALAMOS OPEN-END FAMILY OF FUNDS ANNUAL REPORT

173www.calamos.com
Short-Term Bond Fund Schedule of Investments October 31, 2021
PRINCIPAL AMOUNT VALUE
PRINCIPAL AMOUNT VALUE
1,209,000 CNH Equipment Trust 2020-A 2.300%, 10/15/27 $ 1,245,424 500,000 CNH Equipment Trust 2020-A 1.160%, 06/16/25 503,087 500,000 HPEFS Equipment Trust 2021-1* 0.570%, 03/20/31 497,473 402,443 MVW Owner Trust 2019-1* 2.890%, 11/20/36 412,296 140,566 SCF Equipment Leasing 2019-2, LLC* 2.220%, 06/20/24 141,272 500,000 SCF Equipment Leasing 2020-1, LLC* 1.190%, 10/20/27 501,094 1,070,000 SCF Equipment Leasing, LLC Series 2021-1A, Class A3* 0.830%, 08/21/28 1,062,697 400,000 Tesla Auto Lease Trust 2020-A* 0.680%, 12/20/23 401,027 500,000 Tesla Auto Lease Trust 2021-A* 1.020%, 03/20/25 500,934 775,000 Tesla Auto Lease Trust 2021-B* 0.910%, 09/22/25 769,373 1,504,792 Vantage Data Centers Issuer, LLC* 4.196%, 11/16/43 1,552,291 1,000,000 Verizon Master Trust 2021 2 B 1.280%, 04/20/28 999,688 11,344,640
Utilities (0.1%) 293,156 Harley-Davidson Motorcycle Trust 2020-A 1.870%, 10/15/24 295,309
TOTAL ASSET BACKED SECURITIES (Cost $36,670,857) 36,744,319
MUNICIPAL OBLIGATIONS (4.7%)Airlines (0.1%)
250,000 Dallas Fort Worth International Airport 1.041%, 11/01/23 251,585
Other (4.2%) 400,000 Alaska Housing Finance Corp. 0.846%, 12/01/23 399,042 250,000 Armada Area Schools 0.950%, 05/01/25 248,694 155,000 City of Auburn CA 0.961%, 06/01/25 153,278 210,000 City of Freeport IL 1.027%, 01/01/22 210,233 1,000,000 City of Montclair CA 0.926%, 06/01/24 997,674 500,000 City of Wheaton IL 0.786%, 12/01/24 497,515 300,000 City of Willows CA 0.770%, 08/01/23 299,521
240,000 City of Willows CA 0.720%, 08/01/22 $ 240,429 290,000 Cloverleaf Local School District 0.839%, 03/01/22 290,389 150,000 Colorado Housing and Finance Authority 0.858%, 11/01/24 149,324 175,000 Cook County School District No 94 0.700%, 12/01/21 175,025 250,000 Corona-Norco Unified School District 1.000%, 09/01/25 246,973 250,000 County of Bergen NJ 2.000%, 11/01/23 256,975 295,000 County of San Diego CA 0.600%, 10/01/23 294,016 290,000 County of San Diego CA 0.480%, 10/01/22 290,107 250,000 Cypress-Fairbanks Independent School District 5.000%, 02/15/25 282,486 400,000 Duluth Independant School District No. 709& 2.000%, 02/01/23 405,334 230,000 Duluth Independent School District No. 709 0.710%, 02/01/22 230,007 175,000 Encinitas Public Financing Authority 1.020%, 10/01/25 172,391 175,000 Encinitas Public Financing Authority 0.790%, 10/01/24 173,424 250,000 Galveston Independent School District 5.000%, 02/01/25 282,078 175,000 Haverstraw-Stony Point Central School District 0.790%, 05/01/23 174,832 200,000 Indiana Bond Bank Revenue 0.650%, 02/01/24 198,900 200,000 Indiana Bond Bank Revenue 0.470%, 02/01/23 199,770 640,000 Kentucky Housing Corp.+ 0.550%, 07/01/23 639,447 500,000 Lake Central Multi-District School Building Corp. 0.853%, 01/15/24 494,842 215,000 Minnetonka Independent School District No 276 2.000%, 01/01/24 220,992 155,000 Natomas Unified School District 0.700%, 08/01/22 155,409 150,000 Pharr San Juan Alamo Independent School District TX 5.000%, 02/01/25 169,280 250,000 Reedy Creek Improvement District 1.549%, 06/01/23 253,943
See accompanying Notes to Schedule of Investments

174
Short-Term Bond Fund Schedule of Investments October 31, 2021
PRINCIPAL AMOUNT VALUE
PRINCIPAL AMOUNT VALUE
400,000 Regl Transprtn Auth Il Regtrn 06/25 Fixed 3 3.000%, 06/01/25 $ 423,733 400,000 San Bernardino City Unified School District 0.792%, 08/01/23 400,682 250,000 Thornapple Kellogg School District 0.930%, 05/01/25 248,383 250,000 Torrance Joint Powers Financing Authority 1.289%, 10/01/22 251,970 250,000 Town of Oyster Bay NY 2.000%, 08/15/23 256,430 525,000 Town of Stratford CT 0.956%, 08/01/24 523,176 100,000 Ukiah Public Financing Authority 1.370%, 04/01/22 99,920 250,000 Village of Tarrytown NY 2.000%, 10/15/23 256,403 300,000 Virginia Housing Development Authority 0.607%, 09/01/23 300,578 250,000 West Covina Public Financing Authority 1.847%, 08/01/22 251,789 400,000 West Mifflin Sanitary Sewer Municipal Authority 1.052%, 08/01/23 396,652 250,000 West Mifflin Sanitary Sewer Municipal Authority 0.895%, 08/01/22 249,351 125,000 Wichita Falls 4B Sales Tax Corp. 1.049%, 09/01/25 123,309 340,000 Williamston Community Schools School District 1.050%, 05/01/25 339,059 200,000 Woodbury County Law Enforcement Center Authority 0.719%, 06/01/22 199,834 13,123,599
Utilities (0.4%) 505,000 Augusta GA Water & Sewer Revenue 4.300%, 10/01/26 537,732 135,000 City of Fountain Company Electric Water & Wastewater Utility Enterprise Revenue 0.930%, 12/01/23 133,314 100,000 City of Fountain Company Electric Water & Wastewater Utility Enterprise Revenue 0.870%, 12/01/22 99,659 100,000 City of Fountain Company Electric Water & Wastewater Utility Enterprise Revenue 0.770%, 12/01/21 99,974
260,000 Twin Lakes Regional Sewer District 0.570%, 07/01/23 $ 259,444 1,130,123
TOTAL MUNICIPAL OBLIGATIONS (Cost $14,533,793) 14,505,307
RESIDENTIAL MORTGAGE BACKED SECURITIES (1.4%)
1,190,000 BANK 2019-BNK16 3.933%, 02/15/52 1,247,548 1,548,000 CSAIL 2017-CX9 Commercial Mortgage Trust 3.054%, 09/15/50 1,574,228 1,125,706 Morgan Stanley Bank of America Merrill Lynch Trust 2014-C15 3.773%, 04/15/47 1,178,137 181,960 Wells Fargo Commercial Mortgage Trust 2015-LC20 2.678%, 04/15/50 181,936 100,403 Wells Fargo Commercial Mortgage Trust 2017-RC1 3.118%, 01/15/60 100,750 58,275 WFRBS Commercial Mortgage Trust 2012-C10 2.453%, 12/15/45 58,742 134,662 WFRBS Commercial Mortgage Trust 2014-LC14 3.522%, 03/15/47 138,379
TOTAL RESIDENTIAL MORTGAGE BACKED SECURITIES (Cost $4,464,970) 4,479,720
NUMBER OF SHARES/ PRINCIPAL AMOUNT VALUE
INVESTMENT OF CASH COLLATERAL FOR SECURITIES LOANED (6.0%)
18,541,423 State Street Navigator Securities Lending Government Money Market Portfolio† (Cost $18,541,423) 18,541,423
TOTAL INVESTMENTS (96.7%)(Cost $298,117,260) 298,917,619
PAYABLE UPON RETURN OF SECURITIES ON LOAN (-6.0%) (18,541,423)
OTHER ASSETS, LESS LIABILITIES (9.3%) 28,683,445
NET ASSETS (100.0%) $309,059,641
See accompanying Notes to Schedule of InvestmentsCALAMOS OPEN-END FAMILY OF FUNDS ANNUAL REPORT

175www.calamos.com
Short-Term Bond Fund Schedule of Investments October 31, 2021
NOTES TO SCHEDULE OF INVESTMENTS* Securities issued and sold pursuant to a Rule 144A transaction are
exempted from the registration requirement of the Securities Act of 1933,as amended. These securities may only be sold to qualified institutionalbuyers (“QIBs”), such as the Fund. Any resale of these securities mustgenerally be effected through a sale that is registered under the Act orotherwise exempted from such registration requirements.
^ Security, or portion of security, is on loan.
‡ Variable rate security. The rate shown is the rate in effect at October 31,2021.
¡ Bank loans generally are subject to mandatory and/or optionalprepayment. As a result, the actual remaining maturity of bank loans maybe substantially less than the stated maturities shown.
! This position represents an unsettled loan commitment at period end.Certain details associated with this purchase are not known prior to thesettlement date, including coupon rate, which will be adjusted onsettlement date.
+ Security or a portion of the security purchased on a delayed delivery orwhen-issued basis.
† Represents investment of cash collateral received from securities on loanas of October 31, 2021.
FUTURES CONTRACTS
MARKET VALUE/ UNREALIZEDNUMBER OF EXPIRATION NOTIONAL APPRECIATIONCONTRACTS DESCRIPTION DATE VALUE (DEPRECIATION)
Sales50 U.S. Treasury Note 5-Year Dec 2021 $6,087,500 $(94,639)
See accompanying Notes to Schedule of Investments
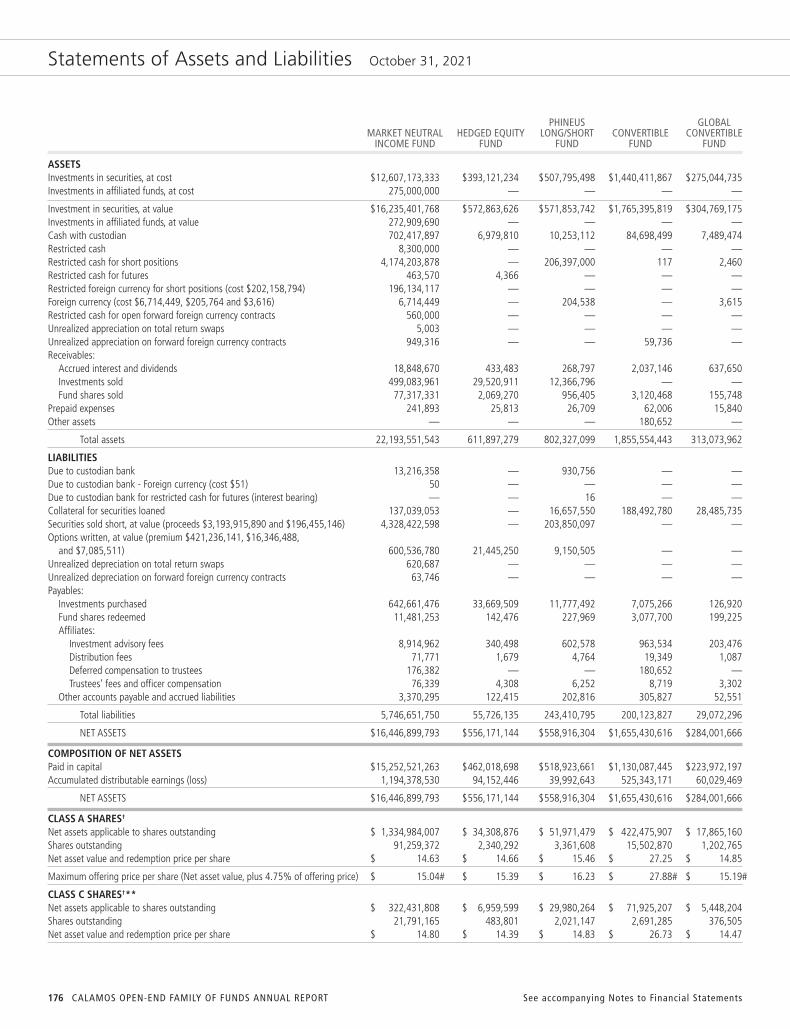
176 CALAMOS OPEN-END FAMILY OF FUNDS ANNUAL REPORT See accompanying Notes to Financial Statements
Statements of Assets and Liabilities October 31, 2021
PHINEUS GLOBAL MARKET NEUTRAL HEDGED EQUITY LONG/SHORT CONVERTIBLE CONVERTIBLE INCOME FUND FUND FUND FUND FUND
ASSETSInvestments in securities, at cost $12,607,173,333 $393,121,234 $507,795,498 $1,440,411,867 $275,044,735Investments in affiliated funds, at cost 275,000,000 — — — —
Investment in securities, at value $16,235,401,768 $572,863,626 $571,853,742 $1,765,395,819 $304,769,175Investments in affiliated funds, at value 272,909,690 — — — —Cash with custodian 702,417,897 6,979,810 10,253,112 84,698,499 7,489,474Restricted cash 8,300,000 — — — —Restricted cash for short positions 4,174,203,878 — 206,397,000 117 2,460Restricted cash for futures 463,570 4,366 — — —Restricted foreign currency for short positions (cost $202,158,794) 196,134,117 — — — —Foreign currency (cost $6,714,449, $205,764 and $3,616) 6,714,449 — 204,538 — 3,615Restricted cash for open forward foreign currency contracts 560,000 — — — —Unrealized appreciation on total return swaps 5,003 — — — —Unrealized appreciation on forward foreign currency contracts 949,316 — — 59,736 —Receivables:
Accrued interest and dividends 18,848,670 433,483 268,797 2,037,146 637,650Investments sold 499,083,961 29,520,911 12,366,796 — —Fund shares sold 77,317,331 2,069,270 956,405 3,120,468 155,748
Prepaid expenses 241,893 25,813 26,709 62,006 15,840Other assets — — — 180,652 —
Total assets 22,193,551,543 611,897,279 802,327,099 1,855,554,443 313,073,962
LIABILITIESDue to custodian bank 13,216,358 — 930,756 — —Due to custodian bank - Foreign currency (cost $51) 50 — — — —Due to custodian bank for restricted cash for futures (interest bearing) — — 16 — —Collateral for securities loaned 137,039,053 — 16,657,550 188,492,780 28,485,735Securities sold short, at value (proceeds $3,193,915,890 and $196,455,146) 4,328,422,598 — 203,850,097 — —Options written, at value (premium $421,236,141, $16,346,488,
and $7,085,511) 600,536,780 21,445,250 9,150,505 — —Unrealized depreciation on total return swaps 620,687 — — — —Unrealized depreciation on forward foreign currency contracts 63,746 — — — —Payables:
Investments purchased 642,661,476 33,669,509 11,777,492 7,075,266 126,920Fund shares redeemed 11,481,253 142,476 227,969 3,077,700 199,225Affiliates:
Investment advisory fees 8,914,962 340,498 602,578 963,534 203,476Distribution fees 71,771 1,679 4,764 19,349 1,087Deferred compensation to trustees 176,382 — — 180,652 —Trustees’ fees and officer compensation 76,339 4,308 6,252 8,719 3,302
Other accounts payable and accrued liabilities 3,370,295 122,415 202,816 305,827 52,551
Total liabilities 5,746,651,750 55,726,135 243,410,795 200,123,827 29,072,296
NET ASSETS $16,446,899,793 $556,171,144 $558,916,304 $1,655,430,616 $284,001,666
COMPOSITION OF NET ASSETSPaid in capital $15,252,521,263 $462,018,698 $518,923,661 $1,130,087,445 $223,972,197Accumulated distributable earnings (loss) 1,194,378,530 94,152,446 39,992,643 525,343,171 60,029,469
NET ASSETS $16,446,899,793 $556,171,144 $558,916,304 $1,655,430,616 $284,001,666
CLASS A SHARES†
Net assets applicable to shares outstanding $ 1,334,984,007 $ 34,308,876 $ 51,971,479 $ 422,475,907 $ 17,865,160Shares outstanding 91,259,372 2,340,292 3,361,608 15,502,870 1,202,765Net asset value and redemption price per share $ 14.63 $ 14.66 $ 15.46 $ 27.25 $ 14.85
Maximum offering price per share (Net asset value, plus 4.75% of offering price) $ 15.04# $ 15.39 $ 16.23 $ 27.88# $ 15.19#
CLASS C SHARES†**Net assets applicable to shares outstanding $ 322,431,808 $ 6,959,599 $ 29,980,264 $ 71,925,207 $ 5,448,204Shares outstanding 21,791,165 483,801 2,021,147 2,691,285 376,505Net asset value and redemption price per share $ 14.80 $ 14.39 $ 14.83 $ 26.73 $ 14.47

177www.calamos.comSee accompanying Notes to Financial Statements
Statements of Assets and Liabilities October 31, 2021
PHINEUS GLOBAL MARKET NEUTRAL HEDGED EQUITY LONG/SHORT CONVERTIBLE CONVERTIBLE INCOME FUND FUND FUND FUND FUND
CLASS I SHARES†
Net assets applicable to shares outstanding $14,780,637,486 $514,902,669 $476,964,561 $1,161,029,502 $260,688,302Shares outstanding 1,022,908,075 35,129,950 30,500,537 48,749,121 17,525,989Net asset value and redemption price per share $ 14.45 $ 14.66 $ 15.64 $ 23.82 $ 14.87
CLASS R6 SHARES†
Net assets applicable to shares outstanding $ 8,846,492 $ — $ — $ — $ —Shares Outstanding 611,860 — — — —Net asset value and redemption price per share $ 14.46 $ — $ — $ — $ —
† No par value; unlimited number of shares authorized.
# For Market Neutral Income Fund maximum offering price per share is Net asset value plus 2.75% of offering price. For Convertible Fund and Global Convertible Fund maximumofferingprice per share is Net asset value plus 2.25% of offering price.
** Redemption price may be reduced by contingent deferred sales charge.

178 CALAMOS OPEN-END FAMILY OF FUNDS ANNUAL REPORT See accompanying Notes to Financial Statements
Statements of Assets and Liabilities October 31, 2021
TIMPANI SMALL CAP TIMPANI SMID GROWTH AND GROWTH FUND GROWTH FUND GROWTH FUND INCOME FUND
ASSETSInvestments in securities, at cost $308,191,792 $16,877,251 $1,018,209,332 $1,583,363,660
Investment in securities, at value $443,718,256 $26,423,305 $1,837,557,466 $2,889,723,249Investments in affiliated funds, at value — — — —Cash with custodian 7,101,897 84,747 33,008,854 98,076,475Restricted cash for short positions — — 6,153 —Unrealized appreciation on forward foreign currency contracts — — — 51,896Receivables:
Accrued interest and dividends — 2 297,961 2,695,674Investments sold 7,552,836 447,034 16,847,758 5,751,786Fund shares sold 12,447,510 — 148,681 2,837,842Due from investment advisor 52,974 7,867 — —
Prepaid expenses 52,878 27,593 42,392 56,066Other assets — — 875,631 378,098
Total assets 470,926,351 26,990,548 1,888,784,896 2,999,571,086
LIABILITIESDue to Investment advisor — — — —Collateral for securities loaned — — 23,479,460 127,829,927Foreign currency overdraft (cost $60) — — — 58Options written, at value (premium $75,878 and $1,312,486) — — 56,700 536,975Payables:
Investments purchased 15,666,255 490,186 3,486,410 19,132,217Fund shares redeemed 143,980 5,038 940,575 1,460,360Affiliates:
Investment advisory fees 314,924 19,910 1,336,923 1,587,696Distribution fees 1,282 4 41,782 52,504Deferred compensation to trustees — — 875,631 378,098Trustees’ fees and officer compensation 2,906 2,220 12,043 18,748
Other accounts payable and accrued liabilities 89,237 19,847 450,628 529,353
Total liabilities 16,218,584 537,205 30,680,152 151,525,936
NET ASSETS $454,707,767 $26,453,343 $1,858,104,744 $2,848,045,150
COMPOSITION OF NET ASSETSPaid in capital $323,450,788 $14,530,356 $ 863,826,362 $1,417,479,388Accumulated distributable earnings (loss) 131,256,979 11,922,987 994,278,382 1,430,565,762
NET ASSETS $454,707,767 $26,453,343 $1,858,104,744 $2,848,045,150
CLASS A SHARES†
Net assets applicable to shares outstanding $ 35,274,073 $ 161,713 $1,436,708,975 $1,531,444,779Shares outstanding 833,612 8,900 31,314,689 31,783,363Net asset value and redemption price per share $ 42.31 $ 18.17 $ 45.88 $ 48.18
Maximum offering price per share (Net asset value, plus 4.75% of offering price) $ 44.42 $ 19.08 $ 48.17 $ 50.58
CLASS C SHARES†**(a)
Net assets applicable to shares outstanding $ 3,164,943 $ — $ 25,964,894 $ 98,647,372Shares outstanding 72,757 — 1,224,237 2,031,899Net asset value and redemption price per share $ 43.50 $ — $ 21.21 $ 48.55
CLASS I SHARES†
Net assets applicable to shares outstanding $387,149,131 $25,792,930 $ 395,430,875 $1,211,984,930Shares outstanding 8,870,064 1,411,054 5,908,392 26,336,100Net asset value and redemption price per share $ 43.65 $ 18.28 $ 66.93 $ 46.02
CLASS R6 SHARES†
Net assets applicable to shares outstanding $ 29,119,620 $ 498,700 $ — $ 5,968,069Shares Outstanding 665,782 27,286 — 129,636Net asset value and redemption price per share $ 43.74 $ 18.28 $ — $ 46.04
† No par value; unlimited number of shares authorized.
** Redemption price may be reduced by contingent deferred sales charge.
(a) Timpani Small Cap Growth Fund Class C shares commenced operations on June 25, 2021.

179www.calamos.comSee accompanying Notes to Financial Statements
Statements of Assets and Liabilities October 31, 2021
EVOLVING DIVIDEND INTERNATIONAL WORLD GROWTH GLOBAL EQUITY GROWTH FUND SELECT FUND GROWTH FUND FUND FUND
ASSETSInvestments in securities, at cost $ 9,109,536 $34,045,054 $220,371,435 $500,754,570 $ 83,024,678
Investment in securities, at value $17,506,332 $53,497,214 $314,372,799 $594,669,242 $138,353,760Cash with custodian 47,070 226,516 3,904,036 2,461,067 676,639Restricted cash for short positions — — — 2,480 —Foreign currency (cost $14,188 and $409) — — 14,072 409 —Unrealized appreciation on forward foreign currency contracts — — 4,526 — 1,350Receivables:
Accrued interest and dividends 13,030 22,693 481,415 373,508 102,002Investments sold 85,320 — 10,216 231,439 2,180,791Fund shares sold — 83 177,156 1,185,649 48,062Due from investment advisor 10,022 15,647 125,061 291,334 27,730
Prepaid expenses 30,773 15,299 30,791 75,071 24,744Other assets — 93,873 59,087 17,411 30,307
Total assets 17,692,547 53,871,325 319,179,159 599,307,610 141,445,385
LIABILITIESCollateral for securities loaned 57,360 — 15,927,726 15,402,702 2,471,810Payables:
Investments purchased 69,038 — — — 1,085,166Fund shares redeemed 2,500 20,600 150,864 844,483 66,680Affiliates:
Investment advisory fees 14,475 44,236 273,882 555,606 126,633Distribution fees 360 484 2,618 3,295 1,051Deferred compensation to trustees — 93,873 59,087 17,411 30,307Trustees’ fees and officer compensation 2,237 9,450 3,617 3,587 3,666
Other accounts payable and accrued liabilities 16,676 19,849 660,636 2,483,434 233,852
Total liabilities 162,646 188,492 17,078,430 19,310,518 4,019,165
NET ASSETS $17,529,901 $53,682,833 $302,100,729 $579,997,092 $137,426,220
COMPOSITION OF NET ASSETSPaid in capital $ 7,710,511 $30,600,498 $166,870,507 $502,904,546 $ 69,209,656Accumulated distributable earnings (loss) 9,819,390 23,082,335 135,230,222* 77,092,546* 68,216,564*
NET ASSETS $17,529,901 $53,682,833 $302,100,729 $579,997,092 $137,426,220
CLASS A SHARES†
Net assets applicable to shares outstanding $ 5,139,408 $14,210,952 $ 79,503,181 $ 54,730,535 $ 32,510,623Shares outstanding 300,060 694,044 2,757,530 2,459,573 1,767,159Net asset value and redemption price per share $ 17.13 $ 20.48 $ 28.83 $ 22.25 $ 18.40
Maximum offering price per share (Net asset value, plus 4.75% of offering price) $ 17.98 $ 21.50 $ 30.27 $ 23.36 $ 19.32
CLASS C SHARES†**Net assets applicable to shares outstanding $ 2,016,650 $ 887,047 $ 3,953,001 $ 16,050,466 $ 1,491,537Shares outstanding 122,304 50,627 158,531 781,137 96,559Net asset value and redemption price per share $ 16.49 $ 17.52 $ 24.94 $ 20.55 $ 15.45
CLASS I SHARES†
Net assets applicable to shares outstanding $10,373,843 $38,584,834 $216,723,386 $509,216,091 $103,256,150Shares outstanding 604,870 1,824,168 7,243,714 22,622,597 5,378,270Net asset value and redemption price per share $ 17.15 $ 21.15 $ 29.92 $ 22.51 $ 19.20
CLASS R6 SHARES†
Net assets applicable to shares outstanding $ — $ — $ 1,921,161 $ — $ 167,910Shares Outstanding — — 63,622 — 8,740Net asset value and redemption price per share $ — $ — $ 30.20 $ — $ 19.21
† No par value; unlimited number of shares authorized.
* Net of deferred foreign capital gains tax of $568,253, $2,316,880, and $188,232.
** Redemption price may be reduced by contingent deferred sales charge.

180 CALAMOS OPEN-END FAMILY OF FUNDS ANNUAL REPORT See accompanying Notes to Financial Statements
Statements of Assets and Liabilities October 31, 2021
GLOBAL OPPORTUNITIES FUND (FORMERLY, GLOBAL GROWTH HIGH INCOME AND INCOME TOTAL RETURN OPPORTUNITIES SHORT-TERM FUND) BOND FUND FUND BOND FUND
ASSETSInvestments in securities, at cost $210,928,229 $70,026,317 $ 44,169,307 $298,117,260
Investment in securities, at value $290,205,722 $71,782,104 $ 45,063,480 $298,917,619Investments in affiliated funds, at value — — — —Cash with custodian 7,992,599 316,803 1,457,474 21,526,542Restricted cash for short positions 2,070 — — —Variation margin on open futures contracts — 11,893 — 52,570Receivables:
Accrued interest and dividends 292,262 344,067 521,855 1,295,809Investments sold 1,372,215 427,901 63,448 —Fund shares sold 153,690 34,218 11,142 25,008,865Due from investment advisor 61,760 6,740 12,457 —
Prepaid expenses 29,324 26,550 25,402 23,994Other assets 142,195 34,103 103,448 —
Total assets 300,251,837 72,984,379 47,258,706 346,825,399
LIABILITIESDue to Investment advisor — — — 3,543Collateral for securities loaned 15,303,187 5,136,960 2,146,875 18,541,423Options written, at value (premium $970) — — 1,103 —Payables:
Investments purchased 2,493,885 498,630 375,079 18,278,449TBA and/or when-issued securities — — — 640,000Fund shares redeemed 36,667 79,954 77,185 5,059Dividends payable — 4,013 7,127 206,569Affiliates:
Investment advisory fees 228,612 26,001 22,691 59,101Distribution fees 4,350 701 1,023 73Deferred compensation to trustees 142,195 34,103 103,448 —Trustees’ fees and officer compensation 3,227 2,626 2,412 3,494
Other accounts payable and accrued liabilities 150,874 28,163 28,459 28,047
Total liabilities 18,362,997 5,811,151 2,765,402 37,765,758
NET ASSETS $281,888,840 $67,173,228 $ 44,493,304 $309,059,641
COMPOSITION OF NET ASSETSPaid in capital $188,202,930 $64,876,510 $ 54,491,062 $310,350,782Accumulated distributable earnings (loss) 93,685,910* 2,296,718 (9,997,758) (1,291,141)
NET ASSETS $281,888,840 $67,173,228 $ 44,493,304 $309,059,641
CLASS A SHARES†
Net assets applicable to shares outstanding $119,261,057 $22,394,140 $ 34,549,890 $ 2,661,424Shares outstanding 9,377,339 2,110,141 4,028,240 268,432Net asset value and redemption price per share $ 12.72 $ 10.61 $ 8.58 $ 9.91
Maximum offering price per share (Net asset value, plus 4.75% of offering price) $ 13.35 $ 10.85# $ 8.78# $ 10.14#
CLASS C SHARES†**Net assets applicable to shares outstanding $ 10,031,618 $ 799,812 $ 676,601 $ —Shares outstanding 918,263 75,386 74,060 —Net asset value and redemption price per share $ 10.92 $ 10.61 $ 9.14 $ —
CLASS I SHARES†
Net assets applicable to shares outstanding $152,596,165 $43,979,276 $ 9,266,813 $306,398,217Shares outstanding 11,573,829 4,143,237 1,080,153 30,931,653Net asset value and redemption price per share $ 13.18 $ 10.61 $ 8.58 $ 9.91
† No par value; unlimited number of shares authorized.
# For Total Return Bond Fund, High Income Opportunities Fund, and Short-Term Bond Fund, maximum offering price per share is Net asset value plus 2.25% of offering price.
* Net of deferred foreign capital gains tax of $88,630.
** Redemption price may be reduced by contingent deferred sales charge.

181www.calamos.comSee accompanying Notes to Financial Statements
Statements of Operations Year Ended October 31, 2021
PHINEUS GLOBAL MARKET NEUTRAL HEDGED EQUITY LONG/SHORT CONVERTIBLE CONVERTIBLE INCOME FUND FUND FUND FUND FUND
INVESTMENT INCOMEInterest $ 22,358,625 $ 21,474 $ 9,889 $ 6,773,009 $ 1,542,242(Amortization)/accretion of investment securities (415,317,874) — — (34,406,615) (7,193,074)
Net interest (392,959,249) 21,474 9,889 (27,633,606) (5,650,832)Dividends 121,248,825 7,435,881 7,667,540 8,722,653 1,115,581Dividends from affiliated funds 6,504,509 — — — —Dividend taxes withheld — — (75,798) — (343)
Total investment income (loss) (265,205,915) 7,457,355 7,601,631 (18,910,953) (4,535,594)
EXPENSESInvestment advisory fees 86,674,597 3,407,532 6,508,825 10,533,093 2,249,547Performance fees — — — — —Distribution fees
Class A 2,663,308 62,810 126,021 1,008,826 40,015Class C 2,869,453 48,399 291,676 688,184 54,710
Dividend or interest expense on short positions 15,007,090 — 3,490,098 — —Transfer agent fees 11,487,652 453,760 471,279 1,327,368 182,324Printing and mailing fees 1,053,398 45,902 39,571 125,557 15,728Fund administration fees 795,424 27,614 30,280 93,636 16,532Accounting fees 696,983 39,157 40,434 84,064 28,794Trustees’ fees and officer compensation 492,707 30,660 32,582 67,926 23,854Custodian fees 318,448 14,832 95,174 28,013 12,757Audit fees 294,848 18,348 16,878 39,211 14,039Legal fees 280,359 19,175 16,446 43,139 14,938Registration fees 262,796 68,350 59,771 104,814 54,218Other 782,911 36,974 102,382 95,676 27,085
Total expenses 123,679,974 4,273,513 11,321,417 14,239,507 2,734,541Less expense reductions (461,836) — — — —
Net expenses 123,218,138 4,273,513 11,321,417 14,239,507 2,734,541
NET INVESTMENT INCOME (LOSS) (388,424,053) 3,183,842 (3,719,786) (33,150,460) (7,270,135)
REALIZED AND UNREALIZED GAIN (LOSS)Net realized gain (loss) from:Investments, excluding purchased options 2,531,166,396 20,623,930 102,561,219 220,601,801 36,469,192Purchased options (244,125,798) (16,879,488) (51,395,936) 2,484,711 (253,018)Foreign currency transactions 73,800 — (152,941) — 27,002Forward foreign currency contracts 4,365,867 — — (619,964) —Written options (909,902,152) (64,295,996) 68,533,961 2,332,176 —Short positions (1,744,946,049) — (49,256,615) — —Total return swaps (61,617,034) — — — —Futures contracts 445,372 4,366 — — —Realized capital gain distribution from Affiliated fund 1,388,637 — — — —Change in net unrealized appreciation/(depreciation) on:Investments, excluding purchased options 1,420,810,479 136,689,097 80,459,694 135,131,813 11,474,881Affiliated funds (4,906,067) — — — —Purchased options (49,838,315) 47,606 (7,636,526) (895,142) (112,113)Foreign currency translations (10,178,633) — (1,574) — 2,948Forward foreign currency contracts 535,498 — — (3,159) —Written options (158,526,237) (2,570,804) 910,543 (2,356,223) —Short positions 431,463,921 — 10,460,256 — —Total return swaps 10,878,910 — — — —Futures contracts 94,768 929 — — —
NET GAIN (LOSS) 1,217,183,363 73,619,640 154,482,081 356,676,013 47,608,892
NET INCREASE (DECREASE) IN NET ASSETS RESULTING FROM OPERATIONS $ 828,759,310 $ 76,803,482 $150,762,295 $323,525,553 $40,338,757

182 CALAMOS OPEN-END FAMILY OF FUNDS ANNUAL REPORT See accompanying Notes to Financial Statements
Statements of Operations Year Ended October 31, 2021
TIMPANI SMALL CAP TIMPANI SMID GROWTH AND DIVIDEND GROWTH FUND GROWTH FUND GROWTH FUND INCOME FUND GROWTH FUND SELECT FUND
INVESTMENT INCOMEInterest $ 2,611 $ 83 $ 87,550 $ 4,325,001 $ 417 $ 549(Amortization)/accretion of investment securities — — — (7,021,432) — —
Net interest 2,611 83 87,550 (2,696,431) 417 549Dividends 451,322 27,090 8,062,956 33,682,884 221,816 467,212Dividend taxes withheld — — (3,336) (27,952) — —
Total investment income 453,933 27,173 8,147,170 30,958,501 222,233 467,761
EXPENSESInvestment advisory fees 2,685,552 220,851 15,055,081 17,411,853 161,765 483,920Performance fees — — — — — —Distribution fees
Class A 56,258 679 3,281,037 3,522,580 11,041 32,033Class C(a) 5,031 — 301,724 972,014 14,837 9,890
Dividend or interest expense on short positions — — — — — —Transfer agent fees 294,733 14,148 1,684,505 2,225,946 18,592 33,257Printing and mailing fees 44,552 9,273 226,212 217,771 5,501 7,544Fund administration fees 17,813 1,432 104,062 157,322 992 2,946Accounting fees 29,101 12,635 94,463 138,354 15,129 15,112Trustees’ fees and officer compensation 24,225 15,556 75,734 111,032 14,995 23,205Custodian fees 67,131 17,326 37,255 44,931 2,852 —Audit fees 15,787 9,056 41,543 59,066 8,908 9,556Legal fees 44,715 10,349 47,474 65,465 9,371 10,640Registration fees 66,280 44,191 66,920 96,351 45,546 46,660Other 17,852 4,901 100,318 158,998 6,516 7,738
Total expenses 3,369,030 360,397 21,116,328 25,181,683 316,045 682,501Less expense reductions (189,360) (103,916) — — (112,225) (204,517)
Net expenses 3,179,670 256,481 21,116,328 25,181,683 203,820 477,984
NET INVESTMENT INCOME (LOSS) (2,725,737) (229,308) (12,969,158) 5,776,818 18,413 (10,223)
REALIZED AND UNREALIZED GAIN (LOSS)Net realized gain (loss) from:Investments, excluding purchased options (3,877,881) 3,728,407 229,176,121 134,401,936 1,572,517 5,011,477Purchased options — — (13,807,537) 15,857,262 — —Foreign currency transactions — — — (364) — —Forward foreign currency contracts — — — (332,599) — —Written options — — 4,180,155 (3,754,581) — —Change in net unrealized appreciation/(depreciation) on:Investments, excluding purchased options 93,664,468 4,844,369 419,987,715 601,685,510 3,963,573 12,585,439Purchased options — — (518,343) 9,786,793 — —Foreign currency translations — — (209) 2 — —Forward foreign currency contracts — — — (81,886) — —Written options — — (2,097,715) 514,367 — —
NET GAIN (LOSS) 89,786,587 8,572,776 636,920,187 758,076,440 5,536,090 17,596,916
NET INCREASE (DECREASE) IN NET ASSETS RESULTING FROM OPERATIONS $87,060,850 $8,343,468 $623,951,029 $763,853,258 $5,554,503 $17,586,693
(a) Timpani Small Cap Growth Fund Class C shares commenced operations on June 25, 2021.

183www.calamos.comSee accompanying Notes to Financial Statements
Statements of Operations Year Ended October 31, 2021
GLOBAL OPPORTUNITIES FUND (FORMERLY, EVOLVING GLOBAL GROWTH INTERNATIONAL WORLD GLOBAL EQUITY AND INCOME TOTAL RETURN GROWTH FUND GROWTH FUND FUND FUND) BOND FUND
INVESTMENT INCOMEInterest $ 32,783 $ 521,235 $ 10,080 $ 467,302 $ 2,079,106(Amortization)/accretion of investment securities — (2,365,308) — (1,148,084) (52,182)
Net interest 32,783 (1,844,073) 10,080 (680,782) 2,026,924Dividends 4,038,865 9,116,945 1,246,664 3,103,478 938Foreign Taxes Withheld (467,034) (1,014,376) (95,224) (139,541) —
Total investment income 3,604,614 6,258,496 1,161,520 2,283,155 2,027,862
EXPENSESInvestment advisory fees 2,809,601 6,276,427 1,261,431 2,360,240 341,349Performance fees 279,283 — 127,174 — —Distribution fees
Class A 189,329 146,346 73,121 277,779 59,897Class C 50,232 176,455 28,886 89,278 11,641
Dividend or interest expense on short positions — — — — —Transfer agent fees 280,816 780,938 99,282 231,029 54,855Printing and mailing fees 23,963 71,205 9,481 28,257 11,009Fund administration fees 17,033 36,529 7,723 14,489 4,724Accounting fees 29,236 40,758 22,479 25,591 26,701Trustees’ fees and officer compensation 24,477 33,360 20,712 22,576 17,421Custodian fees 84,667 349,314 22,219 34,814 4,318Audit fees 14,066 21,186 11,127 13,545 9,917Legal fees 19,371 23,152 14,868 20,215 11,185Registration fees 61,693 91,249 62,297 50,678 65,204Other 29,693 65,535 16,837 28,489 27,975
Total expenses 3,913,460 8,112,454 1,777,637 3,196,980 646,196Less expense reductions (1,283,136) (1,744,036) (224,393) (350,259) (80,345)
Net expenses 2,630,324 6,368,418 1,553,244 2,846,721 565,851
NET INVESTMENT INCOME (LOSS) 974,290 (109,922) (391,724) (563,566) 1,462,011
REALIZED AND UNREALIZED GAIN (LOSS)Net realized gain (loss) from:Investments, excluding purchased options 42,025,046(a) (5,295,215)(a) 14,338,422(a) 19,157,007(a) 1,009,284Purchased options 3,156,134 (8,211,816) 478,234 (1,047,129) —Foreign currency transactions (133,559) (1,095,797) (8,388) 16,301 —Forward foreign currency contracts 1,652,265 70 370,123 — —Written options — 194,437 — 401,609 —Futures contracts — — — — (11,973)Change in net unrealized appreciation/(depreciation) on:Investments, excluding purchased options 24,692,582(b) 31,893,342(a) 23,438,249(b) 44,879,894(b) (2,351,325)Purchased options 594,718 282,839 124,704 143,440 —Foreign currency translations (5,725) (10,451) (313) (4,786) —Forward foreign currency contracts (239,506) — (55,974) — —Written options — — — 459,793 —Futures contracts — — — — (16,247)
NET GAIN (LOSS) 71,741,955 17,757,409 38,685,057 64,006,129 (1,370,261)
NET INCREASE (DECREASE) IN NET ASSETS RESULTING FROM OPERATIONS $72,716,245 $17,647,487 $38,293,333 $63,442,563 $ 91,750
(a) Net of foreign capital gains tax of $193,817, $1,013,026, $55,374, and $52,549.
(b) Net of change of $(356,816), (1,915,916), (112,026) and 5,508, respectively in deferred capital gains tax.

184 CALAMOS OPEN-END FAMILY OF FUNDS ANNUAL REPORT See accompanying Notes to Financial Statements
Statements of Operations Year Ended October 31, 2021
HIGH INCOME SHORT-TERM OPPORTUNITIES FUND BOND FUND
INVESTMENT INCOMEInterest $2,100,455 $ 4,379,804(Amortization)/accretion of investment securities 7,872 (380,973)
Net interest 2,108,327 3,998,831Dividends 70,953 1,172
Total investment income 2,179,280 4,000,003
EXPENSESInvestment advisory fees 256,440 562,884Distribution fees
Class A 83,701 8,112Class C 8,018 —
Transfer agent fees 48,365 30,427Printing and mailing fees 6,498 4,705Fund administration fees 2,619 11,245Accounting fees 30,794 32,026Trustees’ fees and officer compensation 15,970 21,362Custodian fees 5,542 5,659Audit fees 9,403 11,997Legal fees 9,908 12,670Registration fees 46,578 35,392Other 28,663 29,153
Total expenses 552,499 765,632Less expense reductions (140,229) (11,056)
Net expenses 412,270 754,576
NET INVESTMENT INCOME (LOSS) 1,767,010 3,245,427
REALIZED AND UNREALIZED GAIN (LOSS)Net realized gain (loss) from:Investments (386,223) 811,067Futures contracts — (59,953)Change in net unrealized appreciation/(depreciation) on:Investments 3,597,164 (2,135,817)Written options (133) —Futures contracts — (81,234)
NET GAIN (LOSS) 3,210,808 (1,465,937)
NET INCREASE (DECREASE) IN NET ASSETS RESULTING FROM OPERATIONS $4,977,818 $ 1,779,490
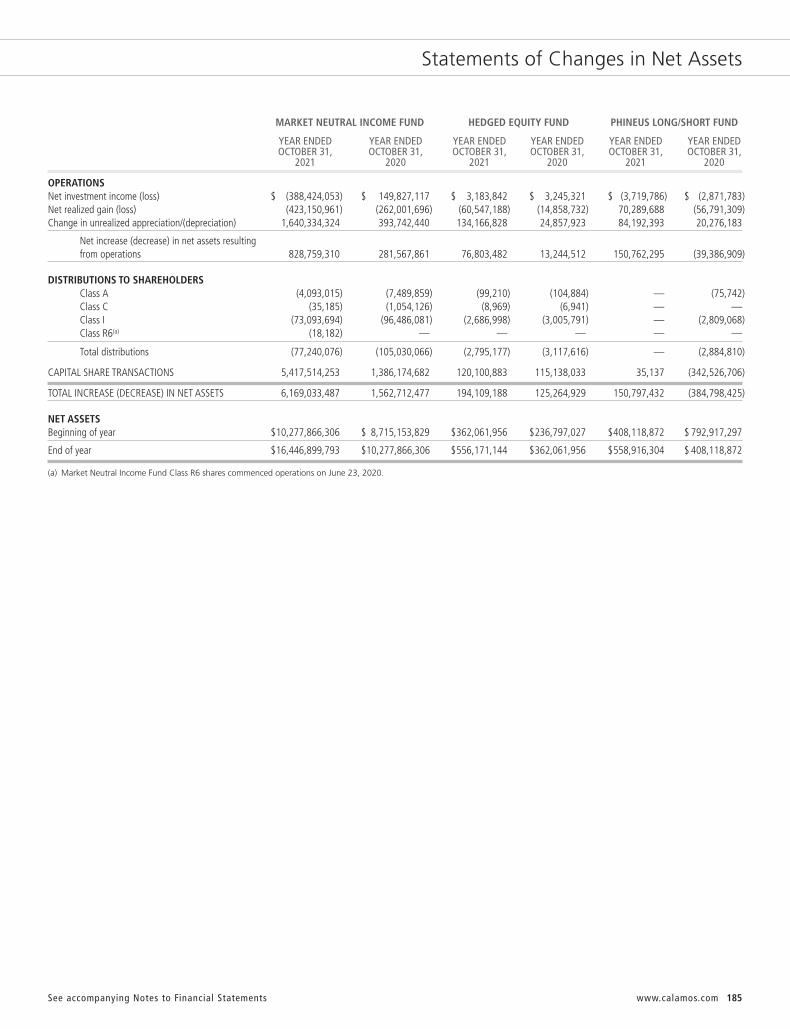
185www.calamos.comSee accompanying Notes to Financial Statements
Statements of Changes in Net Assets
MARKET NEUTRAL INCOME FUND HEDGED EQUITY FUND PHINEUS LONG/SHORT FUND
YEAR ENDED YEAR ENDED YEAR ENDED YEAR ENDED YEAR ENDED YEAR ENDED OCTOBER 31, OCTOBER 31, OCTOBER 31, OCTOBER 31, OCTOBER 31, OCTOBER 31, 2021 2020 2021 2020 2021 2020
OPERATIONSNet investment income (loss) $ (388,424,053) $ 149,827,117 $ 3,183,842 $ 3,245,321 $ (3,719,786) $ (2,871,783)Net realized gain (loss) (423,150,961) (262,001,696) (60,547,188) (14,858,732) 70,289,688 (56,791,309)Change in unrealized appreciation/(depreciation) 1,640,334,324 393,742,440 134,166,828 24,857,923 84,192,393 20,276,183
Net increase (decrease) in net assets resulting from operations 828,759,310 281,567,861 76,803,482 13,244,512 150,762,295 (39,386,909)
DISTRIBUTIONS TO SHAREHOLDERSClass A (4,093,015) (7,489,859) (99,210) (104,884) — (75,742)Class C (35,185) (1,054,126) (8,969) (6,941) — —Class I (73,093,694) (96,486,081) (2,686,998) (3,005,791) — (2,809,068)Class R6(a) (18,182) — — — — —
Total distributions (77,240,076) (105,030,066) (2,795,177) (3,117,616) — (2,884,810)
CAPITAL SHARE TRANSACTIONS 5,417,514,253 1,386,174,682 120,100,883 115,138,033 35,137 (342,526,706)
TOTAL INCREASE (DECREASE) IN NET ASSETS 6,169,033,487 1,562,712,477 194,109,188 125,264,929 150,797,432 (384,798,425)
NET ASSETSBeginning of year $10,277,866,306 $ 8,715,153,829 $362,061,956 $236,797,027 $408,118,872 $ 792,917,297
End of year $16,446,899,793 $10,277,866,306 $556,171,144 $362,061,956 $558,916,304 $ 408,118,872
(a) Market Neutral Income Fund Class R6 shares commenced operations on June 23, 2020.

186 CALAMOS OPEN-END FAMILY OF FUNDS ANNUAL REPORT See accompanying Notes to Financial Statements
Statements of Changes in Net Assets
TIMPANI SMALL CAP CONVERTIBLE FUND GLOBAL CONVERTIBLE FUND GROWTH FUND
YEAR ENDED YEAR ENDED YEAR ENDED YEAR ENDED YEAR ENDED YEAR ENDED OCTOBER 31, OCTOBER 31, OCTOBER 31, OCTOBER 31, OCTOBER 31, OCTOBER 31, 2021 2020 2021 2020 2021 2020
OPERATIONSNet investment income (loss) $ (33,150,460) $ 21,957,017 $ (7,270,135) $ 3,386,084 $ (2,725,737) $ (897,743)Net realized gain (loss) 224,798,724 75,387,193 36,243,176 16,403,115 (3,877,881) 6,474,109Change in unrealized appreciation/(depreciation) 131,877,289 136,925,487 11,365,716 14,324,075 93,664,468 25,621,782
Net increase (decrease) in net assets resulting from operations 323,525,553 234,269,697 40,338,757 34,113,274 87,060,850 31,198,148
DISTRIBUTIONS TO SHAREHOLDERSClass A (23,380,794) (1,824,939) (1,045,348) (169,920) (448,442) (355,909)Class C(b) (3,892,096) (129,160) (393,770) (55,671) — —Class I (64,455,836) (5,335,357) (16,845,247) (2,570,676) (6,108,848) (3,556,011)Class R6 — — — — (72,878) (53,959)
Total distributions (91,728,726) (7,289,456) (18,284,365) (2,796,267) (6,630,168) (3,965,879)
Return of capitalClass A — — — — (2) —Class I — — — — (23) —Class R6 — — — — — —
Total return of capital — — — — (25) —
CAPITAL SHARE TRANSACTIONS 259,758,376 191,970,630 53,416,871 44,280,008 238,535,395 28,050,622
TOTAL INCREASE (DECREASE) IN NET ASSETS 491,555,203 418,950,871 75,471,263 75,597,015 318,966,052 55,282,891
NET ASSETSBeginning of year $1,163,875,413 $ 744,924,542 $208,530,403 $132,933,388 $135,741,715 $ 80,458,824
End of year $1,655,430,616 $1,163,875,413 $284,001,666 $208,530,403 $454,707,767 $135,741,715
(b) Timpani Small Cap Growth Fund Class C shares commenced operations on June 25, 2021.

187www.calamos.comSee accompanying Notes to Financial Statements
Statements of Changes in Net Assets
TIMPANI SMID GROWTH FUND GROWTH FUND GROWTH AND INCOME FUND
YEAR ENDED YEAR ENDED YEAR ENDED YEAR ENDED YEAR ENDED YEAR ENDED OCTOBER 31, OCTOBER 31, OCTOBER 31, OCTOBER 31, OCTOBER 31, OCTOBER 31, 2021 2020 2021 2020 2021 2020
OPERATIONSNet investment income (loss) $ (229,308) $ (121,802) $ (12,969,158) $ (5,872,977) $ 5,776,818 $ 18,410,783Net realized gain (loss) 3,728,407 (23,843) 219,548,739 177,669,344 146,171,654 59,983,402Change in unrealized appreciation/(depreciation) 4,844,369 4,803,138 417,371,448 72,786,970 611,904,786 150,295,015
Net increase (decrease) in net assets resulting from operations 8,343,468 4,657,493 623,951,029 244,583,337 763,853,258 228,689,200
DISTRIBUTIONS TO SHAREHOLDERSClass A — — (128,871,354) (98,134,931) (36,912,502) (40,314,590)Class C — — (7,716,439) (7,680,613) (2,400,579) (3,659,187)Class I — — (24,434,261) (18,544,308) (30,498,794) (29,752,522)Class R6(c) — — — — (122,602) (53)
Total distributions — — (161,022,054) (124,359,852) (69,934,477) (73,726,352)
CAPITAL SHARE TRANSACTIONS 1,038,619 3,047,500 (25,604,069) (97,118,518) 70,103,447 (71,802,895)
TOTAL INCREASE (DECREASE) IN NET ASSETS 9,382,087 7,704,993 437,324,906 23,104,967 764,022,228 83,159,953
NET ASSETSBeginning of year $17,071,256 $ 9,366,263 $1,420,779,838 $1,397,674,871 $2,084,022,922 $2,000,862,969
End of year $26,453,343 $17,071,256 $1,858,104,744 $1,420,779,838 $2,848,045,150 $2,084,022,922
(c) Growth and Income Fund Class R6 shares commenced operations on June 23, 2020.

188 CALAMOS OPEN-END FAMILY OF FUNDS ANNUAL REPORT See accompanying Notes to Financial Statements
Statements of Changes in Net Assets
DIVIDEND GROWTH FUND SELECT FUND INTERNATIONAL GROWTH FUND
YEAR ENDED YEAR ENDED YEAR ENDED YEAR ENDED YEAR ENDED YEAR ENDED OCTOBER 31, OCTOBER 31, OCTOBER 31, OCTOBER 31, OCTOBER 31, OCTOBER 31, 2021 2020 2021 2020 2021 2020
OPERATIONSNet investment income (loss) $ 18,413 $ 83,332 $ (10,223) $ 272,182 $ 974,290 $ (94,906)Net realized gain (loss) 1,572,517 1,408,817 5,011,477 2,666,276 46,699,886 16,580,215Change in unrealized appreciation/(depreciation) 3,963,573 (692,399) 12,585,439 229,077 25,042,069 33,910,156
Net increase (decrease) in net assets resulting from operations 5,554,503 799,750 17,586,693 3,167,535 72,716,245 50,395,465
DISTRIBUTIONS TO SHAREHOLDERSClass A (314,294) (427,003) (561,996) (70,752) (3,751,792) —Class C (62,147) (78,044) (60,882) — (440,816) —Class I (798,425) (1,485,056) (1,424,305) (242,385) (9,711,583) —Class R6 — — — — (65,577) —
Total distributions (1,174,866) (1,990,103) (2,047,183) (313,137) (13,969,768) —
CAPITAL SHARE TRANSACTIONS (42,481) (2,899,623) (9,582,232) (155,321) 19,150,551 (31,189,036)
TOTAL INCREASE (DECREASE) IN NET ASSETS 4,337,156 (4,089,976) 5,957,278 2,699,077 77,897,028 19,206,429
NET ASSETSBeginning of year $13,192,745 $17,282,721 $47,725,555 $45,026,478 $224,203,701 $204,997,272
End of year $17,529,901 $13,192,745 $53,682,833 $47,725,555 $302,100,729 $224,203,701

189www.calamos.comSee accompanying Notes to Financial Statements
GLOBAL OPPORTUNITIES FUND EVOLVING WORLD (FORMERLY, GLOBAL GROWTH GROWTH FUND GLOBAL EQUITY FUND AND INCOME FUND)
YEAR ENDED YEAR ENDED YEAR ENDED YEAR ENDED YEAR ENDED YEAR ENDED OCTOBER 31, OCTOBER 31, OCTOBER 31, OCTOBER 31, OCTOBER 31, OCTOBER 31, 2021 2020 2021 2020 2021 2020
OPERATIONSNet investment income (loss) $ (109,922) $ (547,814) $ (391,724) $ (396,543) $ (563,566) $ 1,185,331Net realized gain (loss) (14,408,321) 24,212,381 15,178,391 7,916,114 18,527,788 7,623,114Change in unrealized appreciation/(depreciation) 32,165,730 30,112,642 23,506,666 14,542,348 45,478,341 15,122,597
Net increase (decrease) in net assets resulting from operations 17,647,487 53,777,209 38,293,333 22,061,919 63,442,563 23,931,042
DISTRIBUTIONS TO SHAREHOLDERSClass A (747,004) (185,052) (1,621,951) (1,443,237) (6,002,158) (963,092)Class C (333,159) — (377,975) (677,355) (624,026) (157,436)Class I (5,912,444) (1,308,635) (4,817,056) (3,950,779) (4,693,425) (671,550)Class R6(d) — — (8,657) — — —
Total distributions (6,992,607) (1,493,687) (6,825,639) (6,071,371) (11,319,609) (1,792,078)
CAPITAL SHARE TRANSACTIONS 331,901,974 23,192,489 14,327,412 (5,224,917) 66,293,575 (10,072,449)
TOTAL INCREASE (DECREASE) IN NET ASSETS 342,556,854 75,476,011 45,795,106 10,765,631 118,416,529 12,066,515
NET ASSETSBeginning of year $237,440,238 $161,964,227 $ 91,631,114 $80,865,483 $163,472,311 $151,405,796
End of year $579,997,092 $237,440,238 $137,426,220 $91,631,114 $281,888,840 $163,472,311
(d) Global Equity Fund Class R6 shares commenced operations on June 23, 2020.
Statements of Changes in Net Assets

190 CALAMOS OPEN-END FAMILY OF FUNDS ANNUAL REPORT See accompanying Notes to Financial Statements
Statements of Changes in Net Assets
HIGH INCOME TOTAL RETURN BOND FUND OPPORTUNITIES FUND SHORT-TERM BOND FUND
YEAR ENDED YEAR ENDED YEAR ENDED YEAR ENDED YEAR ENDED YEAR ENDED OCTOBER 31, OCTOBER 31, OCTOBER 31, OCTOBER 31, OCTOBER 31, OCTOBER 31, 2021 2020 2021 2020 2021 2020
OPERATIONSNet investment income (loss) $ 1,462,011 $ 1,517,466 $ 1,767,010 $ 2,127,446 $ 3,245,427 $ 4,735,665Net realized gain (loss) 997,311 967,759 (386,223) (818,932) 751,114 1,694,112Change in unrealized appreciation/(depreciation) (2,367,572) 2,130,719 3,597,031 (957,110) (2,217,051) 71,373
Net increase (decrease) in net assets resulting from operations 91,750 4,615,944 4,977,818 351,404 1,779,490 6,501,150
DISTRIBUTIONS TO SHAREHOLDERSClass A (542,753) (491,561) (1,080,427) (1,824,231) (134,481) (47,643)Class C (20,122) (31,410) (20,245) (63,841) — —Class I (1,303,761) (1,035,582) (288,687) (384,142) (7,632,234) (6,244,535)Class R6 — — — — — —
Total distributions (1,866,636) (1,558,553) (1,389,359) (2,272,214) (7,766,715) (6,292,178)
Return of capitalClass A — — (465,338) — — —Class C — — (8,676) — — —Class I — — (124,338) — — —
Total return of capital — — (598,352) — — —
CAPITAL SHARE TRANSACTIONS (17,806,314) 22,633,496 3,226,381 (3,816,942) 135,382,170 (38,697,303)
TOTAL INCREASE (DECREASE) IN NET ASSETS (19,581,200) 25,690,887 6,216,488 (5,737,752) 129,394,945 (38,488,331)
NET ASSETSBeginning of year $ 86,754,428 $61,063,541 $38,276,816 $44,014,568 $179,664,696 $218,153,027
End of year $ 67,173,228 $86,754,428 $44,493,304 $38,276,816 $309,059,641 $179,664,696
191www.calamos.com
Notes to Financial Statements
Note 1 – Organization and Significant Accounting PoliciesOrganization. CALAMOS INVESTMENT TRUST, a Massachusetts business trust organized December 21, 1987 (the “Trust”), consistsof eighteen series, Market Neutral Income Fund, Hedged Equity Fund, Phineus Long/Short Fund, Convertible Fund, GlobalConvertible Fund, Timpani Small Cap Growth Fund, Timpani SMID Growth Fund, Growth Fund, Growth and Income Fund, DividendGrowth Fund, Select Fund, International Growth Fund , Evolving World Growth Fund, Global Equity Fund, Global OpportunitiesFund (formerly, Global Growth and Income Fund), Total Return Bond Fund, High Income Opportunities Fund, and Short-Term BondFund, (each a “Fund” and collectively the “Funds”). The Trust is registered under the Investment Company Act of 1940 as amended(the “1940 Act”) as an open-end management investment company. The Fund is considered an investment company under U.S.GAAP and follows the accounting and reporting guidance applicable to investment companies. The Trust currently offers Class A,Class C (except Timpani SMID Growth Fund and Short-Term Bond Fund), and Class I shares of each of the Funds. Class R6 sharesare offered in Market Neutral Income Fund, Timpani Small Cap Growth Fund, Timpani SMID Growth Fund, Growth and IncomeFund, International Growth Fund and Global Equity Fund only.
Significant Accounting Policies. The financial statements have been prepared in conformity with accounting principles generallyaccepted in the United States of America (U.S. GAAP), and the Funds are each considered an investment company under U.S.GAAP and follow the accounting and reporting guidance applicable to investment companies. The Funds adhere to the accountingand reporting requirements set forth in ASU 2013-08 and ASC 946. Under U.S. GAAP, management is required to make certainestimates and assumptions at the date of the financial statements and actual results may differ from those estimates. Subsequentevents, if any, through the date that the financial statements were issued, have been evaluated in the preparation of the financialstatements. The following summarizes the significant accounting policies of the Fund:
Fund Valuation. The valuation of the Funds’ investments is in accordance with policies and procedures adopted by and under theultimate supervision of the board of trustees.
Fund securities that are traded on U.S. securities exchanges, except option securities, are valued at the official closing price, whichis the last current reported sales price on its principal exchange at the time each Fund determines its net asset value (“NAV”).Securities traded in the over-the-counter market and quoted on The NASDAQ Stock Market are valued at the NASDAQ OfficialClosing Price, as determined by NASDAQ, or lacking a NASDAQ Official Closing Price, the last current reported sale price onNASDAQ at the time a Fund determines its NAV. When a last sale or closing price is not available, equity securities, other thanoption securities, that are traded on a U.S. securities exchange and other equity securities traded in the over-the-counter marketare valued at the mean between the most recent bid and asked quotations on its principal exchange in accordance with guidelinesadopted by the board of trustees. Each option security traded on a U.S. securities exchange is valued at the mid-point of theconsolidated bid/ask quote for the option security, also in accordance with guidelines adopted by the board of trustees. Eachover-the-counter option that is not traded through the Options Clearing Corporation is valued either by an independent pricingagent approved by the board of trustees or based on a quotation provided by the counterparty to such option under the ultimatesupervision of the board of trustees.
Fixed income securities, bank loans, certain convertible preferred securities, and non-exchange traded derivatives are normallyvalued by independent pricing services or by dealers or brokers who make markets in such securities. Valuations of such fixedincome securities, bank loans, certain convertible preferred securities, and non-exchange traded derivatives consider yield or priceof equivalent securities of comparable quality, coupon rate, maturity, type of issue, trading characteristics and other market dataand do not rely exclusively upon exchange or over-the-counter prices.
Trading on European and Far Eastern exchanges and over-the-counter markets is typically completed at various times before theclose of business on each day on which the New York Stock Exchange (“NYSE”) is open. Each security trading on these exchangesor in over-the-counter markets may be valued utilizing a systematic fair valuation model provided by an independent pricing serviceapproved by the board of trustees. The valuation of each security that meets certain criteria in relation to the valuation model issystematically adjusted to reflect the impact of movement in the U.S. market after the foreign markets close. Securities that do notmeet the criteria, or that are principally traded in other foreign markets, are valued as of the last reported sale price at the time therespective Fund determines its NAV, or when reliable market prices or quotations are not readily available, at the mean betweenthe most recent bid and asked quotations as of the close of the appropriate exchange or other designated time. Trading of foreignsecurities may not take place on every NYSE business day. In addition, trading may take place in various foreign markets on Saturdaysor on other days when the NYSE is not open and on which the respective Fund’s NAV is not calculated.

192 CALAMOS OPEN-END FAMILY OF FUNDS ANNUAL REPORT
Notes to Financial Statements
If the pricing committee determines that the valuation of a security in accordance with the methods described above is not reflectiveof a fair value for such security, the security is valued at a fair value by the pricing committee, under the ultimate supervision of theboard of trustees, following the guidelines and/or procedures adopted by the board of trustees.
Each Fund also may use fair value pricing, pursuant to guidelines adopted by the board of trustees and under the ultimatesupervision of the board of trustees, if trading in the security is halted or if the value of a security it holds is materially affected byevents occurring before the Fund’s pricing time but after the close of the primary market or exchange on which the security islisted. Those procedures may utilize valuations furnished by pricing services approved by the board of trustees, which may be basedon market transactions for comparable securities and various relationships between securities that are generally recognized byinstitutional traders, a computerized matrix system, or appraisals derived from information concerning the securities or similarsecurities received from recognized dealers in those securities.
When fair value pricing of securities is employed, the prices of securities used by the Fund to calculate its NAV may differ frommarket quotations or official closing prices. There can be no assurance that the Fund could purchase or sell a portfolio security atthe price used to calculate the Fund’s net asset value (“NAV”).
Investment Transactions. Investment transactions are recorded on a trade date basis as of October 31, 2021. Net realized gainsand losses from investment transactions are reported on an identified cost basis. Interest income is recognized using the accrualmethod and includes accretion of original issue and market discount and amortization of premium. Dividend income is recognizedon the ex-dividend date, except that certain dividends from foreign securities are recorded as soon as the information becomesavailable after the ex-dividend date.
Foreign Currency Translation. Values of investments and other assets and liabilities denominated in foreign currencies aretranslated into U.S. dollars using a rate quoted by a major bank or dealer in the particular currency market, as reported by arecognized quotation dissemination service.
The Funds do not isolate that portion of the results of operations resulting from changes in foreign exchange rates on investmentsfrom the fluctuations arising from changes in market prices of securities held. Such fluctuations are included with the net realizedand unrealized gain or loss from investments.
Reported net realized foreign currency gains or losses arise from disposition of foreign currency, the difference in the foreignexchange rates between the trade and settlement dates on securities transactions, and the difference between the amounts ofdividends, interest and foreign withholding taxes recorded on the ex-date or accrual date and the U.S. dollar equivalent of theamounts actually received or paid. Net unrealized foreign exchange gains and losses arise from changes (due to the changes in theexchange rate) in the value of foreign currency and other assets and liabilities denominated in foreign currencies held at periodend.
Allocation of Expenses Among Funds and Classes. Expenses directly attributable to a Fund are charged to that Fund; certainother common expenses of the Trust, Calamos Advisors Trust, Calamos Convertible Opportunities and Income Fund, CalamosConvertible and High Income Fund, Calamos Strategic Total Return Fund, Calamos Global Total Return Fund, Calamos GlobalDynamic Income Fund, Calamos Dynamic Convertible and Income Fund, and Calamos Long/Short Equity and Dynamic Income Trustare allocated proportionately among each Fund to which the expenses relate in relation to the net assets of each Fund or on anotherreasonable basis. Expenses directly attributable to a particular class of a fund in the Trust are charged directly to such class. Incalculating the net asset value per share of each class, investment income, realized and unrealized gains and losses and expensesother than class specific expenses are allocated daily to each class of shares based upon the proportion of net assets of each classat the beginning of each day plus current day fund share activity.
Income Taxes. No provision has been made for U.S. income taxes because the Trust’s policy is to continue to qualify as a regulatedinvestment company under the Internal Revenue Code of 1986, as amended, and distribute to shareholders substantially all of theFunds’ taxable income and net realized gains.
Dividends and distributions paid to shareholders are recorded on the ex-dividend date. The amount of dividends and distributionsfrom net investment income and net realized capital gains is determined in accordance with federal income tax regulations, whichmay differ from U.S. generally accepted accounting principles. To the extent these “book/tax” differences are permanent in nature,

193www.calamos.com
Notes to Financial Statements
such amounts are reclassified within the capital accounts based on their federal tax-basis treatment. These differences are primarilydue to differing treatments for foreign currency transactions, contingent payment debt instruments and methods of amortizingand accreting for fixed income securities. The financial statements are not adjusted for temporary differences.
The Funds recognized no liability for uncertain tax positions. A reconciliation is not provided as the beginning and ending amountsof unrecognized benefits are zero, with no interim additions, reductions or settlements. Tax years 2018 – 2021 remain subject toexamination by the U.S. and the State of Illinois tax jurisdictions for those Funds that have been in existence during that time, andfor all years since inception for those Funds created subsequent to October 31, 2016.
Indemnifications. Under the Trust’s organizational documents, the Trust is obligated to indemnify its officers and trustees againstcertain liabilities incurred by them by reason of having been an officer or trustee of the Trust. In addition, in the normal course ofbusiness, the Trust may enter into contracts that provide general indemnifications to other parties. Each Fund’s maximum exposureunder these arrangements is unknown as this would involve future claims that may be made against the Fund that have not yetoccurred. Currently, the Funds’ management expects the risk of material loss in connection to a potential claim to be remote.
Note 2 – Investment Adviser and Transactions With Affiliates Or Certain Other PartiesPursuant to an investment advisory agreement with Calamos Advisors LLC (“Calamos Advisors”), each Fund pays a monthlyinvestment advisory fee based on the average daily net assets of the Fund, as shown below:
SELECT FUND, DIVIDEND GROWTH FUND, INTERNATIONAL GROWTH FUND*, EVOLVING WORLD TOTAL RETURN GLOBAL EQUITY FUND*, GROWTH FUND GROWTH FUND BOND FUND GLOBAL OPPORTUNITIES FUND**AVERAGE DAILY NET ASSETS ANNUAL RATE ANNUAL RATE ANNUAL RATE ANNUAL RATE
First $500 million 1.00% 1.10% 0.45% 1.00%
Next $500 million 0.90% 1.05% 0.43% 0.95%
Next $5 billion 0.80% 1.00% 0.41% 0.90%
Over $6 billion 0.70% 0.90% 0.35% 0.80%
* International Growth Fund and Global Equity Fund are subject to a possible adjustment based on performance as described below.
** Formerly Global Growth and Income Fund.
GROWTH AND INCOME FUND, CONVERTIBLE FUND, TIMPANI TIMPANI MARKET NEUTRAL
GLOBAL SMALL CAP SMID INCOME FUND, HIGH INCOME PHINEUSCONVERTIBLE GROWTH GROWTH SHORT-TERM HEDGED EQUITY OPPORTUNITIES LONG/SHORT
FUND FUND FUND BOND FUND FUND FUND FUNDAVERAGE DAILY NET ASSETS ANNUAL RATE ANNUAL RATE ANNUAL RATE ANNUAL RATE ANNUAL RATE ANNUAL RATE ANNUAL RATE
First $500 million 0.85% 0.90% 0.95% 0.30% 0.75% 0.60% 1.25%
Next $500 million 0.80% 0.80% 0.85% 0.27% 0.70% 0.55% 1.20%
Over $1 billion 0.75% 0.75% 0.80% 0.25% 0.65% 0.50% 1.15%
The average investment advisory fee as of the period ended October 31, 2021 was as follows:
FUND PERCENTAGE
Market Neutral Income Fund 0.66%Hedged Equity Fund 0.75Phineus Long/Short Fund 1.25Convertible Fund 0.70Global Convertible Fund 0.85Timpani Small Cap Growth Fund 0.90Timpani SMID Growth Fund 0.95

194 CALAMOS OPEN-END FAMILY OF FUNDS ANNUAL REPORT
Notes to Financial Statements
FUND PERCENTAGE
Growth Fund 0.89%Growth and Income Fund 0.68Dividend Growth Fund 1.00Select Fund 1.00International Growth Fund 1.00Evolving World Growth Fund 1.09Global Equity Fund 1.00Global Opportunities Fund (formerly, Global Growth and Income Fund) 1.00Total Return Bond Fund 0.45High Income Opportunities Fund 0.60Short-Term Bond Fund 0.30
Each of the International Growth and Global Equity Funds pays a fee based on average daily net assets of the Fund that is accrueddaily and paid on a monthly basis, subject to possible adjustment based on the Fund’s investment performance (since March 2006for International Growth Fund and since February 2008 for Global Equity Fund). The performance adjustment increases or decreasesthe management fee, on a monthly basis, by 1/12 of 0.03% of a Fund’s average daily net assets over the performance period foreach full 1% increment amount by which a Fund outperforms or underperforms the benchmark index (“Index”), on an annualizedbasis, over the performance measurement period. The benchmark indexes are the MSCI EAFE Growth Index and the MSCI WorldIndex for the International Growth Fund and Global Equity Fund, respectively.
The base fee is shown in the table above. The performance adjustment rate is calculated by comparing over the performancemeasurement period the Fund’s Class A share performance to that of the respective Index. The performance measurement periodcommenced at the beginning of each Fund’s first full month of operation (April 2005 and March 2007 for the International GrowthFund and Global Equity Fund, respectively). The first performance adjustment was applied to the advisory fee at the end of thetwelfth month. Each month subsequent to the twelfth month, a new month is added to the performance measurement perioduntil the performance measurement period includes 36 months. Thereafter, the performance measurement period consists of themost recent month plus the previous 35 months.
The performance comparison is made at the end of each month. The maximum annualized performance adjustment rate is+/- 0.30% of the Fund’s average daily net assets over the performance measurement period. The performance adjustment rate isdivided by twelve and multiplied by the Fund’s average daily net assets over the performance measurement period, and the resultingdollar amount is then added to or subtracted from the base fee. Calamos Advisors may receive a positive performance adjustmenteven if the Fund has a negative return over a performance measurement period if it otherwise outperforms the Index during thatperiod.
Each Fund may invest in shares of the Timpani Small Cap Growth Fund (“SCG”), Timpani SMID Growth Fund (“SMID”) or ShortTerm Bond Fund (“STBF”). Calamos Advisors has contractually agreed to waive a portion of its advisory fee charged to the Fundequal to the advisory fee paid by SCG, SMID or STBF, respectively, attributable to the Fund’s investment in SCG, SMID or STBF,respectively, based on daily net assets. For the period ended October 31, 2021, the total advisory fees waived pursuant to suchagreement were $461,836 for the Market Neutral Income Fund and are included in the Statements of Operations under the caption“Expense reductions”.
As of October 31, 2021, the Market Neutral Income Fund had holdings of $272.9 million in STBF. During the period fromNovember 1, 2020 through October 31, 2021, the Market Neutral Income Fund made net subscriptions of $125.0 million andearned $6.5 million in dividends.
The Funds reimburses Calamos Advisors for a portion of compensation paid to the Trust’s Chief Compliance Officer. Thiscompensation is reported as part of the “Trustees’ fees and officer compensation” expense on the Statements of Operations.

195www.calamos.com
Calamos Advisors has contractually agreed to limit the annual ordinary operating expenses of each Fund as a percentage of theaverage daily net assets as follows:
CLASS A CLASS C CLASS I CLASS R6 Fund SHARES SHARES SHARES SHARES
Market Neutral Income Fund 1.75% 2.50% 1.50% 1.50% less the annual sub-transfer agency ratio*Hedged Equity Fund(a) 1.25% 2.00% 1.00% —Phineus Long/Short Fund 2.00% 2.75% 1.75% —Convertible Fund 1.75% 2.50% 1.50% —Global Convertible Fund 1.35% 2.10% 1.10% —Timpani Small Cap Growth Fund 1.30% 2.05% 1.05% 1.05% less the annual sub-transfer agency ratio*Timpani SMID Growth Fund 1.35% — 1.10% 1.10% less the annual sub-transfer agency ratio*Growth Fund 1.75% 2.50% 1.50% —Growth and Income Fund 1.75% 2.50% 1.50% 1.50% less the annual sub-transfer agency ratio*Dividend Growth Fund 1.35% 2.10% 1.10% —Select Fund 1.15% 1.90% 0.90% —International Growth Fund 1.10% 1.85% 0.85% 0.85% less the annual sub-transfer agency ratio*Evolving World Growth Fund 1.30% 2.05% 1.05% —Global Equity Fund 1.40% 2.15% 1.15% 1.15% less the annual sub-transfer agency ratio*Global Opportunities Fund (formerly, Global Growth and Income Fund)(b) 1.22% 1.97% 0.97% —Total Return Bond Fund 0.90% 1.65% 0.65% —High Income Opportunities Fund 1.00% 1.75% 0.75% —Short-Term Bond Fund 0.65% — 0.40% —
* The annual sub-transfer agency ratio is equal to the aggregate sub-transfer agency expenses common to the other share classes of the Fund divided by the aggregatedaverage annual net assets of the Fund’s other share classes.
(a) Limit effective 3/1/21; for the period 11/01/20-2/28/21, the limit was 1.15%, 1.90% & 0.90% for Class A , C & I Shares, respectively
(b) Limit effective 4/1/21; for the period 11/01/20-3/31/21, the limit was 1.75%, 2.50% & 1.50% for Class A , C & I Shares, respectively.
Notes to Financial Statements

196 CALAMOS OPEN-END FAMILY OF FUNDS ANNUAL REPORT
Notes to Financial Statements
These agreements are binding on Calamos Advisors through March 1, 2023.
For the year ended October 31, 2021, Calamos Advisors waived or absorbed the following expenses:
FUND AMOUNT
Market Neutral Income Fund $ 461,836Timpani Small Cap Growth Fund 189,360Timpani SMID Growth Fund 103,916Dividend Growth Fund 112,225Select Fund 204,517International Growth Fund 1,283,136Evolving World Growth Fund 1,744,036Global Equity Fund 224,393Global Opportunities Fund (formerly, Global Growth and Income Fund) 350,259Total Return Bond Fund 80,345High Income Opportunities Fund 140,229Short-Term Bond Fund 11,056
These amounts are included in the Statements of Operations under the caption “Expense reductions”.
As Distributor, Calamos Financial Services LLC (“CFS”) assumed all expenses of personnel, office space, office facilities andequipment incidental to such service. Each Fund has adopted a Distribution Plan pursuant to Rule 12b-1 under the 1940 Actwhereby the Fund pays to CFS a distribution and/or service fee at the annual rate of 0.25% of the average daily net assets of theFund’s Class A shares; a service fee at the annual rate of 0.25% and a distribution fee at the rate of 0.75% of the average dailynet assets of the Fund’s Class C shares. No such fees are paid on each Fund’s Class I or Class R6 shares.
CFS also receives a sales commission and/or an underwriting fee on certain sales of each Fund’s Class A shares. During the periodended October 31, 2021, CFS received commissions and underwriting fees as follows:
FUND AMOUNT
Market Neutral Income Fund $101,277Hedged Equity Fund 21,216Phineus Long/Short Fund 7,842Convertible Fund 23,248Global Convertible Fund 1,189Timpani Small Cap Growth Fund 29,370Timpani SMID Growth Fund 54Growth Fund 44,760Growth and Income Fund 182,806Dividend Growth Fund 1,137Select Fund 836International Growth Fund 3,069Evolving World Growth Fund 19,106Global Equity Fund 2,501Global Opportunities Fund (formerly, Global Growth and Income Fund) 14,863Total Return Bond Fund 230High Income Opportunities Fund 225Short-Term Bond Fund 73

197www.calamos.com
A trustee and certain officers of the Trust are also officers and directors of CFS and Calamos Advisors. Such trustee and officersserve without direct compensation from the Trust. The Trust’s Statement of Additional Information contains additional informationabout the Trust’s Trustees and Officers and is available without charge, upon request, at www.calamos.com or by calling800.582.6959.
As of October 31, 2021, certain affiliates of Calamos Advisors hold material investments in the Funds as follows:
FUND PERCENTAGE
Timpani SMID Growth Fund 70%Select Fund 33Global Equity Fund 26High Income Opportunities Fund 30
As of October 31, 2021, the Market Neutral Income Fund, Phineus Long/Short Fund, and Growth Fund held 88.3%, 0.0%, and0.0% of the outstanding shares respectively of Short Term Bond Fund.
The Trust has adopted a deferred compensation plan (the “Plan”). Under the Plan, a trustee who is not an “interested person” (asdefined in the 1940 Act) and has elected to participate in the Plan (a “participating trustee”) may defer receipt of all or a portionof his compensation from the Trust. The deferred compensation payable to the participating trustee is credited to the trustee’sdeferral account as of the business day such compensation would have been paid to the participating trustee. The value of amountsdeferred for a participating trustee is determined by reference to the change in value of Class I shares of one or more funds ofthe Trust designated by the participant. The value of the account increases with contributions to the account or with increases inthe value of the measuring shares, and the value of the account decreases with withdrawals from the account or with declines inthe value of the measuring shares.
At October 31, 2021, the Funds had deferred compensation balances, which are included in “Other assets” on the Statements ofAssets and Liabilities, as follows:
FUND AMOUNT
Convertible Fund $180,652Growth Fund 875,631Growth and Income Fund 378,098Select Fund 93,873International Growth Fund 59,087Evolving World Growth Fund 17,411Global Equity Fund 30,307Global Opportunities Fund (formerly, Global Growth and Income Fund) 142,195Total Return Bond Fund 34,103High Income Opportunities Fund 103,448
Each Fund’s obligation to make payments under the Plan is a general obligation of the Fund and is included in “Payable for deferredcompensation to trustees” on the Statements of Assets and Liabilities at October 31, 2021.
Notes to Financial Statements

198 CALAMOS OPEN-END FAMILY OF FUNDS ANNUAL REPORT
Notes to Financial Statements
Interfund Lending ProgramThe SEC has granted an exemptive order to the Funds permitting the Funds to participate in an interfund lending facility wherebyparticipating Funds may directly lend to and borrow money from each other (an “Interfund Loan”) for temporary purposes (e.g., tosatisfy redemption requests or when a sale of securities “fails,” resulting in an unanticipated cash shortfall) (the “InterFundProgram”). The InterFund Program is subject to a number of conditions, which are discussed in detail in the Funds’ statement ofadditional information. Any loan made through the InterFund Program is expected to be more beneficial to a borrowing Fund(i.e., at a lower interest rate) than borrowing from a bank and more beneficial to a lending Fund (i.e., at a higher rate of return)than an alternative short-term investment. The duration of an InterFund Loan will be limited to the time required to receive paymentfor securities sold, but in no event more than seven days. In addition, each InterFund Loan may be called on one business day’snotice by a lending Fund and may be repaid on any day by a borrowing Fund. No Interfund Loans were made during the period.
Joint Credit AgreementOn April 30, 2021, the Trust, on behalf of the Funds, entered into a $50,000,000 Demand Discretionary Credit Agreement withState Street Bank and Trust Company (the “Credit Agreement”). Each Fund may borrow under the Credit Agreement to meetshareholder redemptions and for other lawful temporary purposes. Borrowing results in interest expense and other fees andexpenses, which may increase a Fund’s net expenses and reduce a Fund’s return. In addition, borrowing by a Fund may createleverage by increasing a Fund’s investment exposure. This will result in changes in a Fund’s net asset value, either positive or negative,being greater than it would have been if the Fund had not borrowed. Administration, legal, and arrangement fees, if applicable,under the Credit Agreement are allocated among Funds based upon factors deemed relevant by the Adviser and the Board of eachFund, while fees on any amounts drawn by a Fund under the Credit Agreement are borne by that Fund. At October 31, 2021,there were no borrowings under the Credit Agreement. Please see the supplement to the Prospectus and Statement of AdditionalInformation dated May 3, 2021 for more information about the Credit Agreement.
Note 3 – InvestmentsThe cost of purchases and proceeds from sales of long-term investments for the year ended October 31, 2021 were as follows:
COST OF PURCHASES PROCEEDS FROM SALES
U.S. GOV’T U.S. GOV’T FUND SECURITIES OTHER SECURITIES OTHER
Market Neutral Income Fund $ — $14,955,426,973 $ — $10,638,114,407Hedged Equity Fund — 208,148,576 — 181,747,998Phineus Long/Short Fund — 2,486,480,229 — 2,546,025,482Convertible Fund — 730,405,843 — 591,051,885Global Convertible Fund 2,356,399 121,114,536 2,727,925 84,871,595Timpani Small Cap Growth Fund — 706,448,033 — 486,753,755Timpani SMID Growth Fund — 43,996,995 — 43,155,535Growth Fund — 755,808,557 — 1,000,821,601Growth and Income Fund — 450,127,628 — 495,787,548Dividend Growth Fund — 3,136,733 — 4,230,827Select Fund — 11,756,480 — 22,681,869International Growth Fund — 279,864,546 — 271,678,672Evolving World Growth Fund — 1,052,632,904 — 754,715,551Global Equity Fund — 94,518,822 — 88,208,507Global Opportunities Fund (formerly, Global Growth and Income Fund) — 231,829,468 — 186,210,217Total Return Bond Fund 9,416,680 28,106,940 17,087,518 32,729,476High Income Opportunities Fund — 22,025,746 — 20,006,796Short-Term Bond Fund 9,968,125 179,824,618 4,091,883 78,426,614
The following information is presented on a federal income tax basis as of October 31, 2021. Differences between the cost basisunder U.S. generally accepted accounting principles and federal income tax purposes are primarily due to temporary differences.

199www.calamos.com
The cost basis of investments for federal income tax purposes at October 31, 2021 was as follows:
NET UNREALIZED COST BASIS OF GROSS UNREALIZED GROSS UNREALIZED APPRECIATIONFUND INVESTMENTS APPRECIATION DEPRECIATION (DEPRECIATION)
Market Neutral Income Fund $9,565,958,119 $3,699,336,878 $(1,686,558,602) $2,012,778,276Hedged Equity Fund 378,975,011 188,913,056 (10,453,765) 178,459,291Phineus Long/Short Fund 308,062,008 80,566,276 (29,775,144) 50,791,132Convertible Fund 1,450,401,278 340,557,604 (25,622,799) 314,934,805Global Convertible Fund 277,863,312 35,630,136 (8,724,273) 26,905,863Timpani Small Cap Growth Fund 311,358,777 134,035,857 (1,676,378) 132,359,479Timpani SMID Growth Fund 16,983,732 9,459,002 (19,429) 9,439,573Growth Fund 1,023,495,039 815,147,901 (1,142,174) 814,005,727Growth and Income Fund 1,601,625,904 1,298,307,404 (10,747,034) 1,287,560,370Dividend Growth Fund 9,126,319 8,442,391 (62,378) 8,380,013Select Fund 34,178,610 19,507,735 (189,131) 19,318,604International Growth Fund 220,494,190 96,785,501 (2,906,892) 93,878,609Evolving World Growth Fund 502,921,917 108,128,870 (16,381,545) 91,747,325Global Equity Fund 83,088,202 55,389,878 (124,320) 55,265,558Global Opportunities Fund (formerly, Global Growth and Income Fund) 211,196,535 80,888,728 (1,879,541) 79,009,187Total Return Bond Fund 70,119,167 2,429,497 (766,560) 1,662,937High Income Opportunities Fund 44,126,574 1,733,089 (797,286) 935,803Short-Term Bond Fund 300,333,712 1,539,704 (2,955,798) (1,416,094)
Note 4 – Income TaxesFor the fiscal year ended October 31, 2021, the Fund recorded the following permanent reclassifications to reflect tax character.The results of operations and net assets were not affected by these reclassifications.
UNDISTRIBUTED/ ACCUMULATED (OVERDISTRIBUTED) NET REALIZED PAID-IN NET INVESTMENT GAIN/(LOSS) ONFUND CAPITAL INCOME INVESTMENTS
Market Neutral Income Fund $ (6,755,203) $468,885,730 $(462,130,527)Hedged Equity Fund 2,317 (491,804) 489,487Phineus Long/Short Fund (1,932,174) 1,724,227 207,947Convertible Fund 7,996,134 34,984,928 (42,981,062)Global Convertible Fund 1,397,850 8,202,406 (9,600,256)Timpani Small Cap Growth Fund (2,725,762) 2,725,737 25Timpani SMID Growth Fund 84,768 351,572 (436,340)Growth Fund 16,440,313 13,050,661 (29,490,974)Growth and Income Fund 2,321,622 7,301,577 (9,623,199)Dividend Growth Fund 122,106 7,564 (129,670)Select Fund 1,112,187 49,710 (1,161,897)International Growth Fund 4,405,286 (159,346) (4,245,940)Evolving World Growth Fund (1,622,297) 3,266,856 (1,644,559)Global Equity Fund 1,432,793 420,245 (1,853,038)Global Opportunities Fund (formerly, Global Growth and Income Fund) 1,217,074 1,258,060 (2,475,134)Total Return Bond Fund — 226,541 (226,541)High Income Opportunities Fund (598,405) 643,563 (45,158)Short-Term Bond Fund (484,523) 1,007,776 (523,253)
Notes to Financial Statements

200 CALAMOS OPEN-END FAMILY OF FUNDS ANNUAL REPORT
Notes to Financial Statements
Distributions were characterized for federal income tax purposes as follows:
YEAR OR PERIOD ENDED YEAR ENDED OCTOBER 31, 2021 OCTOBER 31, 2020
ORDINARY LONG-TERM RETURN OF ORDINARY LONG-TERM RETURN OFFUND INCOME CAPITAL GAIN CAPITAL INCOME CAPITAL GAIN CAPITAL
Market Neutral Income Fund $77,240,076 $ — $ — $105,030,066 $ — $ —Hedged Equity Fund 2,795,177 — — 3,117,616 — —Phineus Long/Short Fund — — — 1,884,486 — 1,000,324Convertible Fund 23,011,285 68,717,440 — 7,289,456 — —Global Convertible Fund 8,075,991 10,208,374 — 2,110,346 685,921 —Timpani Small Cap Growth Fund — 6,630,168 25 — 3,965,879 —Growth Fund 2,572,719 158,449,335 — — 124,359,852 —Growth and Income Fund 35,180,486 34,753,991 — 25,311,459 48,414,893 —Dividend Growth Fund 22,251 1,152,615 — 92,175 1,897,928 —Select Fund — 2,047,183 — 313,137 — —International Growth Fund 941,757 13,028,011 — — — —Evolving World Growth Fund 91,008 6,901,599 — 1,493,687 — —Global Equity Fund 514,069 6,311,570 — — 6,071,371 —Global Opportunities Fund (formerly, Global Growth and Income Fund) 3,527,218 7,792,391 — 309,995 1,482,083 —Total Return Bond Fund 1,866,636 — — 1,558,553 — —High Income Opportunities Fund 1,389,359 — 598,352 2,272,214 — —Short-Term Bond Fund 6,716,397 1,050,318 — 6,279,345 12,833 —
As of October 31, 2021, the components of accumulated earnings/(loss) on a tax basis were as follows:
PHINEUS GLOBALMARKET NEUTRAL HEDGED EQUITY LONG/SHORT CONVERTIBLE CONVERTIBLE
INCOME FUND FUND FUND FUND FUND
Undistributed ordinary income $ 8,119,004 $ 394,105 $ — $ 52,891,284 $ 17,365,703Undistributed capital gains — — — 157,563,612 15,769,050Total undistributed earnings 8,119,004 394,105 — 210,454,896 33,134,753Accumulated capital and other losses (821,300,803) (84,876,534) (10,774,705) — (1,391)Net unrealized gains/(losses) 2,007,648,928 178,459,291 50,789,078 314,994,541 26,910,735Total accumulated earnings/(losses) 1,194,467,129 93,976,862 40,014,373 525,449,437 60,044,097Other (88,599) 175,584 (21,730) (106,266) (14,628)Paid-in-capital 15,252,521,263 462,018,698 518,923,661 1,130,087,445 223,972,197Net assets applicable to common shareholders $16,446,899,793 $556,171,144 $558,916,304 $1,655,430,616 $284,001,666

201www.calamos.com
TIMPANI SMALL CAP GROWTH TIMPANI SMID GROWTH AND DIVIDEND
FUND GROWTH FUND GROWTH FUND INCOME FUND GROWTH FUND
Undistributed ordinary income $ — $ 334,298 $ 56,615,150 $ 41,046,269 $ 38,284Undistributed capital gains — 2,149,114 131,148,901 104,832,731 1,401,093Total undistributed earnings — 2,483,412 187,764,051 145,879,000 1,439,377Accumulated capital and other losses (1,102,500) — (7,397,832) (2,620,193) —Net unrealized gains/(losses) 132,359,479 9,439,575 814,004,915 1,287,612,268 8,380,013Total accumulated earnings/(losses) 131,256,979 11,922,987 994,371,134 1,430,871,075 9,819,390Other — — (92,752) (305,313) —Paid-in-capital 323,450,788 14,530,356 863,826,362 1,417,479,388 7,710,511Net assets applicable to common shareholders $454,707,767 $26,453,343 $1,858,104,744 $2,848,045,150 $17,529,901
GLOBAL OPPORTUNITIES FUND (FORMERLY, GLOBAL GROWTH INTERNATIONAL EVOLVING WORLD GLOBAL EQUITY AND INCOME
SELECT FUND GROWTH FUND GROWTH FUND FUND FUND)
Undistributed ordinary income $ 1,439,954 $ 13,108,182 $ 3,175,489 $ 1,770,057 $ 5,451,950Undistributed capital gains 2,430,611 29,479,859 — 11,645,200 9,656,804Total undistributed earnings 3,870,565 42,588,041 3,175,489 13,415,257 15,108,754Accumulated capital and other losses (10,013) (615,859) (15,322,311) (199,219) (268,383)Net unrealized gains/(losses) 19,318,604 93,320,951 89,413,001 55,078,860 78,921,585Total accumulated earnings/(losses) 23,179,156 135,293,133 77,266,179 68,294,898 93,761,956Other (96,821) (62,911) (173,633) (78,334) (76,046)Paid-in-capital 30,600,498 166,870,507 502,904,546 69,209,656 188,202,930Net assets applicable to common shareholders $53,682,833 $302,100,729 $579,997,092 $137,426,220 $281,888,840
HIGH INCOME TOTAL RETURN OPPORTUNITIES SHORT-TERM
BOND FUND FUND BOND FUND
Undistributed ordinary income $ 50,446 $ — $ —Undistributed capital gains 721,123 — —Total undistributed earnings 771,569 — —Accumulated capital and other losses — (10,829,158) (234,795)Net unrealized gains/(losses) 1,662,943 939,003 (1,416,094)Total accumulated earnings/(losses) 2,434,512 (9,890,155) (1,650,889)Other (137,794) (107,603) 359,748Paid-in-capital 64,876,510 54,491,062 310,350,782Net assets applicable to common shareholders $67,173,228 $ 44,493,304 $309,059,641
Notes to Financial Statements

202 CALAMOS OPEN-END FAMILY OF FUNDS ANNUAL REPORT
Notes to Financial Statements
The following Funds had capital loss carryforwards for the year ended October 31, 2021, with no expiration date, available tooffset future realized capital gains:
FUND SHORT-TERM LONG-TERM
Market Neutral Income Fund $777,436,131 $ —Hedged Equity Fund 37,602,846 47,055,997Phineus Long/Short Fund 5,228,659 —Timpani Small Cap Growth Fund 1,102,500 —Evolving World Growth Fund 14,302,497 —High Income Opportunities Fund 1,128,959 9,700,199Short-Term Bond Fund 160,485 74,310
The capital loss carryforwards utilized in the year ended October 31, 2021 in Phineus Long/Short Fund and Timpani SMID GrowthFund are $30,975,869 and $786,171, respectively.
Note 5 – Short SalesSecurities sold short represent obligations to deliver the securities at a future date. A Fund may sell a security it does not own inanticipation of a decline in the value of that security before the delivery date. When the Fund sells a security short, it must borrowthe security sold short and deliver it to the broker-dealer through which it made the short sale. Dividends paid on securities soldshort are disclosed as an expense on the Statements of Operations. A gain, limited to the price at which the Fund sold the securityshort, or a loss, unlimited in size, will be realized upon the termination of a short sale.
To secure its obligation to deliver to the broker-dealer the securities sold short, the Fund must segregate an amount of cash orliquid securities with its custodian equal to any excess of the current market value of the securities sold short over any cash orliquid securities deposited as collateral with the broker in connection with the short sale (not including the proceeds of the shortsale). As a result of that requirement, the Fund will not gain any leverage merely by selling short, except to the extent that it earnsinterest or other income or gains on the segregated cash or liquid securities while also being subject to the possibility of gain orloss from the securities sold short.
Note 6 – Derivative InvestmentsForeign Currency Risk. Each Fund may engage in portfolio hedging with respect to changes in currency exchange rates by enteringinto forward foreign currency contracts to purchase or sell currencies. A forward foreign currency contract is a commitment topurchase or sell a foreign currency at a future date at a negotiated forward rate. Risks associated with such contracts include,among other things, movement in the value of the foreign currency relative to the U.S. dollar and the ability of the counterpartyto perform.
To mitigate the counterparty risk, the Fund may enter into an International Swaps and Derivatives Association, Inc. MasterAgreement (“ISDA Master Agreement”) or similar agreement with its derivative contract counterparties. An ISDA Master Agreementis a bilateral agreement between the Fund and a counterparty that governs over-the-counter derivatives and foreign exchangecontracts and typically contains, among other things, collateral posting terms and netting provisions in the event of a default and/ortermination event. Under an ISDA Master Agreement, the Fund may, under certain circumstances, offset with the counterpartycertain derivative financial instrument’s payables and/or receivables with collateral held and/or posted and create one single netpayment. The provisions of the ISDA Master Agreement typically permit a single net payment in the event of default (close-outnetting) including the bankruptcy or insolvency of the counterparty. Generally, collateral is exchanged between the Fund and thecounterparty and the amount of collateral due from the Fund or to a counterparty has to exceed a minimum transfer amountthreshold before a transfer has to be made. To the extent amounts due to the Fund from its counterparties are not fully collateralized,contractually or otherwise, the Fund bears the risk of loss from counterparty nonperformance. When a Fund is required to postcollateral under the terms of a derivatives transaction and master netting agreement, the Fund’s custodian holds the collateral in asegregated account, subject to the terms of a tri-party agreement among the Fund, the custodian and the counterparty. The masternetting agreement and tri-party agreement provide, in relevant part, that the counterparty may have rights to the amounts in thesegregated account in the event that the Fund defaults in its obligation with respect to the derivative instrument that is subject tothe collateral requirement. When a counterparty is required to post collateral under the terms of a derivatives transaction and

203www.calamos.com
master netting agreement, the counterparty delivers such amount to the Fund’s custodian. The master netting agreement provides,in relevant part, that the Fund may have rights to such collateral in the event that the counterparty defaults in its obligation withrespect to the derivative instrument that is subject to the collateral requirement. Generally before a default, neither a Fund nor thecounterparty may resell, rehypothecate, or repledge any collateral that it receives.
For financial reporting purposes, the Funds do not offset derivative assets and derivative liabilities that are subject to nettingarrangements in the Statements of Assets and Liabilities. The Fund’s net counterparty exposure is reflected in the counterpartytable below. The net unrealized gain, if any, represents the credit risk to the respective Fund on a forward foreign currency contract.The contracts are valued daily at forward foreign exchange rates. The Funds realize a gain or loss when a position is closed or uponsettlement of the contracts. Please see the disclosure regarding ISDA Master Agreements under Foreign Currency Risk within thisnote.
As of October 31, 2021, the Funds had outstanding forward foreign currency contracts listed on the Schedules of Investments.
Equity Risk. Each Fund may engage in option transactions and in doing so achieves similar objectives to what it would achievethrough the sale or purchase of individual securities. A call option, upon payment of a premium, gives the purchaser of the optionthe right to buy, and the seller of the option the obligation to sell, the underlying security, index or other instrument at the exerciseprice. A put option gives the purchaser of the option, upon payment of a premium, the right to sell, and the seller the obligationto buy, the underlying security, index, or other instrument at the exercise price.
To seek to offset some of the risk of a potential decline in value of certain long positions, each Fund may also purchase put optionson individual securities, broad-based securities indexes or certain exchange-traded funds (“ETFs”). Each Fund may also seek togenerate income from option premiums by writing (selling) options on a portion of the equity securities (including securities thatare convertible into equity securities) in the Fund’s portfolio, on broad-based securities indexes, or certain ETFs.
When the Fund purchases an option, it pays a premium and an amount equal to that premium is recorded as an asset. When theFund writes an option, it receives a premium and an amount equal to that premium is recorded as a liability. The asset or liability isadjusted daily to reflect the current market value of the option. If an option expires unexercised, the Fund realizes a gain or loss tothe extent of the premium received or paid. If an option is exercised, the premium received or paid is recorded as an adjustmentto the proceeds from the sale or the cost basis of the purchase. The difference between the premium and the amount received orpaid on a closing purchase or sale transaction is also treated as a realized gain or loss. The cost of securities acquired through theexercise of call options is increased by premiums paid. The proceeds from securities sold through the exercise of put options aredecreased by the premiums paid. Gain or loss on written options and purchased options is presented separately on the Statementsof Operations as net realized gain or loss on written options and net realized gain or loss on purchased options, respectively.
Options written by each Fund do not typically give rise to counterparty credit risk since options written obligate each Fund and notthe counterparty to perform. Exchange traded purchased options have minimal counterparty credit risk to each Fund since theexchange’s clearinghouse, as counterparty to such instruments, guarantees against a possible default.
As of October 31, 2021, the Fund had outstanding purchased options and/or written options as listed on the Schedules ofInvestments.
As of October 31, 2021, the Funds had outstanding derivative contracts which are reflected on the Statements of Assets andLiabilities as follows:
ASSET LIABILITY DERIVATIVES DERIVATIVES
MARKET NEUTRAL INCOME FUND
Gross amounts at fair value:Forward foreign currency contracts(1) $ 949,316 $ 63,746Purchased options(2) 73,524,911 —Total Return Swaps(4) 5,003 620,687Written options(3) — 600,536,780 $74,479,230 $601,221,213
Notes to Financial Statements

204 CALAMOS OPEN-END FAMILY OF FUNDS ANNUAL REPORT
Notes to Financial Statements
ASSET LIABILITY DERIVATIVES DERIVATIVES
HEDGED EQUITY FUND
Gross amounts at fair value:Purchased options(2) $ 3,796,950 $ —Written options(3) — 21,445,250 $ 3,796,950 $ 21,445,250
PHINEUS LONG/SHORT FUND
Gross amounts at fair value:Purchased options(2) $ 7,648,887 $ —Written options(3) — 9,150,505 $ 7,648,887 $ 9,150,505
CONVERTIBLE FUND
Gross amounts at fair value:Forward foreign currency contracts(1) $ 59,736 $ —Purchased options(2) 1,351,250 — $ 1,410,986 $ —
GLOBAL CONVERTIBLE FUND
Gross amounts at fair value:Purchased options(2) $ 798,177 $ — $ 798,177 $ —
GROWTH FUND
Gross amounts at fair value:Purchased options(2) $ 170,625 $ —Written options(3) — 56,700 $ 170,625 $ 56,700
GROWTH AND INCOME FUND
Gross amounts at fair value:Forward foreign currency contracts(1) $ 51,896 $ —Purchased options(2) 17,732,375 —Written options(3) — 536,975 $17,784,271 $ 536,975
INTERNATIONAL GROWTH FUND
Gross amounts at fair value:Forward foreign currency contracts(1) $ 4,526 $ — $ 4,526 $ —
EVOLVING WORLD GROWTH FUND
Gross amounts at fair value:Purchased options(2) $15,172,585 $ — $15,172,585 $ —

205www.calamos.com
ASSET LIABILITY DERIVATIVES DERIVATIVES
GLOBAL EQUITY FUND
Gross amounts at fair value:Forward foreign currency contracts(1) $ 1,350 $ — $ 1,350 $ —
GLOBAL OPPORTUNITIES FUND (formerly, Global Growth and Income Fund)
Gross amounts at fair value:Purchased options(2) $ 7,541,363 $ — $ 7,541,363 $ —
TOTAL RETURN BOND FUND
Gross amounts at fair value:Futures contracts(5) $ — $ 18,928 $ — $ 18,928
HIGH INCOME OPPORTUNITIES FUND
Gross amounts at fair value:Written options(3) $ — $ 1,103 $ — $ 1,103
SHORT-TERM BOND FUND
Gross amounts at fair value:Futures contracts(5) $ — $ 94,639 $ — $ 94,639
The following tables present the outstanding derivative contracts, organized by counterparty, that are subject to enforceable masternetting agreements as of October 31, 2021:
GROSS AMOUNTS NOT OFFSET IN THE STATEMENT OF ASSETS AND LIABILITIES
GROSS AMOUNTS PRESENTED IN THE NET AMOUNT NET AMOUNT
MARKET NEUTRAL INCOME FUND STATEMENT OF ASSETS AND LIABILITIES RECEIVABLE IN PAYABLE IN
COLLATERAL THE EVENT THE EVENTCounterparty ASSETS LIABILITIES PLEDGED OF DEFAULT OF DEFAULT
Bank of New York ISDA $ 72,081 $ — $— $ 72,081 $ —State Street Bank and Trust ISDA 877,235 63,746 — 813,489 —JPMorgan Chase Bank N.A. ISDA — 620,687 — — 620,687Morgan Stanley & Co. ISDA 5,003 — — 5,003 — $954,319 $684,433 $— $890,573 $620,687
GROSS AMOUNTS PRESENTED IN THE NET AMOUNT NET AMOUNT
CONVERTIBLE FUND STATEMENT OF ASSETS AND LIABILITIES RECEIVABLE IN PAYABLE IN
COLLATERAL THE EVENT THE EVENTCounterparty ASSETS LIABILITIES PLEDGED OF DEFAULT OF DEFAULT
Bank of New York ISDA $ 59,736 $ — $— $ 59,736 $ — $ 59,736 $ — $— $ 59,736 $ —
Notes to Financial Statements

206 CALAMOS OPEN-END FAMILY OF FUNDS ANNUAL REPORT
Notes to Financial Statements
GROSS AMOUNTS NOT OFFSET IN THE STATEMENT OF ASSETS AND LIABILITIES
GROSS AMOUNTS PRESENTED IN THE NET AMOUNT NET AMOUNT
GROWTH AND INCOME FUND STATEMENT OF ASSETS AND LIABILITIES RECEIVABLE IN PAYABLE IN
COLLATERAL THE EVENT THE EVENTCounterparty ASSETS LIABILITIES PLEDGED OF DEFAULT OF DEFAULT
Bank of New York ISDA $ 25,684 $ — $— $ 25,684 $ —State Street Bank and Trust ISDA 26,212 — — 26,212 — $ 51,896 $ — $— $ 51,896 $ —
GROSS AMOUNTS PRESENTED IN THE NET AMOUNT NET AMOUNT
INTERNATIONAL GROWTH FUND STATEMENT OF ASSETS AND LIABILITIES RECEIVABLE IN PAYABLE IN
COLLATERAL THE EVENT THE EVENTCounterparty ASSETS LIABILITIES PLEDGED OF DEFAULT OF DEFAULT
State Street Bank and Trust ISDA $ 4,526 $ — $— $ 4,526 $ — $ 4,526 $ — $— $ 4,526 $ —
GROSS AMOUNTS PRESENTED IN THE NET AMOUNT NET AMOUNT
GLOBAL EQUITY FUND STATEMENT OF ASSETS AND LIABILITIES RECEIVABLE IN PAYABLE IN
COLLATERAL THE EVENT THE EVENTCounterparty ASSETS LIABILITIES PLEDGED OF DEFAULT OF DEFAULT
State Street Bank and Trust ISDA $ 1,350 $ — $— $ 1,350 $ — $ 1,350 $ — $— $ 1,350 $ —
For the year ended October 31, 2021, the volume of derivative activity for the Fund is reflected below:*
FORWARD PURCHASED FUTURES WRITTEN FUND CONTRACTS(1) OPTIONS(2) CONTRACTS(5) OPTIONS(3) SWAPS(4)
Market Neutral Income Fund 660,223,441 126,871 — 113,805 670,282,884Hedged Equity Fund — 9,560 — 6,920 —Phineus Long/Short Fund — 712,771 — 791,338 —Convertible Fund — 18,930 — 22,395 —Global Convertible Fund 616,757 730 — — —Growth Fund — 7,590 — 5,180 —Growth and Income Fund 82,826,994 291,637 — 7,229 —International Growth Fund 83,775,911 16,513 — — —Evolving World Growth Fund 246 423,786 — 17,785 —Global Equity Fund 17,522,923 3,678 — — —Global Opportunities Fund (formerly, Global Growth and Income Fund) — 19,902 — 1,160 —Total Return Bond Fund — — 40 — —High Income Opportunities Fund — — — 9 —Short-Term Bond Fund — — 200 — —
* Activity during the period is measured by opened number of contracts for options purchased or written, opened foreign currency contracts (measured in notional), openednumber of contracts for futures contracts, and opened total return swaps (measured in notional).
(1) Generally, the Statement of Assets and Liabilities location for Forward foreign currency contracts is Unrealized appreciation on forward foreign currency contracts for assetderivatives and Unrealized depreciation on forward foreign currency contracts for liability derivatives.
(2) Generally, the Statement of Assets and Liabilities location for Purchased Options is Investments in securities, at value.
(3) Generally, the Statement of Assets and Liabilities location for Written Options is Options written, at value.
(4) Generally, the Statement of Assets and Liabilities location for Swap contracts is Unrealized appreciation on total return swaps for asset derivatives and Unrealized depreciationon total return swaps for liability derivatives.
(5) Generally, the Statement of Assets and Liabilities location for Futures contracts is Investments in securities, at value.

207www.calamos.com
Note 7 – Securities LendingThe Funds may loan one or more of their securities to broker-dealers and banks. Any such loan must be secured by collateral incash or cash equivalents maintained on a current basis in an amount at least equal to the value of the securities loaned by theFunds. The Funds continue to receive the equivalent of the interest or dividends paid by the issuer on the securities loaned and alsoreceive an additional return that may be in the form of a fixed fee or a percentage of the collateral. The additional return is disclosedon a net basis as Securities lending income in the Statement of Operations. Upon receipt of cash or cash equivalent collateral, theFunds’ securities lending agent invests the collateral into short term investments following investment guidelines approved byCalamos Advisors. The Funds record the investment of collateral as an asset and the value of the collateral as a liability on theStatements of Assets and Liabilities. If the value of the invested collateral declines below the value of the collateral deposited bythe borrower, the Funds will record unrealized depreciation equal to the decline in value of the invested collateral. The Funds willpay reasonable fees to persons unaffiliated with the Funds for services in arranging these loans. The Funds have the right to call aloan and obtain the securities loaned at any time. The Funds do not have the right to vote the securities during the existence ofthe loan but could call the loan in an attempt to permit voting of the securities in certain circumstances. Upon return of the securitiesloaned, the cash or cash equivalent collateral will be returned to the borrower. In the event of bankruptcy or other default of theborrower, the Funds could experience both delays in liquidating the loan collateral or recovering the loaned securities and losses,including (a) possible decline in the value of the collateral or in the value of the securities loaned during the period while the Fundsseek to enforce its rights thereto, (b) possible subnormal levels of income and lack of access to income during this period, and(c) the expenses of enforcing their rights. In an effort to reduce these risks, the Funds’ security lending agent monitors and reportsto Calamos Advisors on the creditworthiness of the firms to which a Fund lends securities.
The following table indicates the total amount of securities loaned by asset class, reconciled to the gross liability payable uponreturn of the securities loaned by the Funds as of October 31, 2021.
AMOUNT OF COLLATERAL
HELD IN SHORT TERM
VALUE OF SECURITIES ON
INVESTMENTS LOAN TO BROKER-DEALERS
EXCESSAND AMOUNT OF
BANKS BY ASSET CLASS ON LOAN AMOUNT
RESTRICTED NON-CASH TOTAL DUE TO/(FROM) FUND CASH COLLATERAL COLLATERAL EQUITY FIXED INCOME TOTAL COUNTERPARTY
Market Neutral Income Fund $137,039,053 $43,001,817 $180,040,870 $34,445,423 $141,916,251 $176,361,674 $3,679,196Hedged Equity Fund — 140,286 140,286 137,304 — 137,304 2,982Phineus Long/Short Fund 16,657,550 2,320,920 18,978,470 18,438,008 — 18,438,008 540,462Convertible Fund 188,492,780 31,558,541 220,051,321 25,126,780 190,321,224 215,448,004 4,603,317Global Convertible Fund 28,485,735 708,412 29,194,147 3,223,443 23,650,590 26,874,023 2,320,114Growth Fund 23,479,460 9,669,971 33,149,431 32,462,588 — 32,462,588 686,843Growth and Income Fund 127,829,927 32,705,536 160,535,463 41,805,422 115,388,010 157,193,432 3,342,031Dividend Growth Fund 57,360 66,544 123,904 121,389 — 121,389 2,515International Growth Fund 15,927,726 12,438,915 28,366,641 27,413,897 — 27,413,897 952,744Evolving World Growth Fund 15,402,702 14,417,470 29,820,172 17,203,186 — 17,203,186 12,616,986Global Equity Fund 2,471,810 4,505,684 6,977,494 6,799,086 — 6,799,086 178,408Global Opportunities Fund (formerly, Global Growth and Income Fund) 15,303,187 5,495,193 20,798,380 14,175,804 6,135,770 20,311,574 486,806Total Return Bond Fund 5,136,960 201,748 5,338,708 — 5,228,840 5,228,840 109,868High Income Opportunities Fund 2,146,875 682,622 2,829,497 9,306 2,761,752 2,771,058 58,439Short-Term Bond Fund 18,541,423 2,592,191 21,133,614 — 20,698,566 20,698,566 435,048
Note 8 – Fair Value MeasurementsVarious inputs are used to determine the value of the Funds’ investments. These inputs are categorized into three broad levels asfollows:
• Level 1 – Prices are determined using inputs from unadjusted quoted prices from active markets (including securities activelytraded on a securities exchange) for identical assets.
Notes to Financial Statements

208 CALAMOS OPEN-END FAMILY OF FUNDS ANNUAL REPORT
Notes to Financial Statements
• Level 2 – Prices are determined using significant observable market inputs other than unadjusted quoted prices, includingquoted prices of similar securities, fair value adjustments to quoted foreign securities, interest rates, credit risk, prepaymentspeeds, and other relevant data.
• Level 3 – Prices reflect unobservable market inputs (including the Funds’ own judgments about assumptions marketparticipants would use in determining fair value) when observable inputs are unavailable.
Debt securities are valued based upon evaluated prices received from an independent pricing service or from a dealer or brokerwho makes markets in such securities. Pricing services utilize various observable market data and as such, debt securities aregenerally categorized as Level 2. The levels are not necessarily an indication of the risk or liquidity of the Fund’s investments.
The following is a summary of the inputs used in valuing the Funds’ holdings at fair value:
MARKET NEUTRAL INCOME FUND
LEVEL 1 LEVEL 2 LEVEL 3 TOTAL
Assets:Convertible Bonds $ — $5,999,498,239 $— $ 5,999,498,239Convertible Preferred Stocks 369,703,803 47,978,880 — 417,682,683Common Stocks U.S. 9,210,579,093 68,449,111 — 9,279,028,204Common Stocks Foreign 11,409,653 — — 11,409,653Exchange-traded Fund 316,662,519 — — 316,662,519Investment In Affiliated Fund 272,909,690 — — 272,909,690Warrants 552,835 3,670 — 556,505Purchased Options 58,781,790 14,743,121 — 73,524,911Investment Of Cash Collateral For Securities Loaned 74,966,114 62,072,939 — 137,039,053Forward Foreign Currency Contracts — 949,316 — 949,316Total Return Swaps — 5,003 — 5,003
Total $10,315,565,497 $6,193,700,279 $— $16,509,265,776
Liabilities:Common Stocks Sold Short U.S. $ 4,125,112,173 $ — $— $ 4,125,112,173Common Stocks Sold Short Foreign 203,310,425 — — 203,310,425Written Options 600,536,780 — — 600,536,780Forward Foreign Currency Contracts — 63,746 — 63,746Total Return Swaps — 620,687 — 620,687
Total $ 4,928,959,378 $ 684,433 $— $ 4,929,643,811
HEDGED EQUITY FUND
LEVEL 1 LEVEL 2 LEVEL 3 TOTAL
Assets:Convertible Bond $ — $ 11,054,169 $— $ 11,054,169Common Stocks U.S. 545,470,389 — — 545,470,389Exchange-Traded Fund 12,542,118 — — 12,542,118Purchased Options 3,796,950 — — 3,796,950
Total $ 561,809,457 $ 11,054,169 $— $ 572,863,626
Liabilities:Written Options $ 21,445,250 $ — $— $ 21,445,250
Total $ 21,445,250 $ — $— $ 21,445,250

209www.calamos.com
PHINEUS LONG/SHORT FUND
LEVEL 1 LEVEL 2 LEVEL 3 TOTAL
Assets:Common Stocks U.S. $ 476,850,038 $ — $— $ 476,850,038Common Stocks Foreign — 70,697,267 — 70,697,267Purchased Options 7,648,887 — — 7,648,887Investment of Cash Collateral For Securities Loaned — 16,657,550 — 16,657,550
Total $ 484,498,925 $ 87,354,817 $— $ 571,853,742
Liabilities:Common Stocks Sold Short U.S. $ 17,601,626 $ — $— $ 17,601,626Exchange-Traded Funds Sold Short 186,248,471 — — 186,248,471Written Options 9,150,505 — — 9,150,505
Total $ 213,000,602 $ — $— $ 213,000,602
CONVERTIBLE FUND
LEVEL 1 LEVEL 2 LEVEL 3 TOTAL
Assets:Convertible Bonds $ — $1,375,296,094 $— $ 1,375,296,094Convertible Preferred Stocks 190,555,655 9,700,040 — 200,255,695Purchased Options 1,351,250 — — 1,351,250Investment of Cash Collateral For Securities Loaned 100,822,833 87,669,947 — 188,492,780Forward Foreign Currency Contracts — 59,736 — 59,736
Total $ 292,729,738 $1,472,725,817 $— $ 1,765,455,555
GLOBAL CONVERTIBLE FUND
LEVEL 1 LEVEL 2 LEVEL 3 TOTAL
Assets:Convertible Bonds $ — $ 248,989,891 $— $ 248,989,891Convertible Preferred Stocks 23,285,566 886,112 — 24,171,678U.S. Government and Agency Security — 2,323,694 — 2,323,694Purchased Options 798,177 — — 798,177Investment of Cash Collateral For Securities Loaned — 28,485,735 — 28,485,735
Total $ 24,083,743 $ 280,685,432 $— $ 304,769,175
TIMPANI SMALL CAP GROWTH FUND
LEVEL 1 LEVEL 2 LEVEL 3 TOTAL
Assets:Common Stocks U.S. $ 443,718,256 $ — $— $ 443,718,256
Total $ 443,718,256 $ — $— $ 443,718,256
TIMPANI SMID GROWTH FUND
LEVEL 1 LEVEL 2 LEVEL 3 TOTAL
Assets:Common Stocks U.S. $ 26,423,305 $ — $— $ 26,423,305
Total $ 26,423,305 $ — $— $ 26,423,305
Notes to Financial Statements

210 CALAMOS OPEN-END FAMILY OF FUNDS ANNUAL REPORT
Notes to Financial Statements
GROWTH FUND
LEVEL 1 LEVEL 2 LEVEL 3 TOTAL
Assets:Common Stocks U.S. $ 1,813,907,381 $ — $— $ 1,813,907,381Purchased Option 170,625 — — 170,625Investment of Cash Collateral For Securities Loaned — 23,479,460 — 23,479,460
Total $ 1,814,078,006 $ 23,479,460 $— $ 1,837,557,466
Liabilities:Written Option $ 56,700 $ — $— $ 56,700
Total $ 56,700 $ — $— $ 56,700
GROWTH AND INCOME FUND
LEVEL 1 LEVEL 2 LEVEL 3 TOTAL
Assets:Convertible Bonds $ — $ 568,572,715 $— $ 568,572,715Convertible Preferred Stocks 213,290,673 20,779,675 — 234,070,348Common Stocks U.S. 1,941,517,884 — — 1,941,517,884Purchased Options 17,732,375 — — 17,732,375Investment of Cash Collateral For Securities Loaned 66,600,465 61,229,462 — 127,829,927Forward Foreign Currency Contracts — 51,896 — 51,896
Total $ 2,239,141,397 $ 650,633,748 $— $ 2,889,775,145
Liabilities:Written Options $ 536,975 $ — $— $ 536,975
Total $ 536,975 $ — $— $ 536,975
DIVIDEND GROWTH FUND
LEVEL 1 LEVEL 2 LEVEL 3 TOTAL
Assets:Convertible Preferred Stock $ 85,439 $ — $— $ 85,439Common Stocks U.S. 17,309,269 — — 17,309,269Exchange-Traded Fund 54,264 — — 54,264Investment of Cash Collateral For Securities Loaned — 57,360 — 57,360
Total $ 17,448,972 $ 57,360 $— $ 17,506,332
SELECT FUND
LEVEL 1 LEVEL 2 LEVEL 3 TOTAL
Assets:Common Stocks U.S. $ 53,497,214 $ — $— $ 53,497,214
Total $ 53,497,214 $ — $— $ 53,497,214

211www.calamos.com
INTERNATIONAL GROWTH FUND
LEVEL 1 LEVEL 2 LEVEL 3 TOTAL
Assets:Common Stocks Foreign $ 17,205,967 $ 209,024,419 $— $ 226,230,386Common Stocks U.S. 72,214,685 — — 72,214,685Right 2 — — 2Investment of Cash Collateral For Securities Loaned — 15,927,726 — 15,927,726Forward Foreign Currency Contracts — 4,526 — 4,526
Total $ 89,420,654 $ 224,956,671 $— $ 314,377,325
EVOLVING WORLD GROWTH FUND
LEVEL 1 LEVEL 2 LEVEL 3 TOTAL
Assets:Convertible Bonds $ — $ 82,566,497 $— $ 82,566,497Common Stocks Foreign 53,042,656 342,067,542 — 395,110,198Common Stocks U.S. 77,345,415 9,071,845 — 86,417,260Purchased Options 15,172,585 — — 15,172,585Investment of Cash Collateral For Securities Loaned — 15,402,702 — 15,402,702
Total $ 145,560,656 $ 449,108,586 $— $ 594,669,242
GLOBAL EQUITY FUND
LEVEL 1 LEVEL 2 LEVEL 3 TOTAL
Assets:Common Stocks U.S. $ 94,713,163 $ — $— $ 94,713,163Common Stocks Foreign 1,083,791 40,084,996 — 41,168,787Investment of Cash Collateral For Securities Loaned — 2,471,810 — 2,471,810Forward Foreign Currency Contracts — 1,350 — 1,350
Total $ 95,796,954 $ 42,558,156 $— $ 138,355,110
GLOBAL OPPORTUNITIES FUND (FORMERLY, GLOBAL GROWTH AND INCOME FUND)
LEVEL 1 LEVEL 2 LEVEL 3 TOTAL
Assets:Convertible Bonds $ — $ 73,298,408 $— $ 73,298,408Convertible Preferred Stocks 17,502,809 — — 17,502,809Common Stocks U.S. 115,369,933 — — 115,369,933Common Stocks Foreign 2,800,857 58,389,165 — 61,190,022Purchased Options 7,541,363 — — 7,541,363Investment of Cash Collateral For Securities Loaned — 15,303,187 — 15,303,187
Total $ 143,214,962 $ 146,990,760 $— $ 290,205,722
Notes to Financial Statements

212 CALAMOS OPEN-END FAMILY OF FUNDS ANNUAL REPORT
Notes to Financial Statements
TOTAL RETURN BOND FUND
LEVEL 1 LEVEL 2 LEVEL 3 TOTAL
Assets:Corporate Bonds $ — $ 33,857,108 $— $ 33,857,108Convertible Bond — 121,630 — 121,630Bank Loans — 6,640,889 — 6,640,889Asset Backed Securities — 3,292,258 — 3,292,258Sovereign Bond — 397,156 — 397,156U.S. Government and Agency Securities — 20,004,470 — 20,004,470Residential Mortgage Backed Securities — 2,331,633 — 2,331,633Investment of Cash Collateral For Securities Loaned — 5,136,960 — 5,136,960
Total $ — $ 71,782,104 $— $ 71,782,104
Liabilities:Futures Contracts $ 18,928 $ — $— $ 18,928
Total $ 18,928 $ — $— $ 18,928
HIGH INCOME OPPORTUNITIES FUND
LEVEL 1 LEVEL 2 LEVEL 3 TOTAL
Assets:Corporate Bonds $ — $ 36,019,526 $— $ 36,019,526Convertible Bonds — 324,456 — 324,456Bank Loans — 4,908,422 — 4,908,422Common Stocks U.S. 526,751 186,998 — 713,749Preferred Stocks 351,981 73,750 — 425,731Warrants 43,705 28,765 — 72,470Exchange-Traded Funds 440,301 — — 440,301Convertible Preferred Stocks — 11,950 — 11,950Investment of Cash Collateral For Securities Loaned — 2,146,875 — 2,146,875
Total $ 1,362,738 $ 43,700,742 $— $ 45,063,480
Liabilities:Written Options $ 1,103 $ — $— $ 1,103
Total $ 1,103 $ — $— $ 1,103
SHORT-TERM BOND FUND
LEVEL 1 LEVEL 2 LEVEL 3 TOTAL
Assets:Corporate Bonds $ — $ 183,582,228 $— $ 183,582,228U.S. Government and Agency Securities — 14,074,297 — 14,074,297Sovereign Bonds — 3,220,697 — 3,220,697Bank Loans — 23,769,628 — 23,769,628Asset Backed Securities — 36,744,319 — 36,744,319Municipal Obligations — 14,505,307 — 14,505,307Residential Mortgage Backed Securities — 4,479,720 — 4,479,720Investment of Cash Collateral For Securities Loaned — 18,541,423 — 18,541,423
Total $ — $ 298,917,619 $— $ 298,917,619
Liabilities:Futures Contracts $ 94,639 $ — $— $ 94,639
Total $ 94,639 $ — $— $ 94,639

213www.calamos.com
Note 9 – Capital Share TransactionsThe following table summarizes the activity in capital shares of the Funds for the Year ended October 31, 2021:
MARKET NEUTRAL INCOME FUND HEDGED EQUITY FUND PHINEUS LONG/SHORT FUND
Class A Shares Dollars Shares Dollars Shares Dollars
Shares sold 48,554,245 $ 695,201,026 1,441,169 $ 19,988,009 738,586 $ 11,322,683Shares issued as reinvestment of distributions 240,648 3,435,092 7,350 98,789 — —Less shares redeemed (16,883,138) (241,454,139) (386,124) (5,358,012) (1,022,190) (14,988,782)Net increase (decrease) 31,911,755 $ 457,181,979 1,062,395 $ 14,728,786 (283,604) $ (3,666,099)
Class C Shares Dollars Shares Dollars Shares Dollars
Shares sold 8,167,959 $ 118,538,445 248,475 $ 3,425,300 247,561 $ 3,685,673Shares issued as reinvestment of distributions 1,913 27,893 694 8,969 — —Less shares redeemed (4,435,798) (64,308,323) (46,912) (629,814) (311,890) (4,390,989)Net increase (decrease) 3,734,074 $ 54,258,015 202,257 $ 2,804,455 (64,329) $ (705,316)
Class I Shares Dollars Shares Dollars Shares Dollars
Shares sold 481,262,999 $ 6,805,725,825 16,334,120 $ 226,238,382 7,525,798 $ 115,301,010Shares issued as reinvestment of distributions 4,305,160 60,691,588 189,464 2,552,174 — —Less shares redeemed (139,548,062) (1,969,026,109) (9,181,017) (126,222,914) (7,607,705) (110,894,458)Net increase (decrease) 346,020,097 $ 4,897,391,304 7,342,567 $ 102,567,642 (81,907) $ 4,406,552
Class R6 Shares Dollars Shares Dollars Shares Dollars
Shares sold 623,329 $ 8,856,506 — $ — — $ —Shares issued as reinvestment of distributions 759 10,807 — — — —Less shares redeemed (12,977) (184,358) — — — —Net increase (decrease) 611,111 $ 8,682,955 — $ — — $ —
Notes to Financial Statements

214 CALAMOS OPEN-END FAMILY OF FUNDS ANNUAL REPORT
Notes to Financial Statements
TIMPANI SMALL CAP CONVERTIBLE FUND GLOBAL CONVERTIBLE FUND GROWTH FUND
Class A Shares Dollars Shares Dollars Shares Dollars
Shares sold 2,777,331 $ 72,665,732 536,727 $ 7,878,385 563,461 $ 22,054,242Shares issued as reinvestment of distributions 833,011 21,241,780 67,185 965,671 12,429 448,444Less shares redeemed (2,745,563) (71,528,455) (234,040) (3,462,058) (61,406) (2,379,887)Net increase (decrease) 864,779 $ 22,379,057 369,872 $ 5,381,998 514,484 $ 20,122,799
Class C(a) Shares Dollars Shares Dollars Shares Dollars
Shares sold 527,193 $ 13,584,758 62,029 $ 897,028 73,715 $ 3,025,301Shares issued as reinvestment of distributions 152,610 3,841,200 27,576 388,548 — —Less shares redeemed (521,154) (13,386,606) (77,213) (1,114,914) (958) (39,448)Net increase (decrease) 158,649 $ 4,039,352 12,392 $ 170,662 72,757 $ 2,985,853
Class I Shares Dollars Shares Dollars Shares Dollars
Shares sold 19,798,724 $ 453,359,024 5,750,086 $ 84,668,776 6,552,471 $264,307,210Shares issued as reinvestment of distributions 2,833,100 63,015,810 1,166,932 16,794,465 164,479 6,107,102Less shares redeemed (12,465,538) (283,034,867) (3,650,432) (53,599,030) (2,010,241) (79,646,237)Net increase (decrease) 10,166,286 $ 233,339,967 3,266,586 $ 47,864,211 4,706,709 $190,768,075
Class R6 Shares Dollars Shares Dollars Shares Dollars
Shares sold — $ — — $ — 754,011 $ 30,387,908Shares issued as reinvestment of distributions — — — — 1,961 72,878Less shares redeemed — — — — (142,205) (5,802,118)Net increase (decrease) — $ — — $ — 613,767 $ 24,658,668
(a) Timpani Small Cap Growth Fund Class C shares commenced operations on June 25, 2021.

215www.calamos.com
TIMPANI SMID GROWTH FUND GROWTH FUND GROWTH AND INCOME FUND
Class A Shares Dollars Shares Dollars Shares Dollars
Shares sold 15,953 $ 265,494 1,001,231 $ 38,718,724 2,865,182 $ 123,267,802Shares issued as reinvestment of distributions — — 3,210,883 119,220,099 814,587 33,063,790Less shares redeemed (21,775) (357,204) (4,191,712) (168,341,439) (3,995,738) (173,246,676)Net increase (decrease) (5,822) $ (91,710) 20,402 $ (10,402,616) (315,969) $ (16,915,084)
Class C Shares Dollars Shares Dollars Shares Dollars
Shares sold — $ — 78,424 $ 1,489,432 582,347 $ 25,856,512Shares issued as reinvestment of distributions — — 441,180 7,623,586 57,908 2,351,622Less shares redeemed — — (1,267,411) (23,098,760) (1,383,950) (58,921,715)Net increase (decrease) — $ — (747,807) $ (13,985,742) (743,695) $ (30,713,581)
Class I Shares Dollars Shares Dollars Shares Dollars
Shares sold 225,185 $ 3,475,331 349,978 $ 20,093,648 5,756,072 $ 240,119,420Shares issued as reinvestment of distributions — — 442,786 23,932,552 767,992 29,983,198Less shares redeemed (176,853) (2,792,757) (793,486) (45,241,911) (3,795,835) (157,630,478)Net increase (decrease) 48,332 $ 682,574 (722) $ (1,215,711) 2,728,229 $ 112,472,140
Class R6 Shares Dollars Shares Dollars Shares Dollars
Shares sold 26,286 $ 447,755 — $ — 148,440 $ 6,063,308Shares issued as reinvestment of distributions — — — — 3,120 122,602Less shares redeemed — — — — (22,364) (925,938)Net increase (decrease) 26,286 $ 447,755 — $ — 129,196 $ 5,259,972
Notes to Financial Statements

216 CALAMOS OPEN-END FAMILY OF FUNDS ANNUAL REPORT
Notes to Financial Statements
DIVIDEND GROWTH FUND SELECT FUND INTERNATIONAL GROWTH FUND
Class A Shares Dollars Shares Dollars Shares Dollars
Shares sold 45,063 $ 688,741 40,948 $ 724,394 551,383 $ 15,070,245Shares issued as reinvestment of distributions 22,697 310,042 32,177 525,780 131,078 3,332,005Less shares redeemed (38,761) (576,175) (88,898) (1,565,831) (560,965) (15,238,749)Net increase (decrease) 28,999 $ 422,608 (15,773) $ (315,657) 121,496 $ 3,163,501
Class C Shares Dollars Shares Dollars Shares Dollars
Shares sold 73,532 $ 1,025,067 2,605 $ 38,845 43,908 $ 1,049,903Shares issued as reinvestment of distributions 4,697 62,147 4,327 60,882 19,862 439,547Less shares redeemed (9,986) (146,192) (37,732) (572,425) (219,726) (5,212,131)Net increase (decrease) 68,243 $ 941,022 (30,800) $ (472,698) (155,956) $ (3,722,681)
Class I Shares Dollars Shares Dollars Shares Dollars
Shares sold 143,318 $ 2,098,829 257,995 $ 4,700,807 1,905,212 $ 54,803,138Shares issued as reinvestment of distributions 58,493 798,425 84,555 1,423,899 367,227 9,669,096Less shares redeemed (285,863) (4,303,365) (866,973) (14,918,583) (1,616,979) (45,382,962)Net increase (decrease) (84,052) $(1,406,111) (524,423) $ (8,793,877) 655,460 $ 19,089,272
Class R6 Shares Dollars Shares Dollars Shares Dollars
Shares sold — $ — — $ — 31,518 $ 912,308Shares issued as reinvestment of distributions — — — — 2,470 65,576Less shares redeemed — — — — (12,639) (357,425)Net increase (decrease) — $ — — $ — 21,349 $ 620,459

217www.calamos.com
GLOBAL OPPORTUNITIES FUND (FORMERLY, GLOBAL EVOLVING WORLD GROWTH AND GROWTH FUND GLOBAL EQUITY FUND INCOME FUND)
Class A Shares Dollars Shares Dollars Shares Dollars
Shares sold 2,212,209 $ 51,019,685 446,625 $ 7,341,057 1,400,654 $ 16,147,177Shares issued as reinvestment of distributions 32,116 698,205 92,854 1,425,309 500,215 5,452,069Less shares redeemed (1,366,960) (30,741,959) (324,849) (5,415,646) (1,370,975) (16,118,554)Net increase (decrease) 877,365 $ 20,975,931 214,630 $ 3,350,720 529,894 $ 5,480,692
Class C Shares Dollars Shares Dollars Shares Dollars
Shares sold 404,762 $ 8,912,627 15,763 $ 223,586 398,710 $ 4,020,787Shares issued as reinvestment of distributions 16,204 327,330 28,680 372,273 65,916 618,294Less shares redeemed (361,595) (7,792,422) (333,206) (4,632,598) (573,770) (5,633,247)Net increase (decrease) 59,371 $ 1,447,535 (288,763) $ (4,036,739) (109,144) $ (994,166)
Class I Shares Dollars Shares Dollars Shares Dollars
Shares sold 23,551,104 $ 552,762,439 1,926,087 $ 32,790,956 7,439,534 $ 89,201,046Shares issued as reinvestment of distributions 268,509 5,891,083 299,709 4,792,340 404,201 4,592,491Less shares redeemed (10,965,677) (249,175,014) (1,307,319) (22,578,522) (2,631,882) (31,986,488)Net increase (decrease) 12,853,936 $ 309,478,508 918,477 $ 15,004,774 5,211,853 $ 61,807,049
Class R6 Shares Dollars Shares Dollars Shares Dollars
Shares sold — $ — — $ — — $ —Shares issued as reinvestment of distributions — — 541 8,657 — —Less shares redeemed — — — — — —Net increase (decrease) — $ — 541 $ 8,657 — $ —
Notes to Financial Statements

218 CALAMOS OPEN-END FAMILY OF FUNDS ANNUAL REPORT
Notes to Financial Statements
HIGH INCOME TOTAL RETURN BOND FUND OPPORTUNITIES FUND SHORT-TERM BOND FUND
Class A Shares Dollars Shares Dollars Shares Dollars
Shares sold 425,168 $ 4,581,154 490,424 $ 4,182,704 130,782 $ 1,326,520Shares issued as reinvestment of distributions 44,679 480,419 170,873 1,458,344 13,305 134,013Less shares redeemed (605,838) (6,482,744) (475,259) (4,048,553) (191,018) (1,918,900)Net increase (decrease) (135,991) $ (1,421,171) 186,038 $ 1,592,495 (46,931) $ (458,367)
Class C Shares Dollars Shares Dollars Shares Dollars
Shares sold 6,836 $ 74,127 19,862 $ 180,547 — $ —Shares issued as reinvestment of distributions 1,850 19,977 3,158 28,595 — —Less shares redeemed (97,055) (1,039,926) (64,999) (588,385) — —Net increase (decrease) (88,369) $ (945,822) (41,979) $ (379,243) — $ —
Class I Shares Dollars Shares Dollars Shares Dollars
Shares sold 1,130,619 $ 12,133,263 377,612 $ 3,217,952 13,795,593 $136,965,873Shares issued as reinvestment of distributions 120,410 1,296,009 46,775 399,554 110,341 1,109,247Less shares redeemed (2,691,929) (28,868,593) (187,903) (1,604,377) (223,370) (2,234,583)Net increase (decrease) (1,440,900) $(15,439,321) 236,484 $ 2,013,129 13,682,564 $135,840,537
Class R6 Shares Dollars Shares Dollars Shares Dollars
Shares sold — $ — — $ — — $ —Shares issued as reinvestment of distributions — — — — — —Less shares redeemed — — — — — —Net increase (decrease) — $ — — $ — — $ —

219www.calamos.com
The following table summarizes the activity in capital shares of the Funds for the year or period ended October 31, 2020:
MARKET NEUTRAL INCOME FUND HEDGED EQUITY FUND PHINEUS LONG/SHORT FUND
Class A Shares Dollars Shares Dollars Shares Dollars
Shares sold 23,507,307 $ 318,481,399 1,079,464 $ 13,115,927 654,466 $ 7,492,400Shares issued as reinvestment of distributions 506,101 6,686,850 8,680 104,884 6,418 75,411Less shares redeemed (19,910,936) (266,861,063) (686,573) (7,988,001) (3,607,025) (40,137,010)Net increase (decrease) 4,102,472 $ 58,307,186 401,571 $ 5,232,810 (2,946,141) $ (32,569,199)
Class C Shares Dollars Shares Dollars Shares Dollars
Shares sold 4,786,497 $ 65,961,046 177,834 $ 2,116,965 166,506 $ 1,836,087Shares issued as reinvestment of distributions 62,532 842,122 580 6,941 — —Less shares redeemed (5,870,600) (80,250,388) (80,386) (941,366) (1,444,655) (15,565,258)Net increase (decrease) (1,021,571) $ (13,447,220) 98,028 $ 1,182,540 (1,278,149) $ (13,729,171)
Class I Shares Dollars Shares Dollars Shares Dollars
Shares sold 285,069,085 $ 3,801,544,821 17,102,185 $ 205,853,593 15,436,848 $ 175,709,968Shares issued as reinvestment of distributions 6,128,256 79,890,119 244,588 2,923,243 235,680 2,785,741Less shares redeemed (193,875,237) (2,540,130,224) (8,451,892) (100,054,153) (42,820,758) (474,724,045)Net increase (decrease) 97,322,104 $ 1,341,304,716 8,894,881 $ 108,722,683 (27,148,230) $(296,228,336)
Class R6(a) Shares Dollars Shares Dollars Shares Dollars
Shares sold 749 $ 10,000 — $ — — $ —Shares issued as reinvestment of distributions — — — — — —Less shares redeemed — — — — — —Net increase (decrease) 749 $ 10,000 — $ — — $ —
(a) Market Neutral Income Fund Class R6 shares commenced operations on June 23, 2020.
Notes to Financial Statements

220 CALAMOS OPEN-END FAMILY OF FUNDS ANNUAL REPORT
Notes to Financial Statements
GLOBAL CONVERTIBLE TIMPANI SMALL CAP CONVERTIBLE FUND FUND GROWTH FUND
Class A Shares Dollars Shares Dollars Shares Dollars
Shares sold 3,779,907 $ 76,036,819 224,517 $ 2,763,247 83,127 $ 2,038,224Shares issued as reinvestment of distributions 98,509 1,644,047 15,031 169,920 16,119 355,909Less shares redeemed (3,330,801) (61,899,582) (219,049) (2,646,454) (87,385) (1,961,422)Net increase (decrease) 547,615 $ 15,781,284 20,499 $ 286,713 11,861 $ 432,711
Class C Shares Dollars Shares Dollars Shares Dollars
Shares sold 626,775 $ 12,529,477 123,304 $ 1,532,137 — $ —Shares issued as reinvestment of distributions 7,484 119,553 4,969 54,887 — —Less shares redeemed (1,349,127) (25,502,044) (76,117) (895,793) — —Net increase (decrease) (714,868) $ (12,853,014) 52,156 $ 691,231 — $ —
Class I Shares Dollars Shares Dollars Shares Dollars
Shares sold 23,198,658 $ 411,409,196 6,606,715 $ 80,794,677 1,837,833 $ 48,095,872Shares issued as reinvestment of distributions 340,738 5,205,185 227,360 2,570,590 156,926 3,554,389Less shares redeemed (13,751,433) (227,572,021) (3,451,303) (40,063,203) (1,006,368) (24,167,855)Net increase (decrease) 9,787,963 $ 189,042,360 3,382,772 $ 43,302,064 988,391 $ 27,482,406
Class R6 Shares Dollars Shares Dollars Shares Dollars
Shares sold — $ — — $ — 3,234 $ 83,578Shares issued as reinvestment of distributions — — — — 2,381 53,959Less shares redeemed — — — — (99) (2,032)Net increase (decrease) — $ — — $ — 5,516 $ 135,505

221www.calamos.com
TIMPANI SMID GROWTH FUND GROWTH FUND GROWTH AND INCOME FUND
Class A Shares Dollars Shares Dollars Shares Dollars
Shares sold 22,299 $ 225,952 1,163,903 $ 35,916,013 2,586,315 $ 88,603,488Shares issued as reinvestment of distributions — — 2,949,175 90,952,567 1,087,899 36,218,823Less shares redeemed (8,577) (106,936) (5,924,330) (186,796,357) (5,354,038) (179,900,007)Net increase (decrease) 13,722 $ 119,016 (1,811,252) $ (59,927,777) (1,679,824) $ (55,077,696)
Class C Shares Dollars Shares Dollars Shares Dollars
Shares sold — $ — 151,764 $ 2,389,732 475,674 $ 16,379,409Shares issued as reinvestment of distributions — — 439,532 7,094,039 94,428 3,194,398Less shares redeemed — — (1,382,103) (23,292,608) (1,841,945) (62,865,328)Net increase (decrease) — $ — (790,807) $ (13,808,837) (1,271,843) $ (43,291,521)
Class I Shares Dollars Shares Dollars Shares Dollars
Shares sold 346,537 $3,166,560 964,653 $ 41,967,197 5,565,557 $ 181,141,237Shares issued as reinvestment of distributions — — 418,998 18,167,781 916,902 29,159,931Less shares redeemed (20,359) (238,076) (1,826,623) (83,516,882) (5,832,606) (183,750,056)Net increase (decrease) 326,178 $2,928,484 (442,972) $ (23,381,904) 649,853 $ 26,551,112
Class R6(a) Shares Dollars Shares Dollars Shares Dollars
Shares sold — $ — — $ — 576 $ 20,037Shares issued as reinvestment of distributions — — — — 2 53Less shares redeemed — — — — (138) (4,880)Net increase (decrease) — $ — — $ — 440 $ 15,210
(a) Growth and Income Fund Class R6 shares commenced operations on June 23, 2020.
Notes to Financial Statements
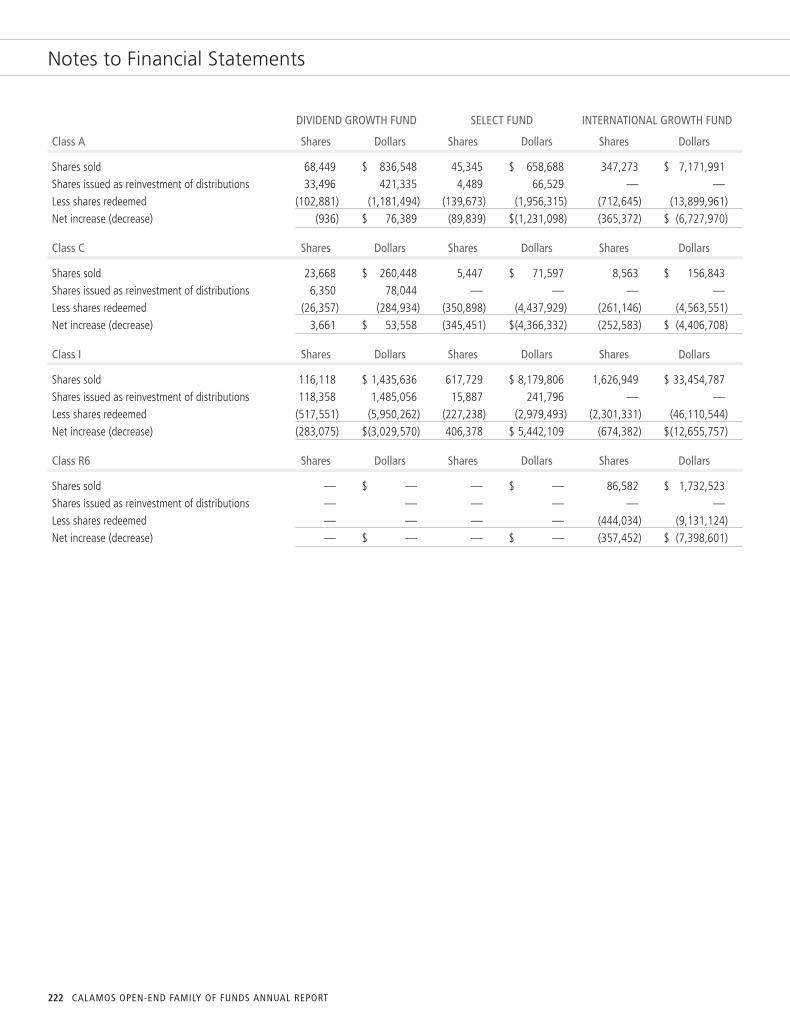
222 CALAMOS OPEN-END FAMILY OF FUNDS ANNUAL REPORT
Notes to Financial Statements
DIVIDEND GROWTH FUND SELECT FUND INTERNATIONAL GROWTH FUND
Class A Shares Dollars Shares Dollars Shares Dollars
Shares sold 68,449 $ 836,548 45,345 $ 658,688 347,273 $ 7,171,991Shares issued as reinvestment of distributions 33,496 421,335 4,489 66,529 — —Less shares redeemed (102,881) (1,181,494) (139,673) (1,956,315) (712,645) (13,899,961)Net increase (decrease) (936) $ 76,389 (89,839) $(1,231,098) (365,372) $ (6,727,970)
Class C Shares Dollars Shares Dollars Shares Dollars
Shares sold 23,668 $ 260,448 5,447 $ 71,597 8,563 $ 156,843Shares issued as reinvestment of distributions 6,350 78,044 — — — —Less shares redeemed (26,357) (284,934) (350,898) (4,437,929) (261,146) (4,563,551)Net increase (decrease) 3,661 $ 53,558 (345,451) $(4,366,332) (252,583) $ (4,406,708)
Class I Shares Dollars Shares Dollars Shares Dollars
Shares sold 116,118 $ 1,435,636 617,729 $ 8,179,806 1,626,949 $ 33,454,787Shares issued as reinvestment of distributions 118,358 1,485,056 15,887 241,796 — —Less shares redeemed (517,551) (5,950,262) (227,238) (2,979,493) (2,301,331) (46,110,544)Net increase (decrease) (283,075) $(3,029,570) 406,378 $ 5,442,109 (674,382) $(12,655,757)
Class R6 Shares Dollars Shares Dollars Shares Dollars
Shares sold — $ — — $ — 86,582 $ 1,732,523Shares issued as reinvestment of distributions — — — — — —Less shares redeemed — — — — (444,034) (9,131,124)Net increase (decrease) — $ — — $ — (357,452) $ (7,398,601)

223www.calamos.com
EVOLVING WORLD GLOBAL GROWTH GROWTH FUND GLOBAL EQUITY FUND AND INCOME FUND
Class A Shares Dollars Shares Dollars Shares Dollars
Shares sold 391,004 $ 6,762,959 265,416 $ 3,292,315 1,099,698 $ 9,490,501Shares issued as reinvestment of distributions 11,579 172,408 112,095 1,289,097 97,528 873,603Less shares redeemed (815,536) (12,469,085) (564,070) (6,729,651) (2,108,626) (18,481,508)Net increase (decrease) (412,953) $ (5,533,718) (186,559) $ (2,148,239) (911,400) $ (8,117,404)
Class C Shares Dollars Shares Dollars Shares Dollars
Shares sold 40,192 $ 672,788 22,660 $ 245,184 71,960 $ 613,871Shares issued as reinvestment of distributions — — 60,883 603,351 18,357 141,351Less shares redeemed (342,622) (5,001,576) (487,287) (5,269,441) (1,040,655) (8,078,310)Net increase (decrease) (302,430) $ (4,328,788) (403,744) $ (4,420,906) (950,338) $ (7,323,088)
Class I Shares Dollars Shares Dollars Shares Dollars
Shares sold 4,363,545 $ 78,476,333 600,310 $ 7,767,489 2,337,755 $ 23,373,263Shares issued as reinvestment of distributions 86,887 1,302,432 329,656 3,929,499 69,759 649,005Less shares redeemed (3,120,110) (46,723,770) (847,457) (10,471,760) (2,141,926) (18,654,225)Net increase (decrease) 1,330,322 $ 33,054,995 82,509 $ 1,225,228 265,588 $ 5,368,043
Class R6(a) Shares Dollars Shares Dollars Shares Dollars
Shares sold — $ — 8,199 $ 119,000 — $ —Shares issued as reinvestment of distributions — — — — — —Less shares redeemed — — — — — —Net increase (decrease) — $ — 8,199 $ 119,000 — $ —
(a) Global Equity Fund Class R6 shares commenced operations on June 23, 2020.
Notes to Financial Statements

224 CALAMOS OPEN-END FAMILY OF FUNDS ANNUAL REPORT
Notes to Financial Statements
HIGH INCOME TOTAL RETURN BOND FUND OPPORTUNITIES FUND SHORT-TERM BOND FUND
Class A Shares Dollars Shares Dollars Shares Dollars
Shares sold 687,482 $ 7,365,277 245,970 $ 2,032,831 286,957 $ 2,896,835Shares issued as reinvestment of distributions 39,601 425,925 217,034 1,717,793 4,621 46,909Less shares redeemed (622,896) (6,676,918) (834,673) (6,720,348) (35,177) (350,938)Net increase (decrease) 104,187 $ 1,114,284 (371,669) $(2,969,724) 256,401 $ 2,592,806
Class C Shares Dollars Shares Dollars Shares Dollars
Shares sold 109,098 $ 1,175,752 19,346 $ 158,252 — $ —Shares issued as reinvestment of distributions 2,691 28,837 7,484 62,826 — —Less shares redeemed (226,107) (2,418,888) (124,746) (1,023,391) — —Net increase (decrease) (114,318) $ (1,214,299) (97,916) $ (802,313) — $ —
Class I Shares Dollars Shares Dollars Shares Dollars
Shares sold 4,238,417 $ 44,471,732 322,369 $ 2,486,979 421,347 $ 4,283,245Shares issued as reinvestment of distributions 95,353 1,028,248 45,623 360,699 71,315 723,691Less shares redeemed (2,125,614) (22,766,469) (364,455) (2,892,583) (4,574,906) (46,297,045)Net increase (decrease) 2,208,156 $ 22,733,511 3,537 $ (44,905) (4,082,244) $(41,290,109)
Class R6 Shares Dollars Shares Dollars Shares Dollars
Shares sold — $ — — $ — — $ —Shares issued as reinvestment of distributions — — — — — —Less shares redeemed — — — — — —Net increase (decrease) — $ — — $ — — $ —
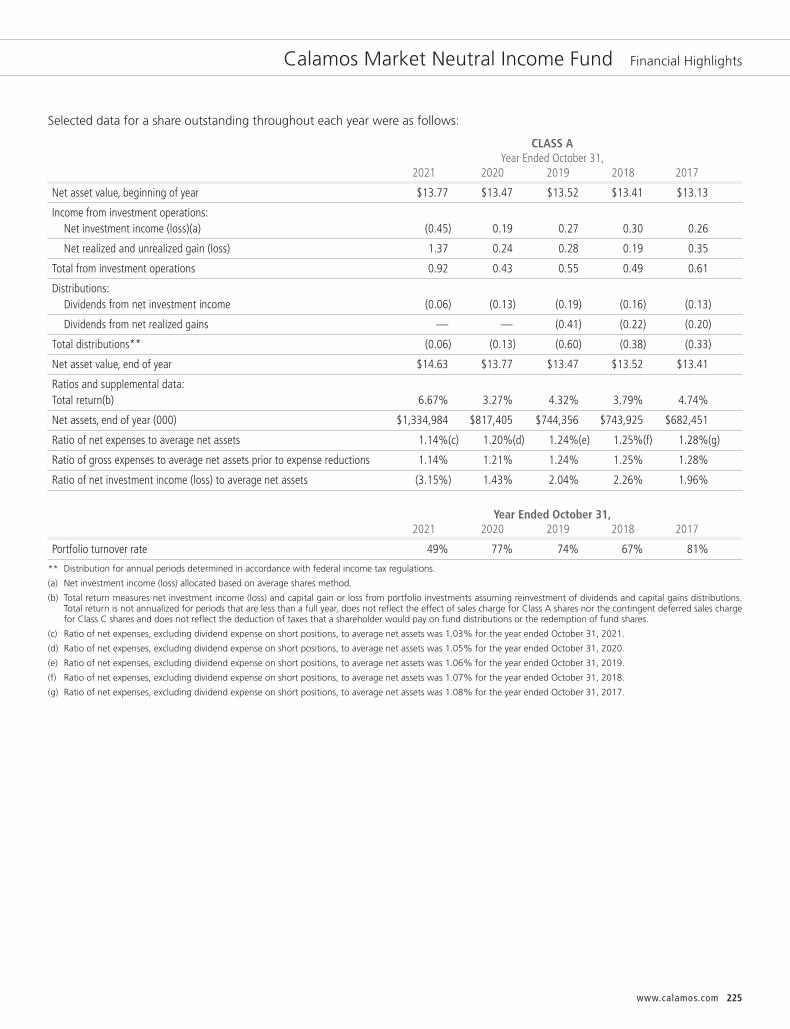
225www.calamos.com
Calamos Market Neutral Income Fund Financial Highlights
Selected data for a share outstanding throughout each year were as follows:
CLASS A Year Ended October 31, 2021 2020 2019 2018 2017
Net asset value, beginning of year $13.77 $13.47 $13.52 $13.41 $13.13
Income from investment operations:Net investment income (loss)(a) (0.45) 0.19 0.27 0.30 0.26
Net realized and unrealized gain (loss) 1.37 0.24 0.28 0.19 0.35
Total from investment operations 0.92 0.43 0.55 0.49 0.61
Distributions:Dividends from net investment income (0.06) (0.13) (0.19) (0.16) (0.13)
Dividends from net realized gains — — (0.41) (0.22) (0.20)
Total distributions** (0.06) (0.13) (0.60) (0.38) (0.33)
Net asset value, end of year $14.63 $13.77 $13.47 $13.52 $13.41
Ratios and supplemental data:Total return(b) 6.67% 3.27% 4.32% 3.79% 4.74%
Net assets, end of year (000) $1,334,984 $817,405 $744,356 $743,925 $682,451
Ratio of net expenses to average net assets 1.14%(c) 1.20%(d) 1.24%(e) 1.25%(f) 1.28%(g)
Ratio of gross expenses to average net assets prior to expense reductions 1.14% 1.21% 1.24% 1.25% 1.28%
Ratio of net investment income (loss) to average net assets (3.15%) 1.43% 2.04% 2.26% 1.96%
Year Ended October 31, 2021 2020 2019 2018 2017
Portfolio turnover rate 49% 77% 74% 67% 81%
** Distribution for annual periods determined in accordance with federal income tax regulations.
(a) Net investment income (loss) allocated based on average shares method.
(b) Total return measures net investment income (loss) and capital gain or loss from portfolio investments assuming reinvestment of dividends and capital gains distributions.Total return is not annualized for periods that are less than a full year, does not reflect the effect of sales charge for Class A shares nor the contingent deferred sales chargefor Class C shares and does not reflect the deduction of taxes that a shareholder would pay on fund distributions or the redemption of fund shares.
(c) Ratio of net expenses, excluding dividend expense on short positions, to average net assets was 1.03% for the year ended October 31, 2021.
(d) Ratio of net expenses, excluding dividend expense on short positions, to average net assets was 1.05% for the year ended October 31, 2020.
(e) Ratio of net expenses, excluding dividend expense on short positions, to average net assets was 1.06% for the year ended October 31, 2019.
(f) Ratio of net expenses, excluding dividend expense on short positions, to average net assets was 1.07% for the year ended October 31, 2018.
(g) Ratio of net expenses, excluding dividend expense on short positions, to average net assets was 1.08% for the year ended October 31, 2017.
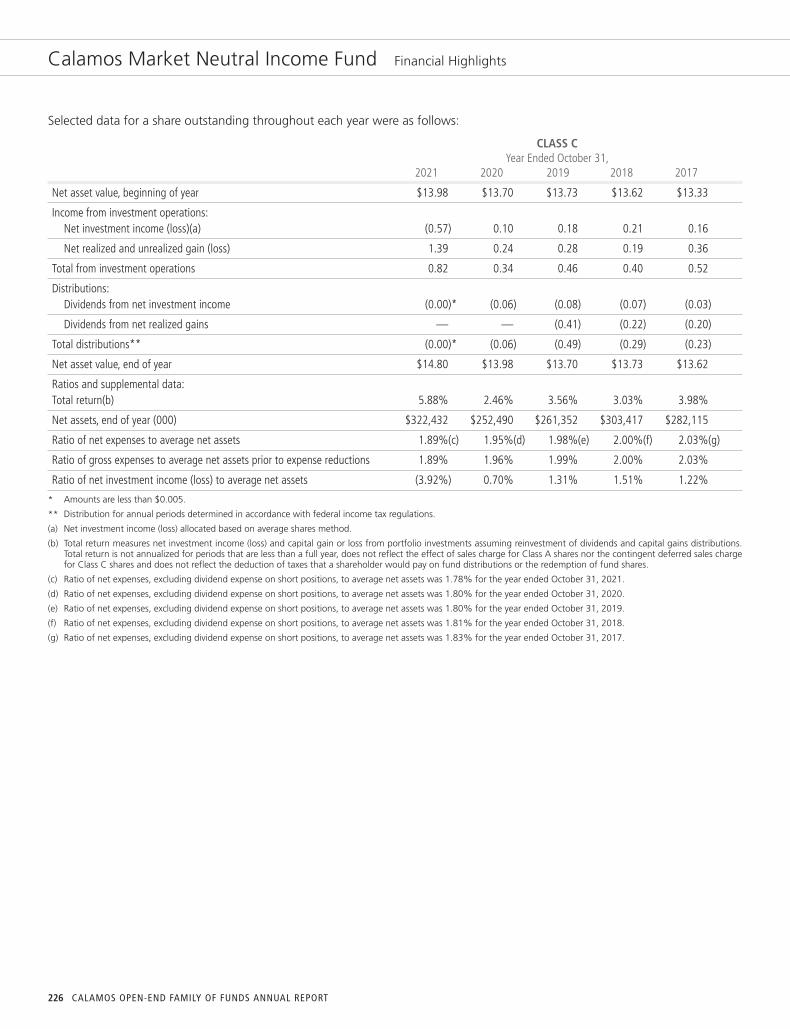
226 CALAMOS OPEN-END FAMILY OF FUNDS ANNUAL REPORT
Calamos Market Neutral Income Fund Financial Highlights
Selected data for a share outstanding throughout each year were as follows:
CLASS C Year Ended October 31, 2021 2020 2019 2018 2017
Net asset value, beginning of year $13.98 $13.70 $13.73 $13.62 $13.33
Income from investment operations:Net investment income (loss)(a) (0.57) 0.10 0.18 0.21 0.16
Net realized and unrealized gain (loss) 1.39 0.24 0.28 0.19 0.36
Total from investment operations 0.82 0.34 0.46 0.40 0.52
Distributions:Dividends from net investment income (0.00)* (0.06) (0.08) (0.07) (0.03)
Dividends from net realized gains — — (0.41) (0.22) (0.20)
Total distributions** (0.00)* (0.06) (0.49) (0.29) (0.23)
Net asset value, end of year $14.80 $13.98 $13.70 $13.73 $13.62
Ratios and supplemental data:Total return(b) 5.88% 2.46% 3.56% 3.03% 3.98%
Net assets, end of year (000) $322,432 $252,490 $261,352 $303,417 $282,115
Ratio of net expenses to average net assets 1.89%(c) 1.95%(d) 1.98%(e) 2.00%(f) 2.03%(g)
Ratio of gross expenses to average net assets prior to expense reductions 1.89% 1.96% 1.99% 2.00% 2.03%
Ratio of net investment income (loss) to average net assets (3.92%) 0.70% 1.31% 1.51% 1.22%
* Amounts are less than $0.005.
** Distribution for annual periods determined in accordance with federal income tax regulations.
(a) Net investment income (loss) allocated based on average shares method.
(b) Total return measures net investment income (loss) and capital gain or loss from portfolio investments assuming reinvestment of dividends and capital gains distributions.Total return is not annualized for periods that are less than a full year, does not reflect the effect of sales charge for Class A shares nor the contingent deferred sales chargefor Class C shares and does not reflect the deduction of taxes that a shareholder would pay on fund distributions or the redemption of fund shares.
(c) Ratio of net expenses, excluding dividend expense on short positions, to average net assets was 1.78% for the year ended October 31, 2021.
(d) Ratio of net expenses, excluding dividend expense on short positions, to average net assets was 1.80% for the year ended October 31, 2020.
(e) Ratio of net expenses, excluding dividend expense on short positions, to average net assets was 1.80% for the year ended October 31, 2019.
(f) Ratio of net expenses, excluding dividend expense on short positions, to average net assets was 1.81% for the year ended October 31, 2018.
(g) Ratio of net expenses, excluding dividend expense on short positions, to average net assets was 1.83% for the year ended October 31, 2017.

227www.calamos.com
Calamos Market Neutral Income Fund Financial Highlights
Selected data for a share outstanding throughout each year were as follows:
CLASS I Year Ended October 31, 2021 2020 2019 2018 2017
Net asset value, beginning of year $13.60 $13.30 $13.36 $13.26 $12.98
Income from investment operations:Net investment income (loss)(a) (0.41) 0.22 0.30 0.33 0.29
Net realized and unrealized gain (loss) 1.35 0.24 0.28 0.19 0.36
Total from investment operations 0.94 0.46 0.58 0.52 0.65
Distributions:Dividends from net investment income (0.09) (0.16) (0.23) (0.20) (0.17)
Dividends from net realized gains — — (0.41) (0.22) (0.20)
Total distributions** (0.09) (0.16) (0.64) (0.42) (0.37)
Net asset value, end of year $14.45 $13.60 $13.30 $13.36 $13.26
Ratios and supplemental data:Total return(b) 6.92% 3.51% 4.62% 4.02% 5.07%
Net assets, end of year (000) $14,780,637 $9,207,961 $7,709,445 $5,658,499 $3,734,035
Ratio of net expenses to average net assets 0.89%(c) 0.95%(d) 0.99%(e) 0.99%(f) 1.02%(g)
Ratio of gross expenses to average net assets prior to expense reductions 0.89% 0.96% 0.99% 0.99% 1.02%
Ratio of net investment income (loss) to average net assets (2.90%) 1.66% 2.28% 2.49% 2.22%
** Distribution for annual periods determined in accordance with federal income tax regulations.
(a) Net investment income (loss) allocated based on average shares method.
(b) Total return measures net investment income (loss) and capital gain or loss from portfolio investments assuming reinvestment of dividends and capital gains distributions.Total return is not annualized for periods that are less than a full year, does not reflect the effect of sales charge for Class A shares nor the contingent deferred sales chargefor Class C shares and does not reflect the deduction of taxes that a shareholder would pay on fund distributions or the redemption of fund shares.
(c) Ratio of net expenses, excluding dividend expense on short positions, to average net assets was 0.78% for the year ended October 31, 2021.
(d) Ratio of net expenses, excluding dividend expense on short positions, to average net assets was 0.80% for the year ended October 31, 2020.
(e) Ratio of net expenses, excluding dividend expense on short positions, to average net assets was 0.81% for the year ended October 31, 2019.
(f) Ratio of net expenses, excluding dividend expense on short positions, to average net assets was 0.81% for the year ended October 31, 2018.
(g) Ratio of net expenses, excluding dividend expense on short positions, to average net assets was 0.83% for the year ended October 31, 2017.

228 CALAMOS OPEN-END FAMILY OF FUNDS ANNUAL REPORT
Calamos Market Neutral Income Fund Financial Highlights
Selected data for a share outstanding throughout each period were as follows:
CLASS R6 June 23, 2020• Year Ended through October 31, October 31, 2021 2020
Net asset value, beginning of period $13.61 $13.35
Income from investment operations:Net investment income (loss)(a) (0.38) 0.05
Net realized and unrealized gain (loss) 1.33 0.21
Total from investment operations 0.95 0.26
Distributions:Dividends from net investment income (0.10) —
Dividends from net realized gains — —
Total distributions** (0.10) —
Net asset value, end of period $14.46 $13.61
Ratios and supplemental data:Total return(b) 6.99% 1.95%
Net assets, end of year (000) $8,846 $10
Ratio of net expenses to average net assets 0.82%(c) 0.77%(d)(e)
Ratio of gross expenses to average net assets prior to expense reductions 0.83% 0.77%(d)
Ratio of net investment income (loss) to average net assets (2.64%) 1.06%(d)
• Commencement of operations.
** Distribution for annual periods determined in accordance with federal income tax regulations.
(a) Net investment income (loss) allocated based on average shares method.
(b) Total return measures net investment income (loss) and capital gain or loss from portfolio investments assuming reinvestment of dividends and capital gains distributions.Total return is not annualized for periods that are less than a full year, does not reflect the effect of sales charge for Class A shares nor the contingent deferred sales chargefor Class C shares and does not reflect the deduction of taxes that a shareholder would pay on fund distributions or the redemption of fund shares.
(c) Ratio of net expenses, excluding dividend expense on short positions, to average net assets was 0.70% for the year ended October 31, 2021.
(d) Annualized.
(e) Ratio of net expenses, excluding dividend expense on short positions, to average net assets was 0.66% for the year ended October 31, 2020.

229www.calamos.com
Selected data for a share outstanding throughout each year were as follows:
CLASS A Year Ended October 31, 2021 2020 2019 2018 2017
Net asset value, beginning of year $12.35 $11.88 $11.44 $10.85 $10.03
Income from investment operations:Net investment income (loss)(a) 0.06 0.10 0.10 0.08 0.12
Net realized and unrealized gain (loss) 2.32 0.47 0.64 0.57 0.76
Total from investment operations 2.38 0.57 0.74 0.65 0.88
Distributions:Dividends from net investment income (0.07) (0.10) (0.05) (0.06) (0.06)
Dividends from net realized gains — — (0.25) — —
Total distributions** (0.07) (0.10) (0.30) (0.06) (0.06)
Net asset value, end of year $14.66 $12.35 $11.88 $11.44 $10.85
Ratios and supplemental data:Total return(b) 19.20% 4.92% 6.65% 6.08% 8.77%
Net assets, end of year (000) $34,309 $15,782 $10,412 $5,151 $1,007
Ratio of net expenses to average net assets 1.17% 1.15% 1.21% 1.25% 1.25%
Ratio of gross expenses to average net assets prior to expense reductions 1.17% 1.20% 1.21% 1.47% 2.14%
Ratio of net investment income (loss) to average net assets 0.44% 0.84% 0.86% 0.65% 1.12%
Year Ended October 31, 2021 2020 2019 2018 2017
Portfolio turnover rate 39% 57% 82% 141% 49%
** Distribution for annual periods determined in accordance with federal income tax regulations.
(a) Net investment income (loss) allocated based on average shares method.
(b) Total return measures net investment income (loss) and capital gain or loss from portfolio investments assuming reinvestment of dividends and capital gains distributions.Total return is not annualized for periods that are less than a full year, does not reflect the effect of sales charge for Class A shares nor the contingent deferred sales chargefor Class C shares and does not reflect the deduction of taxes that a shareholder would pay on fund distributions or the redemption of fund shares.
Calamos Hedged Equity Fund Financial Highlights

230 CALAMOS OPEN-END FAMILY OF FUNDS ANNUAL REPORT
Calamos Hedged Equity Fund Financial Highlights
Selected data for a share outstanding throughout each year were as follows:
CLASS C Year Ended October 31, 2021 2020 2019 2018 2017
Net asset value, beginning of year $12.18 $11.72 $11.35 $10.78 $10.00
Income from investment operations:Net investment income (loss)(a) (0.04) 0.01 0.01 (0.01) 0.02
Net realized and unrealized gain (loss) 2.28 0.48 0.63 0.58 0.79
Total from investment operations 2.24 0.49 0.64 0.57 0.81
Distributions:Dividends from net investment income (0.03) (0.03) (0.02) (0.00)* (0.03)
Dividends from net realized gains — — (0.25) — —
Total distributions** (0.03) (0.03) (0.27) (0.00)* (0.03)
Net asset value, end of year $14.39 $12.18 $11.72 $11.35 $10.78
Ratios and supplemental data:Total return(b) 18.43% 4.19% 5.88% 5.31% 8.09%
Net assets, end of year (000) $6,960 $3,429 $2,151 $616 $173
Ratio of net expenses to average net assets 1.92% 1.90% 1.96% 2.00% 2.00%
Ratio of gross expenses to average net assets prior to expense reductions 1.92% 1.95% 1.96% 2.30% 3.03%
Ratio of net investment income (loss) to average net assets (0.30%) 0.08% 0.11% (0.07%) 0.24%
* Amounts are less than $0.005.
** Distribution for annual periods determined in accordance with federal income tax regulations.
(a) Net investment income (loss) allocated based on average shares method.
(b) Total return measures net investment income (loss) and capital gain or loss from portfolio investments assuming reinvestment of dividends and capital gains distributions.Total return is not annualized for periods that are less than a full year, does not reflect the effect of sales charge for Class A shares nor the contingent deferred sales chargefor Class C shares and does not reflect the deduction of taxes that a shareholder would pay on fund distributions or the redemption of fund shares.

231www.calamos.com
Selected data for a share outstanding throughout each year were as follows:
CLASS I Year Ended October 31, 2021 2020 2019 2018 2017
Net asset value, beginning of year $12.34 $11.87 $11.45 $10.84 $10.04
Income from investment operations:Net investment income (loss)(a) 0.10 0.13 0.13 0.10 0.13
Net realized and unrealized gain (loss) 2.31 0.47 0.64 0.59 0.78
Total from investment operations 2.41 0.60 0.77 0.69 0.91
Distributions:Dividends from net investment income (0.09) (0.13) (0.10) (0.08) (0.11)
Dividends from net realized gains — — (0.25) — —
Total distributions** (0.09) (0.13) (0.35) (0.08) (0.11)
Net asset value, end of year $14.66 $12.34 $11.87 $11.45 $10.84
Ratios and supplemental data:Total return(b) 19.60% 5.09% 7.01% 6.38% 9.12%
Net assets, end of year (000) $514,903 $342,851 $224,234 $91,589 $11,883
Ratio of net expenses to average net assets 0.92% 0.90% 0.96% 1.00% 1.00%
Ratio of gross expenses to average net assets prior to expense reductions 0.92% 0.95% 0.96% 1.26% 2.06%
Ratio of net investment income (loss) to average net assets 0.73% 1.09% 1.12% 0.91% 1.22%
** Distribution for annual periods determined in accordance with federal income tax regulations.
(a) Net investment income (loss) allocated based on average shares method.
(b) Total return measures net investment income (loss) and capital gain or loss from portfolio investments assuming reinvestment of dividends and capital gains distributions.Total return is not annualized for periods that are less than a full year, does not reflect the effect of sales charge for Class A shares nor the contingent deferred sales chargefor Class C shares and does not reflect the deduction of taxes that a shareholder would pay on fund distributions or the redemption of fund shares.
Calamos Hedged Equity Fund Financial Highlights

232 CALAMOS OPEN-END FAMILY OF FUNDS ANNUAL REPORT
Calamos Phineus Long/Short Fund Financial Highlights
Selected data for a share outstanding throughout each year were as follows:
CLASS A Year Ended October 31, 2021 2020 2019 2018 2017
Net asset value, beginning of year $11.18 $11.63 $12.15 $12.33 $10.77
Income from investment operations:Net investment income (loss)(a) (0.13) (0.08) 0.04 (0.03) (0.16)
Net realized and unrealized gain (loss) 4.41 (0.36) (0.12) — 1.82
Total from investment operations 4.28 (0.44) (0.08) (0.03) 1.66
Distributions:Dividends from net investment income — (0.01) — — —
Dividends from net realized gains — — (0.44) (0.15) (0.10)
Return of capital — (0.00)* — — —
Total distributions** — (0.01) (0.44) (0.15) (0.10)
Net asset value, end of year $15.46 $11.18 $11.63 $12.15 $12.33
Ratios and supplemental data:Total return(b) 38.19% (3.77%) (0.45%) (0.34%) 15.46%
Net assets, end of year (000) $51,971 $40,748 $76,689 $108,730 $66,854
Ratio of net expenses to average net assets 2.34%(c) 2.91%(d) 2.95%(e) 2.28%(f) 2.71%(g)
Ratio of gross expenses to average net assets prior to expense reductions 2.34% 2.92% 2.96% 2.28% 2.71%
Ratio of net investment income (loss) to average net assets (0.88%) (0.68%) 0.33% (0.27%) (1.34%)
Year Ended October 31, 2021 2020 2019 2018 2017
Portfolio turnover rate 253% 206% 135% 229% 168%
* Amounts are less than $0.005.
** Distribution for annual periods determined in accordance with federal income tax regulations.
(a) Net investment income (loss) allocated based on average shares method.
(b) Total return measures net investment income (loss) and capital gain or loss from portfolio investments assuming reinvestment of dividends and capital gains distributions.Total return is not annualized for periods that are less than a full year, does not reflect the effect of sales charge for Class A shares nor the contingent deferred sales chargefor Class C shares and does not reflect the deduction of taxes that a shareholder would pay on fund distributions or the redemption of fund shares.
(c) Ratio of net expenses, excluding dividend expense on short positions, to average net assets was 1.67% for the year ended October 31, 2021.
(d) Ratio of net expenses, excluding dividend expense on short positions, to average net assets was 1.71% for the year ended October 31, 2020.
(e) Ratio of net expenses, excluding dividend expense on short positions, to average net assets was 1.64% for the year ended October 31, 2019.
(f) Ratio of net expenses, excluding dividend expense on short positions, to average net assets was 1.64% for the year ended October 31, 2018.
(g) Ratio of net expenses, excluding dividend expense on short positions, to average net assets was 1.73% for the year ended October 31, 2017.

233www.calamos.com
Selected data for a share outstanding throughout each year were as follows:
Class C Year Ended October 31, 2021 2020 2019 2018 2017
Net asset value, beginning of year $10.80 $11.32 $11.92 $12.19 $10.73
Income from investment operations:Net investment income (loss)(a) (0.24) (0.16) (0.05) (0.13) (0.25)
Net realized and unrealized gain (loss) 4.27 (0.36) (0.11) 0.01 1.81
Total from investment operations 4.03 (0.52) (0.16) (0.12) 1.56
Distributions:Dividends from net investment income — — — — —
Dividends from net realized gains — — (0.44) (0.15) (0.10)
Return of capital — (0.00)* — — —
Total distributions** — — (0.44) (0.15) (0.10)
Net asset value, end of year $14.83 $10.80 $11.32 $11.92 $12.19
Ratios and supplemental data:Total return(b) 37.31% (4.59%) (1.15%) (1.09%) 14.58%
Net assets, end of year (000) $29,980 $22,528 $38,072 $52,169 $28,933
Ratio of net expenses to average net assets 3.09%(c) 3.65%(d) 3.69%(e) 3.03%(f) 3.46%(g)
Ratio of gross expenses to average net assets prior to expense reductions 3.09% 3.65% 3.70% 3.03% 3.46%
Ratio of net investment income (loss) to average net assets (1.63%) (1.43%) (0.42%) (1.02%) (2.11%)
* Amounts are less than $0.005.
** Distribution for annual periods determined in accordance with federal income tax regulations.
(a) Net investment income (loss) allocated based on average shares method.
(b) Total return measures net investment income (loss) and capital gain or loss from portfolio investments assuming reinvestment of dividends and capital gains distributions.Total return is not annualized for periods that are less than a full year, does not reflect the effect of sales charge for Class A shares nor the contingent deferred sales chargefor Class C shares and does not reflect the deduction of taxes that a shareholder would pay on fund distributions or the redemption of fund shares.
(c) Ratio of net expenses, excluding dividend expense on short positions, to average net assets was 2.42% for the year ended October 31, 2021.
(d) Ratio of net expenses, excluding dividend expense on short positions, to average net assets was 2.46% for the year ended October 31, 2020.
(e) Ratio of net expenses, excluding dividend expense on short positions, to average net assets was 2.39% for the year ended October 31, 2019.
(f) Ratio of net expenses, excluding dividend expense on short positions, to average net assets was 2.39% for the year ended October 31, 2018.
(g) Ratio of net expenses, excluding dividend expense on short positions, to average net assets was 2.47% for the year ended October 31, 2017.
Calamos Phineus Long/Short Fund Financial Highlights

234 CALAMOS OPEN-END FAMILY OF FUNDS ANNUAL REPORT
Calamos Phineus Long/Short Fund Financial Highlights
Selected data for a share outstanding throughout each year were as follows:
Class I Year Ended October 31, 2021 2020 2019 2018 2017
Net asset value, beginning of year $11.28 $11.75 $12.23 $12.39 $10.80
Income from investment operations:Net investment income (loss)(a) (0.10) (0.05) 0.07 0.01 (0.13)
Net realized and unrealized gain (loss) 4.46 (0.37) (0.11) (0.02) 1.82
Total from investment operations 4.36 (0.42) (0.04) (0.01) 1.69
Distributions:Dividends from net investment income — (0.02) — — —
Dividends from net realized gains — — (0.44) (0.15) (0.10)
Return of capital — (0.03) — — —
Total distributions** — (0.05) (0.44) (0.15) (0.10)
Net asset value, end of year $15.64 $11.28 $11.75 $12.23 $12.39
Ratios and supplemental data:Total return(b) 38.69% (3.67%) (0.16%) (0.10%) 15.70%
Net assets, end of year (000) $476,965 $344,843 $678,157 $1,003,457 $348,840
Ratio of net expenses to average net assets 2.09%(c) 2.64%(d) 2.68%(e) 2.00%(f) 2.45%(g)
Ratio of gross expenses to average net assets prior to expense reductions 2.09% 2.65% 2.69% 2.00% 2.45%
Ratio of net investment income (loss) to average net assets (0.63%) (0.42%) 0.57% 0.05% (1.09%)
** Distribution for annual periods determined in accordance with federal income tax regulations.
(a) Net investment income (loss) allocated based on average shares method.
(b) Total return measures net investment income (loss) and capital gain or loss from portfolio investments assuming reinvestment of dividends and capital gains distributions.Total return is not annualized for periods that are less than a full year, does not reflect the effect of sales charge for Class A shares nor the contingent deferred sales chargefor Class C shares and does not reflect the deduction of taxes that a shareholder would pay on fund distributions or the redemption of fund shares.
(c) Ratio of net expenses, excluding dividend expense on short positions, to average net assets was 1.42% for the year ended October 31, 2021.
(d) Ratio of net expenses, excluding dividend expense on short positions, to average net assets was 1.46% for the year ended October 31, 2020.
(e) Ratio of net expenses, excluding dividend expense on short positions, to average net assets was 1.39% for the year ended October 31, 2019.
(f) Ratio of net expenses, excluding dividend expense on short positions, to average net assets was 1.39% for the year ended October 31, 2018.
(g) Ratio of net expenses, excluding dividend expense on short positions, to average net assets was 1.47% for the year ended October 31, 2017.

235www.calamos.com
Calamos Convertible Fund Financial Highlights
Selected data for a share outstanding throughout each year were as follows:
CLASS A Year Ended October 31, 2021 2020 2019 2018 2017
Net asset value, beginning of year $22.78 $17.45 $18.11 $18.27 $15.93
Income from investment operations:Net investment income (loss)(a) (0.61) 0.47 0.51 0.48 0.49
Net realized and unrealized gain (loss) 6.68 4.99 1.00 0.13 2.16
Total from investment operations 6.07 5.46 1.51 0.61 2.65
Distributions:Dividends from net investment income (0.06) (0.13) (0.35) (0.24) (0.31)
Dividends from net realized gains (1.54) — (1.82) (0.53) —
Total distributions** (1.60) (0.13) (2.17) (0.77) (0.31)
Net asset value, end of year $27.25 $22.78 $17.45 $18.11 $18.27
Ratios and supplemental data:Total return(b) 27.09% 31.58% 10.02% 3.43% 16.88%
Net assets, end of year (000) $422,476 $333,481 $245,948 $210,845 $222,017
Ratio of net expenses to average net assets 1.08% 1.13% 1.16% 1.16% 1.18%
Ratio of gross expenses to average net assets prior to expense reductions 1.08% 1.13% 1.16% 1.16% 1.18%
Ratio of net investment income (loss) to average net assets (2.35%) 2.37% 2.98% 2.58% 2.87%
Year Ended October 31, 2021 2020 2019 2018 2017
Portfolio turnover rate 41% 71% 37% 73% 56%
** Distribution for annual periods determined in accordance with federal income tax regulations.
(a) Net investment income (loss) allocated based on average shares method.
(b) Total return measures net investment income (loss) and capital gain or loss from portfolio investments assuming reinvestment of dividends and capital gains distributions.Total return is not annualized for periods that are less than a full year, does not reflect the effect of sales charge for Class A shares nor the contingent deferred sales chargefor Class C shares and does not reflect the deduction of taxes that a shareholder would pay on fund distributions or the redemption of fund shares.

236 CALAMOS OPEN-END FAMILY OF FUNDS ANNUAL REPORT
Calamos Convertible Fund Financial Highlights
Selected data for a share outstanding throughout each year were as follows:
CLASS C Year Ended October 31, 2021 2020 2019 2018 2017
Net asset value, beginning of year $22.48 $17.27 $17.92 $18.09 $15.79
Income from investment operations:Net investment income (loss)(a) (0.80) 0.32 0.39 0.34 0.36
Net realized and unrealized gain (loss) 6.59 4.93 0.99 0.12 2.14
Total from investment operations 5.79 5.25 1.38 0.46 2.50
Distributions:Dividends from net investment income — (0.04) (0.21) (0.10) (0.20)
Dividends from net realized gains (1.54) — (1.82) (0.53) —
Total distributions** (1.54) (0.04) (2.03) (0.63) (0.20)
Net asset value, end of year $26.73 $22.48 $17.27 $17.92 $18.09
Ratios and supplemental data:Total return(b) 26.16% 30.53% 9.21% 2.65% 15.99%
Net assets, end of year (000) $71,925 $56,935 $56,070 $128,920 $147,112
Ratio of net expenses to average net assets 1.83% 1.88% 1.91% 1.91% 1.93%
Ratio of gross expenses to average net assets prior to expense reductions 1.83% 1.88% 1.91% 1.91% 1.93%
Ratio of net investment income (loss) to average net assets (3.10%) 1.65% 2.34% 1.85% 2.14%
** Distribution for annual periods determined in accordance with federal income tax regulations.
(a) Net investment income (loss) allocated based on average shares method.
(b) Total return measures net investment income (loss) and capital gain or loss from portfolio investments assuming reinvestment of dividends and capital gains distributions.Total return is not annualized for periods that are less than a full year, does not reflect the effect of sales charge for Class A shares nor the contingent deferred sales chargefor Class C shares and does not reflect the deduction of taxes that a shareholder would pay on fund distributions or the redemption of fund shares.

237www.calamos.com
Calamos Convertible Fund Financial Highlights
Selected data for a share outstanding throughout each year were as follows:
CLASS I Year Ended October 31, 2021 2020 2019 2018 2017
Net asset value, beginning of year $20.05 $15.38 $16.23 $16.45 $14.38
Income from investment operations:Net investment income (loss)(a) (0.48) 0.46 0.49 0.47 0.48
Net realized and unrealized gain (loss) 5.86 4.39 0.88 0.13 1.95
Total from investment operations 5.38 4.85 1.37 0.60 2.43
Distributions:Dividends from net investment income (0.07) (0.18) (0.40) (0.29) (0.36)
Dividends from net realized gains (1.54) — (1.82) (0.53) —
Total distributions** (1.61) (0.18) (2.22) (0.82) (0.36)
Net asset value, end of year $23.82 $20.05 $15.38 $16.23 $16.45
Ratios and supplemental data:Total return(b) 27.40% 31.91% 10.31% 3.73% 17.14%
Net assets, end of year (000) $1,161,030 $773,460 $442,907 $275,776 $233,077
Ratio of net expenses to average net assets 0.83% 0.88% 0.91% 0.91% 0.93%
Ratio of gross expenses to average net assets prior to expense reductions 0.83% 0.88% 0.91% 0.91% 0.93%
Ratio of net investment income (loss) to average net assets (2.09%) 2.60% 3.21% 2.83% 3.12%
** Distribution for annual periods determined in accordance with federal income tax regulations.
(a) Net investment income (loss) allocated based on average shares method.
(b) Total return measures net investment income (loss) and capital gain or loss from portfolio investments assuming reinvestment of dividends and capital gains distributions.Total return is not annualized for periods that are less than a full year, does not reflect the effect of sales charge for Class A shares nor the contingent deferred sales chargefor Class C shares and does not reflect the deduction of taxes that a shareholder would pay on fund distributions or the redemption of fund shares.

238 CALAMOS OPEN-END FAMILY OF FUNDS ANNUAL REPORT
Calamos Global Convertible Fund Financial Highlights
Selected data for a share outstanding throughout each year were as follows:
CLASS A Year Ended October 31, 2021 2020 2019 2018 2017
Net asset value, beginning of year $13.48 $11.08 $10.81 $11.24 $9.89
Income from investment operations:Net investment income (loss)(a) (0.44) 0.24 0.10 0.33 0.25
Net realized and unrealized gain (loss) 2.95 2.37 0.70 (0.34) 1.21
Total from investment operations 2.51 2.61 0.80 (0.01) 1.46
Distributions:Dividends from net investment income (0.01) (0.06) (0.22) (0.08) (0.11)
Dividends from net realized gains (1.13) (0.15) (0.31) (0.34) —
Total distributions** (1.14) (0.21) (0.53) (0.42) (0.11)
Net asset value, end of year $14.85 $13.48 $11.08 $10.81 $11.24
Ratios and supplemental data:Total return(b) 18.86% 23.93% 7.90% (0.09%) 14.86%
Net assets, end of year (000) $17,865 $11,231 $8,998 $11,184 $12,713
Ratio of net expenses to average net assets 1.25% 1.33% 1.32% 1.34% 1.35%
Ratio of gross expenses to average net assets prior to expense reductions 1.25% 1.34% 1.32% 1.35% 1.45%
Ratio of net investment income (loss) to average net assets (2.96%) 1.96% 0.91% 2.98% 2.46%
Year Ended October 31, 2021 2020 2019 2018 2017
Portfolio turnover rate 35% 48% 45% 32% 52%
** Distribution for annual periods determined in accordance with federal income tax regulations.
(a) Net investment income (loss) allocated based on average shares method.
(b) Total return measures net investment income (loss) and capital gain or loss from portfolio investments assuming reinvestment of dividends and capital gains distributions.Total return is not annualized for periods that are less than a full year, does not reflect the effect of sales charge for Class A shares nor the contingent deferred sales chargefor Class C shares and does not reflect the deduction of taxes that a shareholder would pay on fund distributions or the redemption of fund shares.

239www.calamos.com
Selected data for a share outstanding throughout each year were as follows:
CLASS C Year Ended October 31, 2021 2020 2019 2018 2017
Net asset value, beginning of year $13.25 $10.93 $10.69 $11.14 $9.85
Income from investment operations:Net investment income (loss)(a) (0.54) 0.14 0.02 0.24 0.16
Net realized and unrealized gain (loss) 2.89 2.35 0.69 (0.33) 1.21
Total from investment operations 2.35 2.49 0.71 (0.09) 1.37
Distributions:Dividends from net investment income — (0.02) (0.16) (0.02) (0.08)
Dividends from net realized gains (1.13) (0.15) (0.31) (0.34) —
Total distributions** (1.13) (0.17) (0.47) (0.36) (0.08)
Net asset value, end of year $14.47 $13.25 $10.93 $10.69 $11.14
Ratios and supplemental data:Total return(b) 17.95% 23.09% 7.01% (0.77%) 13.95%
Net assets, end of year (000) $5,448 $4,824 $3,409 $3,884 $2,887
Ratio of net expenses to average net assets 2.00% 2.08% 2.07% 2.09% 2.10%
Ratio of gross expenses to average net assets prior to expense reductions 2.00% 2.09% 2.07% 2.10% 2.19%
Ratio of net investment income (loss) to average net assets (3.72%) 1.21% 0.16% 2.21% 1.54%
** Distribution for annual periods determined in accordance with federal income tax regulations.
(a) Net investment income (loss) allocated based on average shares method.
(b) Total return measures net investment income (loss) and capital gain or loss from portfolio investments assuming reinvestment of dividends and capital gains distributions.Total return is not annualized for periods that are less than a full year, does not reflect the effect of sales charge for Class A shares nor the contingent deferred sales chargefor Class C shares and does not reflect the deduction of taxes that a shareholder would pay on fund distributions or the redemption of fund shares.
Calamos Global Convertible Fund Financial Highlights

240 CALAMOS OPEN-END FAMILY OF FUNDS ANNUAL REPORT
Calamos Global Convertible Fund Financial Highlights
Selected data for a share outstanding throughout each year were as follows:
CLASS I Year Ended October 31, 2021 2020 2019 2018 2017
Net asset value, beginning of year $13.50 $11.08 $10.82 $11.24 $9.92
Income from investment operations:Net investment income (loss)(a) (0.40) 0.26 0.12 0.36 0.26
Net realized and unrealized gain (loss) 2.94 2.39 0.70 (0.33) 1.21
Total from investment operations 2.54 2.65 0.82 0.03 1.47
Distributions:Dividends from net investment income (0.04) (0.08) (0.25) (0.11) (0.15)
Dividends from net realized gains (1.13) (0.15) (0.31) (0.34) —
Total distributions** (1.17) (0.23) (0.56) (0.45) (0.15)
Net asset value, end of year $14.87 $13.50 $11.08 $10.82 $11.24
Ratios and supplemental data:Total return(b) 19.09% 24.36% 8.09% 0.24% 14.98%
Net assets, end of year (000) $260,688 $192,475 $120,526 $121,170 $91,086
Ratio of net expenses to average net assets 1.00% 1.08% 1.07% 1.09% 1.10%
Ratio of gross expenses to average net assets prior to expense reductions 1.00% 1.09% 1.07% 1.10% 1.18%
Ratio of net investment income (loss) to average net assets (2.71%) 2.19% 1.16% 3.22% 2.47%
** Distribution for annual periods determined in accordance with federal income tax regulations.
(a) Net investment income (loss) allocated based on average shares method.
(b) Total return measures net investment income (loss) and capital gain or loss from portfolio investments assuming reinvestment of dividends and capital gains distributions.Total return is not annualized for periods that are less than a full year, does not reflect the effect of sales charge for Class A shares nor the contingent deferred sales chargefor Class C shares and does not reflect the deduction of taxes that a shareholder would pay on fund distributions or the redemption of fund shares.

241www.calamos.com
Selected data for a share outstanding throughout each year were as follows:
CLASS A* May 31, 2019 July 1, 2018 through through Year Ended October 31, October 31, May 31, Year Ended June 30, 2021 2020 2019 2019† 2018 2017
Net asset value, beginning of year $29.18 $22.31 $22.51 $25.02 $18.54 $14.62
Income from investment operations:Net investment income (loss)(a) (0.45) (0.28) (0.11) (0.29) (0.28) (0.18)
Net realized and unrealized gain (loss) 14.95 8.29 (0.09) (0.80) 6.76 4.10
Total from investment operations 14.50 8.01 (0.20) (1.09) 6.48 3.92
Distributions:Dividends from net investment income — — — — — —
Dividends from net realized gains (1.37) (1.14) — (1.42) — —
Return of capital (0.00)** — — — — —
Total distributions*** (1.37) (1.14) — (1.42) — —
Net asset value, end of year $42.31 $29.18 $22.31 $22.51 $25.02 $18.54
Ratios and supplemental data:Total return(b) 50.42% 37.60% (0.89%) (3.52%) 34.95% 26.81%
Net assets, end of year (000) $35,274 $9,313 $6,857 $5,551 $5,890 $3,954
Ratio of net expenses to average net assets 1.30% 1.30% 1.30%(c) 1.50%(c) 1.50% 1.50%
Ratio of gross expenses to average net assets prior to expense reductions 1.37% 1.40% 1.35%(c) 1.71%(c) 1.74% 1.75%
Ratio of net investment income (loss) to average net assets (1.15%) (1.16%) (1.18%)(c) (1.31%)(c) (1.33%) (1.10%)
May 31, 2019 July 1, 2018 through through Year Ended October 31, October 31, May 31, Year Ended June 30, 2021 2020 2019 2019† 2018 2017
Portfolio turnover rate 165% 181% 142% 112% 126% 179%
* Prior to May 31, 2019, Class A shares were Class Y shares of the predecessor fund.
† Pursuant to the Reorganization of the Predecessor Fund into the Fund, Class Y shareholders of the Predecessor Fund received Class A shares of the Fund, and ServiceClass and Institutional Class shareholders of the Predecessor Fund each received Class I shares of the Fund. As a result of the Reorganization, the Fund adopted theperformance and financial history of the Predecessor Fund. Accordingly, the data shown for periods prior to May 31, 2019 is the data of the Predecessor Fund.
** Amounts are less than $0.005.
*** Distribution for annual periods determined in accordance with federal income tax regulations.
(a) Net investment income (loss) allocated based on average shares method.
(b) Total return measures net investment income (loss) and capital gain or loss from portfolio investments assuming reinvestment of dividends and capital gains distributions.Total return is not annualized for periods that are less than a full year, does not reflect the effect of sales charge for Class A shares and does not reflect the deduction oftaxes that a shareholder would pay on fund distributions or the redemption of fund shares.
(c) Annualized.
Calamos Timpani Small Cap Growth Fund Financial Highlights

242 CALAMOS OPEN-END FAMILY OF FUNDS ANNUAL REPORT
Calamos Timpani Small Cap Growth Fund Financial Highlights
Selected data for a share outstanding throughout each year were as follows:
CLASS C June 25, 2021• through October 31, 2021
Net asset value, beginning of year $41.91
Income from investment operations:Net investment income (loss)(a) (0.82)
Net realized and unrealized gain (loss) 2.41
Total from investment operations 1.59
Distributions:Dividends from net investment income —
Dividends from net realized gains —
Total distributions** —
Net asset value, end of year $43.50
Ratios and supplemental data:Total return(b) 3.75%
Net assets, end of year (000) $3,165
Ratio of net expenses to average net assets 2.05%(c)
Ratio of gross expenses to average net assets prior to expense reductions 2.06%(c)
Ratio of net investment income (loss) to average net assets (2.00%)(c)
• Commencement of operations.
** Distribution for annual periods determined in accordance with federal income tax regulations.
(a) Net investment income (loss) allocated based on average shares method.
(b) Total return measures net investment income (loss) and capital gain or loss from portfolio investments assuming reinvestment of dividends and capital gains distributions.Total return is not annualized for periods that are less than a full year, does not reflect the effect of sales charge for Class A shares nor the contingent deferred sales chargefor Class C shares and does not reflect the deduction of taxes that a shareholder would pay on fund distributions or the redemption of fund shares.
(c) Annualized.

243www.calamos.com
Selected data for a share outstanding throughout each year were as follows:
CLASS I* May 31, 2019 July 1, 2018 through through Year Ended October 31, October 31, May 31, Year Ended June 30, 2021 2020 2019 2019† 2018 2017
Net asset value, beginning of year $29.99 $22.85 $23.02 $25.47 $18.80 $14.77
Income from investment operations:Net investment income (loss)(a) (0.36) (0.23) (0.09) (0.20) (0.20) (0.10)
Net realized and unrealized gain (loss) 15.39 8.51 (0.08) (0.83) 6.87 4.13
Total from investment operations 15.03 8.28 (0.17) (1.03) 6.67 4.03
Distributions:Dividends from net investment income — — — — — —
Dividends from net realized gains (1.37) (1.14) — (1.42) — —
Return of capital (0.00)** — — — — —
Total distributions*** (1.37) (1.14) — (1.42) — —
Net asset value, end of year $43.65 $29.99 $22.85 $23.02 $25.47 $18.80
Ratios and supplemental data:Total return(b) 50.80% 37.90% (0.74%) (3.21%) 35.48% 27.29%
Net assets, end of year (000) $387,149 $124,867 $72,539 $68,510 $69,095 $43,833
Ratio of net expenses to average net assets 1.05% 1.05% 1.05%(c) 1.10%(c) 1.10% 1.10%
Ratio of gross expenses to average net assets prior to expense reductions 1.11% 1.16% 1.11%(c) 1.34%(c) 1.36% 1.36%
Ratio of net investment income (loss) to average net assets (0.90%) (0.92%) (0.93%)(c) (0.92%)(c) (0.92%) (0.64%)
* Prior to May 31, 2019, Class I shares were Institutional Class shares or Service Class shares of the predecessor fund. Results shown are exclusive of the Service Class shares.
† Pursuant to the Reorganization of the Predecessor Fund into the Fund, Class Y shareholders of the Predecessor Fund received Class A shares of the Fund, and ServiceClass and Institutional Class shareholders of the Predecessor Fund each received Class I shares of the Fund. As a result of the Reorganization, the Fund adopted theperformance and financial history of the Predecessor Fund. Accordingly, the data shown for periods prior to May 31, 2019 is the data of the Predecessor Fund.
** Amounts are less than $0.005.
*** Distribution for annual periods determined in accordance with federal income tax regulations.
(a) Net investment income (loss) allocated based on average shares method.
(b) Total return measures net investment income (loss) and capital gain or loss from portfolio investments assuming reinvestment of dividends and capital gains distributions.Total return is not annualized for periods that are less than a full year, does not reflect the effect of sales charge for Class A shares and does not reflect the deduction oftaxes that a shareholder would pay on fund distributions or the redemption of fund shares.
(c) Annualized.
Calamos Timpani Small Cap Growth Fund Financial Highlights

244 CALAMOS OPEN-END FAMILY OF FUNDS ANNUAL REPORT
Calamos Timpani Small Cap Growth Fund Financial Highlights
Selected data for a share outstanding throughout each year were as follows:
CLASS R6 May 31, 2019• through Year Ended October 31, October 31, 2021 2020 2019
Net asset value, beginning of year $30.02 $22.86 $23.02
Income from investment operations:Net investment income (loss)(a) (0.32) (0.21) (0.08)
Net realized and unrealized gain (loss) 15.41 8.51 (0.08)
Total from investment operations 15.09 8.30 (0.16)
Distributions:Dividends from net investment income — — —
Dividends from net realized gains (1.37) (1.14) —
Total distributions** (1.37) (1.14) —
Net asset value, end of year $43.74 $30.02 $22.86
Ratios and supplemental data:Total return(b) 50.96% 37.98% (0.70%)
Net assets, end of year (000) $29,120 $1,562 $1,063
Ratio of net expenses to average net assets 0.96% 0.98% 1.00%(c)
Ratio of gross expenses to average net assets prior to expense reductions 1.02% 1.09% 0.96%(c)
Ratio of net investment income (loss) to average net assets (0.80%) (0.84%) (0.84%)(c)
• Commencement of operations.
** Distribution for annual periods determined in accordance with federal income tax regulations.
(a) Net investment income (loss) allocated based on average shares method.
(b) Total return measures net investment income (loss) and capital gain or loss from portfolio investments assuming reinvestment of dividends and capital gains distributions.Total return is not annualized for periods that are less than a full year.
(c) Annualized.

245www.calamos.com
Calamos Timpani SMID Growth Financial Highlights
Selected data for a share outstanding throughout each year were as follows:
CLASS A August 1, 2019• through Year Ended October 31, October 31, 2021 2020 2019
Net asset value, beginning of year $12.34 $9.01 $10.00
Income from investment operations:Net investment income (loss)(a) (0.20) (0.13) (0.03)
Net realized and unrealized gain (loss) 6.03 3.46 (0.96)
Total from investment operations 5.83 3.33 (0.99)
Distributions:Dividends from net investment income — — —
Dividends from net realized gains — — —
Total distributions** — — —
Net asset value, end of year $18.17 $12.34 $9.01
Ratios and supplemental data:Total return(b) 47.04% 36.96% (9.90)%
Net assets, end of year (000) $162 $182 $9
Ratio of net expenses to average net assets 1.35% 1.35% 1.37%(c)
Ratio of gross expenses to average net assets prior to expense reductions 1.79% 2.45% 3.42%(c)
Ratio of net investment income (loss) to average net assets (1.22%) (1.21%) (1.11%)(c)
August 1, 2019• through Year Ended October 31, October 31, 2021 2020 2019
Portfolio turnover rate 188% 201% 55%
• Commencement of operations.
** Distribution for annual periods determined in accordance with federal income tax regulations.
(a) Net investment income (loss) allocated based on average shares method.
(b) Total return measures net investment income (loss) and capital gain or loss from portfolio investments assuming reinvestment of dividends and capital gains distributions.Total return is not annualized for periods that are less than a full year, does not reflect the effect of sales charge for Class A shares.
(c) Annualized.

246 CALAMOS OPEN-END FAMILY OF FUNDS ANNUAL REPORT
Calamos Timpani SMID Growth Financial Highlights
Selected data for a share outstanding throughout each year were as follows:
CLASS I August 1, 2019• through Year Ended October 31, October 31, 2021 2020 2019
Net asset value, beginning of year $12.38 $9.02 $10.00
Income from investment operations:Net investment income (loss)(a) (0.16) (0.10) (0.02)
Net realized and unrealized gain (loss) 6.06 3.46 (0.96)
Total from investment operations 5.90 3.36 (0.98)
Distributions:Dividends from net investment income — — —
Dividends from net realized gains — — —
Total distributions** — — —
Net asset value, end of year $18.28 $12.38 $9.02
Ratios and supplemental data:Total return(b) 47.46% 37.25% (9.80%)
Net assets, end of year (000) $25,793 $16,877 $9,348
Ratio of net expenses to average net assets 1.10% 1.10% 1.10%(c)
Ratio of gross expenses to average net assets prior to expense reductions 1.55% 2.25% 3.17%(c)
Ratio of net investment income (loss) to average net assets (0.98%) (0.94%) (0.85%)(c)
• Commencement of operations.
** Distribution for annual periods determined in accordance with federal income tax regulations.
(a) Net investment income (loss) allocated based on average shares method.
(b) Total return measures net investment income (loss) and capital gain or loss from portfolio investments assuming reinvestment of dividends and capital gains distributions.Total return is not annualized for periods that are less than a full year.
(c) Annualized.

247www.calamos.com
Calamos Timpani SMID Growth Financial Highlights
Selected data for a share outstanding throughout each year were as follows:
CLASS R6 August 1, 2019• through Year Ended October 31, October 31, 2021 2020 2019
Net asset value, beginning of year $12.38 $9.02 $10.00
Income from investment operations:Net investment income (loss)(a) (0.18) (0.09) (0.02)
Net realized and unrealized gain (loss) 6.08 3.45 (0.96)
Total from investment operations 5.90 3.36 (0.98)
Distributions:Dividends from net investment income — — —
Dividends from net realized gains — — —
Total distributions** — — —
Net asset value, end of year $18.28 $12.38 $9.02
Ratios and supplemental data:Total return(b) 47.46% 37.25% (9.80%)
Net assets, end of year (000) $499 $12 $9
Ratio of net expenses to average net assets 1.08% 1.06% 1.07%(c)
Ratio of gross expenses to average net assets prior to expense reductions 1.48% 2.25% 3.16%(c)
Ratio of net investment income (loss) to average net assets (1.04%) (0.90%) (0.81%)(c)
• Commencement of operations.
** Distribution for annual periods determined in accordance with federal income tax regulations.
(a) Net investment income (loss) allocated based on average shares method.
(b) Total return measures net investment income (loss) and capital gain or loss from portfolio investments assuming reinvestment of dividends and capital gains distributions.Total return is not annualized for periods that are less than a full year.
(c) Annualized.

248 CALAMOS OPEN-END FAMILY OF FUNDS ANNUAL REPORT
Calamos Growth Fund Financial Highlights
Selected data for a share outstanding throughout each year were as follows:
CLASS A Year Ended October 31, 2021 2020 2019 2018 2017
Net asset value, beginning of year $34.96 $32.23 $33.14 $35.54 $30.12
Income from investment operations:Net investment income (loss)(a) (0.33) (0.14) (0.04) (0.08) (0.17)
Net realized and unrealized gain (loss) 15.44 5.90 3.53 2.15 6.79
Total from investment operations 15.11 5.76 3.49 2.07 6.62
Distributions:Dividends from net investment income — — — — —
Dividends from net realized gains (4.19) (3.03) (4.40) (4.47) (1.20)
Total distributions** (4.19) (3.03) (4.40) (4.47) (1.20)
Net asset value, end of year $45.88 $34.96 $32.23 $33.14 $35.54
Ratios and supplemental data:Total return(b) 46.00% 19.11% 13.97% 6.12% 22.79%
Net assets, end of year (000) $1,436,709 $1,093,909 $1,066,939 $851,590 $967,725
Ratio of net expenses to average net assets 1.28% 1.34% 1.34% 1.29% 1.39%
Ratio of gross expenses to average net assets prior to expense reductions 1.28% 1.34% 1.34% 1.29% 1.39%
Ratio of net investment income (loss) to average net assets (0.80%) (0.45%) (0.12%) (0.22%) (0.52%)
Year Ended October 31, 2021 2020 2019 2018 2017
Portfolio turnover rate 45% 115% 69% 72% 104%
** Distribution for annual periods determined in accordance with federal income tax regulations.
(a) Net investment income (loss) allocated based on average shares method.
(b) Total return measures net investment income (loss) and capital gain or loss from portfolio investments assuming reinvestment of dividends and capital gains distributions.Total return is not annualized for periods that are less than a full year, does not reflect the effect of sales charge for Class A shares nor the contingent deferred sales chargefor Class C shares and does not reflect the deduction of taxes that a shareholder would pay on fund distributions or the redemption of fund shares.

249www.calamos.com
Selected data for a share outstanding throughout each year were as follows:
CLASS C Year Ended October 31, 2021 2020 2019 2018 2017
Net asset value, beginning of year $18.18 $18.26 $21.00 $24.26 $21.08
Income from investment operations:Net investment income (loss)(a) (0.29) (0.20) (0.13) (0.22) (0.28)
Net realized and unrealized gain (loss) 7.51 3.15 1.79 1.43 4.66
Total from investment operations 7.22 2.95 1.66 1.21 4.38
Distributions:Dividends from net investment income — — — — —
Dividends from net realized gains (4.19) (3.03) (4.40) (4.47) (1.20)
Total distributions** (4.19) (3.03) (4.40) (4.47) (1.20)
Net asset value, end of year $21.21 $18.18 $18.26 $21.00 $24.26
Ratios and supplemental data:Total return(b) 44.94% 18.23% 13.18% 5.34% 21.85%
Net assets, end of year (000) $25,965 $35,843 $50,442 $329,883 $398,115
Ratio of net expenses to average net assets 2.04% 2.09% 2.11% 2.04% 2.14%
Ratio of gross expenses to average net assets prior to expense reductions 2.04% 2.10% 2.12% 2.04% 2.14%
Ratio of net investment income (loss) to average net assets (1.53%) (1.17%) (0.73%) (0.97%) (1.26%)
** Distribution for annual periods determined in accordance with federal income tax regulations.
(a) Net investment income (loss) allocated based on average shares method.
(b) Total return measures net investment income (loss) and capital gain or loss from portfolio investments assuming reinvestment of dividends and capital gains distributions.Total return is not annualized for periods that are less than a full year, does not reflect the effect of sales charge for Class A shares nor the contingent deferred sales chargefor Class C shares and does not reflect the deduction of taxes that a shareholder would pay on fund distributions or the redemption of fund shares.
Calamos Growth Fund Financial Highlights

250 CALAMOS OPEN-END FAMILY OF FUNDS ANNUAL REPORT
Calamos Growth Fund Financial Highlights
Selected data for a share outstanding throughout each year were as follows:
CLASS I Year Ended October 31, 2021 2020 2019 2018 2017
Net asset value, beginning of year $49.25 $44.13 $43.48 $45.18 $37.88
Income from investment operations:Net investment income (loss)(a) (0.33) (0.09) 0.06 0.02 (0.11)
Net realized and unrealized gain (loss) 22.20 8.24 4.99 2.75 8.61
Total from investment operations 21.87 8.15 5.05 2.77 8.50
Distributions:Dividends from net investment income — — — — —
Dividends from net realized gains (4.19) (3.03) (4.40) (4.47) (1.20)
Total distributions** (4.19) (3.03) (4.40) (4.47) (1.20)
Net asset value, end of year $66.93 $49.25 $44.13 $43.48 $45.18
Ratios and supplemental data:Total return(b) 46.40% 19.39% 14.24% 6.41% 23.09%
Net assets, end of year (000) $395,431 $291,027 $280,294 $282,061 $301,237
Ratio of net expenses to average net assets 1.03% 1.09% 1.09% 1.04% 1.14%
Ratio of gross expenses to average net assets prior to expense reductions 1.03% 1.09% 1.09% 1.04% 1.14%
Ratio of net investment income (loss) to average net assets (0.56%) (0.20%) 0.15% 0.03% (0.27%)
** Distribution for annual periods determined in accordance with federal income tax regulations.
(a) Net investment income (loss) allocated based on average shares method.
(b) Total return measures net investment income (loss) and capital gain or loss from portfolio investments assuming reinvestment of dividends and capital gains distributions.Total return is not annualized for periods that are less than a full year, does not reflect the effect of sales charge for Class A shares nor the contingent deferred sales chargefor Class C shares and does not reflect the deduction of taxes that a shareholder would pay on fund distributions or the redemption of fund shares.

251www.calamos.com
Selected data for a share outstanding throughout each year were as follows:
CLASS A Year Ended October 31, 2021 2020 2019 2018 2017
Net asset value, beginning of year $36.26 $33.43 $32.53 $33.15 $30.17
Income from investment operations:Net investment income (loss)(a) 0.07 0.30 0.32 0.25 0.49
Net realized and unrealized gain (loss) 13.01 3.74 2.99 1.41 4.53
Total from investment operations 13.08 4.04 3.31 1.66 5.02
Distributions:Dividends from net investment income (0.27) (0.41) (0.50) (0.38) (0.84)
Dividends from net realized gains (0.89) (0.80) (1.91) (1.90) (1.20)
Total distributions** (1.16) (1.21) (2.41) (2.28) (2.04)
Net asset value, end of year $48.18 $36.26 $33.43 $32.53 $33.15
Ratios and supplemental data:Total return(b) 36.68% 12.43% 11.51% 5.20% 17.39%
Net assets, end of year (000) $1,531,445 $1,163,876 $1,129,201 $832,433 $918,695
Ratio of net expenses to average net assets 1.06% 1.08% 1.09% 1.09% 1.11%
Ratio of gross expenses to average net assets prior to expense reductions 1.06% 1.08% 1.09% 1.09% 1.11%
Ratio of net investment income (loss) to average net assets 0.15% 0.86% 1.01% 0.77% 1.58%
Year Ended October 31, 2021 2020 2019 2018 2017
Portfolio turnover rate 18% 35% 19% 25% 32%
** Distribution for annual periods determined in accordance with federal income tax regulations.
(a) Net investment income (loss) allocated based on average shares method.
(b) Total return measures net investment income (loss) and capital gain or loss from portfolio investments assuming reinvestment of dividends and capital gains distributions.Total return is not annualized for periods that are less than a full year, does not reflect the effect of sales charge for Class A shares nor the contingent deferred sales chargefor Class C shares and does not reflect the deduction of taxes that a shareholder would pay on fund distributions or the redemption of fund shares.
Calamos Growth and Income Fund Financial Highlights

252 CALAMOS OPEN-END FAMILY OF FUNDS ANNUAL REPORT
Calamos Growth and Income Fund Financial Highlights
Selected data for a share outstanding throughout each year were as follows:
CLASS C Year Ended October 31, 2021 2020 2019 2018 2017
Net asset value, beginning of year $36.57 $33.68 $32.69 $33.30 $30.28
Income from investment operations:Net investment income (loss)(a) (0.25) 0.04 0.12 0.01 0.27
Net realized and unrealized gain (loss) 13.12 3.79 2.98 1.41 4.54
Total from investment operations 12.87 3.83 3.10 1.42 4.81
Distributions:Dividends from net investment income — (0.14) (0.20) (0.13) (0.59)
Dividends from net realized gains (0.89) (0.80) (1.91) (1.90) (1.20)
Total distributions** (0.89) (0.94) (2.11) (2.03) (1.79)
Net asset value, end of year $48.55 $36.57 $33.68 $32.69 $33.30
Ratios and supplemental data:Total return(b) 35.66% 11.62% 10.68% 4.42% 16.54%
Net assets, end of year (000) $98,647 $101,490 $136,333 $502,593 $574,455
Ratio of net expenses to average net assets 1.81% 1.84% 1.85% 1.84% 1.86%
Ratio of gross expenses to average net assets prior to expense reductions 1.81% 1.84% 1.85% 1.84% 1.86%
Ratio of net investment income (loss) to average net assets (0.57%) 0.13% 0.37% 0.02% 0.85%
** Distribution for annual periods determined in accordance with federal income tax regulations.
(a) Net investment income (loss) allocated based on average shares method.
(b) Total return measures net investment income (loss) and capital gain or loss from portfolio investments assuming reinvestment of dividends and capital gains distributions.Total return is not annualized for periods that are less than a full year, does not reflect the effect of sales charge for Class A shares nor the contingent deferred sales chargefor Class C shares and does not reflect the deduction of taxes that a shareholder would pay on fund distributions or the redemption of fund shares.

253
Selected data for a share outstanding throughout each year were as follows:
CLASS I Year Ended October 31, 2021 2020 2019 2018 2017
Net asset value, beginning of year $34.68 $32.03 $31.28 $31.96 $29.15
Income from investment operations:Net investment income (loss)(a) 0.17 0.36 0.39 0.32 0.55
Net realized and unrealized gain (loss) 12.44 3.58 2.85 1.37 4.38
Total from investment operations 12.61 3.94 3.24 1.69 4.93
Distributions:Dividends from net investment income (0.38) (0.49) (0.58) (0.47) (0.92)
Dividends from net realized gains (0.89) (0.80) (1.91) (1.90) (1.20)
Total distributions** (1.27) (1.29) (2.49) (2.37) (2.12)
Net asset value, end of year $46.02 $34.68 $32.03 $31.28 $31.96
Ratios and supplemental data:Total return(b) 37.02% 12.72% 11.81% 5.45% 17.71%
Net assets, end of year (000) $1,211,985 $818,641 $735,329 $643,422 $554,490
Ratio of net expenses to average net assets 0.81% 0.83% 0.85% 0.84% 0.86%
Ratio of gross expenses to average net assets prior to expense reductions 0.81% 0.83% 0.85% 0.84% 0.86%
Ratio of net investment income (loss) to average net assets 0.40% 1.11% 1.27% 1.01% 1.83%
** Distribution for annual periods determined in accordance with federal income tax regulations.
(a) Net investment income (loss) allocated based on average shares method.
(b) Total return measures net investment income (loss) and capital gain or loss from portfolio investments assuming reinvestment of dividends and capital gains distributions.Total return is not annualized for periods that are less than a full year, does not reflect the effect of sales charge for Class A shares nor the contingent deferred sales chargefor Class C shares and does not reflect the deduction of taxes that a shareholder would pay on fund distributions or the redemption of fund shares.
www.calamos.com
Calamos Growth and Income Fund Financial Highlights
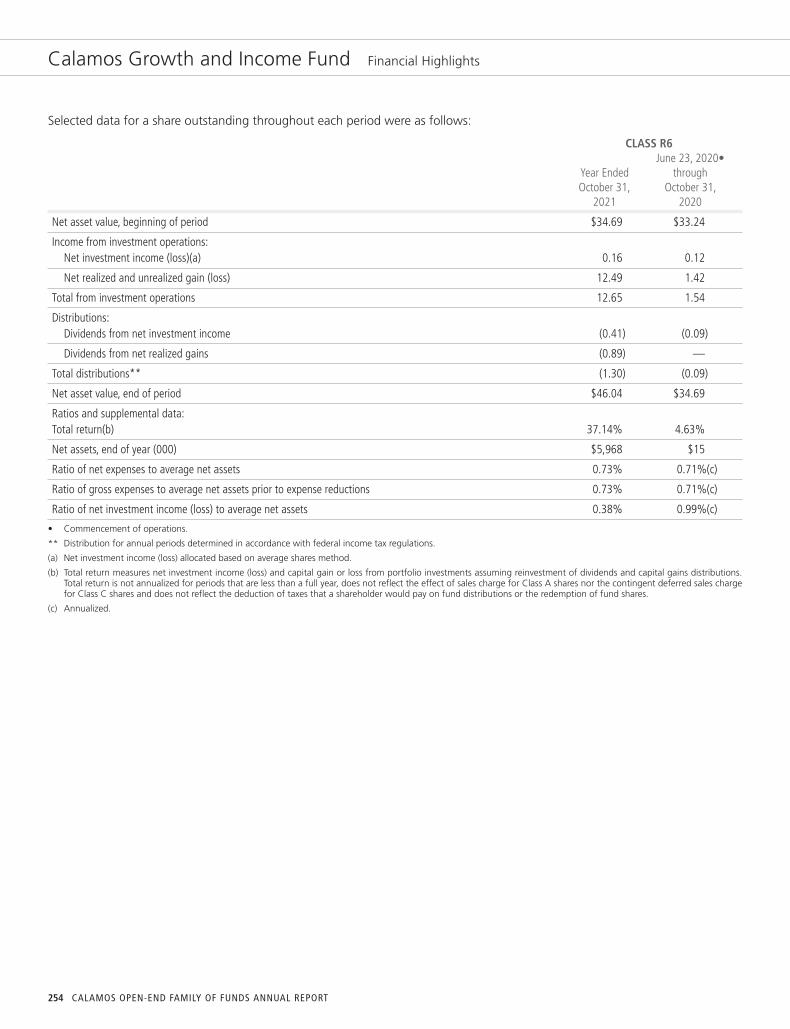
254 CALAMOS OPEN-END FAMILY OF FUNDS ANNUAL REPORT
Calamos Growth and Income Fund Financial Highlights
Selected data for a share outstanding throughout each period were as follows:
CLASS R6 June 23, 2020• Year Ended through October 31, October 31, 2021 2020
Net asset value, beginning of period $34.69 $33.24
Income from investment operations:Net investment income (loss)(a) 0.16 0.12
Net realized and unrealized gain (loss) 12.49 1.42
Total from investment operations 12.65 1.54
Distributions:Dividends from net investment income (0.41) (0.09)
Dividends from net realized gains (0.89) —
Total distributions** (1.30) (0.09)
Net asset value, end of period $46.04 $34.69
Ratios and supplemental data:Total return(b) 37.14% 4.63%
Net assets, end of year (000) $5,968 $15
Ratio of net expenses to average net assets 0.73% 0.71%(c)
Ratio of gross expenses to average net assets prior to expense reductions 0.73% 0.71%(c)
Ratio of net investment income (loss) to average net assets 0.38% 0.99%(c)
• Commencement of operations.
** Distribution for annual periods determined in accordance with federal income tax regulations.
(a) Net investment income (loss) allocated based on average shares method.
(b) Total return measures net investment income (loss) and capital gain or loss from portfolio investments assuming reinvestment of dividends and capital gains distributions.Total return is not annualized for periods that are less than a full year, does not reflect the effect of sales charge for Class A shares nor the contingent deferred sales chargefor Class C shares and does not reflect the deduction of taxes that a shareholder would pay on fund distributions or the redemption of fund shares.
(c) Annualized.

255www.calamos.com
Calamos Dividend Growth Fund Financial Highlights
Selected data for a share outstanding throughout each year were as follows:
CLASS A Year Ended October 31, 2021 2020 2019 2018 2017
Net asset value, beginning of year $13.04 $13.37 $12.34 $12.73 $10.38
Income from investment operations:Net investment income (loss)(a) 0.00* 0.05 0.07 0.07 0.10
Net realized and unrealized gain (loss) 5.24 1.13 1.50 0.57 2.30
Total from investment operations 5.24 1.18 1.57 0.64 2.40
Distributions:Dividends from net investment income (0.02) (0.06) (0.08) (0.05) (0.05)
Dividends from net realized gains (1.13) (1.45) (0.46) (0.98) —
Total distributions** (1.15) (1.51) (0.54) (1.03) (0.05)
Net asset value, end of year $17.13 $13.04 $13.37 $12.34 $12.73
Ratios and supplemental data:Total return(b) 42.42% 9.20% 13.63% 5.26% 23.17%
Net assets, end of year (000) $5,139 $3,534 $3,638 $2,347 $2,031
Ratio of net expenses to average net assets 1.35% 1.35% 1.35% 1.35% 1.35%
Ratio of gross expenses to average net assets prior to expense reductions 2.04% 2.15% 1.94% 1.83% 1.87%
Ratio of net investment income (loss) to average net assets 0.02% 0.40% 0.60% 0.55% 0.93%
Year Ended October 31, 2021 2020 2019 2018 2017
Portfolio turnover rate 20% 22% 15% 11% 15%
* Amounts are less than $0.005.
** Distribution for annual periods determined in accordance with federal income tax regulations.
(a) Net investment income (loss) allocated based on average shares method.
(b) Total return measures net investment income (loss) and capital gain or loss from portfolio investments assuming reinvestment of dividends and capital gains distributions.Total return is not annualized for periods that are less than a full year, does not reflect the effect of sales charge for Class A shares nor the contingent deferred sales chargefor Class C shares and does not reflect the deduction of taxes that a shareholder would pay on fund distributions or the redemption of fund shares.

256 CALAMOS OPEN-END FAMILY OF FUNDS ANNUAL REPORT
Calamos Dividend Growth Fund Financial Highlights
Selected data for a share outstanding throughout each year were as follows:
CLASS C Year Ended October 31, 2021 2020 2019 2018 2017
Net asset value, beginning of year $12.67 $13.07 $12.09 $12.52 $10.26
Income from investment operations:Net investment income (loss)(a) (0.11) (0.04) (0.01) (0.02) 0.00*
Net realized and unrealized gain (loss) 5.07 1.09 1.45 0.57 2.28
Total from investment operations 4.96 1.05 1.44 0.55 2.28
Distributions:Dividends from net investment income (0.01) — — — (0.02)
Dividends from net realized gains (1.13) (1.45) (0.46) (0.98) —
Total distributions** (1.14) (1.45) (0.46) (0.98) (0.02)
Net asset value, end of year $16.49 $12.67 $13.07 $12.09 $12.52
Ratios and supplemental data:Total return(b) 41.37% 8.35% 12.74% 4.56% 22.26%
Net assets, end of year (000) $2,017 $685 $659 $1,028 $1,039
Ratio of net expenses to average net assets 2.10% 2.11% 2.10% 2.10% 2.10%
Ratio of gross expenses to average net assets prior to expense reductions 2.78% 2.91% 2.65% 2.59% 2.73%
Ratio of net investment income (loss) to average net assets (0.74%) (0.36%) (0.06%) (0.19%) 0.00%^
* Amounts are less than $0.005.
** Distribution for annual periods determined in accordance with federal income tax regulations.
^ Amounts are less than 0.005%.
(a) Net investment income (loss) allocated based on average shares method.
(b) Total return measures net investment income (loss) and capital gain or loss from portfolio investments assuming reinvestment of dividends and capital gains distributions.Total return is not annualized for periods that are less than a full year, does not reflect the effect of sales charge for Class A shares nor the contingent deferred sales chargefor Class C shares and does not reflect the deduction of taxes that a shareholder would pay on fund distributions or the redemption of fund shares.

257www.calamos.com
Calamos Dividend Growth Fund Financial Highlights
Selected data for a share outstanding throughout each year were as follows:
CLASS I Year Ended October 31, 2021 2020 2019 2018 2017
Net asset value, beginning of year $13.03 $13.36 $12.33 $12.71 $10.39
Income from investment operations:Net investment income (loss)(a) 0.04 0.08 0.11 0.10 0.11
Net realized and unrealized gain (loss) 5.23 1.12 1.49 0.58 2.32
Total from investment operations 5.27 1.20 1.60 0.68 2.43
Distributions:Dividends from net investment income (0.02) (0.08) (0.11) (0.08) (0.11)
Dividends from net realized gains (1.13) (1.45) (0.46) (0.98) —
Total distributions** (1.15) (1.53) (0.57) (1.06) (0.11)
Net asset value, end of year $17.15 $13.03 $13.36 $12.33 $12.71
Ratios and supplemental data:Total return(b) 42.73% 9.46% 13.93% 5.61% 23.46%
Net assets, end of year (000) $10,373 $8,974 $12,986 $20,585 $22,201
Ratio of net expenses to average net assets 1.10% 1.10% 1.10% 1.10% 1.10%
Ratio of gross expenses to average net assets prior to expense reductions 1.80% 1.88% 1.67% 1.60% 1.80%
Ratio of net investment income (loss) to average net assets 0.28% 0.67% 0.92% 0.82% 0.89%
** Distribution for annual periods determined in accordance with federal income tax regulations.
(a) Net investment income (loss) allocated based on average shares method.
(b) Total return measures net investment income (loss) and capital gain or loss from portfolio investments assuming reinvestment of dividends and capital gains distributions.Total return is not annualized for periods that are less than a full year, does not reflect the effect of sales charge for Class A shares nor the contingent deferred sales chargefor Class C shares and does not reflect the deduction of taxes that a shareholder would pay on fund distributions or the redemption of fund shares.

258 CALAMOS OPEN-END FAMILY OF FUNDS ANNUAL REPORT
Calamos Select Fund Financial Highlights
Selected data for a share outstanding throughout each year were as follows:
CLASS A Year Ended October 31, 2021 2020 2019 2018 2017
Net asset value, beginning of year $14.93 $14.21 $15.37 $15.21 $12.60
Income from investment operations:Net investment income (loss)(a) (0.03) 0.07 0.15 0.10 0.15
Net realized and unrealized gain (loss) 6.39 0.74 0.95 0.58 2.56
Total from investment operations 6.36 0.81 1.10 0.68 2.71
Distributions:Dividends from net investment income — (0.09) (0.06) (0.05) (0.10)
Dividends from net realized gains (0.81) — (2.20) (0.47) —
Total distributions** (0.81) (0.09) (2.26) (0.52) (0.10)
Net asset value, end of year $20.48 $14.93 $14.21 $15.37 $15.21
Ratios and supplemental data:Total return(b) 43.93% 5.71% 10.14% 4.53% 21.56%
Net assets, end of year (000) $14,211 $10,595 $11,363 $21,349 $21,894
Ratio of net expenses to average net assets 1.15% 1.15% 1.15% 1.15% 1.15%
Ratio of gross expenses to average net assets prior to expense reductions 1.57% 1.64% 1.62% 1.60% 1.67%
Ratio of net investment income (loss) to average net assets (0.19%) 0.49% 1.06% 0.64% 1.10%
Year Ended October 31, 2021 2020 2019 2018 2017
Portfolio turnover rate 25% 136% 78% 119% 105%
** Distribution for annual periods determined in accordance with federal income tax regulations.
(a) Net investment income (loss) allocated based on average shares method.
(b) Total return measures net investment income (loss) and capital gain or loss from portfolio investments assuming reinvestment of dividends and capital gains distributions.Total return is not annualized for periods that are less than a full year, does not reflect the effect of sales charge for Class A shares nor the contingent deferred sales chargefor Class C shares and does not reflect the deduction of taxes that a shareholder would pay on fund distributions or the redemption of fund shares.

259www.calamos.com
Selected data for a share outstanding throughout each year were as follows:
CLASS C Year Ended October 31, 2021 2020 2019 2018 2017
Net asset value, beginning of year $12.97 $12.36 $13.77 $13.74 $11.39
Income from investment operations:Net investment income (loss)(a) (0.14) (0.01) 0.02 (0.01) 0.04
Net realized and unrealized gain (loss) 5.50 0.62 0.83 0.51 2.32
Total from investment operations 5.36 0.61 0.85 0.50 2.36
Distributions:Dividends from net investment income — — (0.06) — (0.01)
Dividends from net realized gains (0.81) — (2.20) (0.47) —
Total distributions** (0.81) — (2.26) (0.47) (0.01)
Net asset value, end of year $17.52 $12.97 $12.36 $13.77 $13.74
Ratios and supplemental data:Total return(b) 42.92% 4.85% 9.33% 3.77% 20.70%
Net assets, end of year (000) $887 $1,056 $5,274 $4,318 $4,728
Ratio of net expenses to average net assets 1.90% 1.90% 1.90% 1.90% 1.90%
Ratio of gross expenses to average net assets prior to expense reductions 2.33% 2.40% 2.35% 2.35% 2.42%
Ratio of net investment income (loss) to average net assets (0.92%) (0.11%) 0.15% (0.10%) 0.31%
** Distribution for annual periods determined in accordance with federal income tax regulations.
(a) Net investment income (loss) allocated based on average shares method.
(b) Total return measures net investment income (loss) and capital gain or loss from portfolio investments assuming reinvestment of dividends and capital gains distributions.Total return is not annualized for periods that are less than a full year, does not reflect the effect of sales charge for Class A shares nor the contingent deferred sales chargefor Class C shares and does not reflect the deduction of taxes that a shareholder would pay on fund distributions or the redemption of fund shares.
Calamos Select Fund Financial Highlights

260 CALAMOS OPEN-END FAMILY OF FUNDS ANNUAL REPORT
Calamos Select Fund Financial Highlights
Selected data for a share outstanding throughout each year were as follows:
CLASS I Year Ended October 31, 2021 2020 2019 2018 2017
Net asset value, beginning of year $15.36 $14.62 $15.80 $15.63 $12.94
Income from investment operations:Net investment income (loss)(a) 0.01 0.10 0.16 0.14 0.18
Net realized and unrealized gain (loss) 6.59 0.76 1.01 0.59 2.64
Total from investment operations 6.60 0.86 1.17 0.73 2.82
Distributions:Dividends from net investment income — (0.12) (0.15) (0.09) (0.13)
Dividends from net realized gains (0.81) — (2.20) (0.47) —
Total distributions** (0.81) (0.12) (2.35) (0.56) (0.13)
Net asset value, end of year $21.15 $15.36 $14.62 $15.80 $15.63
Ratios and supplemental data:Total return(b) 44.28% 5.92% 10.43% 4.78% 21.92%
Net assets, end of year (000) $38,585 $36,075 $28,389 $21,892 $25,669
Ratio of net expenses to average net assets 0.90% 0.90% 0.90% 0.90% 0.90%
Ratio of gross expenses to average net assets prior to expense reductions 1.32% 1.39% 1.36% 1.36% 1.42%
Ratio of net investment income (loss) to average net assets 0.07% 0.69% 1.13% 0.90% 1.28%
** Distribution for annual periods determined in accordance with federal income tax regulations.
(a) Net investment income (loss) allocated based on average shares method.
(b) Total return measures net investment income (loss) and capital gain or loss from portfolio investments assuming reinvestment of dividends and capital gains distributions.Total return is not annualized for periods that are less than a full year, does not reflect the effect of sales charge for Class A shares nor the contingent deferred sales chargefor Class C shares and does not reflect the deduction of taxes that a shareholder would pay on fund distributions or the redemption of fund shares.

261www.calamos.com
Selected data for a share outstanding throughout each year were as follows:
CLASS A Year Ended October 31, 2021 2020 2019 2018 2017
Net asset value, beginning of year $22.96 $17.97 $18.10 $21.55 $16.65
Income from investment operations:Net investment income (loss)(a) 0.05 (0.04) 0.09 0.15 0.07
Net realized and unrealized gain (loss) 7.29 5.03 1.80 (2.78) 4.83
Total from investment operations 7.34 4.99 1.89 (2.63) 4.90
Distributions:Dividends from net investment income — — — — —
Dividends from net realized gains (1.47) — (2.02) (0.82) —
Total distributions** (1.47) — (2.02) (0.82) —
Net asset value, end of year $28.83 $22.96 $17.97 $18.10 $21.55
Ratios and supplemental data:Total return(b) 32.76% 27.82% 13.07% (12.70%) 29.43%
Net assets, end of year (000) $79,503 $60,527 $53,950 $59,566 $72,491
Ratio of net expenses to average net assets 1.10% 1.10% 1.10% 1.33% 1.40%
Ratio of gross expenses to average net assets prior to expense reductions 1.56% 1.52% 1.48% 1.51% 1.46%
Ratio of net investment income (loss) to average net assets 0.19% (0.20%) 0.51% 0.71% 0.41%
Year Ended October 31, 2021 2020 2019 2018 2017
Portfolio turnover rate 99% 85% 81% 112% 100%
** Distribution for annual periods determined in accordance with federal income tax regulations.
(a) Net investment income (loss) allocated based on average shares method.
(b) Total return measures net investment income (loss) and capital gain or loss from portfolio investments assuming reinvestment of dividends and capital gains distributions.Total return is not annualized for periods that are less than a full year, does not reflect the effect of sales charge for Class A shares nor the contingent deferred sales chargefor Class C shares and does not reflect the deduction of taxes that a shareholder would pay on fund distributions or the redemption of fund shares.
Calamos International Growth Fund Financial Highlights

262 CALAMOS OPEN-END FAMILY OF FUNDS ANNUAL REPORT
Calamos International Growth Fund Financial Highlights
Selected data for a share outstanding throughout each year were as follows:
CLASS C Year Ended October 31, 2021 2020 2019 2018 2017
Net asset value, beginning of year $20.17 $15.91 $16.38 $19.72 $15.35
Income from investment operations:Net investment income (loss)(a) (0.16) (0.16) (0.05) (0.03) (0.05)
Net realized and unrealized gain (loss) 6.40 4.42 1.60 (2.49) 4.42
Total from investment operations 6.24 4.26 1.55 (2.52) 4.37
Distributions:Dividends from net investment income — — — — —
Dividends from net realized gains (1.47) — (2.02) (0.82) —
Total distributions** (1.47) — (2.02) (0.82) —
Net asset value, end of year $24.94 $20.17 $15.91 $16.38 $19.72
Ratios and supplemental data:Total return(b) 31.79% 26.84% 12.21% (13.35%) 28.47%
Net assets, end of year (000) $3,953 $6,344 $9,022 $20,449 $27,840
Ratio of net expenses to average net assets 1.85% 1.85% 1.85% 2.06% 2.15%
Ratio of gross expenses to average net assets prior to expense reductions 2.31% 2.27% 2.26% 2.26% 2.21%
Ratio of net investment income (loss) to average net assets (0.69%) (0.95%) (0.35%) (0.17%) (0.33%)
** Distribution for annual periods determined in accordance with federal income tax regulations.
(a) Net investment income (loss) allocated based on average shares method.
(b) Total return measures net investment income (loss) and capital gain or loss from portfolio investments assuming reinvestment of dividends and capital gains distributions.Total return is not annualized for periods that are less than a full year, does not reflect the effect of sales charge for Class A shares nor the contingent deferred sales chargefor Class C shares and does not reflect the deduction of taxes that a shareholder would pay on fund distributions or the redemption of fund shares.
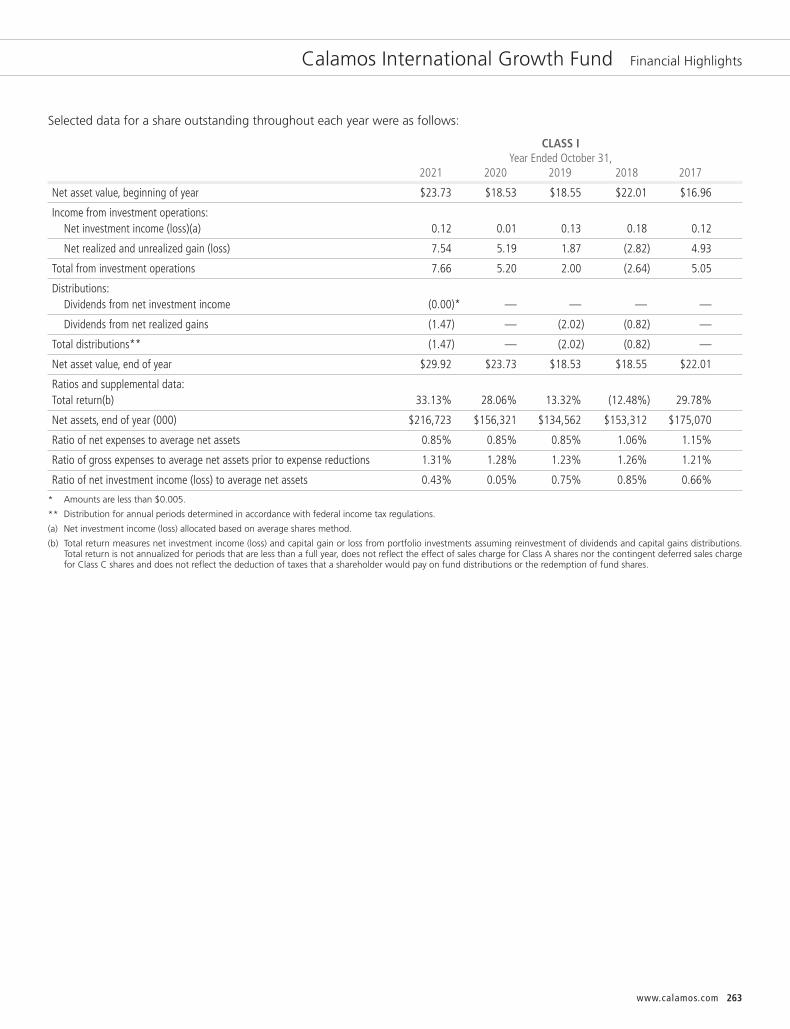
263www.calamos.com
Selected data for a share outstanding throughout each year were as follows:
CLASS I Year Ended October 31, 2021 2020 2019 2018 2017
Net asset value, beginning of year $23.73 $18.53 $18.55 $22.01 $16.96
Income from investment operations:Net investment income (loss)(a) 0.12 0.01 0.13 0.18 0.12
Net realized and unrealized gain (loss) 7.54 5.19 1.87 (2.82) 4.93
Total from investment operations 7.66 5.20 2.00 (2.64) 5.05
Distributions:Dividends from net investment income (0.00)* — — — —
Dividends from net realized gains (1.47) — (2.02) (0.82) —
Total distributions** (1.47) — (2.02) (0.82) —
Net asset value, end of year $29.92 $23.73 $18.53 $18.55 $22.01
Ratios and supplemental data:Total return(b) 33.13% 28.06% 13.32% (12.48%) 29.78%
Net assets, end of year (000) $216,723 $156,321 $134,562 $153,312 $175,070
Ratio of net expenses to average net assets 0.85% 0.85% 0.85% 1.06% 1.15%
Ratio of gross expenses to average net assets prior to expense reductions 1.31% 1.28% 1.23% 1.26% 1.21%
Ratio of net investment income (loss) to average net assets 0.43% 0.05% 0.75% 0.85% 0.66%
* Amounts are less than $0.005.
** Distribution for annual periods determined in accordance with federal income tax regulations.
(a) Net investment income (loss) allocated based on average shares method.
(b) Total return measures net investment income (loss) and capital gain or loss from portfolio investments assuming reinvestment of dividends and capital gains distributions.Total return is not annualized for periods that are less than a full year, does not reflect the effect of sales charge for Class A shares nor the contingent deferred sales chargefor Class C shares and does not reflect the deduction of taxes that a shareholder would pay on fund distributions or the redemption of fund shares.
Calamos International Growth Fund Financial Highlights

264 CALAMOS OPEN-END FAMILY OF FUNDS ANNUAL REPORT
Calamos International Growth Fund Financial Highlights
Selected data for a share outstanding throughout each year were as follows:
CLASS R6 September 17, 2018• through Year Ended October 31, October 31, 2021 2020 2019 2018
Net asset value, beginning of year $23.93 $18.67 $18.66 $20.89
Income from investment operations:Net investment income (loss)(a) 0.15 0.05 0.20 0.01
Net realized and unrealized gain (loss) 7.61 5.21 1.83 (2.24)
Total from investment operations 7.76 5.26 2.03 (2.23)
Distributions:Dividends from net investment income (0.02) — — —
Dividends from net realized gains (1.47) — (2.02) —
Total distributions** (1.49) — (2.02) —
Net asset value, end of year $30.20 $23.93 $18.67 $18.66
Ratios and supplemental data:Total return(b) 33.24% 28.23% 13.41% (10.67)%
Net assets, end of year (000) $1,921 $1,012 $7,463 $22
Ratio of net expenses to average net assets 0.77% 0.76% 0.77% 0.76%(c)
Ratio of gross expenses to average net assets prior to expense reductions 1.22% 1.17% 1.15% 1.21%(c)
Ratio of net investment income (loss) to average net assets 0.51% 0.24% 1.13% 0.34%(c)
• Commencement of operations.
** Distribution for annual periods determined in accordance with federal income tax regulations.
(a) Net investment income (loss) allocated based on average shares method.
(b) Total return measures net investment income (loss) and capital gain or loss from portfolio investments assuming reinvestment of dividends and capital gains distributions.Total return is not annualized for periods that are less than a full year, does not reflect the effect of sales charge for Class A shares nor the contingent deferred sales chargefor Class C shares and does not reflect the deduction of taxes that a shareholder would pay on fund distributions or the redemption of fund shares.
(c) Annualized.

265www.calamos.com
Calamos Evolving World Growth Fund Financial Highlights
Selected data for a share outstanding throughout each year were as follows:
CLASS A Year Ended October 31, 2021 2020 2019 2018 2017
Net asset value, beginning of year $19.60 $14.12 $12.54 $14.83 $12.11
Income from investment operations:Net investment income (loss)(a) (0.05) (0.07) 0.09 (0.01) 0.05
Net realized and unrealized gain (loss) 3.15 5.66 1.49 (2.28) 2.67
Total from investment operations 3.10 5.59 1.58 (2.29) 2.72
Distributions:Dividends from net investment income — (0.11) — (0.00)* —
Dividends from net realized gains (0.45) — — — —
Return of capital — — — (0.00)* —
Total distributions** (0.45) (0.11) — (0.00)* —
Net asset value, end of year $22.25 $19.60 $14.12 $12.54 $14.83
Ratios and supplemental data:Total return(b) 15.87% 39.81% 12.60% (15.43%) 22.46%
Net assets, end of year (000) $54,731 $31,015 $28,168 $34,678 $68,142
Ratio of net expenses to average net assets 1.30% 1.56% 1.64% 1.63% 1.67%
Ratio of gross expenses to average net assets prior to expense reductions 1.60% 1.64% 1.64% 1.63% 1.67%
Ratio of net investment income (loss) to average net assets (0.21%) (0.47%) 0.63% (0.08%) 0.40%
Year Ended October 31, 2021 2020 2019 2018 2017
Portfolio turnover rate 140% 125% 78% 97% 105%
* Amounts are less than $0.005.
** Distribution for annual periods determined in accordance with federal income tax regulations.
(a) Net investment income (loss) allocated based on average shares method.
(b) Total return measures net investment income (loss) and capital gain or loss from portfolio investments assuming reinvestment of dividends and capital gains distributions.Total return is not annualized for periods that are less than a full year, does not reflect the effect of sales charge for Class A shares nor the contingent deferred sales chargefor Class C shares and does not reflect the deduction of taxes that a shareholder would pay on fund distributions or the redemption of fund shares.

266 CALAMOS OPEN-END FAMILY OF FUNDS ANNUAL REPORT
Calamos Evolving World Growth Fund Financial Highlights
Selected data for a share outstanding throughout each year were as follows:
CLASS C Year Ended October 31, 2021 2020 2019 2018 2017
Net asset value, beginning of year $18.26 $13.16 $11.78 $14.03 $11.55
Income from investment operations:Net investment income (loss)(a) (0.22) (0.18) (0.01) (0.12) (0.03)
Net realized and unrealized gain (loss) 2.96 5.28 1.39 (2.13) 2.51
Total from investment operations 2.74 5.10 1.38 (2.25) 2.48
Distributions:Dividends from net investment income — — — — —
Dividends from net realized gains (0.45) — — — —
Total distributions** (0.45) — — — —
Net asset value, end of year $20.55 $18.26 $13.16 $11.78 $14.03
Ratios and supplemental data:Total return(b) 15.05% 38.75% 11.71% (16.04%) 21.47%
Net assets, end of year (000) $16,050 $13,183 $13,478 $17,739 $24,846
Ratio of net expenses to average net assets 2.05% 2.32% 2.39% 2.38% 2.41%
Ratio of gross expenses to average net assets prior to expense reductions 2.34% 2.39% 2.39% 2.38% 2.41%
Ratio of net investment income (loss) to average net assets (1.04%) (1.23%) (0.11%) (0.85%) (0.29%)
** Distribution for annual periods determined in accordance with federal income tax regulations.
(a) Net investment income (loss) allocated based on average shares method.
(b) Total return measures net investment income (loss) and capital gain or loss from portfolio investments assuming reinvestment of dividends and capital gains distributions.Total return is not annualized for periods that are less than a full year, does not reflect the effect of sales charge for Class A shares nor the contingent deferred sales chargefor Class C shares and does not reflect the deduction of taxes that a shareholder would pay on fund distributions or the redemption of fund shares.

267www.calamos.com
Calamos Evolving World Growth Fund Financial Highlights
Selected data for a share outstanding throughout each year were as follows:
CLASS I Year Ended October 31, 2021 2020 2019 2018 2017
Net asset value, beginning of year $19.78 $14.26 $12.63 $14.96 $12.19
Income from investment operations:Net investment income (loss)(a) 0.01 (0.03) 0.12 0.02 0.09
Net realized and unrealized gain (loss) 3.18 5.71 1.51 (2.29) 2.68
Total from investment operations 3.19 5.68 1.63 (2.27) 2.77
Distributions:Dividends from net investment income (0.01) (0.16) — (0.06) —
Dividends from net realized gains (0.45) — — — —
Return of capital — — — (0.00)* —
Total distributions** (0.46) (0.16) — (0.06) —
Net asset value, end of year $22.51 $19.78 $14.26 $12.63 $14.96
Ratios and supplemental data:Total return(b) 16.17% 40.16% 12.91% (15.21%) 22.72%
Net assets, end of year (000) $509,216 $193,243 $120,318 $152,114 $225,339
Ratio of net expenses to average net assets 1.05% 1.30% 1.39% 1.38% 1.41%
Ratio of gross expenses to average net assets prior to expense reductions 1.35% 1.39% 1.39% 1.38% 1.41%
Ratio of net investment income (loss) to average net assets 0.04% (0.22%) 0.91% 0.14% 0.72%
* Amounts are less than $0.005.
** Distribution for annual periods determined in accordance with federal income tax regulations.
(a) Net investment income (loss) allocated based on average shares method.
(b) Total return measures net investment income (loss) and capital gain or loss from portfolio investments assuming reinvestment of dividends and capital gains distributions.Total return is not annualized for periods that are less than a full year, does not reflect the effect of sales charge for Class A shares nor the contingent deferred sales chargefor Class C shares and does not reflect the deduction of taxes that a shareholder would pay on fund distributions or the redemption of fund shares.

268 CALAMOS OPEN-END FAMILY OF FUNDS ANNUAL REPORT
Calamos Global Equity Fund Financial Highlights
Selected data for a share outstanding throughout each year were as follows:
CLASS A Year Ended October 31, 2021 2020 2019 2018 2017
Net asset value, beginning of year $14.05 $11.64 $13.61 $15.63 $12.74
Income from investment operations:Net investment income (loss)(a) (0.08) (0.07) (0.01) 0.00* (0.00)*
Net realized and unrealized gain (loss) 5.49 3.37 0.79 (0.63) 3.45
Total from investment operations 5.41 3.30 0.78 (0.63) 3.45
Distributions:Dividends from net investment income — — — — —
Dividends from net realized gains (1.06) (0.89) (2.75) (1.39) (0.56)
Total distributions** (1.06) (0.89) (2.75) (1.39) (0.56)
Net asset value, end of year $18.40 $14.05 $11.64 $13.61 $15.63
Ratios and supplemental data:Total return(b) 39.89% 30.07% 10.28% (4.59%) 28.42%
Net assets, end of year (000) $32,511 $21,814 $20,236 $27,489 $26,957
Ratio of net expenses to average net assets 1.40% 1.40% 1.40% 1.40% 1.40%
Ratio of gross expenses to average net assets prior to expense reductions 1.58% 1.65% 1.51% 1.56% 1.53%
Ratio of net investment income (loss) to average net assets (0.48%) (0.59%) (0.08%) 0.03% (0.02%)
Year Ended October 31, 2021 2020 2019 2018 2017
Portfolio turnover rate 72% 71% 72% 81% 102%
* Amounts are less than $0.005.
** Distribution for annual periods determined in accordance with federal income tax regulations.
(a) Net investment income (loss) allocated based on average shares method.
(b) Total return measures net investment income (loss) and capital gain or loss from portfolio investments assuming reinvestment of dividends and capital gains distributions.Total return is not annualized for periods that are less than a full year, does not reflect the effect of sales charge for Class A shares nor the contingent deferred sales chargefor Class C shares and does not reflect the deduction of taxes that a shareholder would pay on fund distributions or the redemption of fund shares.

269www.calamos.com
Selected data for a share outstanding throughout each year were as follows:
CLASS C Year Ended October 31, 2021 2020 2019 2018 2017
Net asset value, beginning of year $12.03 $10.15 $12.34 $14.40 $11.86
Income from investment operations:Net investment income (loss)(a) (0.18) (0.14) (0.09) (0.10) (0.09)
Net realized and unrealized gain (loss) 4.66 2.91 0.65 (0.57) 3.19
Total from investment operations 4.48 2.77 0.56 (0.67) 3.10
Distributions:Dividends from net investment income — — — — —
Dividends from net realized gains (1.06) (0.89) (2.75) (1.39) (0.56)
Total distributions** (1.06) (0.89) (2.75) (1.39) (0.56)
Net asset value, end of year $15.45 $12.03 $10.15 $12.34 $14.40
Ratios and supplemental data:Total return(b) 38.88% 29.19% 9.36% (5.31%) 27.53%
Net assets, end of year (000) $1,492 $4,635 $8,011 $10,887 $13,769
Ratio of net expenses to average net assets 2.15% 2.15% 2.15% 2.15% 2.15%
Ratio of gross expenses to average net assets prior to expense reductions 2.33% 2.40% 2.26% 2.32% 2.27%
Ratio of net investment income (loss) to average net assets (1.32%) (1.31%) (0.86%) (0.76%) (0.76%)
** Distribution for annual periods determined in accordance with federal income tax regulations.
(a) Net investment income (loss) allocated based on average shares method.
(b) Total return measures net investment income (loss) and capital gain or loss from portfolio investments assuming reinvestment of dividends and capital gains distributions.Total return is not annualized for periods that are less than a full year, does not reflect the effect of sales charge for Class A shares nor the contingent deferred sales chargefor Class C shares and does not reflect the deduction of taxes that a shareholder would pay on fund distributions or the redemption of fund shares.
Calamos Global Equity Fund Financial Highlights
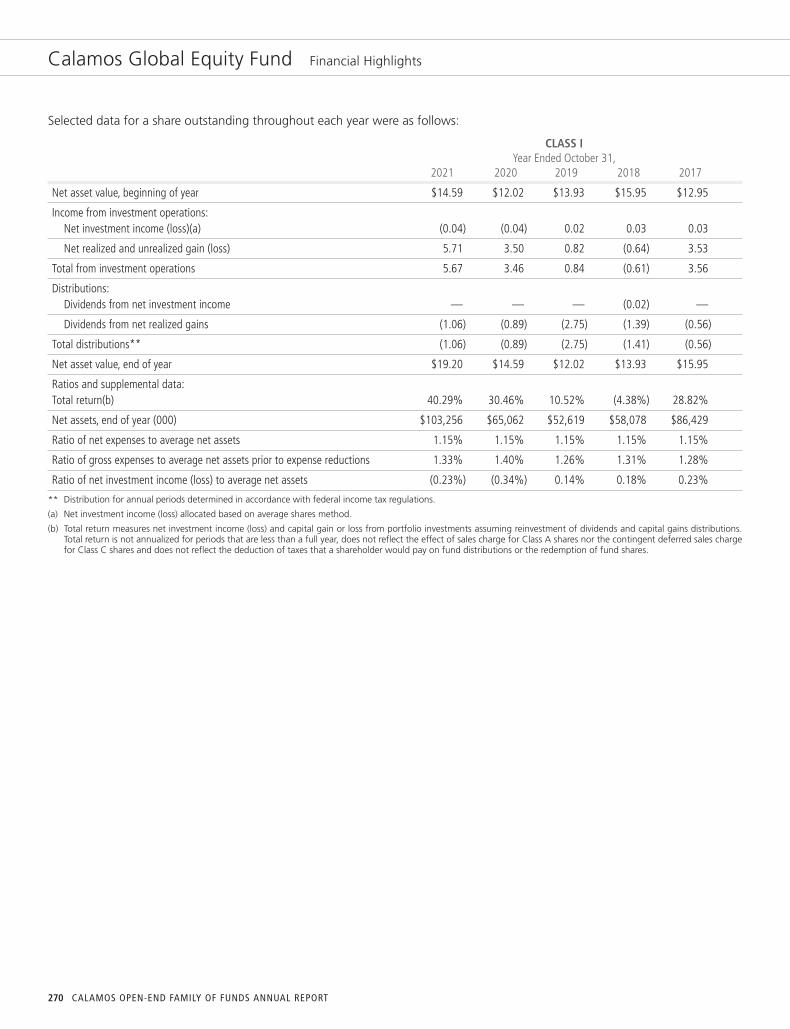
270 CALAMOS OPEN-END FAMILY OF FUNDS ANNUAL REPORT
Calamos Global Equity Fund Financial Highlights
Selected data for a share outstanding throughout each year were as follows:
CLASS I Year Ended October 31, 2021 2020 2019 2018 2017
Net asset value, beginning of year $14.59 $12.02 $13.93 $15.95 $12.95
Income from investment operations:Net investment income (loss)(a) (0.04) (0.04) 0.02 0.03 0.03
Net realized and unrealized gain (loss) 5.71 3.50 0.82 (0.64) 3.53
Total from investment operations 5.67 3.46 0.84 (0.61) 3.56
Distributions:Dividends from net investment income — — — (0.02) —
Dividends from net realized gains (1.06) (0.89) (2.75) (1.39) (0.56)
Total distributions** (1.06) (0.89) (2.75) (1.41) (0.56)
Net asset value, end of year $19.20 $14.59 $12.02 $13.93 $15.95
Ratios and supplemental data:Total return(b) 40.29% 30.46% 10.52% (4.38%) 28.82%
Net assets, end of year (000) $103,256 $65,062 $52,619 $58,078 $86,429
Ratio of net expenses to average net assets 1.15% 1.15% 1.15% 1.15% 1.15%
Ratio of gross expenses to average net assets prior to expense reductions 1.33% 1.40% 1.26% 1.31% 1.28%
Ratio of net investment income (loss) to average net assets (0.23%) (0.34%) 0.14% 0.18% 0.23%
** Distribution for annual periods determined in accordance with federal income tax regulations.
(a) Net investment income (loss) allocated based on average shares method.
(b) Total return measures net investment income (loss) and capital gain or loss from portfolio investments assuming reinvestment of dividends and capital gains distributions.Total return is not annualized for periods that are less than a full year, does not reflect the effect of sales charge for Class A shares nor the contingent deferred sales chargefor Class C shares and does not reflect the deduction of taxes that a shareholder would pay on fund distributions or the redemption of fund shares.

271www.calamos.com
Selected data for a share outstanding throughout each period were as follows:
CLASS R6 June 23, 2020• Year Ended through October 31, October 31, 2021 2020
Net asset value, beginning of period $14.59 $13.19
Income from investment operations:Net investment income (loss)(a) (0.03) (0.02)
Net realized and unrealized gain (loss) 5.71 1.42
Total from investment operations 5.68 1.40
Distributions:Dividends from net investment income — —
Dividends from net realized gains (1.06) —
Total distributions** (1.06) —
Net asset value, end of period $19.21 $14.59
Ratios and supplemental data:Total return(b) 40.36% 10.61%
Net assets, end of year (000) $168 $120
Ratio of net expenses to average net assets 1.09% 1.09%(c)
Ratio of gross expenses to average net assets prior to expense reductions 1.27% 1.36%(c)
Ratio of net investment income (loss) to average net assets (0.18%) (0.45%)(c)
• Commencement of operations.
** Distribution for annual periods determined in accordance with federal income tax regulations.
(a) Net investment income (loss) allocated based on average shares method.
(b) Total return measures net investment income (loss) and capital gain or loss from portfolio investments assuming reinvestment of dividends and capital gains distributions.Total return is not annualized for periods that are less than a full year, does not reflect the effect of sales charge for Class A shares nor the contingent deferred sales chargefor Class C shares and does not reflect the deduction of taxes that a shareholder would pay on fund distributions or the redemption of fund shares.
(c) Annualized.
Calamos Global Equity Fund Financial Highlights

272 CALAMOS OPEN-END FAMILY OF FUNDS ANNUAL REPORT
Selected data for a share outstanding throughout each year were as follows:
CLASS A Year Ended October 31, 2021 2020 2019 2018 2017
Net asset value, beginning of year $10.02 $8.51 $8.99 $9.85 $8.47
Income from investment operations:Net investment income (loss)(a) (0.04) 0.07 0.10 0.09 0.10
Net realized and unrealized gain (loss) 3.42 1.55 0.37 (0.35) 1.35
Total from investment operations 3.38 1.62 0.47 (0.26) 1.45
Distributions:Dividends from net investment income (0.05) (0.02) (0.07) (0.03) (0.01)
Dividends from net realized gains (0.63) (0.09) (0.88) (0.57) (0.06)
Total distributions** (0.68) (0.11) (0.95) (0.60) (0.07)
Net asset value, end of year $12.72 $10.02 $8.51 $8.99 $9.85
Ratios and supplemental data:Total return(b) 34.84% 19.09% 6.67% (2.91%) 17.16%
Net assets, end of year (000) $119,261 $88,618 $83,069 $63,069 $78,196
Ratio of net expenses to average net assets 1.31% 1.53% 1.49% 1.50% 1.54%
Ratio of gross expenses to average net assets prior to expense reductions 1.45% 1.53% 1.49% 1.50% 1.54%
Ratio of net investment income (loss) to average net assets (0.33%) 0.78% 1.20% 0.93% 1.16%
Year Ended October 31, 2021 2020 2019 2018 2017
Portfolio turnover rate 82% 119% 69% 75% 100%
** Distribution for annual periods determined in accordance with federal income tax regulations.
(a) Net investment income (loss) allocated based on average shares method.
(b) Total return measures net investment income (loss) and capital gain or loss from portfolio investments assuming reinvestment of dividends and capital gains distributions.Total return is not annualized for periods that are less than a full year, does not reflect the effect of sales charge for Class A shares nor the contingent deferred sales chargefor Class C shares and does not reflect the deduction of taxes that a shareholder would pay on fund distributions or the redemption of fund shares.
Calamos Global Opportunities Fund Financial Highlights
(formerly, Calamos Global Growth and Income Fund)
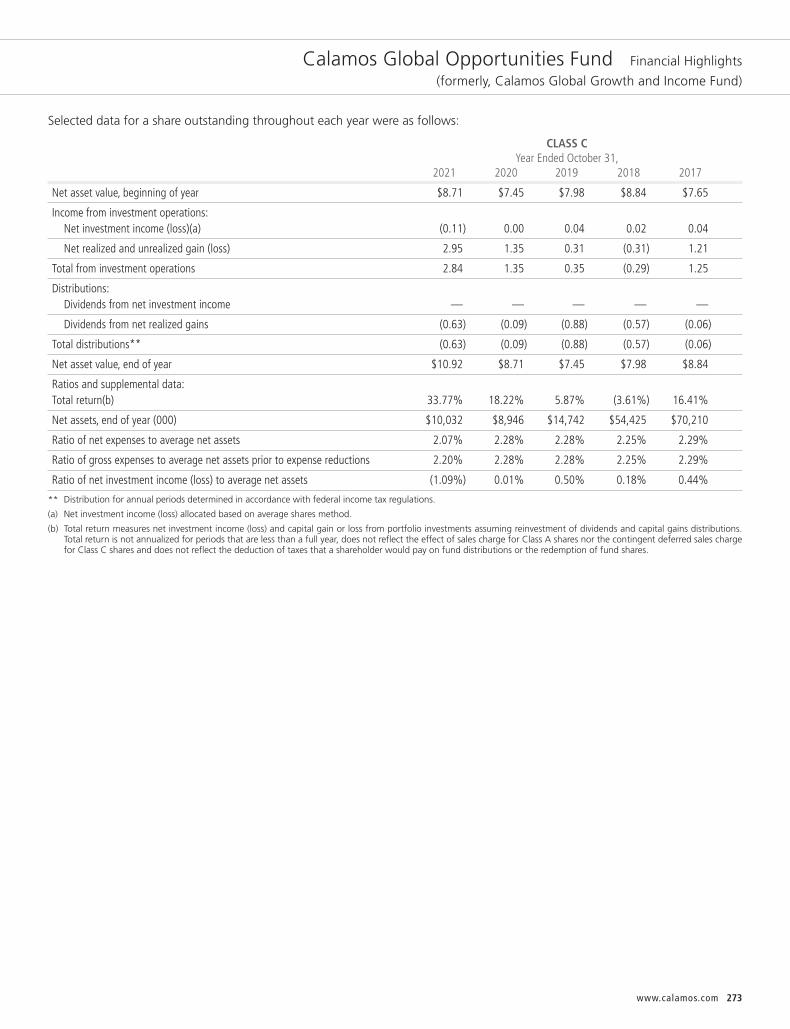
273www.calamos.com
Selected data for a share outstanding throughout each year were as follows:
CLASS C Year Ended October 31, 2021 2020 2019 2018 2017
Net asset value, beginning of year $8.71 $7.45 $7.98 $8.84 $7.65
Income from investment operations:Net investment income (loss)(a) (0.11) 0.00 0.04 0.02 0.04
Net realized and unrealized gain (loss) 2.95 1.35 0.31 (0.31) 1.21
Total from investment operations 2.84 1.35 0.35 (0.29) 1.25
Distributions:Dividends from net investment income — — — — —
Dividends from net realized gains (0.63) (0.09) (0.88) (0.57) (0.06)
Total distributions** (0.63) (0.09) (0.88) (0.57) (0.06)
Net asset value, end of year $10.92 $8.71 $7.45 $7.98 $8.84
Ratios and supplemental data:Total return(b) 33.77% 18.22% 5.87% (3.61%) 16.41%
Net assets, end of year (000) $10,032 $8,946 $14,742 $54,425 $70,210
Ratio of net expenses to average net assets 2.07% 2.28% 2.28% 2.25% 2.29%
Ratio of gross expenses to average net assets prior to expense reductions 2.20% 2.28% 2.28% 2.25% 2.29%
Ratio of net investment income (loss) to average net assets (1.09%) 0.01% 0.50% 0.18% 0.44%
** Distribution for annual periods determined in accordance with federal income tax regulations.
(a) Net investment income (loss) allocated based on average shares method.
(b) Total return measures net investment income (loss) and capital gain or loss from portfolio investments assuming reinvestment of dividends and capital gains distributions.Total return is not annualized for periods that are less than a full year, does not reflect the effect of sales charge for Class A shares nor the contingent deferred sales chargefor Class C shares and does not reflect the deduction of taxes that a shareholder would pay on fund distributions or the redemption of fund shares.
Calamos Global Opportunities Fund Financial Highlights
(formerly, Calamos Global Growth and Income Fund)

274 CALAMOS OPEN-END FAMILY OF FUNDS ANNUAL REPORT
Selected data for a share outstanding throughout each year were as follows:
CLASS I Year Ended October 31, 2021 2020 2019 2018 2017
Net asset value, beginning of year $10.36 $8.79 $9.25 $10.11 $8.70
Income from investment operations:Net investment income (loss)(a) (0.01) 0.09 0.13 0.12 0.13
Net realized and unrealized gain (loss) 3.54 1.60 0.38 (0.36) 1.38
Total from investment operations 3.53 1.69 0.51 (0.24) 1.51
Distributions:Dividends from net investment income (0.08) (0.03) (0.09) (0.05) (0.04)
Dividends from net realized gains (0.63) (0.09) (0.88) (0.57) (0.06)
Total distributions** (0.71) (0.12) (0.97) (0.62) (0.10)
Net asset value, end of year $13.18 $10.36 $8.79 $9.25 $10.11
Ratios and supplemental data:Total return(b) 35.16% 19.33% 6.95% (2.65%) 17.51%
Net assets, end of year (000) $152,596 $65,909 $53,594 $72,843 $73,361
Ratio of net expenses to average net assets 1.04% 1.28% 1.25% 1.25% 1.29%
Ratio of gross expenses to average net assets prior to expense reductions 1.20% 1.28% 1.25% 1.25% 1.29%
Ratio of net investment income (loss) to average net assets (0.09%) 1.01% 1.47% 1.18% 1.43%
** Distribution for annual periods determined in accordance with federal income tax regulations.
(a) Net investment income (loss) allocated based on average shares method.
(b) Total return measures net investment income (loss) and capital gain or loss from portfolio investments assuming reinvestment of dividends and capital gains distributions.Total return is not annualized for periods that are less than a full year, does not reflect the effect of sales charge for Class A shares nor the contingent deferred sales chargefor Class C shares and does not reflect the deduction of taxes that a shareholder would pay on fund distributions or the redemption of fund shares.
Calamos Global Opportunities Fund Financial Highlights
(formerly, Calamos Global Growth and Income Fund)
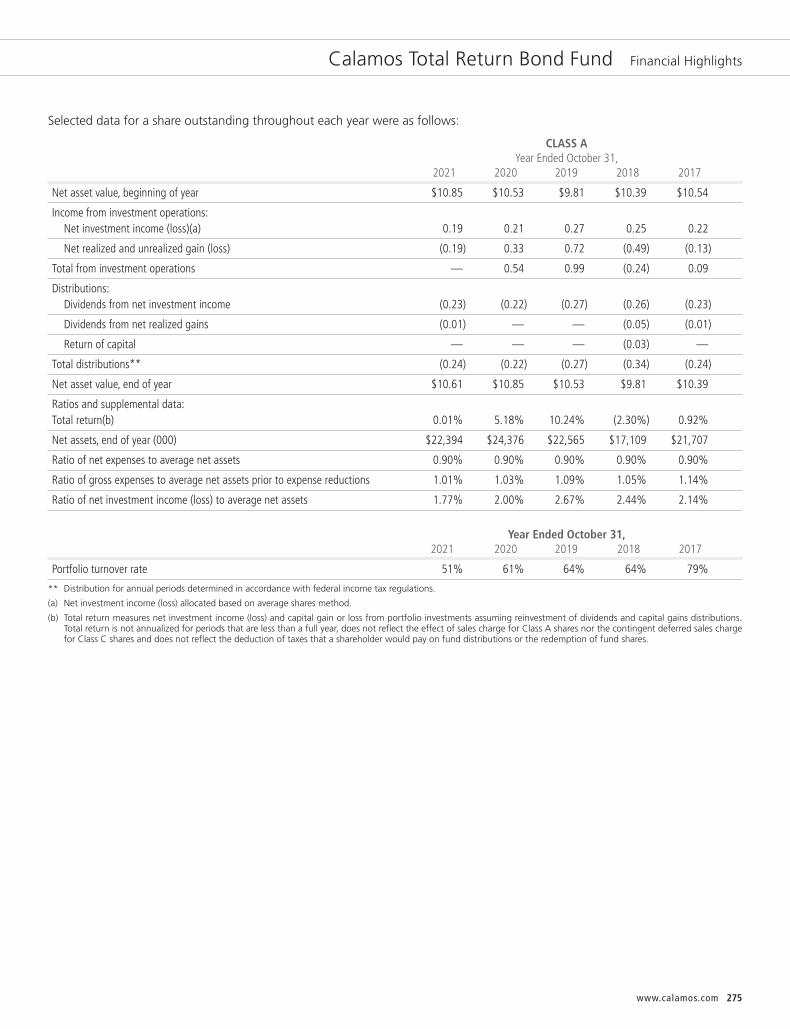
275www.calamos.com
Calamos Total Return Bond Fund Financial Highlights
Selected data for a share outstanding throughout each year were as follows:
CLASS A Year Ended October 31, 2021 2020 2019 2018 2017
Net asset value, beginning of year $10.85 $10.53 $9.81 $10.39 $10.54
Income from investment operations:Net investment income (loss)(a) 0.19 0.21 0.27 0.25 0.22
Net realized and unrealized gain (loss) (0.19) 0.33 0.72 (0.49) (0.13)
Total from investment operations — 0.54 0.99 (0.24) 0.09
Distributions:Dividends from net investment income (0.23) (0.22) (0.27) (0.26) (0.23)
Dividends from net realized gains (0.01) — — (0.05) (0.01)
Return of capital — — — (0.03) —
Total distributions** (0.24) (0.22) (0.27) (0.34) (0.24)
Net asset value, end of year $10.61 $10.85 $10.53 $9.81 $10.39
Ratios and supplemental data:Total return(b) 0.01% 5.18% 10.24% (2.30%) 0.92%
Net assets, end of year (000) $22,394 $24,376 $22,565 $17,109 $21,707
Ratio of net expenses to average net assets 0.90% 0.90% 0.90% 0.90% 0.90%
Ratio of gross expenses to average net assets prior to expense reductions 1.01% 1.03% 1.09% 1.05% 1.14%
Ratio of net investment income (loss) to average net assets 1.77% 2.00% 2.67% 2.44% 2.14%
Year Ended October 31, 2021 2020 2019 2018 2017
Portfolio turnover rate 51% 61% 64% 64% 79%
** Distribution for annual periods determined in accordance with federal income tax regulations.
(a) Net investment income (loss) allocated based on average shares method.
(b) Total return measures net investment income (loss) and capital gain or loss from portfolio investments assuming reinvestment of dividends and capital gains distributions.Total return is not annualized for periods that are less than a full year, does not reflect the effect of sales charge for Class A shares nor the contingent deferred sales chargefor Class C shares and does not reflect the deduction of taxes that a shareholder would pay on fund distributions or the redemption of fund shares.

276 CALAMOS OPEN-END FAMILY OF FUNDS ANNUAL REPORT
Calamos Total Return Bond Fund Financial Highlights
Selected data for a share outstanding throughout each year were as follows:
CLASS C Year Ended October 31, 2021 2020 2019 2018 2017
Net asset value, beginning of year $10.85 $10.53 $9.81 $10.39 $10.54
Income from investment operations:Net investment income (loss)(a) 0.11 0.14 0.20 0.17 0.14
Net realized and unrealized gain (loss) (0.19) 0.32 0.72 (0.48) (0.12)
Total from investment operations (0.08) 0.46 0.92 (0.31) 0.02
Distributions:Dividends from net investment income (0.15) (0.14) (0.20) (0.20) (0.16)
Dividends from net realized gains (0.01) — — (0.05) (0.01)
Return of capital — — — (0.02) —
Total distributions** (0.16) (0.14) (0.20) (0.27) (0.17)
Net asset value, end of year $10.61 $10.85 $10.53 $9.81 $10.39
Ratios and supplemental data:Total return(b) (0.74%) 4.40% 9.42% (3.03%) 0.17%
Net assets, end of year (000) $800 $1,777 $2,929 $6,413 $9,334
Ratio of net expenses to average net assets 1.65% 1.65% 1.65% 1.65% 1.65%
Ratio of gross expenses to average net assets prior to expense reductions 1.76% 1.77% 1.84% 1.80% 1.89%
Ratio of net investment income (loss) to average net assets 1.02% 1.28% 1.98% 1.69% 1.38%
** Distribution for annual periods determined in accordance with federal income tax regulations.
(a) Net investment income (loss) allocated based on average shares method.
(b) Total return measures net investment income (loss) and capital gain or loss from portfolio investments assuming reinvestment of dividends and capital gains distributions.Total return is not annualized for periods that are less than a full year, does not reflect the effect of sales charge for Class A shares nor the contingent deferred sales chargefor Class C shares and does not reflect the deduction of taxes that a shareholder would pay on fund distributions or the redemption of fund shares.

277www.calamos.com
Calamos Total Return Bond Fund Financial Highlights
Selected data for a share outstanding throughout each year were as follows:
CLASS I Year Ended October 31, 2021 2020 2019 2018 2017
Net asset value, beginning of year $10.85 $10.54 $9.81 $10.39 $10.54
Income from investment operations:Net investment income (loss)(a) 0.22 0.24 0.30 0.27 0.24
Net realized and unrealized gain (loss) (0.20) 0.32 0.73 (0.48) (0.12)
Total from investment operations 0.02 0.56 1.03 (0.21) 0.12
Distributions:Dividends from net investment income (0.25) (0.25) (0.30) (0.29) (0.26)
Dividends from net realized gains (0.01) — — (0.05) (0.01)
Return of capital — — — (0.03) —
Total distributions** (0.26) (0.25) (0.30) (0.37) (0.27)
Net asset value, end of year $10.61 $10.85 $10.54 $9.81 $10.39
Ratios and supplemental data:Total return(b) 0.17% 5.34% 10.62% (2.06%) 1.18%
Net assets, end of year (000) $43,979 $60,602 $35,570 $32,888 $40,290
Ratio of net expenses to average net assets 0.65% 0.65% 0.65% 0.65% 0.65%
Ratio of gross expenses to average net assets prior to expense reductions 0.76% 0.77% 0.84% 0.80% 0.90%
Ratio of net investment income (loss) to average net assets 2.02% 2.21% 2.92% 2.69% 2.32%
** Distribution for annual periods determined in accordance with federal income tax regulations.
(a) Net investment income (loss) allocated based on average shares method.
(b) Total return measures net investment income (loss) and capital gain or loss from portfolio investments assuming reinvestment of dividends and capital gains distributions.Total return is not annualized for periods that are less than a full year, does not reflect the effect of sales charge for Class A shares nor the contingent deferred sales chargefor Class C shares and does not reflect the deduction of taxes that a shareholder would pay on fund distributions or the redemption of fund shares.

278 CALAMOS OPEN-END FAMILY OF FUNDS ANNUAL REPORT
Calamos High Income Opportunities Fund Financial Highlights
Selected data for a share outstanding throughout each year were as follows:
CLASS A Year Ended October 31, 2021 2020 2019 2018 2017
Net asset value, beginning of year $7.96 $8.34 $8.37 $8.87 $8.62
Income from investment operations:Net investment income (loss)(a) 0.35 0.43 0.48 0.47 0.40
Net realized and unrealized gain (loss) 0.66 (0.35) (0.01) (0.45) 0.26
Total from investment operations 1.01 0.08 0.47 0.02 0.66
Distributions:Dividends from net investment income (0.27) (0.46) (0.50) (0.52) (0.41)
Dividends from net realized gains — — — — —
Return of capital (0.12) — — — —
Total distributions** (0.39) (0.46) (0.50) (0.52) (0.41)
Net asset value, end of year $8.58 $7.96 $8.34 $8.37 $8.87
Ratios and supplemental data:Total return(b) 12.88% 1.13% 5.85% 0.25% 7.82%
Net assets, end of year (000) $34,550 $30,580 $35,124 $32,282 $36,351
Ratio of net expenses to average net assets 1.00% 1.00% 1.00% 1.00% 1.29%
Ratio of gross expenses to average net assets prior to expense reductions 1.33% 1.37% 1.23% 1.46% 1.43%
Ratio of net investment income (loss) to average net assets 4.10% 5.34% 5.71% 5.41% 4.57%
Year Ended October 31, 2021 2020 2019 2018 2017
Portfolio turnover rate 49% 52% 46% 56% 93%
** Distribution for annual periods determined in accordance with federal income tax regulations.
(a) Net investment income (loss) allocated based on average shares method.
(b) Total return measures net investment income (loss) and capital gain or loss from portfolio investments assuming reinvestment of dividends and capital gains distributions.Total return is not annualized for periods that are less than a full year, does not reflect the effect of sales charge for Class A shares nor the contingent deferred sales chargefor Class C shares and does not reflect the deduction of taxes that a shareholder would pay on fund distributions or the redemption of fund shares.

279www.calamos.com
Selected data for a share outstanding throughout each year were as follows:
CLASS C Year Ended October 31, 2021 2020 2019 2018 2017
Net asset value, beginning of year $8.45 $8.82 $8.82 $9.31 $9.03
Income from investment operations:Net investment income (loss)(a) 0.31 0.40 0.45 0.42 0.35
Net realized and unrealized gain (loss) 0.71 (0.38) (0.02) (0.46) 0.27
Total from investment operations 1.02 0.02 0.43 (0.04) 0.62
Distributions:Dividends from net investment income (0.21) (0.39) (0.43) (0.45) (0.34)
Dividends from net realized gains — — — — —
Return of capital (0.12) — — — —
Total distributions** (0.33) (0.39) (0.43) (0.45) (0.34)
Net asset value, end of year $9.14 $8.45 $8.82 $8.82 $9.31
Ratios and supplemental data:Total return(b) 12.11% 0.38% 5.04% (0.42%) 6.97%
Net assets, end of year (000) $677 $981 $1,887 $9,772 $13,286
Ratio of net expenses to average net assets 1.75% 1.75% 1.75% 1.75% 2.05%
Ratio of gross expenses to average net assets prior to expense reductions 2.08% 2.11% 2.08% 2.22% 2.18%
Ratio of net investment income (loss) to average net assets 3.38% 4.67% 5.16% 4.66% 3.80%
** Distribution for annual periods determined in accordance with federal income tax regulations.
(a) Net investment income (loss) allocated based on average shares method.
(b) Total return measures net investment income (loss) and capital gain or loss from portfolio investments assuming reinvestment of dividends and capital gains distributions.Total return is not annualized for periods that are less than a full year, does not reflect the effect of sales charge for Class A shares nor the contingent deferred sales chargefor Class C shares and does not reflect the deduction of taxes that a shareholder would pay on fund distributions or the redemption of fund shares.
Calamos High Income Opportunities Fund Financial Highlights
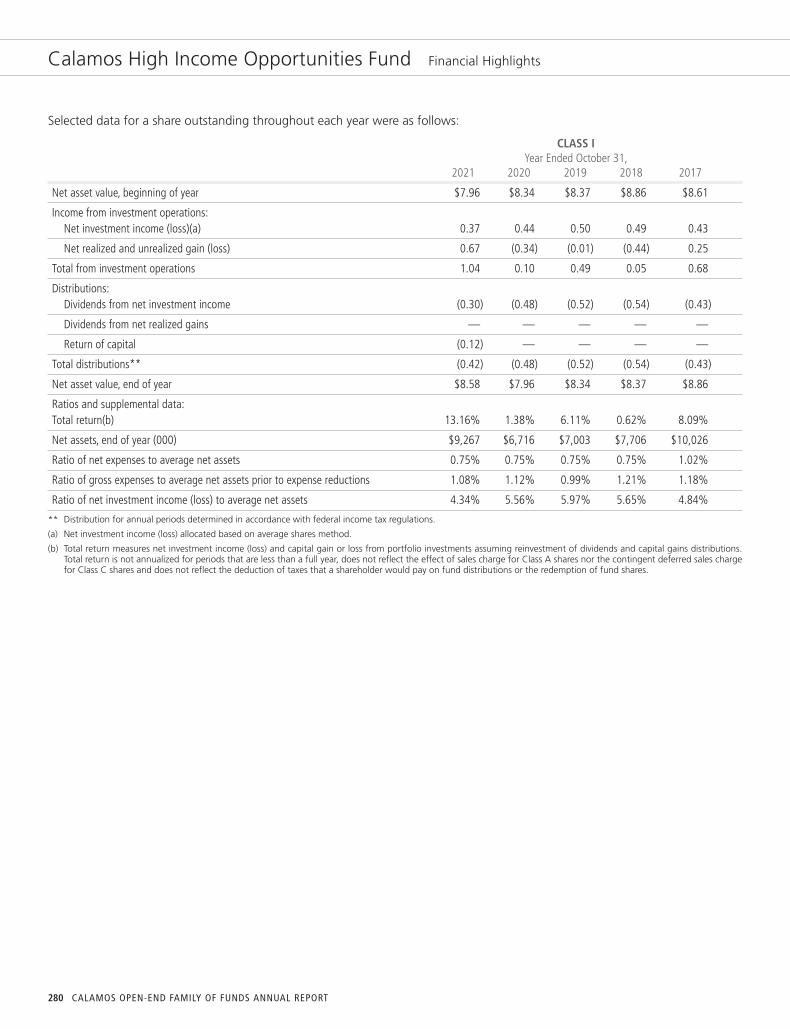
280 CALAMOS OPEN-END FAMILY OF FUNDS ANNUAL REPORT
Calamos High Income Opportunities Fund Financial Highlights
Selected data for a share outstanding throughout each year were as follows:
CLASS I Year Ended October 31, 2021 2020 2019 2018 2017
Net asset value, beginning of year $7.96 $8.34 $8.37 $8.86 $8.61
Income from investment operations:Net investment income (loss)(a) 0.37 0.44 0.50 0.49 0.43
Net realized and unrealized gain (loss) 0.67 (0.34) (0.01) (0.44) 0.25
Total from investment operations 1.04 0.10 0.49 0.05 0.68
Distributions:Dividends from net investment income (0.30) (0.48) (0.52) (0.54) (0.43)
Dividends from net realized gains — — — — —
Return of capital (0.12) — — — —
Total distributions** (0.42) (0.48) (0.52) (0.54) (0.43)
Net asset value, end of year $8.58 $7.96 $8.34 $8.37 $8.86
Ratios and supplemental data:Total return(b) 13.16% 1.38% 6.11% 0.62% 8.09%
Net assets, end of year (000) $9,267 $6,716 $7,003 $7,706 $10,026
Ratio of net expenses to average net assets 0.75% 0.75% 0.75% 0.75% 1.02%
Ratio of gross expenses to average net assets prior to expense reductions 1.08% 1.12% 0.99% 1.21% 1.18%
Ratio of net investment income (loss) to average net assets 4.34% 5.56% 5.97% 5.65% 4.84%
** Distribution for annual periods determined in accordance with federal income tax regulations.
(a) Net investment income (loss) allocated based on average shares method.
(b) Total return measures net investment income (loss) and capital gain or loss from portfolio investments assuming reinvestment of dividends and capital gains distributions.Total return is not annualized for periods that are less than a full year, does not reflect the effect of sales charge for Class A shares nor the contingent deferred sales chargefor Class C shares and does not reflect the deduction of taxes that a shareholder would pay on fund distributions or the redemption of fund shares.

281www.calamos.com
Selected data for a share outstanding throughout each year were as follows:
CLASS A September 19, 2018• through Year Ended October 31, October 31, 2021 2020 2019 2018•
Net asset value, beginning of year $10.23 $10.20 $9.98 $10.00
Income from investment operations:Net investment income (loss)(a) 0.15 0.21 0.25 0.03
Net realized and unrealized gain (loss) (0.07) 0.12 0.23 (0.02)
Total from investment operations 0.08 0.33 0.48 0.01
Distributions:Dividends from net investment income (0.31) (0.25) (0.26) (0.03)
Dividends from net realized gains (0.09) (0.05) (0.00)* —
Total distributions** (0.40) (0.30) (0.26) (0.03)
Net asset value, end of year $9.91 $10.23 $10.20 $9.98
Ratios and supplemental data:Total return(b) 0.85% 3.24% 4.84% 0.12%
Net assets, end of year (000) $2,661 $3,225 $601 $25
Ratio of net expenses to average net assets 0.65% 0.65% 0.65% 0.66%(c)
Ratio of gross expenses to average net assets prior to expense reductions 0.65% 0.68% 0.74% 48.01%(c)
Ratio of net investment income (loss) to average net assets 1.51% 2.12% 2.47% 2.55%(c)
September 19, 2018• through Year Ended October 31, October 31, 2021 2020 2019 2018
Portfolio turnover rate 44% 41% 132% 3%
• Commencement of operations.
* Amounts are less than $0.005.
** Distribution for annual periods determined in accordance with federal income tax regulations.
(a) Net investment income (loss) allocated based on average shares method.
(b) Total return measures net investment income (loss) and capital gain or loss from portfolio investments assuming reinvestment of dividends and capital gains distributions.Total return is not annualized for periods that are less than a full year, does not reflect the effect of sales charge for Class A shares nor the contingent deferred sales chargefor Class C shares and does not reflect the deduction of taxes that a shareholder would pay on fund distributions or the redemption of fund shares.
(c) Annualized.
Calamos Short-Term Bond Fund Financial Highlights
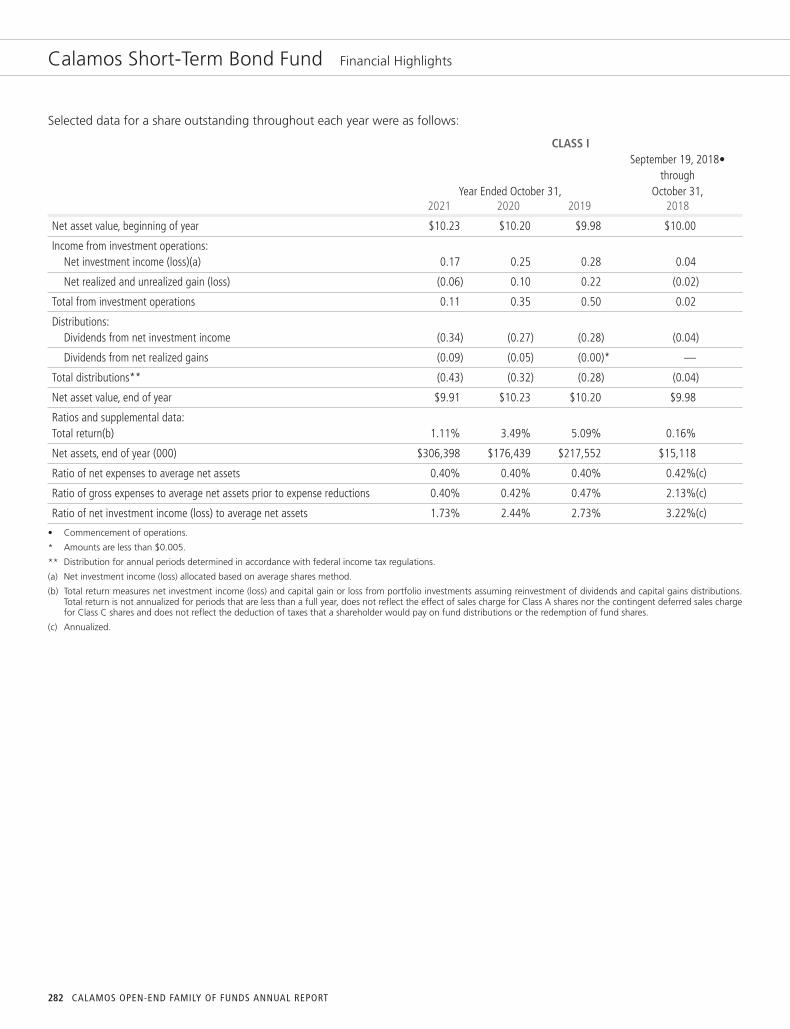
282 CALAMOS OPEN-END FAMILY OF FUNDS ANNUAL REPORT
Calamos Short-Term Bond Fund Financial Highlights
Selected data for a share outstanding throughout each year were as follows:
CLASS I September 19, 2018• through Year Ended October 31, October 31, 2021 2020 2019 2018
Net asset value, beginning of year $10.23 $10.20 $9.98 $10.00
Income from investment operations:Net investment income (loss)(a) 0.17 0.25 0.28 0.04
Net realized and unrealized gain (loss) (0.06) 0.10 0.22 (0.02)
Total from investment operations 0.11 0.35 0.50 0.02
Distributions:Dividends from net investment income (0.34) (0.27) (0.28) (0.04)
Dividends from net realized gains (0.09) (0.05) (0.00)* —
Total distributions** (0.43) (0.32) (0.28) (0.04)
Net asset value, end of year $9.91 $10.23 $10.20 $9.98
Ratios and supplemental data:Total return(b) 1.11% 3.49% 5.09% 0.16%
Net assets, end of year (000) $306,398 $176,439 $217,552 $15,118
Ratio of net expenses to average net assets 0.40% 0.40% 0.40% 0.42%(c)
Ratio of gross expenses to average net assets prior to expense reductions 0.40% 0.42% 0.47% 2.13%(c)
Ratio of net investment income (loss) to average net assets 1.73% 2.44% 2.73% 3.22%(c)
• Commencement of operations.
* Amounts are less than $0.005.
** Distribution for annual periods determined in accordance with federal income tax regulations.
(a) Net investment income (loss) allocated based on average shares method.
(b) Total return measures net investment income (loss) and capital gain or loss from portfolio investments assuming reinvestment of dividends and capital gains distributions.Total return is not annualized for periods that are less than a full year, does not reflect the effect of sales charge for Class A shares nor the contingent deferred sales chargefor Class C shares and does not reflect the deduction of taxes that a shareholder would pay on fund distributions or the redemption of fund shares.
(c) Annualized.

283www.calamos.com
Report of Independent Registered Public Accounting Firm
To the shareholders and the Board of Trustees of Calamos Investment Trust
Opinion on the Financial Statements and Financial Highlights
We have audited the accompanying statements of assets and liabilities of Calamos Investment Trust comprising the Calamos MarketNeutral Income Fund, Calamos Hedged Equity Fund, Calamos Phineus Long/Short Fund, Calamos Convertible Fund, Calamos GlobalConvertible Fund, Calamos Timpani Small Cap Growth Fund, Calamos Timpani SMID Growth Fund, Calamos Growth Fund, CalamosGrowth and Income Fund, Calamos Dividend Growth Fund, Calamos Select Fund, Calamos International Growth Fund, CalamosEvolving World Growth Fund, Calamos Global Equity Fund, Calamos Global Opportunities Fund (formerly, Calamos Global Growthand Income Fund), Calamos Total Return Bond Fund, Calamos High Income Opportunities Fund, and Calamos Short-Term BondFund (the “Funds”), including the schedules of investments, as of October 31, 2021; the related statements of operations, thestatements of changes in net assets, and the financial highlights for each of the periods listed in the table below, and the relatednotes. In our opinion, the financial statements and financial highlights present fairly, in all material respects, the financial positionof each of the funds listed above constituting Calamos Investment Trust as of October 31, 2021, and the results of their operations,the changes in their net assets, and the financial highlights for each of the periods listed in the table below in conformity withaccounting principles generally accepted in the United States of America.
Statements of Individual Fund Comprising the Statement of Changes in Calamos Investment Trust Operations Net Assets Financial Highlights
The financial highlights for the year ended June 30, 2018 and 2017 of Frontier Timpani Small Cap Growth Fund were audited byother auditors whose report dated August 27, 2018, expressed an unqualified opinion on those financial highlights.
Basis for Opinion
These financial statements and financial highlights are the responsibility of the Funds’ management. Our responsibility is to expressan opinion on the Funds’ financial statements and financial highlights based on our audits. We are a public accounting firmregistered with the Public Company Accounting Oversight Board (United States) (PCAOB) and are required to be independent withrespect to the Funds in accordance with the U.S. federal securities laws and the applicable rules and regulations of the Securitiesand Exchange Commission and the PCAOB.
Calamos Market Neutral Income Fund,Calamos Hedged Equity Fund, CalamosPhineus Long/Short Fund, CalamosConvertible Fund, Calamos Global ConvertibleFund, Calamos Growth Fund, Calamos Growthand Income Fund, Calamos Dividend GrowthFund, Calamos Select Fund, CalamosInternational Growth Fund, Calamos EvolvingWorld Growth Fund, Calamos Global EquityFund, Calamos Global Opportunities Fund(formerly, Calamos Global Growth and IncomeFund), Calamos Total Return Bond Fund, andCalamos High Income Opportunities Fund
For the year endedOctober 31, 2021
For the years endedOctober 31, 2021and 2020
For the five years ended October 31, 2021, 2020, 2019, 2018,and 2017 respectively
Calamos Short-Term Bond Fund For the year endedOctober 31, 2021
For the years endedOctober 31, 2021and 2020
For the year ended October 31, 2021, 2020, 2019, and for theperiod from September 19, 2018 (commencement of operations)through October 31, 2018
Calamos Timpani Small Cap Growth Fund(formerly, Frontier Timpani Small Cap GrowthFund for the period July 1, 2018 through May31, 2019)
For the year endedOctober 31, 2021
For the year endedOctober 31, 2021and 2020
For the year ended October 31, 2021, 2020, and for the periodfrom May 31, 2019 (commencement of operations) throughOctober 31, 2019 and July 1, 2018 through May 31, 2019
Calamos Timpani SMID Growth Fund For the year endedOctober 31, 2021
For the year endedOctober 31, 2021and 2020
For the year ended October 31, 2021, 2020, and the period fromJuly 31, 2019 (commencement of operations) through October31, 2019

284
Report of Independent Registered Public Accounting Firm
We conducted our audits in accordance with the standards of the PCAOB. Those standards require that we plan and perform theaudit to obtain reasonable assurance about whether the financial statements and financial highlights are free of materialmisstatement, whether due to error or fraud. The Funds are not required to have, nor were we engaged to perform, an audit oftheir internal control over financial reporting. As part of our audits we are required to obtain an understanding of internal controlover financial reporting but not for the purpose of expressing an opinion on the effectiveness of the Funds’ internal control overfinancial reporting. Accordingly, we express no such opinion.
Our audits included performing procedures to assess the risks of material misstatement of the financial statements and financialhighlights, whether due to error or fraud, and performing procedures that respond to those risks. Such procedures includedexamining, on a test basis, evidence regarding the amounts and disclosures in the financial statements and financial highlights.Our audits also included evaluating the accounting principles used and significant estimates made by management, as well asevaluating the overall presentation of the financial statements and financial highlights. Our procedures included confirmation ofsecurities owned as of October 31, 2021, by correspondence with the custodian and brokers; when replies were not received frombrokers, we performed other auditing procedures. We believe that our audits provide a reasonable basis for our opinion.
Chicago, Illinois
December 20, 2021
We have served as the auditor of one or more Calamos Advisors LLC investment companies since 2003.
CALAMOS OPEN-END FAMILY OF FUNDS ANNUAL REPORT

285www.calamos.com
Trustee Approval of Management Agreement (Unaudited)
The Board of Trustees (“Board” or the “Trustees”) of the Trust oversees the management of each of the Funds, and, as requiredby law, determines annually whether to continue the Trust’s management agreement with Calamos Advisors LLC (“Adviser”)pursuant to which the Adviser serves as the investment manager and administrator for each of the Funds. The “IndependentTrustees,” who comprise more than 80% of the Board, have never been affiliated with the Adviser.
In connection with their most recent consideration regarding the continuation of the management agreement, the Trustees receivedand reviewed a substantial amount of information provided by the Adviser in response to detailed requests of the IndependentTrustees and their independent legal counsel. In the course of their consideration of the agreement, the Independent Trustees wereadvised by their counsel, and in addition to meeting with management of the Adviser, they met separately in executive sessionwith their counsel.
At a meeting held on June 30, 2021,* based on their evaluation of the information referred to above and other information providedin this and previous meetings, the Trustees determined that the overall arrangements between the Trust and the Adviser on behalfof the Funds were fair in light of the nature, quality and extent of the services provided by the Adviser and its affiliates, the feescharged for those services and other matters that the Trustees considered relevant in the exercise of their business judgment. Atthat meeting, the Trustees, including all of the Independent Trustees, approved the continuation of the management agreementwith respect to all of the Funds through July 31, 2022, subject to possible earlier termination as provided in the agreement.
In connection with its consideration of the management agreement, the Board considered, among other things: (i) the nature,quality and extent of the Adviser’s services, (ii) the investment performance of each Fund as well as performance information forcomparable funds and other, comparable clients of the Adviser, (iii) the fees and other expenses paid by each Fund as well asexpense information for comparable funds and for other, comparable clients of the Adviser, (iv) the profitability of the Adviser andits affiliates from their relationship with each Fund, (v) whether economies of scale may be realized as each Fund grows and whetherpotential economies may be shared, in some measure, with Fund investors and (vi) other benefits to the Adviser from its relationshipwith the Funds. In the Board’s deliberations, no single factor was responsible for the Board’s decision to approve continuation ofthe management agreement, and each Trustee may have afforded different weight to the various factors.
Nature, Quality and Extent of Services. The Board’s consideration of the nature, quality and extent of the Adviser’s services to theFunds took into account the knowledge gained from the Board’s meetings with the Adviser throughout the years. In addition, theBoard considered: the Adviser’s long-term history of managing the Funds; the consistency of investment approach; the backgroundand experience of the Adviser’s investment personnel responsible for managing the Funds; and the Adviser’s performance asadministrator of the Funds, including, among other things, in the areas of brokerage selection, trade execution, compliance andshareholder communications. The Board also reviewed the Adviser’s resources and key personnel involved in providing investmentmanagement services to the Funds. The Board noted the personal investments that the Adviser’s key investment personnel havemade in the Funds, which further aligns the interests of the Adviser and its personnel with those of the Funds’ shareholders. Inaddition, the Board considered compliance reports about the Adviser from the Funds’ Chief Compliance Officer.
The Board also considered the information provided by the Adviser regarding the Funds’ performance and the steps the Adviser istaking to improve performance. In particular, the Board noted the additional personnel added to the Adviser’s investment team,which includes portfolio managers, research analysts, research associates and risk management personnel. The Board also notedthe Adviser’s significant investment into its infrastructure and investment processes.
Investment Performance of the Funds. The Board considered each Fund’s investment performance over various time periods,including how the Fund performed compared to the median performance of a group of comparable funds (the Fund’s “Category”)selected by an independent third-party service provider. In certain instances noted below, the Category represents a custom groupof comparable funds, also selected by the independent third-party service provider. The performance periods considered by theBoard ended on March 31, 2021, except where otherwise noted. Where available, the Board considered one-, three-, five- andten-year performance. To the extent the Board considered data for periods other than those ending on March 31, 2021 or
* The meeting was held via videoconference in reliance on an exemptive order issued by the Securities and Exchange Commission on June 19, 2020.

CALAMOS OPEN-END FAMILY OF FUNDS ANNUAL REPORT286
Trustee Approval of Management Agreement (Unaudited)
considered comparative data in addition to that of the Category, such as comparative data for an alternate group of comparablefunds (a “category”), the data was still produced by an independent third-party service provider.
Further detail considered by the Board regarding the investment performance of each Fund is set forth below:
Calamos Growth Fund. The Board considered that the Fund outperformed its custom Category median for the one-year periodand underperformed its custom Category median for the remaining periods. The Board noted that the recent changes to the Fund’sportfolio management team and the corresponding implementation of a new investment sleeve approach effective April 1, 2020were yielding improving performance, with the Fund ranked in the first quartile of its Morningstar category and 2nd quartile of itscustom Category for the one-year period ended April 30, 2021. The Board also noted that the Fund outperformed both of itsbenchmarks for the same period.
Calamos Select Fund. The Board considered that the Fund outperformed its custom Category median for the one-year periodand underperformed its custom Category median for the remaining periods. The Board considered that the recent changes to theFund’s management team and the adoption of a new primary benchmark index were yielding improving performance, with theFund ranked in the second quartile of its Morningstar category and custom Category for the one-year period ended April 30, 2021.The Board also noted that the Fund outperformed benchmark for the same period.
Calamos Dividend Growth Fund. The Board considered that the Fund outperformed its custom Category median for all periods.
Calamos International Growth Fund. The Board considered that the Fund outperformed its Category median for all periods.
Calamos Evolving World Growth Fund. The Board considered that the Fund outperformed its Category median for all periods.
Calamos Global Equity Fund. The Board considered that the Fund outperformed its Category median for all periods.
Calamos Growth and Income Fund. The Board considered that the Fund outperformed its custom Category median for allperiods.
Calamos Global Opportunities Fund. The Board considered that the Fund outperformed its custom Category median for allperiods.
Calamos Convertible Fund. The Board considered that the Fund outperformed its Category median for the one- and five-yearperiods and underperformed its Category median for the remaining periods. The Board further noted that the Fund ranked in the2nd quartile of its Category for the one- and five-year periods as of April 30, 2021.
Calamos Global Convertible Fund. The Board considered that the Fund underperformed its Category median for all periods. TheBoard further noted the Adviser’s representation that the Fund is the only U.S.-based convertible fund with a global mandate in itsCategory, and therefore considered the Adviser’s assertion that the Global Convertible UCITS fund managed by the Adviser and itsperformance universe are a better comparative source than the Category. As a result, the Board considered the Fund’s similarity tothe UCITS fund managed by the Adviser, noting that the UCITS fund, when compared to its peers, ranked in the 1st quartile forthe one-, three- and five-year periods.
Calamos Total Return Bond Fund. The Board considered that the Fund underperformed its Category median for all periods. TheBoard also considered that as of April 30, 2021, the Fund outperformed its benchmark for the one-year period and the Fund rankedin the second quartile for the month and quarter-to date. The Board further considered the Adviser’s assertion that the Fund’sCategory peers’ exposure to higher risk investments negatively affected the Fund’s performance comparisons. The Board also notedthat when it considered the performance of the Fund one year before, the Fund outperformed its Category median for the one-,three- and five-year periods, though it underperformed for the ten-year period, signaling that the Fund’s underperformance hadbeen isolated to 2020.
Calamos High Income Opportunities Fund. The Board considered that Class I shares of the Fund outperformed its Categorymedian for the one-, three- and five-year periods, though it underperformed the Category median for the ten-year period. TheBoard also considered that Class A shares of the Fund outperformed its Category median for the one- and three-year periods,
287www.calamos.com
though it underperformed the Category median for the remaining periods. The Board further considered the Fund ranked in the1st quartile of its Category for the one-year period.
Calamos Market Neutral Income Fund. The Board considered that the Fund outperformed its Category median for all periods.
Calamos Hedged Equity Fund. The Board considered that the Fund outperformed its Category median for the three- and five-yearperiods and underperformed its Category median for the one-year period.
Calamos Phineus Long/Short Fund. The Board considered that the Fund outperformed its Category median for all periods.
Calamos Short-Term Bond Fund. The Board considered that the Fund underperformed its Category median for the one-yearperiod. The Board also noted, however, that the Fund only commenced operations in September 2018 and that it would be prudentto allow the portfolio management team time to further develop its performance record with the Fund.
Calamos Timpani Small Cap Growth Fund. The Board considered that the Fund outperformed its Category median for all periods.
Calamos Timpani SMID Growth Fund. The Board considered that the Fund outperformed its custom Category median for theone-year period.
Costs of Services Provided and Profits Realized by the Adviser. Using information provided by an independent third-party serviceprovider, the Board evaluated each Fund’s actual management fee rate compared to the median management fee rate for othermutual funds similar in size, character and investment strategy (the Fund’s “Expense Group”), and the Fund’s total expense ratiocompared to the median total expense ratio of the Fund’s Expense Group.
The Board also reviewed the Adviser’s management fee rates for its institutional separate accounts and sub-advisory accounts. TheBoard took into account that although, generally, the rates of fees paid by institutional clients or for sub-advisory services werelower than the rates of fees paid by the Funds, the differences reflected the Adviser’s greater level of responsibilities and significantlybroader scope of services regarding the Funds, the more extensive regulatory obligations and risks associated with managing theFunds, and other financial considerations with respect to creation and sponsorship of the Funds. The Board considered factors thatlead to more expenses for registered funds including but not limited to: (i) capital expenditures to establish a fund, (ii) length oftime to reach critical mass, and the related expenses, (iii) higher servicing costs of intermediaries and shareholders, (iv) higherredemption rates of assets under management, (v) entrepreneurial risk assumed by the Adviser and (vi) greater exposure to “makewhole” errors.
The Board also considered the Adviser’s costs in serving as the Funds’ investment adviser and manager, including but not limitedto costs associated with technology, infrastructure and compliance necessary to manage the Funds. The Board reviewed the Adviser’smethodology for allocating costs among the Adviser’s lines of business. The Board also considered information regarding thestructure of the Adviser’s compensation program for portfolio managers, analysts and certain other employees, and the relationshipof such compensation to the attraction and retention of quality personnel. Finally, the Board reviewed information on the profitabilityof the Adviser in serving as each Fund’s investment manager and of the Adviser and its affiliates in all of their relationships witheach Fund, as well as an explanation of the methodology utilized in allocating various expenses among the Funds and the Adviser’sother business units. Data was provided to the Board with respect to profitability, both on a pre- and post-marketing cost basis.The Board reviewed the financial statements of the Adviser’s parent company and discussed its corporate structure.
Further detail considered by the Board regarding the management fee rate and total expense ratio of each Fund is set forth below:
Calamos Growth Fund. The Board considered that, while the Fund’s management fee rate and total expense ratio are higherthan the respective medians of the Fund’s Expense Group, the Adviser continues to invest resources in the Fund to addressperformance and that the Board will continue to closely monitor the results of the Adviser’s initiatives. The Board also reviewed theFund’s expenses in light of its recent performance record and the Adviser’s conviction in the Fund’s recent changes.
Calamos Select Fund. The Board considered that the Fund’s management fee rate is lower than its Expense Group median andthe Fund’s total expense ratio is equal to its Expense Group median.
Trustee Approval of Management Agreement (Unaudited)

CALAMOS OPEN-END FAMILY OF FUNDS ANNUAL REPORT288
Trustee Approval of Management Agreement (Unaudited)
Calamos Dividend Growth Fund. The Board considered that the Fund’s management fee rate is lower than its Expense Groupmedian, though the Fund’s total expense ratio is higher than its Expense Group median. The Board also reviewed the Fund’s expensesin light of its performance record.
Calamos International Growth Fund. The Board considered that the Fund’s management fee rate and total expense ratio arelower than the respective medians of the Fund’s Expense Group. The Board also noted that the Fund’s management fee is subjectto a performance adjustment, which serves to lower the management fee during periods of underperformance. The Board alsoreviewed the Fund’s expenses in light of its performance record.
Calamos Evolving World Growth Fund. The Board considered that the Fund’s management fee rate and total expense ratio arehigher than the respective medians of the Fund’s Expense Group. The Board also reviewed the Fund’s expenses in light of itsperformance record.
Calamos Global Equity Fund. The Board considered that, while the Fund’s management fee rate and total expense ratio arehigher than the respective medians of the Fund’s Expense Group, the Fund’s management fee is subject to a performanceadjustment, which serves to lower the management fee during periods of underperformance. The Board also reviewed the Fund’sexpenses in light of its performance record.
Calamos Growth and Income Fund. The Board considered that the Fund’s management fee rate and total expense ratio arehigher than the respective medians of the Fund’s Expense Group. The Board reviewed the Fund’s expenses in light of its performancerecord.
Calamos Global Opportunities Fund. The Board considered that the Fund’s management fee rate and total expense ratio arehigher than the respective medians of the Fund’s Expense Group. The Board reviewed the Fund’s expenses in light of its performancerecord.
Calamos Convertible Fund. The Board considered that the Fund’s management fee rate is lower than its Expense Group medianand the Fund’s total expense ratio is higher than its Expense Group median. The Board also reviewed the Fund’s expenses in lightof its performance record.
Calamos Global Convertible Fund. The Board considered that the Fund’s management fee rate and total expense ratio are higherthan the respective medians of the Fund’s Expense Group. The Board also considered, however, that the Fund offers a uniquemandate and the Adviser’s assertion that, as a result, there are no appropriate peer funds against which to meaningfully comparethe Fund’s fees. The Board reviewed the Fund’s expenses in light of its performance record against its benchmark.
Calamos Total Return Bond Fund. The Board considered that the Fund’s management fee rate and total expense ratio are higherthan the respective medians of the Fund’s Expense Group. The Board also considered that the Adviser had contractually agreed tolimit Fund expenses through March 1, 2023 and was currently subsidizing the Fund under this arrangement.
Calamos High Income Opportunities Fund. The Board considered that the Fund’s management fee rate and total expense ratioare lower than the respective medians of the Fund’s Expense Group.
Calamos Market Neutral Income Fund. The Board considered that the Fund’s management fee rate and total expense ratio arelower than the respective medians of the Fund’s Expense Group.
Calamos Hedged Equity Fund. The Board considered that the Fund’s management fee rate and total expense ratio are lowerthan the respective medians of the Fund’s Expense Group.
Calamos Phineus Long/Short Fund. The Board considered that the Fund’s management fee rate and total expense ratio are lowerthan the respective medians of the Fund’s Expense Group.
Calamos Short-Term Bond Fund. The Board considered that the Fund’s management fee rate and total expense ratio are lowerthan the respective medians of the Fund’s Expense Group.
289www.calamos.com
Calamos Timpani Small Cap Growth Fund. The Board considered that the Fund’s management fee rate and total expense ratioare higher than the respective medians of the Fund’s Expense Group. The Board reviewed the Fund’s expenses in light of itsperformance record.
Calamos Timpani SMID Growth Fund. The Board considered that the Fund’s management fee rate is lower than the ExpenseGroup median and that the Fund’s total expense ratio is higher than the Expense Group median. The Board considered Fund’sexpenses in light of its level of assets and short performance record. The Board also considered that the Adviser had contractuallyagreed to limit Fund expenses through March 1, 2023 and was currently subsidizing the Fund under this arrangement.
Economies of Scale. The Board considered whether each Fund’s management fee shares with shareholders potential economies ofscale that may be achieved by the Adviser. The Board recognized that breakpoints in the fee schedule for each Fund could resultin the sharing of economies of scale as Fund assets increase. The Board also considered the Adviser’s agreement to reimburse eachFund for a portion of its expenses if the Fund’s expense ratio otherwise would exceed a certain level. The Board also considered thebenefits accruing to shareholders from the Adviser’s investments into its infrastructure and investment processes. The Boardconcluded that the breakpoints in the fee schedule for each Fund allow shareholders to benefit from potential economies of scalethat may be achieved by the Adviser.
Other Benefits Derived from the Relationship with the Funds. The Board also considered other benefits that accrue to the Adviserand its affiliates from their relationship with the Funds. The Board concluded that while the Adviser may potentially benefit fromits relationship with the Funds in ways other than the fees payable by the Funds, the Funds also may benefit from their relationshipwith the Adviser in ways other than the services to be provided by the Adviser and its affiliates pursuant to their agreement withthe Funds and the fees payable by the Funds.
The Board also considered the Adviser’s use of a portion of the commissions paid by the Funds on their portfolio brokeragetransactions to obtain research products and services benefiting the Funds and/or other clients of the Adviser and concluded, basedon reports from the Funds’ Chief Compliance Officer, that the Adviser’s use of “soft” commission dollars to obtain research productsand services was consistent with regulatory requirements.
After full consideration of the above factors as well as other factors that were instructive in their consideration, the Trustees,including all of the Independent Trustees, concluded that the continuation of the management agreement for each Fund with theAdviser was in the best interest of each respective Fund and its shareholders.
Trustee Approval of Management Agreement (Unaudited)
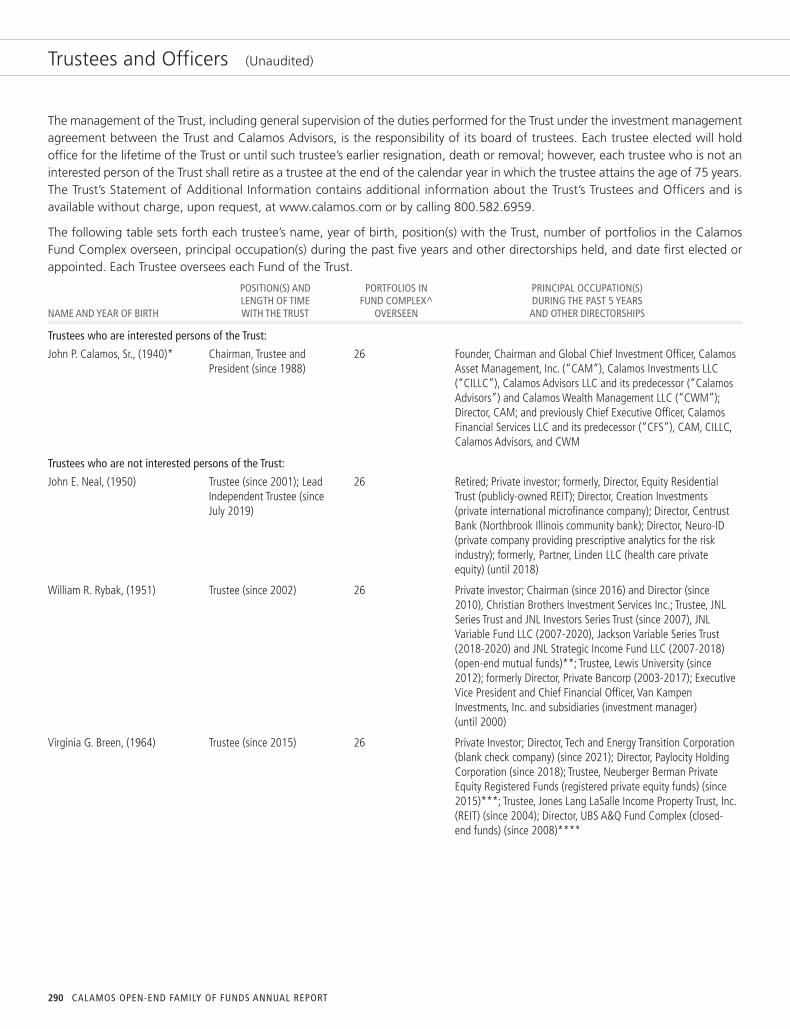
CALAMOS OPEN-END FAMILY OF FUNDS ANNUAL REPORT290
Trustees and Officers (Unaudited)
The management of the Trust, including general supervision of the duties performed for the Trust under the investment managementagreement between the Trust and Calamos Advisors, is the responsibility of its board of trustees. Each trustee elected will holdoffice for the lifetime of the Trust or until such trustee’s earlier resignation, death or removal; however, each trustee who is not aninterested person of the Trust shall retire as a trustee at the end of the calendar year in which the trustee attains the age of 75 years.The Trust’s Statement of Additional Information contains additional information about the Trust’s Trustees and Officers and isavailable without charge, upon request, at www.calamos.com or by calling 800.582.6959.
The following table sets forth each trustee’s name, year of birth, position(s) with the Trust, number of portfolios in the CalamosFund Complex overseen, principal occupation(s) during the past five years and other directorships held, and date first elected orappointed. Each Trustee oversees each Fund of the Trust.
POSITION(S) AND PORTFOLIOS IN PRINCIPAL OCCUPATION(S) LENGTH OF TIME FUND COMPLEX^ DURING THE PAST 5 YEARS NAME AND YEAR OF BIRTH WITH THE TRUST OVERSEEN AND OTHER DIRECTORSHIPS
Trustees who are interested persons of the Trust:
Trustees who are not interested persons of the Trust:
John P. Calamos, Sr., (1940)* Chairman, Trustee andPresident (since 1988)
26 Founder, Chairman and Global Chief Investment Officer, CalamosAsset Management, Inc. (“CAM”), Calamos Investments LLC(“CILLC”), Calamos Advisors LLC and its predecessor (“CalamosAdvisors”) and Calamos Wealth Management LLC (“CWM”);Director, CAM; and previously Chief Executive Officer, CalamosFinancial Services LLC and its predecessor (“CFS”), CAM, CILLC,Calamos Advisors, and CWM
John E. Neal, (1950) Trustee (since 2001); LeadIndependent Trustee (sinceJuly 2019)
26 Retired; Private investor; formerly, Director, Equity ResidentialTrust (publicly-owned REIT); Director, Creation Investments(private international microfinance company); Director, CentrustBank (Northbrook Illinois community bank); Director, Neuro-ID(private company providing prescriptive analytics for the riskindustry); formerly, Partner, Linden LLC (health care privateequity) (until 2018)
William R. Rybak, (1951) Trustee (since 2002) 26 Private investor; Chairman (since 2016) and Director (since2010), Christian Brothers Investment Services Inc.; Trustee, JNLSeries Trust and JNL Investors Series Trust (since 2007), JNLVariable Fund LLC (2007-2020), Jackson Variable Series Trust(2018-2020) and JNL Strategic Income Fund LLC (2007-2018)(open-end mutual funds)**; Trustee, Lewis University (since2012); formerly Director, Private Bancorp (2003-2017); ExecutiveVice President and Chief Financial Officer, Van KampenInvestments, Inc. and subsidiaries (investment manager)(until 2000)
Virginia G. Breen, (1964) Trustee (since 2015) 26 Private Investor; Director, Tech and Energy Transition Corporation(blank check company) (since 2021); Director, Paylocity HoldingCorporation (since 2018); Trustee, Neuberger Berman PrivateEquity Registered Funds (registered private equity funds) (since2015)***; Trustee, Jones Lang LaSalle Income Property Trust, Inc.(REIT) (since 2004); Director, UBS A&Q Fund Complex (closed-end funds) (since 2008)****

291www.calamos.com
POSITION(S) AND PORTFOLIOS IN PRINCIPAL OCCUPATION(S) LENGTH OF TIME FUND COMPLEX^ DURING THE PAST 5 YEARS NAME AND YEAR OF BIRTH WITH THE TRUST OVERSEEN AND OTHER DIRECTORSHIPS
* Mr. Calamos, Sr. is an “interested person” of the Trust as defined in the 1940 Act because he is an officer of the Trust and an affiliate of Calamos Advisors and CFS.** Overseeing 131 portfolios in fund complex.*** Overseeing eighteen portfolios in fund complex.**** Overseeing four portfolios in fund complex.^ The Fund Complex consists of Calamos Investment Trust, Calamos Advisors Trust, Calamos Convertible Opportunities and Income Fund, Calamos Convertible and High
Income Fund, Calamos Strategic Total Return Fund, Calamos Global Total Return Fund, Calamos Global Dynamic Income Fund, Calamos Dynamic Convertible and IncomeFund and Calamos Long/Short Equity & Dynamic Income Trust.
The address of each trustee is 2020 Calamos Court, Naperville, Illinois 60563.
Lloyd A. Wennlund, (1957) Trustee (since 2018) 26 Trustee and Chairman, Datum One Series Trust (since 2020);Expert Affiliate, Bates Group, LLC (financial services consultingand expert testimony firm) (since 2018); Executive Vice President,The Northern Trust Company (1989-2017); President andBusiness Unit Head of Northern Funds and Northern InstitutionalFunds (1994-2017); Director, Northern Trust Investments (1998-2017); Governor (2004-2017) and Executive Committee member(2011-2017), Investment Company Institute Board of Governors;Member, Securities Industry Financial Markets Association(SIFMA) Advisory Council, Private Client Services Committee andPrivate Client Steering Group (2006-2017); Board Member,Chicago Advisory Board of the Salvation Army (2011-2019)
Karen L. Stuckey, (1953) Trustee (since 2019) 26 Member (2015-2021) of Desert Mountain CommunityFoundation Advisory Board (non-profit organization); Partner(1990-2012) of PricewaterhouseCoopers LLP (professionalservices firm) (held various positions 1975-1990); member ofExecutive, Nominating and Audit Committees and Chair ofFinance Committee (1992-2006), and Emeritus Trustee (since2007) of Lehigh University; Member, Women’s InvestmentManagement Forum (professional organization) (since inception);formerly, Trustee, Denver Board of Oppenheimer Funds (open-endmutual funds) (2012-2019)
Christopher M. Toub, (1959) Trustee (since 2019) 26 Private investor; formerly, Director of Equities, AllianceBernsteinLP (until 2012)
Trustees and Officers (Unaudited)

CALAMOS OPEN-END FAMILY OF FUNDS ANNUAL REPORT292
Trustees and Officers (Unaudited)
Officers. The preceding table gives information about John P. Calamos, Sr., who is Chairman, Trustee and President of the Trust.The following table sets forth each other officer’s name, year of birth, position with the Trust and date first appointed to thatposition, and principal occupation(s) during the past five years. Each officer serves until his or her successor is chosen and qualifiedor until his or her resignation or removal by the board of trustees.
POSITION(S) AND LENGTH OF TIME PRINCIPAL OCCUPATION(S) NAME AND YEAR OF BIRTH WITH THE TRUST DURING THE PAST 5 YEARS
The address of each officer is 2020 Calamos Court, Naperville, Illinois 60563.
John S. Koudounis, (1966) Vice President (since 2016) President (since February 2021) and Chief Executive Officer, CAM, CILLC, CalamosAdvisors, CWM and CFS (since 2016); Director CAM (since 2016); President and ChiefExecutive Officer (2010-2016), Mizuho Securities USA Inc.
Thomas E. Herman, (1961) Vice President (since 2016)and Chief Financial Officer(2016-2017) and sinceAugust 2019)
Executive Vice President (since February 2021) and Chief Financial Officer, CAM, CILLC,Calamos Advisors and CWM (since 2016); Chief Financial Officer and Treasurer, HarrisAssociates (2010-2016)
Stephen Atkins, (1965) Treasurer (since March 2020) Senior Vice President, Head of Fund Administration (since February 2020), CalamosAdvisors; prior thereto, Consultant, Fund Accounting and Administration, Vx CapitalPartners (March 2019-February 2020); Chief Financial Officer and Treasurer of SECRegistered Funds, and Senior Vice President, Head of European Special PurposeVehicles Accounting and Administration, Avenue Capital Group (2010-2018)
Robert F. Behan, (1964) Vice President (since 2013) Executive Vice President and Chief Distribution Officer (since February 2021), CAM,CILLC, Calamos Advisors and CFS; prior thereto, President (2015-February 2021); Headof Global Distribution (2013-February 2021); Executive Vice President (2013-2015);Senior Vice President (2009-2013); Head of US Intermediary Distribution (2010-2013)
J. Christopher Jackson, (1951) Vice President and Secretary(since 2010)
Senior Vice President, General Counsel and Secretary, CAM, CILLC, Calamos Advisors,CWM and CFS (since 2010); Director, Calamos Global Funds plc (since 2011)
Mark J. Mickey, (1951) Chief Compliance Officer(since 2005)
Chief Compliance Officer, Calamos Funds (since 2005)
Daniel Dufresne (1974) Vice President (since June 30,2021)
Executive Vice President and Chief Operating Officer, CAM, CILLC, Calamos Advisors,and CWM (since April 2021); prior thereto, Citadel (1999-2020); Partner (2008-2020);Managing Director, Global Treasurer (2008-2020); Global Head of Operations(2011-2020); Global Head of Counterparty Strategy (2018-2020); Senior Advisor to theCOO (2020); CEO, Citadel Clearing LLC (2015-2020).

293www.calamos.com
We are providing this information as required by the Internal Revenue Code (Code). The amounts shown may differ from thoseelsewhere in this report due to differences between tax and financial reporting requirements. In January 2022, shareholders willreceive Form 1099-DIV which will include their share of qualified dividends and capital gains distributed during the calendar year2021. Shareholders are advised to check with their tax advisors for information on the treatment of these amounts on their individualincome tax returns.
Under Section 852(b)(3)(C) of the Code, the Funds hereby designate the following amounts as capital gain dividends for the fiscalperiod ended October 31, 2021:
CONVERTIBLE GLOBAL TIMPANI GROWTH FUND CONVERTIBLE FUND SMALL CAP GROWTH FUND FUND
$68,717,440 $10,208,374 $6,630,168 $158,449,335
GROWTH AND DIVIDEND INTERNATIONAL INCOME FUND GROWTH FUND SELECT FUND GROWTH FUND
$34,753,991 $1,152,615 $2,047,183 $13,028,011
GLOBAL OPPORTUNITIES FUND EVOLVING WORLD GLOBAL EQUITY (formerly, Calamos Global Growth SHORT-TERM GROWTH FUND FUND and Income Fund) BOND FUND
$6,901,599 $6,311,570 $7,792,391 $1,050,318
Under Section 854(b)(2) of the Code, the Funds hereby designate the following amounts, or the maximum amount allowable underthe Code, as qualified dividends for the fiscal period ended October 31, 2021:
MARKET NEUTRAL HEDGED EQUITY PHINEUS LONG/SHORT CONVERTIBLE INCOME FUND FUND FUND FUND
$76,086,150 $2,707,559 $5,835,460 $8,710,041
GLOBAL TIMPANI TIMPANI GROWTH CONVERTIBLE FUND SMALL CAP GROWTH FUND SMID GROWTH FUND FUND
$1,004,476 $408,053 $24,602 $7,832,956
GROWTH AND DIVIDEND GROWTH INTERNATIONAL INCOME FUND FUND SELECT FUND GROWTH FUND
$32,304,591 $182,636 $451,729 $3,363,509
GLOBAL OPPORTUNITIES FUND EVOLVING WORLD GLOBAL EQUITY (formerly, Calamos Global Growth TOTAL RETURN GROWTH FUND FUND and Income Fund) BOND FUND
$4,189,900 $1,112,915 $2,929,928 $329
HIGH INCOME SHORT-TERM OPPORTUNITIES FUND BOND FUND
$51,272 $28
Tax Information (Unaudited)
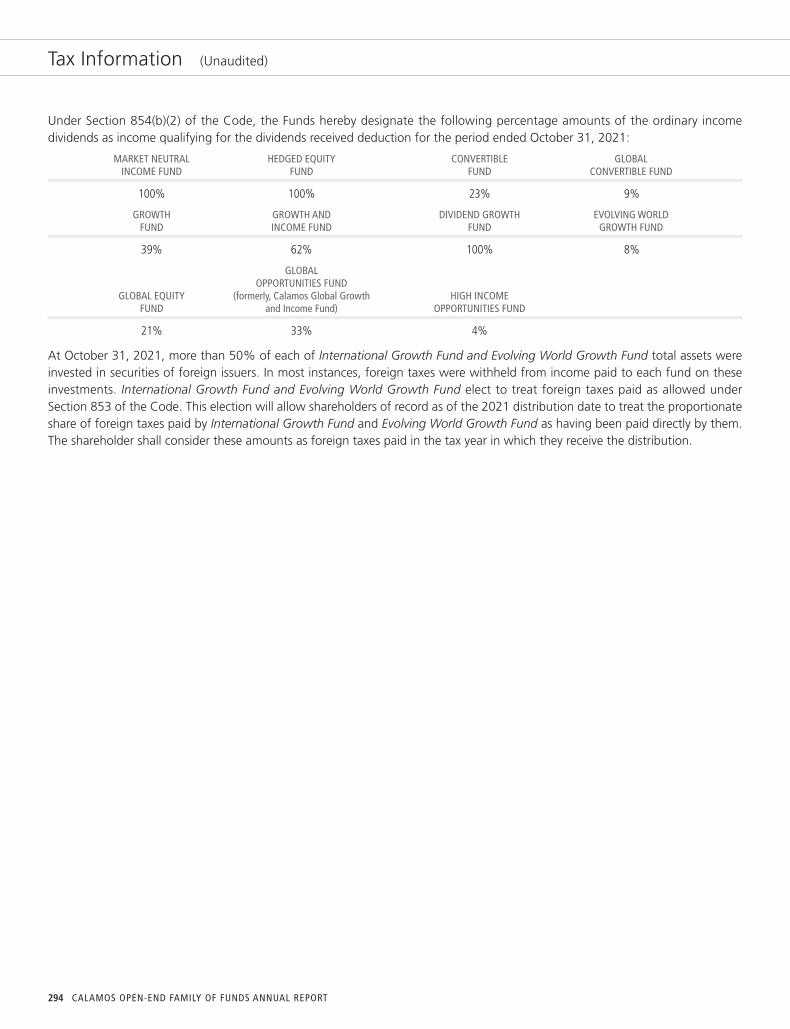
294
Tax Information (Unaudited)
Under Section 854(b)(2) of the Code, the Funds hereby designate the following percentage amounts of the ordinary incomedividends as income qualifying for the dividends received deduction for the period ended October 31, 2021:
MARKET NEUTRAL HEDGED EQUITY CONVERTIBLE GLOBAL INCOME FUND FUND FUND CONVERTIBLE FUND
100% 100% 23% 9%
GROWTH GROWTH AND DIVIDEND GROWTH EVOLVING WORLD FUND INCOME FUND FUND GROWTH FUND
39% 62% 100% 8%
GLOBAL OPPORTUNITIES FUND GLOBAL EQUITY (formerly, Calamos Global Growth HIGH INCOME FUND and Income Fund) OPPORTUNITIES FUND
21% 33% 4%
At October 31, 2021, more than 50% of each of International Growth Fund and Evolving World Growth Fund total assets wereinvested in securities of foreign issuers. In most instances, foreign taxes were withheld from income paid to each fund on theseinvestments. International Growth Fund and Evolving World Growth Fund elect to treat foreign taxes paid as allowed underSection 853 of the Code. This election will allow shareholders of record as of the 2021 distribution date to treat the proportionateshare of foreign taxes paid by International Growth Fund and Evolving World Growth Fund as having been paid directly by them.The shareholder shall consider these amounts as foreign taxes paid in the tax year in which they receive the distribution.
CALAMOS OPEN-END FAMILY OF FUNDS ANNUAL REPORT

T h i s p a g e i n t e n t i o n a l l y l e f t b l a n k .

T h i s p a g e i n t e n t i o n a l l y l e f t b l a n k .

MANAGING YOUR CALAMOSFUNDS INVESTMENTSCalamos Investments offers several convenient meansto monitor, manage and feel confident about yourCalamos investment choice.
24-HOUR AUTOMATED SHAREHOLDERASSISTANCE: 800.823.7386Through a single toll-free number, Calamos 24-Hour ShareholderAssistance is fast and easy. Get fund prices and account balances,review recent transactions, order statements, literature and more.
PERSONAL ASSISTANCE: 800.582.6959Dial this toll-free number to speak with a knowledgeable ClientServices Representative who can help answer questions oraddress issues concerning your Calamos Fund.
ONLINE ACCOUNT MANAGEMENT: www.calamos.comManage your personal account of Calamos Funds online atwww.calamos.com. On your account access page, you can viewaccount history and download data.
YOUR FINANCIAL ADVISORWe encourage you to talk to your financial advisor to determinehow the Calamos Funds can benefit your investment portfoliobased on your financial goals, risk tolerance, time horizon andincome needs.

STAY CONNECTEDwww.calamos.com/connect
Visit our Web site for timely fundperformance, detailed fund profiles, fundnews and insightful market commentary.
This report, including the audited financial statements contained herein, is submittedfor general information for the shareholders of the Funds. The report is not authorizedfor distribution to prospective investors in the Funds unless accompanied by a currentlyeffective prospectus of the Funds. The views expressed in this report reflect those ofCalamos Advisors LLC only through October 31, 2021.
A description of the Calamos Proxy Voting Policies and Procedures and the Funds’proxy voting record for the 12-month period ended June 30 are available free ofcharge upon request by calling 800.582.6959, by visiting the Calamos Web site atwww.calamos.com, or by writing Calamos at: Calamos Investments, Attn: ClientServices, 2020 Calamos Court, Naperville, IL 60563. The Funds’ proxy voting record isalso available free of charge by visiting the SEC Web site at www.sec.gov.
The Funds file a complete list of their portfolio holdings with the SEC for the first andthird quarters each fiscal year as an exhibit to its reports on Form N-PORT. The FormsN-PORT are available free of charge, upon request, by calling or writing CalamosInvestments at the phone number or address provided above or by visiting the SECWeb site at www.sec.gov.
FOR 24-HOUR AUTOMATED SHAREHOLDER ASSISTANCE: 800.823.7386
TO OBTAIN INFORMATION ABOUT YOUR INVESTMENTS: 800.582.6959
VISIT OUR WEB SITE: www.calamos.com
INVESTMENT ADVISER:Calamos Advisors LLC 2020 Calamos CourtNaperville, IL 60563-2787
CUSTODIAN AND FUND ACCOUNTING AGENT:State Street Bank and Trust Company Boston, MA
TRANSFER AGENT:U.S. Bank Global Fund Services 615 E. Michigan St., 3rd Floor Milwaukee, WI 53202
INDEPENDENT REGISTERED PUBLIC ACCOUNTING FIRM:Deloitte & Touche LLP Chicago, IL
LEGAL COUNSEL:Ropes & Gray LLP Chicago, IL
2020 Calamos CourtNaperville, IL 60563-2787800.582.6959www.calamos.com
© 2021 Calamos Investments LLC. All RightsReserved. Calamos® and Calamos Investments® areregistered trademarks of Calamos Investments LLC.
MFANR 1631 2021