familial factors in longevity: exploring complex environmental and genetic effects leonid a....
TRANSCRIPT

Familial Factors in Longevity: Exploring Complex
Environmental and Genetic Effects
Leonid A. Gavrilov, Ph.D.Natalia S. Gavrilova, Ph.D.
Center on Aging
NORC and The University of Chicago Chicago, USA

Heritability of Longevity

Mutation Accumulation Theory of Aging
(Medawar, 1946)
From the evolutionary perspective, aging is an inevitable result of the declining force of natural selection with age.
So, over successive generations, late-acting deleterious mutations will accumulate, leading to an increase in mortality rates late in life.

Predictions of the Mutation Accumulation Theory of Aging
Mutation accumulation theory predicts that those deleterious mutations that are expressed in later life should have higher frequencies (because mutation-selection balance is shifted to higher equilibrium frequencies due to smaller selection pressure).
Therefore, ‘expressed’ genetic variability should increase with age (Charlesworth, 1994. Evolution in Age-structured Populations).
This should result in higher heritability estimates for lifespan of offspring born to longer-lived parents.
Parental Lifespan0 20 40 60 80
Off
sp
rin
g L
ifesp
an
0
10
20
30
40
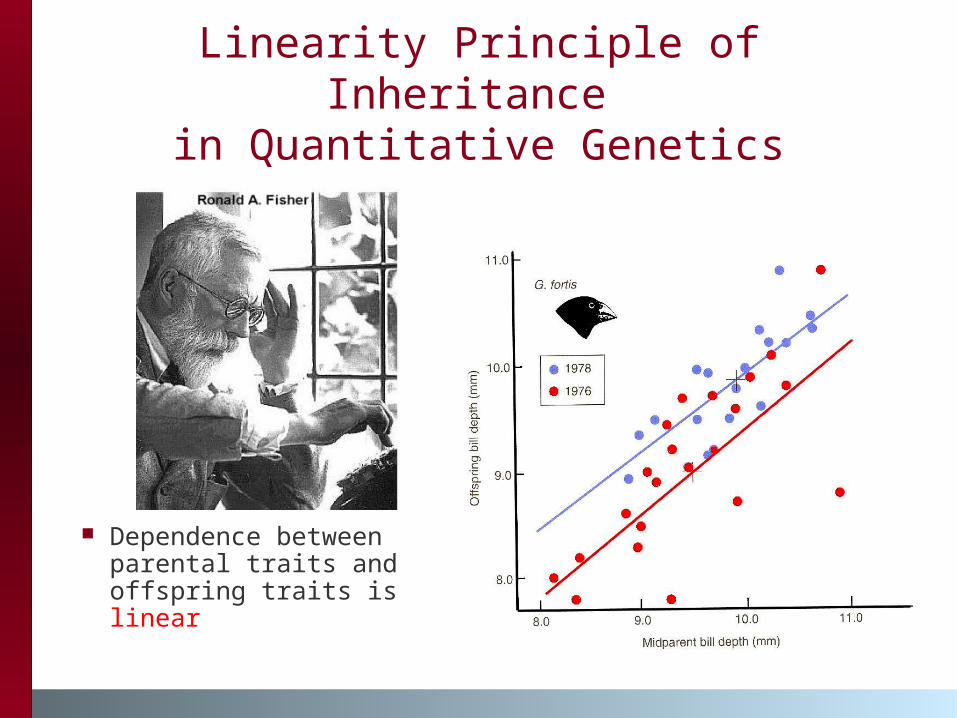
Linearity Principle of Inheritance in Quantitative Genetics
Dependence between parental traits and offspring traits is linear
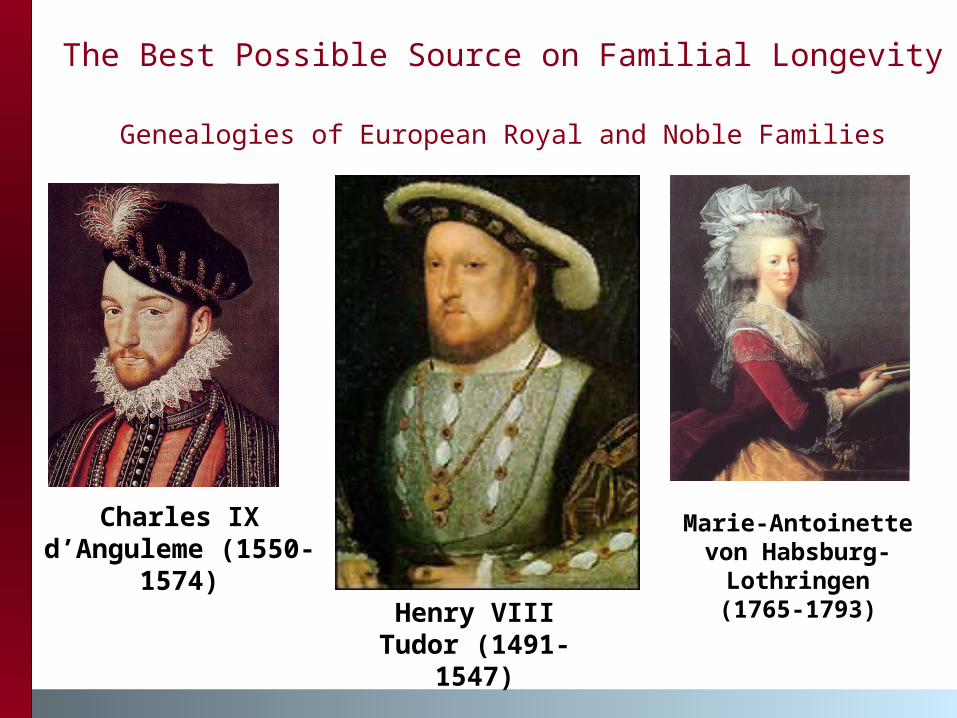
The Best Possible Source on Familial Longevity Genealogies of European Royal and Noble Families
Charles IX d’Anguleme (1550-1574)
Henry VIII Tudor (1491-1547)
Marie-Antoinette von Habsburg-Lothringen
(1765-1793)

Characteristic of our Dataset Over 16,000 persons
belonging to the European aristocracy
1800-1880 extinct birth cohorts
Adult persons aged 30+
Data extracted from the professional genealogical data sources including Genealogisches Handbook des Adels, Almanac de Gotha, Burke Peerage and Baronetage.
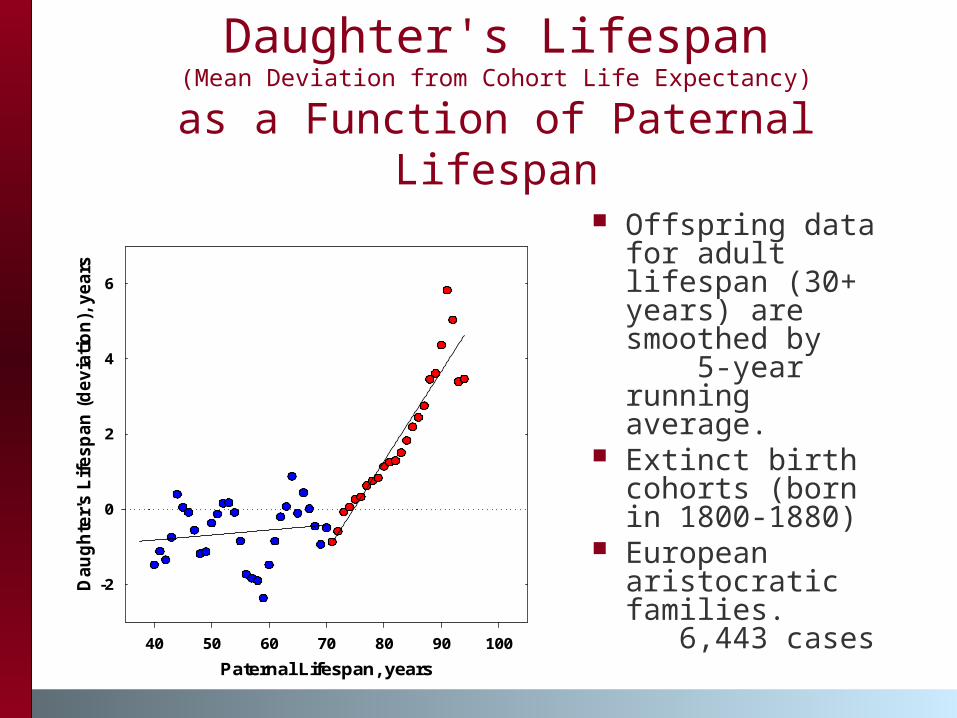
Daughter's Lifespan(Mean Deviation from Cohort Life Expectancy)
as a Function of Paternal Lifespan
Paternal Lifespan, years
40 50 60 70 80 90 100
Da
ug
hte
r's
Lif
es
pa
n (
de
via
tio
n),
ye
ars
-2
2
4
6
0
Offspring data for adult lifespan (30+ years) are smoothed by 5-year running average.
Extinct birth cohorts (born in 1800-1880)
European aristocratic families. 6,443 cases

“The Heritability of Life-Spans Is Small”C.E. Finch, R.E. Tanzi, Science, 1997, p.407
“… long life runs in families”A. Cournil, T.B.L. Kirkwood, Trends in Genetics, 2001, p.233
Paradox of low heritability of lifespan vs high familial clustering of longevity

Heritability Estimates of Human Lifespan
Author(s) Heritability
estimate
Population
McGue et al., 1993 0.22 Danish twins
Ljungquist et al., 1998
<0.33 Swedish twins
Bocquet-Appel, Jacobi, 1990
0.10-0.30 French village
Mayer, 1991 0.10-0.33 New England families
Cournil et al., 2000 0.27 French village
Mitchell et al., 2001 0.25 Old Order Amish

Compensation Law of Mortality
Convergence of Mortality Rates with Age
1 – India, 1941-1950, males 2 – Turkey, 1950-1951,
males3 – Kenya, 1969, males 4 - Northern Ireland, 1950-
1952, males5 - England and Wales,
1930-1932, females 6 - Austria, 1959-1961,
females 7 - Norway, 1956-1960,
females
Source: Gavrilov, Gavrilova,“The Biology of Life Span”
1991

Compensation Law of Mortality (Parental Longevity Effects)
Mortality Kinetics for Progeny Born to Long-Lived (80+) vs Short-Lived Parents
Sons DaughtersAge
40 50 60 70 80 90 100
Log(
Haz
ard
Rat
e)
0.001
0.01
0.1
1
short-lived parentslong-lived parents
Linear Regression Line
Age
40 50 60 70 80 90 100
Log(
Haz
ard
Rat
e)
0.001
0.01
0.1
1
short-lived parentslong-lived parents
Linear Regression Line

Numerous studies showed that biological relatives of
centenarians have substantial survival
advantage compared to biological relatives of
shorter-lived individuals.

Who lives longer in centenarian families?
Siblings > Spouses > Siblings-in-law
Relatives:Men Women
N LS50* N LS50*
Parents 1590 76.2 1557 77.2
Spouses 877 75.4 283 81.4
Siblings 5324 77.6 4877 82.4
Siblings in law 2363 75.1 2410 79.5
1900 US birth cohort
73.3 79.4
*Mean lifespan conditional on survival to age 50
Relatives of 1,711 centenarians born in 1880-1895
Little is known about effects of centenarian’s
sex on longevity of relatives
In this study effects of centenarian’s sex were used to explore genetic and
environmental effects on longevity

Dataset
We have developed and analyzed a new computerized database on 1,711 validated centenarians born in 1880-1895 in the the United States, their parents and 13,185 shorter-lived siblings.

Methods
Gompertz multivariate regression models were used to model survival time between age 50 and death for centenarian siblings. Models for brothers and sisters were analyzed separately. Student t-test was used to compare mean life spans.
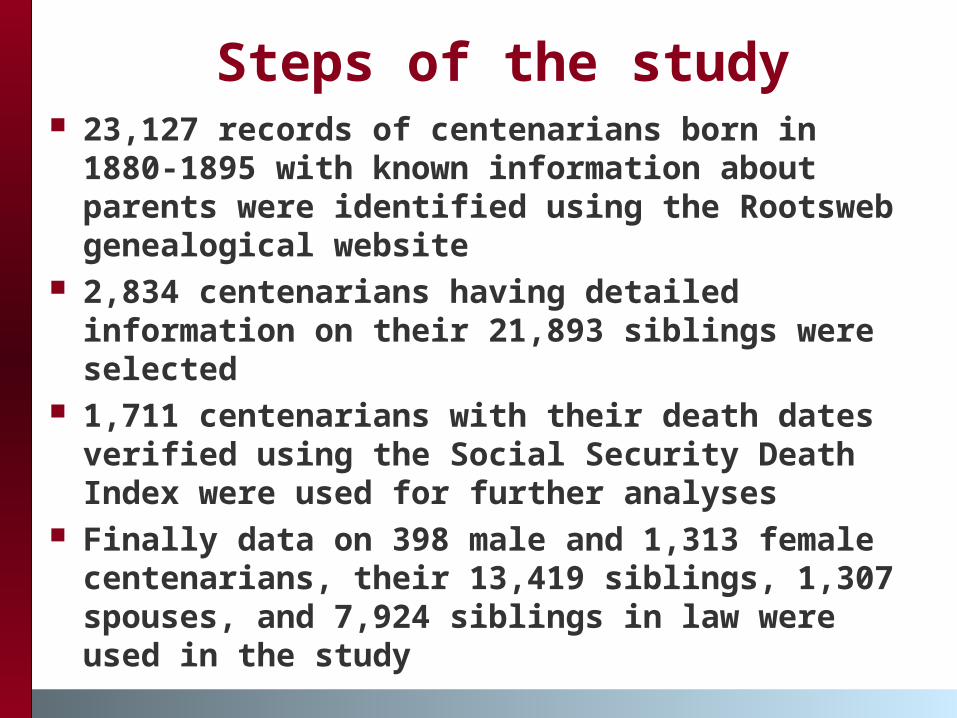
Steps of the study 23,127 records of centenarians born in
1880-1895 with known information about parents were identified using the Rootsweb genealogical website
2,834 centenarians having detailed information on their 21,893 siblings were selected
1,711 centenarians with their death dates verified using the Social Security Death Index were used for further analyses
Finally data on 398 male and 1,313 female centenarians, their 13,419 siblings, 1,307 spouses, and 7,924 siblings in law were used in the study
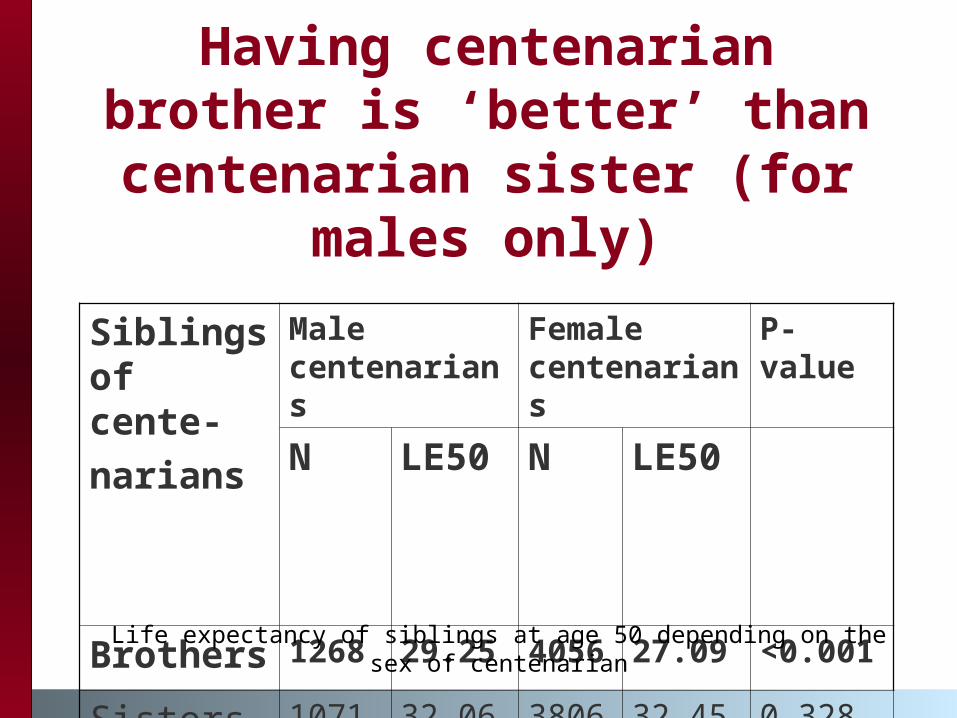
Having centenarian brother is ‘better’ than centenarian sister (for
males only)
Siblings of cente-narians
Male centenarians
Female centenarians
P-value
N LE50 N LE50
Brothers
1268 29.25 4056
27.09 <0.001
Sisters 1071 32.06 3806 32.45 0.328
Life expectancy of siblings at age 50 depending on the sex of centenarian

Survival of male siblings of centenarians, by sex of
centenarian
0.2
.4.6
.81
surv
ival
40 60 80 100 120age
Male cent. Female cent.
Male siblings

Male centenarians
Female centenarians
P-value
N LE50 N LE50
Fathers 374 27.22 1216
25.93 0.023
Mothers 362 27.97 1195 27.03 0.176Life expectancy of parents at age 50 depending on the sex of centenarian
Having centenarian son is ‘better’ than centenarian
daughter (for fathers only)

Male sex of centenarian is ‘better’ for brother’s longevity
Gomperz hazard regression model for survival of brothers of centenarians after age 50. N=5,287
CovariateHazar
d ratio
95% CIP-
value
Father lived 80+
0.8830.836-0.933
<0.001
Mother lived 80+
0.9300.881-0.982
0.009
Married 0.9130.843-0.988
0.025
Birth Year 1.0031.001-1.006
0.011
Female sex of centenarian
1.1721.100-1.249
<0.001

Sex of centenarian is not important for sister’s longevity
Gomperz hazard regression model for survival of sisters of centenarians after age 50. N=4,849
CovariateHazar
d ratio
95% CIP-
value
Father lived 80+ 0.978 0.924-1.035 0.443
Mother lived 80+
0.9310.879-0.985
0.013
Married 0.975 0.895-1.062 0.563
Birth Year 0.9960.994-0.999
0.013
Female sex of centenarian
1.019 0.952-1.091 0.590

Sex-specific Survival Threshold (SSST)
Hypothesis
Because of male and female centenarians have
different survival threshold to reach age
100, sex-specific effects are observed

Test of the SSST hypothesis
Compare siblings of male centenarians to siblings of
females survived to age 103 Probability of survival to 103 for females is similar to probability
of reaching age 100 for males (according to the 1900 U.S.
cohort)
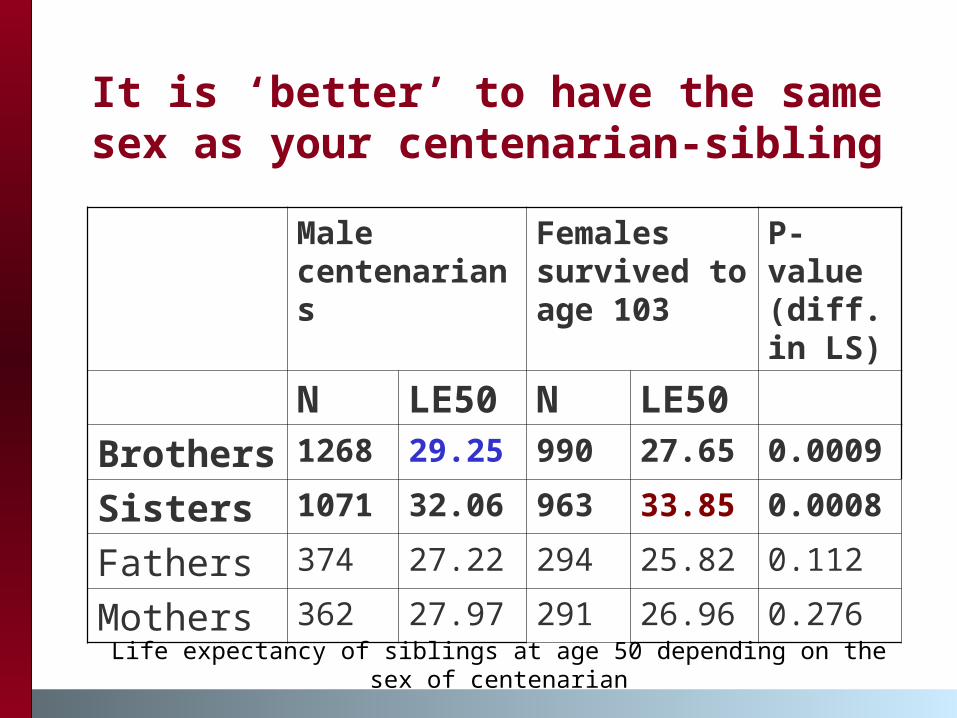
It is ‘better’ to have the same sex as your centenarian-sibling
Male centenarians
Females survived to age 103
P-value (diff.in LS)
N LE50 N LE50
Brothers
1268 29.25 990 27.65 0.0009
Sisters 1071 32.06 963 33.85 0.0008
Fathers 374 27.22 294 25.82 0.112
Mothers 362 27.97 291 26.96 0.276Life expectancy of siblings at age 50 depending on the sex of centenarian

SSST Hypothesis is confirmedfor brothers of centenarians
Gomperz hazard regression model for survival of male centenarian brothers and brothers of females
lived 103+ years after age 50. N=2,243
CovariateHazar
d ratio
95% CIP-
value
Father lived 80+
0.8990.826-0.978
0.013
Mother lived 80+
0.9100.837-0.990
0.027
Married 0.926 0.822-1.043 0.209
Birth Year 1.0051.001-1.009
0.025
Female sex of centenarian
1.064 0.978-1.157 0.147

SSST Hypothesis is NOT confirmed for sisters of
centenarians: sex is still important
Gomperz hazard regression model for survival of male centenarian sisters and sisters of females
lived 103+ years after age 50. N=2,022
CovariateHazar
d ratio
95% CIP-
value
Father lived 80+ 0.984 0.901-1.075 0.727
Mother lived 80+
0.8950.820-0.978
0.014
Married 1.028 0.896-1.179 0.695
Birth Year 0.996 0.991-1.001 0.113
Female sex of centenarian
0.8580.786-0.937
0.001
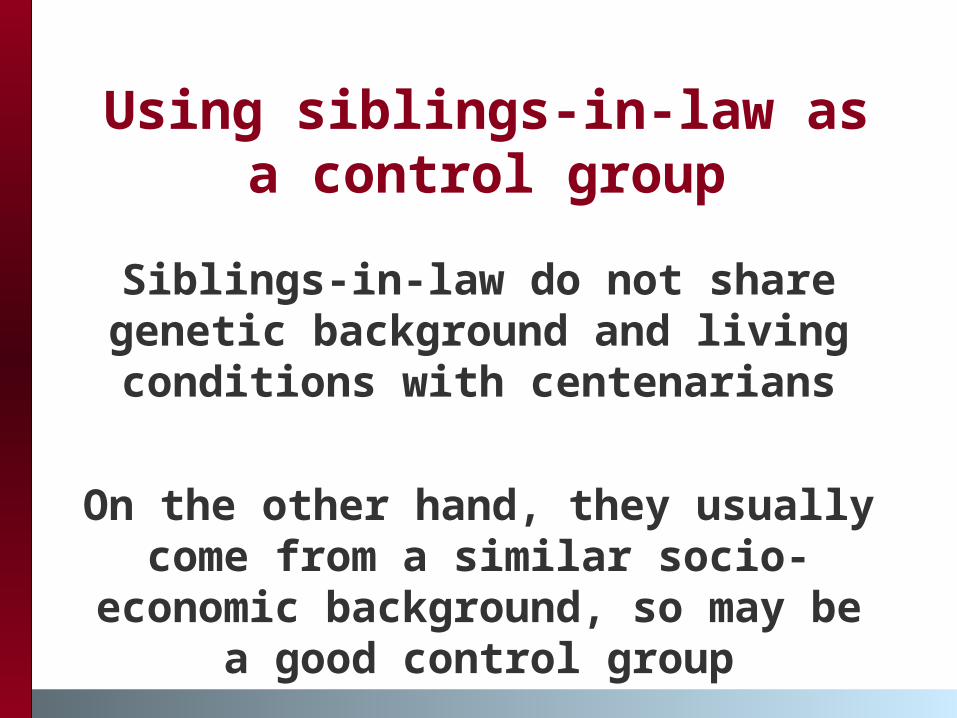
Using siblings-in-law as a control group
Siblings-in-law do not share genetic background and living conditions with centenarians
On the other hand, they usually come from a similar socio-
economic background, so may be a good control group

Sex of centenarian is important for siblings but not for siblings-
in-law
Married relatives:
Male centenarians
Females centenarians
P-value
N LE50 N LE50
Brothers 784 29.53 2437 27.12
<0.001
Sisters 650 31.36 2378 32.40
0.045
Brothers in law
492 24.95 1857 25.06 0.846
Sisters in law 611 29.22 1796 29.55 0.539
Life expectancy of relatives at age 50 depending on the sex of centenarian

Only women benefit from having centenarian spouse
Centenarian spouses
Sibling spouses
P-value
Sex of spouse
N LE50 N LE50
Men 875 25.40 2349 25.04 0.411
Men (married to 103+ centenarians)
214 25.36 2349 25.04 NS
Women 283 31.40 2407
29.46 0.007
Life expectancy of spouses at age 50 depending on the sex of centenarian

For sisters of centenarians father’s longevity becomes
unimportant
Gomperz hazard regression model for survival of centenarian sisters after age 50.
N=3,141
CovariateHazar
d ratio
95% CIP-
value
Father lived 80+ 1.005 0.933-1.081 0.902
Mother lived 80+
0.9230.858-0.993
0.032
Spouse lived 80+
0.9050.832-0.985
0.020
Birth Year 0.9940.990-0.997
0.001
Female sex of centenarian
0.975 0.893-1.065 0.577
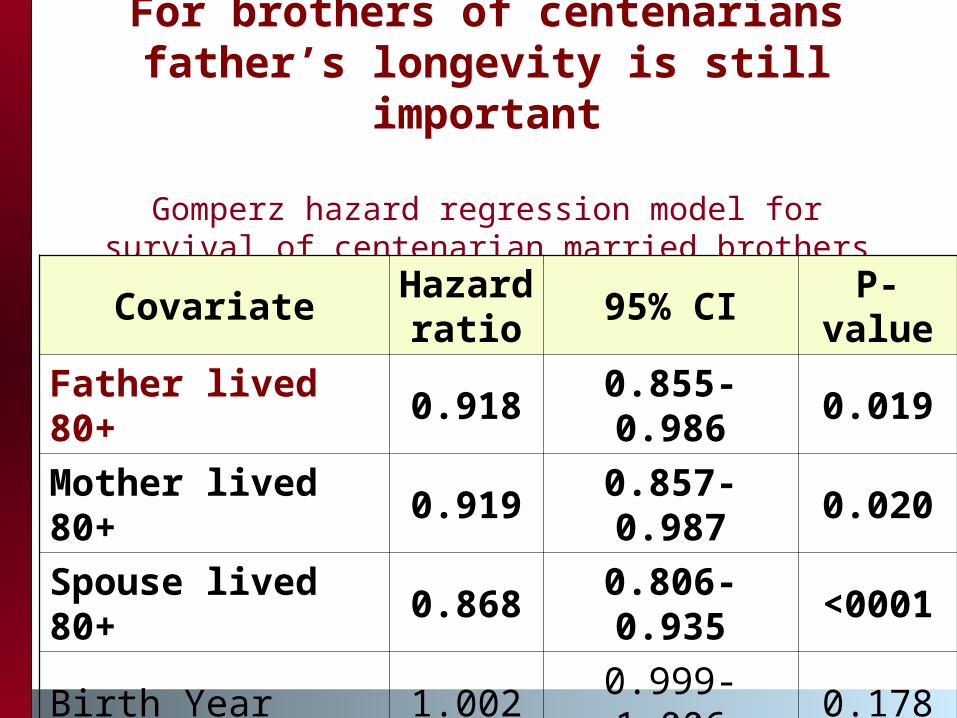
For brothers of centenarians father’s longevity is still
important
Gomperz hazard regression model for survival of centenarian married brothers after age 50.
N=3,141Covariate
Hazard
ratio95% CI
P-value
Father lived 80+
0.9180.855-0.986
0.019
Mother lived 80+
0.9190.857-0.987
0.020
Spouse lived 80+
0.8680.806-0.935
<0001
Birth Year 1.002 0.999-1.006 0.178
Female sex of centenarian
1.1831.090-1.284
<0001

Conclusion
Familial factors in human longevity are likely to be sex-specific.
Exploring complex environmental and genetic effects in longevity could be facilitated by further analysis of sex-specific effects

AcknowledgmentsThis study was made possible thanks to:
generous support from the National Institute on Aging
grant #R01AG028620

For More Information and Updates Please Visit Our Scientific and Educational
Website on Human Longevity:
http://longevity-science.org
And Please Post Your Comments at our Scientific Discussion Blog:
http://longevity-science.blogspot.com/

Exceptional longevity in a family of Iowa farmers
Father: Mike Ackerman, Farmer, 1865-1939 lived 74 years
Mother: Mary Hassebroek 1870-1961 lived 91 years
1. Engelke "Edward" M. Ackerman b: 28 APR 1892 in Iowa 101
2. Fred Ackerman b: 19 JUL 1893 in Iowa 1033. Harmina "Minnie" Ackerman b: 18 SEP 1895 in Iowa 1004. Lena Ackerman b: 21 APR 1897 in Iowa 1055. Peter M. Ackerman b: 26 MAY 1899 in Iowa 866. Martha Ackerman b: 27 APR 1901 in IA 957. Grace Ackerman b: 2 OCT 1904 in IA 1048. Anna Ackerman b: 29 JAN 1907 in IA 1019. Mitchell Johannes Ackerman b: 25 FEB 1909 in IA 85