fall 2017 career pathways and economic mobility
TRANSCRIPT

Career Pathways and Economic MobilityLos Angeles Regional Coalition
for Linked Learning
FALL 2017

01
02
03
Introduction 05Recommendations 06
OCCUPATIONAL GROWTH PROJECTIONS BY PATHWAY TYPEIntroduction and Methodology 09Agriculture and Natural Resources 11Arts, Media and Entertainment 13Building and Construction Trades 15Education, Child Development and Family Services 17Energy, Environment and Utilities 19Engineering and Architecture 21Fashion and Interior Design 23Finance and Business 25Health Science and Medical Technology 27Hospitality, Tourism and Recreation 31Information and Communications Technologies 33Manufacturing and Product Development 35Marketing, Sales and Service 37Public Services 39Transportation 41
Resources 44
Table of Contents

5
IntroductionLos Angeles Regional Coalition for Linked Learning (LARCLL) connects education, employers, and government to help create pathways for the region’s students that increase college completions and prepare them for the evolving workforce.
The Coalition serves as a champion for Linked Learning in the region, actively promoting its growth with schools, colleges, and employers; advocating for local and state policy change; and providing leadership by offering resources and best practices. The Coalition’s members work within the region’s cultural and socioeconomic diversity and policies to bring about true, transformative change to the region’s education system for the betterment of our students and our companies.
LARCLL’s member districts, committed to Linked Learning as their primary reform effort for secondary schools, offer over 80 career academies. Increasingly they are piloting Linked Learning efforts in middle schools. Linked Learning presents a viable and exciting opportunity to reinvent our high schools to better serve, support, engage, challenge and prepare all students—especially those who have been historically under-served. Linked Learning is an approach to high school that combines college-preparatory and career technical coursework with interdisciplinary, project-based learning, the kind of learning that is student-centered, collaborative and real-world. This approach further engages students than traditional models—and does not track students from an early age into either a career or a college track as tracking has historically been discriminatory in its practice. (In fact, the vocational education of 100 years ago was intended for children of immigrants and the working class.)
Linked Learning’s other two main components, work-based learning and personalized student supports, enrich and deepen the academic experience but also require the participation of community-based organizations, nonprofits, intermediaries, and employers to fully bring to life. Linked Learning brings together the collective wisdom of an academic community that has been moving for the last few decades in the direction of smaller academies, learning communities, and pilot schools. Many of those smaller schools have now become Linked Learning pathways, which are organized around a central career theme and which offer students a comprehensive and coherent high school experience—and, ultimately, a pathway to a career cluster, should they choose to pursue it, while also learning twenty-first century skills applicable to any career.
Through the California Community Colleges’ Guided Pathways program—and other local efforts—community colleges are designing pathways that both articulate
with high school programs and lead to credentials and transfers into higher degree programs at the state’s four-year institutions. Deeper relationships among academic institutions have been developing over the past four years with greater commitments to dual enrollment, industry certification, cohorting students into first-year experience programs, and co-designing engaging learning experiences for students.
This economic discussion is intended to help identify priority industry sectors that reflect significant regional and national workforce needs and to guide career academy design for optimal student outcomes. In its largest, most detail-oriented section, this report presents job projection data by Career Technical Education sectors, which represent the 15 largest industries in California. This report details which industries are projected to grow substantially and create demand for workers with certain kinds of training and education. National job growth data, projected out into 2026, provide a wider perspective as students who choose college or the military as postsecondary options may be more likely to move to other regions of the country.
We envision this report being useful to: • Schools transforming as they redesign programs
of study and select career themes with maximum benefit to their students.
• Community partners and local businesses tailoring their services, partnerships and advocacy efforts to increase opportunities for students around career awareness, exploration and preparation.
• Community organizations ensuring Linked Learning pathway implementation maximizes industry relevance and the economic growth of our citizens and neighborhoods.
• Students considering additional postsecondary study.
Linked Learning has the power to transform secondary education, create equitable access to college and career readiness for all students, and provide opportunity for students to imagine a broader future for themselves and to be prepared for entry-level positions in each industry. But Linked Learning cannot exist in a vacuum at each separate school or academy; its successful implementation demands community and industry involvement and collaboration. This report is intended as a tool to be used broadly in that effort.

RecommendationsThis report is intended to help identify industry sectors that reflect significant regional and national workforce needs and to provide target guidance for Linked Learning districts and academies. The stronger the connection between economic growth projections and Linked Learning curricula, the better students in Los Angeles County will be prepared to succeed in career and college.
For the high-growth industry sectors with substantial employee needs in the immediate and longer-term future, we recommend district and partner investment in pathway creation and support to mitigate the skills gap and supply the workforce the industries need:
• Education, Child Development, and Family Services• Finance and Business• Health Science and Medical Technology• Information and Communication Technologies• Information and Communication Technologies
The following sectors require thoughtful pathway creation as responding to specific industry growth areas demands more nuanced curriculum design, vigilance about rigor, and ambition for what is possible for students:
• Agriculture and Natural Resources• Arts, Media and Entertainment• Building and Construction Trades• Energy, Environment and Utilities• Engineering and Architecture• Hospitality, Tourism and Recreation• Manufacturing and Product Development• Public Service• Transportation
Low-growth sectors should not be invested in, even if they represent a larger industry in Los Angeles, as they are not the best, most beneficial choice for students.
• Fashion and Interior Design
Occupational Growth Projections by Pathway Type
6

9
This discussion is organized by the 15 industry sectors identified by the state of California and adopted by the California Department of Education and explores the extent to which each offers career growth and opportunity for its students regionally and nationally. Linked Learning pathway types align with the 15 industry sectors and are based on Career Technical Education (CTE) designations; they do not cover every possible occupation, and in some ways they do not coordinate well with traditional career groupings, educational disciplines, or industry sectors. Also, many high school pathways do not adhere purely to just one sector: their fields of study and coursework often overlap with another—if not a third.
Readers searching for STEM occupations will find no such industry distinction; elements of science, technology, engineering and medicine are an integral part of several industry sectors, depending on occupational function and responsibilities. Strong Linked Learning programs integrate STEM throughout their curricula.
The CTE designations complicate job projection analysis, as do the somewhat different systems of occupational category between the California Employment Development Department (EDD) and the U.S. Bureau of Labor Statistics (BLS). While it is impossible to synergize federal and state occupational data by industry cluster via CTE sector designations, it is possible to assign individual occupations to different CTE designations/pathway types as a way to show varied opportunities for students by education level, median salary, and growth projections. Some pathway types are further illustrated with sample career ladders.
Worthy of note is that industries reflective of our region’s more global economy, like global trade logistics, are not reflected in the more traditional-career oriented
job projection data or in the CTE sector designations, which might deter pathways from exposing students to careers in this rich and growing field for Los Angeles. Goods movement and warehousing are perhaps not that interesting to high school students, but it is possible now to earn an undergraduate degree in supply chain management at 40 institutions. According to a 2013 report from the National Center for Supply Chain Technology Education, the 625 “employers surveyed project an increase of 30%, or an additional 61,000 jobs in 24 months” for the relatively new career of supply chain technician, which requires workers to be highly trained to operate robotics and conveyor systems, skills that may be more traditionally categorized in engineering or manufacturing.1
2026 job growth projections from the BLS are included on the national level, with both number of new jobs projected, via replacement and growth, and the overall percentage of growth for the ten-year period from 2016-2026.2 Los Angeles County job growth projections from the EDD are included for the ten-year period ending in 2024.3 Readers will note that while some occupations show above average growth (15% and above), their actual numbers are quite small—and vice versa: some show average (8-14%) or below average (less than 7%) growth but actually show very large numbers. Above average growth is noted in green, as are particularly large numbers. Lastly, local opportunities for apprenticeship programs are noted when germane with an asterisk next to the “apprenticeship” requirement on the national charts. (These are most commonly noted for Building Trades & Construction.)
Introduction and MethodologyThe following discussion is meant to guide both future pathway creation and curricula; it may also be used in other ways to serve students, from guiding articulation conversations with local colleges to exploring more varied ideas of work-based learning.

OccupationRequired
Education
2016 Median
Salary (U.S.)
Projected 2026 Job
Growth (U.S.)
Agricultural & Food Scientists Bachelor’s 62,920 3,200 7%
Agricultural & Food Service Technicians Associate’s 37,550 1,700 6%
Agricultural Workers On-the-job Training 22,540 -100 0%
Biochemists & Biophysicists Doctorate 82,180 3,600 11%
Biological Technicians Bachelor’s 42,520 8,400 10%
Butchers On-the-job Training 29,870 7,700 6%
Cartographers & Photogrammetrists Bachelor’s 62,750 2,400 19%
Conservation Scientists & Foresters Bachelor’s 60,610 2,100 6%
Farmers, Ranchers & Other Agricultural Managers
High School 66,360 68,700 7%
Firefighters Certificate & Training 48,030 23,600 7%
Fishers and Hunting Workers On-the-job Training 29,280 2,000 7%
Forest & Conservation Workers On-the-job Training 26,940 -200 -1%
Geographers Bachelor’s 74,260 100 6%
Grounds Maintenance Workers On-the-job Training 26,830 133,400 10%
Landscape Architects Bachelor’s 63,480 1,500 6%
Logging Workers On-the-job Training 37,590 -3,800 -7%
Microbiologists Bachelor’s 66,850 1,900 8%
Natural Sciences Managers Bachelor’s 119,850 5,600 10%
Pest Control Workers High School 33,040 6,300 8%
Urban & Regional Planners Master’s 70,020 4,600 13%
11
Agriculture and Natural Resources
By sheer number of jobs, the strongest area of growth in this sector will be of grounds maintenance workers, followed by firefighters. Agriculture in general will suffer tough declines and low growth. Pathways would do well to prepare students for careers that demand serious science knowledge and skills by way of ensuring their agricultural curricula are heavy in the natural sciences. Agricultural innovations in soil and water management, for example, will call for employees with higher skills in science.
a. Agricultural Business b. Agricultural Mechanics c. Agriscience d. Animal Science
e. Forestry and Natural Resources f. Ornamental Horticulture g. Plant and Soil Science

OccupationProjected 2024 Los Angeles
County Job Growth
Biochemists & Biophysicists 100 22%
Biological Technicians 190 11.2%
Cartographers & Photogrammetrists 90 32.1%
Firefighters 610 8%
Geological & Petroleum Technicians 230 18.9%
Geoscientists 150 22.4%
Grounds Maintenance Workers, , Landscaping & Groundskeeping Workers 9,480 18.2%
Microbiologists 80 13.1%
Natural Sciences Managers 180 17.5%
Pest Control Workers 110 5.7%
OccupationRequired
Education
2016 Median
Salary (U.S.)
Projected 2026 Job Growth
(U.S.)
Actors On-the-job Training N/A 7,500 12%
Announcers Bachelor’s 30,830 -4,100 -8%
Art Directors Bachelor’s 89,820 6,700 7%
Audio & Video Equipment Technicians Certificate 42,230 10,700 13%
Broadcast News Analysts Bachelor’s 56,680 -100 -1%
Broadcast Technicians Associate’s 38,550 -1,100 -3%
Camera Operators Bachelor’s 55,080 1,600 6%
Choreographers On-the-job Training N/A 200 3%
Craft and Fine Artists On-the-job Training 48,780 4,100 8%
Curators Master’s 53,360 1,700 14%
Dancers On-the-job Training N/A 700 5%
Desktop Publishers Associate’s 41,090 -2,000 -14%
Drafters Associate’s 53,480 14,500 7%
Editors Bachelor’s 57,210 -100 0%
Film & Video Editors Bachelor’s 62,760 5,600 16%
Graphic Designers Bachelor’s 47,640 12,500 5%
Industrial Designers Bachelor’s 67,790 2,000 5%
Multimedia Artists & Animators Bachelor’s 65,300 7,700 10%
Museum Technicians & Conservators Master’s 40,040 1,500 12%
Music Directors & Composers Bachelor’s 50,110 4,600 6%
Musicians & Singers On-the-job Training N/A 11,300 7%
Photographers On-the-job Training 34,070 -12,400 -8%
Producers & Directors Bachelor’s 70,950 16,100 12%
Public Relations Specialists Bachelor’s 58,020 23,300 9%
Reporters & Correspondents Bachelor’s 37,820 -4,800 -11%
Sound Engineering Technicians Certificate 53,680 1,100 6%
Writers & Authors Bachelor’s 61,240 11,000 8%
Arts, Media and Entertainment
While there is no doubt of this pathway type’s ability to attract and engage students, the growth of Arts, Media and Entertainment Linked Learning pathways must be curbed. This is both because of below-average job growth projections for the sector as a whole and because of an overrepresentation of pathways in this sector. Existing digital media pathways do offer students better preparation for market demand, and performing arts pathways that combine artistic with technical curricula offer strong preparation.
a. Design, Visual, and Media Arts b. Performing Arts
c. Production and Managerial Arts d. Game Design and Integration
1312

OccupationProjected 2024 Los Angeles
County Job Growth
Art Directors 430 6.1%
Audio & Video Equipment Technicians 1,200 14.3%
Camera Operators, Television, Video, and Motion Picture 120 2.0%
Commercial & Industrial Designers 10 0.5%
Curators 90 23.7%
Desktop Publishers -120 -20.3%
Film & Video Editors 1,630 11.7%
Fine Artists, including Painters & Sculptors 340 11.8%
Graphic Designers 1,120 8.9%
Makeup Artists, Theatrical & Performance 340 21.8%
Multimedia Artists & Animators 640 5.1%
Museum Technicians & Conservators 170 24.3%
Postsecondary Art, Drama & Music Teachers 1,070 19.1%
Prepress Technicians & Workers -310 -26.7%
Public Relations Specialists 1,410 19%
Set & Exhibit Designers 290 10.9%
Sound Engineering Technicians 180 5.3%
Occupation Required Education2016 Median
Salary (U.S.)
Projected 2026 Job
Growth (U.S.)
Carpenters Apprenticeship* 43,600 87,000 8%
Cement Masons & Concrete Finishers Apprenticeship* 39,180 22,600 13%
Construction & Building Inspectors High School 58,480 10,500 10%
Construction Equipment Operators Apprenticeship 45,040 52,800 12%
Construction Laborers & Helpers 160 Hours of Basic Training 32,230 183,400 13%
Construction Managers Bachelor’s 89,300 46,100 11%
Drywall & Ceiling Tile Installers On-the-job Training/Apprenticeship* 41,090 1,400 1%
Electricians Apprenticeship* 52,720 60,100 9%
Elevator Installers & Repairers Apprenticeship* 78,890 2,700 12%
Glaziers Apprenticeship* 41,920 5,300 11%
Hazardous Materials Removal Workers On-the-job Training 40,640 7,900 17%
Insulation Workers On-the-job Training 39,280 3,200 5%
Masons (Brick, Block & Stone) Apprenticeship 41,330 34,500 12%
Painters On-the-job Training/Apprenticeship* 37,570 23,400 6%
Plumbers, Pipefitters & Steamfitters Apprenticeship* 51,450 75,800 16%
Roofers On-the-job-Training/Apprenticeship* 37,760 16,500 11%
Sheet Metal Workers Apprenticeship* 46,940 12,000 9%
Solar Photovoltaic Installers On-the-job Training 39,240 11,900 105%
Structural Iron & Steel Workers Apprenticeship* 50,830 11,400 13%
Surveying & Mapping Technicians On-the-job Training 42,450 6,400 11%
Surveyors Bachelor’s or Apprenticeship* 59,390 5,000 11%
Tile & Marble Setters On-the-job Training/Apprenticeship* 40,460 5,800 10%
Urban & Regional Planners Master’s 70,020 4,600 13%
Welders, Cutters, Solderers & Brazers On-the-job Training/Apprenticeship* 39,390 22,200 5%
Building and Construction Trades:
This is a sector of growth for both the U.S. and LA County over the next decade because it mirrors growth in other sectors. For example, as we build hospitals to meet increased health care needs, we need a trained workforce in many occupations in this industry. We urge the thoughtful creation of Building and Construction Trades pathways to meet heavy demand in this sector. Districts and partners must ensure that these pathways offer students rigorous, integrated experiences which prepare them for both college and career and that they do not reflect lower expectations of lower-income teenagers. Also, note on the chart the number of apprenticeship programs available locally.
a. Cabinetry, Millwork, and Woodworking b. Engineering and Heavy Construction
c. Mechanical Systems Installation and Repair d. Residential and Commercial Construction
1514

OccupationProjected 2024 Los Angeles
County Job Growth
Carpenters 4,090 19.6%
Cement Masons & Concrete Finishers 800 26%
Construction & Building Inspectors 220 10.5%
Construction Managers 1,410 14.4%
Drywall & Ceiling Tile Installers 980 27.7%
Fence Erectors 100 16.4%
Glaziers 200 23.3%
Helpers, Brickmasons & Tile Setters 220 39.3%
Helpers, Carpenters 110 25%
Helpers, Electricians 230 20.7%
Helpers, Painters, Paperhangers & Plasterers 180 31%
Masons (Brick, Block & Stone) 380 40.9%
Paving, Surfacing & Tamping Equipment Operators 70 17.5%
Plasterers & Stucco Masons 370 19.7%
Plumbers, Pipefitters & Steamfitters 1,610 19.1%
Reinforcing Iron & Rebar Workers 270 44.3%
Structural Iron & Steel Workers 150 14.3%
Tile & Marble Setters 520 22.7%
Welders, Cutters, Solderers & Brazers 190 2.7%
EXAMPLE OF A BUILDING AND CONSTRUCTION CAREER PATH
Education, Child Development, and Family Services:
Occupation Required Education2016 Median
Salary (U.S.)
Projected 2026 Job
Growth (U.S.)Adult Literacy & High School Equivalency Diploma Teachers
Bachelor’s 50,650 -3,800 -6%
Career & Technical Education Teachers Bachelor’s 54,020 7,700 4%
Childcare Workers On-the-job Training 21,170 82,100 7%
Elementary Teachers Bachelor’s 55,490 116,300 7%
High School Teachers Bachelor’s 58,030 76,800 8%
Instructional Coordinators Master’s 62,460 16,500 10%
Librarians Master’s 57,680 12,400 9%
Library Technicians & Assistants Associate’s 28,440 18,800 9%
Middle School Teachers Bachelor’s 56,720 47,300 8%
Marriage & Family Therapists Master’s 49,170 8,400 20%
Postsecondary Education Administrators Master’s 90,760 18,000 10%
Postsecondary Teachers Master’s 75,430 197,500 15%
Preschool & Childcare Center Directors Bachelor’s 45,790 6,500 11%
Preschool Teachers Associate’s 28,790 50,100 10%
Principals Master’s 92,510 19,700 8%
Recreational Therapists Bachelor’s 46,410 1,300 7%
Rehabilitation Counselors Master’s 34,670 11,600 10%
School & Career Counselors Master’s 54,560 33,000 11%
Social & Community Service Managers Bachelor’s 64,680 23,100 16%
Social & Human Service Assistants On-the-job Training 31,810 63,900 16%
Social Workers Bachelor’s 46,890 102,100 15%
Special Education Teachers Bachelor’s 57,910 33,300 8%
Substance Abuse & Behavioral Disorder Counselors
On-the-job Training 41,070 20,400 20%
Teacher Assistants Postsecondary Classes 25,410 109,500 8%
Training & Development Managers Bachelor’s 105,830 3,600 10%
Training & Development Specialists Bachelor’s 59,020 32,500 11%
Education, Child Development and Family Services is an excellent pathway type for long-term career growth and development. By sheer numbers, teaching and related occupations offer students a wide range of choices. With our districts already experiencing teacher shortages, they should think about building their own pipelines; in this respect, districts enjoy a depth of knowledge about the sector, and a whole host of professionals to provide work-based learning. Regional postsecondary partners also welcome the building of pipeline academies into their teacher education programs.
a. Child Development b. Consumer Services
c. Education d. Family and Human Services
1716

EXAMPLE OF AN EDUCATION, CHILD DEVELOPMENT AND FAMILY SERVICES CAREER PATH
OccupationProjected 2024 Los Angeles
County Job Growth
Childcare Workers 2,240 8.7%
Instructional Coordinators 640 15.0%
Library Technicians 130 7.1%
Marriage & Family Therapists 910 30.5%
Postsecondary Teachers 11,800 19.9%
Preschool & Childcare Center Directors 160 8.1%
Preschool Teachers 940 7%
Primary, Secondary & Special Education Teachers 5,980 6.1%
Recreational Therapists 40 10.3%
Rehabilitation Counselors 410 14.2%
Social & Community Service Managers 940 22.3%
Social & Human Service Assistants 4,260 29.6%
Teacher Assistants 2,980 8%
Training & Development Managers 70 10.9%
Training & Development Specialists 950 16.8%
Energy, Environment and Utilities
OccupationRequired
Education
2016 Median
Salary (U.S.)
Projected 2026 Job Growth
(U.S.)
Electrical Line Installers & Repairers On-the-job Training 62,650 18,500 8%
Electricians Apprenticeship* 52,720 60,100 9%
Environmental Science & Protection Technicians
Associate’s 44,190 4,100 12%
Environmental Scientists & Specialists Bachelor’s 68,910 9,900 11%
Geological & Petroleum Technicians Associate’s 56,470 2,500 16%
Geoscientists Bachelor’s 89,780 4,500 14%
Heating, Air Conditioning & Refrigeration Mechanics & Installers
Certificate/Apprenticeship*
45,910 49,100 15%
Hydrologists Master’s 80,480 700 10%
Power Plant Operators On-the-job Training 74,690 500 1%
Nuclear Technicians Associate’s 79,140 0 1%
Physicists Doctorate 115,870 2,600 14%
Plumbers, Pipefitters & Steamfitters Apprenticeship* 51,450 75,800 16%
Power Distributor & Dispatchers On-the-job Training 81,900 -300 -3%
Power Plant Operators On-the-job Training 74,690 500 1%
Solar Photovoltaic Installers On-the-job Training 39,240 11,900 105%
Telecommunications Equipment Installers & Repairers
Certificate 53,640 -17,900 -8%
Water & Wastewater Treatment Plant & System Operators
On-the-job Training 45,760 -3,800 -3%
Wind Turbine Technicians Certificate 52,260 5,500 96%
Overall, there is a lack of job growth in this sector for traditional energy jobs, but not for green energy jobs. And as noted in the discussion of Agriculture and Natural Resources, if pathways can prepare students for college majors and careers involving the hard sciences, those students will fare better in the job market. Students will also fare better if energy is integrated with green building technology, with a curriculum as technical as possible.
a. Environmental Resources b. Energy and Power Technology c. Telecommunications
1918

OccupationProjected 2024 Los Angeles
County Job Growth
Electrical Line Installers & Repairers 570 3%
Environmental Scientists 590 20.4%
Helpers, Electricians 230 20.7%
Meter Readers -130 -14.8%
Plumbers, Pipefitters & Steamfitters 1,610 19.1%
Septic Tank Servicers & Sewer Pipe Cleaners 20 11.8%
Telecommunications Equipment Workers -60 -0.2%
Telecommunications Line Installers & Repairers 40 0.5%
Water & Wastewater Treatment Plant & System Operators 110 5%
Engineering and Architecture
Occupation Required Education 2016 Median Salary (U.S.)
Projected 2026 Job Growth (U.S.)
Aerospace Engineering & Operations Technicians Associate’s 68,020 800 7%
Aerospace Engineers Bachelor’s 109,650 4,200 6%
Architects Bachelor’s 76,930 5,100 4%
Architectural & Engineering Managers Bachelor’s 134,730 9,900 6%
Chemical Engineers Bachelor’s 98,340 2,500 8%
Chemical Technicians Associate’s 45,840 2,700 4%
Civil Engineering Technicians Associate’s 49,980 6,600 9%
Civil Engineers Bachelor’s 83,540 32,100 11%
Computer Hardware Engineers Bachelor’s 115,080 4,000 5%
Drafters Associate’s 53,480 14,500 7%
Electrical & Electronic Engineering Technicians Associate’s 62,190 2,800 2%
Electrical & Electronics Engineers Bachelor’s 96,270 21,200 7%
Electrical & Electronics Installers & Repairers Certificate 55,920 1,100 1%
Electro-mechanical Technicians Associate’s 55,610 500 4%
Environmental Engineering Technicians Associate’s 49,170 2,200 13%
Environmental Engineers Bachelor’s 84,890 4,400 8%
General Maintenance & Repair Workers On-the-job Training 36,940 112,700 8%
Health & Safety Engineers Bachelor’s 86,720 2,200 9%
Heating, Air Conditioning & Refrigeration Mechanics & Installers
Certificate/Apprenticeship* 45,910 49,100 15%
Industrial Designers Bachelor’s 67,790 2,000 5%
Industrial Engineering Technicians Associate’s 53,330 400 1%
Industrial Engineers Bachelor’s 84,310 25,100 10%
Landscape Architects Bachelor’s 63,480 1,500 6%
Marine Engineers & Naval Architects Bachelor’s 93,350 1,000 12%
Materials Engineers Bachelor’s 93,310 400 2%
Mechanical Engineering Technicians Associate’s 54,480 2,300 5%
Mechanical Engineers Bachelor’s 84,190 25,300 9%
Mining & Geological Engineers Bachelor’s 93,720 500 7%
Nuclear Engineers Bachelor’s 102,220 700 4%
Petroleum Engineers Bachelor’s 128,230 4,900 15%
Physicists Doctorate 115,870 2,600 14%
Technical Writers Bachelor’s 69,850 5,700 11%
National job growth projections for this sector are largely disappointing in terms of overall number, but there are large exceptions for specific types of engineers, like civil, the growth of which is connected to growth in the construction sector. Another disappointing aspect is the dearth of job opportunities in this sector for high school graduates, but many advanced manufacturing jobs require a similar skill set for entry-level positions.
a. Architectural Design b. Engineering Technology
c. Engineering Design d. Environmental Engineering
2120

OccupationProjected 2024 Los Angeles
County Job Growth
Aerospace Engineers -60 -1.4%
Chemical Engineers 70 14.3%
Civil Engineers 520 7%
Electrical Engineers 150 13.3%
Electronics Engineers -110 2%
Environmental Engineering Technicians 50 18.5%
Environmental Engineers 200 14.3%
Health & Safety Engineers 60 8%
Industrial Engineering Technicians -20 -2%
Materials Engineers 70 10.1%
Mechanical Engineering Technicians -30 -2.5%
Mechanical Engineers 460 7.3%
Petroleum Engineers -30 -2.4%
Physicists 70 17.1%
EXAMPLE OF AN ENGINEERING AND ARCHITECTURE CAREER PATH
Fashion and Interior Design
OccupationRequired
Education
2016 Median
Salary (U.S.)
Projected 2026 Job Growth
(U.S.)
Fashion Designers Bachelor’s 65,170 700 3%
Interior Designers Bachelor’s 49,810 3,300 5%
Jewelers & Precious Stone & Metal Workers High School 38,200 -1,200 -3%
Models High School 21,870 0 -1%
Fashion and Interior Design is such a low-growth sector that it is not the best, most beneficial choice for students.
a. Fashion Design and Merchandising b. Interior Design c. Personal Services
2322

OccupationProjected 2024 Los Angeles
County Job Growth
Fabric & Apparel Patternmakers -130 -10%
Fashion Designers 630 12.3%
Interior Designers 130 4.6%
Jewelers & Precious Stone & Metal Workers -300 -14.3%
Pressers, Textile & Garment -170 -8%
Sewing Machine Operators -5,490 -22.1%
Shoe & Leather Workers & Repairers -40 -29.2%
Tailors, Dressmakers & Custom Sewers -100 -7%
Textile Cutting Machine Workers -360 -18.3%
Textile Knitting & Weaving Machine Workers -610 -56%
Textile Winding & Twisting Machine Workers -60 -33.3%
Finance and Business
OccupationRequired
Education
2016 Median
Salary (U.S.)
Projected 2026 Job
Growth (U.S.)
Accountants & Auditors Bachelor’s 68,150 140,300 10%
Actuaries Bachelor’s 100,610 5,300 22%
Appraisers & Assessors of Real Estate Bachelor’s 51,850 11,600 14%
Bill & Account Collectors On-the-job Training 35,350 -9,100 -3%
Bookkeeping, Accounting & Auditing Clerks High School 38,390 -23,500 -1%
Budget Analysts Bachelor’s 73,840 3,800 7%
Claims Adjusters, Appraisers, Examiners & Investigators High School 63,670 -3,700 -1%
Compensation, Benefits & Job Analysis Specialists Bachelor’s 62,080 7,200 9%
Compensation & Benefits Managers Bachelor’s 116,240 800 5%
Cost Estimators Bachelor’s 61,790 23,000 11%
Economists Master’s 101,050 1,300 6%
Financial Analysts Bachelor’s 81,760 32,100 11%
Financial Clerks High School 38,080 128,200 9%
Financial Examiners Bachelor’s 79,280 5,100 10%
Financial Managers Bachelor’s 121,750 108,400 19%
Fundraisers Bachelor’s 54,130 13,200 15%
Human Resources Specialists Bachelor’s 59,180 38,700 7%
Human Resource Managers Bachelor’s 106,910 12,200 9%
Insurance Underwriters Bachelor’s 67,680 -5,400 -5%
Labor Relations Specialists Bachelor’s 62,310 -6,300 -8%
Loan Officers Bachelor’s 63,650 36,500 11%
Logisticians Bachelor’s 74,170 10,300 7%
Management Analysts Bachelor’s 81,330 96,500 12%
Personal Financial Advisors Bachelor’s 90,530 39,300 14%
Purchasing Managers, Buyers, & Purchasing Agents Bachelor’s 64,850 -16,400 -3%
Securities, Commodities, & Financial Services Sales Agents
Bachelor’s 67,310 23,000 6%
Tax Examiners, Collectors, & Revenue Agents Bachelor’s 52,060 -400 -1%
Tellers High School 27,260 -41,700 -8%
Training & Development Managers Bachelor’s 105,830 3,600 10%
Training & Development Specialists Bachelor’s 59,020 32,500 11%
The sector of Finance and Business is also a sustainable pathway. In both growth percentages and number of jobs to be filled over the next decade, business-focused pathways offer students opportunity and the highest ratio of ready-and-willing industry partners. Course offerings should include financial recordkeeping and accounting skills to align most usefully to regional workforce needs.
a. Business Management b. Financial Services c. International Business
2524
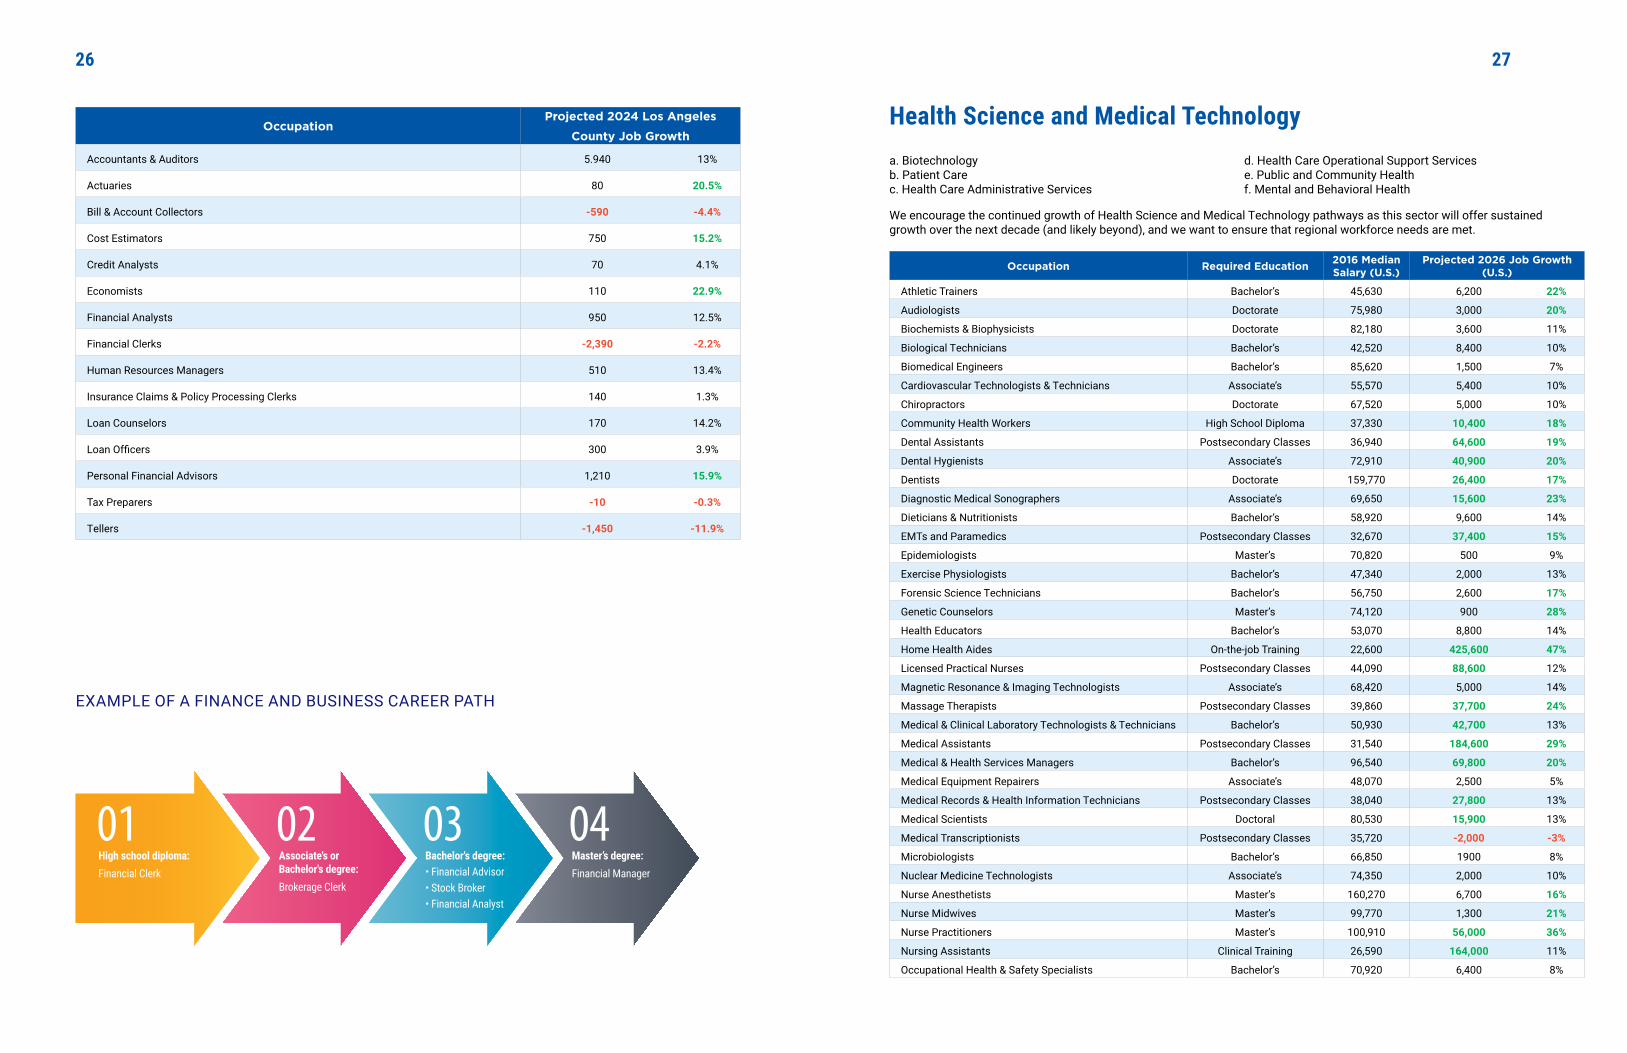
OccupationProjected 2024 Los Angeles
County Job Growth
Accountants & Auditors 5.940 13%
Actuaries 80 20.5%
Bill & Account Collectors -590 -4.4%
Cost Estimators 750 15.2%
Credit Analysts 70 4.1%
Economists 110 22.9%
Financial Analysts 950 12.5%
Financial Clerks -2,390 -2.2%
Human Resources Managers 510 13.4%
Insurance Claims & Policy Processing Clerks 140 1.3%
Loan Counselors 170 14.2%
Loan Officers 300 3.9%
Personal Financial Advisors 1,210 15.9%
Tax Preparers -10 -0.3%
Tellers -1,450 -11.9%
EXAMPLE OF A FINANCE AND BUSINESS CAREER PATH
Health Science and Medical Technology
Occupation Required Education 2016 Median Salary (U.S.)
Projected 2026 Job Growth (U.S.)
Athletic Trainers Bachelor’s 45,630 6,200 22%
Audiologists Doctorate 75,980 3,000 20%
Biochemists & Biophysicists Doctorate 82,180 3,600 11%
Biological Technicians Bachelor’s 42,520 8,400 10%
Biomedical Engineers Bachelor’s 85,620 1,500 7%
Cardiovascular Technologists & Technicians Associate’s 55,570 5,400 10%
Chiropractors Doctorate 67,520 5,000 10%
Community Health Workers High School Diploma 37,330 10,400 18%
Dental Assistants Postsecondary Classes 36,940 64,600 19%
Dental Hygienists Associate’s 72,910 40,900 20%
Dentists Doctorate 159,770 26,400 17%
Diagnostic Medical Sonographers Associate’s 69,650 15,600 23%
Dieticians & Nutritionists Bachelor’s 58,920 9,600 14%
EMTs and Paramedics Postsecondary Classes 32,670 37,400 15%
Epidemiologists Master’s 70,820 500 9%
Exercise Physiologists Bachelor’s 47,340 2,000 13%
Forensic Science Technicians Bachelor’s 56,750 2,600 17%
Genetic Counselors Master’s 74,120 900 28%
Health Educators Bachelor’s 53,070 8,800 14%
Home Health Aides On-the-job Training 22,600 425,600 47%
Licensed Practical Nurses Postsecondary Classes 44,090 88,600 12%
Magnetic Resonance & Imaging Technologists Associate’s 68,420 5,000 14%
Massage Therapists Postsecondary Classes 39,860 37,700 24%
Medical & Clinical Laboratory Technologists & Technicians Bachelor’s 50,930 42,700 13%
Medical Assistants Postsecondary Classes 31,540 184,600 29%
Medical & Health Services Managers Bachelor’s 96,540 69,800 20%
Medical Equipment Repairers Associate’s 48,070 2,500 5%
Medical Records & Health Information Technicians Postsecondary Classes 38,040 27,800 13%
Medical Scientists Doctoral 80,530 15,900 13%
Medical Transcriptionists Postsecondary Classes 35,720 -2,000 -3%
Microbiologists Bachelor’s 66,850 1900 8%
Nuclear Medicine Technologists Associate’s 74,350 2,000 10%
Nurse Anesthetists Master’s 160,270 6,700 16%
Nurse Midwives Master’s 99,770 1,300 21%
Nurse Practitioners Master’s 100,910 56,000 36%
Nursing Assistants Clinical Training 26,590 164,000 11%
Occupational Health & Safety Specialists Bachelor’s 70,920 6,400 8%
We encourage the continued growth of Health Science and Medical Technology pathways as this sector will offer sustained growth over the next decade (and likely beyond), and we want to ensure that regional workforce needs are met.
a. Biotechnology b. Patient Care c. Health Care Administrative Services
d. Health Care Operational Support Services e. Public and Community Health f. Mental and Behavioral Health
2726

Occupation Required Education2016 Median
Salary (U.S.)
Projected 2026 Job Growth
(U.S.)
Occupational Health & Safety Technicians On-the-job Training 48,820 1,700 10%
Occupational Therapists Master’s 81,910 27,700 21%
Occupational Therapy Aides On-the-job Training 28,330 1,800 25%
Occupational Therapy Assistants Associate’s 59,010 11,400 29%
Opticians, Dispensing On-the-job Training 35,530 11,300 15%
Optometrists Doctoral 106,140 7,000 17%
Orderlies High School 26,690 4,400 8%
Orthotists & Prosthetists Master’s 65,630 1,700 22%
Personal Care Aides On-the-job Training 21,920 754,000 37%
Pharmacists Doctoral 122,230 17,600 6%
Pharmacy Technicians On-the-job Training 30,920 47,600 12%
Phlebotomists Postsecondary Classes 32,710 30,000 24%
Physical Therapy Aides On-the-job Training 25,680 15,100 29%
Physical Therapy Assistants Associate’s 56,610 27,200 31%
Physical Therapists Doctoral 85,400 60,000 25%
Physician Assistants Master’s 101,480 39,700 37%
Physicians & Surgeons Doctoral 208,000 106,500 15%
Podiatrists Doctoral 124,830 1,100 10%
Psychiatric Aides High School 26,720 3,900 5%
Psychiatric Technicians Postsecondary Certificate 30,970 3,900 6%
Radiologic Technologists Associate’s 57,450 25,200 12%
Radiation Therapists Associate’s 80,160 2,300 12%
Recreational Therapists Bachelor’s 46,410 1,300 7%
Registered Nurses Associate’s 68,450 437,000 15%
Respiratory Therapists Associate’s 58,670 30,400 23%
Speech Language Pathologists Master’s 74,680 25,400 18%
Surgical Technologists Postsecondary Classes 45,160 12,600 12%
Veterinarians Doctoral 88,720 14,400 18%
Veterinary Assistants & Laboratory Animal Caretakers On-the-job Training 25,250 16,300 19%
Veterinary Technologists & Technicians Associate’s 32,490 20,400 20%
Zoologists & Wildlife Biologists Bachelor’s 60,520 1,500 8%
OccupationProjected 2024 Los Angeles County Job
Growth
Biomedical Engineers 190 31.1%
Dental Assistants 1,540 13.5%
Dieticians & Nutritionists 500 22.5%
Emergency Medical Technicians & Paramedics 800 22.7%
Exercise Physiologists 40 20%
Family & General Practitioners 650 10.5%
Healthcare Social Workers 1,040 23.7%
Health Educators 560 24.1%
Health Information Technicians 960 18.4%
Home Health Aides 8,390 21.2%
Licensed Vocational Nurses 4,370 20.8%
Medical & Health Services Managers 1,760 21.9%
Medical Assistants 5,440 24.3%
Medical Secretaries 3,820 18.9%
Medical Scientists, except Epidemiologists 680 14.5%
Mental Health Counselors 740 17.7%
Opticians, Dispensing 390 19.3%
Optometrists 300 21.6%
Personal Care Aides 96,900 51.9%
Pharmacists 640 7.7%
Pharmacy Aides 170 5.9%
Pharmacy Technicians 1,050 12.7%
Physical Therapists 1,170 24.4%
Physician Assistants 780 29.9%
Speech-Language Pathologists 460 17.5%
Surgeons 270 24.3%
Surgical Technologists 450 16.1%
Respiratory Therapists 770 17.7%
2928

EXAMPLE OF A HEALTH SCIENCE AND MEDICAL TECHNOLOGY CAREER PATH Hospitality, Tourism and Recreation
OccupationRequired
Education
2016 Median
Salary (U.S.)
Projected 2026 Job Growth
(U.S.)
Bakers High School 25,090 12,100 6%
Bartenders High School 20,800 15,100 2%
Chefs & Head Cooks High School 43,180 14,100 10%
Cooks High School 22,850 147,600 6%
Fitness Trainers & Instructors Certificate 38,160 29,300 10%
Food Preparation Workers High School 21,440 68,700 8%
Food Service Managers High School 50,820 27,300 9%
Lodging Managers High School 51,840 2,800 6%
Meeting, Convention & Event Planners Bachelor’s 47,350 11,800 10%
Recreation Workers Bachelor’s 23,870 33,300 9%
Travel Agents On-the-job Training 36,460 -7,500 -9%
Waiters & Waitresses High School 19,990 182,500 7%
Hospitality is a major industry of Los Angeles, but most of the job growth—the numbers are staggeringly high—is in the lower-skilled and lower-paid occupations of the sector. Artful pathway design should reflect a range of jobs in this field so students are prepared for both college and career.
a. Food Science, Dietetics and Nutrition b. Food Service and Hospitality c. Hospitality, Tourism and Recreation
3130
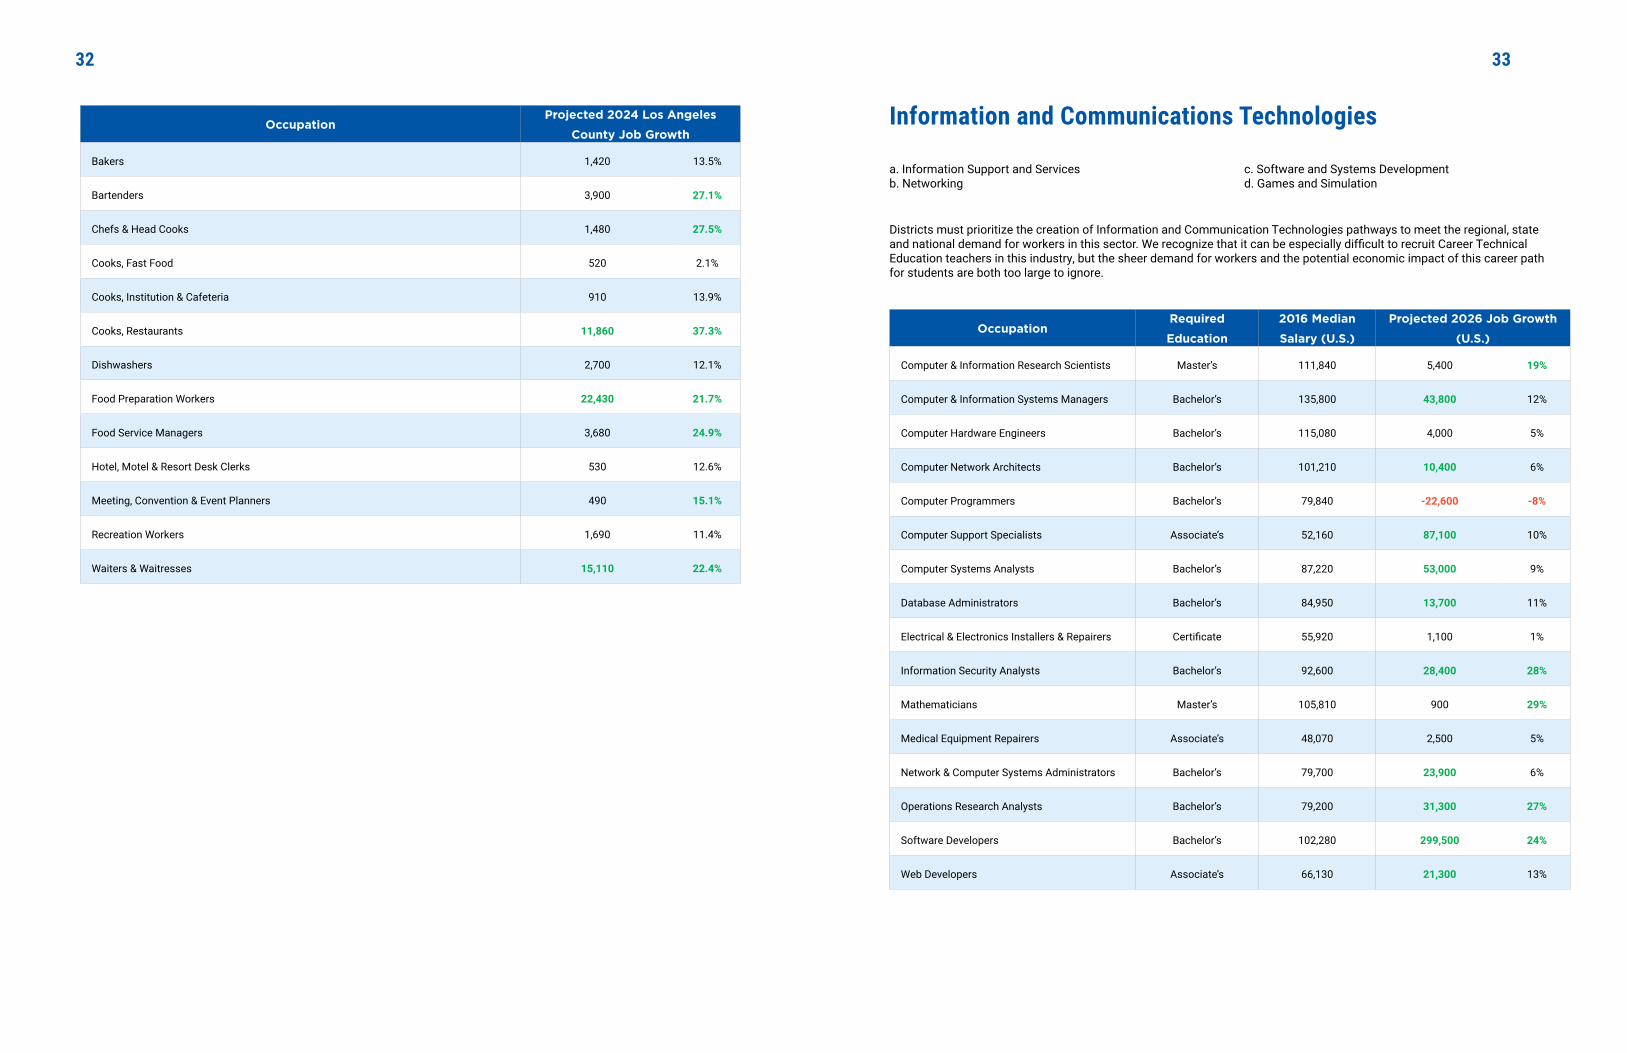
OccupationProjected 2024 Los Angeles
County Job Growth
Bakers 1,420 13.5%
Bartenders 3,900 27.1%
Chefs & Head Cooks 1,480 27.5%
Cooks, Fast Food 520 2.1%
Cooks, Institution & Cafeteria 910 13.9%
Cooks, Restaurants 11,860 37.3%
Dishwashers 2,700 12.1%
Food Preparation Workers 22,430 21.7%
Food Service Managers 3,680 24.9%
Hotel, Motel & Resort Desk Clerks 530 12.6%
Meeting, Convention & Event Planners 490 15.1%
Recreation Workers 1,690 11.4%
Waiters & Waitresses 15,110 22.4%
Information and Communications Technologies
OccupationRequired
Education
2016 Median
Salary (U.S.)
Projected 2026 Job Growth
(U.S.)
Computer & Information Research Scientists Master’s 111,840 5,400 19%
Computer & Information Systems Managers Bachelor’s 135,800 43,800 12%
Computer Hardware Engineers Bachelor’s 115,080 4,000 5%
Computer Network Architects Bachelor’s 101,210 10,400 6%
Computer Programmers Bachelor’s 79,840 -22,600 -8%
Computer Support Specialists Associate’s 52,160 87,100 10%
Computer Systems Analysts Bachelor’s 87,220 53,000 9%
Database Administrators Bachelor’s 84,950 13,700 11%
Electrical & Electronics Installers & Repairers Certificate 55,920 1,100 1%
Information Security Analysts Bachelor’s 92,600 28,400 28%
Mathematicians Master’s 105,810 900 29%
Medical Equipment Repairers Associate’s 48,070 2,500 5%
Network & Computer Systems Administrators Bachelor’s 79,700 23,900 6%
Operations Research Analysts Bachelor’s 79,200 31,300 27%
Software Developers Bachelor’s 102,280 299,500 24%
Web Developers Associate’s 66,130 21,300 13%
Districts must prioritize the creation of Information and Communication Technologies pathways to meet the regional, state and national demand for workers in this sector. We recognize that it can be especially difficult to recruit Career Technical Education teachers in this industry, but the sheer demand for workers and the potential economic impact of this career path for students are both too large to ignore.
a. Information Support and Services b. Networking
c. Software and Systems Development d. Games and Simulation
3332
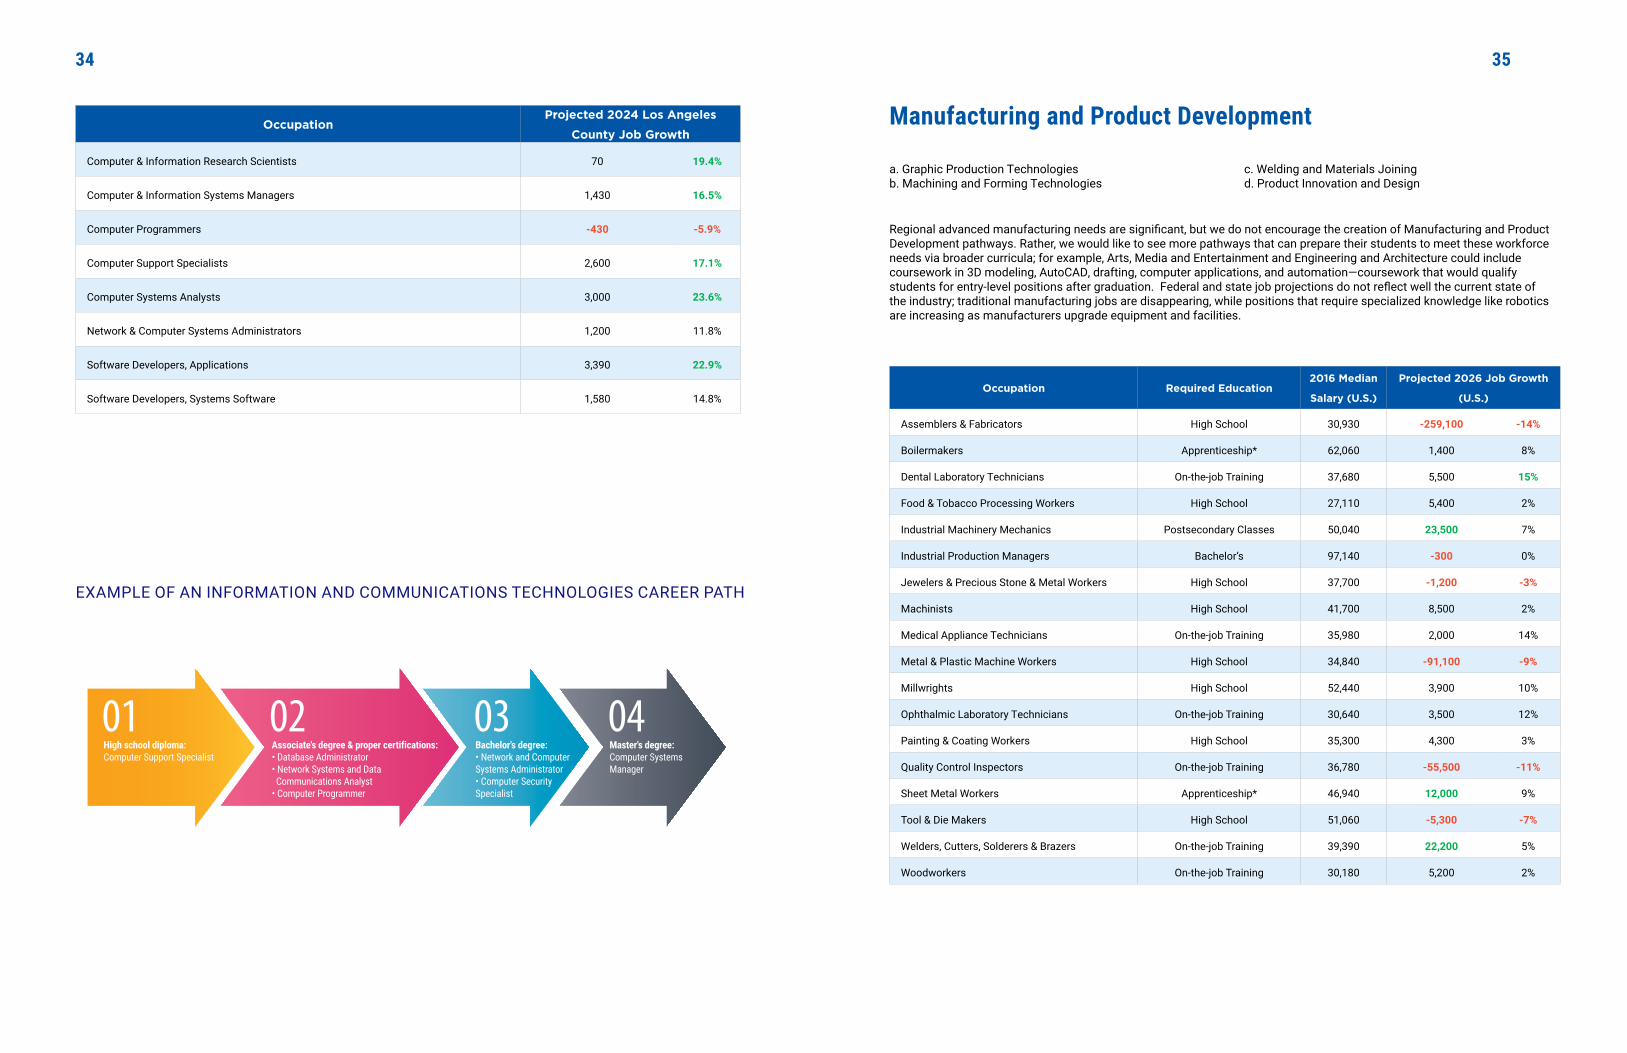
OccupationProjected 2024 Los Angeles
County Job Growth
Computer & Information Research Scientists 70 19.4%
Computer & Information Systems Managers 1,430 16.5%
Computer Programmers -430 -5.9%
Computer Support Specialists 2,600 17.1%
Computer Systems Analysts 3,000 23.6%
Network & Computer Systems Administrators 1,200 11.8%
Software Developers, Applications 3,390 22.9%
Software Developers, Systems Software 1,580 14.8%
EXAMPLE OF AN INFORMATION AND COMMUNICATIONS TECHNOLOGIES CAREER PATH
Manufacturing and Product Development
Occupation Required Education2016 Median
Salary (U.S.)
Projected 2026 Job Growth
(U.S.)
Assemblers & Fabricators High School 30,930 -259,100 -14%
Boilermakers Apprenticeship* 62,060 1,400 8%
Dental Laboratory Technicians On-the-job Training 37,680 5,500 15%
Food & Tobacco Processing Workers High School 27,110 5,400 2%
Industrial Machinery Mechanics Postsecondary Classes 50,040 23,500 7%
Industrial Production Managers Bachelor’s 97,140 -300 0%
Jewelers & Precious Stone & Metal Workers High School 37,700 -1,200 -3%
Machinists High School 41,700 8,500 2%
Medical Appliance Technicians On-the-job Training 35,980 2,000 14%
Metal & Plastic Machine Workers High School 34,840 -91,100 -9%
Millwrights High School 52,440 3,900 10%
Ophthalmic Laboratory Technicians On-the-job Training 30,640 3,500 12%
Painting & Coating Workers High School 35,300 4,300 3%
Quality Control Inspectors On-the-job Training 36,780 -55,500 -11%
Sheet Metal Workers Apprenticeship* 46,940 12,000 9%
Tool & Die Makers High School 51,060 -5,300 -7%
Welders, Cutters, Solderers & Brazers On-the-job Training 39,390 22,200 5%
Woodworkers On-the-job Training 30,180 5,200 2%
Regional advanced manufacturing needs are significant, but we do not encourage the creation of Manufacturing and Product Development pathways. Rather, we would like to see more pathways that can prepare their students to meet these workforce needs via broader curricula; for example, Arts, Media and Entertainment and Engineering and Architecture could include coursework in 3D modeling, AutoCAD, drafting, computer applications, and automation—coursework that would qualify students for entry-level positions after graduation. Federal and state job projections do not reflect well the current state of the industry; traditional manufacturing jobs are disappearing, while positions that require specialized knowledge like robotics are increasing as manufacturers upgrade equipment and facilities.
a. Graphic Production Technologies b. Machining and Forming Technologies
c. Welding and Materials Joining d. Product Innovation and Design
3534

OccupationProjected 2024 Los Angeles County Job
Growth
Assemblers & Fabricators -1,720 -4.7%
Computer-controlled Machine Tool Operators 620 16.8%
Dental Laboratory Technicians 130 11.9%
Electrical & Electronic Equipment Assemblers 570 3%
Food Processing Workers 2,450 9.3%
Industrial Machinery Mechanics 1,530 23.3%
Industrial Production Managers -380 -7.6%
Jewelers & Precious Stone & Metal Workers -300 -14.3%
Machinists 740 7.9%
Metal & Plastic Workers -50 -27.8%
Millwrights 120 21.1%
Ophthalmic Laboratory Technicians 40 12.1%
Packing & Filling Machine Workers 480 3.9%
Printing Workers -1,410 -15.7%
Rolling Machine Workers -120 -13.8%
Semiconductor Processors -140 -20%
Separating & Filtering Machine Workers 20 2%
Tool & Die Makers -190 -15.2%
Welders, Cutters, Solderers & Brazers 190 2.7%
Woodworkers 370 7.2%
Marketing, Sales and Service
Occupation Required Education2016 Median
Salary (U.S.)
Projected 2026 Job Growth
(U.S.)
Advertising & Promotions Managers Bachelor’s 100,810 1,800 6%
Advertising Sales Agents On-the-job Training 50,380 -4,400 -3%
Cashiers High School 20,180 -29,500 -1%
Customer Service Representatives On-the-job Training 32,300 136,000 5%
Flight Attendants On-the-job Training 48,500 11,900 10%
Insurance Sales Agents On-the-job Training 49,990 48,600 10%
Marketing Managers Bachelor’s 131,180 21,800 10%
Market Research Analysts Bachelor’s 62,560 136,000 23%
Real Estate Brokers & Agents Licensure/Formal Training 46,410 26,900 6%
Retail Sales Workers High School 22,900 100,900 2%
Sales Engineers Bachelor’s 100,000 5,200 7%
Sales Managers Bachelor’s 117,960 28,400 7%
Sales Representatives, Wholesale & Manufacturing, Technical & Scientific Products
Bachelor’s 78,980 18,700 5%
Sales Representatives, Wholesale & Manufacturing, Except Technical & Scientific Products
On-the-job Training 57,140 81,100 6%
Securities, Commodities, & Financial Services Sales Agents
Bachelor’s 67,310 23,000 6%
Travel Agents On-the-job Training 36,460 -7,500 -9%
Marketing, Service and Sales pathways could be expanded as there will be plenty of job growth, both nationally and locally, to support students’ many levels of career aspiration. Curricula should offer students industry-recognized credentials and employability wherever possible instead of overly focusing on entrepreneurship.
a. Marketing b. Professional Sales c. Entrepreneurship/Self-employment
3736

OccupationProjected 2024 Los Angeles County Job
Growth
Advertising & Promotions Managers 240 16.2%
Advertising Sales Agents 450 5.5%
Cashiers 7,300 7.5%
Customer Service Representatives 5,000 8.9%
Demonstrators & Product Promoters 180 3.8%
Insurance Sales Agents 200 2%
Merchandise Displayers & Window Trimmers 120 4.9%
Retail Salespersons 11,150 9.6%
Retail Sales Supervisors 2,350 8%
Sales Engineers 310 12.7%
Sales Managers 1,450 8.2%
Sales Representatives, Technical & Scientific 840 9.3%
Sales Representatives, Wholesale & Manufacturing 3,260 7.3%
Stock Clerks & Order Fillers 6,140 10.3%
Public Services
Occupation Required Education2016 Median
Salary (U.S.)
Projected 2026 Job Growth
(U.S.)
Arbitrators, Mediators & Conciliators Bachelor’s 59,770 900 11%
Correctional Officers On-the-job Training 42,820 -34,500 -8%
Court Reporters Certificate 51,320 600 3%
EMTs and Paramedics Postsecondary Classes 32,670 37,400 15%
Firefighters Certificate & Training 48,030 23,600 7%
Fire Inspectors & Investigators On-the-job Training 56,130 1,400 10%
Judges & Hearing Officers Doctorate 109,940 2,200 5%
Lawyers Doctorate 118,160 74,800 9%
Paralegals & Legal Assistants Associate’s 49,500 41,800 15%
Police & Detectives Training Academy 61,600 53,400 7%
Police, Fire & Ambulance Dispatchers On-the-job Training 38,870 8,200 8%
Political Scientists Master’s 114,290 200 2%
Private Detectives & Investigators On-the-job Training 48,190 4,300 10%
Probation Officers & Correctional Treatment Specialists
Bachelor’s 50,160 5,200 6%
Postal Service Workers Exam & On-the-job Training 56,790 -65,300 -13%
Security Guards On-the-job Training 25,770 70,700 6%
Gaming Surveillance Officers On-the-job Training 32,630 400 4%
Social Workers Bachelor’s 46,890 102,100 15%
Sociologists Master’s 79,750 0 0%
Statisticians Master’s 80,500 12,400 33%
Survey Researchers Master’s 54,470 100 1%
The Public Services sector offers a mixed job-growth picture. Thoughtfully designed curricula could mitigate any ill effects of the negative growth occupations. We recommend a more calculated growth pattern for this type of pathway focusing on legal and emergency services only.
a. Public Safety b. Emergency Response c. Legal Practices
3938

OccupationProjected 2024 Los Angeles County Job
Growth
Arbitrators, Mediators & Conciliators 70 8.1%
Court Reporters 100 9.4%
Eligibility Interviewers, Government 460 5.7%
Firefighters 530 7%
Information & Records Clerks 11,080 7.6%
Law Enforcement Workers 1,680 5.3%
Lawyers 1,900 6.3%
Paralegals & Legal Assistants 740 9%
Postal Service Clerks -330 -17.6%
Postal Service Mail Processors -1,120 -26.2%
Public Safety Dispatchers -30 -2.7%
Security Guards 7,980 15.5%
Statisticians 310 44.3%
Survey Researchers 90 12%
Transportation
Occupation Required Education2016 Median
Salary (U.S.)
Projected 2026 Job Growth
(U.S.)
Air Traffic Controllers Associate’s 122,410 900 3%
Aircraft Mechanics & Service Technicians Certificate & Training 60,170 6,400 5%
Airline Pilots, Co-Pilots, & Flight Engineers Bachelor’s 127,820 2,900 3%
Automotive Body & Glass Repairers On-the-job Training 40,370 15,200 8%
Automotive Service Technicians & Mechanics Postsecondary Classes 38,470 47,600 6%
Avionics Technicians Associate’s 60,760 1,100 6%
Bus Drivers High School 31,920 42,500 6%
Commercial Pilots License Training 77,200 1,500 4%
Delivery Truck Drivers High School 28,390 59,300 4%
Diesel Service Technicians & Mechanics On-the-job Training 45,170 26,500 10%
Flight Attendants On-the-job Training 48,500 11,900 10%
Hand Laborers & Material Movers High School 24,880 273,000 7%
Heavy & Tractor-Trailer Truck Drivers Certificate 41,340 113,800 6%
Material Recording Clerks High School 26,820 120,600 4%
Mobile Heavy Equipment Mechanics, except engines
Certificate 49,370 10,400 8%
Rail Car Repairers Certificate 55,000 1,100 5%
Railroad Workers On-the-job Training 57,160 -3,000 -3%
Small Engine Mechanics On-the-job Training 35,280 4,700 6%
Taxi Drivers & Chauffeurs On-the-job Training 24,300 14,700 5%
Water Transportation Workers Bachelor’s 54,870 6,900 8%
Job growth projections, both here and nationally, show growth mostly in low-paying, low-skilled occupations in this sector. Districts must be vigilant about rigor in Transportation academies; optimally pathways would be combined with Engineering and Architecture to give students preparation for both college and career. Districts and partners must ensure that these pathways offer students rigorous, integrated experiences and that they do not reflect lower expectations of lower-income teenagers.
a. Operations b. Structural Repair and Refinishing c. Systems Diagnostics, Service and Repair
40 41

OccupationProjected 2024 Los Angeles County Job
Growth
Automotive Service Technicians & Mechanics 1,200 7%
Bicycle Repairers 10 3%
Bus & Truck Mechanics 1,180 22.5%
Bus Drivers, School or Special Client 1,120 19%
Bus Drivers, Transit and Intercity 1,290 17.6%
Cargo & Freight Agents 1,190 15.7%
Commercial Pilots 230 30.3%
Heavy Truck Drivers 2,860 9.4%
Industrial Truck & Trailer Operators 2,060 12.8%
Laborers & Material Movers 9,690 11.8%
Light Truck Drivers 2,290 8.5%
Motorcycle Mechanics 401 13.8%
Packers & Packagers 2,380 7.6%
Rail Car Repairers 100 34.5%
Taxi Drivers & Chauffeurs 1,370 22%
Tire Repairers & Changers 120 7.3%
Transportation & Materials Moving Supervisors 1,500 11.2%
Water Transportation Workers 720 31.3%
42 43
Notes

44
Resources Cited
1. Lindstrom, Walters and Fleming. Supply Chain Technicians in the U.S.: Nationwide Employer Survey Results. National
Center for Supply Chain Technology Education. www.supplychain247.com/company/national_center_for_supply_chain_
technology_education. May 2013. Accessed 10/27/17.
2. “Occupational Outlook Handbook.” Bureau of Labor Statistics, https://www.bls.gov/ooh/ Data last updated on 10/24/17. Accessed 10/27/17.
3. “Employment Projections.” Labor Market Information Division, State of California Employment Development Department.
http://www.labormarketinfo.edd.ca.gov/data/employment-projections.html November 2016. Accessed 10/27/17.

© 2017
United Way of Greater Los Angeles,1150 South Olive Street, Suite T500, Los Angeles, CA 90015(213) 808-6220
linkedlearning.unitedwayla.org
This report was made possible through the generosity of the James Irvine Foundation and of interns from the University of Southern California’s Dornsife Internship Program.