fall 2014 advisory board presentation - university of …...portfolio performance net of cash •...
TRANSCRIPT

All figures shown in $CAD millions except share price or otherwise noted
Fall 2014 Advisory Board Presentation
SAF Student-Run Investment Fund Team December 1st, 2014
Agenda
▲ December 2014 SAF Student-run Investment Fund Team
▲ New Initiatives
▲ Overview
▲ Macro and Sector Outlook
▲ Fund Performance
▲ Recommendations
3
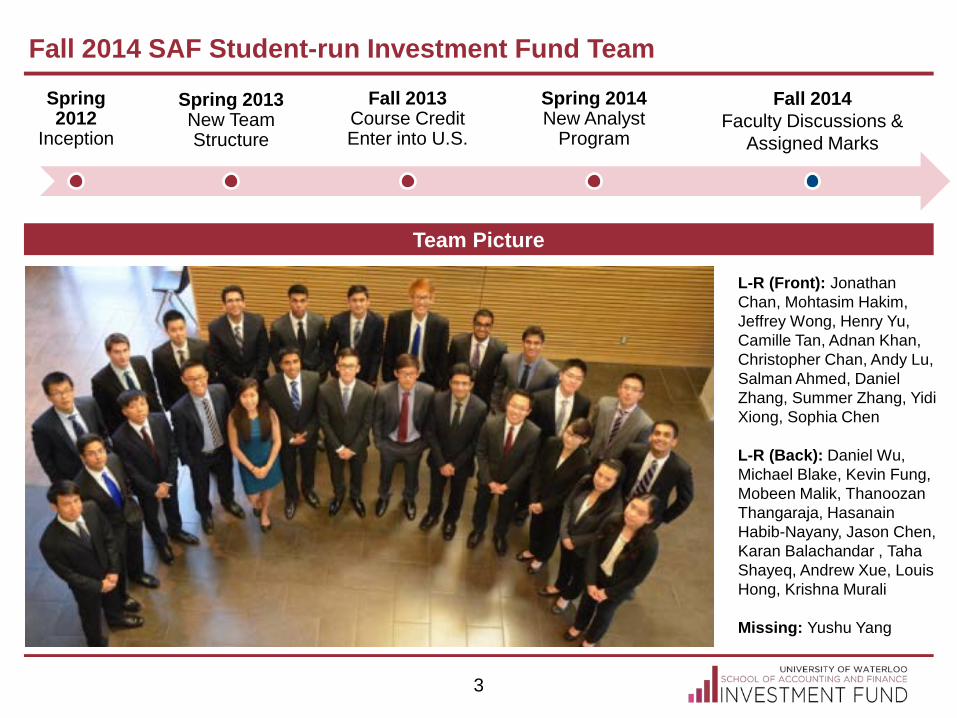
Fall 2014 SAF Student-run Investment Fund Team
Team Picture
L-R (Front): Jonathan Chan, Mohtasim Hakim, Jeffrey Wong, Henry Yu, Camille Tan, Adnan Khan, Christopher Chan, Andy Lu, Salman Ahmed, Daniel Zhang, Summer Zhang, Yidi Xiong, Sophia Chen L-R (Back): Daniel Wu, Michael Blake, Kevin Fung, Mobeen Malik, Thanoozan Thangaraja, Hasanain Habib-Nayany, Jason Chen, Karan Balachandar , Taha Shayeq, Andrew Xue, Louis Hong, Krishna Murali Missing: Yushu Yang
Spring 2012
Inception
Spring 2013 New Team Structure
Fall 2013 Course Credit Enter into U.S.
Spring 2014 New Analyst
Program
Fall 2014 Faculty Discussions &
Assigned Marks

4
Overview – Current Team Structure
Jeffrey Wong Michael Blake Louis Hong Henry Yu
Hasanain Habib-
Nayany Jonathan Chan
Christopher Chan
Sophia Chen Daniel Zhang
Yidi Xiong
Adnan Khan Daniel Wu Jason Chen
Karan Balachandar Summer Zhang
Kevin Fung Mohtasim Hakim
Consumer Industrials Healthcare Energy
Industrials & TMT
Andrew Ecclestone: Financials, Healthcare, & Materials Craig Geoffrey: TMT, Energy, & Utilities
Ranjini Jha: Consumer & Industrials
Faculty
Andrew Xue
Mobeen Malik Camille Tan
Taha Shayeq Salman Ahmed
Thanoozan Thangaraja
N/A
TMT Utilities
Krishna Murali, Louis Hong, Andrew Xue Executive Team
Materials Andy Lu
Yushu Yang
Financials
Energy & Utilities Materials & Healthcare Consumer Financials

5
Overview – Current Initiatives
Communication to Stakeholders
Learning and Growth
Annual Report (2013-2014 is in
progress)
Report to Industry Mentors
Advisory Board Presentation
Meet and Greet with Industry Mentors
Investment Boot Camp
Guest and Faculty
Speakers
Weekly Meetings with
Faculty
Bloomberg / Capital IQ Training Sessions
SAF Student-run Investment
Fund Panel

6
Overview – The Fund
1 The weight will change depending on the portfolio allocation for the period
Purpose
Objective
“To provide students with an investment management experience in an institutional setting. Specifically, it will provide
students hands-on-training in equity valuation and portfolio management with guidance from industry experts and with
supervision by finance faculty.”
“To generate long-term growth of the Fund’s assets. The Fund will invest in a broadly diversified portfolio of Canadian and US
equities that may provide capital gains and/or income.”
Benchmark 50% S&P/TSX Total Return Index and 50% S&P 500 Total Return Index1
7
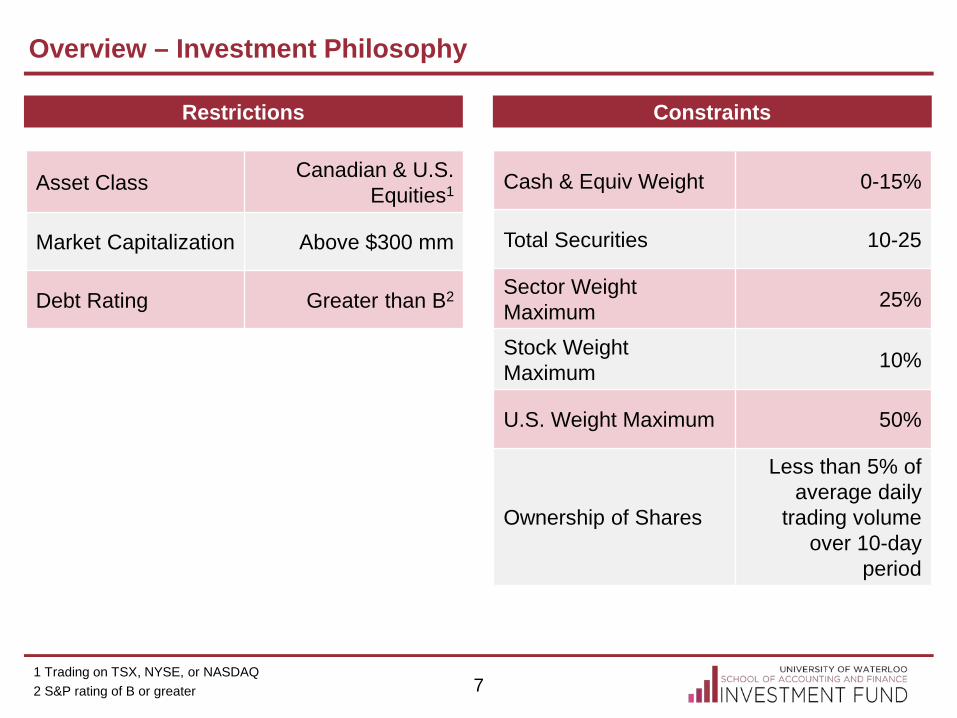
Overview – Investment Philosophy
1 Trading on TSX, NYSE, or NASDAQ 2 S&P rating of B or greater
Restrictions Constraints
Asset Class Canadian & U.S. Equities1
Market Capitalization Above $300 mm
Debt Rating Greater than B2
Cash & Equiv Weight 0-15%
Total Securities 10-25
Sector Weight Maximum 25%
Stock Weight Maximum 10%
U.S. Weight Maximum 50%
Ownership of Shares
Less than 5% of average daily
trading volume over 10-day
period

8
Overview – Selling Discipline
Fundamental
Price Movement
Material change in the business or in the industry
Exceed 25% capital gain from the time of purchase or
Exceed 15% capital loss from the time of purchase or
Exceed 25% decline in price from the highest price attained since initial purchase
Valuation Reached 12-month target price
We will review our holdings if…

9
Overview – Investment Process
• Break down industries and further divide into sectors or sub-sectors
• Remove any stocks within the universe that do not meet the Fund’s restrictions
• Select and apply relevant industry metrics for each stock
• Rank all stocks and select the top four
• Select one stock within the top four and conduct detailed research to determine the recommendation (“Buy”, “Sell”, or “Hold”)

10
Overview – Lessons Learned ▲ The Fund has grown tremendously over the last 2 years ▲ Selected quotes from the Fall 2014 team members
Adnan Khan, Junior Analyst, Energy Sophia Chen, Senior Analyst, Healthcare
Henry Yu, Junior PM, Consumer Andrew Xue, Senior PM, Financials
“It is important to delve deeper than just the numbers when telling the story of a company. For instance, it is important to understand why a company is trading at a discount to its peers”
“You truly understand a complex business when you are able to distinguish the key fundamentals from the details, but are ready to answer questions about the details”
“Though I was there to pass on my knowledge and experiences, my analysts taught me the importance of time management, work review and delegation”
“Finding the right stock is only the first step. As a portfolio manager, determining how the stock fits with the overall portfolio is just as important”

11
Overview – Sample Co-op Placements
Analyst, Investment
Banking Division
Analyst, Investment
Banking Division
Analyst, Investment
Banking Division
Analyst, Private Equity
Analyst, Private Equity
Analyst, Public Markets
Analyst, Investment
Banking Division
Analyst, Structured Products
Analyst, Investment
Banking Division
Associate, Equity
Research
Analyst, Alternative
Assets
Analyst, Private Equity

12
Overview – Sample Full-Time Placements 2014 and 2015
Andrew George-Parkin
• TDAM, Bond Analyst Analyst (2014)
Michael Liu
• CIBC, IB Analyst (2014)
Sunny Guo
• UBS, Trading (2014)
Michael Wang
• CIBC, IB Analyst (2014)
Anqi Wang
• CIBC, IB Analyst (2014)
Linda Teng
• Morgan Stanley, Research (2014)
Nitish Sharma
• Oliver Wyman, Consultant (2014)
Dustin Fader
• RBC Capital Markets, Analyst (2014)
Jing Xu
• CPPIB, Public Markets Analyst (2014)
Joanne Toporowski
• J.P. Morgan, IB Analyst (2014)
• KPMG Global Infrastructure, Advisory Practice (2014)
William Li
• Jarislowsky Fraser Limited (2014)
Jiatong Ma Krishna Murali Louis Hong
• Goldman Sachs, IB
Analyst (2015)
• Susquehanna International Group (2015)

Macro and Sector Outlook

14
Macro Outlook Key Themes
Sectors
Global economic outlook continues to improve Growing household debt levels are a worry
Global Macro
Expect low interest rate environment Given continued low inflation and asset buybacks in Europe
Interest Rates
Slowing developing economies keeping commodity prices flat Oil prices
Commodities
Consumer TMT
Overweight
Healthcare Industrials Materials
Neutral
Energy Financials
Underweight

15
Global Macro Outlook ▲ Consumer spending is on the uptick, driven
by pent-up demand and rising real wages; the concern however is the continuing increase in household debt levels
North America Employment Rate Pent-Up Consumer Demand
Household Debt to Disposable Income Industrial Production (yoy % change)
▲ Global economic outlook continues to improve; some emerging market concerns; growth continues in North America and other developed markets
95 100 105 110 115 120
2004 2006 2009 2012
Canada US
(20.0%)
(10.0%)
-
10.0%
20.0%
1992 1997 2003 2008 2013
Global US-
30%60%90%
120%150%180%
1990 1993 1996 1999 2002 2005 2008 2011

16
Interest Rates ▲ We do not see the Fed unilaterally raising
rates amidst continued low inflation and easing from Europe; little desire to increase spreads between US and German yields
Inflation vs. Central Bank Rates But 10Y Rate Trends Down
Germany-US Rate spreads Short Term Rise From Tapering
▲ While Fed taper led to a short-term rise in rates, overall rate trend continues to move downward, and we expect a continued low interest rate environment
-1.0%2.0%3.0%4.0%5.0%
2010 2010 2011 2012 2013 2014
Can US

17
Commodity Prices
▲ Oil has continued its tumble over the last month, with WTI now below $70/bbl
▲ While short-term prices continue to fall amidst no shortage of global supply
▲ Long-term oil prices not sustainable at this level, as costly projects begin to price out
Sluggish Metal Prices Continue
Crude Oil Prices Metals Prices
▲ While global recovery remains stable, concerns over emerging markets continue to weigh on prices of base metals
▲ Precious metals prices remain tepid, as the US continues to post strong economic growth and the Fed continues to taper
-
20
40
60
80
100
120
140
160
2009 2010 2011 2013 2014
WTI Brent
Buying Opportunity in Energy?
-
50
100
150
200
250
300
2009 2009 2010 2011 2012 2013 2014
Base Metals Precious Metals

Fund Performance

Portfolio Returns Since Inception
• Includes 2.2% dividend yield All figures are C$ basis
Net Asset Value
Fund NAV NAV Return TRI Benchmark Relative Return Avg. Cash % of Portfolio Fiscal Year ’12 10.49 4.93% 11.22% -6.29% 42.9% Fiscal Year ’13 12.26 18.61% 20.82% -2.21% 21.7%
Spring ’14 12.58 2.60% 7.32% -4.72% 41.7% Fall ’14 12.08 -3.97% -1.98% -2.00% 33.7%
Since Inception 12.08 20.76%* 38.90% -18.14% 33.4%
Total Returns
19
12.08
13.89
9.00
10.00
11.00
12.00
13.00
14.00
15.00
Jul-12 Nov-12 Feb-13 May-13 Sep-13 Dec-13 Mar-14 Jul-14 Oct-14
Fund NAV Benchmark

Portfolio Characteristics
All figures are C$ basis
Average Portfolio Return 0.69%
Portfolio Standard Deviation 1.73%
Average Benchmark Return 1.20%
Benchmark Standard Deviation 2.07%
Portfolio Beta 0.62
Portfolio Alpha -0.12%
Sharpe Ratio 0.30
Value at Risk (5%) -$3,674
All returns are listed on a monthly basis Historical
Looking Forward
Weighted Average Beta 0.89
20
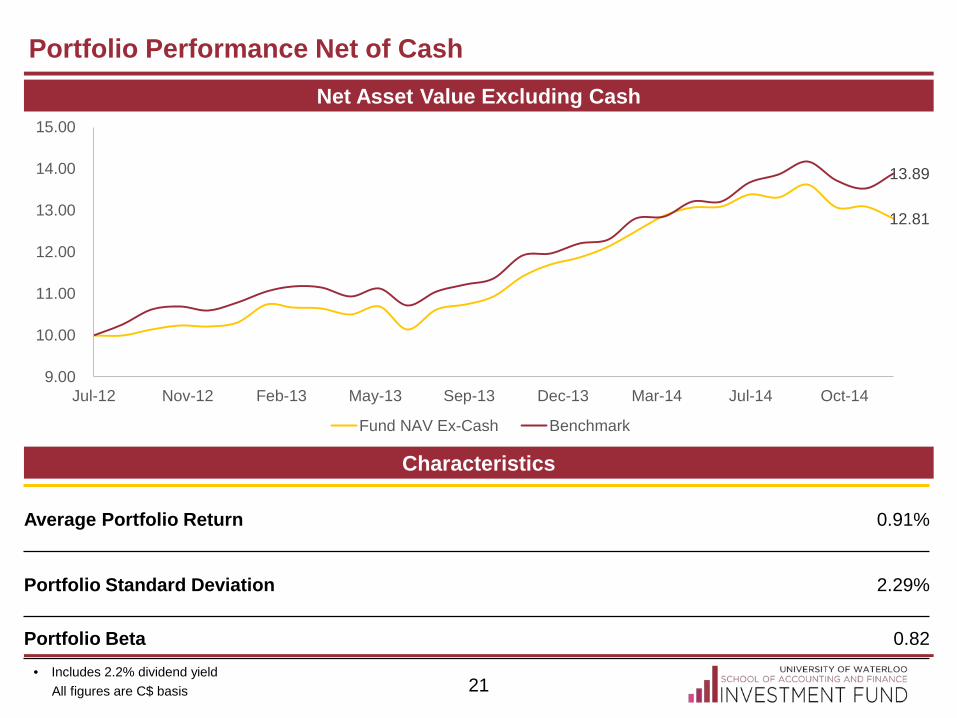
Portfolio Performance Net of Cash
• Includes 2.2% dividend yield All figures are C$ basis
Net Asset Value Excluding Cash
Characteristics
21
12.81
13.89
9.00
10.00
11.00
12.00
13.00
14.00
15.00
Jul-12 Nov-12 Feb-13 May-13 Sep-13 Dec-13 Mar-14 Jul-14 Oct-14
Fund NAV Ex-Cash Benchmark
Average Portfolio Return 0.91%
Portfolio Standard Deviation 2.29%
Portfolio Beta 0.82

22
Security and Sector Returns (Fall 2014)
All figures are C$ basis
Security Returns Sector Returns
-60% -40% -20% 0% 20% 40%
VSI
SU
SAFM
RRX
PRA
OLED
NA
MYGN
GIL
G
FTS
D.UN
CPX
CCA
BNS
BDI
AX.UN
AGU
-60% -40% -20% 0% 20%
Utilities
Telecommunication
Materials
Information Technology
Industrials
Healthcare
Financials
Energy
Consumer Staples
Consumer Discretionary
TSX Sector Fund Return
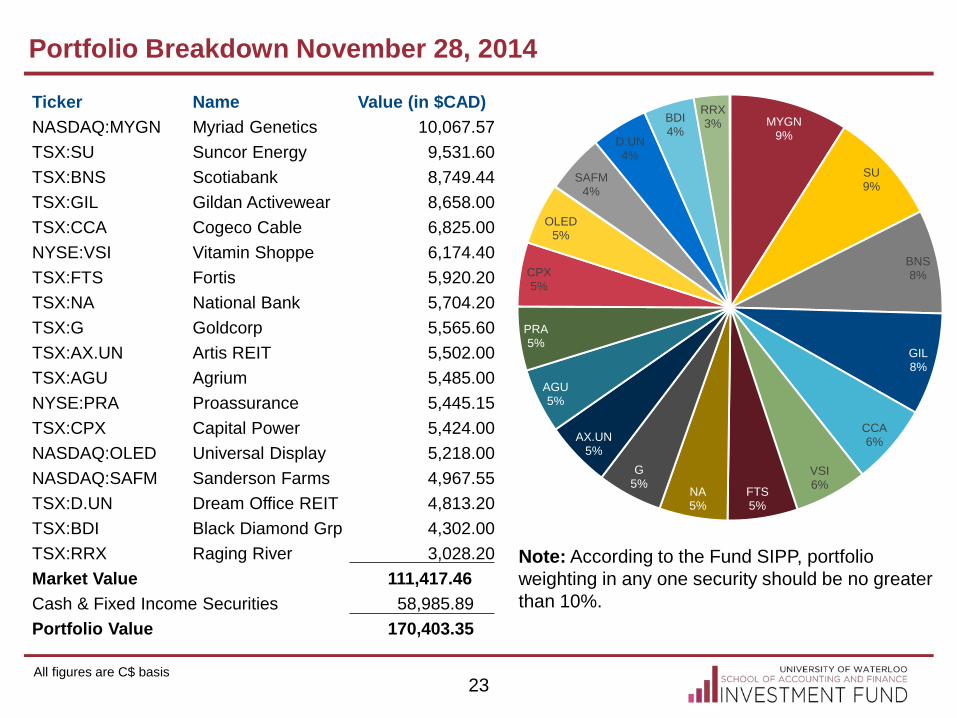
Portfolio Breakdown November 28, 2014
All figures are C$ basis
Note: According to the Fund SIPP, portfolio weighting in any one security should be no greater than 10%.
Ticker Name Value (in $CAD) NASDAQ:MYGN Myriad Genetics 10,067.57 TSX:SU Suncor Energy 9,531.60 TSX:BNS Scotiabank 8,749.44 TSX:GIL Gildan Activewear 8,658.00 TSX:CCA Cogeco Cable 6,825.00 NYSE:VSI Vitamin Shoppe 6,174.40 TSX:FTS Fortis 5,920.20 TSX:NA National Bank 5,704.20 TSX:G Goldcorp 5,565.60 TSX:AX.UN Artis REIT 5,502.00 TSX:AGU Agrium 5,485.00 NYSE:PRA Proassurance 5,445.15 TSX:CPX Capital Power 5,424.00 NASDAQ:OLED Universal Display 5,218.00 NASDAQ:SAFM Sanderson Farms 4,967.55 TSX:D.UN Dream Office REIT 4,813.20 TSX:BDI Black Diamond Grp 4,302.00 TSX:RRX Raging River 3,028.20 Market Value 111,417.46 Cash & Fixed Income Securities 58,985.89 Portfolio Value 170,403.35
23
MYGN 9%
SU 9%
BNS 8%
GIL 8%
CCA 6%
VSI 6% FTS
5% NA 5%
G 5%
AX.UN 5%
AGU 5%
PRA 5%
CPX 5%
OLED 5%
SAFM 4%
D.UN 4%
BDI 4%
RRX 3%

Portfolio Breakdown Post-Trade November 28, 2014
All figures are C$ basis
Note: According to the Fund SIPP, portfolio weighting in any one security should be no greater than 10%.
Ticker Name Value (in $CAD) TSX:BNS Scotiabank 13,406.40 NASDAQ:MYGN Myriad Genetics 10,067.57 NASDAQ:FOSL Fossil Group 10,046.59 NASDAQ:SAFM Sanderson Farms 9,935.10 TSX:CCA Cogeco Cable 9,750.00 NASDAQ:OLED Universal Display 9,545.22 TSX:SU Suncor Energy 9,531.60 TSX:CPX Capital Power 9,492.00 NYSE:VSI Vitamin Shoppe 9,207.44 TSX:PSI Pason Systems 9,012.50 TSX:GIL Gildan Activewear 8,658.00 TSX:BDI Black Diamond Grp 8,280.00 TSX:AX.UN Artis REIT 7,860.00 TSX:RRX Raging River 6,180.00 TSX:NA National Bank 5,740.20 TSX:G Goldcorp 5,565.60 TSX:AGU Agrium 5,485.00 TSX:D.UN Dream Office REIT 4,813.20 Market Value 152,576.42 Cash & Fixed Income Securities 17,696.94 Portfolio Value 170,273.35
24
AGU 4% AX.UN
5%
BNS 9%
BDI 5%
CPX 6%
CCA 6%
D.UN 3%
GIL 6%
G 4%
MYGN 7%
NA 4%
RRX 4%
SAFM 7%
SU 6%
OLED 6%
VSI 6%
FOSL 7%
PSI 6%

Large Cap 32%
Mid Cap 46%
Small Cap 22%
CDN 68%
US 32%
Portfolio Breakdown November 28, 2014
All figures are C$ basis 25
Consumer Discretionary
18%
Staples [PERCENTAGE]
Energy 10%
Financials 21%
Healthcare 7%
Tech PERCENTAGE]
Industrials 11%
Materials 7%
Telecom [PERCENTAGE]
Utilities 6%
0%5%
10%15%20%25%30%35%40%
Consumer Energy Financials Healthcare Industrials Materials TMT Utilities
Portfolio S&P/TSX S&P 500
26
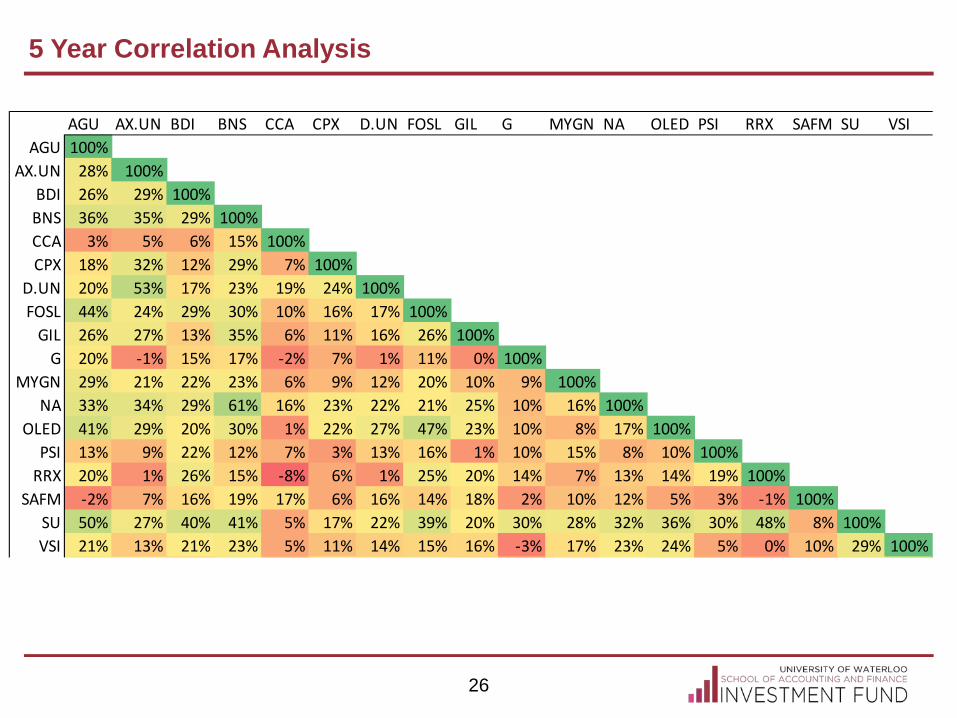
5 Year Correlation Analysis
AGU AX.UN BDI BNS CCA CPX D.UN FOSL GIL G MYGN NA OLED PSI RRX SAFM SU VSIAGU 100%
AX.UN 28% 100%BDI 26% 29% 100%BNS 36% 35% 29% 100%CCA 3% 5% 6% 15% 100%CPX 18% 32% 12% 29% 7% 100%
D.UN 20% 53% 17% 23% 19% 24% 100%FOSL 44% 24% 29% 30% 10% 16% 17% 100%
GIL 26% 27% 13% 35% 6% 11% 16% 26% 100%G 20% -1% 15% 17% -2% 7% 1% 11% 0% 100%
MYGN 29% 21% 22% 23% 6% 9% 12% 20% 10% 9% 100%NA 33% 34% 29% 61% 16% 23% 22% 21% 25% 10% 16% 100%
OLED 41% 29% 20% 30% 1% 22% 27% 47% 23% 10% 8% 17% 100%PSI 13% 9% 22% 12% 7% 3% 13% 16% 1% 10% 15% 8% 10% 100%
RRX 20% 1% 26% 15% -8% 6% 1% 25% 20% 14% 7% 13% 14% 19% 100%SAFM -2% 7% 16% 19% 17% 6% 16% 14% 18% 2% 10% 12% 5% 3% -1% 100%
SU 50% 27% 40% 41% 5% 17% 22% 39% 20% 30% 28% 32% 36% 30% 48% 8% 100%VSI 21% 13% 21% 23% 5% 11% 14% 15% 16% -3% 17% 23% 24% 5% 0% 10% 29% 100%

Recommendations

Valuation
Company Overview
Buy Recommendation – First Quantum Minerals (TSX:FM)
▲ Strong Fundamentals for Copper ▲ Sector Leading Growth in Copper Production ▲ Track Record of Cost Leadership
Share Performance
Drivers & Risks Drivers
Risks ▲ Copper Price Risk ▲ Exposure to Uncertain Fiscal Regimes ▲ Strong Reliance on Projects in the Pipeline
Canada’s Leading Pure Play Copper Company Market Data Metals Exposure
Share Price EV (mm) P/E P/B EV/EBIT Div. Yield D/E Debt Rating Beta
$19.46 $18,336
18.6x 1.08x 15.8x
0.88% 0.45
B+ 1.67
NAV Discount Rate NAVPS Multiple Cash Cost Growth
7.0% 0.9x 2%
Limit Price Weighting Target Price Current Price Upside
$19.10 100%
$22.35 $19.46 17.0%
28
12%
15%
73%
Other Nickel Copper
(20.0%)
-
20.0%
40.0%
60.0%
Nov-13 Mar-14 Jun-14 Sep-14
First Quantum S&P/TSX Capped Materials

Valuation
Company Overview
Buy Recommendation – Fossil Group Inc. (NASDAQ:FOSL)
▲ Current upcoming products & partnerships ▲ International & domestic growth strategy ▲ Undervaluation
Share Performance
Drivers & Risks Drivers
Risks ▲ Undetermined impact of smart watches ▲ License agreement renegotiations ▲ Requirement for skilled labour
Fossil designs and distributes fashion accessories Market Data Revenue by Segment
Share Price EV (mm) P/E EV/EBITDA ROE Div Yield D/E Debt Rating Beta
$110.16 $6,044
16.0x 9.0x
38.2% 0.0%
65.1% NR
1.74
29
(40.0%)
(20.0%)
-
20.0%
40.0%
Nov-13 Feb-14 May-14 Aug-14 Nov-14FOSL Consumer Disc. Index
Watches 77%
Leather 13%
Jewelry 7%
Other 3%
DCF Comps Historical
WACC Rev. CAGR
8.8% 6.2%
Share Price Weighting Target Price Current Price Upside
$156.33 77.5%
$130.00 $110.16
18.2%
$71.71 10%
$107.51 12.5%
$71.71 $162.36
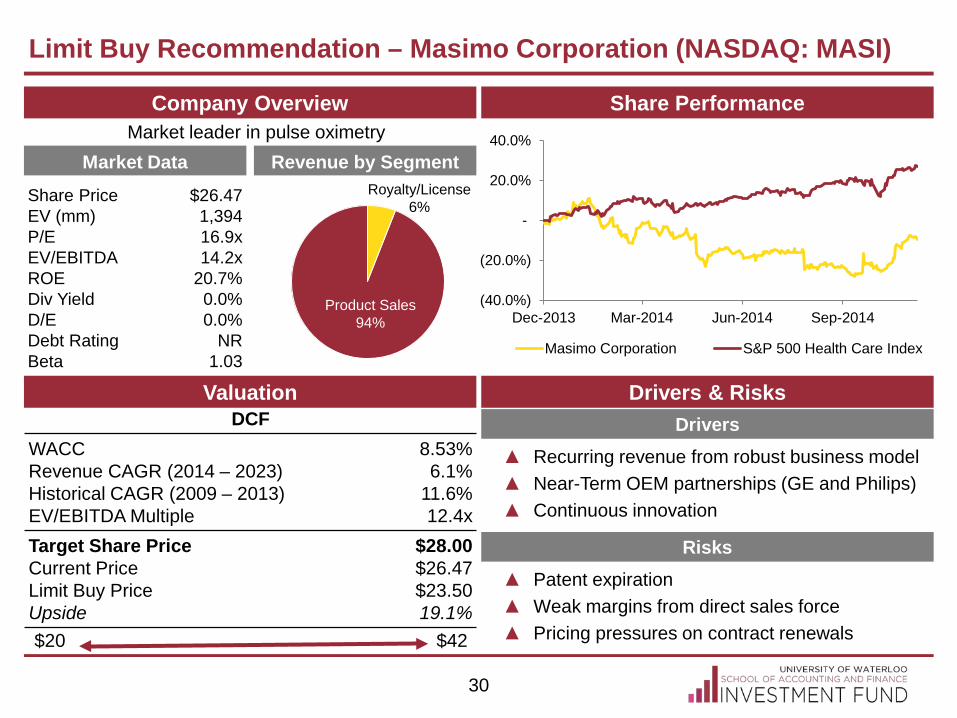
Valuation
Company Overview
Limit Buy Recommendation – Masimo Corporation (NASDAQ: MASI)
▲ Recurring revenue from robust business model ▲ Near-Term OEM partnerships (GE and Philips) ▲ Continuous innovation
Share Performance
Drivers & Risks Drivers
Risks ▲ Patent expiration ▲ Weak margins from direct sales force ▲ Pricing pressures on contract renewals
Market leader in pulse oximetry Market Data Revenue by Segment
Share Price EV (mm) P/E EV/EBITDA ROE Div Yield D/E Debt Rating Beta
$26.47 1,394 16.9x 14.2x
20.7% 0.0% 0.0%
NR 1.03
DCF WACC Revenue CAGR (2014 – 2023) Historical CAGR (2009 – 2013) EV/EBITDA Multiple
8.53% 6.1%
11.6% 12.4x
Target Share Price Current Price Limit Buy Price Upside
$28.00 $26.47 $23.50 19.1%
$20 $42
30
(40.0%)
(20.0%)
-
20.0%
40.0%
Dec-2013 Mar-2014 Jun-2014 Sep-2014
Masimo Corporation S&P 500 Health Care Index
Royalty/License 6%
Product Sales 94%

Valuation
Company Overview
Limit Buy Recommendation – Pason Systems Inc. (TSX:PSI)
▲ Industry leader in EDR market which allows for cross-selling of complimentary products
▲ Growth opportunities through robust pipeline ▲ Poised for international expansion with joint
ventures in the Middle East
Share Performance
Drivers & Risks Drivers
Risks ▲ Correlation with oil ▲ Competitive landscape in US and technology
Industry leader in oilfield instrumentation equipment Market Data Revenue by Segment
Share Price EV (mm) P/E EV/EBITDA ROE Div. Yield D/E Debt Rating Beta
$25.80 $2,092.0
24.3x 10.7x
23.0% 2.5% 0.0%
NR 0.83
DCF WACC Forecasted 5 Year Revenue CAGR EV/EBITDA Multiple
8.02% 8.1% 10.4x
Share Price Weighting Target Price Current Price Upside
$30.52 100%
$30.52 $25.80
18% $23.20 $35.70
31
(20.0%)
-
20.0%
40.0%
60.0%
Nov-13 Feb-14 May-14 Aug-14 Nov-14
PSI Industrial Index
Gas 8% Other
9%
ADR 11%
C&S 14% PVT
15%
EDR 43%
Buy
Existing Holdings
32
Hold

(10.0%)
-
10.0%
20.0%
30.0%
Nov/2013 Feb/2014 May/2014 Aug/2014 Nov/2014
FTS TSX Composite Utilities Index
Stock Performance
Sell Recommendation – Fortis (TSX:FTS)
Portfolio Data
Sell Rationale Events
Original Value Market Value Purchased Capital Gains Div. Yield
$5,007.0 $5,920.5
July 2012 18.2% 8.4%
Market Data Price Market Cap EV/EBITDA 5Y Beta Dividend
$37.94 10,386.8
12.5x 0.29
3.4%
A
B Short-term performance to be heavily reliant on successful integration process of UNS acquisition
Dividend yield and other valuation metrics no longer favourable given recent run-up
December 2013 – Fortis announces $4.3B acquisition of UNS Energy
November 2014 – Fortis announces strategic review of real estate portfolio
33
A
B
Believe that market has over-optimistic view of real estate holding monetisation options

(20.0%)
20.0%
60.0%
100.0%
140.0%
Nov/2011 May/2012 Nov/2012 May/2013 Oct/2013 Apr/2014 Oct/2014
PRA Financial Index
Stock Performance
Sell Recommendation – ProAssurance Corporation (NYSE:PRA)
Portfolio Data
Sell Rationale Events
Original Value Market Value Purchased Capital Loss Div. Yield
$5,200.7 $4,734.5
Dec 2013 -9.0% 2.4%
Market Data Price Market Cap P/TBV 5Y Beta Dividend
$45.09 2,578.4
1.3x 0.65
2.7%
A
B
C
Lack of organic growth in the competitive healthcare professional liability market
Macro environment forces PRA to reinvest at low interest rates, depressing investment returns
January 2013 – ProAssurance closes $154 million Medmarc Insurance Group acquisition
December 2013 – Fund purchases 105 shares
January 2014 – ProAssurance closes $205 million Eastern Insurance Holdings acquisition
34
Persistent rise in underwriting expenses leading to combined ratio deterioration
B
C A

35
Other Stock Pitches
▲ Designs and manufactures connectors, cables and senor products
▲ Overvaluation on EV/EBITDA, and P/E metrics compared to peers
▲ Highly fragmented industry with increasing market share only possible through acquisitions
▲ Develops and provides end-to-end green computing solutions and servers for enterprises, data centres and cloud computing
▲ Overvaluation on EV/EBITDA, and P/E metrics compared to peers
▲ Industry primarily dominated by HP, Dell and IBM
36
Industry Mentors
Mike Williams Jin Li
Nader Ahmed Lu Jiang
Niall Glynn Aly Hadibhai
Pawel Rajszel
Kevin Huynh
Simon Kwan
David Middleton
Dorena Tu
Meng Wang
Ian Gutwinski Derek Chu
Ray Wan Michael Liu

37
Industry Mentors
Michael Liu Nick Gill Jonathan Sue David Lee

38
Partners
Craig Geoffrey Ranjini Jha Andrew Ecclestone
John Gort, Chair
Jeffrey Stacey Thomas Scott Dennis Huber Aazar Zafar
Faculty
Advisory Board
Dan Lavric Alan Douglas
Lynn Graham
Student Relations
Appendices

1 Year Performance
Current Holding – Suncor Energy Inc. (TSX:SU)
Valuation Metrics Share Price Market Cap (mm) P/E 2013 P/E 2014 EV/EBITDA 2013 EV/EBITDA 2014 P/B P/TBV ROE 2013 Dividend Yield D/E Beta
$36.11 $52,409 17.0x 11.6x
5.3x 5.1x
1.3x 1.4x
9.7% 3.1%
28.4% 1.64
Recent News
Valuation Fund Portfolio Data Investment Outlook Recommendation Previous Target Price Updated Target Price
Hold $45.00 $42.50
Investment Thesis •Downstream integration continues to allow capture of price differentials Investment Risks •Upside reliant on continued reserve development; projects risk being priced out
▲ 22% dividend increase in 2014
▲ Oil production slight miss through Q3 14
▲ Cash operating costs continue to improve
▲ 2014 capex spend 13% below original estimate
▲ Impairment charges for Joslyn oil sands project and Libya assets
40
Current Price Shares Owned Market Value Purchase Date Purchase Price Return – Inception Return – TTM Return – YTD
$36.11 260
$9,389
3/22/13 $32.00
12.8%
-3.0% -0.8%
80 85 90 95
100 105 110 115 120 125 130
Nov-13 Jan-14 Feb-14 Apr-14 Jun-14 Jul-14 Sep-14 Oct-14
SU TSX Energy Index
30.00 35.00 40.00 45.00 50.00
EV/BoE per D
EV/2P Reserve
EV/EBITDA
DCF NAV Model

1 Year Performance
Current Holding – Raging River Exploration (TSX:RRX)
Valuation Metrics Share Price Market Cap (mm) P/E 2013 P/E 2014 EV/EBITDA 2013 EV/EBITDA 2014 P/B P/TBV ROE 2013 Dividend Yield D/E Beta
$6.21 $1,119
15.7x 11.3x
7.1x 4.6x
3.1x 3.1x
13.6% - 6.5% 2.17
Recent News
Valuation Fund Portfolio Data Investment Outlook Recommendation Previous Target Price Updated Target Price
Buy $11.75 $8.50
Investment Thesis •Very low cash operating costs •High positive leverage to WTI Investment Risks •Very price sensitive to oil •Valuation dependent on continued resource base development
▲ 30% fall in oil prices over last three months
▲ Q3 production well ahead of estimates
▲ 2015 guidance of average daily production of 12.5mBoE
▲ Average IP90 for 2014 at 47bbl/d
41
Current Price Shares Owned Market Value Purchase Date Purchase Price Return – Inception Return – TTM Return – YTD
$6.21 490
$3,041
7/25/14 $10.09
-38.4%
-1.4% -7.9%
4.00 5.00 6.00 7.00 8.00 9.00 10.00
EV/BoE per D
EV/2P Reserve
EV/EBITDA
DCF NAV Model
70
90
110
130
150
170
190
Nov-13 Jan-14 Mar-14 Apr-14 Jun-14 Aug-14 Sep-14 Nov-14
RRX TSX Energy Index

1 Year Performance
Current Holding – Capital Power Corp. (TSX:CPX)
Valuation Metrics Share Price Market Cap (mm) P/E 2013 P/E 2014 EV/EBITDA 2013 EV/EBITDA 2014 P/B P/TBV ROE 2013 Dividend Yield D/E Beta
$27.13 $2.263 27.1x 17.8x
10.0x 8.4x
0.9x 1.1x
7.9% 5.0%
52.3% 0.38
Recent News
Valuation Fund Portfolio Data Investment Outlook Recommendation Previous Target Price Updated Target Price
Hold $29.00 $29.50
Investment Thesis •Continued organic growth potential •Positive leverage to Alberta economy Investment Risks •Potential cost and construction delays
▲ 8% dividend increase in 2014
▲ Construction timeline continues to track on schedule
▲ Sheperd Energy Natural Gas [400MW] Q1 2015
▲ K2 Wind Project [90MW] Q3 2015
42
Current Price Shares Owned Market Value Purchase Date Purchase Price Return – Inception Return – TTM Return – YTD
$27.13 200
$9,389
3/22/13 $21.64
25.4%
29.8% 27.3%
20.00 24.00 28.00 32.00 36.00
EV/EBITDA
Dividend Yield
DCF EBITDA Multiple
DCF FCF Multiple
80
90
100
110
120
130
140
Nov-13 Jan-14 Feb-14 Apr-14 Jun-14 Jul-14 Sep-14 Oct-14
CPX TSX Utilities Index
1 Year Performance v.s. Sector Index
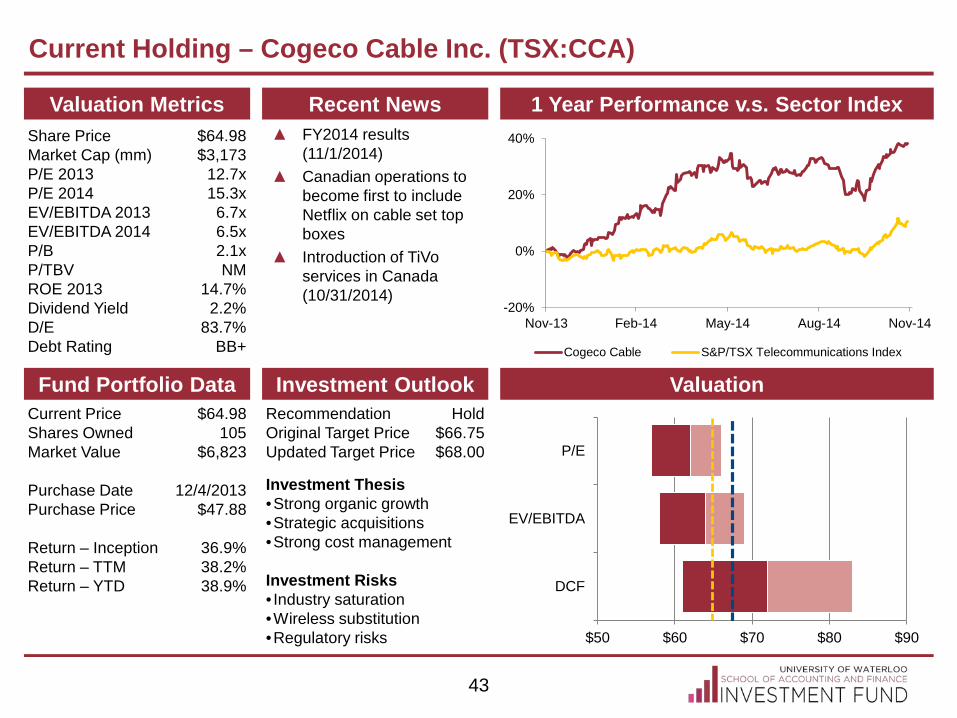
Current Holding – Cogeco Cable Inc. (TSX:CCA)
Valuation Metrics Share Price Market Cap (mm) P/E 2013 P/E 2014 EV/EBITDA 2013 EV/EBITDA 2014 P/B P/TBV ROE 2013 Dividend Yield D/E Debt Rating
$64.98 $3,173
12.7x 15.3x
6.7x 6.5x 2.1x NM
14.7% 2.2%
83.7% BB+
Recent News
Valuation Fund Portfolio Data Investment Outlook Current Price Shares Owned Market Value Purchase Date Purchase Price Return – Inception Return – TTM Return – YTD
$64.98 105
$6,823
12/4/2013 $47.88
36.9% 38.2% 38.9%
Recommendation Original Target Price Updated Target Price
Hold $66.75 $68.00
Investment Thesis •Strong organic growth •Strategic acquisitions •Strong cost management Investment Risks • Industry saturation •Wireless substitution •Regulatory risks
▲ FY2014 results (11/1/2014)
▲ Canadian operations to become first to include Netflix on cable set top boxes
▲ Introduction of TiVo services in Canada (10/31/2014)
43
-20%
0%
20%
40%
Nov-13 Feb-14 May-14 Aug-14 Nov-14
Cogeco Cable S&P/TSX Telecommunications Index
$50 $60 $70 $80 $90
DCF
EV/EBITDA
P/E

1 Year Performance v.s. Sector Index
Current Holding – Black Diamond Group Limited (TSX:BDI)
Valuation Metrics Share Price Market Cap (mm) P/E 2013 P/E 2014 EV/EBITDA 2013 EV/EBITDA 2014 P/B P/TBV ROE 2013 Dividend Yield D/E Debt Rating
$18.04 $775 25.6x 14.8x 11.1x 6.1x 1.9x 2.1x
13.8% 5.3%
16.1% NR
Recent News
Valuation Fund Portfolio Data Investment Outlook Current Price Shares Owned Market Value Purchase Date Purchase Price Return – Inception Return – TTM Return – YTD
$18.04 239
$4,312
3/28/2013 $20.96
-9.4%
-36.9% -34.7%
Recommendation Original Target Price Updated Target Price
Hold $35.50 $27.00
Investment Thesis •Defensive play on oil and gas production •One of a kind business in niche market Investment Risks • Increasing capacity in Alberta •Price Competition •Softer market for oil and gas
▲ Announced Q3 2014 (11/6/2014)
▲ FY2015 CapEx budget of $85mm does not include LNG projects
44
-40%
-20%
0%
20%
40%
Nov-13 Feb-14 May-14 Aug-14 Nov-14
Black Diamond S&P/TSX Industrials Index
$10 $20 $30 $40 $50
DCF - Growth
DCF - Multiple
NTM P / E:
LTM P / E:
LTM EV / EBITDA:
NTM EV / EBITDA:

1 Year Performance v.s. Sector Index
Current Holding – Universal Display Corp (NASDAQ:OLED)
Valuation Metrics Share Price Market Cap (mm) P/E 2013 P/E 2014 EV/EBITDA 2013 EV/EBITDA 2014 P/B P/TBV ROE 2013 Dividend Yield D/E Debt Rating
$27.74 $1,267
73.2x 15.0x 33.4x 13.5x
2.9x 3.6x
21.5% 0
0.0% NR
Recent News
Valuation Fund Portfolio Data Investment Outlook Current Price Shares Owned Market Value Purchase Date Purchase Price Return – Inception Return – TTM Return – YTD
$27.74 164
$4,549
7/30/2014 $30.05
-23.2% -23.2% -23.2%
Recommendation Original Target Price Updated Target Price
Hold $38.30 $34.20
Investment Thesis •Patented technology (PHOLED) •Key customer relationships Patent pipeline Investment Risks •Revenue dependency on critical customers •Technology obsolescence •Patent expiration
▲ Announced Q3 2014 results (11/6/2014)
▲ Increased proliferation and application and advancement of OLED technology (mobile phone resolutions, virtual reality simulators), smart watches
45
-40%
-20%
0%
20%
40%
Nov-13 Feb-14 May-14 Aug-14 Nov-14
OLED iShares US Tech
Major DCF Assumptions (100% DCF Value)5-year revenue CAGR 28.5%5-year EBITDA CAGR 27.8%WACC 10.6%Terminal Multiple 16.2xTarget Price $34.30Current Price $27.74Upside 23.6%

1 Year Performance vs. Sector Index
Current Holding – Agrium Inc. (TSX:AGU)
Valuation Metrics Share Price Market Cap (mm) P/E 2013 P/E 2014 EV/EBITDA 2013 EV/EBITDA 2014 P/B P/TBV ROE 2013 Dividend Yield D/E Debt Rating
$109.50 $16,192
17.5x 14.3x
11.3x 9.0x 2.0x 3.4x 15.7% 3.0%
29% BBB
Recent News
Valuation Fund Portfolio Data Investment Outlook Current Price Shares Owned Market Value Purchase Date Purchase Price Return – Inception Return – TTM Return – YTD
$99.61 50
$5,634
11/30/12 $101.41
15.1%
20.0% 6.9%
Recommendation Original Target Price Updated Target Price
Hold $120.76 $126.00
Investment Thesis • Integrated value chain •Diversified business mix •Undervalued retail business Investment Risks •Volatile commodity prices •Production difficulties • Integration risk
▲ Offers $500M debentures (11/13/2014)
▲ Increase in dividend (11/3/2014)
▲ ValueAct Capital ownership announcement (10/24/2014)
$110 $126
46
$80.00 $120.00 $160.00
52W Range
Sum of Parts
DCF - EM
DCF - PG
-20%
0%
20%
40%
Nov-13 Mar-14 Jun-14 Sep-14
Agrium Inc. S&P/TSX Capped Materials

1 Year Performance v.s. Sector Index
Current Holding – Goldcorp Inc. (TSX:G)
Valuation Metrics Share Price Market Cap (mm) P/E 2013 P/E 2014 EV/EBITDA 2013 EV/EBITDA 2014 P/B P/TBV ROE 2013 Dividend Yield D/E Debt Rating
$23.48 $19,113
NM 20.4x
5.4x 8.9x
0.9x 0.9x
(3.7%) 2.9%
14% BBB+
Recent News
Valuation Fund Portfolio Data Investment Outlook Current Price Shares Owned Market Value Purchase Date Purchase Price Return – Inception Return – TTM Return – YTD
$23.48 240
$5,635
11/30/12 $35.30
(31.7%)
(5.0%) (23.0%)
Recommendation Original Target Price Updated Target Price
Hold $51.06 $25.50
Investment Thesis •Unhedged exposure to gold •Robust product pipeline •Focus on low risk operations Investment Risks •Movement of gold prices •Currency risk •Development risk
▲ Missed production estimates in Q3 results (10/30/2014)
▲ First commercial production at Éléonore and Cerro Negro (10/2/2014)
▲ Delayed production at El Sauzal (9/2/2014)
47
$21.84
$25.50 $5.87 $2.51
Producing Assets DevelopingAssets
Other Assets NAV
-20%
0%
20%
40%
Nov-13 Mar-14 Jun-14 Sep-14
Goldcorp Inc. S&P/TSX Capped Materials

Inception Performance vs. Sector Index
Current Holding – Myriad Genetics Inc. (NASDAQ:MYGN)
Valuation Metrics Share Price Market Cap (mm) P/E 2013 P/E 2014 EV/EBITDA 2013 EV/EBITDA 2014 P/B P/TBV ROE 2013 Dividend Yield D/E Debt Rating
$33.20 $2,423
18.4x 15.6x
9.0x 9.1x
3.4x 7.1x (19.5%) 0.0%
0% --
Recent News
Valuation Fund Portfolio Data Investment Outlook Current Price Shares Owned Market Value Purchase Date Purchase Price Return – Inception Return – TTM Return – YTD
$33.20 266
$8,831
07/25/14 $37.32
(11.0%)
(11.0%) (11.0%)
Recommendation Original Target Price Updated Target Price
Hold $45.15 $44.00
Investment Thesis •Growth in MDx industry •Economic moat in MDx •Robust product pipeline Investment Risks • Increasing competition •Management execution •Legal risk
▲ myRisk reports 96% growth in Q1 earnings with increase in operating expenses (11/4/2014)
48
$34.89 $44.00
$20 $30 $40 $50 $60
52W RangeHist. P/E
Hist. EV/EBITDAComp. EV/EBITDA
DCF - PGDCF - EM
-40%
-20%
0%
20%
40%
60%
Nov-13 Mar-14 Jun-14 Sep-14
Myriad Genetics Inc. S&P 500 Healthcare Sector Index
1 Year Performance v.s. Sector Index
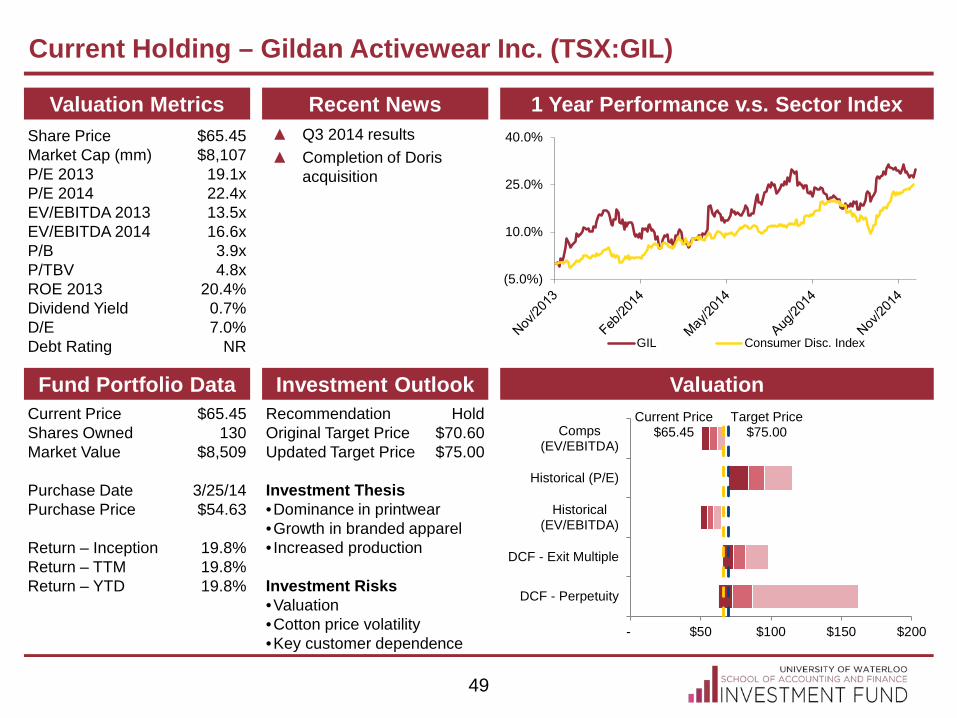
Current Holding – Gildan Activewear Inc. (TSX:GIL)
Valuation Metrics Share Price Market Cap (mm) P/E 2013 P/E 2014 EV/EBITDA 2013 EV/EBITDA 2014 P/B P/TBV ROE 2013 Dividend Yield D/E Debt Rating
$65.45 $8,107 19.1x 22.4x
13.5x 16.6x
3.9x 4.8x
20.4% 0.7%
7.0% NR
Recent News
Valuation Fund Portfolio Data Investment Outlook Recommendation Original Target Price Updated Target Price
Hold $70.60 $75.00
Investment Thesis •Dominance in printwear •Growth in branded apparel • Increased production Investment Risks •Valuation •Cotton price volatility •Key customer dependence
▲ Q3 2014 results ▲ Completion of Doris
acquisition
49
(5.0%)
10.0%
25.0%
40.0%
GIL Consumer Disc. Index
Current Price $65.45
Target Price $75.00
- $50 $100 $150 $200
DCF - Perpetuity
DCF - Exit Multiple
Historical(EV/EBITDA)
Historical (P/E)
Comps(EV/EBITDA)
Current Price Shares Owned Market Value Purchase Date Purchase Price Return – Inception Return – TTM Return – YTD
$65.45 130
$8,509
3/25/14 $54.63
19.8%
19.8% 19.8%

1 Year Performance v.s. Sector Index
Current Holding – Sanderson Farms (NASDAQ:SAFM)
Valuation Metrics Recent News
Valuation Fund Portfolio Data Investment Outlook
Investment Thesis •Added capacity •Consumer preference •Big bird deboning Investment Risks •Prices of competing meats •High crop prices • Increasing short interest
50
(10.0%)
-
10.0%
20.0%
30.0%
40.0%
50.0%
SAFM Consumer Staples Index
Current Price, $86.02
Target Price, $95.00
- $40 $80 $120 $160 $200
DCF - Exit Multiple
Historical (EV/EBITDA)
Historical (P/E)
Comps (P/E)
Comps (EV/EBITDA)
▲ Construction of Palestine, Texas big bird deboning facility
▲ Q3 2014 results
Current Price Shares Owned Market Value Purchase Date Purchase Price Return – Inception Return – TTM Return – YTD
$86.02 50 $4,301
7/30/14
$100.30
(14.2%) (14.2%) (14.2%)
Recommendation Original Target Price Updated Target Price
Hold $113.00 $95.00
Share Price Market Cap (mm) P/E 2013 P/E 2014 EV/EBITDA 2013 EV/EBITDA 2014 P/B P/TBV ROE 2013 Dividend Yield D/E Debt Rating
$86.02 $1,985
15.4x 9.8x
7.1x 4.9x
2.4x 2.4x
27.7% 1.0%
2.4% NR
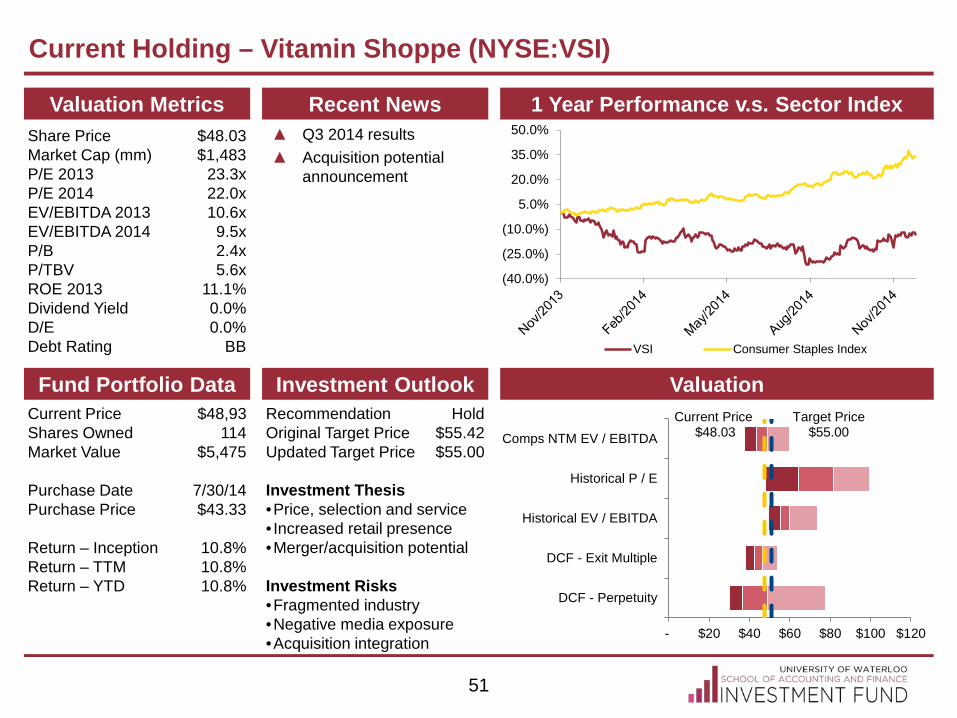
1 Year Performance v.s. Sector Index
Current Holding – Vitamin Shoppe (NYSE:VSI)
Valuation Metrics Share Price Market Cap (mm) P/E 2013 P/E 2014 EV/EBITDA 2013 EV/EBITDA 2014 P/B P/TBV ROE 2013 Dividend Yield D/E Debt Rating
$48.03 $1,483
23.3x 22.0x 10.6x
9.5x 2.4x 5.6x
11.1% 0.0%
0.0% BB
Recent News
Valuation Fund Portfolio Data Investment Outlook Current Price Shares Owned Market Value Purchase Date Purchase Price Return – Inception Return – TTM Return – YTD
$48,93 114
$5,475
7/30/14 $43.33
10.8%
10.8% 10.8%
Recommendation Original Target Price Updated Target Price
Hold $55.42 $55.00
Investment Thesis •Price, selection and service • Increased retail presence •Merger/acquisition potential Investment Risks •Fragmented industry •Negative media exposure •Acquisition integration
▲ Q3 2014 results ▲ Acquisition potential
announcement
51
(40.0%)
(25.0%)
(10.0%)
5.0%
20.0%
35.0%
50.0%
VSI Consumer Staples Index
Current Price $48.03
Target Price $55.00
- $20 $40 $60 $80 $100 $120
DCF - Perpetuity
DCF - Exit Multiple
Historical EV / EBITDA
Historical P / E
Comps NTM EV / EBITDA

1 Year Performance v.s. Sector Index
Current Holding – National Bank (TSX:NA)
Valuation Metrics Share Price Market Cap (mm) P/E CT1 Capital Ratio P/TBV ROE ROCE Dividend Yield
$53.13 $17,462 12.1x 9.1%
2.9x 16.5%
18.6% 3.6%
Recent News
Valuation Fund Portfolio Data Investment Outlook Recommendation Original Target Price Updated Target Price
Hold $47 $65
Investment Thesis •Strong Wealth Management •Strong Financial Markets Investment Risks •Lack of Geographical Diversity •Complicated Regulatory Environment
▲ Q3 2014 results
52
Current Price Shares Owned Market Value Purchase Date Purchase Price Return – Inception Return – TTM Return – YTD
$53.13 108
$5,740
7/31/12 $37.38
30.4%
19.8% 20.3%
35 45 55 65 75
52 Week Range
DDM
Forward PEG
LTM P/Book
NTM P/E
LTM P/E
(10%)
-
10%
20%
30%
Nov-13 Nov-14National Bank of Canada S&P/TSX Capped Financials Index
19.8%
13.8%

1 Year Performance v.s. Sector Index
Current Holding – Bank of Nova Scotia (TSX:BNS)
Valuation Metrics Share Price Market Cap (mm) P/E CT1 Capital Ratio P/TBV ROE ROCE Dividend Yield
$70.50 $85,769 12.0x
13.0% 2.6x
15.2% 16.4%
3.7%
Recent News
Valuation Fund Portfolio Data Investment Outlook Recommendation Original Target Price Updated Target Price
Increase $78 $80
Investment Thesis •Strong capital position •Solid risk management • International exposure Investment Risks •Geopolitical instability •Complicated regulatory environment
▲ Q3 2014 results ▲ Announced series of
charges totaling $451M, including restructuring of Canadian and International operations
53
Current Price Shares Owned Market Value Purchase Date Purchase Price Return – Inception Return – TTM Return – YTD
$70.50 190
$13,406
3/22/13 $59.18
23.1%
11.8% 10.1%
$40 $50 $60 $70 $80 $90 $100
52 - Week Range
DDM
LTM P/E
NTM P/E
LTM P/BV
LTM P/TangBV
NTM PEG
(10%)
-
10%
20%
Nov-13 Nov-14The Bank of Nova Scotia S&P/TSX Capped Financials Index
12.1%13.8%

1 Year Performance v.s. Sector Index
Current Holding – Artis REIT (TSX:AX.UN)
Valuation Metrics Share Price Market Cap (mm) P/AFFO P/FFO P/TBV ROE Distribution Yield FFO Payout Ratio
$15.88 $2,159 13.7x
11.5x 0.9x
5.2% 6.8%
74.7%
Recent News
Valuation Fund Portfolio Data Investment Outlook Recommendation Original Target Price Updated Target Price
Increase $18 $17
Investment Thesis •Well positioned in Canada and US •Rent increase on renewals Investment Risks •Declining occupancy rate •High rate exposure
▲ Q3 2014 results ▲ Completion of Doris
acquisition
54
Current Price Shares Owned Market Value Purchase Date Purchase Price Return – Inception Return – TTM Return – YTD
$15.88 495
$7,860
7/31/13 $14.50
18.4%
18.2% 15.7% $9 $14 $19 $24 $29 $34
52 Week Range
NAV (Cap: 5.43 -7.43%)
LTM P/FFO
LTM P/AFFO
(10%)
-
10%
20%
Nov-13 Nov-14Artis Real Estate Investment Trust S&P/TSX Capped Financials Index
18.2%
13.8%

1 Year Performance v.s. Sector Index
Current Holding – Dream Office REIT (TSX:D.UN)
Valuation Metrics Share Price Market Cap (mm) P/AFFO P/FFO P/TBV ROE Distribution Yield FFO Payout Ratio
$26.96 $3,014 11.2x
9.6x 0.8x
12.7% 8.3%
56.7%
Recent News
Valuation Fund Portfolio Data Investment Outlook Recommendation Original Target Price Updated Target Price
Hold $35 $30
Investment Thesis •High quality portfolio •High occupancy rates •Geographic Diversity Investment Risks •Limited growth opportunities •Refinancing rate risk •Exposure to office market
▲ Q3 2014 results ▲ Completion of Doris
acquisition
55
Current Price Shares Owned Market Value Purchase Date Purchase Price Return – Inception Return – TTM Return – YTD
$26.96 180
$4,813
11/29/13 $28.00
4.6%
4.6% 1.5%
$20 $30 $40 $50 $60
52 - Week Range
NAV (Cap: 5.78 - 7.78%)
LTM P/FFO
LTM P/AFFO
(10%)
-
10%
20%
Nov-13 Nov-14Dream Office Real Estate Investment Trust S&P/TSX Capped Financials Index
4.6%
13.8%