fall 2007 issue 50 table of contents for fall 2007, issue ... · by chad martini, 2007 chair as...
TRANSCRIPT
1
Fall 2007 Issue 50
Table of Contents for Fall 2007, Issue 50 MN GIS/LIS Consortium………………………………………………………………3 MN GIS/LIS 2007 Fall Conference, By Rebecca Foster, Conference Chair Silent Auction at Fall Conference, By Jane Mueller, Professional Development Committee Chair From the Chair, By Chad Martini, 2007 Chair 2007 Mn GIS/LIS Polaris Awards Student Scholarship Competition, By Banette Kritzky, Scholarship Chair Our 50th Issue!, By Don Yaeger, Mn GIS/LIS News Editor, Retired from LMIC
State…………………………………………………………………………………...….8 New Budget Restores LMIC Funding, By David Arbeit, Office of Geographic and Demographic Analysis Updated Statewide Parcel Map Inventory Online, By Jay Krafthefer, Mn/DOT and Norman Anderson, Land Management Information Center Geodetic Control Monument Coordinates Now Published in Feet, By Richard Morey, Minnesota Department of Transportation
Governor's Council……………………………………………………………………..11 Governor’s Council Welcomes New Members 2007 Annual Report Online GIS Seminar for LCCMR, By Will Craig, University of Minnesota Council Sponsors Regional Panel in St. Cloud
Regional…………………………………………………………………………………14 New Metropolitan Council Maps Webpages, By Jessica Deegan and Alison Slaats, GIS Staff, Metropolitan Council MetroGIS Vision for Regional Addresses Points Dataset Closer to Reality, By Matthew McGuire, Project Manager – MetroGIS Web Editing Application (Address Points) Viability Assessment and Mark Kotz, MetroGIS Address Workgroup Staff
Local…………………………………………………………………………………..…17 New Funding Source for Land Data, By Will Craig, CURA, University of MinnesotaNow, Anyone Can Create Web Mapping Applications – Announcing GeoMoose!, Reprinted from Dakota County GIS Newsletter, Summer 2007 Issue Hennepin County GIS Division Creates Mobile Assessor Tool, By Zachary Christoff, Principal Information Technology Specialist, Hennepin County GIS Division Remote Controlled Aircraft Utilized to Collect Aerial Photography, By Jane Mueller, Beltrami County GIS Director Clay County Address System, By Mark Sloan, GIS Coordinator
2
Federal…………………………………………………………………………………..25 USGS Makes Topographic Maps Available Using GeoPDF, From USGS press release USGS Pilot Project Makes High-Quality Landsat Data Available through Web, Adapted from USGS technical announcement TerraLook: Free Satellite Images, Adapted from U.S. Geological Survey TerraLook and NASA JPL websites NOAA Satellites Ready for Distress Calls, From NOAA website USGS Resources for Teachers Online Brochure, From USGS SILS Information Bulletin Higher Education……………………………………………………………………….29 St. Mary’s University Update, By John Ebert, St. Mary’s University K-12 Education…………………………………………………………………..……..30 History Comes Alive with Online GIS!, By Lesley Kadish, Minnesota Historical Society Private………………………………….………………………………………………..32 ESRI Launches New Cartographic Help Site, Adapted from ESRI ArcWatch Newsletter, July 2007 Non-Profits………………………..……………………………………………………..32 Non-Profits Can Apply for Free Access to Google Earth Pro, By Sally Wakefield, 1000 Friends of Minnesota Other Places……………………………………………………………………………..33 Bring Back Geography!, Reprinted with permission of the author and copyright holder, Jerome E. Dobson. New Parcel Study Released, By Will Craig, University of Minnesota MAPPS Loses Lawsuit, From Association of American Geographers website

3
MN GIS/LIS Consortium Time to Register for the Annual Conference By Rebecca Foster, 2007 Conference Chair It’s time to register for the 17th annual Minnesota GIS/LIS Consortium Conference and Workshops. Hopefully, all of you have received your Preliminary Program in the mail – if not, visit www.mngislis.org to review it and register for the conference. As the conference chair, I would like to welcome all of you who have already registered for the conference, and extend a warm invitation to any of you who haven’t yet. The Conference Planning Committee is excited about this year’s event. In addition to it being our first time in Rochester, this year 95% of our workshops will be hands-on! There will be a robust slate of sessions and a full exhibit hall, and the silent auction will run all day Thursday. OVERVIEW
• Wednesday, October 10 o Workshops o Social hour
• Thursday, October 11 o Opening plenary: America’s Secret Eyes in the Sky o Concurrent sessions o Scholarship competition o Awards luncheon o Exhibit hall and vendor reception o Silent and live auction o Beer-tasting o Birds-of-a-feather sessions
• Friday, October 12 o Concurrent sessions o Closing lunch and plenary: Neogeography and the Social Mapping Movement o Member meeting with door prizes
WEDNESDAY Workshops: The event begins with workshops held in the Mayo Civic Center. Come to the Grand Lobby to register, enjoy a continental breakfast and receive your packets in the morning or join us for lunch at 12:15 and attend an afternoon workshop. With a broad offering of hands-on and lecture-style workshops on a variety of topics, we hope that everyone will find something of interest. Social Hour: That evening, be sure to stop by Goonie’s, located just two blocks west of the Civic Center. The Consortium will again host a social hour that evening with complimentary appetizers and comedy! It should be a good time – please try to join us for this fun and free entertainment option. THURSDAY Opening Plenary: Conference registration begins at 7:30 a.m. and we lead things off with a great plenary session. Dr. Keith Clarke, Research Cartographer and Professor, will address the conference and speak about America’s Secret Eyes in the Sky: Implications of the First Real Decade of Remote Sensing. Concurrent sessions begin immediately following the keynote. Six tracks of concurrent sessions run throughout the conference schedule, providing information on a vast array of GIS/LIS-related topics. Learn how others have implemented solutions to issues you might be having, find out about new technology advances and listen to recent research in a field of interest.

4
Scholarship Competition and Awards Lunch: For the third year, outstanding students from across the state will be competing for cash prizes in a dedicated scholarship track. Watch for the competition entries among the student track presentations and in the poster gallery. Thursday’s lunch will spotlight the annual Polaris Awards, given each year by the GIS/LIS Consortium. Exhibit Hall, Vendor Reception and Auction: The exhibit hall, open throughout the show, will be the site of the silent auction held all day Thursday with a live auction during the vendor’s reception, following the concurrent sessions. Vendors will be on hand to share their latest technologies and services. Conference attendees are encouraged to contribute to the silent auction and bid on auction items as all proceeds from this event benefit the Consortium’s scholarship program. Sample the hors d’oeuvres during the Thursday evening vendors’ reception as you make your way through the hall and the poster gallery, where you can meet and talk with the poster presenters and exhibitors. Beer Tasting and Birds-of-a-Feather Sessions: Finally, after the close of the poster gallery and the exhibit hall, join us in the Galleria Ballroom at the Radisson Plaza Hotel for the annual beer tasting. Home brewers are welcome to bring samples to share. Tickets can be purchased at the registration desk or at the door. All proceeds from this event support activities to foster and recognize exceptional up-and-coming GIS professionals. Across the hall from the beer tasting will be three free concurrent Birds-of-a-Feather (common interest groups) sessions. FRIDAY Sessions and Closing Plenary: The conference concludes with concurrent sessions in the morning followed by lunch and the closing plenary session. Our closing lunch will include an awards presentation to this year’s student scholars. Closing the conference will be Ken Hoetmer, Managing Director of Spatial North Technologies, discussing Neogeography and the Social Mapping Movement. Following the lunch will be the Consortium’s brief annual member meeting and awesome door prizes. You must be present to win! We are excited about the conference and related events and hope you are too! It should be a great conference with quality workshops, engaging sessions, full exhibit hall, quality entertainment and an excellent opportunity to network and reconnect with friends and acquaintances. Please let others know about the conference who might not get our materials directly. To register, visit our website at: www.mngislis.org. While there, you can learn more about the conference and contribute to the silent auction! Thanks to each and every one of you who support the Consortium, and we hope to see you all in October! For more information, please contact Rebecca Foster at [email protected] or 952-826-0447. Silent Auction at Annual Conference By Jane Mueller, Professional Development Committee Chair With summer quickly passing and the fall conference coming soon, the GIS/LIS Consortium is asking individuals, vendors and businesses to please consider donating an item to the silent or live auction to be held Thursday, October 11, 2007. Proceeds from the auctions will help support scholarship opportunities for students enrolled in GIS programs across Minnesota. Items will be displayed throughout the day in the exhibit hall and conference goers can place their bids on the silent auction items from 10:00 a.m. – 6:30 p.m. with the awarding of the bids following shortly afterwards. The live auction will take place at 6:00 p.m. Thursday evening during the vendor reception. Anyone can donate items, and, because the Consortium is a non-profit organization with 501(c)3 status, your donation is tax deductible. Some of the items donated thus far include a custom-framed waterfowl print; a vacation package at a resort in northern Minnesota; a cozy winter’s night package; necklace and bracelet set; GIS Fundamentals textbook; lazy susan 3-CD set; and a sixpack of homebrew.

5
Anyone wishing to donate items can contact: • Banette Kritzky: [email protected] or 651-602-7905 • Jane Mueller: [email protected] or 218-333-8457 • Julie Adams: [email protected] or 218-999-7943
From the Chair By Chad Martini, 2007 Chair As October approaches, the GIS/LIS conference committee continues to get busier and busier preparing for the Rochester conference. Rebecca Foster and her team of volunteers have been working for months to get all the fine details in order before you arrive in October. The 17th annual conference will be held in Rochester at the Mayo Civic Center. Workshops will again kick off the conference on October 10, with the conference itself beginning on October 11. Entertainment at this year’s conference will include a social hour and comedy on October 10 and the annual beer tasting to be held on the 11th. A silent auction to benefit the GIS/LIS scholarship program will again be held this year. Anyone wishing to donate items should contact Jane Mueller at 651-602-7905. Thanks for all the hard work, Jane! The Consortium will again be sponsoring a student scholarship competition. I would like to extend my thanks to Banette Kritzky and the scholarship committee for all of their work. GIS/LIS will be awarding $5000 worth of scholarships at the 2007 conference. All of the student participants will receive $200 whether or not they win a scholarship. I encourage all of you to check out one or more of the student competitions and see what these bright minds have to offer. I am also excited to announce the 2007 Polaris Award Winners. Congratulations to Randy Johnson of MetroGIS, Ben Verbick of LOGIS, and Sally Wakefield of 1000 Friends of Minnesota. The Polaris Leadership Award was established in 2003 to honor mid-career professionals who are guiding stars to the rest of us. I believe that these three individuals are very deserving and will make outstanding additions to the growing group of Polaris winners. Thank you, Chad Martini, [email protected] 2007 Polaris Winners The Polaris Leadership Award was established in 2003 to honor mid-career professionals who are guiding stars to the rest of us. Minnesota’s motto is L’Etoile du Nord (“Star of the North,” also called Polaris). Since Polaris is a triple star, we honor three leaders each year. This year’s winners are: Randall (Randy) Johnson, MetroGIS Randy is the soul of MetroGIS and a national leader for regional collaboration. Ben Verbick, LOGIS Ben is a leader for GIS in cities and a champion for cities in the region. Sally Wakefield, 1000 Friends of Minnesota Sally is a leader with an amazing ability to make things happen. More details on the award and past years’ winners can be found at: http://www.mngislis.org/displaycommon.cfm?an=1&subarticlenbr=65

6
Student Scholarship Competition News By Banette Kritzky, Scholarship Chair During the Consortium’s 2007 fall conference in Rochester, we will again host a student scholarship winner competition. If you did not have an opportunity to watch last year’s bright and enthusiastic students, let me invite you to attend this year’s competition on October 11 and 12. Each student scholarship winner receives a complimentary registration to the annual conference (worth $230) and will be presented a certificate at the awards luncheon on Thursday. The competition winners will be recognized during the Friday luncheon. The competition tracks will be as follows – look for room locations in the conference program:
1. Undergraduate Competition: a. Thursday afternoon 1:30 – 3:00 b. Thursday afternoon 3:30 – 5:00
2. Poster Competition: a. Thursday during vendor reception b. The posters will be on display in the map gallery; the timing of the poster competition is
still being determined
3. Graduate Competition: a. Friday morning 8:30 – 10:00
Prizes for each of the competitions are as follows:
1st Prize 2nd Prize • Graduate Students – paper and presentation $1,000.00 $500 • Undergraduate Students – presentation $800.00 $400 • Community College Students – poster $500.00
In addition, those student winners who participate in the competition, but do not win a prize in their category, will receive $200. Each category will be judged on presentation and substance and must be based on an original research project. Below is a list of the topics that the students will present: 2007 Graduate Competitors: Andrew Moore – University of Minnesota, Mankato The Integration of Retail Site Location Analysis, Spatial Interaction Models and Geographic Information Systems Jason Menard – University of Minnesota Anisotropic Least-Cost Modeling of Roman Roads in Cumbria, United Kingdom using ArcGIS and Idrisi Kurt Swendson – St. Mary’s University A Comparative Analysis of Programming Languages for GIS Kunwar Krishna Veer Singh, St. Cloud State University No information yet received

7
2007 Undergraduate Competitors: Mark Balwanz – University of Minnesota, Mankato Improving the Efficiency of the Twin Cities Park and Ride System Using GIS Michael Boucher – Bemidji Tumen River Project: Application of GIS in exploring the economic potentials Breanna Duffey, University of St. Thomas No information yet received Matthew Petcoff, Macalester College No information yet received Jason Reinhart – St. Cloud State University Analysis of Upstream Phosphorus Loading to Big Sauk Lake Jonathan Schultz, University of Minnesota, Duluth No information yet received Teresa Sperl, University of Minnesota Goodhue County Municipal Growth Zones 2007 Poster Competitors: Kristin Hanson, Fond du Lac Tribal and Community College No information yet received Colin Lee – Anoka Ramsey Community College Disk Golfing in Inver Grove Heights Samantha Mann – Itasca Community College Wetland Mapping: Assessment of Seasonal Imagery Utilized to Delineate Wetlands in Minnesota Congratulations and good luck to all of the student scholarship winners! Silent / Live Auction: Also, don’t forget to stop by the auction booth to bid on some of the terrific items donated to help support our efforts to provide scholarships to future GIS students. If you have any questions, please contact me at [email protected] or 651-602-7905. Our 50th Issue! By Don Yaeger, MnGIS/LIS News Editor, Retired from LMIC This issue of MnGIS/LIS News marks our 50th! The first issue was released in Fall 1988 and was called the Natural Resources GIS News. It contained three pages of information (no graphics – how technology has changed!) on the establishment of the “Minnesota Natural Resources (MN-NRGIS) Consortium,” GIS at Bemidji State University, and News from LMIC, from NRRI, and from The University of Minnesota Remote Sensing Laboratory. Lucinda B. Johnson of the Natural Resources Research Institute was the first editor. Both our organization and the newsletter have greatly evolved over the years. When I was working on the newsletter while at the Land Management Information Center, I would receive calls from other states asking how big our “paid staff” was. I pointed out that the organization was all volunteers. I said that much of the newsletter coordination was done by key staff at LMIC, the University of Minnesota and other organizations as part of their commitment to GIS coordination in the state, and that volunteers – GIS users in state, federal, local, educational, non-profit and private sector employment – wrote all of the articles. This was usually met with silence and then a comment about the unique level of cooperation within Minnesota’s GIS community.
8
I think that cooperative/volunteer feeling is still strong in Minnesota. The organization is still run by a volunteer board. This newsletter is useful and expansive because of volunteer contributors from all over the state. Please continue to contribute articles and suggestions using the process outlined on the newsletter website: http://www.mngislis.org/displaycommon.cfm?an=1&subarticlenbr=69. We have placed past newsletters distributed since 1999 (issue #21) online at http://www.mngislis.org/displaycommon.cfm?an=1&subarticlenbr=70. And please stay or become involved in other Minnesota GIS/LIS Consortium activities to continue to foster the cooperative spirit as we progress toward Issue 100! State New Budget Restores LMIC Funding By David Arbeit, Office of Geographic and Demographic Analysis On May 25, 2007, Governor Tim Pawlenty signed a State Government Finance bill that funds the Land Management Information Center for the 2008 and 2009 fiscal years. The bill provides $889,000 for FY08 and $895,000 for FY09. The approved budget is about $200,000 less than a bill passed by the Legislature earlier in the session but vetoed by the Governor; however, it represents a ten percent increase over LMIC’s 2007 budget. Perhaps more importantly, the appropriation formalized a “base” budget, reducing the uncertainty that has clouded LMIC’s future since its budget was first threatened with reductions in 2005. Why It Happened LMIC’s budget was restored because the Legislature listened to the GIS community. From the time the Governor proposed his budget in January until the very end of the legislative session, LMIC stakeholders – those it serves and its partners – provided compelling testimony about LMIC’s importance. Support came in the form of emails, letters, phone calls, and testimony at hearings in both the House and the Senate. The response was so compelling that one Senator remarked at a budget hearing: “I’ve heard more from constituents about LMIC’s budget than about any other issue, including transportation.” He was not alone; several legislators made a special point to speak publicly about the support LMIC received from its community. The Silver Lining Minnesotans know about weather and successfully weathering a storm has its benefits. At the eye of a budget storm that began in 2005, LMIC staff had good reason for anxiety. Proposed budget cuts resulted in reorganization and downsizing. Few would blame them for being demoralized, perhaps even dysfunctional, but they remained committed to supporting Minnesota’s GIS community despite the turbulent environment. Staying positive was made easier by the public and private expressions of support brought on by the threat. Under less threatening circumstances, we only occasionally hear from stakeholders about LMIC’s value. But clearly, LMIC services were needed and would be missed. What It Means LMIC would have strived to serve Minnesota’s GIS needs even with more limited resources, but the restored funding allows us to express thanks by renewing our commitment to service. Expect a special emphasis on coordination, the Geographic Data Clearinghouse, expanded web services, and advocacy for issues important to Minnesota’s GIS community. In all of these areas, we will continue to promote integrated approaches that support and leverage the great work being done throughout the state. I hope you will continue to let us know how we’re doing.

9
Updated Statewide Parcel Map Inventory Online By Jay Krafthefer, Mn/DOT and Norman Anderson, Land Management Information Center The Statewide Parcel Map Inventory (SPMI), originally conducted and published by the Minnesota Department of Transportation in 2003, has been updated for June 2007 – results are available through an online mapping and reporting tool developed at the Land Management Information Center (LMIC): http://www.lmic.state.mn.us/chouse/SPMI/. This project collected updated information about Minnesota’s efforts to develop digital parcel data and mapping capabilities. It was funded by Mn/DOT’s Office of Land Management and conducted by LMIC. Survey Procedure Results from previous inventories (2003, 2004) were used to populate the 2007 online survey instrument developed and hosted by LMIC. Previous respondents were then asked to visit the online survey and update information about their organization. In addition to the state’s 87 counties, 6 cities, 11 tribal governments and both the Chippewa and Superior National Forests have now contributed to the inventory. The survey asked questions regarding each organization’s development of digital parcel data and characteristics of those data. Specific questions were asked about data accuracy, availability and attributes. Contact information for each organization was collected as well. Site Enhancements Updated results are served via a Mapserver application developed by LMIC in 2004 and enhanced for 2007. Custom maps and reports can be generated from the site. Full text reports for each respondent are also available. Users can easily define which unit of government, survey questions or area of the state they are interested in querying. Beginning in 2007, organizations can easily update their data on an on-going basis through a suite of new administrative tools LMIC has added to the application. Findings This updated survey found a slight increase in the number of organizations creating digital parcel data, but perhaps more significantly, found a larger increase in the total percentage of digital parcel data coverage within many local units of government. There was a 41.3% increase between 2004 and 2007 in the number of counties which have completed more than 75% of their digital parcel data. Uses This survey is important to Mn/DOT when conducting road right-of-way studies for local transportation initiatives and is also important to many others. Organizations still developing digital parcel data can better understand how their colleagues are managing

10
their data. Local units of government can learn about their neighbors’ development. Eventually, this inventory may lead to uniformity in practice and reduction in data duplication by sharing information about governmental parcel development efforts. Feedback Welcomed We look forward to review and comment by the Minnesota GIS community and hope that this inventory will be useful across the state. Please visit the SPMI 2007 site at: http://www.lmic.state.mn.us/chouse/SPMI/ and let us know what you think! Results from previous inventories are still accessible. Also, a session is being planned on the process and findings of the new inventory at the MN GIS/LIS Conference in October 2007. For more information, contact Jay Krafthefer at [email protected] or 651-366-3463, or Norman Anderson at [email protected] or 651-201-2483. Geodetic Control Monument Coordinates Now Published in Feet By Richard Morey, Minnesota Department of Transportation At the request of several Minnesota surveying and GIS organizations, the National Geodetic Survey (NGS) will now publish state plane coordinates for Minnesota’s geodetic control monuments in feet as well as in meters; the conversion will be based on the U.S. Survey Foot. These monuments are used by the surveying and GIS communities, and most users would like the coordinates published in English (feet) units. For the current datum, NAD83, NGS publishes the coordinates only in metric units until a state informs them which conversion factor the state would like them to use to convert meters to feet. There are two different conversions:
• The international (SI) based upon 1 inch = 2.54 centimeter • The U.S. Survey Foot based upon 1 meter = 39.37 inches.
While the difference between the two factors is not large, it makes a difference over large distances such as those represented by the state plane coordinate system. States can specify the conversion factor either through legislation or through a letter from the main surveying and GIS organizations within the state agreeing upon which conversion factor to use. Minnesota had not enacted such legislation, although the preferred conversion factor may be inferred by the fact that M.S. 505.20 specifies that NAD27 coordinates are expressed in “U.S. Survey Feet” and NAD83 coordinates are expressed in “meters.” In the absence of legislation, the following groups requested that NGS provide Minnesota’s geodetic control monument locations in English coordinates using the U.S. Survey Foot as the conversion factor:
• Minnesota Department of Transportation • Minnesota Society of Professional Surveyors • Minnesota Association of County Surveyors • Minnesota GIS/LIS Consortium • Minnesota Governor’s Council on Geographic Information
The letter is posted at: http://www.gis.state.mn.us/Policies/NGS_coordinates.pdf For more information, contact Richard Morey at: [email protected] or 651-366-3504.

11
Governor's Council Governor’s Council Welcomes New Members Minnesota Department of Administration Commissioner Dana Badgerow has appointed three new members to the Minnesota Governor’s Council on Geographic Information for Fiscal Year 2008. She has also reappointed 15 current members and has requested that Rick Gelbmann continue as the council’s chair. Council members will be working together on issues related to the continued development and coordination of geographic information technology across Minnesota. Members represent a broad range of GIS professionals including state, county and local government, academia, nonprofits and the private sector. More information is available about the council and its members at its website: www.gis.state.mn.us New council members:
• Kris Eide, Minnesota Department of Public Safety • Tad Schindler, Minnesota Pollution Control Agency • Gerry Sjerven, Natural Resources Research Institute
Returning council members:
• Jeff Bloomquist, U.S. Department of Agriculture, Farm Service Agency • Gordon Chinander, Metropolitan Emergency Services Board • Will Craig, University of Minnesota • Mike Dolbow, Minnesota Department of Agriculture • Rick Gelbmann, Metropolitan Council (chair) • Jeff Grussing, United Services Group / Great River Energy • Jonette Kreideweis, Minnesota Department of Transportation • Stuart Lien, Clearwater County • Shannon Flynn, Minnesota Department of Natural Resources • Tim Ogg, Minnesota Board of Water and Soil Resources • Victoria Reinhardt, Ramsey County • Ken Saffert, City of Mankato • Mark Sloan, Clay County • Bill Swing, Wright County • Sally Wakefield, 1000 Friends of Minnesota
Ex-officio members: In addition, five organizations hold ex-officio seats on the council. Those members are:
� David Arbeit, Land Management Information Center � Lee Meilleur, Minnesota Legislative Coordinating Commission � Eileen Quam, Minnesota Office of Enterprise Technology � Sally Wakefield, Minnesota GIS/LIS Consortium � Ron Wencl, United States Geological Survey
2007 Annual Report Online The FY2007 annual report for the Governor’s Council on Geographic Information summarizes accomplishments from the past year and outlines planned activities for the next. It is online at http://www.gis.state.mn.us/pdf/AnnualReport-GCGI-2007.pdf. Council accomplishments are presented in four categories. Highlights of each are listed below: • Help people and organizations get the data they need
Launched a new Digital Elevation Committee to advocate improving the state’s elevation data. • Communicate with Minnesota’s GIS stakeholders
Held a well-attended meeting in St. Cloud focusing on regional collaborations; connected with key

12
stakeholder groups through conferences and newsletters: the GIS/LIS community, Minnesota counties, and the IT, surveying, and utility communities.
• Coordinate federal, state, regional, and local activities Launched a strategic planning effort to help the state better coordinate its GIS activities; helped to organize a new Minnesota County GIS Association.
• Develop standards and guidelines that support data sharing Requested that the National Geodetic Survey publish State Plane Coordinates in both meters and feet; contributed to the proposed National Street Address Standard.
Plans for next year include continuing the strategic planning process; working with the Office of Enterprise Technology to integrate geospatial technology with the state’s enterprise technology environment; determining costs and funding options for statewide elevation data; and reviewing and commenting on the proposed federal Wetland Mapping Standard. Details of those activities are subject to modification by next year’s committees. You do not need to be a council member to participate on a committee. See http://www.gis.state.mn.us/committe/ for more information – this is your chance to get involved!
GIS Seminar for LCCMR By Will Craig, University of Minnesota
The Governor's Council, with assistance from the MN GIS/LIS Consortium, presented a Natural Resources Data Seminar to LCCMR on June 6, 2007. LCCMR, the Legislative-Citizen Commission on Minnesota Resources, recommends environmental and natural resource projects to be funded by the state from the proceeds of the state lottery and other sources. Nearly $23 million in projects are funded in the current biennium. Many of the proposed projects had a GIS component - LCCMR members requested the seminar to increase their knowledge of GIS to help them make more informed decisions about recommending these projects.
The session was moderated by Will Craig, Associate Director for the Center for Urban and Regional Affairs at the University of Minnesota. Tim Loesch, GIS Manager at the Minnesota Department of Natural Resources, provided background on the nature of GIS and followed with examples of the use of GIS in natural resources management and analysis. Steve Kloiber, Environmental Analyst at the Metropolitan Council, provided an overview of GIS data and how it is collected. The full slide show is available from
http://www.lccmr.leg.mn/ItemsforMeetings/2007/2007-06-06LCCMRMtg/20070606presentation.pps

13
The seminar was very well received. The great majority of LCCMR members were present. They were quite engaged, asking pointed questions about data quality and data availability. One of the main points of the presentation was that a high quality collection of core data will be used many times, sometimes in innovative ways that lead to significant breakthroughs. The presentation also focused on the status of that core data and pointed to some significant weaknesses including old wetland maps, outdated land use data, and incomplete or inaccessible county parcel maps. Improving that data will require new funding. Commission members raised questions about inconsistent data from well-drillers and others responsible for point-level environmental data. Improving that data will require new rules and regulations. LCCMR also seemed quite interested in supporting a new survey of data and information needs for natural resource and environmental professionals.
Council Sponsors Regional Panel in St. Cloud Regional organizations provide an important vehicle to coordinate GIS activities among all levels of government in Minnesota. To learn more about these organizations, the Governor’s Council on Geographic Information sponsored a forum devoted to “Models for Regional Collaboration” at its May 16, 2007 meeting in St. Cloud. The forum provided an opportunity to share ideas and experiences about regional coordination and to provide guidance to the state’s efforts to develop a statewide strategy for GIS coordination. Seven panelists represented the following groups:
• Arrowhead Regional Development Commission: John Chell • Central Minnesota GIS Users Group: Pete Knutson • Fargo-Moorhead Metropolitan GIS Committee: Mark Sloan • MetroGIS: Randy Johnson • Pine to Prairie GIS Users Group: Rick Moore • Southeast Minnesota GIS Users Group: Dave Wavrin • Southwest Minnesota GIS Users Group: Charlie Kost
The panelists provided written answers to questions asked in advance about how their organization was set up, what was working well and what was presenting challenges. See the written responses at: http://www.gis.state.mn.us/Minutes/handouts/07_May/panel_questions_compiled.pdf A lively discussion followed between the panelists and the audience. Key points made were:
• Many different models are working across the state. There is no need to settle on one. • Collaboration requires a cultural change of looking beyond one’s borders to work for the greater
public good. • Choosing a project that will quickly provide benefits to the collaborators will strengthen the
commitment to the effort. • High level policy makers must be included in collaboration efforts to increase the clout to get
things to happen. • The focus must be on public services and business needs and how GIS/IT helps provide those
services. • Any efforts to foster and coordinate GIS activities should be tied to a technology strategic plan,
not just a GIS plan. • The benefits of GIS need to get to “non-users groups” as well as users groups.

14
• Any collaboration needs resources. The apparent resources include outside grants and contracts, energetic volunteers, and government bodies working to meet their own business needs.
• Some level of sustainable state funding is required to provide a level playing field. • Smaller, less developed places are looking for state leadership that will help them move forward
without making major mistakes. • It would help to have regional integrators as connectors between the state and local levels, but it is
not clear what the regional entities would be. • Data sharing requires standards and metadata. • There was consensus that discussions should continue and that we should work towards
acceptable state-wide collaboration models. For more detail about the discussion and about a related presentation on “Natural Resources Inventory Collaboration” by Mark Hauck of the Minnesota Department of Natural Resources, see the meeting minutes: http://www.gis.state.mn.us/Minutes/gn_07may.pdf The Council would like to express its appreciation to Pete Knutsen at Stearns County for hosting the meeting and to all the presenters for their active participation and insights. If you missed the panel and want to learn more or join in the discussion, please consider attending a similar panel at this year’s GIS/LIS conference in Rochester – check the final conference program when it’s available for details: http://www.mngislis.org/displaycommon.cfm?an=1&subarticlenbr=155. Regional New Metropolitan Council Maps Webpages By Jessica Deegan and Alison Slaats, GIS Staff, Metropolitan Council A beta version of new Maps webpages (http://gis.metc.state.mn.us/maps), offering applications and tools that provide maps and information about communities in the Twin Cities seven county metro area, has recently been released by the Metropolitan Council. “We listened to our website users, including the public, planners and GIS professionals, who told us that map-related information was dispersed throughout the Metropolitan Council website with little cohesiveness,” said Rick Gelbmann, GIS Manager. “Users want easier access to maps and data, preferably in one place on the website. Also, we heard that datasets need to be easier to understand and use – and ideally we should offer some added value – so that we provide information instead of raw data.” While many departments at Met Council have a strong record of performing GIS and data analyses to provide useful information, this was not reflected on the website. The beta release of Maps marks the start of Met Council’s effort to share this work via the web.

15
For example, instead of providing raw population numbers, the Council now offers charts showing population trends in communities and maps showing the spatial distribution of population. Met Council plans to add much more to its maps pages as time goes on, with the goal of integrating geographic data with other datasets to provide information that is pertinent and useful for the public, planners and GIS professionals. You are encouraged to take a look at the Maps pages, where you can:
• quickly profile any community in the Metro – the profile includes facts such as a community’s size, location, current population, and household and employment statistics, as well as links to its website and district and sector representative.
• explore planned land use, existing land use and demographic changes, • find and print one of more than 1000 pre-made maps in our map Gallery, • make a custom map suitable for printing with access to over 100 data layers and a suite of
mapping tools.
We value your feedback and suggestions – please send your comments to [email protected]
MetroGIS Vision for Regional Addresses Points Dataset Closer to Reality By Matthew McGuire, Project Manager – MetroGIS Web Editing Application (Address Points) Viability Assessment and Mark Kotz, MetroGIS Address Workgroup Staff
MetroGIS’s vision for a Regional Addresses Points (Occupiable Units) Dataset moved closer to reality in July with positive results in the “Web Editing Application for Occupiable Units Dataset Viability Assessment,” conducted for MetroGIS by Brad Henry with URS/BRW. A subgroup of the MetroGIS Address Workgroup coordinated the assessment. The final project report is at: http://www.metrogis.org/data/info_needs/street_addresses/webedit_viability_ assessment_final.pdf.
Value of the Dataset The vision for the Address Point dataset recognizes missing address data in existing MetroGIS datasets.
16
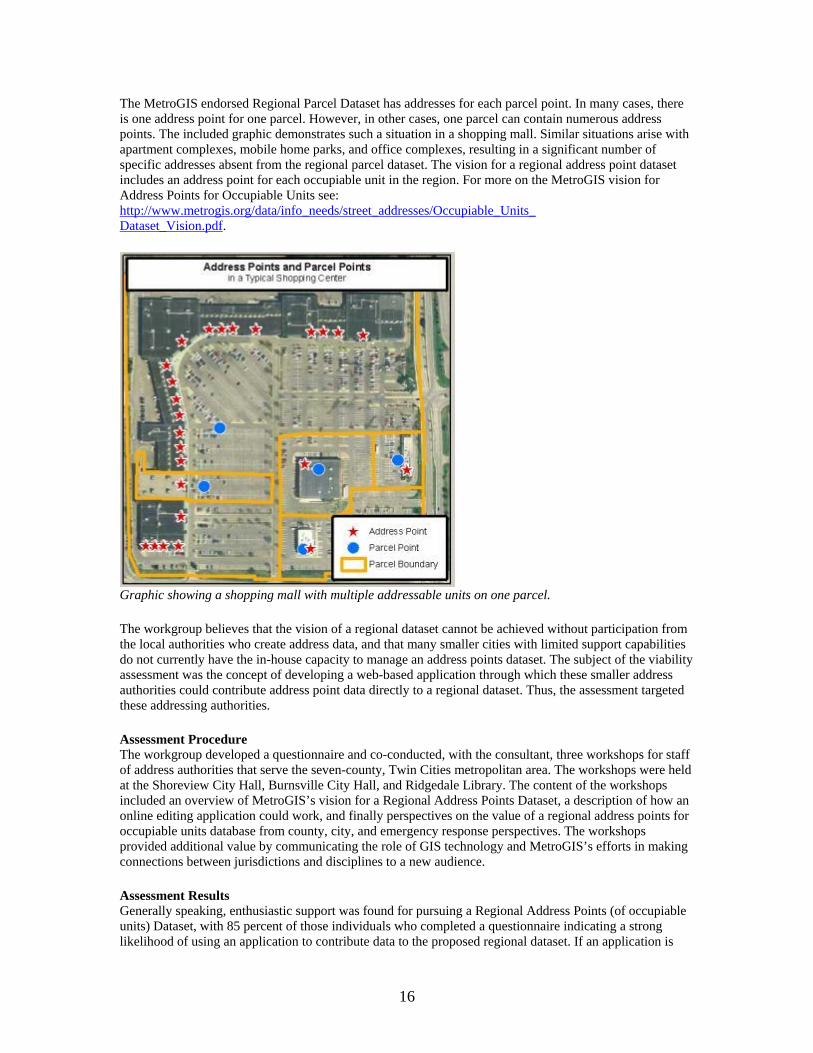
The MetroGIS endorsed Regional Parcel Dataset has addresses for each parcel point. In many cases, there is one address point for one parcel. However, in other cases, one parcel can contain numerous address points. The included graphic demonstrates such a situation in a shopping mall. Similar situations arise with apartment complexes, mobile home parks, and office complexes, resulting in a significant number of specific addresses absent from the regional parcel dataset. The vision for a regional address point dataset includes an address point for each occupiable unit in the region. For more on the MetroGIS vision for Address Points for Occupiable Units see: http://www.metrogis.org/data/info_needs/street_addresses/Occupiable_Units_ Dataset_Vision.pdf.
Graphic showing a shopping mall with multiple addressable units on one parcel.
The workgroup believes that the vision of a regional dataset cannot be achieved without participation from the local authorities who create address data, and that many smaller cities with limited support capabilities do not currently have the in-house capacity to manage an address points dataset. The subject of the viability assessment was the concept of developing a web-based application through which these smaller address authorities could contribute address point data directly to a regional dataset. Thus, the assessment targeted these addressing authorities.
Assessment Procedure The workgroup developed a questionnaire and co-conducted, with the consultant, three workshops for staff of address authorities that serve the seven-county, Twin Cities metropolitan area. The workshops were held at the Shoreview City Hall, Burnsville City Hall, and Ridgedale Library. The content of the workshops included an overview of MetroGIS’s vision for a Regional Address Points Dataset, a description of how an online editing application could work, and finally perspectives on the value of a regional address points for occupiable units database from county, city, and emergency response perspectives. The workshops provided additional value by communicating the role of GIS technology and MetroGIS’s efforts in making connections between jurisdictions and disciplines to a new audience.
Assessment Results Generally speaking, enthusiastic support was found for pursuing a Regional Address Points (of occupiable units) Dataset, with 85 percent of those individuals who completed a questionnaire indicating a strong likelihood of using an application to contribute data to the proposed regional dataset. If an application is

17
developed, the assessment estimates 20-40 percent of address authorities (mostly cities) that serve the seven-county area of the Twin Cities would use an online application to update this dataset. The Address Workgroup expects additional address authorities managing their own address point dataset to contribute to the regional dataset through other channels.
Next Step The next step toward a Regional Address Point Dataset (for occupiable units) will be a recommendation from the Address Workgroup to the MetroGIS Coordinating Committee on how to move forward. The Address Workgroup will use the assessment as a basis for its recommendation.
For more information, contact Mark Kotz, MetroGIS Address Workgroup staff, at [email protected] or 651-602-1644.
Local New Funding Source for Land Data by Will Craig, CURA, University of Minnesota Many counties are using a new source of funds to speed the conversion of parcel data to digital form and for other land related activities. The new source is an increase of $11 in the document fee that counties charged for recording deeds or other documents added as a result of a change in State Statute beginning in 2005. These fees can add up to a significant amount of money for some counties. The popular name of this extra $11 is the “Recorder Compliance Fund.” The name is a misnomer, because the extra funds can be used elsewhere. This article provides details about the fund source and examples of how four counties are using those funds to improve their land record systems. State law calls these “unallocated” funds and allows the money to be used to fund related improvements to the land records system, including GIS.
“This money is available as authorized by the Board of County Commissioners for supporting enhancements to the recording process, including electronic recording, to fund compliance efforts … and for use in undertaking data integration and aggregation projects. ... This money must not be used to supplant the normal operating expenses for the office of county recorder or registrar of titles.” (MS357.182, Subd. 7)
Otter Tail County has taken advantage of this new funding source to complete its parcel mapping. They have been raising about $140-200,000 per year and decided to put half those funds into GIS. Brian Armstrong, the Spatial/Address Coordinator in the GIS Department, says the county was about 50 percent complete with its parcel mapping, and other departments were already seeing significant benefits of those maps. A committee authorized to study best usage of the new funds recommended to the Board that $70,000/year go to completing the parcel map. The parcel map will be completed in 2007, but Armstrong sees other land-related needs that could be addressed with these funds in future years: “Our county ditch maps are very old. And mapping emergent aquatic vegetation is an important environmental issue in Otter Tail County.” Steele County had already completed its parcel map, but they lacked a way for county land office employees to access that data. Compliance funds were used to upgrade software and to migrate parcel shapefiles to the geodatabase format. Then, according to Dave Wavrin, the county GIS Coordinator, funding was provided to create an internal web-based portal for access to GIS data for over 40 Steele County employees. Access to this portal was also provided to other governmental entities with close ties to Steele County, tightly controlled by internal system administrator rights. The next step, also supported by compliance funds, was to provide public web access to a slightly less robust version of the GIS data. Next, Wavrin hopes to use the fund to upgrade ArcView users to ArcGIS 9.x versions and to acquire hardware and software for a GIS intern for the summer of 2008.

18
Beltrami County has also completed its parcel map, but the geodetic control is unreliable. According to Jane Mueller, County GIS Director, some section corners are off by 100 feet or more depending on the source of the section corner information utilized at the time the mapping was compiled. The county board heard other ideas for using the funds, but felt that an aggressive corner remonumentation project would have the “greatest effect for all concerned” at this time. As a part of that project, centimeter-grade GPS coordinates will be collected on every remonumented corner which will be incorporated into the county’s parcel mapping to improve the accuracy of the maps. Mueller stated that Beltrami County records approximately 1000–1500 documents per month which amounts to a potential revenue source of $132,000-$198,000 per year from this fund. Wright County has a fairly mature land records system with a completed parcel map and a full function GIS on the web to serve to internal and external users via ArcIMS. In 2006, compliance funds were used to enhance the ArcIMS application and start work on a website for public use. The county also installed a new Permit and Inspection System that will eventually be integrated with other land records systems. Bill Swing, county IT Director, anticipates that the upgrades to such underlying systems will facilitate the build out and ongoing maintenance of a quality land records portal for the county. This year recorder data is being spatially enabled. Future plans include using the funds to upgrade other legacy land record systems such as property tax and assessor. Future uses of compliance funds include LIDAR, aerial photos, and continued land records web and GIS development. Counties got the $11 bump in recording fees in 2005 when the fee was raised from $35 to $46. The major focus of this increase was to improve compliance in the recording and returning of documents. State law set the goal of 15 days for this process. In 2007, a county is in compliance with this requirement if 60% of documents are processed in this period. By 2010, 90% of documents must meet the 15-day rule. In 2011, the timeframe is reduced to 10 days and 90% compliance is required. It is not clear if these funds will be available after 2011. This fund should not be confused with the Technology Fund, described in section 4 of MS357.18. That fund is enhanced by $10 per instrument and is a separate component of the $46 fee. The purpose of the technology fund is “…obtaining, maintaining, and updating current technology and equipment to provide services from the record system.” It is spent at the discretion of the recorder. The Compliance Fund is a separate $11 component and is spent at the discretion of the county board.
To access the state law, go to http://www.leg.state.mn.us/leg/statutes.asp. For information on the recorder fee, retrieve sections 357.18 and 357.182
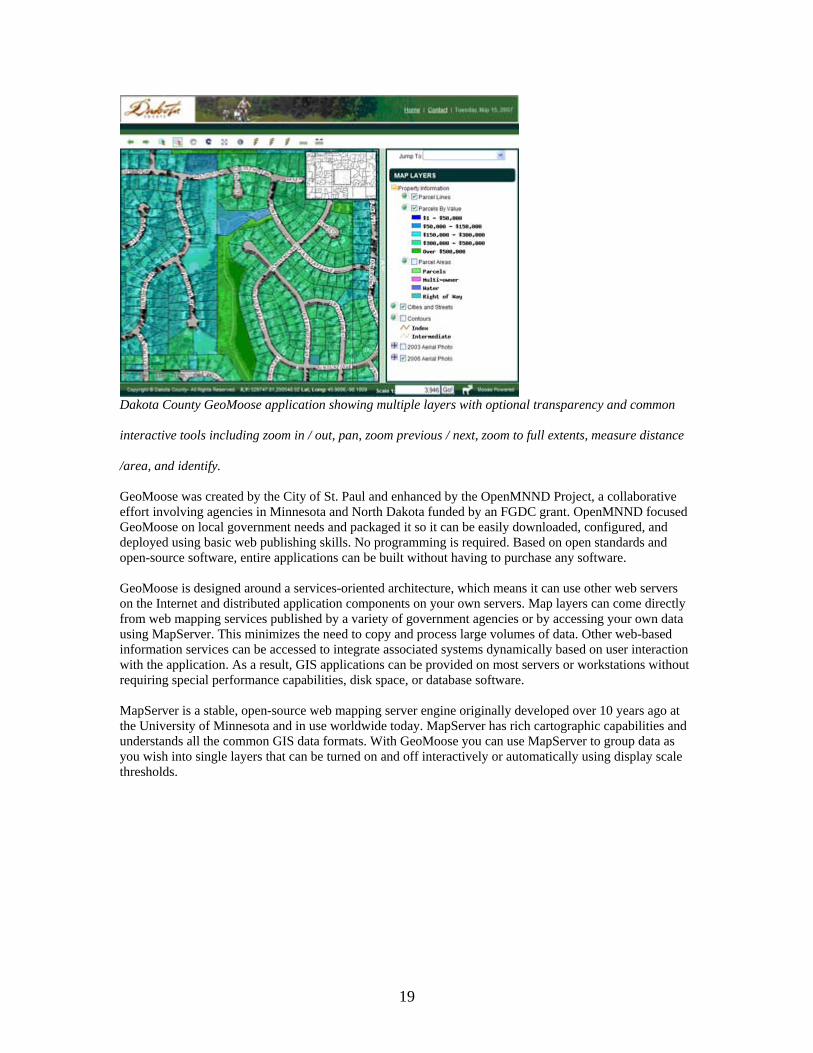
Now, Anyone Can Create Web Mapping Applications – Announcing GeoMoose! Reprinted from Dakota County GIS Newsletter, Summer 2007 Issue Web mapping applications have been around for over 10 years and are becoming commonplace for major metropolitan areas. Citizens expect that they can see maps online with links to information about property, parks, lakes, and road construction.. However, providing this capability has required a significant investment in software and time making it rather exclusive to larger cities and counties. GeoMoose is changing that by making open-source web mapping software available to everyone at no cost. Any city, county, or other governmental unit can create interactive mapping applications for their website or simply put basic GIS capabilities on the desktop of anyone in their organization.
19
Dakota County GeoMoose application showing multiple layers with optional transparency and common
interactive tools including zoom in / out, pan, zoom previous / next, zoom to full extents, measure distance
/area, and identify.
GeoMoose was created by the City of St. Paul and enhanced by the OpenMNND Project, a collaborative effort involving agencies in Minnesota and North Dakota funded by an FGDC grant. OpenMNND focused GeoMoose on local government needs and packaged it so it can be easily downloaded, configured, and deployed using basic web publishing skills. No programming is required. Based on open standards and open-source software, entire applications can be built without having to purchase any software. GeoMoose is designed around a services-oriented architecture, which means it can use other web servers on the Internet and distributed application components on your own servers. Map layers can come directly from web mapping services published by a variety of government agencies or by accessing your own data using MapServer. This minimizes the need to copy and process large volumes of data. Other web-based information services can be accessed to integrate associated systems dynamically based on user interaction with the application. As a result, GIS applications can be provided on most servers or workstations without requiring special performance capabilities, disk space, or database software. MapServer is a stable, open-source web mapping server engine originally developed over 10 years ago at the University of Minnesota and in use worldwide today. MapServer has rich cartographic capabilities and understands all the common GIS data formats. With GeoMoose you can use MapServer to group data as you wish into single layers that can be turned on and off interactively or automatically using display scale thresholds.

20
Metro Mosquito Control District application that accesses aerial photography WMS from LMIC, wetland data and a shapefile containing all 900,000 parcels in the 7 county Twin Cities metropolitan area. Applications can be created without any programming by simply changing options in three configuration files. They can be configured to link directly to other websites based on identified features, locations, or graphics drawn in the map display. Tools can be defined to capture the coordinates of the cursor in the map and send them to a URL. This allows external services to be integrated with GeoMoose, like accessing data associated with a feature on the map or displaying bird’s eye imagery from Microsoft’s Virtual Earth. In this way, existing web-based applications and databases can be accessed directly without the need to copy data or duplicate their capabilities in a mapping application.
Integrating existing information services. A tool requests the user to click in the map and then pops up another browser window to another website providing the location information to access property information, bird’s eye imagery, or features in the neighborhood. GeoMoose was written in JavaScript so it runs directly in a web browser and has no special web server requirements. It also uses standards like cascading style sheets (CSS) and extended markup language (XML) so it can be easily configured and customized. MapServer can run in multiple operating systems

21
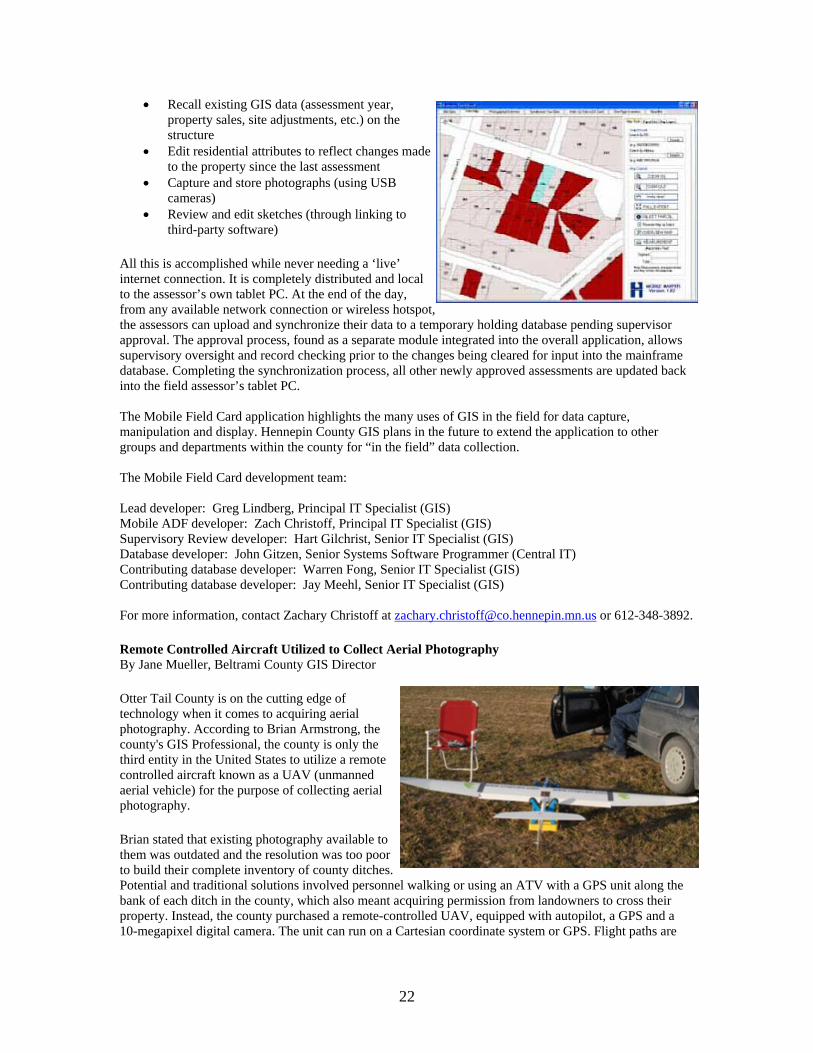
and supports all common vector and raster data formats. It also provides commonly expected cartographic capabilities like sophisticated annotation and symbolization. Now, anyone can create web mapping applications. They don’t require sophisticated hardware or software. This makes them practical for smaller cities and counties that may find it difficult to justify the expense required by other options. It means that other government agencies can easily justify providing interactive mapping applications to their constituents in support of their business. It also means that any governmental unit can use the same techniques for creating internal applications, putting interactive GIS in the hands of anyone in their organization. With barriers removed, these applications will become more prevalent. As that happens, users of those applications will experience greater consistency between applications deployed by multiple agencies and all will benefit by creating a thriving community to continue the collaborative model of working together to add even more capabilities and share application components. Go to the OpenMNND project website at http://www.openmnnd.org to try the demonstration applications and learn more about how to build your own web mapping applications. Hennepin County GIS Division Creates Mobile Assessor Tool By Zachary Christoff, Principal Information Technology Specialist, Hennepin County GIS Division The Hennepin County GIS Team was pleased to receive a “2007 Special Achievement in GIS” Award from ESRI. The award was presented at the 2007 ESRI International User Conference in San Diego this past June and recognized the GIS Team for work it conducted on the newly created Hennepin County Assessor’s Mobile Field Card application. The Hennepin County GIS team developed the Mobile Field Card application to assist the Hennepin County Assessors Department during on-site residential assessments. Previously, assessors edited information using either a paper card or a PDA. They had to print paper maps of the area in which they were working to be able to view information on sales and rate adjustments in the surrounding area. The paper cards required separate data entry, printing and filing. The PDA was slow and displayed only a few fields at a time, making it impossible to do a quick, comprehensive overview of all attributes. Neither method kept a history of updates, so there was uncertainty about the source of changes and no ability to review them or roll them back. Photos were taken with a digital camera and the images had to be manually uploaded and named with the 13-digit property ID number, which was time-consuming and prone to error. Furthermore, there was no way to view the existing photos and sketches in the field without taking along paper copies. Last, there was no way to easily plot or track the completion of revaluations in relation to those that were due to be revalued. Using the latest technology from ESRI and Microsoft, the GIS Team developed a disconnected (offline) tablet PC application that collects residential assessment attributes, provides interactive mapping capabilities and manages property photos and sketches. The applications framework is composed of:
• ESRI’s ArcGIS Server 9.2 Mobile .ADF • Visual Studio 2005 (.NET) • Microsoft SQL Server 2005 CE
While the Hennepin County assessors still have access to an Internet and/or a network connection, they download pre-defined map caches (a collection of pre-rendered map tiles that can be used for display of a map service) before entering the field. While in the field and onsite the assessors have the ability to:
22
• Recall existing GIS data (assessment year, property sales, site adjustments, etc.) on the structure
• Edit residential attributes to reflect changes made to the property since the last assessment
• Capture and store photographs (using USB cameras)
• Review and edit sketches (through linking to third-party software)
All this is accomplished while never needing a ‘live’ internet connection. It is completely distributed and local to the assessor’s own tablet PC. At the end of the day, from any available network connection or wireless hotspot, the assessors can upload and synchronize their data to a temporary holding database pending supervisor approval. The approval process, found as a separate module integrated into the overall application, allows supervisory oversight and record checking prior to the changes being cleared for input into the mainframe database. Completing the synchronization process, all other newly approved assessments are updated back into the field assessor’s tablet PC. The Mobile Field Card application highlights the many uses of GIS in the field for data capture, manipulation and display. Hennepin County GIS plans in the future to extend the application to other groups and departments within the county for “in the field” data collection. The Mobile Field Card development team: Lead developer: Greg Lindberg, Principal IT Specialist (GIS) Mobile ADF developer: Zach Christoff, Principal IT Specialist (GIS) Supervisory Review developer: Hart Gilchrist, Senior IT Specialist (GIS) Database developer: John Gitzen, Senior Systems Software Programmer (Central IT) Contributing database developer: Warren Fong, Senior IT Specialist (GIS) Contributing database developer: Jay Meehl, Senior IT Specialist (GIS) For more information, contact Zachary Christoff at [email protected] or 612-348-3892.
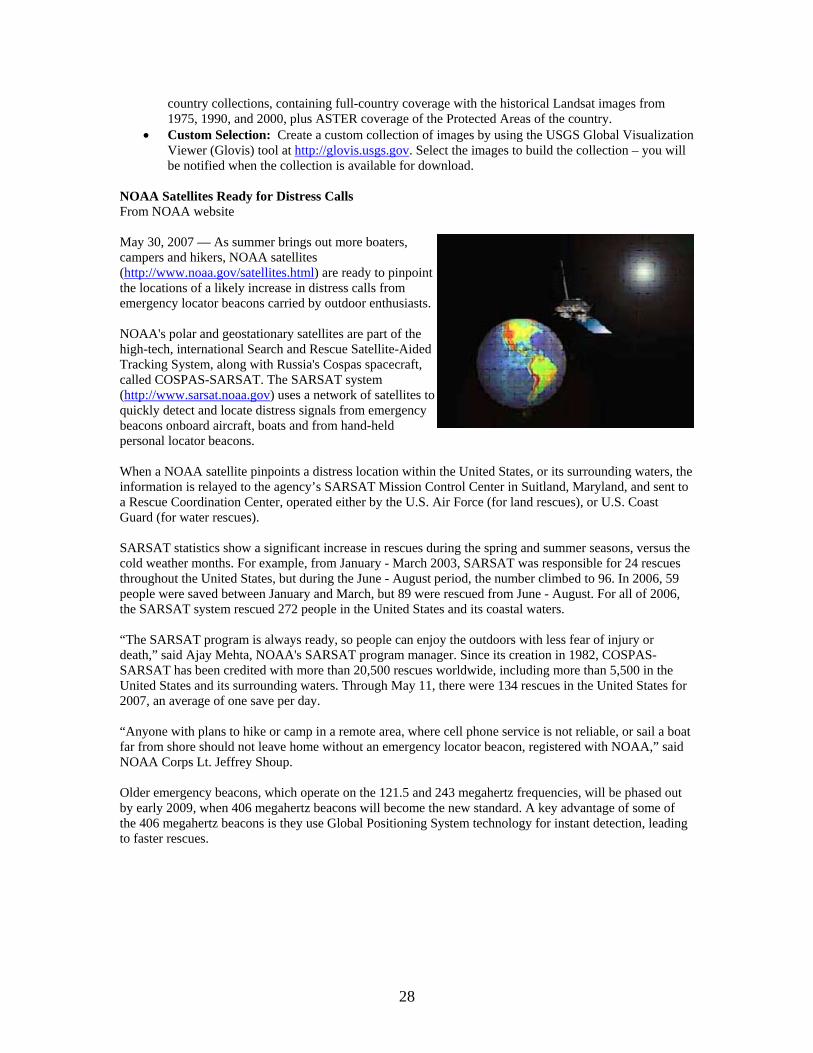
Remote Controlled Aircraft Utilized to Collect Aerial Photography By Jane Mueller, Beltrami County GIS Director
Otter Tail County is on the cutting edge of technology when it comes to acquiring aerial photography. According to Brian Armstrong, the county's GIS Professional, the county is only the third entity in the United States to utilize a remote controlled aircraft known as a UAV (unmanned aerial vehicle) for the purpose of collecting aerial photography.
Brian stated that existing photography available to them was outdated and the resolution was too poor to build their complete inventory of county ditches. Potential and traditional solutions involved personnel walking or using an ATV with a GPS unit along the bank of each ditch in the county, which also meant acquiring permission from landowners to cross their property. Instead, the county purchased a remote-controlled UAV, equipped with autopilot, a GPS and a 10-megapixel digital camera. The unit can run on a Cartesian coordinate system or GPS. Flight paths are

23
derived from existing photography and uploaded into the plane's autopilot system. The plane can also be controlled by the operator using a hand-held remote control unit should the need arise.
It took approximately seven months to get the necessary permission from the Federal Aviation Administration and the necessary insurance on the unit before it could make the first flight. In addition, county and city ordinances regarding the use of such aircraft also needed to be examined and followed. The UAV is capable of 40-plus mile flights; however, the plane needed to be in the line of sight at all times for insurance and FAA regulations, which meant keeping it within a distance of ½ - ¾ of a mile from an operator at all times. It was quickly discovered that operators could extend the overall range of the flight by following the plane with a car and keeping it within the restricted line of sight. Spotters were also utilized along the route to assist with this.
The plane can fly up to 3000-4000 feet above the ground but an altitude of 400-500 feet was used for this project. This resulted in a 3-4 inch pixel. Although the plane and technology works great for specific targeted areas of interest, it is not efficient for the capture of larger areas. There is considerable set up time needed to do a 160-acre tract with an actual flight time of approximately 20 minutes associated with area of that size. Weather conditions can also be restrictive as a wind of less than 20 knots (23 mph) and bright sun are needed for good quality photography.
The plane itself is fairly inexpensive ($300-$400) and measures approximately eight feet from wing tip to wing tip; however, the autopilot technology is expensive. Total costs of UAVs can run from $5000 - $50,000 depending on what additional technology is installed. Additional software is available that rectifies and date/time stamps images, allowing them to be downloaded in a GIS for digitizing and more. UAVs can also be equipped with live video back to the ground for additional capabilities. Additional uses for this technology within Otter Tail County have already included a search and rescue operation for the county's Law Enforcement Department.
For more information on the use of this technology, please contact Brian Armstrong at Otter Tail County: [email protected] or 218-998-8310.
Clay County Address System By Mark Sloan, GIS Coordinator Clay County has complete and current information about all addresses in the county, including secondary structures. The data is systematically updated based on the normal operations of government. Cities and the county cooperate in ensuring a robust system. This information is used by city and county government offices to support the regular operations and by the local power company to plan for new service hookups. Key information about new addresses is forwarded to the emergency response community on a regular basis. The county has address data for all existing and planned buildings. It created its address database at the same time it was establishing its GIS. Addresses are now urban-style and follow the Post Office standard. An x-y geographic coordinate is provided with each address so it can be located on maps and on the ground. The coordinate data was originally collected by county GIS staff using GPS receivers. In addition to primary addresses, the county information is collected on secondary structures, like out-buildings and industrial locations, where accidents or other events might occur; this information comprises about 25% of the full database and is available when needed. The original effort to develop the address database, including fieldwork to collect coordinates, took about 2000 hours of staff time.

24
The County GIS office is the Address Authority and controls new addresses for the entire county. New address data is added based on subdivision plats and building permits. New plats filed with the county must be submitted in electronic format, thereby providing the source of updates to the parcel map. The county’s 11 cities and the county itself issue building permits for new construction on existing lots. Coordinates are added based on parcel centroids from the plats and sketch maps submitted with permit applications. The county GIS office provides addresses for new parcels while the plat is under review and well before construction starts on the new building. Air photos are used to confirm and supplement these sources. The county GIS office budgets about 500 hours a year for managing and maintaining the address system.
Address and coordinate data is widely used within the county by government and the public. It is shared with the local utility companies to help them plan and deliver service to new homes and businesses. It is shared regularly with the local PSAPs (Public Safety Answering Points) to update the address ranges of their Master Street Address Guides (MSAG), used by the E-911 Computer Aided Dispatch (CAD) equipment to identify the appropriate police, fire or other responder. Unfortunately, the coordinate data is not part of the MSAG and is not shared with the contractor that produces the Automatic Location Information (ALI) for individual properties. This means first responders will know the relative location of emergency events but do not have more precise coordinate information to help them find unfamiliar sites. For more information, see http://www.co.clay.mn.us/Depts/GIS/GIS.htm

25
Federal USGS Makes Topographic Maps Available Using GeoPDF From USGS press release The U.S. Geological Survey (USGS) is using TerraGo Technologies’ GeoPDF format to make its primary base series quadrangle maps available online. The USGS GeoPDF maps can be accessed through the USGS Store at http://store.usgs.gov/. The initial project, started by the U.S. Army Corps of Engineers, involved converting more than 60,000 USGS Digital Raster Graphics to GeoPDF files. These maps represent USGS primary base series quadrangles used by businesses and consumers for all kinds of applications from engineering to land use management and recreation such as hiking, hunting and camping. The GeoPDF maps can be accessed online and printed or downloaded. Once maps are downloaded, users can view, manipulate and update maps via Adobe Reader with or without an Internet connection or access to geographic information systems. GeoPDF is the only geospatial data distribution and collaboration format that leverages the Adobe portable document format (PDF), giving users powerful mapping functionality and capabilities via an application already installed on hundreds of millions of computers worldwide. Leveraging a standard format already widely available made the GeoPDF format a logical choice for the USGS project. “Our organization manages vast stores of geospatial assets that all kinds of citizens want and need to access for business and pleasure. It’s our job to make that access as open, simple and cost effective as possible,” says John Davis, chief of the USGS Science Information Delivery section in Denver. “GeoPDF is a great example of the power, flexibility, and portability of the PDF format,” said Kevin M. Lynch, Adobe vice president of product marketing. “Since GeoPDF-enabled documents can be accessed by anyone with the free Adobe Reader, the geospatial community now has a way to quickly and easily communicate and collaborate across different systems and platforms.” As for TerraGo Technologies, they believe the USGS project again proves the efficacy of their technology that makes geospatial data available to everyone. “This kind of application perfectly reflects the vision we’ve had for the GeoPDF format all along,” says James Davis, TerraGo Technologies president and CEO. “It’s wonderful to see the solution being used to open up complex geospatial data warehouses to everyone who can benefit from those valuable assets.”
USGS Pilot Project Makes High-Quality Landsat Data Available through Web Adapted from USGS technical announcement
As of June 4, 2007, the U.S. Geological Survey will be releasing selected Landsat 7 image data of the United States through the Web (http://glovis.usgs.gov or http://earthexplorer.usgs.gov). These data are of high quality with limited cloud cover.
This Web-enabled distribution of new and recently acquired data is a pilot project for the Landsat Data Continuity Mission (LDCM), currently projected for launch in 2011. The project will allow the Landsat data user community to help refine the distribution system planned for the upcoming LDCM. Each scene will be registered to the terrain, or "ortho-rectified," prior to being placed on the Web. Copies of these data will also be available on CD or DVD at the cost of reproduction.

26
Landsat data have proven useful for a wide range of applications. From disaster monitoring after Hurricane Katrina and the Indonesian tsunami to global crop condition analysis, Landsat data are being used by scientists around the world. The Web-based distribution system will allow the user community easier access to Landsat 7 data.
The pilot project will be carefully examined. Customer response will be evaluated and their insight will influence the future distribution system.
TerraLook: Free Satellite Images Adapted from U.S. Geological Survey TerraLook and NASA JPL websites Science writers, field scientists, resource managers, educators, students, policy makers, and the general public are all interested in satellite images of the Earth. The TerraLook product expands and broadens the remote sensing user community by providing a user-selectable collection of free satellite images, distributed as simulated natural color JPEG images. TerraLook images are designed for visual interpretation and display, and are of value to anyone who wants to see the changes to the Earth’s surface over the last 30 years. (The source data, rather than TerraLook images, should be obtained for use in digital analysis.)

27
The images document the changes near the confluence of the Iguazú and Paraná Rivers, which separate Argentina, Brazil and Paraguay A TerraLook collection consists of georegistered Advanced Spaceborne Thermal Emission and Reflection Radiometer (ASTER) images and the Tri-Decadal Global Landsat Orthorectified images from three epochs (circa 1975, 1990, and 2000), selected from satellite images archived at U.S. Geological Survey Center for Earth Resources Observation and Science (EROS).
• ASTER: The Advanced Spaceborne Thermal Emission and Reflection Radiometer (ASTER) instrument provides fourteen spectral bands with 15- to 90-meter resolutions depending on the band(s). ASTER does not acquire data continuously; its sensors are activated only to collect specific scenes upon request. For more information about ASTER images, see: http://eros.usgs.gov/products/satellite/aster.html
• Landsat: The Tri-Decadal Global Landsat Orthorectified data collection consists of a global set of high-quality, relatively cloud-free orthorectified MSS, TM and ETM+ imagery from Landsats 1-5 and 7. This dataset provides users with access to quality-screened, high-resolution satellite images with global coverage over the Earth's land masses. For more information, see: http://eros.usgs.gov/products/satellite/landsat_ortho.html
TerraLook images can be viewed in any program that can open JPEG images. Examples include web browers, word processors, and graphic software. A free Viewer and Toolkit designed for use with TerraLook Collections can also be downloaded from http://terralook.sourceforge.net/. For More Information To learn more about TerraLook collections, see these two websites:
• TerraLook: http://terralook.cr.usgs.gov • NASA’s Jet Propulsion Laboratory: http://asterweb.jpl.nasa.gov/terralook.asp
To download TerraLook products, choose from the following options: • Standard Collections: Many standard collections have been archived and are available for
download from http://asterweb.jpl.nasa.gov/TerraLook_download.asp. Typically, these consist of
28
country collections, containing full-country coverage with the historical Landsat images from 1975, 1990, and 2000, plus ASTER coverage of the Protected Areas of the country.
• Custom Selection: Create a custom collection of images by using the USGS Global Visualization Viewer (Glovis) tool at http://glovis.usgs.gov. Select the images to build the collection – you will be notified when the collection is available for download.
NOAA Satellites Ready for Distress Calls From NOAA website May 30, 2007 — As summer brings out more boaters, campers and hikers, NOAA satellites (http://www.noaa.gov/satellites.html) are ready to pinpoint the locations of a likely increase in distress calls from emergency locator beacons carried by outdoor enthusiasts. NOAA's polar and geostationary satellites are part of the high-tech, international Search and Rescue Satellite-Aided Tracking System, along with Russia's Cospas spacecraft, called COSPAS-SARSAT. The SARSAT system (http://www.sarsat.noaa.gov) uses a network of satellites to quickly detect and locate distress signals from emergency beacons onboard aircraft, boats and from hand-held personal locator beacons. When a NOAA satellite pinpoints a distress location within the United States, or its surrounding waters, the information is relayed to the agency’s SARSAT Mission Control Center in Suitland, Maryland, and sent to a Rescue Coordination Center, operated either by the U.S. Air Force (for land rescues), or U.S. Coast Guard (for water rescues). SARSAT statistics show a significant increase in rescues during the spring and summer seasons, versus the cold weather months. For example, from January - March 2003, SARSAT was responsible for 24 rescues throughout the United States, but during the June - August period, the number climbed to 96. In 2006, 59 people were saved between January and March, but 89 were rescued from June - August. For all of 2006, the SARSAT system rescued 272 people in the United States and its coastal waters. “The SARSAT program is always ready, so people can enjoy the outdoors with less fear of injury or death,” said Ajay Mehta, NOAA's SARSAT program manager. Since its creation in 1982, COSPAS-SARSAT has been credited with more than 20,500 rescues worldwide, including more than 5,500 in the United States and its surrounding waters. Through May 11, there were 134 rescues in the United States for 2007, an average of one save per day. “Anyone with plans to hike or camp in a remote area, where cell phone service is not reliable, or sail a boat far from shore should not leave home without an emergency locator beacon, registered with NOAA,” said NOAA Corps Lt. Jeffrey Shoup. Older emergency beacons, which operate on the 121.5 and 243 megahertz frequencies, will be phased out by early 2009, when 406 megahertz beacons will become the new standard. A key advantage of some of the 406 megahertz beacons is they use Global Positioning System technology for instant detection, leading to faster rescues.

29
USGS Resources for Teachers Online Brochure From USGS SILS Information Bulletin
The U.S. Geological Survey provides scientific information needed to help educate the public about natural resources, natural hazards, geospatial data, and issues that affect our quality of life.
The latest edition of the USGS educational brochure which contains some of this information is now available online at http://education.usgs.gov. Click on ‘resources for teachers’ in the left-hand column.
Discover a wealth of curricular ideas, scientific data, maps, books, lessons, and other resources to support earth science, biology, geography, and hydrology. This four-page informational brochure contains selected online resources to support teaching, learning, education (K-12), and university level inquiry and research.
The brochure is divided into three topic areas: Where can I find it? (displays the online site), What can I do with it? (a useful section to help educators and others explore the possibilities for information), and What does it look like? (thumbprint of the poster, brochure, learning exercise, etc.)
This brochure is currently available online only, but a copy will be enclosed in the 2007 Earth Science Week Toolkit.
For more information on USGS products contact the USGS Science Information and Library Services (SILS) at 1-888-ASK-USGS, or online through the USGS store at: http://store.usgs.gov.
Higher Education Saint Mary’s University Update By John Ebert, Saint Mary’s University The Department of Resource Analysis (RA) (www.smumn.edu/gis) recently attended the ESRI User Conference in San Diego, CA, to showcase RA’s newest curricular offerings in the MSGIS program and the Online Professional GIS Training Certificate sequence. RA staff had the opportunity to exhibit at the Education Expo and the Academic Fair at the ESRI Conference. Both opportunities provided the chance to visit with hundreds of GIS users to discuss the new uses of GIS in the user community and to learn about new and exciting trends in the technology field. The events also provided RA a chance to visit with learners across the globe about GIS education and to visit with SMU-RA alumni at the conference. RA showcased new and exciting learning options for the Master’s Degree as well as the latest Online Professional GIS Certificate CEU (Continuing Education Units) Training options. The Master’s Degree program information showcased our new disciplinary focus area, Homeland Security/Emergency Management, that includes online course studies and complements our existing disciplinary areas in natural resources, business, and management among others. The Online Professional GIS Certificate sequence features the latest and exciting ways one can obtain hands-on GIS training for the GISP endorsement, personal growth and learning, or for general GIS training needs without having to formally apply to a program. For more information about the Online GIS Training Options, please visit our web information at http://www.smumn.edu/sitepages/pid2572.php

30
Lastly, RA is proud to recognize Peter Woeste as a recipient of an ESRI International User Conference Student Assistantship. Pete is a learner in our Minneapolis cohort and commented that his experiences at the conference were amazing and very rewarding for him personally and professionally. Congratulations, Pete! K-12 Education History Comes Alive with Online GIS! By Lesley Kadish, Minnesota Historical Society How often have teachers stumbled upon Minnesota’s incredible collection of GIS maps, only to discover their schools don’t have the software or technical skills to use these available resources? Now, with funding made possible from the Institute for Museum and Library Services, teachers will have new tools to use GIS in their classrooms. The Minnesota Historical Society (MHS) and the Land Management Information Center (LMIC) have joined up to create a groundbreaking new GIS website designed to link historical content with Minnesota’s existing GIS maps. The website, called True North: Mapping Minnesota’s History, integrates more than 200 Minnesota data layers and remote databases into a savvy GIS classroom tool. Although it requires no previous GIS experience from its users, the back-end is an impressive combination of online GIS technologies, created by integrating MapServer with Chameleon and Flash technology. What Makes It Unique? So your students want their state highways to be fuchsia and their forest cover to be orange? They want to zoom in to Grandma’s house in Ada in 1939? OK! True North’s online platform comes with print, save, and download capabilities, navigation and search technologies, as well as fully editable color, symbol size and transparency palettes so that students can personalize their own maps. The list of maps is incredible, stretching from glacial geology to wheat production in 1874; it includes such historic layers as fur trade routes, streetcar lines and dozens of geo-rectified archival maps. But what really makes True North unique, besides the diversity of map layers, is this: each map is associated with the Minnesota Historical Society’s online collections of archival photographs, manuscripts and three-dimensional artifacts, as well as supplemental articles, related websites, and the map metadata. So, for example, when the township/range map is turned on, students can see photographs of weary 19th century surveyors leaning on their tripods and can follow links to sepia-toned images of the original land survey plats.

31
To tie these maps together comprehensively for teachers, True North offers complete lesson plans for 5-8 grade classrooms, and lesson guidelines for 9-12 grade classrooms. These resources offer teachers a quick way to use the new resource, and conveniently package the instruction techniques, worksheets, assessments, and standards correlations. These lesson plans are available both online and in printable PDF formats.
Find Out More
• To see a version of the website, still in development, visit: http://www.lmic.state.mn.us/ghol/ • To find True North workshops, navigate within the site to the Upcoming Workshops page. • For further information on:
o Education aspects of True North, contact Education Specialist Nancy O’Brien Wagner at [email protected]
o Historic GIS related questions, email [email protected] o Technical questions, contact Brent Lund at [email protected]
• For your own adventure with history, visit the Minnesota Historical Society at: http://www.mnhs.org
• Finally, attend our session at the 2007 GIS/LIS Consortium meeting! Session 22, 8 a.m. Friday, October 12, 2007.

32
Private ESRI Launches New Cartographic Help Site Adapted from ESRI ArcWatch Newsletter, July 2007
The Environmental Systems Research Institute (ESRI) has launched a new website to help people make better maps. Mapping Center’s goal is to help you make great-looking maps by using the same cartographic concepts that professional cartographers use. Designed to provide quick answers to mapmaking problems, Mapping Center presents information and sample maps displaying a wide variety of cartographic techniques and effects. The site also gives visitors tips and instructions on how to reproduce the featured effects on their own maps. Visitors are given options to:
• View map examples • Ask a cartographer questions about map design • Join a cartographic blog • Find other resources, including “Cartographers’ Favorites” websites, forums, professional
organizations, journals and books. Visit the Mapping Center at: http://mappingcenter.esri.com Non-Profits Non-Profits Can Apply for Free Access to Google Earth Pro By Sally Wakefield, 1000 Friends of Minnesota Google Earth recently launched a new “Outreach Initiative” to connect Google Earth users and support extended uses of the software. According to Google, the purpose of the initiative is to “empower non-profit groups with the resources, tools, and inspiration that they need to leverage the power of Google Earth for their cause. This is where public service groups can find online guides and video tutorials, inspiring case studies and a gallery of high-quality, public-benefit KML.” Google Earth Pro provides expanded capabilities from what is available in the free version, including GIS data import functions, movie output, high resolution printing and more. Google Earth Pro is regularly priced at $400.00. 1000 Friends of Minnesota has been utilizing the free version of Google Earth over the past year to help citizens and others not trained in GIS to view GIS data in an easy-to-use browser format, thus increasing awareness and understanding of land-based data. With the Pro version provided through the grant, 1000 Friends of Minnesota now has expanded capacity to use visualization strategies to engage citizens and local government officials in the community planning process. 1000 Friends encourages other non-profit groups to consider applying to this helpful grant program. To learn more about the Google Earth Outreach Initiative visit: http://earth.google.com/outreach/index.html. To learn more about 1000 Friends of Minnesota visit: http://www.1000fom.org or call Sally Wakefield, Geospatial Services Manager, 651-312-1000.

33
Other Places Bring Back Geography! Reprinted with permission of the author and copyright holder, Jerome E. Dobson. Original citation: Dobson, Jerome E. "Bring Back Geography!" ArcNews 29(1): 1-5. http://www.esri.com/news/arcnews/spring07articles/bring-back-geography-1of2.html
[Editor’s Note: Jerome Dobson was the opening keynote speaker at the Mn GIS/LIS 2006 annual conference. He writes that “the lecture was a major step in the formation of the article.”]
Quiz after quiz has shown that kids today don’t know where any place is. How often have you heard this lament about “geographic ignorance” or “geographic illiteracy,” as it is commonly called?
Now, take that complaint and turn it around. What does it say about geography? It says geography means knowing where places are. That’s what geographers call “place-name geography.” It’s vital, but it’s the least of what we expect budding geographers to learn.
Geography is more than you think. Geography is to space what history is to time. It is a spatial way of thinking, a science with distinctive methods and tools, a body of knowledge about places, and a set of information technologies that have been around for centuries. Geography is about understanding people and places and how real-world places function in a viscerally organic sense. It’s about understanding spatial distributions and interpreting what they mean. It’s about using technology to study, in the words of the late professor J. Rowland Illick, “why people do what they do where they do it.” Geography is a dimensional science and humanity based on spatial logic in which locations, flows, and spatial associations are considered to be primary evidence of earth processes, both physical and cultural. Its hallmarks are spatial analysis, place-based research (e.g., regional studies, area studies, urban studies), and scientific integration.
The familiar litany also implies that geography is just for kids, something you learn in elementary school or high school if you’re lucky, and use for the rest of your life without any need for new learning. Does geography really matter for grownups? Of course it does. Geographic knowledge, understanding, and skills matter, for instance, in formulating foreign policy, designing and using GIS, and just about everything else in society that involves locations, movements, and flows.
An Excellent Invention Geography was founded at least 2,500 years ago and advanced by Greek, Roman, and Chinese scholars throughout the Classical Age. Prior to the Renaissance, geography and astronomy—interrelated, spatially oriented disciplines—were preeminent sciences. For a thousand years, geography was recognized and valued. “How excellent inventions are geography, arithmetic, astrology, and the rest!” wrote Saint Augustine in The City of God in the early 5th century.
Then came the Great Interruption of the Middle Ages, and geography became a fantasy. For a thousand years, its real body of knowledge was preserved by Irish monks and advanced by Arab and Persian scholars. Its rediscovery by European scholars was central to the enlightenment of the Renaissance. It

34
thrived from c. 1450 to 1948 based on exploration, from c. 1600 to 1900 based on the information needs of westward expansion, and from c. 1915 to 1947 based on geopolitics. Its accomplishments include the following:
• The first proposal of continental drift was published by geographer Abraham Ortelius in 1596. Its most famous champion, Alfred Wegener, was a climatologist (climatology is a subspecialty of geography).
• Biogeographer Alfred Russell Wallace codiscovered evolution in 1859. By today’s rules of precedence, he would be considered the principal discoverer because he published first, but Charles Darwin’s friends made sure his paper was read ahead of Wallace’s at a meeting of the Royal Society.
• President Woodrow Wilson’s geographer Isaiah Bowman was the author of America’s globalization policy, which proclaimed that America could lead the world through political and economic means rather than military conquest. Bowman went on to become president Franklin D. Roosevelt’s geographer, as well, and one of the top six architects of the United Nations.
• Geographer Carl Sauer led the way toward new understanding of the ancient Americas and the vast populations they once contained. His first inklings were published in the 1930s; geographer Bill Denevan discovered massive supporting evidence in 1961; geographers widely accepted their findings by the 1970s; and science journalist Charles Mann’s 1491 announced those findings to the public, to great acclaim, in 2005.
• Geographer Roger Tomlinson is universally recognized as the father of GIS in the early 1960s. Duane Marble and other geographers were instrumental in laying the groundwork for GIS and have been heavily involved ever since. Geographer John K. Wright of the American Geographical Society published the earliest known expression of points, lines, and areas—concepts now central to GIS—and pioneered quantitative techniques, such as dasymetric interpolation, that serve vital GIS functions today.
The Purge of Geography Soon after World War II, however, geography was purged in the United States, and the impact continues today. From 1948 to 1988, the discipline was expunged at the University of Chicago, Columbia, Harvard, the University of Michigan, Northwestern, Stanford, Yale, and other esteemed American universities, oddly even during periods when universities were expanding faster than at any other time before or since. In truth, nobody knows why geography was targeted on such a broad scale. For decades, there have been no geography departments in the Ivy League, except Dartmouth’s undergraduate department. Of the top 20 private universities in the United States, only two currently have geography departments, though 15 of the top 20 public universities do. The purge was an American phenomenon. In the United Kingdom to this day, Oxford and Cambridge universities continue to have strong academic programs offering doctoral degrees in geography.
Lately, geography is enjoying a resurgence due to the phenomenal success of GIS and the need for better understanding of foreign lands and peoples in this age of globalization and geopolitical turmoil. Peers in other disciplines now respect, and some are adopting, our hallmarks—spatial analysis, place-based research, and scientific integration. What this resurgence means is that existing geography departments are adding faculty and new graduate degrees. Unfortunately, however, only four new undergraduate degree programs have been added in the past 10 years, and only one new department is being discussed at present in a serious way. As incredible as it may seem, the purge continues, and there will be a net loss this year as Southern Oregon University closes its geography department.
The panoply of disciplines must evolve, of course, and obsolete ones should disappear. Geography, however, was cut down in its heyday, just as it was shortly after Saint Augustine’s effusive compliment. This not-so-great interruption from 1948 to the present is disturbingly reminiscent of the great one in the Middle Ages. I, for one, take enormous pride in how my discipline handled its fate. For half a century, geography’s body of knowledge and pool of expertise have been preserved and advanced by American scholars in state universities and a few private universities and by foreign scholars. These geographers in exile have, in effect, “preserved the scrolls” as Irish monks did in the Middle Ages. Better yet, they

35
continued to advance the field and contribute to science and society in impressive fashion. Their collective impact is far greater today than one would expect based on their diminished numbers and institutional base.
Meanwhile, geographic education has been nearly eliminated from K–12 curricula in the United States. In elementary school, it has been lost in a mishmash called “social studies” that neglects physical geography and spatial thinking. Each semester, I ask my students in a large introductory class how many of them have ever had a geography course before at any level, and less than 10 percent raise their hands. Advanced Placement (AP) enrollments in geography are rising in high school, but the absolute number remains small (21,000 in 2006). Most matriculating students do not even know it is possible to earn a college degree in geography. The No Child Left Behind program provides funds to improve the teaching of all the essential subjects identified—except geography. Congress said geography is essential and then provided not a single dollar for it.
The situation in government reflects what happened in academia. In ancient China, the Chou emperor had his geographer-royal. Louis XV had his geographer. The Continental Congress appointed its official geographer. President Wilson had his geographer (Bowman). President Roosevelt had his geographer (also Bowman). Since World War II, however, no U.S. president has had a geographer. Again, the deficiency is a distinctly American phenomenon. In the United Kingdom, Prince William, heir to the throne, is himself a geographer, having graduated from St. Andrews University in 2005 with a master’s degree in geography.
In the first half of the 20th century, geopolitics was a major focus of academic research, especially by geographers, and its influence on real-world politics was enormous. In the second half of the century, geopolitics gave way to political science and international affairs. Now, 9 of the top 15 schools of international affairs in the United States reside in universities without geography departments. The late Bill Wood, geographer of the United States, compiled a list illustrating that point and shared it with me shortly before he died. He was deeply concerned by the lack of geographic knowledge among graduates in international affairs and a similar lack of political understanding among geographers. He wanted to hire people with a broad understanding of geopolitics—both geography and politics—at the U. S. Department of State and could not find them in the labor pool.
As one indication that geopolitics matters, consider geographer Bowman’s warning in 1949, “we can lose our shirt in the swamps and canyons of the hinterlands” of Southeast Asia. Two decades later, the United States went to war in Vietnam fully committed to George F. Kennan’s doctrine of containment, but Bowman’s “scroll” was lost, and his warning never entered the debate.
During my 26-year career at Oak Ridge National Laboratory and 6 years at the University of Kansas, I have participated in scores of meetings among insiders who provide decision support to foreign policy makers and military strategists. For about 2 years, I’ve sensed an historic opening for the restoration of geography. Many insiders now openly admit that geographic understanding is sorely missing from their deliberations, though only a few know to call it geography. As I listen to their concerns, I sense a striking similarity to the situation that Woodrow Wilson faced in World War I and Franklin D. Roosevelt in World War II. Yet those wars ended in victories viewed today as intelligence triumphs. They found a solution in their day, and current leaders would be wise to ask what it was.
Wilson’s plight is especially instructive. On the eve of World War I, he knew the United States was poised to become a world power. The Great War and subsequent peace would be his nation’s debut on the global stage. He relished the role of leading man, but who would play his supporting cast? For 140 years, America had practiced isolationism. No one in government—not even the officers and analysts of the Department of State or Military Intelligence—was ready to analyze foreign intelligence or face sophisticated European negotiators. Wilson, scholar that he was, recognized his problem as being geographic and called on the American Geographical Society (AGS) for help.
AGS director Bowman led The Inquiry, a massive analysis of foreign intelligence staffed by 150 scholars from geography and other disciplines. Their task was to collect and analyze the information that would be

36
needed to establish a “scientific” peace at war’s end. As part of The Inquiry, the American Geographical Society was responsible for drafting Wilson’s famous Fourteen Points, one of the most reassuring and effective policy statements ever written. When Wilson and the American delegation left for France aboard the USS George Washington, Bowman sailed with them. On arrival, Bowman pulled off an amazing bureaucratic coup, and Wilson decreed that analysts from the Department of State, Military Intelligence, and Central Bureau of Statistics would report to him through Bowman. In January 1919, AGS geographers and cartographers, led by Mark Jefferson, turned out more than 300 maps per week based on geographic analysis of The Inquiry’s massive data collections covering language, ethnicity, resources, historic boundaries, and other pertinent information. America’s delegation became the envy of Versailles.
President Roosevelt, too, appreciated geography and even served on the Council of the American Geographical Society for more than a decade. During World War II, Bowman was his closest advisor and one of the top six architects of the United Nations. Bowman was the only individual present from the beginning to the end of the effort to establish the United Nations, and he personally convinced Winston Churchill that one global organization would be better than three regional organizations.
During that war, one-third of all academic geographers were called to Washington, D.C., to serve in the Office of Strategic Services (OSS) and other agencies essential to the war effort. Their service, and especially Bowman’s powerful role in both wars, adds to our puzzlement over why geography was purged just three years after the war ended and one year after the United Nations’ charter.
Today, considering our nation’s new capacity for rapid warfare, it is worth noting that the American Geographical Society’s role in World War I and Bowman’s role in World War II had far more to do with peace than war. Knowing the field of peace ahead of time is more important than ever.
Aliased Geography If geography did not exist, it would have to be invented. Indeed, there are four high-profile cases in which it was reinvented by authoritative bodies purportedly unaware of its existence:
• Ten years into the purge of geography, Congress passed Title VI of the National Defense Education Act (NDEA) of 1958, which authorized funding to build “area studies” programs at U.S. universities to ensure “trained expertise of sufficient quality and quantity to meet U.S. national security needs.”
• Forty years into the purge, three federal agencies signed on to a proposal for a “new” scientific discipline called “earth system science.” Days after the Bretherton Report appeared in the late 1980s, I read the definition in a plenary session at an international conference of geographers, and they recognized in an instant that geography had been reinvented yet again. The auditorium erupted in laughter.
• Columbia University disbanded its geography department in 1986 and nine years later established the Earth Institute “for the integrated study of Earth, the environment, and society.” Geography is not listed among its “core disciplines.”
• Harvard University discontinued geography in 1948, and the results showed in its curricular review of 2004. The report called for bold remedies including certain hallmarks of geography—broader knowledge of diverse sciences and a better understanding of foreign cultures, economies, and policies—without mentioning its name.
All four sound like manifestos for geography, but the word itself is assiduously avoided even where it normally would be used in common language.
In 2005, Harvard University announced that it will reintroduce GIS but not geography. The new Center for Geographic Analysis recognizes the demand for GIS throughout all disciplines without granting academic stature to its home discipline. That’s much like building a word processing center without an English department, and it’s a mistake the university has made before. Harvard was one of a handful of key centers

37
advancing GIS in the 1970s. Lacking an academic home, however, its groundbreaking GIS developments were mislabeled “computer graphics,” and a grand opportunity was lost.
Years ago, I warned, “Advances in geography could position our discipline to play a major role in important issues, such as global change or the restructuring of east European economies and societies. In contrast, advances in GIS alone are likely to cast us as clerks handling data for the ecologists, political scientists, economists, and other current leaders in these topics.” Harvard’s previous experience with GIS and its current direction are proving my point. Only by joining the fray of science theory ourselves and occasionally “drawing blood” will we establish ourselves as a respected force in the upper echelons of science, science policy, and public policy influenced by science. Meanwhile, many conventional theories—developed in isolation by specialized disciplines with little thought for geographic relationships, spatial logic, or integration—have stood unchallenged for decades.
Harvard administrators have opened the door to a possible return of geography, but the process is slow and uncertain. Can it possibly be in anyone’s interest for information technology of such power to exist, devoid of intellectual leadership, even temporarily, at the nation’s most influential university? Geography is the intellectual force behind GIS and its natural academic home. Of the 80 institutional members of the University Consortium for Geographic Information Science, for instance, about 85 percent are led or co-led by geography departments.
Gaffes, Laughs, and Downright Insults A laughable event from the past illustrates, in reverse, the state of geographic knowledge today. In 1897, the House of Representatives of the State of Indiana unanimously approved bill no. 246, which inadvertently would have changed the value of pi. Fortunately, the bill died a quiet death and never came before the Senate. The immediate agent of its defeat was Clarence A. Waldo, a professor of mathematics at Purdue University, who happened to visit the legislature; he was shown a copy of the bill and ridiculed its claims. Even if the good professor had not appeared, surely other voices would have materialized from mathematically informed government officials and staffers, journalists, educators, and the public.
Today, however, politicians and pundits can make whatever pronouncements they please about geography, no matter how absurd, and there aren’t enough geographically informed people to counter their claims. Geographically smart people exist, of course, in government offices, schools, businesses, and homes across the land, but they are too few. There’s no sizable constituency to carry the day. Not even journalists ask the questions that should be asked. Worst of all, geography has slipped so far beneath the public consciousness that no politician or journalist is likely to seek an informed geographic opinion, even on matters of war and peace.
There is today no greater gulf of knowledge than that which lies between the public understanding of geography and the reality of what geographers actually do. Every geographer endures frequent reminders from people who suffer from honest misunderstanding. Some are funny, some downright insulting. For example, I once fell into conversation with a salesperson in an upscale shop in Kansas City, a sophisticated woman whose daughter attended my university. She asked what I teach. I answered, “Geography,” and she said, “Oh, they don’t teach that in college, do they?” I said, “Certainly. We offer B.A.s, M.A.s, Ph.D.s.” Then came the cruelest cut of all: “Well, what do they call it?” she asked incredulously.
Believe it or not, some people really do think geography is just knowing your states and capitals. Some think it’s just about borders. Some think it’s purely physical. Others think it’s purely social. Actually, cultural, social, and economic topics comprise 47 percent of declared specialties in geography; geographic information science, 21 percent; physical, 10 percent; regional, 8 percent; methodology, 5 percent; and combinations of all the above, 9 percent.
Most individual gaffes are insignificant, and we are accustomed to fending them off. Collectively, however, they doom society to the kind of misunderstanding that makes bad policy, bad business, and bad science.

38
Some individual comments are dangerous and worth fighting. Harvard’s assault, for instance, began in 1948 when president James Conant declared, “Geography is not a university subject.” His institution’s influence is such that his words and associated actions triggered a national purge of historic proportions.
In spite of all that’s happened to prove Conant wrong, some people still don’t get the message. Recently, the vice president of a highly respected liberal arts college in California publicly questioned the legitimacy of human geography as an Advanced Placement course. Many eloquent letters have been written by geographers to the college’s administrators, and selected ones will be published in the American Geographical Society’s publication Ubique.
Solidarity Restoring geography is in your best interest as a citizen of the world and especially as a GIS professional, regardless of your home discipline. We are your natural ally, whether you yourself hold a degree in geography or not. No discipline should rest easy until the one that was lost is restored. Every scholar should be clamoring for geography’s return as proof that future purges will not be tolerated, and that holds true even for those who do not like geography.
What protects other disciplines from onslaughts like those that beset geography? You may imagine that public opposition would be fierce, and legions of academic peers would rise up in arms, but that did not happen in our case. You may imagine that your own discipline would not go down without a fight, but geographers accepted their fate far more graciously than they should have. Earlier this year, when I published an op-ed piece questioning how and why the nationwide purge had occurred, all but one of the public replies came from geographers, and several blamed the discipline itself. Yet every reason they offered was characteristic of many other disciplines, none of which were punished as we were.
As passionate as I am about my discipline, my advocacy is not chauvinistic. I fully recognize that geography is not the only answer. The GIS revolution never could have happened without massive contributions by computer scientists, landscape architects, mathematicians, electrical engineers, and many others. The same is true for geography as a body of knowledge about places. Cultural anthropologists, for instance, understand as much about culture as we do, and they teach it just as well. Indeed, I support all those other disciplines as much as I do my own, but they were not purged as geography was.
My first point is that geography has an essential viewpoint and methodology that are at least as important as those of other disciplines. Geography was purged, aliased, and fragmented, and none of the fragments add up to the whole. Area studies programs, for instance, bring together specialists of all sorts who know much about each region, but they do not inherently contain the glue that holds those regions together. Their faculties do not inherently think about space and define it as geographers do. That’s why, despite all the federal dollars they have received since 1958, area studies programs were not major contributors to GIS development while geographers were.
My second point is that geography has been neglected to an extent that no other discipline has faced in modern times. Not a single Ivy League university tries to get by without anthropology, biology, history, mathematics, and sociology, for example. Indeed, you will find Ph.D. programs for all of those disciplines, and usually multiple Ph.D. programs for their subspecialties, in every Ivy League university (except, in some cases, Dartmouth, which emphasizes undergraduate education). Only geography is missing.
What Can You Do to Help? Say the word—Nowadays, there is a conspicuous reluctance to say the G word. Spatial or geospatial are more acceptable than geography or geographic. When geographers discover anything new, they are likely to be identified with the closest thematic discipline rather than geography, even if geographic methods were absolutely essential to the discovery. Geographers are routinely misidentified as geologists, though only 10 percent of them claim physical specialties that could possibly be confused with geology.

39
Tell people what geography really is—The vast majority of geographers define their discipline based on spatial perspective and methods rather than content. Tell everybody that geography is to space what history is to time. No one would seriously suggest that a university should exist without a history department, Why should any exist without geography?
Make administrators accountable—If your favorite university does not have a geography department, ask why. If it has one but it’s combined with another discipline, ask administrators to explain the reasoning behind its placement. Together, we must send the clear message that every discipline that helps explain our world matters to every one of us. We and those who support us throughout society must draw a line that no politician or administrator can cross without pain. Every individual who crosses that line must face accountability. The hardest part, of course, will be to set aside your own discipline’s short-term interests in favor of the greater good, but solidarity is our best hope to staunch the purge of disciplines. Together, we must oppose every threat, starting with the one that has already occurred.
Lobby for a rational legislative agenda—Funding for geographic education, development, and research must be increased by at least two orders of magnitude, partly to solve the labor shortage in GIS and partly to educate the general public. These funds are needed to fulfill six modest principles:
1. Every elementary and high school student must have the opportunity to learn basic geography and experience GIS technology.
2. At a minimum, every freshman should reach college knowing that geography is a viable major with solid career prospects after graduation.
3. Every college student must have access to a full geographic curriculum—thematic, regional, methodological, and technological—within the set of college destinations among which he or she normally would choose.
4. Scholarships must be available to support the best and brightest students who choose to pursue undergraduate and graduate degrees in geography.
5. Research grants must be available to encourage substantially increased geographic research, including fieldwork, both foreign and domestic, by faculty and students.
6. Development grants must be available to upgrade or create geography faculties throughout the nation; to ensure topical, regional, methodological, and technological coverage; to upgrade GIS facilities; and to promote community outreach.
Aim big—In a rational world, Congress would urgently fund a crash educational program to rush society ahead in this vital discipline as it did for science and math in the 1950s. Instead, the powers that be in the highest realms of education, science, and science policy have done precisely the opposite for six decades. Now change is coming, but will it be enough? Will it happen fast enough? Will geographers and GIS professionals have much influence on the outcome?
Restoring Geography Actually, I don’t think such a crash program is out of the question. Society may well recognize the folly of its ways and try to restore geography through remedies such as those I recommend. National leaders may suddenly recognize what’s missing in foreign intelligence, foreign policy, information technology, and other vital aspects affecting national interests. Everything depends on getting our message through to the right people. Once it’s there, anyone with a sound, open mind can grasp the point.
One reason for my cautious optimism is that I have seen how quickly individual leaders can modify their personal impressions of geography whenever I’ve had a chance to talk with them one on one at length. Over the past year, for instance, I had occasion to speak three times with General David H. Petraeus, now commander of American forces in Iraq, and he exemplifies an excellent case in point. He holds a doctorate in international relations from Princeton University’s Woodrow Wilson School of Public and International Affairs, and he’s every bit as smart as you’ve heard. His innate sense of geography comes through in his 14 observations from soldiering in Iraq. Observation no. 9 says, “Cultural awareness is a force multiplier,” and he adds, “knowledge of the cultural ‘terrain’ can be as important as, and sometimes even more important than, knowledge of the geographic terrain.” The first time we spoke, I passionately advocated sending
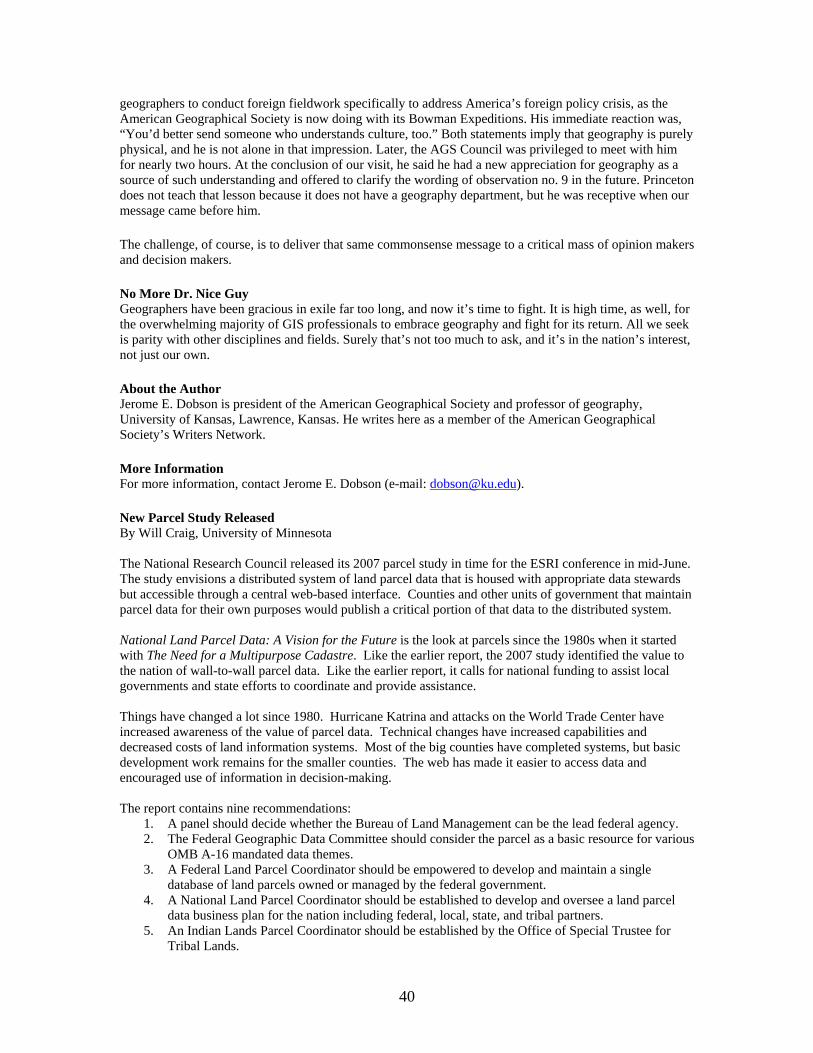
40
geographers to conduct foreign fieldwork specifically to address America’s foreign policy crisis, as the American Geographical Society is now doing with its Bowman Expeditions. His immediate reaction was, “You’d better send someone who understands culture, too.” Both statements imply that geography is purely physical, and he is not alone in that impression. Later, the AGS Council was privileged to meet with him for nearly two hours. At the conclusion of our visit, he said he had a new appreciation for geography as a source of such understanding and offered to clarify the wording of observation no. 9 in the future. Princeton does not teach that lesson because it does not have a geography department, but he was receptive when our message came before him.
The challenge, of course, is to deliver that same commonsense message to a critical mass of opinion makers and decision makers.
No More Dr. Nice Guy Geographers have been gracious in exile far too long, and now it’s time to fight. It is high time, as well, for the overwhelming majority of GIS professionals to embrace geography and fight for its return. All we seek is parity with other disciplines and fields. Surely that’s not too much to ask, and it’s in the nation’s interest, not just our own.
About the Author Jerome E. Dobson is president of the American Geographical Society and professor of geography, University of Kansas, Lawrence, Kansas. He writes here as a member of the American Geographical Society’s Writers Network.
More Information For more information, contact Jerome E. Dobson (e-mail: [email protected]).
New Parcel Study Released By Will Craig, University of Minnesota The National Research Council released its 2007 parcel study in time for the ESRI conference in mid-June. The study envisions a distributed system of land parcel data that is housed with appropriate data stewards but accessible through a central web-based interface. Counties and other units of government that maintain parcel data for their own purposes would publish a critical portion of that data to the distributed system. National Land Parcel Data: A Vision for the Future is the look at parcels since the 1980s when it started with The Need for a Multipurpose Cadastre. Like the earlier report, the 2007 study identified the value to the nation of wall-to-wall parcel data. Like the earlier report, it calls for national funding to assist local governments and state efforts to coordinate and provide assistance. Things have changed a lot since 1980. Hurricane Katrina and attacks on the World Trade Center have increased awareness of the value of parcel data. Technical changes have increased capabilities and decreased costs of land information systems. Most of the big counties have completed systems, but basic development work remains for the smaller counties. The web has made it easier to access data and encouraged use of information in decision-making. The report contains nine recommendations:
1. A panel should decide whether the Bureau of Land Management can be the lead federal agency. 2. The Federal Geographic Data Committee should consider the parcel as a basic resource for various
OMB A-16 mandated data themes. 3. A Federal Land Parcel Coordinator should be empowered to develop and maintain a single
database of land parcels owned or managed by the federal government. 4. A National Land Parcel Coordinator should be established to develop and oversee a land parcel
data business plan for the nation including federal, local, state, and tribal partners. 5. An Indian Lands Parcel Coordinator should be established by the Office of Special Trustee for
Tribal Lands.

41
6. Congress and the Census Bureau should explore modifying Title 13 so that building addresses and coordinates can be made public.
7. State Coordinators should be established in each state to develop plans and relationships with local government. The goal of these efforts is to achieve border-to-border parcel coverage for all publicly and privately owned property within the state.
8. The National Land Parcel Coordinator should develop an intergovernmental funding program for the development and maintenance of parcel data, including incentives to participate for those counties with fully-developed systems and financial support for those who do not.
9. Local government is expected to put into the public domain both parcel geometry and a very limited set of attributes. This should become a minimum requirement to receive federal funds directly associated with property, such as disaster relief.
The full report is available online at http://books.nap.edu/catalog.php?record_id=11978 MAPPS Loses Lawsuit From Association of American Geographers website On June 14, 2007, the U.S. District Court in Alexandria, Virginia, ruled against special interest groups seeking to strictly limit government contracting for mapping and GIS activities. In the matter of MAPPS, et al., v. United States of America, Judge T.S. Ellis III issued a summary judgment in favor of the government based on the MAPPS plaintiffs’ failure to “establish that an injury in fact was suffered by the individual surveyors or their firms.” Several geographic and GIS organizations, including AAG, GISCI, GITA, UCGIS, and URISA joined together to support the government and oppose the MAPPS litigation through educational outreach and the development of an Amicus Brief to the Court on the case. The AAG has also established a Mapping and GIS Community Defense Fund to help defray the cost of legal fees and educational activities related to these issues (see www.aag.org). The “Management Association for Private Photogrammetric Surveyors” (MAPPS) filed the lawsuit earlier this year seeking to limit competition for federal mapping contracts of nearly every type, including GIS services, to firms of licensed architects, engineers and surveyors. “The federal court’s rejection of the MAPPS lawsuit in this ruling will help ensure that all qualified professionals in the mapping and GIS communities can fairly compete for government contracts,” said Douglas Richardson, executive director of the AAG. A ruling in favor of the MAPPS plaintiffs would have had far reaching negative impacts on cartographers, geographers, computer scientists, planners, foresters, GIS specialists, governmental agencies, GIS service companies, and many others who have long been creative, innovative, and productive forces in the mapping and GIS fields. A copy of the judge’s decision and additional background information on the case is available at the following websites: www.aag.org, www.gisci.org, www.gita.org, www.ucgis.org, and www.urisa.org, or by contacting David Coronado at 202-234-1450.