faking bad: do high-ability elementary students
TRANSCRIPT

The Pennsylvania State University
The Graduate School
College of Education
FAKING BAD:
DO HIGH-ABILITY ELEMENTARY STUDENTS INTENTIONALLY
UNDERACHIEVE WHEN THEIR WORK IS PEER-REVIEWED?
A Dissertation in
School Psychology
by
Kasey M. K. Black
© 2012 Kasey M. K. Black
Submitted in Partial Fulfillment
of the Requirements
for the degree of
Doctor of Philosophy
December 2012

ii
The dissertation of Kasey M. K. Black was reviewed and approved* by the
following:
James Clyde DiPerna
Associate Professor of Education
Professor-in-Charge of School Psychology Program
Dissertation Advisor
Chair of Committee
Robert Hale
Full Professor of Education (Educational & School Psychology)
Eric Loken
Research Associate Professor of Human Development
Hoi K. Suen
Distinguished Professor of Educational Psychology
*Signatures are on file in the Graduate School.

iii
ABSTRACT
While faking bad, or the intentional distortion of assessment results, has been studied
extensively with self-report measures (Lim & Butcher, 1996; Roskes, 2009), the
possible presence of this behavior on direct measures has only just begun to be
examined. Previous studies of faking bad on academic measures have been limited to
students at the middle and high school levels, and results have indicated that students
of high ability report faking-bad behavior more often than other students (Boehnke,
2008). These studies also have been limited by their use of nonexperimental designs.
Thus, the current study examined faking-bad behavior on direct measures of reading
and mathematics achievement in fourth and fifth grade. Students were randomly
assigned to a treatment or control condition. In each condition, participants completed
brief standardized measures of reading and mathematics. In the experimental
condition, participants were informed that their peers would be grading their work
after completion of the assessment. In the control condition, participants were
informed that their teachers would be the ones to grade their tests. Results indicated
that peer review did not adversely affect the reading or mathematics achievement of
fourth and fifth grade high-ability students. Moreover, faking-bad behavior did not
vary by gender for either subject area. Therefore, intentional underachievement does
not appear to occur at the fourth and fifth grade levels in reading or math.
iv
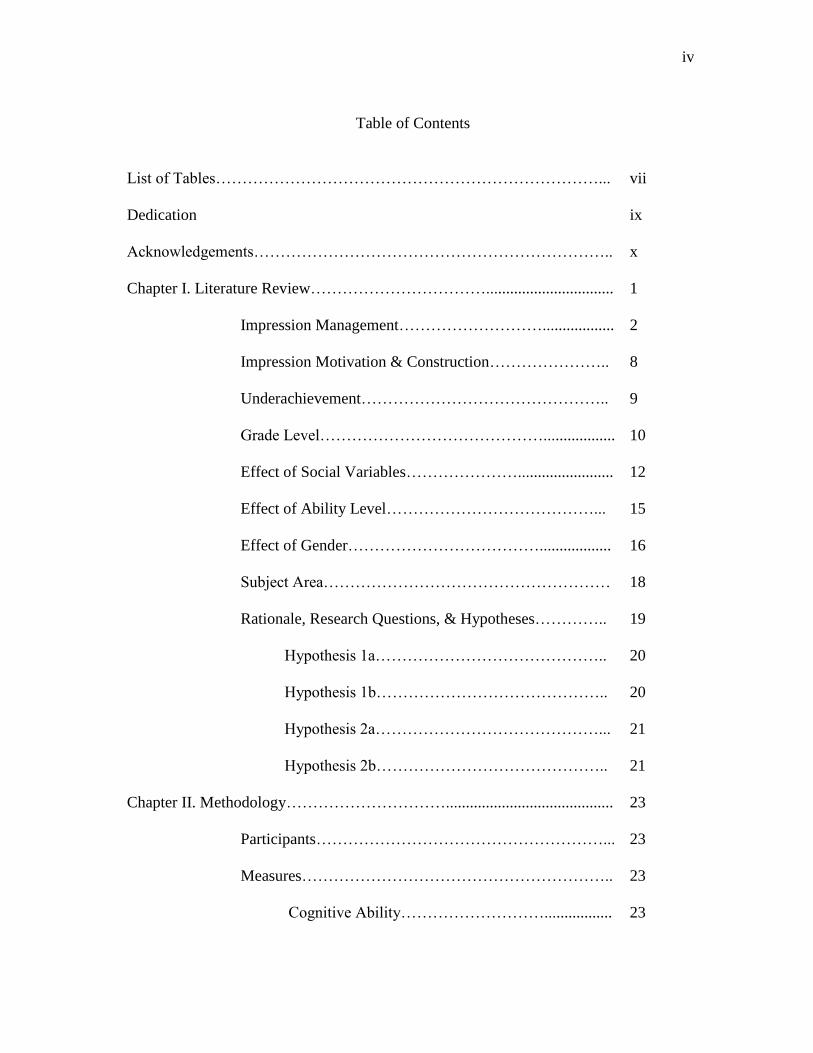
Table of Contents
List of Tables………………………………………………………………...
Dedication
Acknowledgements…………………………………………………………..
vii
ix
x
Chapter I. Literature Review……………………………................................ 1
Impression Management………………………..................
2
Impression Motivation & Construction…………………..
8
Underachievement………………………………………..
Grade Level……………………………………..................
9
10
Effect of Social Variables…………………........................
12
Effect of Ability Level…………………………………...
15
Effect of Gender………………………………..................
16
Subject Area……………………………………………… 18
Rationale, Research Questions, & Hypotheses…………..
Hypothesis 1a……………………………………..
Hypothesis 1b……………………………………..
Hypothesis 2a……………………………………...
Hypothesis 2b……………………………………..
19
20
20
21
21
Chapter II. Methodology………………………….......................................... 23
Participants………………………………………………...
23
Measures…………………………………………………..
Cognitive Ability……………………….................
23
23
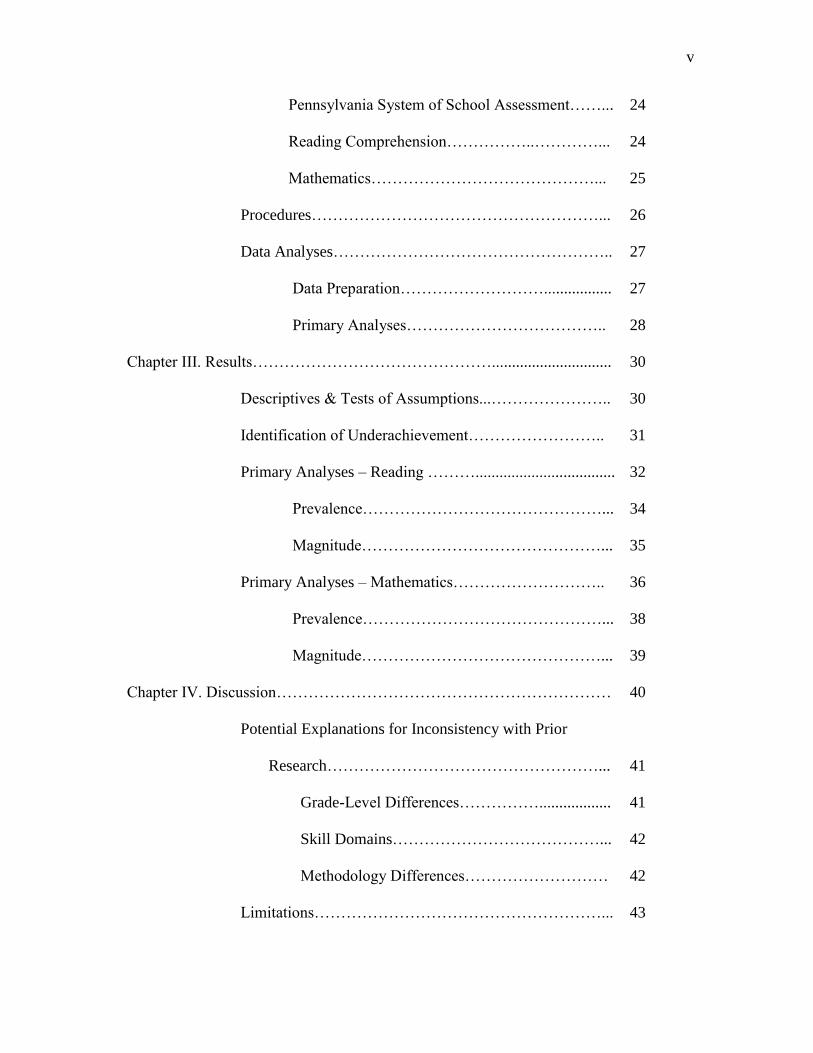
v
Pennsylvania System of School Assessment……...
Reading Comprehension……………..…………...
Mathematics……………………………………...
24
24
25
Procedures………………………………………………...
26
Data Analyses……………………………………………..
Data Preparation……………………….................
Primary Analyses………………………………..
27
27
28
Chapter III. Results………………………………………..............................
30
Descriptives & Tests of Assumptions...…………………..
30
Identification of Underachievement……………………..
31
Primary Analyses – Reading ………...................................
Prevalence………………………………………...
Magnitude………………………………………...
32
34
35
Primary Analyses – Mathematics………………………..
Prevalence………………………………………...
Magnitude………………………………………...
36
38
39
Chapter IV. Discussion……………………………………………………… 40
Potential Explanations for Inconsistency with Prior
Research……………………………………………...
Grade-Level Differences……………..................
Skill Domains…………………………………...
Methodology Differences………………………
41
41
42
42
Limitations………………………………………………...
43

vi
Directions for Future Research……………………………
45
Implications…………………………………….................
46
Conclusion………………………………………………..
47
References…………………………………………………………………..
49
Appendix A: Sample Probe for Reading Comprehension…………………...
61
Appendix B: Sample Probe for Mathematics………………………………...
62
Appendix C: Procedural Directions……………………….............................
68
Appendix D: Preliminary Analyses………………………..............................
69
Reading…………………………………………………..
69
Math………………………………………………………
71

vii
LIST OF TABLES
Table 1. Studies that Explore the Relationship Between Self-Presentation
and Achievement …………...…………………………………………….
6
Table 2. Means and Standard Deviations for Independent and Dependent
Variables……………………………………………………………………
31
Table 3. Percentage of Underachievers by Category in the Area of
Reading……......................................................................................
33
Table 4. Reading Scores for Expected Achievers and Underachievers by
SEM Criterion Level………………………………………………………
34
Table 5. Means and Standard Deviations of Reading Scores by Condition,
Gender, & Ability…...........................................................................
34
Table 6. Percentage of Underachievers by Category in the Area of
Mathematics......................................................................................
37
Table 7. Mathematics Scores for Expected Achievers and Underachievers by
SEM Criterion Level……………………………………………………
38
Table 8. Means and Standard Deviations of Mathematics Scores by
Condition, Gender, & Ability….…………….………………………….
38
Table D1.
Table D2.
Table D3.
Descriptive Results of Independent Variables on Reading
Achievement……………………………………………………………….
Sequential Regression of Independent Variables on Reading
Achievement………………………………………………………………
Descriptive Results of Independent Variables on Math
Achievement………………………………………………………………
70
71
72
viii
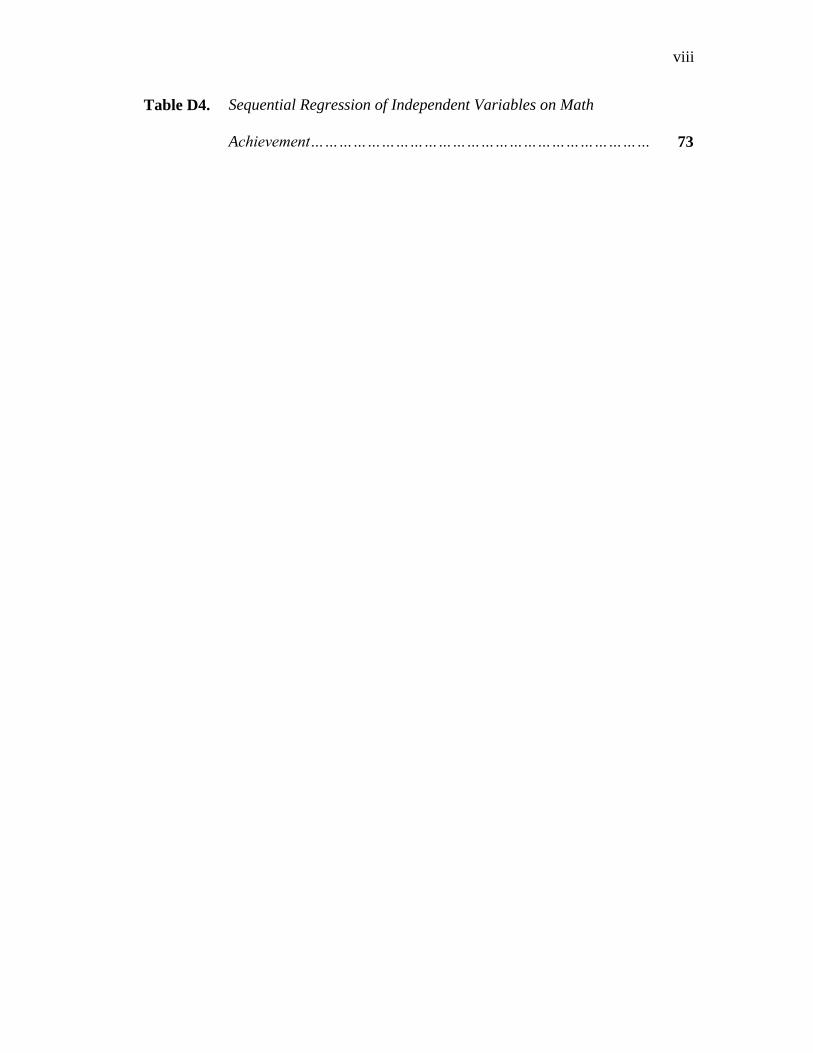
Table D4.
Sequential Regression of Independent Variables on Math
Achievement………………………………………………………………
73

ix
DEDICATION
This research paper is lovingly dedicated to my mother, Joyce Kotz: an educator,
wife, and mother, who will be eternally missed but whose short time on the earth left
a positive fingerprint on countless people. She encouraged me as a young child to
follow my dreams and helped me to believe that anything can be possible if you have
the courage to pursue it.

x
ACKNOWLEDGEMENTS
I would like to extend my sincerest appreciation to my advisor, Dr. James
Clyde DiPerna, for the countless hours spent helping to improve this document and,
more importantly, for teaching me how to conduct accurate research and avoid
common pitfalls. I would also like to thank my committee members: Dr. Robert Hale,
Dr. Eric Loken, and Dr. Hoi Suen. I truly believe that this document would not have
been as complete and informative without your guidance and encouragement. I am
extremely grateful for your input and support.
Additionally, it would have been impossible to complete this process without
the support of my colleagues at Council Rock School District. To my supervisor, Mr.
Rudy Lamberth, and to my director, Dr. Charles Lambert, I am incredibly thankful
for your endless assistance and frequent questioning regarding the status of this
manuscript, which encouraged me to continue persevering. I am very blessed to work
with such remarkable leadership and mentors. Moreover, thank you to the principals,
superintendent, assistant superintendent, and school board for allowing me to gather
data for the betterment of education as a whole.
Lastly, to my family and friends, I would not be anywhere in my education or
career without your care, love, and support. Thank you to my husband, Kevin Black,
for your constant encouragement and support, especially during the times when I
experienced perceived impasses. Your seemingly minor assistance (e.g., foregoing
watching your favorite television shows while I was working, checking on me when I
was up late working, continually fighting with the computer to recover my “lost”
xi
documents) was more than I could have requested and made the completion of this
document possible. Thank you also to my father, Ron Kotz, who constantly managed
to provide me with encouragement while simultaneously not permitting me to feel
accomplished until the conclusion of this manuscript! Your reminders to “get it done”
were mentally replayed when it would have been easy to stop working and, in so
doing, helped me to persist. Most notably, without saying it directly, I knew that you
never once doubted that I would be able to complete this document successfully,
which allowed me to believe in that possibility myself. My appreciation also goes out
to my sisters, Kristin Kotz and Kimberly Kotz, who have more confidence in me than
I could ever imagine having in myself. Your support and listening ears consistently
help me to persevere and remain positive while doing so, and for that I will be forever
grateful. Lastly, to my dear friend, Amanda Garrett, thank you for providing me with
moral and technological support, without which none of this would be possible.

1
CHAPTER I:
LITERATURE REVIEW
Every day people make decisions regarding how to present themselves based on
their self-presentational goals. In turn, goals for self-presentation, also known as a form
of impression management, influence a large range of social decisions and judgments
(Vohs, Baumeister, & Ciarocco, 2005). In fact, some researchers have argued that self-
presentation shapes all aspects of human behavior and has important implications for how
individuals are perceived, evaluated, and treated by others (Martin, Leary, & Rejeski,
2000). Common examples of self-presentation or impression management include
appearing conservative in a job atmosphere, neglecting to disclose bad habits while on a
date, and pretending to be more skilled in a specific area or trade during a job interview.
While some people may strive to appear more competent in an area, others may
downplay their abilities in an effort to be more socially accepted, as desirable qualities
differ according to context (Schlenker, 1980).
Although the use of self-presentation to shape others’ impressions of oneself has
been extensively studied with job applicants, professionals, and users of social
networking sites such as Facebook, MySpace, and StudiVZ (Barrick, Shaffer, &
DeGrassi, 2009; Hewlin, 2009; Kramer & Winter, 2008), the application to educational
settings has not been explored thoroughly to date. Given the high prevalence of
impression management and self-presentation behaviors in employment, it is plausible
that such behaviors would also be observed in school settings. However, while a primary
goal of adulthood is to attain a certain occupational status, a central goal of adolescence is
to achieve and maintain peer approval (Brown, 1990). Thus, the self-presentation goals of

2
adults are likely in stark contrast to those of young students, as adults seek to present
themselves as intellectually competent in most settings, while children and adolescents
focus on emphasizing sociability and other values of young people.
One group of students potentially prone to the use of self-presentation strategies
includes students of high ability, who are frequently labeled nerds, brains, or geeks by
classmates (Huryn, 1986; Kinney, 1993; Seligman, 1990). In order to avoid such
rejection, high-ability students attempt a variety of different impression management
techniques in an effort to remove the focus from their academic abilities. Accordingly,
Filkins (1995) suggested that minimization of academic abilities and underachievement
are the most commonly used self-presentation strategies of high-ability adolescent
students in response to peer pressure.
Given the prevalence of self-handicapping impression management strategies in
high-ability students, it is important that researchers and practitioners understand the
circumstances under which such behavior is exhibited. While this phenomenon has been
investigated at the upper grade levels (Filkins, 1995; Juvonen & Murdock, 1993; Moore,
1997), “faking bad” on measures of academic achievement has yet to be examined at the
elementary level. Furthermore, previous studies have not directly examined faking-bad
behavior through the use of an experimental design. Thus, the present study directly
examined whether young students engage in the self-presentation strategy of
underachievement under peer-review conditions.
Impression Management
The study of impression management and self-presentation was spurred by the
work of two early symbolic interactionists, Cooley (1902) and Mead (1934), who held
3
that people continuously imagine themselves in the role of others, anticipate reactions to
their behaviors, and select their own behavior accordingly. Goffman (1959, 1971)
expanded these theories with analyses of social behavior in which he found that people
can be viewed as actors, and their interpersonal conduct can be considered performances.
Thus, until the 1980s, social psychologists regarded impression management as a
nonessential, tangential topic, which either confounded research processes or was
considered to be an applied concept in politics, business, and advertising. However,
extensive research in the 1980s and early 1990s (e.g., Jones & Pittman, 1982; Leary &
Kowalski, 1990; Schenkler, 1980; Tedeschi, 1981) contributed to a shift in thinking about
self-presentation from a topic of curiosity to a fundamental interpersonal process in
which participants actively attempt to define their identities, roles, and interactions.
As a result of this shift, it was determined that people present images, or schemas,
of themselves in order to control how they are defined and treated by others (Schlenker,
1980). The identities formed from these images are determined by self-glorifying
motives, being consistent with self-beliefs, or because they are accurate. Such motives
can be strengthened or weakened according to the condition and social context. As
asserted by Schlenker and Weigold (1992, p. 137), “just as a textbook writer must edit
information to present it in a readable, concise fashion, so must people edit information
about themselves in everyday life to provide the ‘best’ descriptions possible.” Therefore,
it is typically in one’s best interest to convey specific types of impressions in the presence
of others, and the employed type of impression is dependent on the context and what the
person is trying to achieve (Jones & Pittman, 1982). For example, Lievens, Klehe, and
Libbrecht (2011) identified a significant difference in self-reported emotional intelligence

4
of job applicants versus employees, as job applicants have a vested interest in trying to
appear more emotionally intelligent while current employees who already have the
position are less inclined to exaggerate their traits.
Investigation of this process of impression management has revealed that multiple
self-presentation strategies are available based upon the achievement goal (Jones &
Pittman, 1982). Specifically, when the context for impression management regarded
academic achievement, two opposing strategies were commonly used: self-promotion and
self-deprecation. Examples of the former strategy include statements describing positive
performance on a specific subject or task, while examples of the latter include statements
describing how an individual performs a specific subject or task poorly.
Additional recent literature in the field of social psychology has examined how
people interpret others’ self-attributional statements. While some researchers argue that
behaviors are perceived to be directly representative of a person’s personality (also
known as trait inference; Gilbert & Malone, 1995; Uleman, Newman, & Moskowitz,
1996), others assert that because people are aware of self-presentational motives, these
statements can be interpreted as either directly representative of an individual’s
personality or indicative of how that person would like to be perceived (Hilton, Fein, &
Miller, 1993; Vonk, 1993). Through the examination of how impression management
guides the perceptions of student achievement, Vonk (1999) found that the presence of a
verification indicator (i.e., a direct measure of someone’s claim, such as a score on a test)
moderated the relationship between the type of statement and how it is perceived. From
such findings, it was determined that students making low-ability statements are
perceived to be driven by impression management, or self-deprecation, when verification
5
is possible. Conversely, students who make high-ability statements are perceived as
engaging in self-promotion only when verification is not possible. In sum, students not
only engage in self-promotion and self-deprecation strategies but also apply the
knowledge of the aforementioned methods to academic achievement statements made by
fellow students. Specific studies that explore the relationship between impression
management and achievement are outlined in Table 1.
6
Table 1
Studies that Explore the Relationship Between Self-Presentation and Achievement
Citation Sample Measure Conclusion
Barcocas &
Christiansen,
1968
College
students
Self-report scale, interest
bank, & GPA
Students who are good impression managers achieve higher GPAs than poor
impression managers.
Boehnke, 2008 14-year-old 8th
& 9th graders
Self-report, report card
grades, & performance on 3
math items
Peer pressure experienced by high-ability students results in lower achievement,
while similar findings were not observed for students with low or medium
abilities. Brown,
Uebelacker, &
Heatherington,
1998
College
students
Verbal report of GPA
predictions
Self-reported predictions of achievement for males differed according to the
personality of the peer, while self-reports did not vary for females.
Filkins, 1995 7th, 8
th, 10
th, &
11th graders
Self-report rating scale High achieving students are likely to engage in minimization or
underachievement in response to peer pressure. Fitzpatrick,
1978 2
nd – 10
th
graders
GPAs High-ability students who ultimately earn GPAs that fall below the class mean
begin to underachieve in Grade 6. Ford, Granthem,
& Whiting,
2008
5th – 12
th
graders
Self-report of achievement
related attitudes & behaviors
In an effort to refrain from betraying peers by “acting White,” Black students
frequently engage in purposeful underachievement.
Fordham &
Ogbu, 1986 Middle school
students
Self-report measures Adolescent students often engage in underachievement in an effort to escape
ridicule from peers. Forsyth,
Schlenker,
Leary, &
McCown, 1985
College
students
Self-report questionnaire of
personality
Male college students emphasize their academic achievement when given a
leadership role within the classroom, while female college students emphasize
socio-emotional and interpersonal skills.
Heatherington,
et al., 1993 College
students
Student predictions of GPA Female college students report lower GPA predictions as compared to men
when interacting with low achieving partners. Heatherington,
Townsend, &
Burroughs,
2001
College
students
Student predictions of GPA Men tend to overpredict their achievement, while females offer accurate
predictions.
7
Table 1
(Continued)
Citation Sample Measure Conclusion
Henagan &
Bedaian, 2009 Adults Self-report surveys Because high-ability students experience discomfort when peers respond
negatively to their achievements, they engage in modest self-presentation,
avoidance, or underachievement. Henfield, Moore,
& Wood, 2008 7
th, 8
th, & 9
th
graders
Demographic surveys &
one-on-one interviews
Environmental variables have resulted in a high occurrence of
underachievement in high-ability Black students. Hudgins, 2008 Adults Qualitative observations &
conversations
When faced with peer pressure, females earn lower scores on measures of
mathematic achievement than males. Juvonen &
Murdock, 1993 8
th graders Self-report ratings Students report that high-ability and increased effort result in increased teacher
liking and decreased peer popularity. Tyson, Darrity,
& Castellino,
2005
Middle &
high school
students
Self-report surveys While peer pressure negatively effects the achievement of African American
students, similar effects are also observed on students of other cultural
backgrounds. Vonk, 1999 Adults Ratings of personality traits The presence of an indicator (e. g., score on a test) moderates the relationship
between the type of statement and how it is perceived.

8
Impression Motivation and Construction
As a result of the interplay between impression management and peer knowledge
of such strategies, a two-component model has been developed to explain the process by
which people attempt to control the impressions of others (Leary & Kowalski, 1990). The
first discrete component involves impression motivation, or the extent to which people
are motivated to manage their public impressions. Underlying this component are the
goal-relevance of the impressions, value of desired goals, and discrepancy between the
desired and current image. The second component of the impression motivation model
describes impression construction, or the process by which the person goes about making
the desired impression. This component involves several facets, including self-concept,
role constraints, and current or potential social image. As such, this model provides a
framework for understanding the processes contributing to impression-relevant behavior.
Taking this model into account, Filkins (1995) applied both components of
impression motivation and impression construction to high-ability students, resulting in
four categories of academic self-presentation styles employed in an attempt to maintain
peer approval. One category was group isolation, or having students refuse to follow
social norms of peers who denigrate high achievement. Another category was
acceptance, in which students accept what is viewed as a negative trait (e.g., high
achievement) and the associated effect this may have on peer approval. A third category
was minimization, where high achieving students attempt to downplay their academic
abilities in order to maintain peer approval. Students who engage in this behavior
recognize the importance of academic achievement, but they do not want to incur any
associated peer rejection. Thus, they engage in behavior that makes their effort and

9
achievement less noticeable. Finally, high-ability students also engage in
underachievement, or pretending not to know as much as they do. In contrast to students
who engage in minimization, underachievers refuse to engage in behavior associated with
positive achievement. As a result, these students are prone to experience academic
mediocrity and possibly failure. Filkins’ (1995) study of high-ability seventh and eighth
graders revealed that, of the four aforementioned strategies, minimization and
underachievement are reported by students to be the most prevalent self-presentation
styles.
Underachievement
According to researchers (e.g., Colangelo, Kerr, Christiansen, & Maxey, 1993;
Emerick, 1992; Richert, 1991; Rimm, 1995), a broad definition of underachievement is a
discrepancy between children’s abilities and their school performance. A frequently
investigated topic, Dai, Swanson, and Cheng (2011) found that
achievement/underachievement is one of only four main topics on which focus is placed
in empirical studies concerning high-ability students. To describe the possible origins of
underachievement for students, Rimm (2008) created a 2 x 2 matrix that plotted effort
(from negative to positive) against outcomes (from negative to positive). Though four
categories exist within this framework, only positive effort resulting in positive outcomes
would produce appropriate levels of achievement.
Through the examination of underachievement, several explanatory hypotheses
have been proposed and tested in an effort to better understand potential causes of
underachievement. For example, Heyman and Legare (2005) examined the value of
different sources of information (e.g., self-report, teacher report, peer report, direct
10
observation) regarding psychological traits, including ‘smart’ and ‘honest.’ Results
indicated that social desirability plays a significant role within the self-presentational
process, yielding difficulties with the interpretation of self-report of achievement among
children. Case study research also has shown the significance of social variables on the
intentional underachievement of high-ability students (Moore, 1997).
Grade Level
Although the majority of studies on impression management have been conducted
on college students or adults in the professional world (e.g., Barrick, Shaffer, &
DeGrassi, 2009; Brandt, Vonk, & Knippenberg, 2009; Carter & Sanna, 2008; Chen, Wu,
Kee, Lin, & Shui, 2009; Henagan & Bedeian, 2009; Hewlin, 2009; Lalwani & Shavitt,
2009; Schlenker & Goldman, 1982), some researchers have begun to examine these
phenomena in middle and high school settings. For example, Shen, Sullivan, Igoe, and
Shen (1996) asked seventh graders and high school students to read scenarios in which
the main character attempted both easy and challenging tasks. After completing the
readings, the students were asked to predict whether the main character would attempt the
same task a second time. Students also were asked if they would reattempt the same easy
and difficult tasks as the main character. Self-presentation strategies were evident for all
of the students as a higher return-to-task rate was reported for easy tasks for the scenario
characters, while a significantly higher return-to-task rate was self-reported by the
students for challenging tasks. Therefore, the authors concluded that self-presentation
strategies are employed by children in high school and seventh grade.
Juvonen and Murdock (1993) examined the use of self-presentation strategies by
students at the upper intermediate level. In this study, eighth graders were found to report

11
differential consequences of ability and effort according to the type of audience member.
The results revealed that students predicted high ability and high effort would result in
increased teacher liking but decreased peer popularity. A follow-up study with the same
eighth grade participants examined the self-attributions for successful and poor
performance. Findings uncovered that when explaining their exam performance to peers,
they were less likely to attribute the outcome to ability compared to when they
communicated with parents or teachers. In addition, students did not attribute success to
effort when interacting with peers, while effort was offered as a reason for success when
talking with parents and teachers. Thus, some adolescents attempted to mask their
achievement efforts and give the appearance of not expending effort (Fordham & Ogbu,
1986).
In trying to determine when children begin to associate effort with negative social
consequences, Rimm (2005) found that 15% of children in the third grade are worried
about popularity, and the percentage of students concerned about this issue increases
steadily with each grade in school. Furthermore, Yoshida, Kojo, and Kaku (1982) found
that students begin recognizing that self-deprecating, or modest, personalities regarding
achievement result in more peer approval as early as the second grade. Similarly, some
researchers have begun to explore the point at which underachievement begins.
Fitzpatrick (1978) examined the comparison between the cognitive ability of students
with high ability and their achievement as defined by grade point averages (GPAs) from
Grade 2 to Grade 10. The findings indicated a significant level of underachievement
beginning in Grade 6 and continuing through Grade 10. Results of a similar study
suggested that underachievement begins in Grade 3 (Shaw & McCuen, 1960). However,

12
the effect of social pressure on the presence of underachievement and the point at which
its influence becomes significant were not directly examined by the aforementioned
researchers.
By applying these findings to the research indicating the elevated prevalence of
underachievement in high-ability students (e.g., Colangelo, Kerr, Christiansen, & Maxey,
1993; Preckel, Holling, & Vock, 2006; Wentzel & Asher, 1995), some researchers have
begun to explore a possible causal relationship between the impression management of
young students and underachievement. Boehnke (2008) found that the performance of
high-ability middle school students is reported to be negatively affected by peer pressure,
and such students may purposely underachieve to avoid social exclusion. Relatedly,
students in seventh, eighth, tenth, and eleventh grade were also found to report engaging
in faking-bad behavior on measures of achievement in an effort to cope with social
pressures (Filkins, 1995). Given that social pressure and underachievement have been
documented as early as second and third grade (Kinney, 1993; Rimm, 2005; Shaw &
McCuen, 1960; Yoshida, Kojo, & Kaku, 1982), an examination of intentional
underachievement at the elementary level appears warranted.
Effects of Social Variables
According to social comparison processes theory (Festinger, 1954), people
possess an inherent inclination to evaluate their performance through comparisons with
that of others. Although there have been many proposed revisions to this theory since its
publication, research has consistently demonstrated that individuals seek such evaluations
for the purpose of self-appraisal, self-enhancement, and self-improvement (Gibbons &
Buunk, 1999). When applying such evaluative feedback to one’s own performance,

13
upward comparisons result in negative emotions, such as resentment, bitterness, edginess,
and envy (Kruglanski & Mayseless, 1990; Schaubroeck & Lam, 2004). Due to these
negative emotions, people react by strategically differentiating themselves or
psychologically distancing themselves from the comparison group (Mussweiler, Gabriel,
& Bodenhausen, 2000; Tesser, 1980). Therefore, although high achievers may feel proud
of their accomplishments, they are also likely to experience discomfort resulting from
how others may be responding to such achievements. According to Henagan and Bedeian
(2009), such discomfort combined with comparison threat yields one of three possible
results: modest self-presentation, avoidance behaviors, or socially motivated
underachievement.
Applying these findings to the field of education, Brown (1990) hypothesized that
resentment from typical students is created as a result of the unattainable achievement
standards set by high-ability students, which may make the typical students look bad in
the eyes of teachers and other adults. To test this prediction, Juvonen and Murdock
(1993) asked college students as well as eighth graders to predict how success and failure
would affect peer popularity and teacher liking. Results indicated differential effects of
high achievement on their popularity with peers and teachers. Specifically, while the
students predicted teachers would prefer students who were successful due to effort and
ability, the respondents also predicted that these same students would be the least popular
among their peers. This phenomenon resulted in increased motivation for high-ability
students to underachieve in front of their peers.
As a result of studies such as these, Boehnke (2008) hypothesized that social
variables contribute significantly to scholastic underachievement, or faking bad. To test

14
this hypothesis, Boehnke studied 1,694 middle-school students from three different
countries. Findings indicated that adolescent students commonly experience peer pressure
in mathematics classes, and this peer pressure leads to self-reports of lower achievement.
Fears of social exclusion were found to be moderators in the determination of academic
performance. A negative relationship between ability and performance was noted for
students with very high mathematical skills, but this relationship was not evident,
however, for students with low to average abilities.
Given the fact that African American students, including those identified as
gifted, frequently exhibit underachievement or achieve at low levels due to a variety of
environmental variables (Henfield, Moore, & Wood, 2008), much attention has been
focused on African American students to better understand the impact of social factors on
the achievement of high-ability African American youth. More specifically, researchers
have found that Black students report experiencing societal pressure to ‘act White,’
which is defined as getting good grades, being intelligent, and speaking standard English
(Fryer & Torelli, 2005; Ogbu, 2004). However, peer pressure counteracts this societal
pressure in that ‘acting White’ is often viewed as a betrayal by peers, which results in
Black students intentionally underachieving (Ford, Granthem, & Whiting, 2008). Tyson,
Darrity, and Castellino (2005), though, concluded that the negative effects of peer
pressure on academic achievement for high-ability youths transcends cultural boundaries
and exists for students of all ethnic backgrounds. While the aforementioned studies shed
light on the prevalence of faking bad in students, they have focused primarily on middle
school and high school students without examining if this effect is present at an even
younger age.

15
Effect of Ability Level
Underachievement, as an educational outcome for students of high ability, has
sparked several controversies over the past 30 years (Anastasi, 1976; Behrens & Vernon,
1978; Rimm, 1986). Researchers disagree about the presence of underachievement in
high-ability populations, suggesting that low performance among high-ability students
can be attributed to measurement error. Despite such arguments, many practitioners agree
that underachievement of high-ability students is a persistent problem within schools
(Colangelo, Kerr, Christensen, & Maxey, 1993; Rimm, 2008). In 1983, the National
Commission on Excellence in Education (NCEE) asserted that more than 50% of
American students identified as mentally gifted do not achieve academically at their
potential. However, minimal explanation was offered regarding how the commission
arrived at this conclusion or possible reasons for this phenomenon. Since the release of
the NCEE report, several researchers have explored underachievement and attempted to
explain its occurrence in high-ability populations.
Niehart (2006) indicated that internal conflicts within gifted students arise when
these children begin to associate certain achievement attitudes or behaviors with betrayal
of their social culture. An extension of this theory was tested among gifted middle and
high school boys who were asked to complete two self-report measures, namely the Male
Role Norms Inventory – Adolescent and the Behavior Assessment System for Children –
Self-Report of Personality (Shepard, Nicpon, Haley, Lind, & Liu, 2011). However,
results indicated a negative correlation between achievement and social stress. That said,
the authors noted that their sample of adolescent boys was comprised of students who
16
opted to attend a specialized summer program and might not have been representative of
all high-ability students, especially those participating in schooling with less-able peers.
Effect of Gender
The study of impression management differences between males and females has
revealed several significant distinctions. In general, men tend to overestimate their
performance in front of others, while women offer accurate estimates or underestimates
of their performance (Daubman, Heathering, & Ahn, 1992; Roberts, 1991). In fact,
Heatherington et al. (1993) found that when interacting with low-achieving partners,
female college students offer lower predictions of their GPA as compared to men, after
controlling for actual level of achievement. The authors suggest that men, therefore, are
more likely to display an attitude of immodesty than women. Relatedly, it has been found
that women offer more accurate predictions of achievement, as males tend to inflate their
achievement (Heatherington, Townsend, & Burroughs, 2001). Furthermore, when
students in their first year of college were informed that they would be discussing
academic achievement with a peer, the accuracy of the information offered by males and
females differed significantly (Brown, Uebelacker, & Heatherington, 1998). To examine
this phenomenon, each student was asked to describe his or her own achievement and
make predictions regarding his or her first-semester GPAs. For males, the predictions and
achievement discussions varied according to the personality of the peers, as males offered
predictions that were higher than their actual GPAs when the peer was boastful, and they
offered predictions that were lower than their actual GPAs when the peer was self-
deprecating. The achievement information discussed by females, in contrast, did not vary,
despite the differing personalities of the peers.

17
To better understand the factors by which males and females base their own
achievement predictions, Forsyth, Schlenker, Leary, and McCown (1985) examined
gender differences on a college leadership activity. Four-person, same-sex groups were
created in which the students were asked to complete an assignment with knowledge that
their group dynamics would be examined. Following a bogus inventory, on which
everyone received the same ability and interpersonal scores, all participants were
individually informed that they were their group’s leader due to their score tabulations.
They also were told that they should guide the students during the task and would be
asked to share information about their abilities and skills. Findings revealed that males
emphasize abilities in their self-presentations, while females focus on socio-emotional
and interpersonal skills. Thus, a clear gender effect was present for adult students when
presenting themselves to peers.
While the presentation of overall achievement appears to be more inflated for men
than for women, the actual achievement of students also appears to be affected by gender
differences. Specifically, Hudgins (2008) observed that, in response to peer pressure,
female adults experienced larger negative effects on mathematics achievement than
males. Potential reasons for this include a history of male domination, associated
psychological obstacles, and differential peer pressure experienced during adolescence.
Relatedly, Boehnke (2008) observed similar results with school-age children, as middle
school girls reported engaging in underachievement more often than boys on measures of
mathematics in response to peer pressure, although the effect size was minimal. Such
pressure may be felt even earlier, as girls begin to display an implicit affinity to language
as opposed to math by 9 years of age (Steffens, Jelenec, & Noack, 2010). In contrast,

18
Filkins (1995) found that male middle school students engaged in a self-presentation style
of underachievement more often than females according to overall GPAs. Therefore,
while gender appears to play a significant role in the self-presentation of achievement, its
effects on young students are less clear at this time.
Subject Area
Previous studies of self-presentation and impression management have focused
largely on overall levels of achievement, as opposed to specific subject areas (e.g., Adler,
Kless, & Adler, 1992; Barcocas & Christiansen, 1968; Brown, Uebelacker, &
Heatherington, 1998; Colangelo, Kerr, Christiansen, & Maxey, 1993; Filkins, 1995;
Forsyth, Schlenker, Leary, & McCown, 1985). For example, Barcocas and Christiansen
(1968) asked undergraduate students to complete a familiar inventory in a manner such
that they would appear as various types of professionals (e.g., Forest Ranger, Mortician).
The results were used to divide the participants into two groups: those whose ratings
reflected that of the specified professional (Good Impression Managers) and those whose
ratings were significantly different from that of the specified professional (Poor
Impression Managers). The overall GPAs of the two groups were compared to reveal that
good impression managers achieved higher GPAs than those students who were not
capable of effectively manipulating their appearance. However, this study did not
examine differences according to reading performance or math achievement; rather, an
average of all subject areas was employed as the outcome variable.
Similarly, overall achievement also was considered in a study of more than
30,000 high school juniors and seniors who performed at the 95th
percentile and above on
the American College Testing program (ACT). By comparing the high school GPAs of

19
these students, a high achieving group and an underachieving group were identified. An
examination of demographic, attitudinal, and extracurricular differences revealed that
90% of the underachievers were Caucasian males, and the underachievers had fewer out-
of-class accomplishments. Again, overall achievement levels were used to create such
groups; therefore, it is unclear if underachievement is more prevalent in a specific subject
area.
Conversely, other studies of students’ impression management have focused more
narrowly on specific subject areas. In particular, studies of mathematics and problem-
solving performance have revealed that self-presentation is reported by students as
playing a significant role for students of high ability (Filkins, 1995; Hudgins, 2008). The
role of self-presentation and the prevalence of faking bad on reading achievement,
however, has not been tested. Thus, it is unclear if the findings replicate across specific
subject areas.
Rationale, Research Questions, and Hypotheses
The purpose of this study was to directly examine the effects of peer pressure on
the academic achievement of elementary students. In order to fully understand this
phenomenon, specific skill areas and the possible effect of gender were both examined.
Previous researchers have neither investigated faking-bad behavior with elementary-age
students nor used an experimental design with direct measures of achievement. The
possible phenomenon of intentional underachievement can be directly examined in
different ways. One such way is prevalence, or the proportion of students engaging in the
behavior while under peer review. The second method is magnitude, or the degree to

20
which students underachieve in response to peer-review conditions. Therefore, the
following hypotheses were tested as part of this study.
Hypothesis 1a. High-ability students intentionally underachieve, or “fake bad,”
on assessments of reading when they believe their responses will be reviewed by peers.
Previous studies of middle and high school students have suggested that children with
high levels of ability respond to peer pressure by reducing their effort and underachieving
(Boehnke, 2008; Filkins, 1995; Fordham & Ogbu, 1986; Hudgins, 2008); however, these
studies have not directly examined the outcome of achievement within an experimental
design. Therefore, the present study incorporated an experimental group exposed to peer
influence and a control group, and the effects of achievement were measured as opposed
to the use of self-report. It was hypothesized that the results of previous studies will be
replicated with younger children in the present experimental study. Additionally, while
much of the literature has specifically examined the presence of faking bad on global
measures of achievement (Barcocas & Christiansen, 1968; Brown, Uebelacker, &
Heatherington, 1998; Colangelo, Kerr, Christiansen, & Maxey, 1993; Filkins, 1995;
Forsyth, Schlenker, Leary, & McCown, 1985), such research has yet to examine the
effects specific to reading measures.
Hypothesis 1b. Male students of high ability exhibit greater faking-bad behavior
in reading as compared to female students of high ability. Although some previous
research on achievement suggests that more females engage in faking-bad behavior
(Hudgins, 2008), these studies have not exclusively assessed reading performance and
only have examined adult women. Conversely, studies examining school-age children
suggest that faking bad is more common for males (Filkins, 1995). Relatedly, impression

21
management research suggests that males are more inclined to portray inflated self-
presentations to colleagues and peers (Daubman, Heathering, & Ahn, 1992; Forsyth,
Schlenker, Leary, & McCown, 1985; Heatherington, Townsend, & Burroughs, 2001;
Roberts, 1991; Brown, Uebelacker, & Heatherington, 1998). Accordingly, it was
postulated that a greater proportion of high-ability males would exhibit faking-bad
behavior as compared to females in the area of reading. It also was hypothesized that the
magnitude of score differences would be larger for males when compared to females.
Hypothesis 2a. High ability students intentionally “fake bad” on assessments of
mathematics when they believe their responses will be reviewed by peers. Although
previous research has focused on adolescent populations, results have suggested that
students opt to engage in purposeful underachievement in mathematics (Boehnke, 2008;
Filkins, 1995; Hudgins, 2008). In addition to a lack of focus on elementary students, the
aforementioned studies typically have featured indirect measures of mathematics skill
and non-experimental designs. Thus, the present study included a sample of elementary-
age students, direct measures of mathematics achievement, and an experimental design
with a peer-review condition. Based on previous research, it was hypothesized that high-
ability students would demonstrate greater prevalence and magnitude of
underachievement when they believe their responses will be reviewed by peers.
Hypothesis 2b. Female students of high ability exhibit a greater faking-bad
behavior in mathematics as compared to male students of high ability. Within the area of
mathematics, previous research with adult participants has found that females experience
larger negative effects on outcomes than their male counterparts (Hudgins, 2008).
Similarly, Boehnke (2008) also observed that middle school girls reported engaging in

22
underachievement more often than boys on measures of mathematics. As such, it was
postulated that more females would exhibit faking-bad behavior as compared to males in
the area of mathematics. It was also hypothesized that the magnitude of score differences
would be larger for females when compared to males in this subject area.
23
CHAPTER II:
METHODOLOGY
Participants
Participants included male and female students who attended elementary schools
in a suburban district in eastern Pennsylvania. The final sample size was 723 students
across seven elementary schools, with 393 students in fourth grade and 330 in fifth grade.
Within the sample, 88.6% of students were Caucasian, 0.7% were African American,
0.4% were Hispanic, and 10.3% were Asian American. The sample consisted of 50.0%
females and 50.0% males, and 53.6% of the sample participated in the experimental
group, while 46.4% participated in the control group. Regarding ability level, 105
students were identified as having high cognitive ability (FSIQ > 120). This level of
ability was chosen due to previous studies determining it to be the most accurate cut-off
level for the identification of gifted students of elementary age (Lee & Karnes, 1983).
Participants were treated in accord with the ethical principles of the American
Psychological Association (2002) and the guidelines of The Pennsylvania State
University Office for Research Protections.
Measures
Cognitive Ability. To identify participants with high ability, general intellectual
functioning was measured by the composite of the Cognitive Abilities Test, Form 6
(Lohman & Hagen, 2002). The Cognitive Abilities Test is a group-administered measure
of intellectual ability that had been administered to all participants during their first grade
school-year. Although short- and long-term reliability evidence for this measure has not
yet been established for the most recent version, stability over short-term (less than 3
24
weeks) and long-term (3- and 6-year) intervals has been documented with the previous
version of the measure (DiPerna, 2005). Moreover, internal consistency evidence is
strong across the batteries and levels (r = 0.90). Structural validity was analyzed using
confirmatory factor analysis, which provided support for a three first-order and single
second-order factor model. Additionally, concurrent validity evidence has been examined
with the scores on two achievement tests, including the Iowa Test of Basic Skills
(Hoover, et al., 2005) and the Iowa Test of Educational Development (Forsyth, Ansley,
Feldt, & Alnot, 2003).
Pennsylvania System of School Assessment. Prior academic achievement in the
areas of reading and math was measured by the Pennsylvania System of School
Assessment (PSSA). The PSSA includes standardized measures of achievement that are
administered to all elementary students in Grades 3-5 attending schools in the state of
Pennsylvania. Both continuous scores (ranging from X to Y) and categorical proficiency
levels (below basic, basic, proficient, or advanced) are generated from the PSSA. In the
current study, participants’ most recent PSSA scores were incorporated into the
regression equation used to predict achievement on the reading comprehension and
mathematics measures that were administered as part of the study. :.
Reading comprehension. Reading comprehension was measured through the use
of AIMSweb Maze-CBM (2009; Appendix A). Maze-CBM requires a child to silently
read a grade-level appropriate passage. The first sentence of the passage is left intact;
however, in subsequent sentences, every seventh word is replaced with three words inside
parentheses, and students are asked to choose the best word to complete the sentence.
Test-retest and parallel forms evidence for Grades 3-6 indicate Maze-CBM scores
25
demonstrate adequate reliability (r = .82-.97; Tindal, Marston, & Deno, 1983). Maze-
CBM scores have demonstrated adequate criterion validity with the authentic and
literature based Basal Readers (r = .64-.67; Hintze, Shapiro, Conte, & Basile, 1997), the
Diagnostic Reading Scales (r = .75-.76; Lomax, 1983), and the Wheldall Testing of
Reading Passages (r = .71; Madelaine & Wheldall, 1999). For the present study, probes
developed for the beginning of the fourth grade school-year were used to ensure that the
level of difficulty was appropriate. Cronbach’s alpha was adequate (α = .77) for the data
from the current study.
Mathematics. AIMSweb Mathematics Concepts and Applications (2009) probes
were used to assess the mathematics skills of participants (Appendix B). This type of
assessment includes mathematics probes based on expected computational and
conceptual skills for each grade level. Foegen, Jiban, and Deno (2007) summarized the
results of technical adequacy studies of Mathematics Concepts and Applications
curriculum-based measures (CBM) conducted since 1989. Findings for Grades 4-6
revealed adequate internal consistency (r = .97), alternate form reliability (r = .81 - .88),
and criterion validity with the CTBS-Total Math (r = .71 - .80). Additionally, Thurber,
Shinn, and Smolkowski (2002) performed a confirmatory factor analysis on the results of
math-CBM for fourth grade students. Results indicated that scores from math-CBM are a
valid indicator of mathematics knowledge for elementary students. In the current study,
mathematical probes created for the beginning of the fourth grade school-year were used
to ensure that the students were familiar with the content. Cronbach’s alpha was adequate
for the current sample (α = .73).

26
Procedures
Permission to conduct the study was obtained at the district administrative level,
and seven elementary school principals subsequently agreed to participate in the study.
Fourth and fifth grade teachers in these buildings sent a description of the study and
parental consent letters home with the students. Students whose parents provided written
consent for their participation were included in the sample for the study. For all
participants, most recent PSSA reading and math scores, CogAT scores, and eligibility
for supplemental reading and math services were obtained from district records.
Participants were assessed within their regular education classrooms, which
consisted of a heterogeneous mixture of low-ability, average-ability, and high-ability
students. The classrooms were randomly assigned to either the control group or
experimental group. The students in the control classrooms were administered a Maze-
CBM and a math-CBM task. In these classrooms, the principal investigator provided
participants with oral and written instructions (Appendix C). These instructions informed
the students that the papers would be graded by the principal investigator. At the outset,
the principal investigator read an assent statement to the students (and printed on their
cover sheet). The students were then asked to check whether they agreed or disagreed to
have their results reviewed as part of this study (assent agreement rate = 98.4%).
Following the administration in the control group, the papers were collected by the
principal investigator.
In the experimental group, participants were administered the same Maze-CBM
and math-CBM tasks, but the instructions were different from the control condition
(Appendix C). Specifically, the instructions informed the students that their papers would

27
be graded by a peer immediately following the assessment and prior to removal of their
names from the papers. Such instructions were delivered orally and printed on the
students’ worksheets. The assent statement was read to the students, as well as printed on
their cover sheets. The students then were asked to check whether they agreed or
disagreed to have their results reviewed as part of this study (assent agreement rate =
97.5%). Following the administration, the principal investigator collected the papers,
stating that there was not enough time to perform the peer grading.1
Data Analyses
Data preparation. A multi-step process was used to identify students who were
“underachieving”. First, data from a random subsample of 100 students from the control
condition was used to develop a regression equation to predict expected achievement.
Specifically, simultaneous multiple regression was performed to determine the best-
predicting equation for achievement from the contributing variables (Appendix D).
Separate equations were estimated for each subject area. The general equations for
predicted reading (R) achievement and math (M) achievement were as follows:
ACHR = B1 + B2(PSSAREAD) + B3(SUPPREAD) + B4(GRADE)
ACHM = B1 + B2(PSSAMATH) + B3(SUPPMATH) + B4(GRADE)
1Debriefing procedures were not conducted given such disclosure could have confounded
subsequent data collection if participants shared this information with peers in other
classrooms that were participating at a later date. This approach was approved by Penn
State’s Office of Research Protections as the deception was minimal and posed negligible
risk to participants.

28
The PSSAREAD and PSSAMATH variables are the results of the standardized
Pennsylvania System of Statewide Assessment for both reading and mathematics,
respectively. SUPPREAD indicates whether students received supplemental services to
assist with their reading skills, such as Title I reading support or Response to Intervention
reading services. SUPPMATH indicates whether students received supplemental services
to assist with their math skills, such as small group math support or Response to
Intervention math services. GRADE is either Grade 4 or Grade 5.
These regression equations were applied to the remainder of the sample to
generate predicted reading and mathematics scores. Predicted scores then were compared
against obtained scores to determine occurrence of underachievement. Underachievement
initially was operationalized as obtained scores that fell 2.0 standard errors of prediction
below predicted scores.
Primary analyses. In order to assess the prevalence of differences in reading and
math achievement, logistic regression analyses were performed on the remaining sample
excluding the aforementioned subsample to determine if underachievers could be
distinguished from achievers based on ability (low/average, high) and/or condition
(experimental, control). The independent variable of gender (male, female) was also
added for each of the dependent measures of reading and math achievement. Differences
in reading and math achievement were examined through analyses of variance
(ANOVAs) of mean score differences between expected and observed scores within each
subject area. Again, the independent variables included ability, condition, and gender.
Evidence to support the presence of faking bad was expected in the form of statistically
significant logistic regression coefficients and interaction effects (p ≤ .05). Because eight

29
different analyses were conducted on this sample of data, a Bonferroni correction was
applied resulting in an adjusted alpha of .00625. Calculation of ƞ2effect sizes was
hypothesized to result in small to medium (.01 < ƞ2
< .06) effects, according to Cohen’s
(1988) guidelines.

30
CHAPTER III:
RESULTS
Descriptives and Tests of Assumptions
For the outcome achievement measures of reading and math, linearity was tested
by plotting the standardized residuals against predicted values and found to be randomly
distributed around zero. Histograms and p-plots were inspected, revealing normal
distribution of the residuals. Independence of errors was determined by inspecting scatter
plots of each of the predictor variables against the residuals. Collinearity diagnostics
indicated no cause for concern, as the tolerance statistics did not approach zero. For the
reading outcome measure, there were no missing data; however, nine cases were
identified as outliers with residuals greater than 3.0. Interestingly, each of these nine
outliers was an overachiever (i.e., had performed better than predicted). As such, these
nine cases were subsequently removed from the analyses2. No cases had missing data.
For the mathematics outcome measure, there were neither outliers nor cases with missing
data.
Following case deletion and removal of the subsample used to generate the
predictive equations, the control group totaled 235 students, which included 112 (47.7%)
males and 123 (52.3 %) females. Additionally, within the control group, 208 (88.5%)
students were identified as having low or average ability levels, and 27 (11.5%) were
considered to have high ability levels. The experimental group consisted of 388 students,
which included 198 (51%) males and 190 (49%) females. Within the experimental group,
2 Separate analyses were also run with the outliers included in the area of reading, but no
meaningful differences were observed.

31
324 (83.5%) students fell within the low/average ability category, and 64 (16.5%)
students fell within the high ability category.
Post hoc power analyses (Cohen, 1988, 1992; Faul, Erdfelder, Lang, & Buchner,
2007) indicated that the obtained sample size provided adequate power (.90) for main and
interaction effects assuming a small effect size (ƞ2 = .02) and an alpha level of .00625 for
each of the analyses. Means and standard deviations for all measures are reported in
Table 2.
Table 2
Means and Standard Deviations for Independent and Dependent Variables
Measure M SD Minimum Maximum Skew Kurtosis
CogAT 107.35 12.56 68 143 -0.30 0.07
Reading 19.26 7.23 1 47 0.64 1.61
Math 15.27 4.94 3 29 0.33 -0.19
Identification of Underachievement
As explained in the method, preliminary analyses were conducted using data from
comparison subsample of control participants (n = 100) to develop the prediction
equations for each outcome measure (Appendix D). Specifically, a simultaneous3
3Sequential regression also was executed for both dependent variables in an effort to
determine if order of entry improved the prediction equation; however, this type of
analysis yielded the same results as that for each of the simultaneous regression analyses.

32
multiple regression was performed with the reading achievement measure as the
dependent variable and statewide standardized reading test score, supplemental reading
services, and grade as predictor variables. Similarly, a second simultaneous multiple
regression was performed between the mathematics achievement measure and the
aforementioned independent variables. To determine the best-predicting equations, all
possible combinations of the three independent variables (i.e., state test scores,
supplemental services, and grade) were tested. For both outcome measures, the use of all
three predictor variables accounted for the largest amount of variance and yielded the
smallest amount of error. For reading, F (3, 96) = 36.29, p < 0.01, R2 = 0.53. For
mathematics, F (3, 96) = 24.75, p < 0.01, R2 = 0.44.
Primary Analyses – Reading
In order to identify the presence of underachievement, the aforementioned
regression equation was used to predict the expected score of each participant based on
their most recent score on the state reading test, receipt of supplemental services, and
grade level. As noted previously, underachievement initially was defined as scoring two
standard errors of prediction below predicted achievement; however, this conservative
criterion yielded a minimal number of “underachievers” in reading. Specifically, only
five of the students in the sample (0.80%) met this criterion. As such, the threshold for
underachievement was lowered to a moderately-conservative criterion (i.e., 1.5 standard
errors of measurement below the predicted value) and again to a relaxed criteria (i.e., 1.0
standard error of measurement below the predicted value).4 Table 3 displays the
4Given that relaxing the underachievement criterion raises the probability that faking-bad
is due to measurement error, these analyses were considered to be exploratory.

33
percentages of students who underachieved in reading under each of these criteria. Tables
4 and 5 display the means and standard deviations of the underachievement scores by
expected achievement and underachievement and by the independent variables,
respectively.
Table 3
Percentage of Underachievers by Category in the Area of Reading
Low/Average Ability High Ability
Malea
Female
b
Male
c
Female
d
2.0 SEM
Experimental 1.21 1.26 0.00 0.00
Control 0.00 0.91 0.00 0.00
1.5 SEM
Experimental 2.42 5.66 6.06 3.23
Control 3.06 5.45 0.00 7.69
1.0 SEM
Experimental 13.94 20.76 9.09 25.81
Control 17.35 12.73 7.14 7.69
Note. Percentages are based on cell n. aExperimental n = 165, Control n = 98.
bExperimental n = 159, Control n = 110.
cExperimental n = 33, Control n = 14.
dExperimental n = 31, Control n = 13.

34
Table 4
Reading Scores for Expected Achievers and Underachievers by SEM Criterion Level
Expected Achievers Underachievers
M SD M SD
2.0 SEMa
19.50 6.83 12.40 5.55
1.5 SEMb
19.68 6.86 14.15 3.51
1.0 SEMc
20.22 7.01 15.41 3.96
aExpected Achiever n = 618, Underachievers n = 5.
bExpected Achiever n = 597,
Underachievers n = 26. cExpected Achiever n = 523, Underachievers n = 100.
Table 5
Means and Standard Deviations of Reading Scores by Condition, Gender, and Ability
Experimental
M (SD)
Control
M (SD)
Male
High Ability 23.61 (7.66) 25.50 (6.04)
Low/Average 19.73 (6.37) 19.97 (6.41)
Female
High Ability 24.16 (7.73) 21.92 (9.79)
Low/Average 17.77 (6.13) 17.34 (6.38)
Prevalence. Hypotheses 1a and 1b were tested to determine whether high-ability
students fake bad on reading assessments when they believe their responses will be
reviewed by peers. A direct logistic regression analysis was performed on the presence or

35
absence of reading underachievement as the outcome. A test of the full model with all
three independent variables of ability, condition, and gender against a constant-only
model was not statistically significant, χ2 (3, n = 623) = 2.65, p = 0.45, Nagelkerke R
2 =
0.05. Lowering the criterion to the moderately-conservative, χ2 (3, n = 623) = 2.55, p =
0.47, Nagelkerke R2 = 0.01, and relaxed, χ
2 (3, n = 623) = 3.14, p = 0.37 Nagelkerke R
2 =
0.01, levels did not yield significant results. Therefore, the full model did not distinguish
achievers in reading from those who underachieve.
Magnitude. To further explore Hypotheses 1a and 1b, a 2 x 2 x 2 between-
subjects analysis of variance was performed on the dependent variable of the difference
between observed reading performance and the expected reading performance. The three
independent variables included condition (control and peer-review), ability level (high
and low/average), and gender (male and female). The testing of Hypothesis 1a revealed
no significant interaction between the two independent variables of ability and condition,
F(1, 615) = .06, p = .82, ƞ2 = 0.00. Main effects were also non-significant for condition,
F(1, 615) = .16, p = .69, ƞ2 = 0.00, and for ability level, F(1, 615) = .92, p = .34, ƞ
2 =
0.00. Similarly, with respect to Hypothesis 1b regarding the effect of gender, the
ANOVA indicated no significant interaction between the three independent variables,
F(1, 615) = .78, p = .38, ƞ2 = 0.00. Relatedly, interaction effects were not present
between gender and ability level, F(1, 615) = .13, p = .72, ƞ2 = 0.00, nor were they
present between condition and gender, F(1, 615) = .44, p = .83, ƞ2 = 0.00. Finally, the
main effect of gender was examined but found to be non-significant, F(1, 615) = .00, p =
0.97, ƞ2 = 0.00.

36
Primary Analyses – Mathematics
Consistent with the procedures used in the reading domain, math
underachievement initially was defined as scoring two standard errors of measurement
below the predicted value. Again, however, this conservative criterion yielded only a
minimal number of underachieving students. Specifically, 5 students (.80%) met this
criterion in math. As a result, the stringent criterion was relaxed in which the threshold
for underachievement was lowered to a moderately-conservative level (1.5 standard
errors of measurement below the predicted value) and again to a relaxed level (1.0
standard error of measurement below the predicted value). Table 6 displays the
percentages of students who underachieved in math under each criterion. Table 7 then
displays the means and standard deviations of the scores for the students who
underachieved at these levels in math, while Table 8 displays this information by
condition, gender, and ability.

37
Table 6
Percentage of Underachievers by Category in the Area of Mathematics
Low/Average Ability High Ability
Male
a Femaleb
Malec
Femaled
2.0 SEM
Experimental .00 .63 6.06 .00
Control .00 .91 7.14 .00
1.5 SEM
Experimental 1.81 3.14 6.06 .00
Control 4.08 2.73 7.14 .00
1.0 SEM
Experimental 8.48 8.18 12.12 12.90
Control 11.22 11.81 14.29 15.38
Note. Scores presented are percentages out of cell size. a: Experimental n = 165, Control n = 98.
b: Experimental n = 159, Control n = 110.
c: Experimental n = 33, Control n = 14.
d: Experimental n = 31, Control n = 13.

38
Table 7
Mathematics Scores for Expected Achievers and Underachievers by SEM Criterion Level
Expected Achievers Underachievers
M SD M SD
2.0 SEMa
15.34 4.79 8.40 .89
1.5 SEMb
15.44 4.79 10.11 1.68
1.0 SEMc
15.78 4.79 10.89 1.97
a: Expected n = 618, Underachievers n = 5.
b: Expected n = 605, Underachievers n = 18.
c: Expected n = 560, Underachievers n = 63.
Table 8
Means and Standard Deviations of Mathematics Scores by Condition, Gender, and
Ability
Experimental
M (SD)
Control
M (SD)
Male
High Ability 17.76 (4.82) 15.57 (4.29)
Low/Average 14.11 (4.24) 15.20 (4.73)
Female
High Ability 19.39 (5.19) 17.92 (5.52)
Low/Average 14.96 (4.60) 15.35 (5.00)
Prevalence. To test Hypotheses 2a and 2b, a direct logistic regression analysis
was performed using the presence/absence of mathematics underachievement as the
outcome and ability, gender, and condition as predictors. A test of the full model with all

39
three independent variables against a constant-only model was not statistically
significant, χ2 (3, n = 623) = 5.78, p = .12, Nagelkerke R
2 = .10, indicating that the
predictors as a set did not reliably distinguish between math achievers and
underachievers. When the criterion was lowered to the moderately-conservative level, the
full model was again not statistically significant, χ2 (3, n = 623) = .70, p = .87,
Nagelkerke R2 = .01. Finally, when the criterion for underachievement was reduced to the
relaxed level, the full model was unable to distinguish achievers in math from those who
underachieve, χ2 (3, n = 623) = 2.55, p = .47, Nagelkerke R
2 = .01.
Magnitude. Hypotheses 2a and 2b were examined in a different manner to
determine whether the magnitude of underachievement in mathematics varies by ability
and condition. Thus, a 2 x 2 x 2 between-subjects analysis of variance was performed on
the dependent variable of the difference between the observed math performance and the
expected math performance. The independent variables included condition (control and
experimental), ability level (high and low/average), and gender (male and female). The
findings for Hypothesis 2a did not indicate a significant interaction between the two
independent variables of ability and condition, F(1, 615) = 3.90, p = .05, ƞ2 = 0.01. Main
effects were non-significant for condition, F(1, 615) = 1.62, p = .20, ƞ2 = 0.00, and for
ability level, F(1, 615) = .07, p = .80, ƞ2 = 0.00. Furthermore, the testing of Hypothesis
2b revealed no significant interaction between the three independent variables, F(1, 615)
= .73, p = .79, ƞ2 = 0.00. Similarly, there were no significant interactions between gender
and ability level, F(1, 615) = 1.96, p = .16, ƞ2 = .00 or condition and gender, F(1, 615) =
.02, p = .89, ƞ2 = 0.00. The main effect of gender also was not significant, F(1, 615) =
4.26, p = 0.04, ƞ2 = .01.

40
CHAPTER IV:
DISCUSSION
In schools across the country, decisions are made based upon the results of
academic achievement assessments. These decisions determine educational
programming, placement, and focus of instruction; therefore, the validity of academic
assessments is vital for achieving the primary goals of the education system. Validity,
however, can be compromised by a variety of factors, including intentional manipulation
of the results by examinees. While some students may attempt to demonstrate their best
possible performance, other students may engage in purposeful underachievement in an
attempt to be more socially accepted (Moore, 1997; Rimm, 2008). According to previous
research, students with high levels of ability report that they are likely to engage in
underachievement strategies at the upper grade levels (Filkins, 1995; Juvonen &
Murdock, 1993; Moore, 1997). These studies, however, did not systematically or directly
examine the presence or absence of such phenomena at the elementary levels.
In the current study, level of achievement across academic skill and student
ability levels was examined under peer review. Specifically, performance on math and
reading measures was examined separately to determine whether achievement levels
differ when students believed results of academic assessments would be shared with their
classroom peers. In addition, the role of gender was considered in understanding the
relationship between underachievement and peer review. Potential effects were examined
in terms of magnitude and prevalence.

41
Results, however, indicated that the peer-review condition did not alter the
prevalence or magnitude of faking-bad behavior for high-ability students in reading or
mathematics. Moreover, the prevalence and magnitude of underachievement were not
different between males and females in either skill area. These findings are in contrast to
those of previous studies that have suggested high levels of faking-bad behavior (e.g.,
Boehnke, 2008; Filkins, 1995; Fordham & Ogbu, 1986; Henagan & Bedaian, 2009;
Hudgins, 2008; Tyson, Darrity, & Castellino, 2005).
Potential Explanations for Inconsistency with Prior Research
Grade-Level Differences. While attachment theorists have identified the parent-
child relationship as the most influential factor early in childhood (Ainsworth, 1969;
Bowlby, 1958), peer socialization begins to become more important as children grow
older (Hartup, 1978). The age at which this occurs, however, seems to be unclear. Some
researchers have found that the peer system becomes influential during mid-adolescence,
which is defined as approximately age 15 (Hartup, 1979). Recent studies of preschoolers
and kindergarteners, however, have identified the effects of peer influence as early as
ages 4 and 5 (Haun & Tomasello, 2011; Smith & Fowler, 1984).
Regarding the effect of peer influence on achievement, previous studies have
indicated faking-bad behavior by high-ability students during adolescence (e.g., Boehnke,
2008; Filkins, 1995; Ford, Granthem, & Whiting, 2008; Fordham & Ogbu, 1986;
Henagan & Bedaian, 2009; Juvonen & Murdock, 1993; Schlenker, 1980). In contrast, the
current study featured a younger sample of students drawn from the intermediate
elementary grades. For example, Juvonen and Murdock (1993) concluded that eighth
grade students believe there are differential consequences of ability/effort depending on

42
whether they interact with peers or adults. Similarly, Filkins (1995) and Boehnke (2008)
identified the reported presence of faking-bad behavior in high-ability students, but the
sample consisted of seventh, eighth, and ninth graders. Similarly, Fordham and Ogbu
(1986) found that students report engaging in underachievement in an effort to avoid
negative interactions with peers, but these researchers also looked exclusively at middle
school students. Therefore, while faking-bad behavior has been reported to occur at the
middle school level, the current findings suggest that social pressure may not adversely
affect reading or math performance during elementary school.
Skill Domains. Prior studies have indicated that high-ability students are likely to
display inaccurate self-presentations (Daubman, Heathering, & Ahn, 1992; Forsyth,
Schlenker, Leary, & McCown, 1985; Heatherington, Townsend, & Burroughs, 2001;
Roberts, 1991; Brown, Uebelacker, & Heatherington, 1998). Performance on a
standardized measure of reading, however, was not specifically examined in the
aforementioned studies. Instead, GPAs and the composite scores of recent standardized
achievement measures were used. Therefore, while an elevated prevalence and magnitude
of faking-bad behavior might be observed on global measures of achievement, such
purposeful underachievement does not appear to occur in the area of reading during pre-
adolescence. Similarly, mathematics performance in this context has only begun to be
investigated (Boehnke, 2008), but, as previously mentioned, the presence of faking-bad
behavior had not yet been examined in the context of elementary mathematics
achievement.
Methodology Differences. Another possible reason for the differences between
the findings of previous research with those of the current study could be related to

43
methodology. For example, rather than directly measuring student performance on a
measure of reading, Juvonen and Murdock (1993) examined self-report ratings of
imagined exam performance. Filkins (1995) likewise used self-report measures of self-
presentation styles rather than examining actual performance on outcome measures of
achievement. Additional researchers examining underachievement by students (e.g.,
Ford, Granthem, & Whiting, 2008; Fordham & Ogbu, 1996) also used self-report
measures as opposed to direct measurements.
Although the study by Boehnke (2008) was unique in that it was a large study
examining the effects of social pressure on the achievement of middle school students,
this study also had several notable methodological limitations. In particular, rather than
defining ability by intellectual functioning or a comprehensive measure of achievement,
ability was defined as student performance on three math items. Therefore, the
categorization of students as high math ability versus lower math ability may not have
been a valid method of identification. Further, outcome measures of skills were not
included in the Boehnke study, as he examined self-reports of how often the students felt
their performance contributed to receiving negative comments from peers. Therefore,
while students’ emotional well-being was shown to be impacted, it is unclear if they
actually altered their performance due to such social pressures. Thus, while the previous
results suggest differential self-report of achievement, they did not directly test if students
lower their actual performance.
Limitations
The current study has several limitations that must be considered before drawing
implications from the results. First, the regression equations used to predict expected
44
achievement levels accounted for 53% of the variance in reading achievement and 44%
of the variance in mathematics. While the expected scores were based on various
predictors, including previous cognitive and achievement measures, much of the variance
is unexplained by known variables.
Moreover, when determining underachievement, the criterion had to be lowered
from a stringent level, to a moderately-conservative level, and finally to a relaxed level to
explore the possible presence of underachievement. In so doing, the possibility of
observed differences being attributed to measurement error increased substantially.
However, even with the relaxed (least-stringent) criterion, no differences were observed.
Another potential limitation involves the amount of social pressure created by the
peer-review condition. Within the current study, peer influence was artificially introduced
by informing the students that their papers would be peer-reviewed following the
assessment; however, the effect of this knowledge of a later event may not have been
sufficient to raise self-awareness and alter performance. It is possible that elementary-age
students are more influenced by a concurrent or previous social situation as opposed to
the perception of a future event. To address this issue in a future study, students could be
asked to review each other’s work on an alternative assignment immediately before
beginning the assessments being examined for the study.
Finally, because the participants in this study were drawn from one large
suburban school district, replication is needed in multiple school districts to examine
generalizability to the broader population of children in the intermediate grades. In
particular, the current sample largely consisted of students of well-educated parents and
students with a relatively high level of cognitive ability (M = 107.35). Therefore,
45
replication would ensure that extraneous variables, such as socio-economic status, do not
play a role in the presence or absence of faking-bad behavior at the elementary level.
Directions for Future Research
Given the limitations of the current and previous studies, additional research is
necessary to further understand the phenomenon of faking bad in high-ability elementary-
age students. For example, future research should focus on predicting achievement levels
with greater accuracy by incorporating additional variables (e.g., student motivation and
engagement) into predictive models. Increasing accuracy, in turn, will decrease the
standard error of prediction and increase precision in the identification of students who
are underachieving relative to expectations.
Also with respect to design, randomly assigning students to an experimental
group that is exposed to peer influence and a control group that is not exposed to such
social pressures is warranted. Researchers may consider the use of an authentic peer-
viewing condition as opposed to the perception of a future peer-review condition to
determine if this difference contributes to varying achievement. In addition, achievement
outcomes in specific subject areas should be directly measured rather than using surveys
of perceived peer influence or composite GPAs.
With respect to future studies, it would be important to target adolescent students
to determine if previous findings regarding high levels of faking-bad behavior hold true
under experimental conditions such as those employed in the current study. Replication
with additional samples of elementary-age students is also needed to confirm results of
the current study. Finally, additional between-group comparisons should be examined to
46
determine if the findings replicate across various demographic groups (e.g., gender, grade
level, socio-economic status).
Implications
By further exploring the phenomenon of underachievement, educators are better
able to understand the circumstances under which students opt to engage in self-
handicapping impression management strategies. In so doing, practitioners and
researchers can apply this information to their interpretations of the results of academic
achievement measures for specific profiles of high-ability students. Although the reported
presence of purposeful underachievement in adolescence has been hypothesized by
several researchers (Filkins, 1995; Juvonen & Murdock, 1993; Moore, 1997), the
question of when such patterns emerge has not been definitively answered.
Given these findings, it is important for educators and researchers alike to
consider the possibility that faking-bad behavior may not exist at the upper grade levels,
either. Specifically, although previous research seems to conclude that a high degree of
intentional underachievement is present for adolescents (Boehnke, 2008; Filkins, 1995;
Fitzpatrick, 1978; Juvonen & Murdock, 1993), none of these studies directly examined
the influence of social pressure on achievement using an experimental design. Thus,
while students may feel negatively impacted by social pressure, whether their
achievement is changed remains unknown. Therefore, due to methodology limitations of
previous studies featuring samples of adolescent students and adults, it is unclear if
validity is compromised by intentional underachievement while under peer-review
conditions at any level. This resulting question emphasizes the need for replication with
same-age as well as older student samples.
47
Conclusion
Due to the increasing prevalence of high stakes testing resulting from federal
legislation such as No Child Left Behind, ensuring the validity of scores from
achievement measures is vital. However, the social pressures experienced by students
have been hypothesized to result in adverse effects on achievement and significant levels
of underachievement at the middle and high school levels. Previous studies, however,
have measured this phenomenon indirectly and featured non-experimental designs. The
results of the current study suggest that peer influence does not begin to adversely affect
the achievement of high-ability students at the elementary level. These findings hold true
across the subject areas of reading and math. Moreover, gender differences were not
shown to have an effect on faking-bad behavior as well.
Although these findings differ from those of previous studies, methodological
differences exist between this study and those conducted previously. In particular, the
current study examined a younger age group, whereas the samples of previous studies
consisted of adolescents and adults. Further, none of the research examined specific skill
domains to determine the effect of faking-bad behavior by subject area. Lastly, the
current study examined direct measures of achievement, while previous researchers
gathered data indirectly through self-report and qualitative information.
While the current results potentially provide insight regarding an important aspect
of test score validity, some limitations were identified. For example, the peer-review
condition may not have resulted in a large degree of social pressure. Further, the sample
of students came from one school district and may not have been representative of

48
students with more diverse backgrounds. Because of such limitations, replication with
additional samples of students is necessary.
Although replication is necessary to draw firm conclusions, the current findings
suggest that intentional underachievement does not occur at the elementary level under
peer-review conditions, and this holds true for both reading and mathematics.
Conversely, the findings raise potential questions regarding the results of previous studies
with adolescents and adults. As such, additional studies are necessary with these
populations as well, and these studies should feature several aspects of the current
methodology (e.g., use of direct measures, experimental manipulation of conditions) to
further advance understanding of the purported faking-bad phenomena.

49
References
Adler, P. A., Kless, S. J., Adler, P. (1992). Socialization to gender roles: Popularity among
elementary school boys and girls. Sociology of Education, 65, 169-187. doi:
10.2307/2112807
AIMSweb (2009). Maze – curriculum based measurements. Retrieved October, 2009, from
http://www.aimsweb.com/products/cbm.php.
AIMSweb (2009). Mathematics Concepts & Applications – curriculum based measurements.
Retrieved October, 2009, from http://www.aimsweb.com/products/cbm.php.
Ainsworth, M. D. (1969). Object relations, dependency, and attachment: A theoretical review of
the infant-mother relationship. Child Development, 40, 969-1025. doi: 10.2307/1127008
American Psychological Association (2002). Ethical Principles of Psychologists and Code of
Conduct. Retrieved October 24, 2009 from http://www.apa.org/ethics/code/code.pdf .
doi: 10.1037/0003-066x.57.12.1060
Anastasi, A. (1976). Psychological testing. New York: Macmillan.
Barcocas, R., & Christiansen, D. (1968). Impression management, fakeability, and academic
performance. Journal of Counseling Psychology, 15, 569-571. doi: 10.1037/h0026423
Barrick, M. R., Shaffer, J. A., & DeGrassi, S. W. (2009). What you see may not be what you get:
Relationships among self-presentation tactics and ratings of interview and job
performance. Journal of Applied Psychology, 94, 1394-1411. doi: 10.1037/20016532
Behrens, L. T., & Vernon, I. E. (1978). Personality correlates of overachievement and
underachievement. British Journal of Educational Psychology, 48, 290-297. doi:
10.1111/j.2044-8279.1978.tb03015.x

50
Boehnke, K. (2008). Peer pressure: a cause of scholastic underachievement? A cross-cultural
study of mathematical achievement among German, Canadian, and Israeli middle school
students. Social Psychology of Education, 11, 149-160. doi: 10.1007/s11218-007-9041-z
Bowlby, J. (1958). The nature of the child’s tie to his mother. The International Journal of
Psychoanalysis, 39, 350-373.
Brandt, A. C., Vonk, R., & Knippenberg, A. V. (2009). The source effect: Person descriptions by
self versus others have differential effects on impression formation. Personality and
Social Psychology Bulletin, 35, 965-977. doi: 10.1177/0146167209335056
Brown, B. B. (1990). Peer groups and peer cultures. In S. S. Feldman and G. R. Elliot (Eds.), At
the Threshold: The developing adolescent (p. 171-196), Cambridge, MA: Harvard
University Press.
Brown, L. B., Uebelacker, L., & Heatherington, L. (1998). Men, women, and the self-
presentation of achievement. Sex Roles, 38, 253-268.
Carter, S. E., & Sanna, L. J. (2008). It’s not just what you say but when you say it: Self-
presentation and temporal construal. Journal of Experimental Social Psychology, 44,
1339-1345. doi: 10.1016/j-jesp.2008.03.017
Chen, L. H., Wu, C., Kee, Y. H., Lin, M., & Shui, S. (2009). Fear of failure, 2 x 2 achievement
goal and self-handicapping: An examination of the hierarchical model of achievement
motivation in physical education. Contemporary Educational Psychology, 34, 298-305.
doi: 10.2466/pr0/105.3.707-713
Cohen, J. (1988). Statistical power analysis for the behavioral sciences (2nd
ed.). Hillsdale, NJ:
Erlbaum.

51
Cohen, J. (1992). A power primer. Psychological Bulletin, 112, 155-159. doi: 10.1037//0033-
2909.112.1.155
Cohen, J., Cohen, P., West, S. G., & Aiken, L. S. (2003). Applied Multiple
Regression/Correlation Analysis for the Behavioral Sciences (3rd
ed.). Mahwah, NJ:
Erlbaum.
Colangelo, N., Kerr, B., Christiansen, P., & Maxey, J. (1993). A comparison of gifted
underachievers and gifted high achievers. Gifted Child Quarterly, 37, 155-160. doi:
10.1177/0016986293 Cooley, C. H. (1902). Human Nature and the Social Order. New
York, NY: Scribner’s.
Dai, D. Y., Swanson, J. A., & Cheng, H. (2011). State of Research on giftedness and gifted
education: A survey of empirical studies published during 1998-2010 (April). Gifted
Child Quarterly, 55, 126-138. doi: 10.1177/0016986210397831
Datnow, A., & Cooper, R. (1996). Peer networks of African American students in independent
schools: Affirming academic success and racial identity. Journal of Negro Education, 65,
56-72. doi: 10.2307/2967251
Daubman, K. A., Heatherington, L., & Ahn, A. (1992). Gender and the self-presentation of
academic achievement. Sex Roles, 27, 187-204. doi: 10.1007/BF00290017
Deno, S. L., Marston, D., & Tindal, G. (1986). Direct and frequent curriculum-based
measurement: An alternative for educational decision making. Special Services in the
Schools, 2, 5-27. doi: 10.1300/J008V02n02_02
DiPerna, J. C. (2005). Review of the Cognitive Abilities Test, Form 6. In J. J. Kramer & J. C.
Conoley (Eds.), The Sixteenth Mental Measurements Yearbook. Lincoln, NE: The Buros
Institute of Mental Measurements of the University of Nebraska-Lincoln.

52
Emerick, L. J. (1992). Academic underachievement among the gifted: Students’ perceptions of
factors that reverse the pattern. Gifted Child Quarterly, 36, 140–146. doi:
10.1177/001698629203600304
Faul, F., Erdfelder, E., Lang, A.-G., & Buchner, A. (2007). G*Power 3: A flexible statistical
power analysis program for the social, behavioral, and biomedical sciences. Behavior
Research Methods, 39, 175-191. doi: 10.3758/BF03193146
Festinger, L. A. (1954). A theory of social comparison processes. Human Relations, 7, 117-140.
doi: 10.1177/001872675400700202
Filkins, M. E. (1995). Coping with the brain-nerd stereotype: High ability adolescents’ use of
academic self-presentation strategies. Thesis submitted at the University of Wisconsin-
Madison, 1-83.
Fitzpatrick, J. L. (1978). Academic underachievement, other-direction, and attitudes toward
women’s roles in bright adolescent females. Journal of Educational Psychology, 70, 645-
650. doi: 10.1037//0022-0663.70.4.645
Foegen, A., Jiban, C. & Deno, S. (2007). Progress monitoring measures in mathematics: A
review of the literature. The Journal of Special Education, 41, 121-139. doi:
10.1177/00224669070410020101
Ford, D. Y., Granthem, T. C., & Whiting, G. W. (2008). Another look at the achievement gap:
Learning from the experiences of gifted black students. Urban Education, 43, 216-239.
doi: 10.1177/0042085907
Fordham, S., & Ogbu, J. U. (1986), Black students’ school success: Coping with the “burden of
acting White.” The Urban Review, 18, 176-206. doi: 10.1007/BF01112192

53
Forsyth, R. A., Ansley, T. N., Feldt, L. S., & Alnot, S. D. (2003). Iowa Tests of Educational
Development. Rolling Meadows, IL: Riverside Publishing. Forsyth, D. R., Schlenker, B.
R., Leary, M. R., McCown, N. E. (1985). Self-presentational determinants of sex
differences in leadership behavior. Small Group Behavior, 16, 197-210. doi:
10.1177/104649648501600205
Fryer, R. G., Jr., & Torelli, P. (2005). An empirical analysis of “acting White.” Cambridge, MA:
Harvard University Press.
Gibbons, F. X., & Buunk, B. P. (1999). Individual differences in social comparison:
Development of a scale of social comparison orientation. Journal of Personality and
Social Psychology, 76, 129-142. doi: 10.1037//0022-3514.76.1.129
Gilbert, D. T., & Malone, P. S. (1995). The correspondence bias. Psychological Bulletin, 117,
21-38. doi: 10.1037//0033-2909.117.1.21
Goffman, E. (1959). The Presentation of Self in Everyday Life. Garden City, NY: Doubleday.
Goffman, E. (1971). Relations in Public. New York, NY: Basic Books.
Hartup, W. W. (1978). Children and their friends. In H. McGurk (Ed.) Issues in Childhood
Social Development. London: Methuen.
Hartup, W. W. (1979). The social worlds of childhood. American Psychologist, 34, 944-950. doi:
10.1037//0003-066x.34.10.944
Haun, D. B. M., & Tomasello, B. (2011). Conformity to peer pressure in preschool. Child
Development, 82, 1759-1767. doi: 10.1111/j.1467-8624.2011.01666.x
Heatherington, L., Daubman, K. A., Bates, C., Ahn, A., Brown, H., & Preston, C. (1993). Two
investigations of “female modesty” in achievement situations. Sex Roles, 29, 739-753,

54
Heatherington, L., Townsend, L.S., & Burroughs, D. P. (2001). “How’d you do on that test?”
The effects of gender on self-presentation of achievement to vulnerable men. Sex Roles,
45, 161-177.
Henagan, S. C., & Bedeian, A. G. (2009). The perils of success in the workplace: Comparison
target responses to coworkers’ upward comparison threat. Journal of Applied Social
Psychology, 39, 2438-2468. doi: 10.1111/j.1559-1816.2009.00533.x
Henfield, M. S., Moore, J. L. III, Wood, C. (2008). Inside and outside gifted education
programming: Hidden challenges for African American students. Exceptional Children,
74, 433-450.
Heyman, G. D., & Legare, C. H. (2005). Children’s evaluation of sources of information about
traits. Developmental Psychology, 41, 636-647. doi: 10.1037/0012-1649.41.4.636
Hewlin, P. F. (2009). Wearing the cloak: Antecedents and consequences of creating facades of
conformity. Journal of Applied Psychology, 94, 727-741. doi: 10.1037/20015228
Hilton, J. L., Fein, S., & Miller, D. T. (1993). Suspicion and dispositional inference. Personality
and Social Psychology Bulletin, 19, 501-512. doi: 10.1177/0146167293195003
Hintze, J. M., Shapiro, E. S., Conte, K. L., & Basile, I. M. (1997). Oral reading fluency and
authentic reading material: Criterion validity of the technical features of CBM survey-
level assessment. School Psychology Review, 26, 535-553.
Hoover, H. D., Dunbar, S. B., Frisbie, D. A., Oberley, K. R., Ordman, V. L., Naylor, R. J., …
Qualls, A. L. (2005). Iowa Test of Basic Skills. Rolling Meadows, IL: Riverside
Publishing.
Hudgins, J. C. (2008). Gifted women who underachieve: A study of mathematics and gender.
Dissertation Abstracts International Section A: Humanities & Social Sciences, 68, 5011.
55
Huryn, J. S. (1986). Giftedness as deviance: A test of interaction theories. Deviant Behavior, 7,
175-186. doi: 10.1080/01639625.1986.9967704
Jones, E. E., & Pittman, T. S. (1982). Toward a general theory of strategic self-presentation. In J.
Suls (Eds.) Psychological perspectives on the self (Vol 1., p. 231-262). Hillsdale, NJ:
Erlbaum.
Juvonen, J., & Murdock, T. B. (1993). How to promote social approval: Effects of audience and
achievement outcome on publicly communicated attributions. Journal of Educational
Psychology, 85, 365-376. doi: 10.1037//0022-0663.85.2.365
Kinney, D. A. (1993). From nerds to normals: The recovery of identity among adolescents from
middle school to high school. Sociology of Education, 66, 21-40. doi: 10.2307/2112783
Kramer, N. C., & Winter, S. (2008). Impression management 2.0: The relationship of self-
esteem, extraversion, self-efficacy, and self-presentation within social networking sites.
Journal of Media Psychology, 20, 106-116. doi: 10.1027/1864-1105.20.3.106
Kruglanski, A., & Mayseless, O. (1990). Classic and current social comparison research:
Expanding the perspective. Psychological Bulletin, 108, 195-208. doi: 10.1037//0033-
2909.108.2.195
Lalwani, A. K., Shavitt, S. (2009). The “Me” I claim to be: Cultural self-construal elicits self-
presentational goal pursuit. Journal of Personality and Social Psychology, 97, 88-102.
doi: 10.1037//a0014100
Leary, M. R., & Kowalski, R. M. (1990). Impression management: A literature review and two-
component model. Psychological Bulletin, 107, 34-47. doi: 10.1037//0033-2909.107.1.34

56
Lee, L. A., & Karnes, F. A. (1983). Correlations between the Cognitive Abilities Test, Form 3,
and the Ross Test of Higher Cognitive Processes for Gifted Students. Perceptual and
Motor Skills, 56, 421-422. doi: 10.2466/pms.1983.56.2.421
Lievens, F., Klehe, U., & Libbrecht, N. (2011). Applicant versus employee scores on self-report
emotional intelligence measures. Journal of Personnel Psychology, 10, 89-95.
Lim, J., & Butcher, J. N. (1996). Detection of faking on the MMPI-2: Differentiation among
faking-bad, denial, and claiming extreme virtue. Journal of Personality Assessment, 67,
1-25. doi: 10.1207/s15327752jpa6701_1
Lohman, D. F., & Hagen, E. P. (2002). Cognitive Abilities Test (Form 6): Research handbook.
Itasca, IL: Riverside. 10.4135/9781412971959.n71
Lomax, R. G. (1983). Applying structural modeling to some component processes of reading
comprehension development. Journal of Experimental Education, 52, 33-40.
Madelaine, A., & Wheldall, K. (1999). Curriculum-based measurement of reading: A critical
review. International Journal of Disability, Development and Education, 46, 71-85. doi:
10.1080/103491299100731
Martin, K. A., Leary, M. R., & Rejeski, J. W. (2000). Self-presentational concerns in older
adults: Implications for health and well-being. Basic and Applied Social Psychology, 22,
169-179. doi: 10.1207/15324830051036072
McClelland, D. B., Atkinson, J. W., Clark, R. A., & Lowell, E. L. (1953). The Achievement
Motive. New York: Appleton Century Crofts.
Mead, G. H. (1934). Mind, Self, & Society. Chicago: University of Chicago Press.
Moore, B. J. (1997). Three case studies of gifted students who underachieve in high school.
Dissertation Abstracts International Section A: Humanities and Social Science, 57, 3394.

57
Mussweiler, T., Gabriel, S., & Bodenhausen, G. V. (2000). Shifting social identities as a strategy
for deflecting threatening social comparisons. Journal of Personality and Social
Psychology, 79, 398-409. doi: 10.1037//0022-3514.79.3.398
National Commission on Excellence in Education (1983). A nation at risk: The imperative for
educational reform. Washington, DC: U.S. Government Printing Office.
Ogbu, J. U. (2004). Collective identity and the burden of “acting White” in Black history,
community, and education. The Urban Review, 36, 1-35. doi:
10.1023/B:URRE.0000042734.83194.fle
Preckel, F., Holling, H., & Vock, M. (2006). Academic underachievement: Relationship with
cognitive motivation, achievement motivation, and conscientiousness. Psychology in the
Schools, 43, 401-411. doi: 10.1002/pits/20154
Richert, S. E. (1991). Patterns of underachievement among gifted students. In M. Bireley & J.
Genshaft (Eds.), Understanding the gifted adolescent: Educational, developmental, and
multicultural issues, Education and Psychology of the Gifted Series, (p. 139-162). New
York, NY: Teachers College Press.
Rimm, S. (1986). The underachievement syndrome. Watertown, WI: Apple.
Rimm, S. (1995). Why bright kids get poor grades and what you can do about it. New York, NY:
Crown.
Rimm. S. (2005). Growing Up Too Fast: The Rimm report on the secret world of America’s
middle schoolers. New York: Rodale.
Rimm, S. (2008). Underachievement syndrome: A psychological defensive pattern. In Pfeiffer,
Steven I. (2008). Handbook of giftedness in children: Psychoeducational theory,
research, and best practices, 139-160.

58
Roberts, T. (1991). Gender and the influence of evaluations on self-assessments in achievement
settings. Psychological Bulletin, 109, 297-308. doi: 10.1037//0033-2909.109.2.297
Roskes, E. (2009). “Faking good” and “faking bad.” Psychiatric Services, 60, 851. doi:
10.1176/appi.ps.60.6.851
Schaubroeck, J., & Lam, S. S. K. (2004). Comparing lots before and after: Promotion of
rejectees’ invidious reactions to promotees. Organizational Behavior and Human
Decision Processes, 94, 33-47. doi: 10.1016/j.obhdp.2004.01.001
Schlenker, B. R. (1980). Impression Management. Monterey, CA: Brooks/Cole.
Schlenker, B. R., & Goldman, H. J. (1982). Attitude change as a self-presentation tactic
following attitude-consistent behavior: Effects of choice and role. Social Psychology
Quarterly, 45, 92-99. doi: 10.2307/3033931
Schlenker, B. R., & Weigold, M. F. (1992). Interpersonal processes of involving impression
regulation and management. Annual Review of Psychology, 43, 133-168. doi:
10.1146/annurev.psych.43.1.133
Seligman, R. (1990). A gifted ninth grader tells it like it is. Gifted Child Today, 13, 9-11.
Shaw, M. C., & McCuen, J. T. (1960). The onset of academic underachievement in bright
children. The Journal of Educational Psychology, 51, 103-108. doi: 10.1037/h0043137
Shen, S., Sullivan, H., Igoe, A., & Shen, X. (1996). Self-presentation bias and continuing
motivation among Chinese students: A cross-cultural phenomenon. The Journal of
Educational Research, 90, 52-56. doi: 10.1080/00220671.1996.9944443
Shepard, S. J., Nicpon, M. F., Haley, J. T., Lind, M., & Liu, W. M. (2011). Masculine norms,
school attitudes, and psychosocial adjustment among gifted boys. Psychology of Men and
Masculinity, 12, 181-187. doi: 10.1037/a0019945
59
Smith, L. C., & Fowler, S. A. (1984). Positive peer: The effects of peer monitoring on children’s
disruptive behavior. Journal of Applied Behavior Analysis, 17, 213-227.
Steffens, M. C., Jelenec, P., & Noack, P. (2010). On the leaky math pipeline: comparing implicit
math-gender stereotypes and math withdrawal in female and male children and
adolescents. Journal of Educational Psychology, 102, 947-963. doi: 10.1037/a0019920
Tedeschi, J. T. (1981). Impression Management Theory and Social Psychological Research.
New York: Academic.
Tesser, A. (1980). Self-esteem maintenance in family dynamics. Journal of Personality and
Social Psychology, 39, 77-91. doi: 10.1037/0022-3514.39.1.77
Thurber, R. S., Shinn, M. R., & Smolkowski, K. (2002). What is measured in mathematics tests?
Construct validity of curriculum-based mathematics measures. School Psychology
Review, 31, 498-513.
Tindal, G., Marston, D., & Deno, S. L. (1983). The reliability of direct and repeated
measurement (Research Rep. 109). Minneapolis, MN: University of Minnesota Institute
for Research on Learning Disabilities.
Tyson, K. Darity, W., & Castellino, D. R. (2005). It’s not a Black thing: Understanding the
burden of acting White and other dilemmas of high achievement. American Sociological
Review, 70, 582-605. doi: 10.1177/000312240507000403
Uleman, J. S., Newman, L. S., & Moskowitz, G. B. (1996). People as flexible interpreters:
Evidence and issues from spontaneous trait inference. Advances in Experimental Social
Psychology, 28, 211-279. doi: 10.1016/S0065-2601(08)60239-7
Vohs, K. D., Baumeister, R. F., & Ciarocco, N. J. (2005). Self-regulation and self-presentation:
Regulatory resource depletion impairs impression management and effortful self-

60
presentation depletes regulatory resources. Journal of Personality and Social Psychology,
88, 632-657. doi: 10.1037/0022-3514.88.4.632
Vonk, R. (1993). The negativity effect in trait ratings and in open-ended descriptions of persons.
Personality and Social Psychology Bulletin, 19, 269-278. doi:
10.1177/0146167293193003
Vonk, R. (1999). Impression formation and impression management: Motives, traits, and
likeability inferred from self-promoting and self-deprecating behavior. Social Cognition,
17, 390-412. doi: 10.1521/soco.1999.17.4.390
Yoshida, T., Kojo, K., & Kaku, H. (1982). A study on the development of self-presentation in
children. Japanese Journal of Educational Psychology, 30, 120-127.
Wentzel, K. R., & Asher, S. R. (1995). The academic lives of neglected, rejected, popular, and
controversial children. Child Development, 66, 754-763. doi: 10.2307/1131948

61
Appendix A: Sample Probe for Reading Comprehension

62
Appendix B: Sample Probe for Mathematics

63

64

65

66
67

68
Appendix C: Procedural Directions
Teacher Instructions for the control condition.
“Please complete this (reading/math) worksheet. When everyone has finished the
items, your papers will be collected and graded by me.”
Teacher Instructions for the peer-viewing condition.
“Please complete this (reading/math) worksheet. When everyone has finished the
items, you will be asked to trade papers with a classmate, who will correct and
grade your work.”
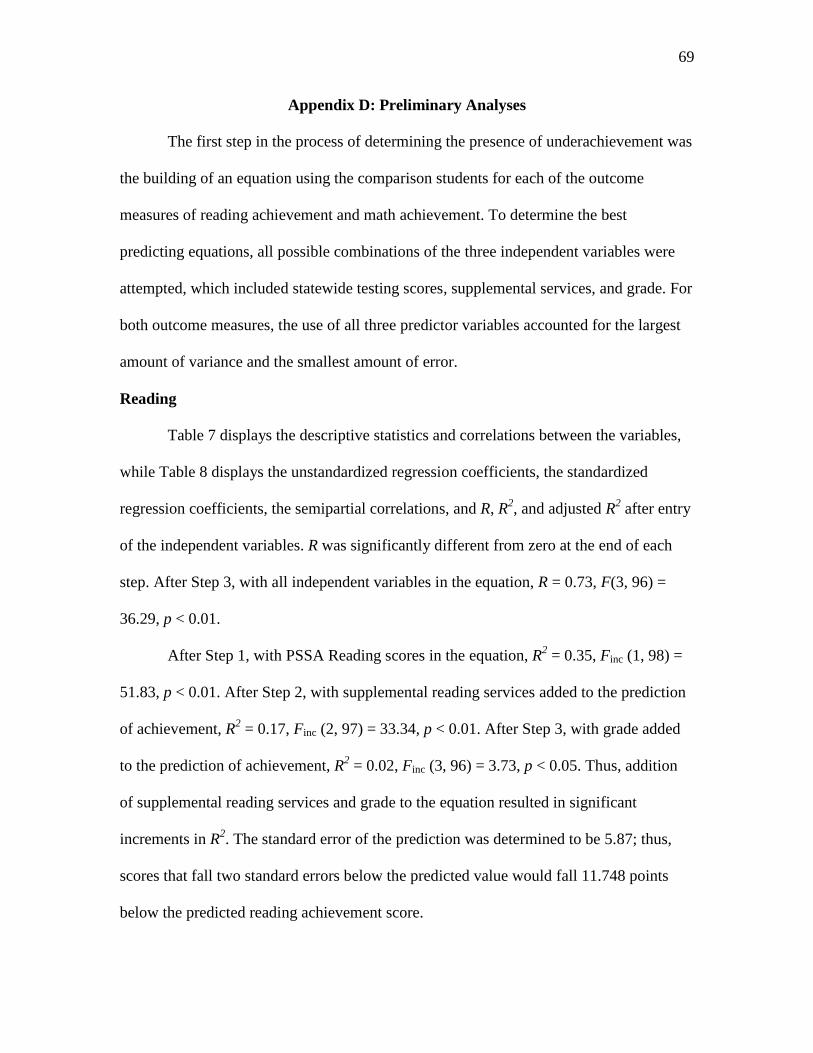
69
Appendix D: Preliminary Analyses
The first step in the process of determining the presence of underachievement was
the building of an equation using the comparison students for each of the outcome
measures of reading achievement and math achievement. To determine the best
predicting equations, all possible combinations of the three independent variables were
attempted, which included statewide testing scores, supplemental services, and grade. For
both outcome measures, the use of all three predictor variables accounted for the largest
amount of variance and the smallest amount of error.
Reading
Table 7 displays the descriptive statistics and correlations between the variables,
while Table 8 displays the unstandardized regression coefficients, the standardized
regression coefficients, the semipartial correlations, and R, R2, and adjusted R
2 after entry
of the independent variables. R was significantly different from zero at the end of each
step. After Step 3, with all independent variables in the equation, R = 0.73, F(3, 96) =
36.29, p < 0.01.
After Step 1, with PSSA Reading scores in the equation, R2 = 0.35, Finc (1, 98) =
51.83, p < 0.01. After Step 2, with supplemental reading services added to the prediction
of achievement, R2 = 0.17, Finc (2, 97) = 33.34, p < 0.01. After Step 3, with grade added
to the prediction of achievement, R2 = 0.02, Finc (3, 96) = 3.73, p < 0.05. Thus, addition
of supplemental reading services and grade to the equation resulted in significant
increments in R2. The standard error of the prediction was determined to be 5.87; thus,
scores that fall two standard errors below the predicted value would fall 11.748 points
below the predicted reading achievement score.

70
Table D1
Descriptive Results of Independent Variables on Reading Achievement
Variables Reading
PSSA
Reading
Supplemental Reading
Services Grade
Reading
1.00
PSSA Reading
.588 1.00
Supplemental
Reading Services
-.637 -.469 1.00
Grade .246 .077 -1.83 1.00
M 19.77 1429.52 .22 4.49
SD 8.45 166.55 .42 .50

71
Table D2
Sequential Regression of Independent Variables on Reading Achievement
Variables B B sr2
(incremental)
PSSARead .02 .37 .35**
SuppRead -8.88 -.437 .17**
Grade 2.31 .14 .02*
Notes. R2 = 0.53, Adjusted R
2 = 0.52, R = 0.73, ** p < 0.01, *p < 0.05.
Math
Table 9 displays the descriptive statistics and correlations between the variables,
while Table 10 displays the unstandardized regression coefficients, the standardized
regression coefficients, the semipartial correlations, and R, R2, and adjusted R
2 after entry
of the independent variables. R was significantly different from zero at the end of each
step. After step 3, with all independent variables in the equation, R = 0. 66, F(3, 96) =
24.75, p < 0.01.
After step 1, with PSSA Math scores in the equation, R2 = 0.23, Finc (1, 98) =
25.59, p < 0.01. After step 2, with supplemental math services added to the prediction of
achievement, R2 = 0.42, Finc (2, 97) = 31.60, p < 0.00. After step 3, with grade added to
the prediction of achievement, R2 = 0.44, Finc (3, 96) = 3.41, p < 0.05. Therefore, similar
to that found for reading achievement, addition of PSSA Math scores, supplemental
services, and grade to the equation results in a reliable improvement in R2. The standard
error of math prediction was determined to be 3.98; therefore, scores that are two

72
standard errors below the predicted value fall 7.96 points below the expected math
achievement score.
Table D3
Descriptive Results of Independent Variables on Math Achievement
Variables Math PSSAMath
Supplemental
Math Services
Grade
Math 1.00
PSSAMath .48 1.00
Supplemental Math
Services
-.58 -.37 1.00
Grade .17 -.05 -.09 1.00
M 14.95 1523.30 .20 4.49
SD 5.33 176.53 .40 .50
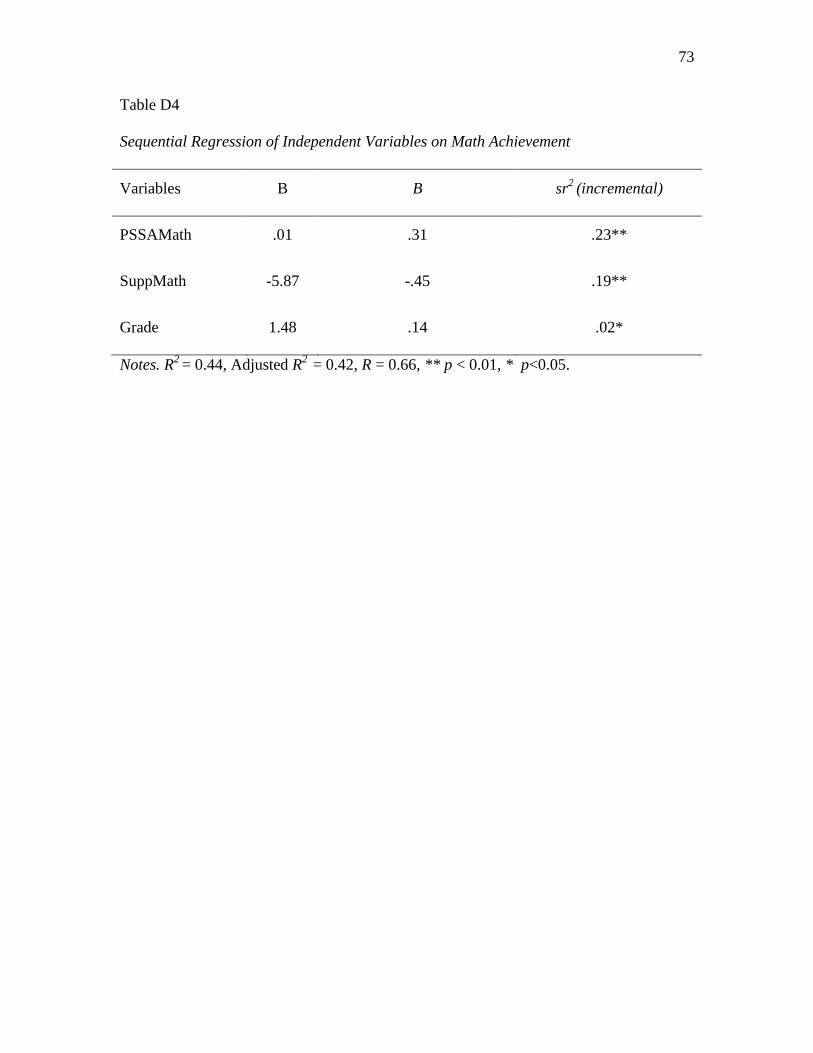
73
Table D4
Sequential Regression of Independent Variables on Math Achievement
Variables B B sr2
(incremental)
PSSAMath .01 .31 .23**
SuppMath -5.87 -.45 .19**
Grade 1.48 .14 .02*
Notes. R2
= 0.44, Adjusted R2
= 0.42, R = 0.66, ** p < 0.01, * p<0.05.
***********************************Kasey M. K. Black**********************************
(908)720-7831
Permanent Address: Current Address:
14 Carter Street 515 North Main St., Apt. 2
Toms River, NJ 08753 Doylestown, PA 18901
EDUCATION
Doctorate of Philosophy, School Psychology, Expected Fall 2012
The Pennsylvania State University, State College, PA
Dissertation: Faking bad: Do high-ability elementary students intentionally when their work is peer-
reviewed?
Advisor: Dr. James C. DiPerna, Special Proficiency – Measurement
Master of Science, School Psychology, Fall 2005
The Pennsylvania State University, State College, PA
Thesis: Validity of the GCA in the presence of discrepant and non-discrepant factor scores
Advisor: Dr. Marley W. Watkins
Bachelor of Arts, Psychology; Minor: Education, Spring 2002
Haverford College, Haverford, PA
Thesis: The theory of affordances as applied to infants age 6-9 months
Semester Abroad: Lorenzo de Medici Institute - Florence, Italy, Spring 2001
RELATED EXPERIENCE
School Psychologist, Council Rock School District, Newtown, PA, 08/08 - current
School Psychologist, Associates for Counseling and Educational Services, Doylestown, PA, 10/08 - current
School Psychologist Pre-doctoral Intern, Pennridge School District, Perkasie, PA, 08/07 – 8/08
Part-time Graduate Assistant on Feeding Grant, The Pennsylvania State University, Great Valley, PA,
08/07 – 12/07
Residential Trainer, Cerebral Palsy Association, Toms River, NJ10/02 - 08/03, 06 - 08/04, 06 - 08/05,
06 - 12/06
Half-time Graduate Assistant: Peer/Mentor/Tutor, The Pennsylvania State University, State College, PA,
08/05 – 06/06
Instructor for Gifted First-Graders in Math, Merion Elementary Gifted Program, Merion, PA09/00 - 12/00
RELATED VOLUNTEER EXPERIENCE
Institutional Review Board Member, Delaware Valley College, Doylestown, PA, 05/10 – current
Member & Grant Writer, Autism Cares Foundation, Newtown, PA, 02/08 – 05/10
Co-chairperson, Haverford/Bryn Mawr College Pen-Pal Program, Haverford, PA, 09/01 - 05/02
Elementary Student Mentor, Heston School Mentoring Project, Philadelphia, PA, 09/98 - 05/99
PUBLICATIONS
Kotz, K. M., Watkins, M.W., & McDermott, P. A. (2008). Validity of the General Conceptual Ability score
from the Differential Ability Scales as a function of significant and rare interfactor
variability.School Psychology Review, 37, 261-278.
Watkins, M. W., Wilson, S. M., Kotz, K. M., Carbone, M. C., & Babula, T. (2006). Factor structure of the
WISC-IV among referred students. Educational and Psychological Measurement, 66, 975-983.
Contributing author of The Autism Encyclopedia. Paul H. Brooks Publishing Co., Baltimore, MD. 2005.
CERTIFICATIONS
School Psychologist in Pennsylvania (April, 2007) & New Jersey (April, 2008)
Crisis Prevention (Crisis Prevention Institute – February, 2008, October, 2010, & November, 2011)
CPR (American Red Cross - July, 2007)
First Aid (American Red Cross - June, 2006)
Developmental Disabilities (American Red Cross – October, 2002)