fairfax county youth survey school year 2014-2015 · 2018-01-23 · fairfax county 2014 youth...
TRANSCRIPT

Fairfax County 2014 Youth Survey
Fairfax County Youth Survey School Year 2014-2015
Updated October 2015
Alcohol, Tobacco and Other Drugs

Fairfax County 2014 Youth Survey
2
It provides DATA to county, school, and community–based organizations to:
• Assess Youth Strengths and Needs
• Develop Programs and Services
• Monitor Trends
• Measure Community Indicators
• Guide Countywide Planning of Prevention Efforts
About the Fairfax County Youth Survey

Fairfax County 2014 Youth Survey
3
• Comprehensive
• Anonymous
• Voluntary
More About the Fairfax County Youth Survey
It examines the
• Behaviors,
• Experiences, and
• Risk and Protective Factors that influence the well-being of our county’s youth.

Fairfax County 2014 Youth Survey
4
Fairfax County Youth Survey Web Page
www.fairfaxcounty.gov/youthsurvey

Fairfax County 2014 Youth Survey
5
Fairfax County Youth Survey Participation
• 46,855 FCPS students • Grades 6, 8, 10, and 12 • Representing 87% of enrolled students
6th grade students take a shortened, modified survey.

Fairfax County 2014 Youth Survey
Three to Succeed

Fairfax County 2014 Youth Survey
7
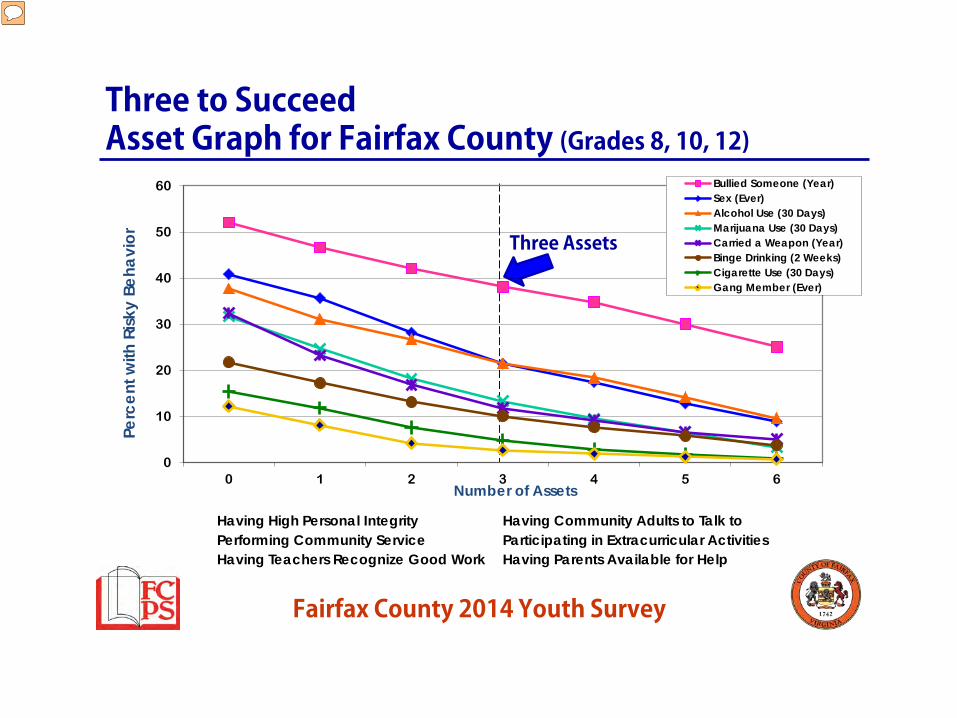
Three to Succeed
The Three to Succeed concept is based on the youth survey analysis that shows how just having three assets (or strengths) dramatically reduces risk behaviors and promotes thriving youth.
Assets are strengths in young people, their families, schools and communities that help them thrive in health, in school and daily life, and in a safe environment. The more assets an individual has in their lives, the fewer risk behaviors are reported.
Fairfax County 2014 Youth Survey
Having High Personal Integrity Performing Community Service Having Teachers Recognize Good Work
Having Community Adults to Talk to Participating in Extracurricular Activities Having Parents Available for Help
Three to Succeed Asset Graph for Fairfax County (Grades 8, 10, 12)
Three Assets
0
10
20
30
40
50
60
0 1 2 3 4 5 6
Perc
ent w
ith R
isky
Beha
vior
Number of Assets
Bullied Someone (Year)Sex (Ever)Alcohol Use (30 Days)Marijuana Use (30 Days)Carried a Weapon (Year)Binge Drinking (2 Weeks)Cigarette Use (30 Days)Gang Member (Ever)

Fairfax County 2014 Youth Survey
Alcohol, Tobacco and Other Drugs: Survey Questions and Results

Fairfax County 2014 Youth Survey
Fairfax County Youth Survey Question
10
The next section asks about your thoughts about and experiences with tobacco, alcohol, and other drugs.
Students were asked the following…
10

Fairfax County 2014 Youth Survey
11
Fairfax County Youth Survey Question
ALCOHOL - On how many occasions (if any) have you had beer, wine, or hard liquor during the past 30 days? • 0 occasions • 1-2 occasions • 3-5 occasions • 6-9 occasions • 10-19 occasions • 20-39 occasions • 40 or more occasions
11

Fairfax County 2014 Youth Survey
Overall 8th 10th 12th Female Male White Black Hispanic Asian Other/Multiple
FCPS 19.2 5.1 17.5 35.5 20.0 18.3 24.4 13.6 20.0 9.7 22.0US 22.6 9.0 23.5 37.4
0
10
20
30
40
50
60
% R
epor
ting
Percent Who Drank Alcohol in Past 30 Days (Grades 8, 10, 12)
Note: 6th Grade Prevalence = 1.5%
12

Fairfax County 2014 Youth Survey
13
Fairfax County Youth Survey Question
BINGE DRINKING - Think back over the last two weeks. How many times have you had five or more alcoholic drinks in a row? • None • Once • Twice • 3-5 times • 6-9 times • 10 or more times
13

Fairfax County 2014 Youth Survey
Percent Reporting Binge Drinking (Grades 8, 10, 12) (Five or More Drinks in a Row, past 2 weeks)
Overall 8th 10th 12th Female Male White Black Hispanic Asian Other/Multiple
FCPS 8.8 1.4 6.4 19.0 8.7 8.8 11.6 5.7 9.5 3.4 10.3US 11.7 4.1 12.6 19.4
0
10
20
30
40
50
60
% R
epor
ting
14

Fairfax County 2014 Youth Survey
15
Fairfax County Youth Survey Question
TOBACCO - How often have you smoked cigarettes during the past 30 days? • Not at all • Less than one cigarette per day • One to five cigarettes per day • About one-half pack per day • About one pack per day • About one and one half packs per day • Two or more packs per day
15

Fairfax County 2014 Youth Survey
Overall 8th 10th 12th Female Male White Black Hispanic Asian Other/Multiple
FCPS 4.1 1.4 2.9 8.3 3.8 4.4 4.5 3.4 5.4 2.3 4.4US 8.0 4.0 7.2 13.6
0
10
20
30
40
50
60
% R
epor
ting
Percent Who Smoked Cigarettes in Past 30 Days (Grades 8, 10, 12)
Note: 6th Grade Prevalence = 0.3%
16

Fairfax County 2014 Youth Survey
17
Fairfax County Youth Survey Questions
OTHER DRUGS - On how many occasions (if any) have you: • used marijuana, • LSD or other hallucinogens (acid, angel dust, special k, shrooms) • used cocaine or crack • sniffed glue, breathed (huffed) the contents of an aerosol spray can, or
inhaled other gases or sprays in order to get high • used methamphetamine (speed, crystal, crank, or ice) • used Ecstasy • taken steroids without a doctor’s order • used heroin • taken painkillers (such as Oxycontin, Vicodin, Percoset, Codeine, and Opium)
without a doctor’s order • taken a prescription drug other than painkillers (such as Ritalin, Adderal, or
Xanax) without a doctor’s order • taken over-the-counter drugs to get high
0, 1-2, 3-5, 6-9, 10-19,20-39, 40 or more occasions
Rates of use by selected demographics can be found in the appendix of this presentation.
17

Fairfax County 2014 Youth Survey
Overall 8th 10th 12th Female Male White Black Hispanic Asian Other/Multiple
FCPS 11.3 2.1 10.5 21.6 10.3 12.3 12.6 12.7 13.5 5.4 13.5US 14.4 6.5 16.6 21.2
0
10
20
30
40
50
60
% R
epor
ting
Percent Who Used Marijuana in Past 30 Days (Grades 8, 10, 12)
Note: 6th Grade Prevalence = 0.1%
18

Fairfax County 2014 Youth Survey
Overall 8th 10th 12th Female Male White Black Hispanic Asian Other/Multiple
FCPS 2.6 4.2 2.3 1.4 2.9 2.3 1.9 3.8 3.8 2.0 3.9US 1.4 2.2 1.1 0.7
0
10
20
30
40
50
60
% R
epor
ting
Percent Who Used Inhalants in Past 30 Days (Grades 8, 10, 12)
The rate of inhalants use in Fairfax County is higher than the rate reported nationally.
Note: 6th Grade Prevalence = 2.0%
19

Fairfax County 2014 Youth Survey
Percent Who Used ATOD in the Past 30 Days (Grades 8, 10, 12)
Overall 8th 10th 12th Female Male White Black Hispanic Asian Other/Multiple
FCPS % 28.1 13.7 26.4 44.3 28.6 27.5 31.3 27.7 32.0 16.7 32.3
0
10
20
30
40
50
60
% R
epor
ting
20

Fairfax County 2014 Youth Survey
Percent Who Used ATOD in the Past 30 Days (Grade 6)
Overall Female Male White Black Hispanic Asian Other/Multiple
FCPS % 3.6 3.1 4.0 3.6 3.1 4.8 2.7 3.7
0
10
20
30
40
50
60
% R
epor
ting
21

Fairfax County 2014 Youth Survey
Violence and Aggression Correlation to ATOD Use
Fairfax County 2014 Youth Survey
23
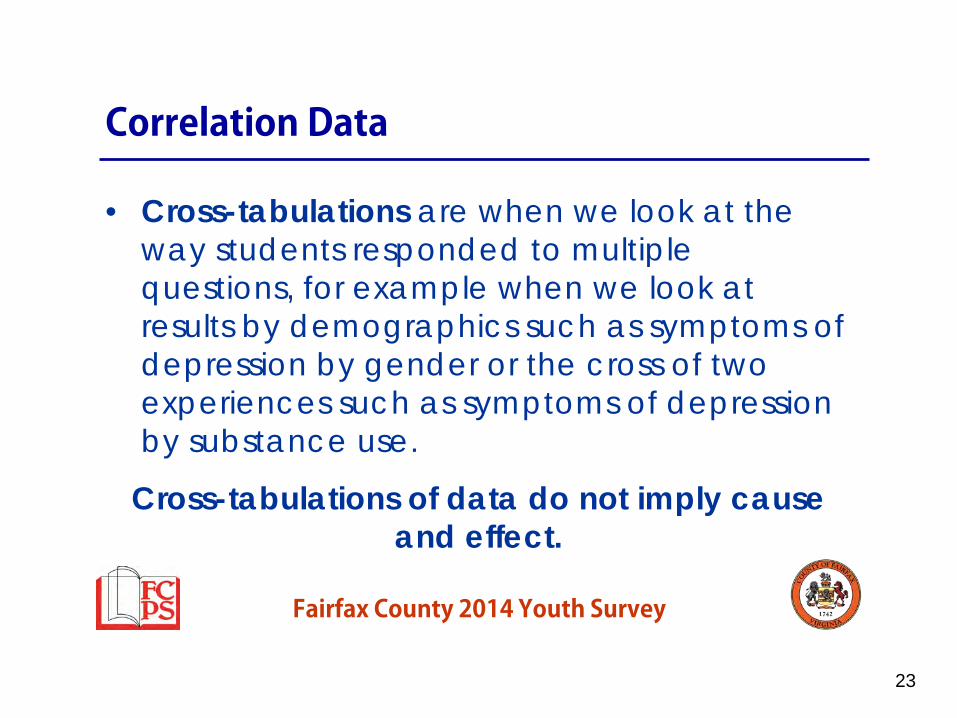
Correlation Data
• Cross-tabulations are when we look at the way students responded to multiple questions, for example when we look at results by demographics such as symptoms of depression by gender or the cross of two experiences such as symptoms of depression by substance use.
Cross-tabulations of data do not imply cause and effect.
23
Fairfax County 2014 Youth Survey
24
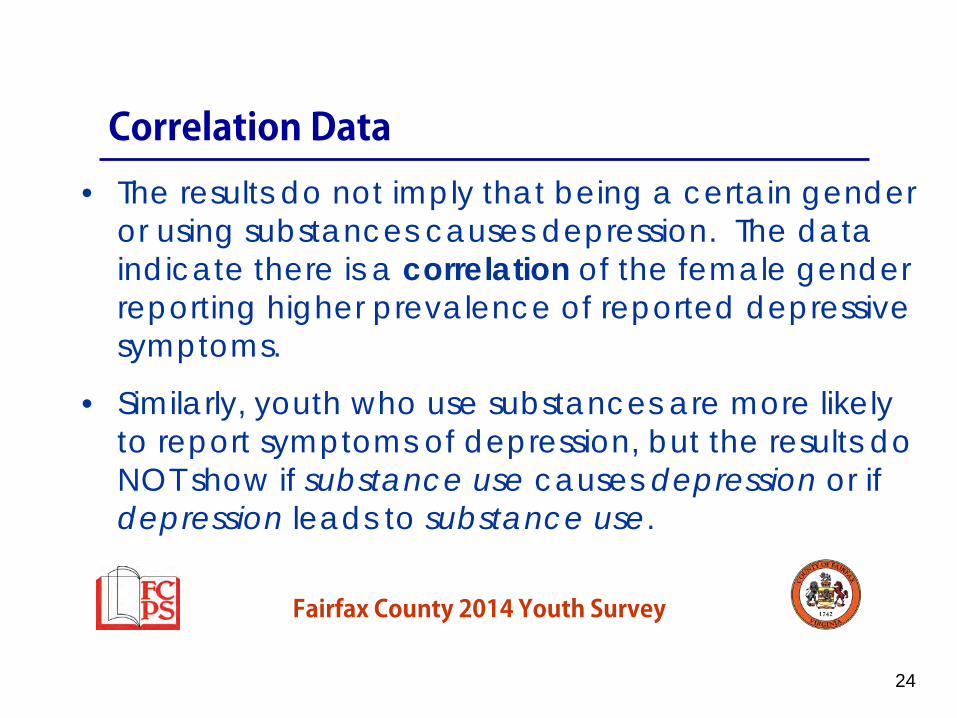
Correlation Data
• The results do not imply that being a certain gender or using substances causes depression. The data indicate there is a correlation of the female gender reporting higher prevalence of reported depressive symptoms.
• Similarly, youth who use substances are more likely to report symptoms of depression, but the results do NOT show if substance use causes depression or if depression leads to substance use.
24

Fairfax County 2014 Youth Survey
VictimBullying
VictimRacial orCulturalHarrass-
ment
VictimCyber-
bullying atSchool
BulliedOthers
Racially orCulturallyHarrassed
Others
Cyber-bullied
Others atSchool
Carried aWeapon
Ever Beenin a Gang
Used ATOD 58.6 53.9 20.4 49.1 49.3 13.6 22.4 6.3
No ATOD 48.1 41.9 9.4 30.0 25.7 3.7 6.3 1.0
01020304050607080
Perc
ent –
Com
parin
g A
TOD
Use
and
N
o A
TOD
Use
as s
ub-p
opul
atio
ns
ATOD (Grades 8, 10, 12) Violence and Aggression Related Factors
25

Fairfax County 2014 Youth Survey
VictimBullying
VictimRacial orCulturalHarrass-
ment
VictimCyber-
bullying atSchool
BulliedOthers
Racially orCulturallyHarrassed
Others
Cyber-bullied
Others atSchool
Carried aWeapon
Used ATOD 61.6 28.0 28.5 34.2 15.4 17.3 40.6No ATOD 42.4 18.0 13.3 15.5 4.0 4.1 12.0
0102030405060708090
100
Perc
ent –
Com
parin
g A
TOD
Use
and
N
o A
TOD
Use
as s
ub-p
opul
atio
ns
ATOD (Grade 6) Violence and Aggression Related Factors
26
Fairfax County 2014 Youth Survey
Health and Well-Being Correlation to ATOD Use

Fairfax County 2014 Youth Survey
Depression Sleep (Fewer than 8hrs)
Ever Had SexualIntercourse Ever Had Oral Sex
ATOD Use 45.1 80.8 45.7 52.4No ATOD 26.5 65.9 8.8 10.6
0
10
20
30
40
50
60
70
80
Perc
ent –
Com
parin
g A
TOD
Use
and
N
o A
TOD
Use
as s
ub-p
opul
atio
ns
ATOD (Grades 8, 10, 12) Health and Well-Being Related Factors
28

Fairfax County 2014 Youth Survey
School Performance Correlation to ATOD Use
Fairfax County 2014 Youth Survey
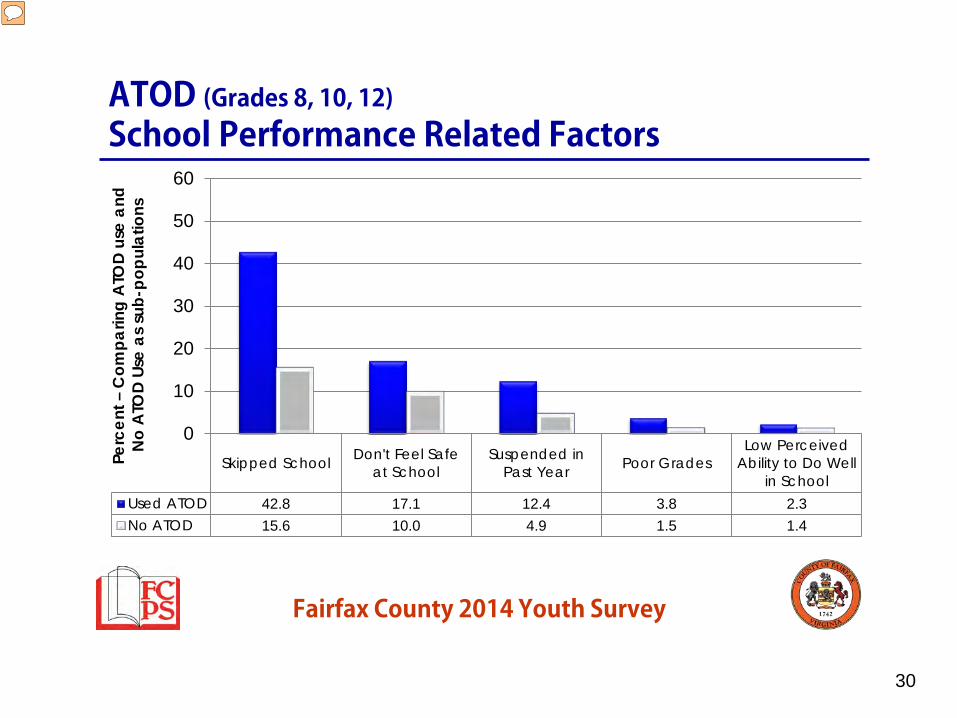
Skipped School Don't Feel Safeat School
Suspended inPast Year Poor Grades
Low PerceivedAbility to Do Well
in SchoolUsed ATOD 42.8 17.1 12.4 3.8 2.3No ATOD 15.6 10.0 4.9 1.5 1.4
0
10
20
30
40
50
60
Perc
ent –
Com
parin
g A
TOD
use
and
N
o A
TOD
Use
as s
ub-p
opul
atio
ns
ATOD (Grades 8, 10, 12) School Performance Related Factors
30
Fairfax County 2014 Youth Survey
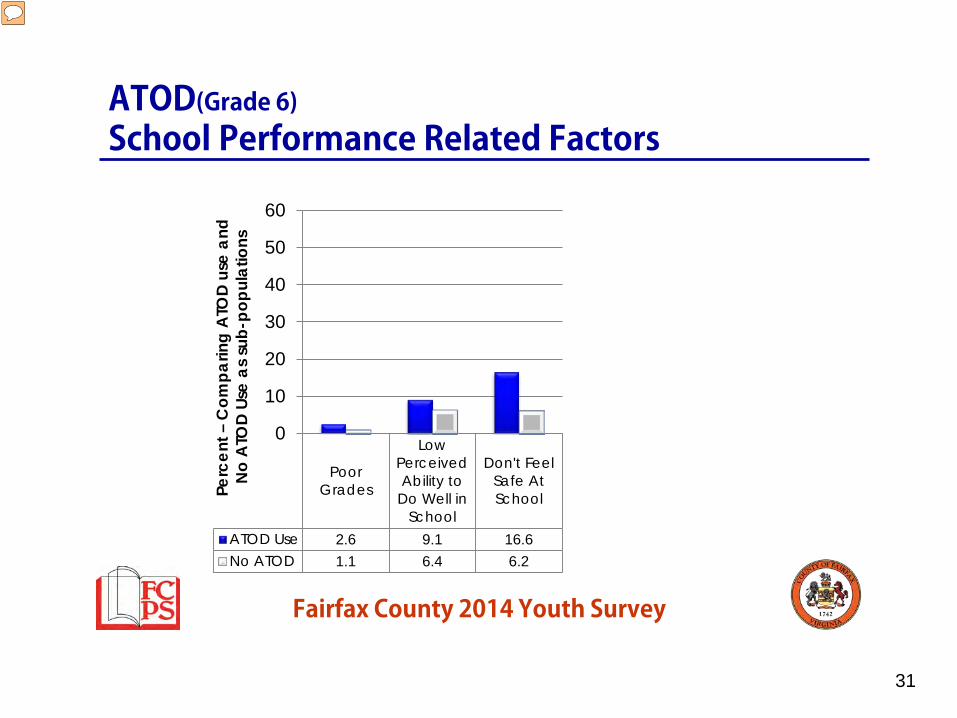
PoorGrades
LowPerceivedAbility to
Do Well inSchool
Don't FeelSafe AtSchool
ATOD Use 2.6 9.1 16.6No ATOD 1.1 6.4 6.2
0
10
20
30
40
50
60Pe
rcen
t – C
ompa
ring
ATO
D us
e an
d
No
ATO
D Us
e as
sub
-pop
ulat
ions
ATOD(Grade 6) School Performance Related Factors
31

Fairfax County 2014 Youth Survey
Risk and Protective Factors

Fairfax County 2014 Youth Survey
Risk and Protective Factors
Risk Factors help us explain circumstances that may increase the likelihood of problem behaviors
Youth who exhibit increased amounts of a risk factor
are considered to be at “high risk” in that category
33

Fairfax County 2014 Youth Survey
Risk and Protective Factors
Protective Factors can help increase resiliency to substance use and problem behaviors, buffering youth from risk Youth who exhibit increased amounts of a protective factor
are considered to have “high protection” in that category
Full Glossary of R&P questions can be found in the 2014 Fairfax County Youth Survey Report..
34

Fairfax County 2014 Youth Survey
Perceived Parental Acceptance of Alcohol Use and Self-Reported Past 30 Day Alcohol Use
35
020406080
100
Very Wrong Wrong A Little BitWrong
Not Wrong
10 32
58 64
% R
epor
ting
Alcohol useNo Alcohol
How wrong do your parents feel it would be for you to drink beer, wine, or hard liquor?

Fairfax County 2014 Youth Survey
Perceived Parental Acceptance of Cigarette Use and Self-Reported Past 30 Day Cigarette Use
36
020406080
100
VeryWrong
Wrong A Little BitWrong
NotWrong
3 12
31 31
% R
epor
ting
Cigarette useNo Cigarette
How wrong do your parents feel it would be for you to smoke cigarettes?

Fairfax County 2014 Youth Survey
Perceived Parental Acceptance of Marijuana Use and Self-Reported Past 30-Day Marijuana Use
37
0
20
40
60
80
100
VeryWrong
Wrong A Little BitWrong
NotWrong
7 27
49
57
% R
epor
ting
Marijuana useNo Marijuana
How wrong do your parents feel it would be for you to smoke marijuana?

Fairfax County 2014 Youth Survey
Protective Factors Correlation to ATOD Use

Fairfax County 2014 Youth Survey
HighPersonalIntegrity
PerformCommunity
Service
TeachersRecognizeGood Work
HaveCommunity
Adults toTalk to
Participatein Extra-
curricularActivities
Parents areAvailable for
Help
ATOD Use 45.3 67.6 55.1 32.6 77.7 68.8No ATOD 15.1 71.7 65.7 44.8 78.7 81.8
0102030405060708090
100
Perc
ent –
Com
parin
g A
TOD
Use
and
N
o A
TOD
Use
as S
ub-p
opul
atio
ns
ATOD (Grades 8, 10, 12) Protective Factors
39

Fairfax County 2014 Youth Survey
HighPersonalIntegrity
Participatein Extra-
curricularActivities
Feel Safe atSchool
HaveCommunity
Adults toTalk to
PerformCommunity
Service
Parents areAvailable for
Help
ATOD Use 87.5 70.7 83.4 46.0 41.6 76.2No ATOD 97.7 73.9 93.9 54.4 42.1 90.9
0102030405060708090
100
Perc
ent –
Com
parin
g A
TOD
Use
and
N
o A
TOD
use
as S
ub-p
opul
atio
ns
ATOD (Grade 6) Protective Factors
40

Fairfax County 2014 Youth Survey
41
Asset Graph for Caring Adults (Grades 8, 10, 12)
Having Parents Available for Help Having Teachers Recognize Good Work Having Community Adults to Talk to
0
5
10
15
20
25
30
35
40
45
50
0 1 2 3
Perc
ent w
ith
Risk
y B
ehav
ior
Number of Assets
Bullied Someone (Year)Sex (Ever)Alcohol Use (30 Days)Marijuana Use (30 Days)Carried a Weapon (Year)Binge Drinking (2 Weeks)Cigarette Use (30 Days)Gang Member (Ever)
Fairfax County 2014 Youth Survey
42
The Prevention Toolkit provides access to presentations, videos, fact sheets, links to helpful organizations and resources, and ideas for taking action in your family and community to address Youth Survey related topics.
The Prevention Toolkit
The Prevention Toolkit Website www.fairfaxcounty.gov/ncs/prevention/toolkit.htm
Contact Email [email protected]
• Alcohol, Tobacco and Other Drugs
• Bullying and Cyberbullying • Depression, Suicide and
Unhealthy Weight Loss • Nutrition and Physical
Activity • Teen Dating Abuse

Fairfax County 2014 Youth Survey
43
Find these and other organizations in the Prevention Toolkit as resources for help and more information.
• Fairfax-Falls Church Community Services Board (CSB) 24-Hour CSB Emergency Services Phone: 703-383-8500 | TTY: 703-207-7737
• Substance Abuse and Mental Health Service Administration • NIDA for Teens, National Institute on Drug Abuse • The Partnership for a Drug-Free America • Stop Underage Drinking
Help and More Information
www.fairfaxcounty.gov/ncs/prevention/toolkit_agencies_orgs.htm#atod

Fairfax County 2014 Youth Survey
44
Intervention and Prevention Services
School Psychology Services
School Social Work Services
Student Safety and Wellness
School Counseling Services
Help and More Information from Fairfax County Public Schools

Fairfax County 2014 Youth Survey
45
Questions? Contact Us!
Sophia Dutton Countywide Service Integration and Planning Management
Strategic Planning, Communications, & Info Management
Dede Bailer Fairfax County Public Schools
Office of Intervention and Prevention Services

Fairfax County 2014 Youth Survey
46
Appendix

Fairfax County 2014 Youth Survey
47
Other Drug Use in the Past 30 Days By Selected Demographics