fair housing equity assessment - puget sound regional ... · fair housing equity assessment for the...
TRANSCRIPT

Fair Housing Equity Assessment
for the Central Puget Sound Region
Neighborhood Matters Matching Opportunity with Community
January 2014


Fair Housing Equity Assessment
for the Central Puget Sound Region
Neighborhood Matters Matching Opportunity with Community

Project Contributors Puget Sound Regional Council (PSRC) StaffBen Bakkenta
Michael Hubner
Sara Maxana
Tim Parham
Lauren Engels
Carol Naito
Neil Kilgren
Rebeccah Maskin
Christy Lam
A Regional Coalition for Housing (ARCH) StaffMike Stanger
Fair Housing Center of Washington StaffLauren Walker
Katy Sheehan
Omar Barraza
Bess Scott
Rusty George Creative StaffRusty George
Chris Cowan
Jacquelyn Marcella
Leah Ettenhofer

Fair Housing Equity Assessment for the Central Puget Sound Region | Contents 1
Tables | 4
Figures | 5
Fair Housing Committee | 6
Executive Summary | 8
Section I. Introduction | 12What is a Fair Housing Equity Assessment? | 12
The Growing Transit Communities Partnership | 12
The Fair Housing Equity Assessment | 13
Relationship between the FHEA and Jurisdictional Analysis of Impediments | 14
Fair Housing in the Central Puget Sound Region | 15
Historical Context of the Fair Housing Act | 15
Federal, State, and Local Protected Classes | 16
Recognizing Disability As A Protected Class | 18
The Growth Management Act | 19
History of Segregation in the Puget Sound Region | 19
Fair Housing versus Affordable Housing | 21
Document Overview | 22
Section II. Regional Profile | 23Demographic Data | 23
Population Growth | 25
Race and Ethnicity | 26
Income | 31
Racially/Ethnically Concentrated Areas of Poverty | 34
Measures of Segregation | 36
Dissimilarity Index | 37
A Geography of Segregation within the Region | 39
Predicted Racial/Ethnic Composition Ratio | 41
Access to Opportunity | 44
Contents

Fair Housing Equity Assessment for the Central Puget Sound Region | Contents 2
Opportunity Defined in the Central Puget Sound Region | 44
Opportunity Distribution by Geography | 46
Opportunity Distribution by Demographics | 48
Implications of Inequitable Access to Opportunity | 50
Addressing Fair Housing and Opportunity Through Housing and Transportation Infrastructure | 51
Housing Overview | 51
Housing Cost | 52
Housing and Transportation Affordability Index | 55
Opportunity Distribution and Housing Assistance | 55
Regulatory Context for Fair Housing and Opportunity | 56
Transportation Infrastructure Investments | 58
Section III. Fair Housing Infrastructure | 63Overview | 63
Analyses of Impediments to Fair Housing Choice in the Central Puget Sound Region | 63
Fair Housing Enforcement | 65
U.S. Department of Justice | 65
HUD Fair Housing and Equal Opportunity Office | 65
Fair Housing Initiatives Program (FHIP) | 66
Fair Housing Assistance Program | 66
Fair Housing Partners of Washington | 67
Recent Litigation - Cases Addressing Issues Involving Affirmatively Furthering Fair Housing Enforcement | 67
Complaint Data | 68
Distribution of Fair Housing Cases by County | 70
Puget Sound Fair Housing Complaints Tell a Story | 71
Regional Transit Communities Fair Housing Testing Audit | 72
Overview | 72
Housing Discrimination Occurring in Snohomish, King and Pierce County Transit Communities | 72
Discrimination in Proximity to Transit Communities | 74

Fair Housing Equity Assessment for the Central Puget Sound Region | Contents 3
Findings | 75
Puget Sound Home Mortgage Disclosure Act (HMDA) Data | 75
Foreclosures in the Puget Sound After the 2008 Collapse | 77
Public Comment | 77
Fair Housing Survey | 78
Survey Comments | 80
Community Forums and Individual Interviews | 80
Conclusions from Public Comment | 81
What Does All This Tell Us About Fair Housing in the Puget Sound Region? | 82
Education Prevents Litigation | 82
Section IV. Findings and Strategies | 83Findings | 83
Fair Housing Equity Assessment (FHEA) | 83
Fair Housing in the Central Puget Sound Region | 83
Demographic Data | 84
Access to Opportunity | 84
Housing and Access to Opportunity | 85
Transportation and Infrastructure | 85
Fair Housing Infrastructure | 86
Fair Housing Complaints | 86
Evidence of Discrimination from Fair Housing Testing | 86
Strategies | 87
Fair Housing | 87
Access to Opportunity | 87
Affordable Housing | 88
Next Steps | 89
Appendix I: Predicted Racial/Ethnic Composition by Small Area | 90
Appendix II: Cases of Note | 94
Appendix III: Introduction to Testing Methodology | 96
Appendix IV: Public Comment/Individual Interview Themes | 97

Fair Housing Equity Assessment for the Central Puget Sound Region | Tables 4
TablesTable 1: Protected Classes in the Puget Sound Region by Jurisdiction/Enforcement Agency | 18
Table 2: Protected Classes in Puget Sound Cities Without Local Enforcement Agencies | 21
Table 3: Tribes Located in the Puget Sound Region | 21
Table 4: Population by County, 1990-2010 | 25
Table 5: Demographic Overview - Central Puget Sound Region | 27
Table 6: Median Income and Poverty by County, 2007-2011 | 31
Table 7: Population and Demographics of R/ECAPs | 36
Table 8: Dissimilarity Index for Central Puget Sound Region 2000 and 2010 | 38
Table 9: Black-White Dissimilarity Index Comparisions to Peer Regions | 39
Table 10: Central Puget Sound Region Comprehensive Access to Opportunity Index Sub-Measures and Indicators | 45
Table 11: Exsisting Housing Stock and Racial Segregation | 52
Table 12: Housing Affordability Benchmarks | 52
Table 13: A List of the Region’s Most Common Barriers to Fair Housing Choice | 64
Table 14: HUD Fair Housing Complaints Nationwide vs. Central Puget Sound Region 2007-2011 | 68
Table 15: Fair Housing Complaints by County 2007-2011 | 69
Table 16: Regional Fair Housing Complaints by Type for 2007-2011 | 70
Table 17: Difference In Treatment Favoring Control Tester | 73
Table 18: 2012-2013 Testing Audit Results | 74
Table 19: Discrimination in Proximity to Transit Communities | 74
Table 20: 2010 Regional Home/Mortgage Disclosure Act Application Outcomes by Race | 75
Table 21: 2010 Regional Home/Mortgage Disclosure Act Application Outcomes by Ethnicity | 76
Table 22: Fair Housing Survey Findings | 78

Fair Housing Equity Assessment for the Central Puget Sound Region | Figures 5
FiguresFigure 1: The Central Puget Sound Region | 24
Figure 2: 2010 Regional Population Shares by County | 25
Figure 3: Regional Population by Race 2010 | 26
Figure 4: Demographic Trends, 1990-2010 | 28
Figure 5: Percent Minority by Census Tract, 1990 | 29
Figure 6: Percent Minority by Census Tract, 2000 | 29
Figure 7: Percent Minority by Census Tract, 2010 | 29
Figure 8: Change in Minority Share of Population, 2000-2010 | 30
Figure 9: Median Income and Race/Ethnicity by County | 32
Figure 10: Median Household Income | 33
Figure 11: Racially/Ethnically Concentrated Areas of Poverty | 35
Figure 12: Race/Ethnicity Concentrations | 40
Figure 13: Predicted Racial/Ethnic Composition Ratio | 43
Figure 14: Comprehensive Opportunity Map for the Central Puget Sound Region | 47
Figure 15: Opportunity Distribution by Demographic Group | 48
Figure 16: Opportunity Distribution and Poverty | 49
Figure 17: Opportunity Distribution by Race and Poverty | 49
Figure 18: Median Home Values by City | 53
Figure 19: Median Rental Rates | 54
Figure 20: Opportunity Distribution and Housing Assistance | 56
Figure 21: Planned Housing Stock and Opportunity | 57
Figure 22: Environmental Justice Analysis of Transportation 2040 | 59
Figure 23: Environmental Justice Analysis of 2013-2016 TIP (Minorities) | 60
Figure 24: Environmental Justice Analysis of 2013-2016 TIP (Low Income Housholds) | 61
Figure 25: Fair Housing Complaint % by County, 2007-2011 | 71

Fair Housing Equity Assessment for the Central Puget Sound Region | Fair Housing Subcommittee 6
Fair Housing SubcommitteeAlaric Bien, City of Redmond
Alex Brennan, Capitol Hill Housing
Alexander Maurice, King County
Allyson O’Malley Jones, Northwest Justice Project
Amy Pow, Pierce County Health Department
Andra Kranzler, Columbia Legal Services
Anna Nelson, VanNess, Feldman, GordonDerr
Ben Miksch, Washington Low Income Housing Alliance
Brock Howell, Cascade Bicycle Club
Brooke Buckingham, City of Redmond
Chandler Felt, King County
Charlie Gray, Pierce County Housing Authority
Cheryl Collins, City of Seattle
Cheryl Markham, King County
Connie Brown, Tacoma Pierce County Housing Development Consortium
Dan Cardwell, Pierce County
Daniel L. Carlson, University of Washington
Dean Weitenhagen, Snohomish County
Denise Lathrop, City of Des Moines
Dinah Wilson, City of Kent
Eileen Canola, Snohomish County
Emily Alvarado, King County Housing Development Consortium
Eric Chipps, Sound Transit
Eva Wong, King County
Gina Custer, YWCA
Gloria Gould-Wessen, City of Kent
Gwenn Rousseau, City of Bellevue
Heidi Hall, Impact Capital
Ike Nwankwo, Washington State Department of Commerce
Jay Clarke, Snohomish County
Jaimie Reavis, City of Tukwila
Jan Meston, City of Everett
Janet Lewine, City of Bellevue
Jonathan Grant, Tenants Union of Washington State
Joseph Adriano, City of Bellevue
Julie West, King County Public Health
Kate Lichtenstein, Sound Transit
Kathy Temper, King County
Kelly Rider, King County Housing Development Consortium
Kirsten Jewell, Kitsap Regional Council
Kristin Pula, Homesight
Laura Hewitt Walker, City of Seattle
Linda Bremmer, City of Tacoma
Lindsay Masters, City of Seattle
Marianne Seifert, Pierce County Public Health Department
Marya Gingery, City of Tacoma
Megan Farley Hyla, King County Housing Authority
Michael Chin, City of Seattle
Michele Thomas, Washington Low Income Housing Association
Miranda Redinger, City of Shoreline

Fair Housing Equity Assessment for the Central Puget Sound Region | Fair Housing Subcommittee 7
Miriam Roskin, City of Seattle
Monica Beach, City of Seattle
Naomi Goodman, Seattle Housing Authority
Ngozi Oleru, King County Public Health
Nicholas Nyland, Pierce County
Rosemary Curran, King County
Rudy Asunsolo, U.S. Department of Housing and Urban Development
Ryan Curren, City of Seattle
Sarah Stiteler, City of Redmond
Scott Mingus, King County
Sharon Anderson, City of Kirkland
Sheryl Whitney, WhitneyJennings
Shane Hope, City of Mountlake Terrace
Siri Kushner, Kitsap County Public Health
Stephanie Bray, Pierce County
Steve Fredrickson, Northwest Justice Project
Steve Toy, Snohomish County
Sue Tracy, Snohomish County
Suzanne D Withers, University of Washington
Tina McLeod, City of Tacoma
Tony To, Homesight
Tricia Ruiz, U.S. Department of Housing and Urban Development
Troy Holbrook, Snohomish County
Valerie Kendall, King County
Williams, Kelli, King County

Fair Housing Equity Assessment for the Central Puget Sound Region | Executive Summary 8
Executive Summary
What is the Regional Fair Housing Equity Assessment (FHEA)?The four-county central Puget Sound region is expected to grow to 5 million people by the year 2040. VISION 2040, the region’s long range plan, envisions a sustainable future that achieves social equity and supports a healthy environment and strong economy. This regional Fair Housing Equity Assessment (FHEA) advances this goal with analysis and recommendations aimed at ensuring equitable access to housing and opportunity for all residents of the region, including racial and ethnic minority populations, people with disabilities, and other classes of people protected under the federal Fair Housing Act. The FHEA, funded through a regional planning grant from the U.S. Department of Housing and Urban Development (HUD), has a two-fold objective:
• To ensure that the regional plans link fair housing considerations with issues of transportation, employment, education, land use planning, and environmental justice; and
• To ensure that affordable housing is located in areas that offer access to opportunity and that such housing is available to all people regardless of race, family status, disability, source of income or other personal characteristics protected under federal and state civil rights statutes.
The FHEA is the first attempt to bring together a full range of regional stakeholders and agencies around a coordinated approach to affirmatively furthering fair housing through cross-jurisdictional affordable housing development, jobs planning, transportation, education, and health initiatives. As such, the recommendations of this report are intended to guide regional and local plans, regulations, investments and other policies and actions.
The Civil Rights Act (1964), the Fair Housing Act (1968), and subsequent statutes, regulations, guidelines, and case law, have created a framework at the federal level to designate protected classes and address issues of
segregation and fair housing access. There are currently 16 classes protected at either the federal, state, or local level in the central Puget Sound region. They are: race, color, religion, national origin, sex, gender identity, sexual orientation, familial/parental status, handicap/disability, creed, marital status, veteran/military status, age, section 8 recipient, ancestry, and political ideology.
As in other parts of the country, the central Puget Sound region has a history of segregation based on race and national origin. Practices such as restrictive covenants, redlining, and loan discrimination, helped contribute to concentration of blacks and other racial/ethnic minorities. A regional FHEA addresses both the lingering effects of historical segregation as well as ongoing discriminatory practices and conditions that create barriers to housing choice and access to opportunity.
Key TermsEquity means that all people, regardless of where they live, have access to opportunities that improve their quality of life and let them reach their full potential. Social equity also requires that low income communities, communities of color and other historically under-represented populations are active participants in planning and policy making.
Affirmatively Furthering Fair Housing means including real and effective fair housing strategies in planning and development process which correspond to the spirit of the Fair Housing Act to rectify the consequences of a history of inequality.
Access to Opportunity opportunity measures community conditions—such as education quality, mobility, and economic health—that places individuals in a position to be more likely to succeed or excel.

Fair Housing Equity Assessment for the Central Puget Sound Region | Executive Summary 9
Summary of Findings
The region is becoming much more diverse. The four-county central Puget Sound region has experienced 34% population growth in the last 20 years. Nearly one-third of the 3.6+ million person population in 2010 identified as a racial/ethnic minority, representing a substantial increase in number, proportion, and geographic spread between 1990 and 2010.
Income and race are linked.Median household incomes of white and Asian populations are higher than the region’s median income, while median household incomes of black and Hispanic populations are lower than the region’s median income. There are four census tracts that meet the HUD-definition for Racially/Ethnically Concentrated Areas of Poverty in the region, meaning over 40% of the population is below the poverty level and over 50% of the population is a racial/ethnic minority. There are 13 additional census tracts in which at least 25% of households are below poverty and 40% of residents are non-white.
Moderate levels of segregation persist in the region, particularly for black residents.
Three measures indicate varying levels of segregation in the central Puget Sound region. A regional ”dissimilarity index” describes a region that is characterized by low to moderate segregation which has declined over the past decade. Blacks continue to be the most segregated racial group in the region. Blacks and Hispanics live predominantly in south Seattle, south King County, and Tacoma. Asians reside predominantly in these areas along with east King County. Data suggest that income differences among racial groups do not explain the patterns of segregation in the region.
Race and income are linked to access to opportunity. There is a strong association between geography and access to opportunity. Communities near the central cities of Seattle and Bellevue and east King County generally have high and very high access to opportunity. Areas in south King County and Pierce County generally are characterized by moderate, low, and very low access to opportunity. To the north, areas of southwest Snohomish County are associated with mixed access to opportunity. There is a relationship between race/ethnicity and access to opportunity. Whites and Asians are more likely to live in census tracts with high or very high access to opportunity than the population overall. Meanwhile, foreign-born, American Indian, Hispanic and African American residents are more likely to live in census tracts with low or very low access to opportunity than the total population. Living in poverty is associated with a higher likelihood of living in an area of low or very low access to opportunity. Blacks and Hispanics living in poverty are more likely to live in areas of low or very low access to opportunity than whites or Asians.
Housing choices are linked to access to opportunity.
Housing costs vary considerably across the region. High housing prices and rents are significant barriers to racial and ethnic minorities, immigrants, and other protected classes from securing housing generally, and especially in communities with good access to opportunity. The cost of transportation compounds the cost burden for housing alone that many low and even moderate income households in the region face. Comprehensive plans, implemented in part through land use regulations, include policies for accommodating growth with a range of housing types and densities. Affordability and access to high opportunity communities will be challenging in areas where displacement of existing affordable units is threatened and where higher-cost high-density is being developed.

Fair Housing Equity Assessment for the Central Puget Sound Region | Executive Summary 10
While regional analysis shows an equitable distribution of recent and planned transportation investments, disparate infrastructure and community development needs persist within the region.
Environmental justice analyses conducted by the Puget Sound Regional Council for Transportation 2040 and the 2013-2016 Transportation Improvement Program conclude that at a regional scale, both past and planned transportation investments, have equitably benefited minority and low-income households. Results of the opportunity mapping analysis show inequitable access to opportunity in the areas of mobility, economic health, education, and public health. These findings strongly suggest that at the local level, inequitable gaps exist between the need for community infrastructure in these areas and the provision of adequate community infrastructure.
Fair housing complaint data show that discrimination occurs in the region.
Demand for fair housing training for housing providers and consumers alike outweighs the resources available to HUD, FHAP, and FHIP agencies in the region to provide for all education needs. Nearly 1,400 fair housing complaints were made between 2007 and 2011, with most related to disability or racial discrimination. People with disabilities have difficulty getting equal access to the housing market through reasonable accommodations. Racial and ethnic minorities experience more harassment and retaliation than whites.
Testing reveals evidence of discrimination. Audits of fair housing testing in the region revealed that minority races, foreign born residents, and disabled people seeking housing had a 60% chance of being treated differently when looking for housing, particularly in areas that are highly served by transit and in areas with good access to opportunity. Among protected classes, racial and ethnic minorities were most likely to be treated differentially when seeking housing. Though it is not a protected class in most jurisdictions, discrimination due to source of income (Section 8) may have restricted housing for many of the region’s most vulnerable people.

Fair Housing Equity Assessment for the Central Puget Sound Region | Executive Summary 11
RecommendationsThe FHEA recommends strategies to affirmatively further fair housing and equity in the region through three main areas: Fair Housing, Access to Opportunity, and Affordable Housing. These strategies are highlighted below.
Fair Housing• Continue and expand regional coordination of
fair housing assessment and enforcement.
• Adopt regional fair housing goals and monitor outcomes.
• Evaluate impacts of regional and local policies and investments on protected classes.
• Promote diversity and prevent discrimination through supporting fair housing educational efforts.
• Increase funding for fair housing programs in the region.
Access to Opportunity• Use opportunity mapping analysis to
prioritize housing, infrastructure, and community development investments.
• Encourage affordable housing development and preservation in areas with high access to opportunity.
• Prioritize investments to improve access to opportunity in areas with low access to opportunity.
• Promote economic development programs in areas of low and very low access to opportunity.
• Invest in equitable access to high quality education.
• Provide sufficient transit investments to provide for the mobility of transit dependent populations, particularly between areas of low and high access to opportunity.
Affordable Housing• Increase efforts to provide sufficient choices of
affordable, safe, healthy, and adequately sized housing throughout the region to meet the region’s existing and future housing needs.
• Implement locally appropriate and effective incentives to encourage the development and preservation of affordable housing.
• Ensure that local zoning and building regulations allow and promote sufficient housing supply and housing types to meet the needs of households at a full range of incomes, household types, and special needs.
• Manage foreclosed homes to best serve areas of low and high access to opportunity respectively.
• Protect housing choice voucher holders from housing discrimination based on source of income.
Next Steps• Use the data, analyses, findings, and recommendations
contained in the FHEA as a resource for the local AIs, as well as a source of data and guidance to support policies and actions by entitlement jurisdictions, other regional partners, and the region as a whole.
• Continue to engage regional partners in developing a regional Analysis of Impediments based on the work done for the regional FHEA.
• Implement recommendations of the FHEA through the PSRC housing work plan.
• Understand and take regional and local action based on final updated HUD fair housing rules.

Fair Housing Equity Assessment for the Central Puget Sound Region | Section I: Introduction 12
What is a Fair Housing Equity Assessment?
Section I: Introduction
Livability PrinciplesOn June 16, 2009, the U.S. Department of Housing and Urban Development (HUD), U.S. Department of Transportation (DOT), and the U.S. Environmental Protection Agency (EPA) joined together in a new Partnership for Sustainable Communities to help communities nationwide improve access to affordable housing, increase transportation options, and lower transportation costs while protecting the environment.
The Partnership works to coordinate housing, transportation, and other infrastructure investments to make neighborhoods more prosperous, allow people to live closer to jobs, save households time and money, and reduce pollution. The partnership agencies incorporate six principles of livability into federal funding programs, policies, and future legislative proposals (see sidebar).
As part of the Partnership, in 2010, HUD created an Office of Sustainable Housing and Communities (OSHC), with a mission to create strong, sustainable communities by connecting housing to jobs, fostering local innovation, and helping to build a clean energy economy.
In February 2010, OSHC announced the availability of funding through a new Sustainable Communities Regional Planning Grant Program, intended to build support for actions that will create more equitable regions.
Provide more transportation choices. Develop safe, reliable, and economical transportation choices to decrease household transportation costs, reduce our nation’s dependence on foreign oil, improve air quality, reduce greenhouse gas emissions, and promote public health.
Promote equitable, affordable housing. Expand location- and energy-efficient housing choices for people of all ages, incomes, races, and ethnicities to increase mobility and lower the combined cost of housing and transportation.
Enhance economic competitiveness. Improve economic competitiveness through reliable and timely access to employment centers, educational opportunities, services and other basic needs by workers, as well as expanded business access to markets.
Support existing communities. Target federal funding toward existing communities—through strategies like transit-oriented, mixed-use development and land recycling—to increase community revitalization and the efficiency of public works investments and safeguard rural landscapes.
Coordinate and leverage federal policies and investment. Align federal policies and funding to remove barriers to collaboration, leverage funding, and increase the accountability and effectiveness of all levels of government to plan for future growth, including making smart energy choices such as locally generated renewable energy.
Value communities and neighborhoods. Enhance the unique characteristics of all communities by investing in healthy, safe, and walkable neighborhoods—rural, urban, or suburban.

Fair Housing Equity Assessment for the Central Puget Sound Region | Section I: Introduction 13
The Growing Transit Communities Partnership
The Fair Housing Equity Assessment
In 2010 the Puget Sound Regional Council (PSRC)1, in collaboration with 17 community partners, applied for and received a $5 million Sustainable Communities Regional Planning Grant from the HUD Office of Sustainable Housing and Communities. The grant funded the creation of the Growing Transit Communities Partnership, with a work program intended to address some of the greatest barriers to implementing the central Puget Sound region’s2 integrated plan for sustainable development—VISION 2040—and securing equitable outcomes. A significant goal of the grant-funded effort is to identify unique roles and opportunities associated with transit investment through the coordination and direct involvement of a wider array of stakeholders, both public and private. The tools and templates funded by
As a condition of participation in Sustainable Communities Regional Grant program, HUD has required that all grantees complete a Fair Housing Equity Assessment (FHEA). Equity in this context means that “all people, regardless of where they live, have access to the resources and opportunities that improve their quality of life and let them reach their full potential. Social equity also requires that low income communities, communities of color and other historically underrepresented populations are active participants in planning and policy making by having the knowledge and other tools required for full participation.”
When developing the regional FHEA concept, HUD established two specific requirements for grantees:
1. The findings of the FHEA must inform the regional planning effort and the decisions, priorities and investments that flow from it; and
the grant will greatly improve the region’s capacity to foster compact, equitable development, while providing affordable housing, reduced transportation costs, better environmental outcomes, and access to jobs for low-income households and communities of color in areas receiving major transit and housing investments.
The Growing Transit Communities Partnership has provided a unique opportunity to establish a more inclusive conversation on regional issues, drawing in those who have traditionally been marginalized from the community planning process. These voices provide new insight into the burdens and benefits experienced by different groups across the region.
The Puget Sound Regional Council (PSRC) is the metropolitan planning organization for Washington State’s central Puget Sound region comprised of King, Kitsap, Pierce and Snohomish counties. PSRC is charged with integrating planning for regional transportation, land use, and economic development planning under authority embodied in state and federal laws.
The Puget Sound Regional Council is designated by the governor of the State of Washington, under federal and state laws, as the Metropolitan Planning Organization (MPO) and Regional Transportation Planning Organization (RTPO) for the central Puget
1
2
2. The regional planning consortium members and leaders must engage in the substance of the FHEA and understand the implications for planning and implementation.
The FHEA includes a detailed look at regional demographics and market conditions as they pertain to housing choice for people of color, families with children, persons with disabilities, and other protected classes. It provides insight into existing fair housing conditions within the region. The objective of the FHEA is twofold:
1. To ensure that the regional plans link fair housing considerations with issues of transportation, employment, education, land use planning, and environmental justice; and
2. To ensure that affordable housing is located in

Fair Housing Equity Assessment for the Central Puget Sound Region | Section I: Introduction 14
areas that offer access to opportunity and that such housing is available to all people regardless of race, family status, disability, source of income or other personal characteristics protected under federal and state civil rights statutes.
Currently there is no consistent regional coordination of fair housing planning by non-fair housing agencies. For fair housing agencies, regional coordination takes place among the Region 10 HUD office, four governmental departments responsible for fair housing, one nonprofit fair housing agency, and numerous stakeholder agencies. This regional FHEA is the first attempt to bring together city and county agencies that have not been formally engaged in this
Fourteen jurisdictions in the central Puget Sound region are recipients of either Community Development Block Grant (CDBG) or HOME funds from HUD and are thus required to prepare an Analysis of Impediments to Fair Housing Choice (“AI”) for their individual jurisdictions.
The FHEA follows much of the format required by HUD’s Fair Housing Planning Guide for jurisdictional AI. Like an AI, the FHEA examines regional demographics and conditions of racial and ethnic segregation. It considers public sector activities affecting housing choice, such as zoning and land use regulation, deployment of affordable housing resources across the central Puget Sound region, as well as the interaction of housing choice with public resources for transportation and similar investments. It looks at evidence concerning the level and types of discrimination that occur in the four counties and 82 cities and towns in the region, and the capacity of the entities to respond appropriately to those conditions. The FHEA discusses recent or current allegations against private or public entities of systemic discrimination, including civil rights lawsuits, pending fair housing enforcement actions, settlements, and consent decrees that signal the presence or resolution of key fair housing and civil rights concerns.
There are, however, several areas in which the requirements of the FHEA and AI differ. Historically, the focus of the AI has been on the local level. Jurisdictions
Relationship Between The FHEA and Jurisdictional Analysis of Impediments
coordination together to address affirmatively furthering fair housing through cross-jurisdictional affordable housing development, jobs planning, transportation, education, and health initiatives. As such, the recommendations of this report are intended to guide regional and local plans, regulations, investments and other policies and actions.
receiving and allocating federal funding have the responsibility to identify and address impediments to access fair housing within their borders. Jurisdictions with a local-level fair housing certification requirement must identify strategies and actions that will be taken to address the fair housing issues raised in the AI. The obligation to conduct an AI in connection with the use of CDBG and HOME funds is statutory. Jurisdictions that fail to carry out the steps required by the AI certification are at risk of an enforcement action. The FHEA is regional in scope and examines fair housing conditions from a regional standpoint. There is no comparable enforcement framework in the Sustainable Communities program or in the FHEA. The Puget Sound Regional Council has no power to compel the communities with which it works to further fair housing. However, jurisdictions are always required to abide by applicable fair housing laws and if they do not they may risk litigation.

Fair Housing Equity Assessment for the Central Puget Sound Region | Section I: Introduction 15
Fair Housing in the Central Puget Sound Region
The civil rights movement of the 1950s and 1960s resulted in landmark legislation known as the Civil Rights Act of 1964 which guarantees the right of all people to enjoy equal treatment regardless of race or color. Because of the painful history of segregation and inequality among the races regarding housing in particular, shortly thereafter Congress passed the Civil Rights Act of 1968, commonly known as the Fair Housing Act. The law guarantees that all people have the right to equal housing opportunities regardless of race, color, religion, national origin, or other federally protected classes. The Act prohibits not only intentional discrimination but also unintentional discrimination, where neutral policies and practices have a negative or disparate impact on members of a protected class.3 Equal housing rights protected under the Fair Housing Act extend to nearly all types of housing, including publicly and privately funded housing and rental and owner-occupied housing.
To ensure compliance with the Fair Housing Act, Congress assigned the Department of Housing and Urban Development (HUD) and U.S. Department of Justice (DOJ) the responsibility of enforcing the law though administrative processes or if necessary, through lawsuits filed in federal court. The Act was amended in 1988, increasing HUDs enforcement powers.
Historical Context of the Fair Housing Act
The following actions are common violations of the FHA if based on any of the protected classes: Refusing to rent or sell a dwelling after a bona fide offer has been made; Refusing to negotiate for the sale or rental of a dwelling; Setting different terms, conditions, or privileges related to the sale or rental or to the use of facilities and services provided at a dwelling; Misrepresentation of availability of a unit; Making a profit by convincing owners to sell or rent properties based on fear of declining property values because members of a protected class are moving into a neighborhood (an action known as ‘blockbusting’); Advertising in a way that implies a preference for or limits usage to a certain type of buyer or renter; Denying access to, or membership in, or setting any different terms and conditions for membership to any organization in the business of selling or renting housing; Refusing to make or give information about a mortgage loan; Setting different terms or conditions for loans; Discriminating in the appraisal of property; Refusing to purchase a loan or setting different terms for the purchase of a loan; Interfering in any way with a person’s exercise of their fair housing rights
Entitlement Jurisdictions, discussed in Section I, are those jurisdictions which receive federal grant money related to housing development and which are subject to the affirmatively furthering fair housing provisions in the Fair Housing Act (discussed in Section III of this report) namely, CDBG, ESG, HOME funds. The Puget Sound Regional Council is designated by the governor of the State of Washington, under federal and state laws, as the Metropolitan Planning Organization (MPO) and Regional Transportation Planning Organization (RTPO) for the central Puget
3
4
Enforcement responsibilities also include the requirement that all agencies of the federal government which administer and/or oversee programs involving housing and community development “affirmatively further fair housing.” This requirement arises in large part from the need to repair the effects of the government’s not so long ago discriminatory policies which restricted minority housing opportunities. The idea is that no federal money should be spent in furthering discriminatory practices, and in fact, federal money should actually be spent on rectifying the injustices caused by housing discrimination in the past and promoting integrated and sustainable communities.
In the central Puget Sound Region there are fourteen entitlement jurisdictions 4 that, because of the federal grants they receive, are subject to the requirement to affirmatively further fair housing. They include:
• Counties: King, Kitsap, Pierce, Snohomish
• Cities: Auburn, Bellevue, Bremerton, Everett, Federal Way, Kent, Lakewood, Marysville, Seattle, Tacoma
Though all communities must abide by fair housing law, entitlement jurisdictions need to go a step further. In terms of practical application for entitlement jurisdictions,

Fair Housing Equity Assessment for the Central Puget Sound Region | Section I: Introduction 16
this means that recipients of federal housing funds are required to include real and effective fair housing strategies in their planning and development process which correspond to the spirit of the Fair Housing Act and rectify the consequences of a history of inequality. In other words, to receive federal money, jurisdictions are required to create a housing plan which affirmatively furthers fair housing.5 The equity assessment, which identifies the key issues of equity and fair housing in the region, is one of the first steps a jurisdiction must take toward affirmatively furthering fair housing because it examines, among other things, segregation and poverty in relation to protected classes as well as the location of areas of opportunity. Such an assessment informs past, present, and future investments in infrastructure that assist with fair housing planning towards more diverse, equitable, and sustainable communities.
The Fair Housing Act has been amended over time to include additional protected classes. The Act now prohibits discrimination in the sale, rental, and financing of housing based on race, color, religion, sex, national origin, family status and/or disability.7 Though not specifically stated in federal law, discrimination due to gender identity or sexual orientation is also prohibited because of a 2010 HUD policy.8
Washington State and some local governments have elected to extend protection from housing discrimination by enacting fair housing laws with additional protected classes, such as sexual orientation, marital status, age, and political ideology, within their jurisdictions. Tables 1 and 2 on the following page categorize the federal, state, and local protected classes.
Since the Fair Housing Act’s passage in1968 there have been numerous attempts to address the broader issues of segregation. In 1996, the U.S. Department of Housing and Urban Development (HUD) published fair housing planning guides for government entities to deeply analyze discriminatory housing practices in their communities. Attempting to understand how discrimination works in individual communities, government entities are required to examine policies and practices that fostered segregation and unequal housing and then come up with an action plan to address what they found. Jurisdictions in receipt of federal housing money6 are required to complete Analysis of Impediments to Fair Housing Choice. HUD has been fine tuning these efforts in recent years to find ways to effectively address the impact of our policy decisions on the successes and failures in our communities.
Federal, State, and Local Protected Classes
42 U.S.C. §3608(d); 24 C.F.R. §570.601(a)(2
Community Development Block Grant, HOME, Emergency Services Grant funds
Federal Register, 24 CFR Part 14 et al., Implementation of the Fair Housing Amendments Act, 1988: Final Rule, (Washington, D.C.: United States Government Printing Office, 1989), 3284.
HUD Issues Guidance on LGBT Housing Discrimination Complaints – Department addresses housing discrimination based on sexual orientation and gender identity (July 1, 2010) - http://portal.hud.gov/hudportal/HUD?src=/press/press_releases_media_advisories/2010/HUDNo.10-139
5
6
7
8
race color
religionsex
national originfamily status
disability
The Fair Housing Act prohibits discrimination in the sale, rental
and financing of housing based on:

Fair Housing Equity Assessment for the Central Puget Sound Region | Section I: Introduction 17
“List of Fair Housing Agencies” available at: http://www.kingcounty.gov/exec/CivilRights/FH/FHresources.aspx
Note: Agencies referenced above are Department of Housing and Urban Development (HUD), Washington State Human Rights Commission (WSHRC), King County Office of Civil Rights (KCOCR), Seattle Office for Civil Rights (SOCR), and City of Tacoma Human Rights (THR).
Basis
Race
Color
Religion
National Origin
Sex
Gender Identity
Sexual Orientation
Familial Status/Parental Status
Handicap/Disability
Creed
Martial Status
Veteran or Military Status
Age
Section 8 Recipient
Ancestry
Political Ideology
Federal/HUD State/WSHRC Seattle/SOCRKing County/KCOCR
Tacoma/THRC
Protected Classes in the Puget Sound Regionby Jurisdiction/Enforcement Agency
Table 1
9
10
Gender Identity and Sexual Orientation are protected classes insofar as they are covered under the HUD’s Guidance on LGBT Housing Discrimination Complaints issued July 1, 2010.
Id.
9
10

Fair Housing Equity Assessment for the Central Puget Sound Region | Section I: Introduction 18
Basis
Sexual Orientation
Gender Identity
Age
Ancestry
Source of Income
Everett Bremerton Burien Renton
Protected Classes in Puget Sound Cities without Local Enforcement Agencies*
Table 2
“List of Fair Housing Agencies” available at: http://www.kingcounty.gov/exec/CivilRights/FH/FHresources.aspx
* State and Federal protected classes apply in all jurisdictions in Washington.
Among the agencies that are active in the fair housing arena, actual enforcement provisions vary. Though the intention may be to protect people from discrimination, without enforcement provisions laws are less effective, which is why the charts above are broken up into jurisdictions with laws that have enforcement agencies, and those that do not.
The disability rights movement arrived relatively recently to the civil rights table. The Fair Housing Act was amended in 1988 to include disability as a protected class, and in 1991 the Americans with Disabilities Act was passed by the US Congress prohibiting discrimination in employment, transportation, public accommodation, communications and governmental activities. In 1971, Washington State enacted the Education for All Act, the nation’s first state mandatory special education law that would serve as a template for a national law passed years later. The state legislature passed the Washington State Freedom from Discrimination Law in 199311.
Discrimination against people with disabilities is multifaceted and may manifest differently than discrimination based on other factors. Disability-related discrimination may include refusal to negotiate with a person because of their disability or withholding access to people with disabilities by failing to reasonably
Recognizing Disability as a Protected Classaccommodate a person with disabilities so that they may access their equal rights to education, employment, housing, and public spaces. In regards to segregation/integration issues, creating accessible housing and public spaces is a major consideration for planners and developers as they plan for communities that can be used by everyone. In terms of access to equal opportunity, reasonable accommodation and modification policies help promote and ensure that people with disabilities are not excluded from opportunities because of their disabilities.
RCW 49.60.030 – Freedom from Discrimination – Declaration of civil rights.11

Fair Housing Equity Assessment for the Central Puget Sound Region | Section I: Introduction 19
The Growth Management Act
History of Segregation in the Central Puget Sound Region
Washington’s Growth Management Act (GMA) provides the framework for planning at all levels in the state, including identifying and protecting critical environmental areas, developing multi-county and county-wide planning policies, and crafting local comprehensive plans (Chapter 36.70A, Revised Code of Washington— RCW). Multi-county planning policies contained in VISION 2040 – the central Puget Sound region’s adopted long range growth management, environmental, economic and transportation strategy – and the related county-wide planning policies provide a common framework for local and regional planning in the region. At a minimum, multi-county planning policies are to address designating an urban growth area, contiguous and orderly development, siting capital facilities, transportation, housing, joint planning, and economic development.
As in other parts of the country, the central Puget Sound region has a history of segregation based on race, national origin, and other characteristics. Practices such as “red lining” and restrictive covenants on property have had long-lasting impacts on neighborhoods.
Across the region, communities have been shaped by racially restrictive covenants. These covenants took the form of terms in a deed that prevented people of minority races, religions, and ethnicities from purchasing the home. The U.S. Supreme Court indirectly validated racially restrictive covenants in a 1926 case ruling that they were private contracts, not created by the government and the government was not responsible for the acts of private citizens. Thereafter the restrictions occurred frequently in private deeds all over the country, including the central Puget Sound region12. Because
The completeness of a jurisdiction’s treatment of the mandatory “housing” elements of the Growth Management Act will go a long way towards affirmatively furthering fair housing. The GMA requires that the local comprehensive plan housing element:
• Include an inventory and analysis of existing and projected housing needs that identifies the number of housing units necessary to manage projected growth;
• Include a statement of goals, policies, objectives, and mandatory provisions for the preservation, improvement, and development of housing, including single-family residences; and
• Identify sufficient land for housing, including, but not limited to, government-assisted housing, housing for low-income families, manufactured housing, multifamily housing, and group homes and foster care facilities; and makes adequate provisions for existing and projected needs of all economic segments of the community.
the restrictions were an enforceable contract, owners who disregarded the contract terms were subject to the consequences outlined within the document which usually meant that violators of the racially restrictive covenant would forfeit their property as a penalty.
As a result of these private contracts, neighborhoods throughout the region prohibited the sale to or rental of property by blacks, Jews, as well as Asians. In 1948 the Supreme Court ruled that racially restrictive covenants were not enforceable (in other words, if racially restrictive covenants existed in a deed there was not a court in the country that could force a violator to forfeit the property which meant the covenant could not be enforced and was effectively null and void).13 Even with this ruling, the decision did not change already segregated communities that had formed or
Corrigan v. Buckley, 271 U.S. 323 (1926)
SHELLEY V. KRAEMER, 334 U.S. 1 (1948)
12
13

Fair Housing Equity Assessment for the Central Puget Sound Region | Section I: Introduction 20
the informal structures that perpetuated segregation within well-established communities. Also, despite the ruling, it was still legal for realtors and property owners to discriminate because of race and national origin until Congress passed the Fair Housing Act in 1968.
Another discriminatory practice which affected the entire nation, including the central Puget Sound region, relates to the Federal Housing Administration (FHA) loans that were available to returning veterans after WWII. As part of the GI Bill, FHA home mortgage loans were approved for veterans with very low interest rates. Veterans of color, however, were only given FHA loans in certain neighborhoods and were therefore prevented from moving into majority white neighborhoods through what amounted to a governmental redlining program.14
In 1900, blacks lived in all fourteen of Seattle’s wards. Through redlining and other practices, however, they were segregated into the two neighborhoods that would become the International District and the Central District.15 Blacks could not rent or buy housing outside of these areas, and in many parts of the city they were not allowed in hospitals, restaurants, theaters, and nightclubs. Racially restrictive covenants were common in the rest of Seattle, but particularly north of the Ship Canal Bridge, Capitol Hill, Madison Park, Queen Anne, Magnolia, and lakeside neighborhoods from Madrona to Rainier Beach. There were fewer restrictive deeds in Beacon Hill and Rainier Valley and people of color had very little chance of finding housing outside of the central neighborhoods.16
In Pierce County, redlining was used as a form of discrimination to segregate blacks within the Hilltop neighborhood as well as the eastside of Tacoma. Within Tacoma, there were certain neighborhoods, including
the Hilltop, where neither government nor private banks would invest. Without these investments in schools, businesses, and public infrastructure pockets of poverty and dilapidated communities evolved. As in other counties, the use of racially restrictive covenants in Pierce County segregated neighborhoods and formal, overt laws were not needed to actively discriminate against people because of race.
During World War II, the military continued to segregate by race. At Fort Lewis, in south Pierce County, people of color were segregated into separate camps and housing areas. At this time Washington State had three black army camps which were separated from whites: Camp Hathaway in Vancouver, Camp George Jordan in Seattle, and South Fort Lewis near Tacoma.17 In both Seattle and Tacoma there was restricted seating for blacks in theaters, as well as discrimination by store clerks in the downtown areas.
World War II also saw the relocation and internment of thousands of Japanese-Americans in the central Puget Sound region. The process decimated the thriving Japantown community in Seattle, and affected hundreds of Japanese-American owned farms in east King and Kitsap Counties. Residents of Japanese descent were given less than a week’s notice to liquidize assets, including real estate. As a result, many families lost their homes, businesses and livelihoods, in addition to the trauma of the three-year internment camps relocation.
Within Snohomish County, people of color have always been underrepresented. Only recently have significant populations of people of color begun to move into Snohomish County. Though the area has begun to diversify, the northern part of the central Puget Sound region was, and still is, the least diverse in comparison with South King and Pierce Counties.
“Race and the Power of Illusion,” California Newsreel, 2003 at http://www.pbs.org/race/000_General/000_00-Home.htm
Lesson Twenty-One: African Americans in the Modern Northwest,” Center for the Study of the Pacific Northwest, University of Washington at http://www.washington.edu/uwired/outreach/cspn/Website/Classroom%20Materials/Pacific%20Northwest%20History/Lessons/Lesson%2021/21.html
Silva, Catherine. “Racial Restrictive Covenants: Enforcing Neighborhood Segregation in Seattle,” Seattle Civil Rights & Labor History Project at http://depts.washington.edu/civilr/covenants_report.htm
Colt Denfeld, Duane. “Washington’s Black Army Camps – Camp Hathaway, Camp George Jordan, South Fort Lewis,” Sept. 27, 2012 at http://www.historylink.org/index.cfm?DisplayPage=output.cfm&file_id=10127
Kerley, Joni. “Does Your Home’s CCR’s Include Bizarre Restrictions?” Everett Area Real Estate Blog – Discovering All of Snohomish County WA. Mar. 12, 2012 at http://activerain.com/blogsview/3035622/does-your-home-s-ccr-s-include-bizarre-restrictions-
14
15
16
17
18

Fair Housing Equity Assessment for the Central Puget Sound Region | Section I: Introduction 21
As elsewhere in the central Puget Sound region, some housing development in Snohomish County had racially restrictive covenants18 which prevented people of color from moving north of Seattle. Unlike King and Pierce Counties, there was no area where people of color were pushed like the International/Central District in Seattle or the Hilltop in Tacoma, and therefore there has been no historic neighborhood for people of color. As a result, few people of color settled north of Seattle until very recently.19
While interrelated, “fair housing” and “affordable housing” are distinct concepts in law and policy. Fair housing is a broader concept which protects people in protected classes from discrimination in housing transactions including both the public and private housing markets because both markets may have conditions which restrict housing choice. Affordable housing affects fair housing because housing and other public policies influence housing markets as well as the distribution of subsidized affordable housing units in a given area. In these ways, public policy can repair or create patterns of residential segregation.
Fair housing for a region means affordable housing options are available in all communities to allow
Federally Recognized
Non-Federally Recognized
Tribes Located in the Central Puget Sound RegionTable 3
Snohomish
Tulalip
Stillaguamish
Snohomish
King
Snoqualmie
Muckleshoot
Duwamish
Kikiallus Indian Nation
Pierce
Puyallup
Steilacoom
Kitsap
Suquamish
Port Gamble’s S’Klallam
None
Fair Housing Versus Affordable Housingpeople to live where they want to live. In areas where there is low access to opportunity20 or where the housing quality is low, new affordable housing units may improve the value of the housing stock. In areas where there is high access to opportunity or where the housing is generally very expensive, affordable housing units add diversity to the community and allow access to opportunities to low income families.
Generally, the more affordable housing units there are in a community the better. However, over concentration of affordable housing can hinder fair housing efforts and actually further residential segregation, especially in in communities with low access to opportunity or segregated communities of color.
Lobos, Ignacio. “Snohomish Minorities Seek Clout,” Seattle Times. Apr. 18, 1990 at http://community.seattletimes.nwsource.com/archive/?date=19900418&slug=1067105
For a complete discussion of access to opportunity, see Section II of this report.
19
20
Native American tribes in the central Puget Sound region are numerous and diverse in comparison with other areas in the state and nation (see Table 3). Like other people of color they have experienced significant discrimination in housing, though there are some differences insofar as they were largely restricted to reservations as Washington State was settled by people of European descent. The chart below lists the federally recognized and non-recognized tribes in the central Puget Sound region.

Fair Housing Equity Assessment for the Central Puget Sound Region | Section I: Introduction 22
The 2007 U.S. Supreme Court challenge, United States v. Westchester County, New York,21 provides a good example of what not to do. In this case, Westchester County, NY, one of the most segregated counties in the United States, allegedly failed to affirmatively further fair housing after having received millions in federal housing grants.22 Though Westchester County certified that it had analyzed the impediments to fair housing choice and that it was addressing those impediments, the court ruled that County had not done anything related to furthering fair housing.
Westchester County argued that efforts to provide more affordable housing in low income areas where there were high percentages of racial minorities improved the housing in those areas. The real effect of the policy of building affordable housing units solely in communities with high populations of low income minorities was that they further segregated those populations, confining affordable housing units to minority communities rather than changing housing patterns within an already racially polarized county. Meanwhile, the county had not built any affordable housing in high opportunity areas which were primarily white communities.
This report proceeds in the following sections. Section II provides a regional profile that includes data on demographics, access to opportunity, and characteristics of the built environment, such as housing and transportation. Section III follows with a description and evaluation of the region’s fair housing infrastructure. Finally, Section IV summarizes overarching findings from the report’s analysis and recommends strategies to improve equitable access to housing in the central Puget Sound region.
As a result of the Westchester case, HUD has been reinvigorated to promote and enforce its authority to affirmatively further fair housing. Since 2009, HUD and the Department of Justice have filed cases against jurisdictions in many part of the country (e.g., the State of Texas; the State of Louisiana; St. Bernard Parish, LA; Danville, IL; Joliet, IL; Sussex Co. DE; and Marin County, CA) that were allegedly not meeting these requirements .
Promoting affordable housing in all neighborhoods affirmatively furthers fair housing and dismantles residential segregation. When a jurisdiction expands affordable housing opportunities in historically homogeneous communities with more opportunity, members of protected classes have access to good schools, employment, and healthy homes which they have been excluded from in the past. Diversifying the housing market diversifies a community’s population.
Document Overview
United States of American ex rel. Anti-Discrimination Center of Metro New York v. Westchester County, New York 495 F.Supp.2d 375 (2007).
To view a map of percentages of minority populations by region in Westchester County: http://giswww.westchestergov.com/wcgis/Census/2010_Tracts_Minority.pdf
21
22
Section IIntroduction
Section IIDemographics, Access to Opportunity, and Characteristics of the Built Environment
Section IIIDescription and Evaluation of the Region’s Fair Housing Infrastructure
Section IVSummarizes Overarching Findings From the Report’s Analysis and Recommends Strategies for Improvement

Fair Housing Equity Assessment for the Central Puget Sound Region | Section II: Regional Profile 23
Section II: Regional Profile
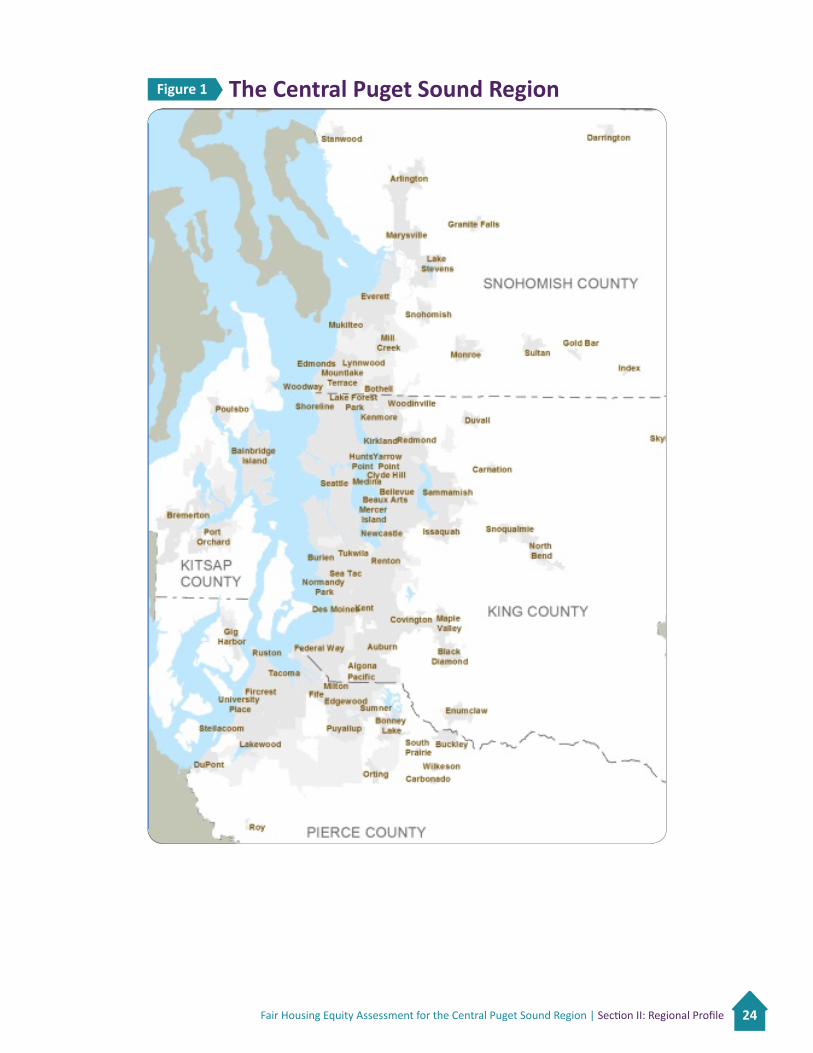
The central Puget Sound region in Washington State consists of the four counties of King, Kitsap, Pierce, and Snohomish, and 82 cities. The region’s 3,690,942 residents comprise over half of the state’s population. See Figure 1.
The following Regional Profile section describes and assesses key characteristics of the region that relate to fair housing. These characteristics include demographic patterns and trends, such as race, disability status, and national origin, and measures of segregation within the region. Access to opportunity is measured, mapped, and analyzed with respect to the communities where different racial and cultural communities currently live. Finally, various aspects of the built environment, such as housing and public investments, are highlighted as they relate to providing fair access to all current and future residents.
For each of the three subsections, a description of current conditions and recent trends is followed by an evaluation that relates the data to implications for fair housing choice and equity.
Data in this section describes select regional demographic characteristics, including the interplay of geography with population growth, race and ethnicity, income, and concentrations of poverty. United States Census and American Community Survey data from 1990, 2000 and 2010, as well as information collected by the Puget Sound Regional Council as part of regional data monitoring, serve as the primary sources of data to support these profiles. The data is presented by region, county, and where appropriate, cities.
Each subsection first presents a data snapshot of the central Puget Sound region today, followed by trend data that indicate change over the twenty year period from 1990-2010. Finally, an
Demographic Dataassessment discusses how the data relate to issues of fair housing choice and equity, including geographic trends, housing affordability, and poverty rates.
Fair Housing Equity Assessment for the Central Puget Sound Region | Section II: Regional Profile 24
The Central Puget Sound RegionFigure 1

Fair Housing Equity Assessment for the Central Puget Sound Region | Section II: Regional Profile 25
Population GrowthThe central Puget Sound region encompasses four counties, King, Kitsap, Pierce, and Snohomish, with a total 2010 population of 3,690,042. In 2010, King County had the largest share of the population with over half of the region’s residents. Pierce and Snohomish counties were close in size at 22% and 19%, respectively, of the region’s population. Kitsap County was home to 7% of the population. See Figure 2.
The region grew by over 34% between 1990 and 2010, from over 2.7 million residents to nearly 3.7 million residents. Snohomish County grew the most rapidly during this time, increasing by 53% over the 20-year period. Pierce County grew by 36%, and Kitsap by 32%. King County, the most urbanized of the counties with Seattle as its major city, experienced the lowest relative growth rate at 28%, but the highest absolute increase in population, growing by more than 400,000 people over the 20-year period. See Table 4 below.
2010 Regional Population Shares by County
Figure 2
Source: US Census, 2010
Source: US Census
KingKitsapPierceSnohomish
52%
19%
7%
22%
King
Kitsap
Pierce
Snohomish
Region
1,507,319
189,731
586,203
465,642
2,748,895
1990 2000
1,737,034
231,969
700,820
606,024
3,275,847
2010
1,931,249
251,133
795,225
713,335
3,690,942
% Change (1990-2010)
28%
32%
36%
53%
34%
Population by County1990-2010
Table 4
Population growth from 1990-2010 in the central Puget Sound Region
34%

26
The 1990 Census did not have an option to select more than one race as a response. The introduction of the multiple race response data in 2000 and 2010 both inflates the apparent increase in this category between 1990 and 2000 and likely reduces the increase in other minority categories.
Migration Policy Institute: http://www.migrationinformation.org/DataHub/state.cfm?ID=WA
23
24
Figure 3 shows the demographic breakdown for the central Puget Sound region reflected in the most recent 2010 Census. Approximately a third of the overall population identifies as a racial or cultural minority. Asians are the largest minority group, at 12%. Hispanics tied with Census responders that indicated “other” or “two or more races” as the next most prominent minority groups with 9% of the population each. Black (African American) residents of the region make up about 5% of the total population.
These statistics represent only the most recent snapshot of a central Puget Sound region that has become increasingly diverse. The central Puget Sound Region’s population grew rapidly in the last twenty years, increasing by 34% from 1990 to 2010 (see Table 4). During this period, the region diversified with the percentage of Whites decreasing from 87% of the population in 1990 to 73% in 2010. Persons of color doubled to about 27%, with fully 31% of the population in a minority, including white Hispanics (see Table 5 and Figure 4). The growth in diversity was due primarily to an increasing population of Asian/Hawaiian/Pacific Islander, Hispanics, and people who were “other” races/two or more races23. In the same period the percentage of Blacks and Native Americans in the region remained steady, making up approximately 5% and 1% of the population respectively in 1990, 2000, and 2010.
Table 5 also shows a significant and growing population in the region that is foreign born. Over the 20-year period, the proportion of the region’s population that had immigrated to this country nearly doubled to about 15%. Many of the most recent immigrants came here as refugees. In fact, Washington State ranked 9th in the United States with 909,312 of the country’s refugees (out of 40,377,860 nationwide)24.
Regional Population by Race 2010
Approximately a third of the overall population identifies as a racial or cultural minority⅓
Figure 3
Source: U.S. Census
WhiteBlack or African AmericanAmerican Indian or Alaska NativeAsian, Hawaiian, or Other Pacific IslanderSome Other Race (alone), or Two or More Races
73%
12%
5%
9%
1%
Total Minority: 31% Hispanic (any race): 9%
Race and Ethnicity
Fair Housing Equity Assessment for the Central Puget Sound Region | Section II: Regional Profile

Fair Housing Equity Assessment for the Central Puget Sound Region | Section II: Regional Profile 27
Due to changes in the way that the Census defines “people with disabilities” the statistics for 2000 and 1990 cannot be compared with the statistic for 2010.
25
Total Population
White
Black or African American
American Indian or Alaska Native
Asian, Hawaiian, or Other Pacific Islander
Some Other Race (alone), or Two or More Races
Hispanic/Latino (any race)
All Racial/Ethnic Minorities
Foreign-born
People with Disabilities25
Total Households
Households with Persons under 18 Years Old
Housholds with Persons 65 and older
2,682,265
198,617
40,859
435,876
333,325
325,162
1,151,923
556,992
376,399
1,454,695
461,382
295,410
3,690,942
2010
12%
57%
13%
152%
N/A
322%
181%
166%
N/A
36%
25%
44%
34%
% Change3,275,847
2,579,305
159,366
37,895
286,995
212,286
172,062
771,837
397,004
N/A
1,282,984
440,269
234,273
20002,748,895
2,385,511
126,607
36,279
172,846
27,652
77,019
409,403
209,717
N/A
1,071,424
370,105
205,586
1990
Regional Growth by DemocraticCategory 1990-2010
Table 5
Source: U.S. Census

Fair Housing Equity Assessment for the Central Puget Sound Region | Section II: Regional Profile 28
As the region as a whole has become more diverse, so has the geographic extent of minority communities expanded beyond what historically had been minority and mixed-race urban neighborhoods in central cities to other cities and communities along major transportation corridors in suburban areas. Figures 5, 6, and 7 illustrate that trend. Census tracts on the map shaded blue indicate areas where the percentage of minority residents exceeds 25%, with the darkest blue indicating over 50% (majority minority) neighborhoods.
In 1990, communities with high numbers of minority residents were primarily limited to central and southeast
neighborhoods of Seattle and Tacoma. By 2000, as overall minority populations in the region increased, so did the number and geographic spread of communities where minorities exceeded a quarter of the population, especially areas of south King County and further along the I-5 corridor. That trend continued and expanded to other parts of the region through the most recent census in 2010, by which time minority communities were even more evident throughout south King County through Tacoma, and, as a more recent trend, in Bellevue and Redmond in east King County, and also north along the I-5 corridor into Snohomish County.
Demographic Trends 1990-2010
1990
White (alone)
Black or African
American (alone)
American Indian or
Alaska Native (alone)
Asian, Hawaiian, or Other Pacific
Islander (alone)
Some Other Race, (alone)
or Two or More Races
Hispanic/Latino
(any race)
2000 2010
Figure 4
Source: U.S. Census

Fair Housing Equity Assessment for the Central Puget Sound Region | Section II: Regional Profile 29
Figure 5: Percent Minority by Census Tract, 1990
Minority residents primarily limited to central and southeast neighborhoods of Tacoma/Seattle
1990
2010
2000
Figure 6: Percent Minority by Census Tract, 2000
Minority populations increase, exceeded a quarter of the population, especially in King County area
Figure 7: Percent Minority by Census Tract, 2010
Minority communities more evident throughout King County and Tacoma, and in Bellevue, Redmond, and Snohomish County
Figure 5
Figure 7
Figure 6
Source: U.S. CensusSource: U.S. Census
Source: U.S. Census

Fair Housing Equity Assessment for the Central Puget Sound Region | Section II: Regional Profile 30
A trend toward more minority residents of the region living in more communities throughout the region is one indication, at least on a broad geographic scale, that the central Puget Sound region is becoming more integrated. Another way of depicting this trend is shown in the map of demographic change in Figure 8. Blue areas have increasing shares of minorities, yellow areas have decreasing shares. The map clearly shows that across the entire arc of suburbs surrounding the region’s
Source: U.S. Census
central cities, communities are generally becoming more diverse. However, the map also suggests that a more complex trend may be occurring in Seattle and other central city locations, where the proportional loss of minority residents may reflect displacement of historical communities in areas that have been experiencing gentrification. As well, the figure shows that the trend toward integration has apparently skipped over some neighborhoods, a factor that deserves further research.
Change in Minority Share of Population 2000-2010
Figure 8

Fair Housing Equity Assessment for the Central Puget Sound Region | Section II: Regional Profile 31
IncomeHousehold income is one key factor in determining where people live within the region. Overall, the central Puget Sound region has higher incomes compared with Washington State and the country as a whole (see Table 6). With the exception of Pierce County, all counties have incomes that are higher than the state median and all four counties are higher than that for the nation as a whole. Fewer people live in poverty in the region compared to the state and country as well with the percentage of households below the poverty line in all four counties falling below the state and national rates. While such comparisons provide important context, they do not tell the whole story of income in the region.
There is a strong relationship between income and race and ethnicity. Data for the four counties that comprise the central Puget Sound region reveal this disparity (see Figure 9). Income for blacks is the most disparate, with black households earning about half to a third less than what white non-Hispanic households earn. Hispanic households are also at a significant disadvantage in terms of income, earning a third to a quarter less than white non-Hispanics. The income picture for Asian households is mixed, with incomes for Asians on par with whites in King, Snohomish, and Kitsap counties and falling somewhat below the median income for white households in Pierce County.
Snohomish
King
Pierce
Kitsap
WA State
National
$67,777
$70,567
$58,824
$61,112
$58,890
$52,762
Median Household Income
% of Households Living Below Poverty Level
9.3%
10.5%
11.6%
9.8%
12.5%
14.3%
Median Income and Poverty by County2007-2011
Table 6
Source: American Community Survey (2007-2011 Estimates)

Fair Housing Equity Assessment for the Central Puget Sound Region | Section II: Regional Profile 32
Median Income and Race/Ethnicity by CountyFigure 9
Source: American Community Survey (2007-2011 Estimates)
$80,000
$70,000
$60,000
$50,000
$40,000
$30,000
$20,000
$10,000
$0
Total White, Non-Hispanic
Black Asian Hispanic
King CountyKitsap CountyPierce CountySnohomish County
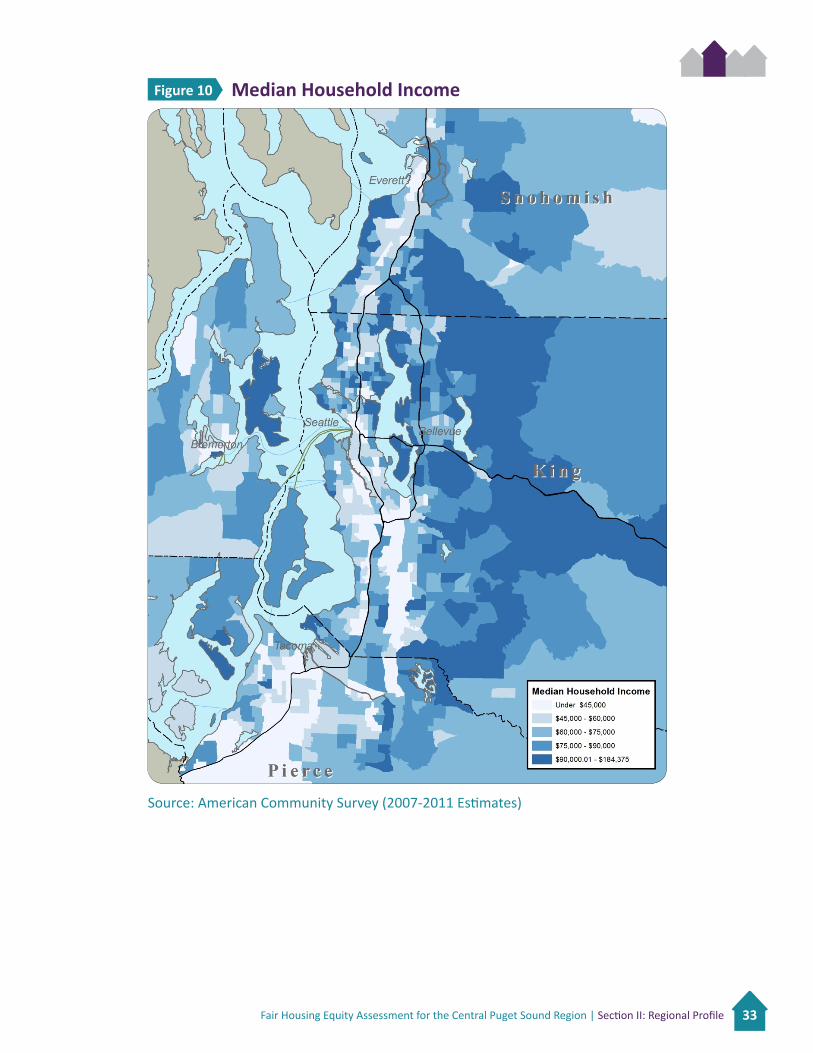
The costs of housing vary from city to city, neighborhood to neighborhood. Transportation becomes more costly for residents of areas that are far from employment centers and transit lines. These realities are reflected in the resulting distribution of income in the region. Figure 10 shows the median household income for census tracts throughout the central Puget Sound region. Darker shades of blue indicate higher income areas. The highest income areas are located along Puget Sound and Lake Washington as well as more broadly in east King County. The lowest income areas, on average, are in south King County and Pierce County. King County has the highest median income and the second highest percentage of households living below the poverty level, indicating that there is the largest income gap in King County between the highest earners and the number of people living in poverty.
Fair Housing Equity Assessment for the Central Puget Sound Region | Section II: Regional Profile 33
Source: American Community Survey (2007-2011 Estimates)
Figure 10 Median Household Income

Fair Housing Equity Assessment for the Central Puget Sound Region | Section II: Regional Profile 34
Racially/Ethically Concentrated Areas of PovertyAs defined by HUD, Racially/Ethnically Concentrated Area of Poverty (R/ECAPs) focus attention on the problematic intersection of poverty and race within single neighborhoods. A Racially/Ethnically Concentrated Area of Poverty is exactly what it sounds like, a neighborhood where there is extreme poverty and where the majority of the population is non-white. The technical definition used by HUD for R/ECAP is a census tract where 40% or more households in the tract live in poverty and more than 50% of the population is non-white.
Racial and ethnic income gaps are perpetuated and may widen in these neighborhoods for many reasons. Neighborhoods with concentrated poverty tend to have high crime rates, health disparities relating to close proximity to environmental hazards, stress, inadequate health care facilities, and poor quality food.26 Children who grow up in densely populated poor neighborhoods and attend low-income schools face barriers to academic and occupational achievement while children who live in mixed-income communities are less likely to drop out of high school and/or become pregnant as teenagers.27
The central Puget Sound region has four census tracts that qualify as R/ECAPs according to the HUD definition. Figure 11 shows the location and extent of census tracts that meet each of the thresholds established by HUD. The blue shaded areas are tracts where more than half of the population identifies in one or more minority groups. Consistent with the data presented earlier in this report, large areas of south Seattle and south King County, Tacoma and Pierce County, and selected tracts to the east and north of Seattle are “majority minority” communities.
A much smaller portion of the region is characterized by a rate of poverty that exceeds the federal threshold of 40%. Less than 1% of the region’s population lives in tracts that exceed this threshold. This finding is consistent with the regional context of relatively high incomes and strong employment markets. However, high regional
prosperity means that the disparity between well-to-do and impoverished neighborhoods is all the more marked.
In the whole region there are only four census tracts where 40% or more of the households live in poverty, thereby meeting HUD’s definition of “area of poverty”. However, all four census tracts also are 50% or more non-white. Essentially, the poorest areas in the region are racially concentrated.
Two of the R/ECAPs are in Seattle and two are in Tacoma. The R/ECAPs in Seattle are adjacent to one-another and together comprise portions of the Central Area and International District. The R/ECAPs in Tacoma are located in the Hilltop and Eastside neighborhoods. With respect to the historical context of racial discrimination, both the Central/International District in Seattle and the Hilltop in Tacoma were the two areas where people of color were historically segregated. The Tacoma Eastside neighborhood includes a large HUD affordable housing development, known as Salishan.28 The Seattle tracts include Yesler Terrace, a large public housing development planned for transformation to a mix-use, mixed-income district in the coming decades.
Jens Ludwig, Greg J. Duncan, Lisa A. Gennetian, Lawrence F. Katz, Ronald C. Kessler, Jeffrey R. King, and Lisa Sanbonmatsu, “Long-Term Neighborhood Effects on Low-Income Families: Evidence from Moving to Opportunity,” American Economic Review Papers and Proceedings 103, no. 3 (May 13): 226-231
Sharkley, Patrick. “Neighborhoods and the Black-White Mobility Gap,” Economic Mobility Project; The Pew Charitable Trusts. July 2009
“Salishan – History and Overview of the Redevelopment Effort,” Tacoma Housing Authority. May 1, 2013
26
27
28
the poorest areas in the region are the mostracially concentrated

Fair Housing Equity Assessment for the Central Puget Sound Region | Section II: Regional Profile 35
Figure 11 Racially/Ethnically Concentrated Areas of Poverty

Fair Housing Equity Assessment for the Central Puget Sound Region | Section II: Regional Profile 36
Total Population
White Alone
All Minorities
Black
Hispanic
Asian
Pacific Islanders
Native Americans
Two or More Races/Other
14,055
5,949
8,106
3,506
1,378
2,015
495
331
761
100%
42%
58%
25%
10%
14%
4%
2%
5%
Population and Demographics of R/ECAPs
Table 7As enumerated in Table 7, just over 14,000 people live in the four R/ECAPs, less than 1% of the total regional population. Nearly 3 in 5 of the residents of these four tracts is a member of a minority. Blacks are the most numerous minority group, at about a quarter of the population, followed by Asians and Hispanics.
Due to the relatively high household incomes prevalent in the region, there is value in looking beyond the HUD definition for R/ECAPs at tracts with somewhat lower rates of poverty, though well above the regional average. A total of 17 census tracts meet the more inclusive criteria of more than 25% of the households in poverty and more than 40% of the people minorities. These neighborhoods are located in south Seattle, Renton, and Kent in King County, and in Tacoma and south unincorporated Pierce County. A total of 77,630 people live in these areas.
For the purposes of this analysis, segregation is defined as an observed pattern of settlement within a region or community where people who belong to different racial or ethnic groups tend to reside in different neighborhoods. As will be discussed in this section, several measures can be used to analyze the overall degree of segregation within a region, locations where it is prevalent, and potential causes.
Segregation may be caused by a number of factors that fall into three categories: self-segregation, active segregation in the form of discriminatory practices or policies, and segregation that results from structural inequities in the society.
Positive residential preferences play a part in segregation in the form of self-segregation. Put simply, people do affirmatively consider the race of their neighbors when they choose a place to live. For example, immigrants often locate in places with significant co-ethnic populations, forming homogenous enclaves with shared cultural affinities and language. A local example is the International District with Seattle’s dense population of people from Asian countries and cultures. Studies have
shown that self-selection by other minority groups, such as blacks and Hispanics, also occurs. However, evidence suggests that self-segregation is only one of many factors shaping where people choose to and are able to reside.
Active segregation due to discrimination has occurred in multiple forms in the United States, both historically and up to the present. Overt barriers to residence, such as racial covenants and redlining, were used for many years to bar minorities from certain neighborhoods. The pattern of racial segregation enforced by such practices in the past is still evident in many neighborhoods in the region. Fortunately, the more overt forms of discrimination have been in decline, a factor that contributes to the demographic trends toward a more broadly diverse region illustrated in Figures 5-7.
an observed pattern of settlement within a region or community where people who belong to a different racial or ethnic groups tend to reside in different neighborhoods
Segregation:Measures of Segregation

Fair Housing Equity Assessment for the Central Puget Sound Region | Section II: Regional Profile 37
In addition to the effects of discrimination in the past, discriminatory real estate practices in the present continue to promote segregation in the region. More subtle forms of discrimination have been emerging in housing markets. Testing, Fair Housing Complaints, and jurisdictions’ analyses of impediments confirm that discrimination occurs in the region.29
Structural causes of segregation continue to have a pervasive effect across communities, whether or not self-segregation or discrimination are also at play. People are residentially sorted by economic status. High-priced neighborhoods as well as neighborhoods with limited rental housing fail to provide feasible housing choices for low- and-moderate income households. The role of housing affordability (or lack there-of) in segregation will be explored further in a later section. In the central Puget Sound region, as well as most metropolitan areas, socioeconomic status and race are linked (see Figure 9). The correlation between race and income translates to spatial segregation as people of color are concentrated in neighborhoods, in part, because of lower incomes.
The dissimilarity index is one measure used to assess the degree of segregation present in a community or region. The index measures segregation as the relationship between the pattern of residence of any two demographic groups (e.g., black – white). The calculated value of the dissimilarity index can fall between zero (0), which represents complete integration, and one (1) which represents complete segregation. Loosely interpreted, the index represents the percentage of one group that would need to move in order for each small area to match the composition of the larger region. Based on guidelines provided by HUD31, a dissimilarity index value of < 0.40
For more discussion about discrimination in housing see Section III: Fair Housing Infrastructure.
Ihlanfeldt, Keith R., and Benjamin Scafidi. “Whites’ Neighbourhood Racial Preferences and Neighbourhood Racial Composition in the United States: Evidence from the Multi-City Study of Urban Inequality.” Housing Studies 19 (3): 325–59. 2004. Woodward, Mikala. “Southeast Seattle Schools: World War II to Present.” Neighborhoods Southeast Seattle Community History Project: 1-3. 2011.
“FHEA Data Documentation,” HUD, 2013.
29
30
31
Forms of segregation can interact and reinforce each other as well. For example, self-segregation by whites in the form of “white flight” from central cities to suburbs shaped the demography of Seattle and many other cities in the second half of the 20th Century.30 However, the extreme segregation that often resulted from this phenomenon was accentuated by both active discrimination that barred minorities from living in suburban communities as well as public policy that limited the availability of housing types that would be affordable to lower income households. Because of the interaction of these factors, segregation is not a simple problem with a simple solution.
Segregation involves a host of issues that have a history of conflict and emotional impact for many people. The discussion of segregation in this report is not intended to blame individuals for segregation in communities in the region, nor to imply a preference for people to live where they do not want to live. The thrust of a fair housing perspective on the issues and recommendations for action moving forward is to ensure that people have choice in where they live. If someone wants to live in a certain area they should not be limited by their race, ethnicity, or status within other protected class.
Dissimilarity Indexindicates “low” levels of segregation, a value of 0.41 – 0.54 indicates “moderate” levels of segregation, and an index value of > 0.50 indicates “high” levels of segregation.
Using Census tract data from the years 2000 and 2010 for the 4-county central Puget Sound region, dissimilarity indices were calculated for five different demographic pairings: white-minority, white-black, white-Hispanic, white-Asian/Pacific Islander, and white-Native American. The results are shown in Table 8.

Fair Housing Equity Assessment for the Central Puget Sound Region | Section II: Regional Profile 38
White - Minority
White - Black
White - Hispanic
White - Asian/Pacific Islander
White - Native American
Low Segregation (<0.40)
Moderate Segregation (0.41-0.54)
High Segregation (>0.55)
2000
0.34
0.54
0.33
0.40
0.35
2010
0.32
0.50
0.34
0.39
0.36
Dissimilarity Index for Central Puget Sound Region2000 and 2010
Table 8
Overall, the dissimilarity index results describe a region that is characterized by low to moderate segregation and that has seen modest desegregation over the past decade. However, the data also indicate that some groups experience more segregation than others.
For whites vs. all minorities, a 2010 index of 0.32 is significantly below the HUD threshold of 0.40. The decline in the index from 2000 for all minorities shows a modest decrease in what was already a “low” level of segregation at that time. The situation for blacks, as a subset of that overall minority population, is quite different vis-a-vis segregation. In the year 2000, the white-black dissimilarity index was 0.54, just below the threshold that indicates “high” segregation. Over the ensuing decade, the white-black index declined to 0.50, a significant improvement, but still far above the HUD threshold of 0.40 for “moderate” segregation. Segregation between whites and Hispanics with an index value of 0.32 and 0.33 respectively for 2000 and 2010, is “low” but clearly not improving. In the year 2000, the dissimilarity index for whites-Asian/Pacific Islander stood at 0.40, just shy of what HUD would consider “moderate” segregation. By 2010, the index had declined slightly to 0.39. Finally, segregation between whites and Native Americans in the region also scores as “low” for both 2000 and 2010.
Source: U.S. Census, HUD, PSRC
The dissimilarity index is limited as a measure of segregation that may be experienced by more specific demographic subgroups than are reflected in the Census data. For example, “blacks” includes both descendants of African slaves and also more recent African immigrants; “Hispanic” applies to both white and non-white races and includes people with a variety of national origins; “Asian/Pacific Islander” is a very diverse category that includes people of widely varying cultures and national origins. The actual experience of any of these sub-groups may be substantially different than the larger group with respect to segregation and discrimination in our region, with those different experiences not reflected in these data.
A comparison of the dissimilarity index for this region with that for other peer regions nationally reveals that the Seattle metropolitan area offers a moderately segregated social landscape. Of the 318 metro areas ranked by the dissimilarity indices nationally, the Seattle-Bellevue-Everett area ranked 172nd for dissimilarity between whites and blacks (see Table 9), 207th between whites and Asians, and 157th between whites and Native Americans.32
The highest dissimilarity index in the Puget Sound region is between whites and blacks. However, in comparison with other metro areas of similar size (between 2-3 million) Seattle, Bellevue-Everett is doing very well, ranking 11th out of 12 in its dissimilarity index between whites and blacks.
http://www.censusscope.org/us/rank_dissimilarity_white_black.html32
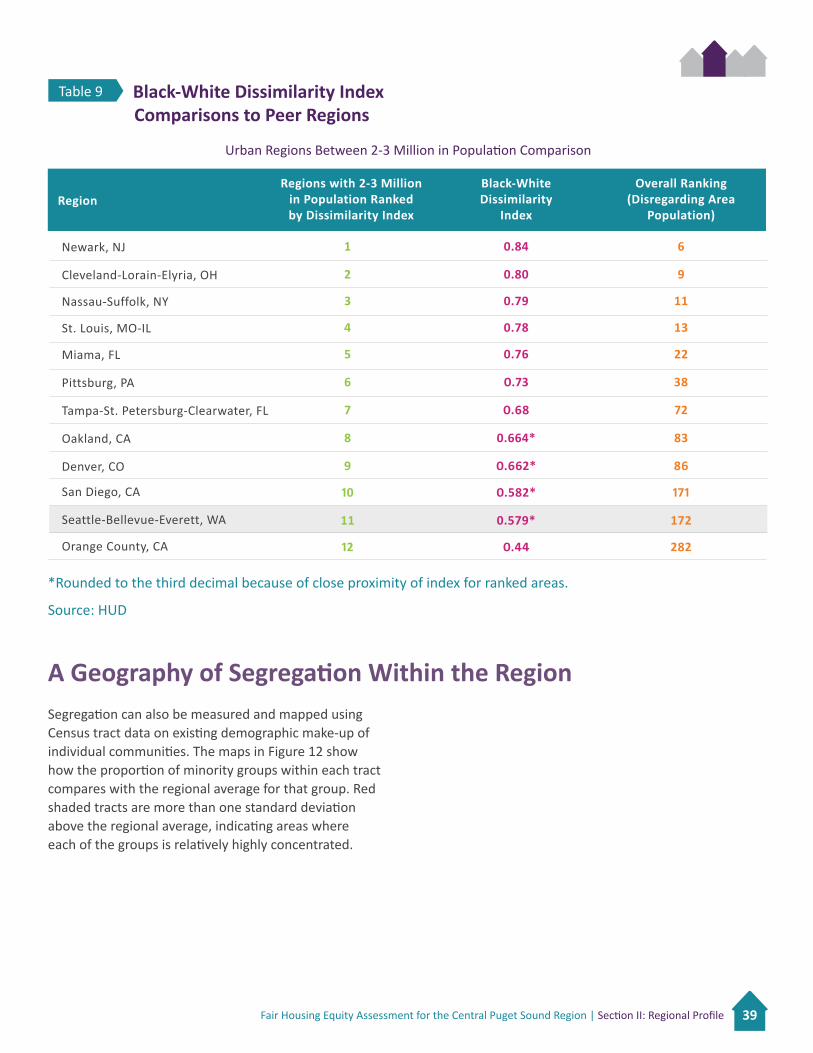
Fair Housing Equity Assessment for the Central Puget Sound Region | Section II: Regional Profile 39
Region
Newark, NJ
Cleveland-Lorain-Elyria, OH
Nassau-Suffolk, NY
St. Louis, MO-IL
Miama, FL
Pittsburg, PA
Tampa-St. Petersburg-Clearwater, FL
Oakland, CA
Denver, CO
San Diego, CA
Seattle-Bellevue-Everett, WA
Orange County, CA
1
2
3
4
5
6
7
8
9
10
11
12
Regions with 2-3 Million in Population Ranked by Dissimilarity Index
Black-WhiteDissimilarity
Index
Overall Ranking (Disregarding Area
Population)
0.84
0.80
0.79
0.78
0.76
0.73
0.68
0.664*
0.662*
0.582*
0.579*
0.44
6
9
11
13
22
38
72
83
86
171
172
282
Black-White Dissimilarity Index Comparisons to Peer Regions
Urban Regions Between 2-3 Million in Population Comparison
Table 9
*Rounded to the third decimal because of close proximity of index for ranked areas.
Source: HUD
A Geography of Segregation Within the RegionSegregation can also be measured and mapped using Census tract data on existing demographic make-up of individual communities. The maps in Figure 12 show how the proportion of minority groups within each tract compares with the regional average for that group. Red shaded tracts are more than one standard deviation above the regional average, indicating areas where each of the groups is relatively highly concentrated.

Fair Housing Equity Assessment for the Central Puget Sound Region | Section II: Regional Profile 40
Figure 12 Race/Ethnicity Concentrations
All Minorities
Blacks
Asians
Hispanics
Source: U.S. Census, PSRC

Fair Housing Equity Assessment for the Central Puget Sound Region | Section II: Regional Profile 41
In Figure 12, the map at upper left shows the share of total population identifying as a minority. With a regional average of 31% and a standard deviation of 16%, the areas of concentration (47% or higher) roughly align with the federal threshold of 50% minority for “areas of racial concentration” (see Figure 11). Existing concentrations are in southeast Seattle, south King County, Tacoma, and, to a lesser degree east King County and along the I-5 corridor in Snohomish County.
At lower left, blacks are shown to be highly concentrated in southeast Seattle, parts of south King County, Tacoma, and further south to Fort Lewis. With a regional average share of just over 5% of the population, blacks are the most highly concentrated racial group. Red shaded tracts indicate areas where the share of blacks is more than twice the regional average.
Another measure of segregation recommended for use by HUD is the Predicted Racial/Ethnic Composition Ratio. The ratio is one way to identify racial segregation, as opposed to income segregation, in communities throughout a region. This value distinguishes between socioeconomic and racial components of residential segregation by taking into consideration current household income characteristics for each community, and predicting the expected racial/ethnic composition of the community. The ratio represents the gap between the predicted and actual percentage of minorities in each community.
Some socioeconomic segregation is expected, based on the ability of different groups of people to afford high-priced real estate. With this in mind, it is possible to predict the racial make-up of the population that would be expected to reside in a jurisdiction based on the region’s income distribution by race and ethnicity. The predicted number of minority residents in a community can be determined by multiplying the incidence of minority persons for each income category by the number of people the jurisdiction has in each income category, and then summing the products.
The ratio helps identify the jurisdictions where minorities are underrepresented or overrepresented with respect to local income levels. If patterns of race segregation
At upper right, Asians are shown to be more broadly represented within the region, particularly in southeast Seattle, south and east King County, and Snohomish County. As the largest minority group in the region, Asians comprise people whose origins span across many parts of that continent, including China, Japan, Korea, southeast Asia, the Philippines, south Asia, and others. Within the overall geography of Asian peoples living in the region, communities of shared national origin are seen to cluster in particular areas (such as southeast Asians in central and southeast Seattle, or south Asians in east King County). Finally, the map at lower right shows that people of Hispanic origin reside primarily from south Seattle down through Tacoma, in the Lynnwood area of Snohomish County, and in selected tracts in east King County.
Predicted Racial/Ethnic Composition Ratiowere entirely the result of income segregation, that ratio would fall close to a value of 1. The extent to which the ratio diverges from 1 indicates that factors other than merely income are at play in determining where different races live. HUD recommends a threshold of 10% above (>110%) or 10% below (<90%) as indicating the influence of non-income factors.
The map in Figure 13 shows the results of this analysis, in which the Predicted Racial/Ethnic Composition Ratio was calculated for each city in the region. Appendix I lists each of the locations with ratio results.
The map suggests a pattern where generally, racial and ethnic minorities are “overrepresented” in centralized places and “underrepresented” at the periphery of the urban area, indicating that factors other than income have shaped the racial make-up of these places. The region’s most urban places, particularly along the southern part of the I-5 Corridor, are the areas where the predicted racial/ethnic composition is higher than expected based on income. The predicted racial/ethnic composition ratio is the lowest on average in the region’s smaller towns in rural and suburban areas and in the northern part of the I-5 Corridor. This is consistent with the demographic data insofar as until recently, suburban areas were populated mainly by whites. Though that

Fair Housing Equity Assessment for the Central Puget Sound Region | Section II: Regional Profile 42
trend is shifting towards more diversity, it is clear that suburban areas, particularly those that are far from the urban core, are still under-populated by people of color.
The analysis underscores that income alone does not explain why more minorities have not moved to suburbs, especially more outlying communities. However, it should be noted that the analysis does not indicate what factors other than income are at play, or specifically what factor discrimination may play in perpetuating the segregation. In addition, while the findings are significant for minorities as a whole, the experience of different racial and ethnic groups likely varies. Race vs. income data for individual groups, such as blacks and Hispanics, for whom other data suggest higher levels of segregation regionally, may show an even more disparate relationship between income and where those races live within the region.
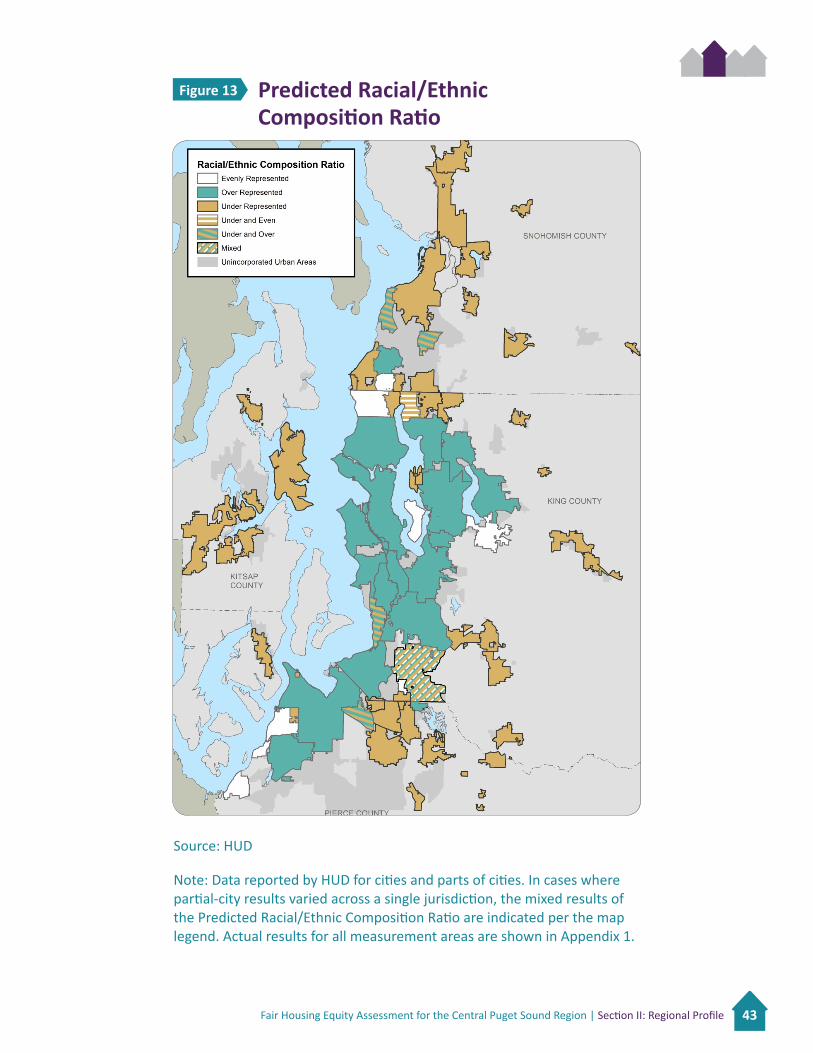
Fair Housing Equity Assessment for the Central Puget Sound Region | Section II: Regional Profile 43
Figure 13 Predicted Racial/Ethnic Composition Ratio
Source: HUD
Note: Data reported by HUD for cities and parts of cities. In cases where partial-city results varied across a single jurisdiction, the mixed results of the Predicted Racial/Ethnic Composition Ratio are indicated per the map legend. Actual results for all measurement areas are shown in Appendix 1.

Fair Housing Equity Assessment for the Central Puget Sound Region | Section II: Regional Profile 44
Access to Opportunity
Opportunity Defined in the Central Puget Sound Region
The demographic profile presented in the previous section discussed where people live within the central Puget Sound region—particularly people who have historically been actively discriminated against, such as racial and ethnic minorities. The profile revealed a historic pattern of moderate segregation that decreased to some extent in the most recent decade as minority populations moved out of historically segregated areas. This trend has led to greater racial/ethnic and income diversity in many—but not all—other areas of the region. Despite greater geographic diversity, patterns also indicate co-concentrations of minority and low income communities, suggesting that race/ethnicity and poverty still intersect.
This section builds on the demographic profile by examining how people live in different communities in the region. There are many critical community attributes and
In 2012, the Puget Sound Regional Council partnered with the The Ohio State University’s Kirwan Institute, through funding from the federal Partnership for Sustainable Communities and as part of the Growing Transit Communities Partnership work program, to analyze “Access to Opportunity” within the central Puget Sound region’s urban growth area.33 The Kirwan Institute defines “Access to Opportunity” as a situation or condition that places individuals in a position to be more likely to succeed or excel. Kirwan has worked with communities around the nation to take this broad concept and translate it into datasets that can be shown in spatial terms, creating maps that roughly portray the relative levels of “opportunity” across a region.
In the central Puget Sound region, a stakeholder and data-driven effort to refine that definition with specific measures tailored to this region resulted in a report and online mapping tool (available at http://www.psrc.org/growth/growing-transit-communities/
resources that support the opportunities for residents to thrive through access to housing, jobs, other services, and healthy environments. Understanding the presence of these conditions in different communities, including the disparity that exists between communities, provides context for the broader discussion of fair housing and housing choice in the region. The data underlying this framework can inform investments to improve the quality of disadvantaged neighborhoods, as well as expand access to advantaged neighborhoods for diverse populations.
regional-equity/opportunity-mapping/). The resulting Comprehensive Access to Opportunity Index is based on twenty community indicators, developed within topic areas as a series of maps to illustrate the geographic distribution of access to opportunity. As a result of this work, the Growing Transit Communities Strategy contains recommended strategies to improve conditions in areas with limited access to opportunity and increase housing choices and transportation access to areas with good access to opportunity. While the analysis does not provide insight on how previous public investments may have led to disparate access to opportunity across geographies or populations, it is a forward-looking tool that suggests which communities may benefit from future investments, such as improvements in infrastructure, job access, neighborhood safety and education quality.
Five sub-measures, each comprising several individual indicators, informed the Comprehensive Access to Opportunity Index. The sub-measures included: education,
For a complete explanation of the Opportunity Index and methodology used for the central Puget Sound region please see Equity, Opportunity, and Sustainability in the Central Puget Sound Region – Kirwan Institute and Puget Sound Regional Council Report May 2012 found: http://www.kirwaninstitute.osu.edu/reports/2012/05_2012_PugetSoundOppMapping.pdf
33

Fair Housing Equity Assessment for the Central Puget Sound Region | Section II: Regional Profile 45
economic health, housing and neighborhood quality, mobility and transportation, and health and environment. See Table 10 for a description of the five sub-measures and the individual indicators that informed each. Indicators include those that are impediments to opportunity (negative factors such as neighborhood crime index or percentage of the community that is within a food desert) or, conversely, sources of opportunity (positive factors such as access to living wage jobs and access to transit services).
A comprehensive opportunity score was then calculated for each census tract in the urban segments of the region. The results were divided into quintiles, classifying 20% of the population by census tract into five categories of
access to opportunity: low, very love, moderate, high and very high. These opportunity categories describe the relative access to opportunity in neighborhoods and communities throughout the region. The mapped index can be used to analyze other data of interest that pertain to equity in access to opportunity for all peoples in the region.
While the quintiles do not denote an absolute quantitative measure of the access to opportunity for any specific neighborhood or population, they do provide insight into how factors, such as geography, demographics and income, suggest varying levels of opportunity access, and highlight areas and populations that would benefit from future investments to improve access to opportunity.
Sub-Measure
EducationQuality of local schools and educational resources
Economic HealthProximity to, and participation in, the labor market
Housing and Neighborhood QualityThe health of neighborhoods and their housing stock and market
Mobility and TransportationResident mobility by different modes
Health and EnvironmentProximity to healthy open space and access to food
Reading Test Scores (4th Grade WASL)Math Test Scores (4th Grade WASL)Student Poverty RateTeacher QualificationsGraduation Rates
Auto and Transit Access Living Wage JobsJob Growth Trends 2000-2010Unemployment Rate
Housing Vacancy RateForeclosure RateHigh Cost Loan RateHousing Stock ConditionCrime Index
Transportation Commute CostProximity to Express Bus StopsAverage Transit Fare CostPercent of Commutes by Walking
Distance to Nearest Park/Open SpaceProximity to Toxic Waste ReleasePercent of Area With a Food Desert
Indicators
Central Puget Sound Region Comprehensive Access to Opportunity Index Sub-Measures and Indicators
Table 10
Source: Equity, Opportunity, and Sustainability in the Central Puget Sound Region Kirwan Institute and Puget Sound Regional Council Report May 2012
Central Puget Sound Region Comprehensive Access to Opportunity Index Factors

Fair Housing Equity Assessment for the Central Puget Sound Region | Section II: Regional Profile 46
Opportunity Distribution by GeographyMapping census tracts by Comprehensive Access to Opportunity Index (Figure 14) reveals geographic patterns of disparate access to opportunity across the region. As the map shows, areas near the central cities of Seattle and Bellevue and east King County generally have high and very high access to opportunity. Areas in south King County and Pierce County generally are characterized by moderate, low, and very low access to opportunity. To the north, areas of southwest Snohomish County are associated with mixed access to opportunity.
These data suggest a strong association between geography and access to opportunity, and major disparities among residents of different parts of the region. The findings highlight areas that would benefit from public investments to improve opportunity, as well as areas that would benefit from housing and transportation improvements to allow greater access for residents of low access to opportunity areas to those areas of higher access to opportunity.

Fair Housing Equity Assessment for the Central Puget Sound Region | Section II: Regional Profile 47
Source: Equity, Opportunity, and Sustainability in the Central Puget Sound Region Kirwan Institute and Puget Sound Regional Council Report May 2012
Figure 14 Comprehensive Opportunity Map for the Central Puget Sound Region

Fair Housing Equity Assessment for the Central Puget Sound Region | Section II: Regional Profile 48
Opportunity Distribution by DemographicsDue to persistent segregation within the region, not all groups of people have equal access to opportunity. Figures 15, 16, and 17 present the correlations between opportunity distribution and demographic group, poverty, and the intersection of poverty and race.
Figure 15 presents the levels of access to opportunity for seven demographic groups (six racial/ethnic groups, plus persons with disabilities). As a point of comparison the distribution across the total population is also given (by 20% quintiles, as noted above). The groups are shown in descending order from the group with the highest percentage of residents living in areas of high or very high access to opportunity (whites), to the group with the lowest percentage of residents living in areas of high or very high access to opportunity (blacks).
The data suggest that white and minority residents alike live in areas of varying access to opportunity, from very low opportunity to very high opportunity. Among racial and ethnic groups, however, whites and Asians are more likely to live in census tracts with high or very high access to opportunity than the total population. Meanwhile, foreign-born, American Indian, Hispanic and African American residents are more likely to live in census tracts with low or very low access to opportunity than the total population. Over half of the populations of American Indian, Hispanic and African Americans live in areas of low or very low access to opportunity.
Opportunity Distribution by Demographic GroupFigure 15
100%
90%
80%
70%
60%
50%
40%
30%
20%
10%
0%
High and Very High Moderate Very Low and Low
Whites
42.5%
20.6%
36.9%
Asian
43.5%
18.1%
38.3%
Total Population
39.9%
19.9%
40.2%
Foreign-Born
40.2%
18.1%
41.7%
Disabled
36.3%
20.0%
43.7%
American Indian/
Alaska Native
27.0%
19.4%
53.7%
Hispanic
27.3%
18.7%
54.0%
African American
25.2%
17.8%
57.0%
Source: Equity, Opportunity, and Sustainability in the Central Puget Sound Region Kirwan Institute and Puget Sound Regional Council Report May 2012

Fair Housing Equity Assessment for the Central Puget Sound Region | Section II: Regional Profile 49
Figure 16, below, shows the intersection of opportunity with poverty. Approximately half of all people living in poverty and households receiving some form of public assistance are located in areas with low or very low access to opportunity, relative to only 40% of the total population living in areas with low or very low access to opportunity.
Figure 17 further explores the intersection of poverty and race in the distribution of access to opportunity. The data demonstrate that for those living below poverty, race is associated with different levels of access to opportunity. For example, blacks living below poverty are nearly twice as likely to live in areas of low or very low access to opportunity as whites living below poverty level (32.4% versus 17.5%). Furthermore, whites and Asians living below poverty are more likely to live in areas with high or very high access to opportunity as the total population (42.6% and 43.5%, respectively, versus 40% for the total population).
Opportunity Distribution and Poverty
Figure 16
100%
90%
80%
70%
60%
50%
40%
30%
20%
10%
0%Below
PovertyPublic
Assistance
High & Very High
Moderate
Very Low & Low
105,866 32,384
55,83923,458
163,516 60,828
Opportunity Distribution by Race and PovertyFigure 17
100%
90%
80%
70%
60%
50%
40%
30%
20%
10%
0%
Very High
Moderate
High
Low
Very Low
Whites
21.4%
20.6%
21.2%
17.5%
19.4%
African American
13.4%
17.8%
11.8%
32.4%
24.6%
American Indian/
Alaska Native
12.9%
19.4%
14.1%
29.4%
24.3%
Asian
21.2%
18.1%
22.3%
20.0%
18.3%
Hispanic
12.2%
18.7%
15.1%
27.0%
27.0%
Source: Equity, Opportunity, and Sustainability in the Central Puget Sound Region Kirwan Institute and Puget Sound Regional Council Report May 2012
Source: Equity, Opportunity, and Sustainability in the Central Puget Sound Region, Kirwan Institute and Puget Sound Regional Council Report May 2012

Fair Housing Equity Assessment for the Central Puget Sound Region | Section II: Regional Profile 50
Implications of Inequitable Access to OpportunityMeasuring access to opportunity is a useful tool to evaluate current conditions of neighborhoods on attributes and resources that promote life success, and compare how geographies and populations differ in relative opportunity access. While the analysis does not measure what historic trends or investments have led to current conditions, it may be used to inform future public investments to improve access to opportunity for geographies or populations with relatively lower access today, as well as improve housing and transportation choices in areas of higher access to opportunity to give more opportunities for people to live and work in those areas. Two important observations may be drawn from the Access to Opportunity tool:
• First, the tool clearly demonstrates that race and income are associated with disparate levels of access to opportunity in the region. With the exception of Asians, racial/ethnic minorities are more likely to live in areas of low or very low access to opportunity, as are lower income households. Race and income interact such that racial/ethnic minorities living below poverty are more likely to live in areas of low or very low access to opportunity than indicated by race and income separately.
• Second, there are specific geographic areas of the region that correspond to lower access to opportunity—particularly communities in south King County, Pierce County, and portions of southwest Snohomish County. These areas would likely benefit from investments to improve access to quality education, economic health, housing and neighborhood quality, mobility and transportation, and health and environment. Investments in transportation linkages, particularly transit, can help to provide that access by connecting these areas with part of the region that have high access to opportunity.

Fair Housing Equity Assessment for the Central Puget Sound Region | Section II: Regional Profile 51
Addressing Fair Housing and Opportunity Through Housing and Transportation Infrastructure
Housing OverviewThe central Puget Sound region has a population of approximately 3.7 million. Available to house those residents are more than 1.5 million housing units. 60% of those units are single-family detached homes. 40% are units in buildings with more than one dwelling unit, including apartments and condominiums. Of the total housing units in the region, 62% are owner-occupied and 38% are renter occupied. The type and tenure of the housing stock plays a critical role in determining whether low or even moderate income households34 can afford to live in a community. Rental housing and multifamily dwellings tend to be more affordable for households of limited resources.
Table 11 shows how the housing stock is distributed across neighborhoods with respect to the percent minority in that neighborhood. Census tracts were classified based on the percent minority relative to the regional minority share of 31% of the total population. Tracts that fell between 23% and 39% minority (1/2 standard deviation around the mean) will be referred to as “integrated” because they most closely mirror the demographic mix at large. About a third of the regional
Two key aspects of the built environment—housing and transportation—are essential to achieving fair housing goals and ensuring equitable access to opportunity in the central Puget Sound region. Housing, especially the availability of housing that is affordable to households earning a full range of incomes, determines who can and who can’t live in a community. Lack of housing affordability may be a barrier to protected classes, many of whom are lower income, being able to live in communities with good access to opportunity. Transportation investments knit
the region together, connecting residences with places of employment, services, education, and recreation. Maintaining and improving the region’s roadways, transit networks, and pedestrian and bicycle facilities can increase access to opportunity and enhance community value. This section will briefly address key data indicators of the intersection of housing and transportation systems with fair housing and opportunity in the region.
population resides in “integrated” tracts. Tracts above and below this range will be called “segregated white,” “somewhat segregated white,” “somewhat segregated minority,” and “segregated minority,” depending on how far from the mean the minority share in those census tracts is. Approximately one out of six people in the region lives in a “segregated minority” census tract.
The PSRC has adopted definitions for “low income” up to 50% of area median income and “moderate income” up to 80% of area median income.34
Population of the Puget Sound Region
Minority of the Puget Sound Region
3.7M31%

Fair Housing Equity Assessment for the Central Puget Sound Region | Section II: Regional Profile 52
Population
Housing Units
% Single-Family
% Owner Occupied
< 15%
551,176
231,320
80%
81%
15%-23%
799,297
347,849
67%
69%
23%-39%
1,278,417
551,685
57%
61%
39%-47%
413,246
174,818
50%
52%
>47%
648,806
264,990
45%
46%
Segregated White
SomewhatSegregated
White
SomewhatSegregated
MinorityIntegrated Segregated
Minority
Existing Housing Stock and Racial Segregation
Percent Minority Population Per Census Tract
Table 11
Source: U.S. Census, PSRC
Segregated white neighborhoods tend to have housing that is predominantly single-family and owner-occupied. Segregated minority communities tend to have housing that is mixed single family - multifamily and mixed tenure as well. This finding, while unsurprising, has several implications. First, it
The cost of housing has an enormous effect on where people of different races and ethnicities can live within the region. In particular, as shown in Figure 9 on page 26, blacks and Hispanics earn significantly lower incomes, on average, than other demographic groups. Housing markets vary across the region,
Housing Cost
underscores the importance of housing tenure and type in accommodating minority households, which generally have lower incomes than white households. Second, the data suggest that regulatory or market practices that shape the type and tenure of housing in a community can effectively limit the minority population.
including both the price of ownership housing and prevailing rents. The maps in Figures 18 and 19 show how median home values and rents vary widely from jurisdiction to jurisdiction, revealing marked sub-regional patterns. Table 12 below provides benchmarks against which to compare the values shown in the maps.
King/Snohomish
Kitsap
Pierce
$85,600
$71,900
$69,600
$301,000
$247,200
$238,100
$1,284
$1,079
$1,044
Area Median Income (AMI)
Affordable Purchase Price at AMI
Affordable Rent at 60% of AMI
Housing Affordability BenchmarksTable 12
Source: PSRC

Fair Housing Equity Assessment for the Central Puget Sound Region | Section II: Regional Profile 53
The maps in figures 18 and 19 illustrate dramatic disparities in the cost of housing across the region. Home values in central and eastern King County, including the City of Seattle and Eastside cities, are significantly higher than what would be affordable to a household earning the area median income. Homes in east King County
cost more than twice what homes cost in south King County, and especially Pierce County and other outlying areas. Rents show a similar disparity, with especially high rents in east King County.35 Most important, generally, the areas with higher housing costs are areas of the region with greater access to opportunity.
Figure 18
The reported rent amounts for Seattle may be skewed lower by two factors: concentration of smaller units and concentration of subsidized apartments in the city35
Median Home Values by City
Source: American Community Survey (2007-2011 Estimates)

Fair Housing Equity Assessment for the Central Puget Sound Region | Section II: Regional Profile 54
Figure 19 Median Rental Rates
Source: American Community Survey (2007-2011 Estimates)

Fair Housing Equity Assessment for the Central Puget Sound Region | Section II: Regional Profile 55
The cost of transportation compounds the cost burden to low and moderate income households of living in any particular community. The Housing + Transportation Affordability Index is a tool that has been developed by the Center for Neighborhood Technology to measure how the proportion of income a typical household spends on housing and transportation costs based on market factors and access to mobility choices. The variables used to determine this transportation cost index include residential density, walkability, transit access, and employment access of the block group, the costs to own/operate a car, and the costs to ride transit. Housing costs are considered affordable if they are less than 30% of a household’s income. An area is considered affordable for housing + transportation costs if a household uses less than 45% of their income.
In the central Puget Sound region, the Housing + Transportation Index calculated for Census tracts shows
In any community, market-rate housing cannot meet the needs of all households at all income levels. Housing assistance, currently and for the foreseeable future, is essential to providing housing access to many people in the central Puget Sound region. Yet another way to understand the distribution of access to opportunity is to overlay housing assistance data with the Comprehensive Access to Opportunity Index results. Figure 20, below, indicates the relationship between several measures of housing need and assistance, such as Section 8 voucher use and subsidized units, and distribution of access to opportunity. The distribution of total units and cost burdened households across opportunity categories is provided for context.
Housing + Transportation Affordability Index
Opportunity Distribution and Housing Assistance
that 38% of neighborhoods are cost burdened for a household earning area median income by housing costs only, while 67% of neighborhoods in the region are housing + transportation cost burdened for such households. The Housing + Transportation cost burden for “moderate-income” households in the region (those households whose income equals 80% of the regional median, or in other words, poorer households) are even heavier. Moderate income households are cost burdened in their housing costs in 62% of neighborhoods and cost burdened in 92% of neighborhoods for housing + transportation costs. Due to the correspondence between income and race, the Housing + Transportation cost burden falls especially heavily on non-white households. This indicates that transportation is a significant cost to households in the region. For more details on this tool, visit http://htaindex.cnt.org/map/.
The data show that over half of households using Section 8 vouchers live in areas of low or very low access to opportunity. Only 30% of Section 8 vouchers are used in areas of high or very high access to opportunity. This figure is below the 40% benchmark that would indicate proportional distribution within the region and perhaps even further behind the level of usage in communities with good access to opportunity that would be necessary to remedy existing racial inequities. The distribution of subsidized units across opportunity categories closely matches the total housing stock. However, the majority of subsidized units36 in areas with high or very high access to opportunity are located in and around downtown Seattle, with relatively
As part of the Growing Transit Communities work, PSRC compiled a mapped database of of subsidized housing units. The data includes dwellings (single-family homes or apartments) where the prices are kept affordable by a contract between a funding agency or local government and the property owner for a defined period of time. Affordable prices may be a percentage (usually 30%) of the income of the actual occupant, or set at 30% of an established level of the area median income (e.g., 50%, 60%, or 80% of AMI) regardless of the occupant’s income; in any case, the units are reserved for moderate-, low-, or very low-income households. Most of these units have received cash subsidies, low-interest loans, tax breaks, land, or other direct financial benefits, but some are “subsidized” by land use incentives, such as density bonuses. The list does not include group homes or count individual beds, as in assisted living facilities.
36

Fair Housing Equity Assessment for the Central Puget Sound Region | Section II: Regional Profile 56
fewer subsidized units in outlying neighborhoods of the city and especially in high opportunity suburban communities. If the region adopts a goal of increasing mobility of subsidized housing residents to high opportunity areas, then the benchmark for evaluating the fair housing impacts of subsidized units would not be proportional distribution, but rather an increased proportion of subsidized units in those communities.
Opportunity Distribution and Housing Assistance37Figure 20
100%
90%
80%
70%
60%
50%
40%
30%
20%
10%
0%
High and Very High Moderate Very Low and Low
Total Units
546,475
238,055
461,551
Cost Burdened
209,492
94,760
199,219
Vouchers
7,807
4,706
13,500
HUD Units
23,549
8,625
18,968
Subsidized Units
32,017
16,797
31,336
Note that “Total Units” does not equate to total population, and therefore the opportunity distribution by units does not fall into the same equal 20% quintiles as does the total population.
37
Regulatory Context for Fair Housing and OpportunityThe housing stock is not fixed; it changes over time with new development and redevelopment. The type of housing that can be built in any given location is determined by local plans and zoning. The type of housing developed (single-family detached, townhomes, apartments, condominiums) is highly correlated with the cost of housing and tenure (rent vs. own), both
of which are crucial to determining whether lower or even moderate income households can obtain housing in a community, and particularly housing in communities which offer high access to opportunity.
Figure 21 shows how the planned future housing stock is distributed across areas that are currently in the five

Fair Housing Equity Assessment for the Central Puget Sound Region | Section II: Regional Profile 57
opportunity categories. The housing units and types shown in this figure represent what the housing in the region would look like if all the land uses identified in local comprehensive plans were realized through new development. The state Growth Management Act requires consistency between the plans these data are based on and zoning. Potential future housing units are divided into four categories based on density:
• Large-lot single family (< 4 dwelling units per acre); lot size is associated with higher home prices
The following observations can be made from these results:
• Across very low opportunity areas of the region, plans and zoning call for housing that is primarily small-lot single-family and high-density multifamily. While much of the single-family potential has already been realized through past development, high-density multifamily is almost entirely future potential. The equity impacts of implementing the planned housing will be shaped by the cost of any new higher density housing and the degree to which existing affordable housing units are displaced with new development and upward market pressure.
• Across low and moderate opportunity areas of the region, plans and zoning call for housing that is primarily small-lot single-family and moderate
• Small-lot single family (4 – 10 dwelling units per acre); homes on urban-sized lots are generally less expensive
• Mid-density multifamily (10 – 50 dwelling units per acre); housing in this density range is generally less costly to build because it can be done with all wood frame construction
• High-density multifamily (>50 dwelling units per acre); building types that achieve higher densities likely to require more expensive materials and engineering, such as concrete podiums and steel frame construction
density multifamily. Again, the small-lot single-family is primarily existing housing stock. Much of the moderate density housing in these opportunity categories is also existing stock, with potential for further infill of the types of multifamily construction that provide the best opportunities for affordability.
• Emphasis on high density multifamily housing to accommodate future growth increases for high opportunity areas and especially for very high opportunity communities, where more than half of the housing will be in this densest category. Without significant subsidy, high-density multifamily presents challenges to providing units that are affordable to low and even moderate income households.
Planned Housing Stock and OpportunityFigure 21
70%
60%
50%
40%
30%
20%
10%
0%
Very Low Opportunity
Low Opportunity
Moderate Opportunity
High Opportunity
Very High Opportunity
Large LotSmall LotMulti-FamilyHi-Density
Source: PSRC

Fair Housing Equity Assessment for the Central Puget Sound Region | Section II: Regional Profile 58
Transportation Infrastructure InvestmentsAmong public investments, transportation infrastructure and services can have significant impacts, both positive and negative, on communities throughout the region. Transportation improvements can increase access to jobs and services, and generally enhance safe and convenient travel by automobile, transit, and non-motorized modes of travel such as walking and biking. Increased access and improved circulation can increase the attractiveness and market value of real estate. Such investments can spur private investment in development of housing, places of employment, and community-serving retail and other businesses. Transportation investments can disadvantage communities as well, such as through physical or market-driven displacement of people and businesses, or by creating barriers within neighborhoods.
PSRC has undertaken several recent efforts that address equitable impacts of transportation investments.
Transportation 2040, the regional transportation plan, was adopted by PSRC in 2010. As part of that effort, an environmental justice analysis of the plan was done pursuant to the Title VI requirements of the Civil Rights Act. The planning process generated five alternatives, along with a preferred alternative, for consideration by PSRC’s boards. As part of the environmental justice analysis, PSRC estimated the net annual benefits to transportation system users generally, and also specifically to poor and minority users within the region. The analysis found that the Preferred Alternative outperformed all of the other alternatives. The analysis also showed that benefits to poor and minority transportation system users were higher than benefits accrued by users generally. Geographic areas with higher percentages of low-income and minority populations were found to have greater user benefits than the region as a whole. Figure 22 below shows the results of this comparative modeling exercise.
Perhaps the most significant impact of the plan on equitable outcomes is the emphasis on transit. Transportation 2040 calls for significant expansion of transit service in the region over the next 30 years, including approximately $100 billion in improvements to commuter rail, light rail, streetcar, and bus transit infrastructure and service levels. Poor and minority households tend to rely more heavily on transit for daily travel to jobs, services, and other activities.
Many poor and minority households lack access to an automobile, rendering them completely transit dependent. People with disabilities are uniquely dependent on transit and paratransit services, both of which would be expanded under Transportation 2040.
In contrast to the long-range plan to expand transit in the region, recent and ongoing financial challenges have significantly reduced, and are threatening to reduce, transit service in King, Pierce, and Snohomish counties. Despite the fact that the bus transit agencies for each of the counties (King County Metro, Pierce Transit, and Community Transit) have adopted policies and procedures to mitigate impacts of any transit cuts on transit dependent populations and are subject to Title VI requirements, as a general observation, transit cuts disproportionally impact protected classes due to their greater dependence on transit.

Fair Housing Equity Assessment for the Central Puget Sound Region | Section II: Regional Profile 59
(Millions of 2008 Dollars)
Low-Income Populations
Minority Populations
$141
$180
$244
$290
$328
$378
$252
$320
$158
$197
$692
$747
$876
$946
Alt 1 Alt 2 Alt 3 Alt 4 Alt 5
Preferred Alternative Constrained
(PA-C)
Preferred Alternative
(PA)
Annual Benefits to Environmental Justice Populations
Changes in Total User Benefits Per Personal Trip from 2040 Baseline
Environmental Justice Analysis of Transportation 2040Figure 22
$3.50
$3.00
$2.50
$2.00
$1.50
$1.00
$0.50
$0
Poverty Populations
Minority Populations
Region
Alt 1
Alt 5
Alt 2
PA-C
Alt 3
PA
Alt 4
As one means to implement Transportation 2040 through shorter-term investments, PSRC funds selected transportation projects throughout the region through its Regional Transportation Improvement Program (TIP). Like Transportation 2040, the TIP is subject to the requirements of Title VI, with an environmental justice analysis conducted with each funding cycle. The results of this analysis for the most recent 2013-2016 TIP provide more information on the benefits and impacts of transportation improvements for low-income and minority households.
Unlike the analysis performed for Transportation 2040, which looked at the net benefits of future transportation improvements through the year 2040, the environmental justice analysis for the 2013-2016 TIP looked at the impacts of past investments made since 1992. The maps in figures 23 and 24 shows the location of TIP funded projects
over the past 20 years in relationship to concentrations of poor and minority populations respectively. For the purpose of this analysis, proximity to a project was assumed to indicate a net benefit to residents of the communities where the improvements were located.
Source: Transportation 2040 Final Environmental Impact Statement, PSRC 2010

Fair Housing Equity Assessment for the Central Puget Sound Region | Section II: Regional Profile 60
Figure 23 Environmental Justice Analysis of 2013-2016 TIP (Minorities)
Source: 2013-2016 Regional TIP Documentation, PSRC 2013

Fair Housing Equity Assessment for the Central Puget Sound Region | Section II: Regional Profile 61
Figure 24 Environmental Justice Analysis of 2013-2016 TIP (Low Income Households)
Source: 2013-2016 Regional TIP Documentation, PSRC 2013

Fair Housing Equity Assessment for the Central Puget Sound Region | Section II: Regional Profile 62
Overall, TIP funded projects were found to benefit both minorities and low-income households at a marginally higher level than they have benefited the regional population as a whole. For example, of the people residing in the census blocks shown in Figure 23 that were touched by TIP-funded projects, approximately 35% are minority, slightly higher than the regional minority share of about 31%.
The analysis also looked at benefits of projects by project type. The TIP-funded projects can be classified as one of the following:
• General purpose capacity
• High occupancy vehicle capacity
• Intelligent transportation systems
• Nonmotorized
• Other roadway
• Rehabilitation
• Transportation demand management
• Transit
• Planning
Across nearly all project types, communities benefiting from the improvements or projects were equitably divided with respect to minority and income status. A small number of planning projects did not achieve the same level of equity, a finding which may be due to locations for new corridor facilities in suburban parts of the region.
Fair Housing Equity Assessment for the Central Puget Sound Region | Section III: Fair Housing Infrastructure 63
Section III: Fair HousingInfrastructure
Overview
Analyses of Impediments to Fair Housing Choice in the Central Puget Sound Region
The purpose of this section is to provide an overview of key fair housing court decisions and to identify the fair housing resources available in the region, and to evaluate whether there is systemic discrimination and corresponding barriers to fair housing choices in the central Puget Sound Region. Systemic discrimination involves a pattern, practice or policy where the alleged discrimination has a broad, long-term impact on a group, industry, or geographic area. In order to identify the most common fair housing issues in the region, the following discussion will review data from recent litigation, discrimination complaints, testing audits, analyses of impediments from jurisdictions within the region, Home Mortgage Disclosure Act (HMDA) data, foreclosure data, and public surveys and direct input from the community. In areas where impediments to fair housing choice have been identified, the discussion will turn to how to take action to address them.
In 1995, HUD released guidance on how to further fair housing across the country. Simply put, the guidance stated that recipients of federal housing funds were required to ensure equal housing opportunity and to affirmatively further fair housing. As part of those requirements entitlement jurisdictions who received federal housing funds needed to conduct an analysis of impediments to fair housing choice in addition to an action plan to address the impediments in order to receive their funding38.
In the Central Puget Sound Region there are fourteen entitlement jurisdictions including Snohomish, King, Pierce and Kitsap Counties, Seattle, Tacoma,
In late 2013 or early 2014 changes to the requirement to affirmatively further fair housing are anticipated in the form of a new rule. The proposed changes include changing the requirement for an “Analysis of Impediments to Fair Housing Choice” for each entitlement jurisdiction to the option of conducting analyses through a more regional approach.
38
Bellevue, Bremerton, Everett, Lakewood, Kent, Marysville, Auburn, and Federal Way. The Analyses of Impediments to Fair Housing Choice for these entitlement jurisdictions were reviewed, and barriers of a regional nature are summarized in Table 13 below.

Fair Housing Equity Assessment for the Central Puget Sound Region | Section III: Fair Housing Infrastructure 64
Rental Housing
For Sale Housing
Fair Housing Resources
• Disability, race/color, national origin, and familial status are the most common fair housing complaints. • The majority of fair housing complaints involve rental units.• Lack of just cause eviction protection in many areas of the region may disguise discriminatory terminations of tenancy.• Landlord screening processes can have discriminatory impacts on protected classes.• Some homeless housing programs and shelters do not allow single father or two parent households• Occupancy restrictions often have discriminatory impact on families with children • Fear of retaliation is common for immigrant populations and other protected classes
• The denial and withdrawal rate of all homeownership loan products is higher for blacks, Hispanics, and Native Americans than for whites.
• Asians, in some entitlement jurisdictions, have better access to loans than Whites.• FHA lending is concentrated among Hispanic households. • Protected classes have greater vulnerability to foreclosures and potential decline in home values.
• Housing consumers and providers lack sufficient up to date information on fair housing laws, where to file a complaint, and how to address a reasonable accommodation.
• Public officials, policy makers, residents, housing providers and the general public are poorly informed on fair housing protected classes and applicable laws.
• Lack of fair housing documents translated into different languages creates a barrier for housing consumers for whom English is not their first language and for housing providers who have difficulties with their housing related interactions.
• Funding for fair housing education is not sufficient to meet the need
A List of the Region’s Most Common Barriers to Fair Housing Choice
Table 13
Source: Analyses of Impediments to Fair Housing Choice prepared by Snohomish, King, Pierce and Kitsap Counties, Seattle, Tacoma, Bellevue, Bremerton, Everett, Lakewood, Kent, Auburn, and Federal Way

Fair Housing Equity Assessment for the Central Puget Sound Region | Section III: Fair Housing Infrastructure 65
Fair Housing Enforcement
U.S. Department of Justice
HUD Fair Housing and Equal Opportunity Office
Enforcement of fair housing law at the federal level is overseen by the U.S. Department of Housing and Urban Development (HUD) and the Department of Justice (DOJ). Discrimination against a person in a protected class under state or local laws is enforced by an agency certified by HUD as part of one of its Fair Housing Assistance Programs (FHAP agencies). FHAP-certified enforcement agencies have equivalent enforcement powers as HUD and DOJ within their jurisdictions.
The Housing and Civil Enforcement Section of the United States Department of Justice has broad authority under the Fair Housing Act. Through this section, DOJ brings cases that allege a pattern and practice of discrimination or the denial of fair housing that raise an issue of general public importance. This authority includes the duty to investigate complaints, and the discretion to file both cases involving the legality of
The fair housing enforcement process typically begins when an individual files a discrimination complaint with either HUD’s Office of Fair Housing and Equal Opportunity (FHEO) or a state or local governmental fair housing enforcement agency (FHAP agency). Many of these complaints are referrals by private nonprofit fair housing organizations that conduct testing and investigation of housing discrimination allegations.
The enforcement process is intended to provide an impartial investigation of claims filed with HUD and FHAP agencies. The Fair Housing Act requires that complaints be investigated within 100 days if feasible. There is also a statutory obligation to engage in conciliation efforts to attempt to resolve complaints. At the close of the investigation, the investigating agency
state or local regulations related to housing. These cases may be adjudicated either through administrative law judges or litigated in federal court. Department of Justice cases brought by the Division can have industry-wide impact in terms of deterrence and reform.39
For more background on federal fair housing enforcement, see “The Future of Fair Housing: Report of the National Commission on Fair Housing and Equal Opportunity http://www.civilrights.org/publications/reports/fairhousing/enforcement-hud.html
39
makes a determination as to whether or not there is reasonable cause to believe that discrimination has occurred. If a determination of reasonable cause is made, the government charges the respondent with violating the law and brings a complaint on behalf of the complainant in an administrative hearing before a HUD administrative law judge or a judicial proceeding.
The enforcement process is intended to provide an
impartial investigation of claims filed with HUD and FHAP agencies.

Fair Housing Equity Assessment for the Central Puget Sound Region | Section III: Fair Housing Infrastructure 66
Fair Housing Initiatives Program (FHIP)Fair housing organizations and other non-profits that receive funding through the Fair Housing Initiatives Program (FHIP) assist people who believe they have been victims of housing discrimination.
In addition to assisting people who may have experienced discrimination with their fair housing complaints, FHIP programs also conduct investigation of claims, including “testing” properties for housing discrimination. Testing refers to the use of “testers” who pose as prospective renters or purchasers of homes in order to collect housing information. Some of the testers are in a protected class and some are not. The purpose of collecting this information is to determine whether a housing provider engages in a pattern or practice of discriminatory treatment towards people in protected classes, in violation of fair housing laws.
As already noted, the right to equal opportunity in housing is ensured not only by the Fair Housing Act, but also by State and local laws. HUD’s Office of Fair Housing and Equal Opportunity (FHEO) provides Fair Housing Assistance Program (FHAP) funding annually to State and local agencies that enforce fair housing laws.
Within Washington State there are four FHAP agencies certified by HUD which have equivalent enforcement powers as HUD and DOJ within their jurisdictions. All four FHAP agencies operate within the Puget Sound Region. They include:
• Washington State Human Rights Commission
• King County Office of Civil Rights
• Seattle Office for Civil Rights
• City of Tacoma Human Rights
FHIP programs promote awareness of fair housing laws and the right to equal opportunity in housing. Where a FHAP agency must remain impartial in order to reach a determination on a case, a FHIP’s role is to assist and support complainants in preparing and filing complaints with the appropriate administrative agency or in filing lawsuits.
The HUD designated FHIP agency serving the central Puget Sound region is the Fair Housing Center of Washington, located in Tacoma, WA40. The Fair Housing Center regularly provides fair housing information and training to consumers, housing providers, lending institutions, social service and government agencies and coalitions relating to the homelessness, disabilities and new immigrants. The Fair Housing Center of Washington also assists with the filing of housing discrimination complaints, conducts testing in the region, and provides other fair housing resources and coordination to the community.
Fair Housing Assistance Program
http://www.fhcwashington.org/40

Fair Housing Equity Assessment for the Central Puget Sound Region | Section III: Fair Housing Infrastructure 67
Recent LitigationCases Addressing Issues Involving Affirmatively Furthering Fair HousingThis section reviews recent national court cases addressing fair housing issues. Generally, recent suits which involve systemic discrimination issues relate to the requirement to affirmatively further fair housing under the Fair Housing Act. None of these cases involved jurisdictions from Washington State. Nevertheless, judicial interpretations on how to affirmatively further fair housing affect any jurisdiction that receives federal funds for housing programs and therefore cases filed outside Washington still may affect Washington law. The line of cases in which courts interpreted the requirement to affirmatively further fair housing mostly involved allegations that a jurisdiction receiving federal funds made efforts to prevent development of affordable housing, multi-family housing, or other types of housing that proportionately have high populations of people in protected classes.
The discriminatory behavior cited in these cases included: exclusionary zoning practices which prevented multi-family
Cases of note include: Get Back Up, Inc. v. city of Detroit, 878 F. Supp. 2d 794 (E.D. Mich. 2013); City of Fort Lauderdale v. Scott, 888 F. Supp. 2d 1279 (S.D. Fla. 2012); Cinnamon Hills Youth Crisis Center, Inc. v. St. George City, 685 F3d 917 (10th Cir. 2012); Nikolich v. Vill. Of Arlington Heights, 2012 WL 2359313 (N.D. III 2012); Inclusive Communities Project v. Texas Dept of Hous. & Community Affairs., 860 F. Supp.2d 312 (N.D. Tex2012); City of Joliet v. Mid-City Nat’l Bank of Chicago, 2012 WL 2514936 (N.D. Ill. June 28, 2012); Fair Hous. Justice Ctr. V. Town of Yorktown, Fair Housing-Fair Lending ¶ 4.9, No. 10-CIV-9337 (S.D.N.Y. Feb. 27, 2010)
See Appendix for cases and explanation
41
42
housing development, interfering with funding sources to prevent development of affordable housing, creating restrictive requirements that favor residents already living in the jurisdiction, and effectively preventing diversification of a given location, among other behaviors.41 Plaintiffs argued that these types of practices have a discriminatory effect on people in protected classes whether or not the discrimination was intentional or unintentional and that by engaging in these discriminatory efforts they were violating the requirement to affirmatively further fair housing.42
The overriding message from these cases is that jurisdictions should make sure that any effort to prevent carefully. Local analysis of practices and programs should include review of whether people in protected classes are affected more than the general population, and whether there is discriminatory intent to exclude certain people from living in an area.
Fair Housing Partners of WashingtonThe central Puget Sound region is home to a unique collaboration of fair housing enforcement and advocacy agencies. The Fair Housing Partners of Washington includes HUD, the Washington State Human Rights Commission, the King County Office for Civil Rights, the City of Seattle Office for Civil Rights, the City of Tacoma Human Rights, and the Fair Housing Center of Washington. The partners work collectively on issues that relate to fair housing enforcement and education and outreach efforts in Washington state. The group meets quarterly and conducts free bi-monthly trainings that are open to the public. The agencies collaborate on public information materials in order to ensure
consistent messaging on rights under federal and state fair housing law across the state. The partnership is unique in the nation in the collaborative approach and strives to make efficient use of limited resources.
The bi-monthly fair housing training conducted by the Fair Housing Partners of Washington is well-subscribed and usually fully booked, demonstrating a desire on the part of the pubic to learn about fair housing issues and to receive training to address them. The popularity of the trainings suggests that the need for fair housing education exceeds the resources available even with effective use of resources.
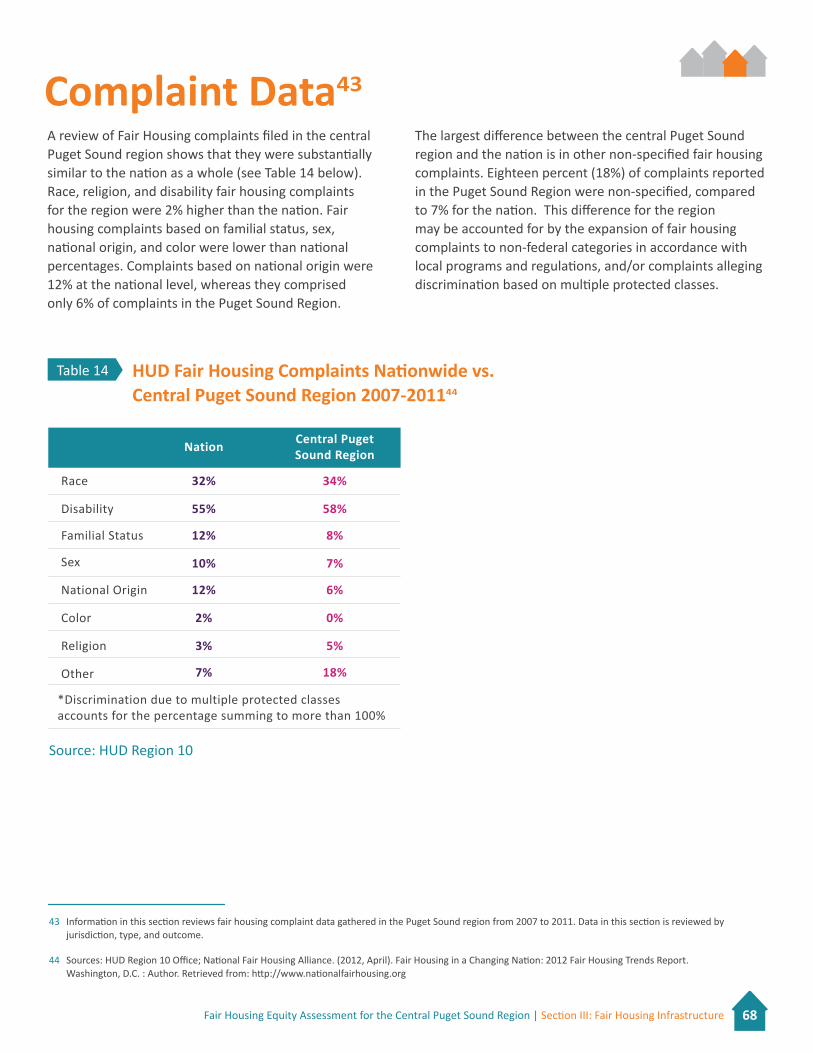
Fair Housing Equity Assessment for the Central Puget Sound Region | Section III: Fair Housing Infrastructure 68
Complaint Data43A review of Fair Housing complaints filed in the central Puget Sound region shows that they were substantially similar to the nation as a whole (see Table 14 below). Race, religion, and disability fair housing complaints for the region were 2% higher than the nation. Fair housing complaints based on familial status, sex, national origin, and color were lower than national percentages. Complaints based on national origin were 12% at the national level, whereas they comprised only 6% of complaints in the Puget Sound Region.
The largest difference between the central Puget Sound region and the nation is in other non-specified fair housing complaints. Eighteen percent (18%) of complaints reported in the Puget Sound Region were non-specified, compared to 7% for the nation. This difference for the region may be accounted for by the expansion of fair housing complaints to non-federal categories in accordance with local programs and regulations, and/or complaints alleging discrimination based on multiple protected classes.
Race
Disability
Familial Status
Sex
National Origin
Color
Religion
Other
*Discrimination due to multiple protected classes accounts for the percentage summing to more than 100%
32%
55%
12%
10%
12%
2%
3%
7%
34%
58%
8%
7%
6%
0%
5%
18%
HUD Fair Housing Complaints Nationwide vs. Central Puget Sound Region 2007-201144
Table 14
Nation Central Puget Sound Region
Information in this section reviews fair housing complaint data gathered in the Puget Sound region from 2007 to 2011. Data in this section is reviewed by jurisdiction, type, and outcome.
Sources: HUD Region 10 Office; National Fair Housing Alliance. (2012, April). Fair Housing in a Changing Nation: 2012 Fair Housing Trends Report. Washington, D.C. : Author. Retrieved from: http://www.nationalfairhousing.org
43
44
Source: HUD Region 10

Fair Housing Equity Assessment for the Central Puget Sound Region | Section III: Fair Housing Infrastructure 69
As summarized in Table 15 below, in the central Puget Sound region, 1,366 fair housing complaints were filed from 2007 to 2011. Strikingly, 850 or 64% of the fair housing complaints reported in the region related to disability or race. Complaints related to disability account for 39% of all fair housing complaints. Approximately 27% of the region’s fair housing complaints were made on the bases of familial status, national origin, and retaliation. The smallest number of complaints was made based on color, religion, sex, and sexual orientation.
Disability
Race
Color
Familial Status
National Origin
Religion
Sex
Retaliation
Marital Status
Sexual Orientation
Total
317
212
7
67
99
27
45
94
1
13
882
21
13
0
3
2
0
1
1
0
0
41
146
71
3
21
23
3
27
40
0
3
337
51
19
0
11
12
1
4
7
0
1
106
535
315
10
102
136
31
77
142
1
17
1,366
39%
23%
1%
7%
10%
2%
6%
10%
0%
1%
100%
Fair Housing Complaints by County 2007-2011Table 15
King Kitsap Pierce Snohomish Region Region %
Source: HUD Region 10 Office; National Fair Housing Alliance. (2012, April). Fair Housing in a Changing Nation: 2012 Fair Housing Trends Report. Washington, D.C. : Author. Retrieved from: http://www.nationalfairhousing.org
In response to complaints filed between 2007 and 2011, monetary settlements and/or damages totaled $267,348. The distribution by type of discrimination for which settlements and damages were made by monetary compensation was similar to the overall distribution by type of discrimination for fair housing complaints overall (see Table 16 below). The highest proportion of fair housing complaints were filed based on disability status and those complaints yielded the greatest amount of monetary compensation. Complaints based on familial status yielded the second highest amount of compensation even though they represent only 7% of the fair housing complaints for the region. Complaints based on race had the biggest gap. While
fair housing complaints based on race represented nearly a quarter of the complaints in the region, complainants in this category received less than 14% of the monetary settlements and/or damages. Retaliation cases also had a gap of just over 4% between the percentage of cases file and the percentage of financial compensation.

Fair Housing Equity Assessment for the Central Puget Sound Region | Section III: Fair Housing Infrastructure 70
Disability
Race
Color
Familial Status
National Origin
Religion
Sex
Retaliation
Marital Status
Sexual Orientation
Total
39.2%
23.1%
0.7%
7.5%
10.0%
2.3%
5.6%
10.4%
0.1%
1.2%
100%
48.7%
13.7%
0.0%
18.0%
11.1%
0.8%
1.5%
6.2%
0.0%
0.0%
100%
Regional Fair Housing Complaints by Type for 2007-2011Table 16
% Complaints Filed % of Total Regional Compensation
Source: HUD Region 10 Office; National Fair Housing Alliance. (2012, April). Fair Housing in a Changing Nation: 2012 Fair Housing Trends Report. Washington, D.C. : Author. Retrieved from: http://www.nationalfairhousing.org
Distribution of Fair Housing Cases by CountyFigure 25 below compares the bases of fair housing complaints among the four counties in the central Puget Sound region. Throughout the region, the highest percentage of fair housing complaints was filed on the basis of disability, followed by race. Some variation can be noted between the counties with respect to complaints filed for other protected classes. The third highest percentage of fair housing complaints was filed on the basis of national origin in Snohomish County; retaliation in Pierce County; familial status in Kitsap County; and national origin (closely followed by retaliation) in King County. The lowest percentages of fair housing complaints were filed on the basis of color, sex, marital status, religion and sexual orientation in all four counties.

Fair Housing Equity Assessment for the Central Puget Sound Region | Section III: Fair Housing Infrastructure 71
Fair Housing Complaint % by County, 2007-2011Figure 25
Coun
ty
% Complaint by Bases
0% 20% 40% 60% 80% 100%
DisabilityRace
ColorFamilial Status
National OriginReligion
SexRetaliation
Marital StatusSexual Orientation
Snohomish
Pierce
Kitsap
King
Source: HUD Region 10 Office; National Fair Housing Alliance. (2012, April). Fair Housing in a Changing Nation: 2012 Fair Housing Trends Report. Washington, D.C. : Author. Retrieved from: http://www.nationalfairhousing.org
Puget Sound Fair Housing Complaints Tell a StoryDiscrimination in the housing market happens in a number of ways. The most common ones are: refusing to rent or sell to someone in a protected class; refusing to negotiate with someone in a protected class; setting different terms, conditions or privileges that favor certain people over those in a protected class; failing to make a reasonable accommodations for persons with a disability; retaliating against people in a protected class; and harassing people in a protected class.
Based on analysis of central Puget Sound region complaint data, certain allegations often correlate
with certain protected classes. For example, failure to make a reasonable accommodation was always filed by people with disabilities. Harassment was often the allegation of people claiming discrimination due to sex and race. Refusal to rent or sell a dwelling was associated with discrimination claims due to family status, national origin, and race. Retaliation was often the allegation of claims filed by people in protected classes due to disability or race.
From this data we can tell that people with disabilities have difficulty getting equal access to the housing

Fair Housing Equity Assessment for the Central Puget Sound Region | Section III: Fair Housing Infrastructure 72
market through reasonable accommodations. People of color experience more harassment and retaliation and have fewer housing opportunities than whites. Landlords appear to be more reticent to rent to families or people of a different national origin and women experience harassment more frequently than men.
Certain housing providers also appear to correlate with fair housing complaints based on certain protected class. For example, people with disabilities file complaints against housing authorities, homeowner associations, and providers of non-profit housing
In order to evaluate whether complaints are valid, certified fair housing enforcement agencies (FHAPs) and advocacy groups (FHIPs) often conduct tests to determine whether a consistent pattern of discrimination exists. In 2012-2013, the Fair Housing Center of Washington conducted a testing audit on behalf of the Washington State Human Rights Commission (WSHRC) to determine the frequency of differences in treatment of persons in protected classes in the central Puget Sound region’s existing and future high capacity transit areas, as defined by the audit. The agency tested 90 properties in Snohomish, King, and Pierce Counties45 for discriminatory treatment due to race, national origin, and disability. Appendix III contains a more detailed description of testing and the methodology used.
Tests were done at 90 rental housing properties over a multiple month period. The results of this testing are summarized in Table 17. Positive test results were an indication of potential discrimination due to multiple types of differences in treatment which favor the control tester. The WSHRC audit showed that in 63% of the positive tests the control tester was told about or shown more units than the protected class tester. Notably, in 13% of the positive
and supportive services, mobile home parks, and senior housing. People filing because of race often filed against housing authorities, homeowner associations, non-profit housing and supportive services, and landlords of single-family rental homes.
Though many of the central Puget Sound region’s 1,366 complaints did not meet the legal evidentiary standards to show that the discrimination occurred, they do show that people feel that they have suffered discrimination and that a more thorough investigation may be needed.
Regional Transit Communities Fair Housing Testing AuditOverview
Housing Discrimination Occuring in Snohomish, King, and Pierce County Transit Communities
Although Kitsap County is part of the central Puget Sound region and included in the Regional Profile contained in Section II, testing focused on areas associated with high capacity transit corridors in King, Pierce and Snohomish counties.
45
tests, the protected class tester was not shown any units because they were told that an appointment was required to get information about availability of units, however the control tester was given a tour and information at the same location on the same day. In other words, rental agents gave a person of a protected class no information about available housing units, but on the same day gave a white person information about available units and/or a tour.

Fair Housing Equity Assessment for the Central Puget Sound Region | Section III: Fair Housing Infrastructure 73
Control tester told about/shown more units
Lower rent, fees, deposit for control tester
Better specials for control tester
Less requirements to rent for control tester
Earlier date of availability for control tester
Courtesy significantly better for control tester
Appointment not required for control tester while protected class tester turned away.
No reasonable accommodation granted for service animal
Follow up contact received by control tester and not protected class tester
63%
35%
30%
24%
22%
15%
13%
9%
7%
Table 17
Differences in Treatment Favoring Control Tester46 % of Time Different Treatment Occurs in Positive Tests for WSHRC Audit*
Source: FHCW, 2013
As summarized in Table 18 below, the testing audit showed that people protected by race, national origin, or disability seeking housing had a 60% chance of being treated differently when seeking housing in transit communities, as defined by the audit. These patterns of discrimination are consistent with the Fair Housing Center’s testing in Western Washington for the last 18 years, in that over half of the tests demonstrated preferences in treatment that favored the non-protected class tester.
When breaking the audit results down by protected class, other potential trends were revealed. Regionally, tests based on race of applicant indicated discriminatory treatment in 69% of the tests. For tests based on disability, 39% indicated discriminatory treatment. For tests based on national origin of the applicant, 70% indicated discriminatory treatment. While the sample sizes are small and may be not be statistically significant, other results for subsets of the data are interesting. In Snohomish County Hispanic testers were more likely to experience discrimination (83% were positive) and South East Asian were less likely to experience discrimination (20% were
positive). In King County discrimination rates were high for both South East Asian testers (81% positive) and Hispanics (67% positive) based on the results of the testing.
The audit showed overall high discrimination rates regionwide, with some variation by county. The following percentages of tests showed differences in treatment due to one of the three protected classes tested: Snohomish County 50%; King County 65%; and Pierce County 75%.
Multiple types of differences in treatment may occur in one test.46
The chance that people protected by race, national origin, or disability seeking housing are treated differently.
60%

Fair Housing Equity Assessment for the Central Puget Sound Region | Section III: Fair Housing Infrastructure 74
Note: Broken down into protected class, National Origin tests showed 100% positive while disability tests were 25%.
Source: FHCW, 2013
Snohomish County
King County
Pierce County
Region
54%
79%
50%
70%
57%
79%
100%
69%
33%
43%
0%
39%
50%
65%
50%
60%
2012-2013 Testing Audit ResultsTable 18
National Origin Race Disability% Tests Showing Differences in Treatment due to:
Total Differences in Treatment Due to a Protected Class
Source: FHCW, 2013
The WSHRC Testing Audit was conducted in Snohomish, King, and Pierce Counties generally along high capacity transit corridors associated with the Interstate 5 corridor, paying particular attention to major transit nodes. The testing that was conducted shows that there are areas where a person in a given protected class is more likely to experience discriminatory treatment than in other areas. Results are summarized below in Table 19.
Discrimination in Proximity to Transit Communities
North Seattle
Mercer Island
Bellevue
Lynnwood
Federal Way/Milton/Fife Area
Des Moines/Kent
Mukilteo/South Everett
University District
SeaTac/Tukwila
Shoreline/Mt. Lake Terrace/Edmonds
South Lake Union
King
King
King
Snohomish
King/Pierce
King
Snohomish
King
King
Snohomish
King
100%
83%
80%
66%
60%
60%
57%*
50%
50%
33%
20%
Table 19
CountyNeighborhood/Area % Positive Tests

Fair Housing Equity Assessment for the Central Puget Sound Region | Section III: Fair Housing Infrastructure 75
In the testing audit 60% of the tests were positive. Testing indicates that people of minority national origin (70% positive tests) and minorities races (69% positive tests) are the most likely to be discriminated against in the region’s transit communities. People with disabilities were the least likely to experience discrimination in this testing audit (39% positive tests).
The most likely form of discrimination is a person in a protected class being told about or shown fewer units
Fair housing choice can be impacted by the ability to access financing to purchase a home. Evaluation of home mortgage data by protected class, where the data are available, can provide insight into home ownership opportunities. People in the Puget Sound applied for almost 48,300 mortgage loans in 2010. In Table 20 below, loan applications are broken down by race and ethnicity and their outcomes.
Findings
Puget Sound Home Mortgage Disclosure Act (HMDA) Data
(occurred in 68% of all positive tests). This suggests that people in protected classes may have access or knowledge of fewer housing opportunities in the region. The next two most common forms of discrimination are being quoted higher rent, fees, and/or deposits, and being told about less beneficial offers/specials. This indicates that people in protected classes in the Puget Sound region could be affected financially by discrimination.
American Indian or Alaska Native
Asian
Black or African American
Native Hawaiian/Pacific Islander
White
Other
Total
* Failed applications are those that were not completed for some reason
** Denied applications were completed but denied for some reason
359 (0.7%)
6,049 (12.5%)
1,452 (3.0%)
484 (1.0%)
33,462 (69.4%)
6,492 (13.4%)
48,298 (100%)
227 (63.2%)
4,129 (68.30%)
925 (63.7%)
314 (64.9%)
24,324 (72.7%)
4,348 (67.0%)
34,267 (71.0%)
73 (20.3%)
1,150 (19.1%)
304 (20.9%)
98 (20.3%)
5,766 (17.2%)
1,431 (22.0%)
8,882 (18.3%)
59 (16.4%)
770 (12.7%)
223 (15.4%)
72 (14.9%)
3,372 (10.1%)
713 (11.0%)
5,209 (11.0%)
2010 Regional Home/Mortgage Disclosure Act Application Outcomes by Race
Table 20
Applications(% of Total
Applications)
Originations(% of Applications
That Were Successful)
Failure*(% of Applications
That Failed)
Denial**(% of Applications
Denied)Race
Source: Federal Financial Institutions Examination Council, 2013

Fair Housing Equity Assessment for the Central Puget Sound Region | Section III: Fair Housing Infrastructure 76
As seen in Table 21, below, on average, of the 48,298 home loan mortgage applications that were submitted in 2010, 71.0% were approved, 11.0% were denied, and the remaining 18.3% failed for some reason. For white applicants, successful applications were slightly higher at 72.7%. Asian-American applicants were approved at a rate of 68.3%, black applicants at 63.7%, Native Hawaiian/Pacific Islanders at 64.9%, and those
When looking at Hispanic or Latino applicants, 66.9% of applications were approved, compared to the 72.7% success rate of white applicants. As with other ethnic minorities, 2/3 of applicants were approved for home loans. However, based on these data, Hispanic or Latino applicants have about 5% lower approval rates, and therefore less access to financial resources to purchase homes when compared to white applicants.
reporting “other” race at 67.0%. In the case of each racial category, nearly 2/3 of applicants were approved for home loans. However, based on these data, ethnic minorities can also be seen as having somewhat lower approval rates, and therefore less access to financial resources to purchase homes when compared to whites. This comparative lack of financial resources could potentially limit household mobility and location choice.
Hispanic or Latino
Not Hispanic or Latino
Other or no Information
Total Count
2010 Regional Home/Mortgage Disclosure Act Application Outcomes by Ethnicity
Table 21
Applications(% of Total
Applications)
Originations(% of Applications
That Were Successful)
Failure*(% of Applications
That Failed)
Denial**(% of Applications
Denied)Ethnicity
1,698 (3.5%)
39,928 (82.7%)
6,672 (13.8%)
48,298 (100%)
1,136 (66.9%)
28,720 (71.9%)
4,411 (66.1%)
34,267 (71.0%)
310 (18.3%)
7,045 (17.6%)
1,467 (22.0%)
8,882 (18.3%)
252 (14.8%)
4,163 (10.4%)
794 (11.9%)
5,209 (11.0%)
This comparative lack of financial resources could potentially limit household mobility and location choice.
According to this data people of color in the region are denied at higher rates than whites. Even if there is no intentional discrimination, this may be unfair and contribute to segregation.
Multiple types of differences in treatment may occur in one test.46
* Failed applications are those that were not completed for some reason
** Denied applications were completed but denied for some reason
Source: Federal Financial Institutions Examination Council, 2013
Fair Housing Equity Assessment for the Central Puget Sound Region | Section III: Fair Housing Infrastructure 77
It is a generally accepted that the higher the homeownership rate in a neighborhood, the more stable the community. During the 1990s and 2000s, neighborhoods like the Hilltop in Tacoma made great strides in working toward increasing stability and reducing crime by increasing the homeownership rate. In 1991, the City of Tacoma contracted with a private consultant to analyze the impact of low homeownership rates in the Hilltop neighborhood. Successful efforts were implemented to increase the homeownership rate to first time homebuyers and reduce the number of investors who were often absentee landlords. Crime rates improved prompting more investment in the community. However, in 2008 many of the gains from the previous decades were lost when the foreclosure rates rose and homeownership rates dropped to 1991 levels.
In 2008 the economy collapsed, due mainly to the concurrent foreclosure crisis and failure of the housing market. The peak housing prices of 2006 plummeted and with them millions of dollars of
Public input from stakeholders is an important piece of the Fair Housing Equity Assessment because numbers and data cannot fully describe the experience and knowledge of the people in our communities. Several strategies were used to collect public input including a fair housing survey, three public meetings held in Snohomish, King, and Pierce Counties, meetings with numerous stakeholder groups throughout the region, and private interviews. Individual interviews were conducted with representatives of housing and social service agencies within the region.48
Foreclosures in the Puget Sound After the 2008 Collapse
Public Comment
wealth vanished. Federally supported programs encouraging homeownership, financial institutions, regulators, credit agencies, and subprime loans directed disproportionally toward lower income families of color resulted in the highest foreclosure rate in history.
The foreclosure rate in Washington hit low opportunity areas in the region the hardest.47 Areas of the Eastside and South End neighborhoods of Tacoma and west side of Federal Way had the highest intrastate foreclosure risk scores (that measure subprime lending, foreclosures, delinquency, and vacancies) were at 64.1 up to 100 points. The Hilltop neighborhood of Tacoma along with Spanaway of south Pierce County; portions of Puyallup and Marysville (the latter of which is in Snohomish County) are within the 50 to 60 foreclosure risk scores. Arlington, Everett, Kent, Puyallup, and Sumner appear in the 39.4-50 scores. The south of Seattle neighborhoods between Tukwila and Burien and Des Moines appear in the 34-38.3 score category.
09-2012 Foreclosure Risk Scores, Analysis by the Local Initiative Support Corporation provided by the Foreclosure Response project.
Including the Somali Youth and Family Club, Mercy Housing, Sound Mental Health, Northwest Justice Project, HUD, and individual private real estate developers.
47
48

Fair Housing Equity Assessment for the Central Puget Sound Region | Section III: Fair Housing Infrastructure 78
Fair Housing SurveyIn the development of the Fair Housing Equity Assessment, public comment was solicited and recorded through surveys, public meetings, and individual interviews. All of these tools were designed to gather information that reflects the public’s experience with fair housing and housing discrimination in general. The survey was distributed throughout the Puget Sound Region as well as online. Nine hundred twenty three (923) surveys were returned from throughout the region. Participants included tenants (13%), homeowners (49%), social service providers (10%), government employees (7%), landlords (13%), home mortgage professionals (less than 1%), and Other (6%). For the most part, participants resided in Everett, Seattle, and Tacoma. Where relevant, comments from all phases are included below to supplement the responses. The results of the survey are summarized in Table 22 below.
Understand the Basics
Have a Thorough Understanding
Understand a Little
Did Not Respond
Discrimination is Non-Existent or Rare
Discrimination is Occasional
Discrimination is Common
Don’t Know
Discrimination is Non-Existent or Rare
Discrimination is Occasional
Discrimination is Common
Don’t Know
True
Somewhat True
Not True
Don’t Know
42%
20%
20%
18%
19.7%
41.3%
16.4%
22.6%
17.2%
39.5%
28.9%
14.4%
4.9%
21.1%
51%
23%
Table 22
Understanding of Fair Housing Laws
Perception of Discrimination in the Sale of Homes
Perception of Discrimination in the Rental of Homes
Individuals Know Where to File a Housing Discrimination Complaint
Fair Housing Survey Findings (Self-Scored)
(continued...)

Fair Housing Equity Assessment for the Central Puget Sound Region | Section III: Fair Housing Infrastructure 79
Felt that it was either not true or somewhat true that landlords welcome persons of all races, national origin and language.
Participants either disagreed or only partially agreed that private landlords welcome immigrants.
Participants believed that families with children either have or partially have a difficult easily renting housing.
Participants stated that it is not true that housing is available to individuals with criminal histories.
Participants did not believe or had questions about landlords’ willingness to rent to individuals with Section 8 certificates.
Participants did not agree or only partially agreed that group homes/low income housing is welcome in all neighborhoods.
Participants did not agree that there is sufficient outreach and education on fair housing.
Participants believed that building codes and zoning encourage the development of affordable housing.
Participants who thought criminal history was a protected class.
Participants who thought homelessness is a protected class.
Participants feelings about public transportation being available in their communities.
Participants feelings about the availability of accessible housing
Participants feelings about landlords granting reasonable accommodations.
Participants were confused about where to file a housing discrimination complaint.
Participants were fairly clear about federal and state protected classes.
Participants felt that their neighborhoods include a variety of races and national origin.
Participants felt that Real Estate agents show their clients housing in a variety of neighborhoods
64%
52.8%
56.4%
52.9%
51.4%
45.8%
47.2%
10.4%
42.4%
32.0%
Positive
Negative
Positive
Most
Most
Most
Most
Findings of Note
Of the respondents, 62% felt they had a thorough or basic understanding of fair housing issues. The greatest number of respondents (42%) felt that discrimination in the sale of housing was occasional, while 16.4% felt that it was common. When it came to rental housing, 68.4% of respondents felt that discrimination in renting is either occasional or common. The majority of respondents (51%) felt that individuals do not know where to file a complaint in the event of perceived discrimination.

Fair Housing Equity Assessment for the Central Puget Sound Region | Section III: Fair Housing Infrastructure 80
Survey CommentsA considerable number of participants perceived that the greatest amount of housing discrimination takes place in Bellevue, East King County, and South King County.
Individual comments of note include:
“There is discrimination toward refugee and immigrants in East King County. Our clients tell us about situations where fair housing standards are not being followed.”
“The region is highly segregated by income. Income correlates to protected class membership. These factors largely determine where a person lives and what housing
choices they will have. The discriminatory effects are visible on a collective level.”
“Redlining STILL exists throughout the City – more common in the South and Southwest quadrants of the City.”
During redevelopment of projects, “they displace existing residents and disrupt the minority community.”
“I feel there is a lot of discrimination against people that have a Section 8 Vouchers. Landlords openly advertise that they do not take Section 8.”
Community Forums and Individual InterviewsThree community forums were conducted in King, Pierce, and Snohomish counties. Each forum included a presentation describing fair housing principles, presentation and discussion of regional opportunity maps, and the preliminary findings of the FHEA. The attendees were then asked to participate in a discussion forum. Sixty-eight people attended the three countywide forums.
Individual interviews included discussions with representatives from the Somali Youth and Family Club, Mercy House, Sound Mental Health, Northwest Justice Project, HUD, and individual private real estate developers.
The themes that emerged from these discussions included issues relating to familial and community connections, market practices, Section 8 and fair market rates, transportation/jobs/affordable housing, the impact of government policy, “Not in My Backyard” (NIMBY) issues, culture gaps, the power of institutions, and access to high opportunity areas.

Fair Housing Equity Assessment for the Central Puget Sound Region | Section III: Fair Housing Infrastructure 81
Conclusions From Public CommentMajor themes revealed in public comment centered around several common themes, including:
• Access to high opportunity areas
• The power of institutions
• Culture gaps
• “Not in My Backyard” (NIMBY) attitudes
• Impact of government policy
• Transportation/Jobs/Affordable Housing
• Section 8 and fair market rates
• Market practices
• Family and community connections
Appendix IV contains a more thorough discussion of these themes.
Public perception appears to be consistent with the findings of this report with the exception of how often discrimination occurs. The survey compared to the testing evidence shows that the public does not realize how often people in protected classes are treated differently.
While the survey indicates that the public is not generally knowledgeable about fair housing laws or the frequency of discrimination, public comment and interviews show that the public generally has a very clear grasp about what affects the housing, transportation, and social issues in their communities. Public comments show that people know that discrimination against protected classes occurs in the housing market, though they do not believe it occurs as frequently as testing indicates. As revealed in comments regarding Section 8 housing vouchers, there is a belief that discrimination does occur, and is a major obstacle to housing for low income people. Respondents felt that cultural competency is an important factor in the success of community projects, and that the availability of high quality, affordable transportation is a major factor in assessing how people move around the region to job and education centers, and areas of higher opportunity. Commenters also felt that government and institutions play a large part in preventing discrimination, though without care they can be barriers to facilitating access to fair housing choice.

Fair Housing Equity Assessment for the Central Puget Sound Region | Section III: Fair Housing Infrastructure 82
What Does All This Tell Us About Fair Housing in the Puget Sound Region?This chapter has discussed fair housing issues in the region through review of recent case law, analysis of complaint data, testing data, an evaluation of barriers to fair housing choice in the region’s 13 entitlement jurisdictions’ Analyses of Impediments to Fair Housing Choice, home mortgage disclosure data (HMDA), and public comments.
The most common themes are:
• Discrimination occurs most frequently due to disability, race, national origin and family status.
• People of color are denied mortgage loans at higher rates than whites.
• Jurisdictions that receive federal funds must make genuine efforts to affirmatively further fair housing.
In distilling all this data down to the key points, we find that there are two major conclusions to make.
• Discrimination occurs in the central Puget Sound region which requires investment in enforcement efforts.
• Demand for Fair Housing resources outweighs supply and requires investment in education efforts.
Discrimination must be identified and addressed through effective and meaningful enforcement. In looking forward, educating the public, landlords (in both the public and private sectors), elected officials, and government staff about the region’s fair housing issues is critical. Education could reduce the amount of money landlords spend responding to discrimination complaints and improve the public’s understanding of their rights under federal, state and local fair housing law, and improve their access to advocacy and enforcement agencies.
Education Prevents LitigationBy supporting fair housing educational efforts throughout the region, jurisdictions, at the most fundamental level, help meet the requirement to affirmatively further fair housing. Providing education to government officials and staff helps ensure that the principles of equity in housing inhabit the decision making process.
• Testing indicates that differences in treatment towards people in protected classes occurs much more frequently than the public realizes.
• More fair housing education is needed for the public and elected officials.
• Access to affordable housing and transportation (and ultimately, opportunity) is a fair housing issue.

Fair Housing Equity Assessment for the Central Puget Sound Region | Section IV: Findings & Strategies 83
Section IV: Findings and Strategies
FindingsFair Housing Equity Assessment (FHEA)
Fair Housing in the Central Puget Sound Region
• The FHEA is an opportunity to examine the impacts of programs and policies on the access and availability of housing choices to racial and ethnic minorities, people with disabilities, and other protected classes.
• The U.S. Department of Housing and Urban Development requires that the FHEA be developed by a broad set of regional stakeholders and be used to inform regional planning and investments.
• While there are fourteen entitlement jurisdictions in the central Puget Sound region that are required to complete a local Analysis of Impediments to Fair Housing Choice, the FHEA is regional in scope and perspective.
• The Civil Rights Act (1964), the Fair Housing Act (1968), and subsequent statutes, regulations, guidelines, and case law, have created a framework at the federal level to designate protected classes and address issues of segregation and fair housing access.
• There are 16 classes protected at either the federal, state, or local level in the central Puget Sound region. They are: race, color, religion, national origin, sex, gender identity, sexual orientation, familial/parental status, handicap/disability, creed, marital status, veteran/military status, age, Section 8 recipient, ancestry, and political ideology.
• There is currently no consistent ongoing regional coordination of fair housing planning or activities in the central Puget Sound region. In addition, there is no regional authority to compel the implementation of regional fair housing programs and policies. The FHEA is the first attempt at regional coordination on these issues.
• As in other parts of the country, the central Puget Sound region has a history of segregation based on race and national origin. Practices such as restrictive covenants, redlining, and loan discrimination, helped contribute to concentration of African Americans and other racial/ethnic minorities in certain areas of Seattle and Tacoma.
• Recent trends have indicated greater racial and ethnic diversity in many historically white areas of the region. Promoting affordable housing in all neighborhoods affirmatively furthers fair housing and helps promote racial/economic integration.

Fair Housing Equity Assessment for the Central Puget Sound Region | Section IV: Findings & Strategies 84
Demographic Data
Access to Opportunity
• The four-county central Puget Sound region has experienced 34% population growth in the last 20 years. Nearly one-third of the 3.7 million person population in 2010 identified as a racial/ethnic minority, representing a substantial increase in number, proportion, and geographic spread between 1990 and 2010.
• The central Puget Sound region has a higher median income and lower poverty level than the state and national levels. There is a relationship between income and race in the region, such that median household incomes of white and Asian populations are higher than the region’s median income, while median household incomes of black and Hispanic populations are lower than the region’s median income.
• There are four census tracts that meet the HUD-definition for Racially/Ethnically Concentrated Areas of Poverty in the region, meaning over 40% of the population is below the poverty level and over 50% of the population is a racial/ethnic minority. There are 13 addition census tracts, totaling 77,630 in population, where at least 25% of households are below poverty and 40% of residents are non-white.
• Segregation in the central Puget Sound region and across the nation stems from self-segregation, active segregation in the form of discriminatory practices or
• There is a strong association between geography and access to opportunity, including in the areas of mobility, public health, education, public safety, and economic opportunity. Communities near the central cities of Seattle and Bellevue and east King County generally have high and very high access to opportunity. Areas in south King County and Pierce County generally are characterized by moderate, low, and very low access to opportunity. To the north, areas of southwest Snohomish County are associated with mixed access to opportunity.
• There is a relationship between race/ethnicity and access to opportunity. Whites and Asians are
policies, and segregation that results from structural inequities in the society. Three measures indicate segregation in the central Puget Sound region:
w The dissimilarity index results describe a region that is characterized by low to moderate segregation and that has seen modest desegregation over the past decade. For whites versus all minorities, the dissimilarity index is well below the HUD threshold for segregation. For white-black, the index shows moderate segregation.
w Census tract data reveals concentrations of black and Hispanic populations in south Seattle, south King County, and Tacoma. Concentrations of Asian populations also extend into areas of east King County.
w The Predicted Racial/Ethnic Composition Ratio, which identifies racial segregation, as opposed to income segregation, suggests a pattern where generally, racial and ethnic minorities are “overrepresented” in centralized places and “underrepresented” at the periphery of the urban area.
more likely to live in census tracts with high or very high access to opportunity than the population overall. Meanwhile, foreign-born, American Indian, Hispanic and African American residents are more likely to live in census tracts with low or very low access to opportunity than the total population.
• Living in poverty is associated with a higher likelihood of living in an area of low or very low access to opportunity. Blacks and Hispanics living in poverty are more likely to live in areas of low or very low access to opportunity than whites or Asians.

Fair Housing Equity Assessment for the Central Puget Sound Region | Section IV: Findings & Strategies 85
Housing and Access to Opportunity
Transportation and Infrastructure
• Segregated white neighborhoods tend to have housing that is predominantly single-family and owner-occupied. Segregated minority communities tend to have housing that is mixed SF/MF and mixed tenure as well.
• Housing costs vary considerably across the region. High housing prices and rents are significant barriers to racial and ethnic minorities, immigrants, and other protected classes from securing housing generally, and especially in communities with good access to opportunity.
• The cost of transportation compounds the cost burden for housing alone that many low and even moderate income households in the region face. The Housing + Transportation Index shows that 38% of neighborhoods in the region are cost burdened by housing costs only, while 67% of neighborhoods in the region are housing + transportation cost burdened for the average household.
• Data on the geographic distribution of housing assistance in the region shows that subsidized units are roughly proportional to the overall housing stock in communities with high and very high access to opportunity. However, this may not be sufficient to overcome existing inequities in access to opportunity.
• Over half of households using Section 8 vouchers live in areas of low or very low access to opportunity.
• Comprehensive plans, implemented in part through land use regulations, include policies for accommodating growth with a range of housing types and densities. Affordability and access to high opportunity communities will be challenging in areas where displacement of existing affordable units is threatened and where higher-cost high-density is being developed.
• Environmental justice analyses conducted by the Puget Sound Regional Council for Transportation 2040 and the 2013-2016 Transportation Improvement Program conclude that at a regional scale, both past and planned transportation investments, have equitably benefited minority and low-income households.
• Results of the opportunity mapping analysis show inequitable access to opportunity in the areas of mobility, economic health, education, and public health. These findings strongly suggest that at the local level, inequitable gaps exist between the need for community infrastructure in these areas and the provision of adequate community infrastructure.

Fair Housing Equity Assessment for the Central Puget Sound Region | Section IV: Findings & Strategies 86
Fair Housing Complaints
Evidence of Discrimination from Fair Housing Testing
• Fair housing complaints in the region are similar in types of protected classes and allegations of the forms of discrimination compared to those nationally. More than half of complaints relate to disability and about a third to racial discrimination. Complaints of discrimination based on family status and national origin occur less frequently.
• Within the central Puget Sound region, a similar pattern exists, with about two-thirds of the nearly 1,400 complaints made from 2007-2011 related to disability or racial discrimination.
• Testing audit results revealed that minority races, foreign born, and disabled people seeking housing had a 60% chance of being treated differently when looking for housing along the transit lines of focus. Racial and ethnic minorities were most likely to be treated differently.
• The most common form of difference in treatment was that protected testers were told about fewer units followed by protected testers being quoted higher amounts for rent, deposits, fees, and told about fewer specials. Discrimination occurs most frequently in the rental market.
• Complaint data indicate that people with disabilities have difficulty getting equal access to the housing market through reasonable accommodations. People of color experience more harassment and retaliation than whites.
• Racial and ethnic minorities have somewhat lower approval rates for home mortgages, and therefore less access to financial resources to purchase homes when compared to whites.
• Though it is not a protected class in most jurisdictions, discrimination due to source of income (Section 8) has restricted housing for many of the region’s most vulnerable people.
Fair Housing Infrastructure• Demand for fair housing training for housing providers and consumers alike outweighs the resources
available to HUD, FHAP, and FHIP agencies in the region to provide for all education needs.

Fair Housing Equity Assessment for the Central Puget Sound Region | Section IV: Findings & Strategies 87
StrategiesFair Housing
Access to Opportunity
Continue regional coordination of fair housing assessment and enforcement.Determine roles for regional organizations, entitlement and other jurisdictions, enforcement and advocacy agencies.
Adopt regional fair housing goals and monitor outcomes. Entitlement jurisdictions should work with other jurisdictions, housing and equity stakeholders, and other regional partners to develop and adopt regional fair housing goals and a system to monitor progress and change over time.
Evaluate impact of regional and local policies and investments on protected classes. Entitlement jurisdictions should work with other jurisdictions, housing and equity stakeholders, to develop and implement evaluation tools to determine and address the potential impacts of regional and local policies and investments on protected classes in the region.
Promote diversity and prevent discrimination through supporting fair housing educational efforts. Efforts should include: educate housing providers about affirmative marketing, educate government officials and staff about affirmatively furthering fair housing, and provide fair housing training and outreach to communities where local opposition to affordable housing creates a barrier to furthering fair housing for all the region’s residents.
Increase funding for fair housing programs in the region.
Use opportunity mapping analysis to prioritize housing, infrastructure and community development investments.Where possible, use the Comprehensive Access to Opportunity Index, or appropriate sub-measure, to provide context to and help direct public investments in housing, infrastructure, and community development.
Encourage affordable housing development and preservation in areas with high access to opportunity. Establish regional goals and target public and private investments to increase affordable housing in areas with high and very high access to opportunity.
Prioritize investments to improve access to opportunity in areas with low access to opportunity.Use the Comprehensive Access to Opportunity Index sub-measures data as a starting point to assess community needs in areas with low access to opportunity. Target appropriate investments to improve access to opportunity for those areas.
Promote economic development programs in areas of low and very low access to opportunity. Use tax incentives and other tools to encourage development in areas of low access to opportunity. Promote and implement a regional economic development goal of providing access to family and living wage jobs for all residents, and especially low-income and minority households, and those living in areas of low or very low access to opportunity.
Invest in equitable access to high quality education.Promote policies and investments at all levels of government to ensure that there is an equitable distribution of educational resources within the region. Use a full range of tools to support educational programs in all communities. Prioritize investments and programs to communities that currently have low or very low access to high quality education indicated by the Opportunity Mapping analysis. Implement innovate tools to support

Fair Housing Equity Assessment for the Central Puget Sound Region | Section IV: Findings & Strategies 88
education quality and outcomes in communities with low access to opportunity, such as housing authority/public school partnerships that provide housing vouchers in exchange for commitment to stay in school49.
Provide sufficient transit investments to provide for the mobility of transit dependent populations, particularly between areas of low and high access to opportunity.Local jurisdictions and transit agencies should work with the state legislature to enable sufficient funding authority to provide transit service to meet the need of transit dependent populations.
Increase efforts to provide sufficient choices of affordable, safe, healthy, and adequately sized housing throughout the region to meet the region’s growing housing needs. Create more housing choices through preservation and new development, including housing trust funds, a transit-oriented development property acquisition fund and other gap-financing tools, equitable value-capture financing tools, and funding and incentives for rehabilitation and preservation of affordable housing units.
Implement appropriate incentives to encourage the development and preservation of affordable housing. Develop incentive tools such as zoning bonus programs, road impact fee waivers, school fee exemptions, expedited permitting, and tax abatement programs to encourage affordable housing development and preservation. In determining the appropriate mix of incentives for each community, consider market conditions, housing needs and existing regulations.
Tacoma Housing Authority/McCarver Elementary49
Affordable HousingEnsure that local zoning and building regulations allow and promote sufficient housing supply and housing types to meet a full range of affordability needs. Ensure that regulations do not create barriers to the development of affordable housing projects, group homes for special needs populations, or homeless shelters.
Manage foreclosed homes to best serve areas of low and high access to opportunity respectively.
Protect housing choice voucher holders. Support legislative efforts to make “Source of Income” a protected class and include enforcement provisions. Support efforts to expand housing choices for voucher holders to move into areas with high access to opportunity.

Fair Housing Equity Assessment for the Central Puget Sound Region | Section IV: Findings & Strategies 89
Next StepsWhile the completion of this Fair Housing Equity Assessment for the Central Puget Sound Region satisfies the requirements and expectations of the Department of Housing and Urban Development, the value and potential use of the FHEA for public agencies and fair housing stakeholders in the region do not end there. Several key areas of activity, listed below, are important next steps in carrying this body of work and the recommendations that emerged from it forward.
Fair Housing Equity Assessment as Resource to Guide Regional and Local Actions. The data, analyses, and findings of the FHEA are resources with particular value to entitlement jurisdictions in the region. Data provide regional context to consider locally by entitlement jurisdictions in completing an Analysis of Impediments (AI). Analyses provide models for tailoring the approaches used regionally at a sub-regional scale. Finally, and perhaps most important, the findings and recommendations contribute a consensus list of policies and tools that, with broad implementation, can benefit fair housing conditions in communities throughout the region.
Engage regional partners in developing a Regional Analysis of Impediments. A regional AI would build on and strengthen the findings and recommendations of the FHEA, specifically in identifying a broader array of barriers to housing choice and in documenting more thoroughly a set of strategies and an action plan intended to affirmatively further fair housing in the region. Stakeholders involved in the FHEA process should continue their collaboration to identify options, tasks, and lead agencies for a regional AI.
Housing work plan at the Puget Sound Regional Council. PSRC has developed a proposed housing work plan for the next two years. This work plan represents a commitment of PSRC to continuing to support housing planning and implementation in the region, building on the housing work done pursuant to the Growing Transit Communities work plan. PSRC has identified several key areas for its housing work, including: data and technical assistance, guidance on comprehensive and other plan updates, housing needs analysis, regulatory and financial tools to promote affordable housing preservation and development, and development of a regional housing strategy. As the housing work plan continues to evolve, PSRC should identify specific recommendations of the FHEA that will be advanced through its work.
Understand and take action based on final updated HUD fair housing rules.Housing and Urban Development has developed draft rules addressing requirements for affirmatively furthering fair housing. Once these rules are finalized in 2014, PSRC and its regional partners should assess the recommendations of this FHEA in light of those requirements to identify any new recommendations or approaches to implementing the current recommendations that may be suggested through the HUD rule making process.

Fair Housing Equity Assessment for the Central Puget Sound Region | Appendix 90
Predicted Racial/Ethnic Composition by Small Area
Appendix I
Algona city, Auburn CCD, King County, Washington
Arlington city (part), Arlington CCD, Snohomish County, Washington
Arlington city (part), Marysville CCD, Snohomish County, Washington
Arlington Heights CDP, Arlington CCD, Snohomish County, Washington
Auburn city (part), Auburn CCD, King County, Washington
Auburn city (part), Enumclaw Plateau CCD, King County, Washington
Auburn city (part), Puyallup CCD, Pierce County, Washington
Auburn city (part), Seattle CCD, King County, Washington
Bainbridge Island city, Bainbridge Island CCD, Kitsap County, Washington
Beaux Arts Village town, East Seattle CCD, King County, Washington
Bellevue city, East Seattle CCD, King County, Washington
Black Diamond city, Enumclaw Plateau CCD, King County, Washington
Bremerton city (part), Bremerton CCD, Kitsap County, Washington
Brier city, Edmonds CCD, Snohomish County, Washington
Buckley city, Buckley CCD, Pierce County, Washington
Burien city, Seattle CCD, King County, Washington
Carbonado town (part), Buckley CCD, Pierce County, Washington
Bonney Lake city (part), Puyallup CCD, Pierce County, Washington
Bothell city (part), East Seattle CCD, King County, Washington
Bothell city (part), Edmonds CCD, Snohomish County, Washington
Bothell city (part), Maltby CCD, Snohomish County, Washington
Carnation city, Snoqualmie Valley CCD, King County, Washington
Clyde Hill city, East Seattle CCD, King County, Washington
Covington city, Tahoma-Maple Valley CCD, King County, Washington
Darrington town, Darrington CCD, Snohomish County, Washington
92.71%
49.41%
55.13%
37.26%
100.83%
86.91%
125.02%
127.51%
30.12%
39.61%
143.98%
6.79%
81.44%
79.86%
39.43%
117.49%
43.50%
61.44%
39.28%
76.61%
21.08%
73.67%
57.36%
76.45%
31.62%
Actual % Non-White/Predicted % Non-White
Predicted Racial/Ethnic Composition is Higher Than ExpectedPredicted Racial/Ethnic Composition Falls Within 90%-110% (Expected Range)Predicted Racial/Ethnic Composition is Lower Than Expected

Fair Housing Equity Assessment for the Central Puget Sound Region | Appendix 91
Des Moines city (part), Auburn CCD, King County, Washington
Des Moines city (part), Seattle CCD, King County, Washington
DuPont city, Fort Lewis-DuPont CCD, Pierce County, Washington
Duvall city, Snoqualmie Valley CCD, King County, Washington
Eatonville town, Eatonville CCD, Pierce County, Washington
Edgewood city (part), Puyallup CCD, Pierce County, Washington
Edmonds city, Edmonds CCD, Snohomish County, Washington
Enumclaw city (part), Enumclaw Plateau CCD, King County, Washington
Everett city (part), Everett CCD, Snohomish County, Washington
Federal Way city (part), Auburn CCD, King County, Washington
Federal Way city (part), Seattle CCD, King County, Washington
Fife city (part), Puyallup CCD, Pierce County, Washington
Granite Falls city, Granite Falls CCD, Snohomish County, Washington
Hunts Point town, East Seattle CCD, King County, Washington
Index town, Skykomish CCD, Snohomish County, Washington
Issaquah city (part), East Seattle CCD, King County, Washington
Issaquah city (part), Issaquah Plateau CCD, King County, Washington
Kent city (part), Seattle CCD, King County, Washington
Kent city (part), Tahoma-Maple Valley CCD, King County, Washington
Kirkland city, East Seattle CCD, King County, Washington
Lake Forest Park city, Seattle CCD, King County, Washington
Fife city (part), Tacoma CCD, Pierce County, Washington
Fircrest city, Tacoma CCD, Pierce County, Washington
Gig Harbor city, Gig Harbor Peninsula CCD, Pierce County, Washington
Gold Bar city, Skykomish CCD, Snohomish County, Washington
Kenmore city (part), East Seattle CCD, King County, Washington
Kenmore city (part), Seattle CCD, King County, Washington
Kent city (part), Auburn CCD, King County, Washington
Kent city (part), Enumclaw Plateau CCD, King County, Washington
77.73%
128.17%
106.47%
78.48%
23.28%
37.23%
55.64%
34.90%
86.61%
149.19%
232.29%
58.60%
27.67%
29.72%
16.96%
103.94%
168.65%
115.00%
87.93%
48.66%
177.97%
68.19%
38.46%
57.25%
94.50%
83.38%
99.36%
190.02%
164.57%
Actual % Non-White/Predicted % Non-White
Predicted Racial/Ethnic Composition is Higher Than ExpectedPredicted Racial/Ethnic Composition Falls Within 90%-110% (Expected Range)Predicted Racial/Ethnic Composition is Lower Than Expected

Fair Housing Equity Assessment for the Central Puget Sound Region | Appendix 92
Maple Valley city (part), Enumclaw Plateau CCD, King County, Washington
Maple Valley city (part), Tahoma-Maple Valley CCD, King County, Washington
Marysville city (part), Marysville CCD, Snohomish County, Washington
Marysville city (part), Snohomish CCD, Snohomish County, Washington
Marysville city (part), Stanwood CCD, Snohomish County, Washington
Medina city, East Seattle CCD, King County, Washington
Mercer Island city, East Seattle CCD, King County, Washington
Mill Creek city (part), Edmonds CCD, Snohomish County, Washington
Mill Creek city (part), Everett CCD, Snohomish County, Washington
Milton city (part), Auburn CCD, King County, Washington
Milton city (part), Tacoma CCD, Pierce County, Washington
Newcastle city, East Seattle CCD, King County, Washington
North Bend city, Snoqualmie Valley CCD, King County, Washington
Orting city (part), Puyallup CCD, Pierce County, Washington
Pacific city (part), Auburn CCD, King County, Washington
Port Orchard city (part), Port Orchard CCD, Kitsap County, Washington
Renton city (part), Seattle CCD, King County, Washington
Monroe city, Monroe CCD, Snohomish County, Washington
Mountlake Terrace city, Edmonds CCD, Snohomish County, Washington
Mukilteo city (part), Edmonds CCD, Snohomish County, Washington
Mukilteo city (part), Everett CCD, Snohomish County, Washington
Poulsbo city, Poulsbo CCD, Kitsap County, Washington
Puyallup city (part), Puyallup CCD, Pierce County, Washington
Redmond city, East Seattle CCD, King County, Washington
Renton city (part), East Seattle CCD, King County, Washington
52.89%
45.07%
58.26%
60.99%
39.60%
48.07%
96.93%
83.23%
124.42%
84.56%
66.33%
106.99%
34.38%
21.16%
85.69%
170.79%
58.62%
104.12%
116.58%
66.56%
48.70%
53.70%
54.93%
137.84%
170.68%
Actual % Non-White/Predicted % Non-White
Predicted Racial/Ethnic Composition is Higher Than ExpectedPredicted Racial/Ethnic Composition Falls Within 90%-110% (Expected Range)Predicted Racial/Ethnic Composition is Lower Than Expected
Lake Stevens city (part), Lake Stevens CCD, Snohomish County, Washington
Lake Stevens city (part), Marysville CCD, Snohomish County, Washington
Lakewood city (part), Tacoma CCD, Pierce County, Washington
Lynnwood city, Edmonds CCD, Snohomish County, Washington
63.43%
59.56%
144.07%
133.26%

Fair Housing Equity Assessment for the Central Puget Sound Region | Appendix 93
Seattle city, Seattle CCD, King County, Washington
Shoreline city, Seattle CCD, King County, Washington
Snohomish city, Snohomish CCD, Snohomish County, Washington
Snoqualmie city, Snoqualmie Valley CCD, King County, Washington
South Prairie town, Buckley CCD, Pierce County, Washington
Stanwood city, Stanwood CCD, Snohomish County, Washington
Steilacoom town, Tacoma CCD, Pierce County, Washington
Sumner city, Puyallup CCD, Pierce County, Washington
Tacoma city, Tacoma CCD, Pierce County, Washington
Tukwila city, Seattle CCD, King County, Washington
University Place city, Tacoma CCD, Pierce County, Washington
Wilkeson town (part), Buckley CCD, Pierce County, Washington
Woodinville city, East Seattle CCD, King County, Washington
Woodway city, Edmonds CCD, Snohomish County, Washington
Yarrow Point town, East Seattle CCD, King County, Washington
Source: HUD
115.15%
104.97%
41.12%
82.19%
12.54%
31.34%
100.93%
52.13%
121.23%
189.00%
107.72%
28.57%
72.57%
74.82%
51.05%
Actual % Non-White/Predicted % Non-White
Predicted Racial/Ethnic Composition is Higher Than ExpectedPredicted Racial/Ethnic Composition Falls Within 90%-110% (Expected Range)Predicted Racial/Ethnic Composition is Lower Than Expected
Roy city, Roy CCD, Pierce County, Washington
Ruston town, Tacoma CCD, Pierce County, Washington
Samish CCD, Samish CCD, Skagit County, Washington
Sammamish city (part), East Seattle CCD, King County, Washington
Sammamish city (part), Issaquah Plateau CCD, King County, Washington
SeaTac city, Seattle CCD, King County, Washington
78.01%
73.17%
47.38%
102.60%
119.38%
181.03%
Fair Housing Equity Assessment for the Central Puget Sound Region | Appendix 94
Cases of Note
Appendix II
I. United States v. City of New Orleans 31 – The City of New Orleans stopped development of an affordable housing project by putting a moratorium on the funding source. Two non-affordable housing developments with the same type of funding were allowed to continue as “exceptions” while exception status was denied to the affordable housing. The Department of Justice filed suit claiming that the city of New Orleans had discriminated against the affordable housing development because it would house higher percentages of people of color and people with disabilities. The City of New Orleans filed a motion to dismiss the case for failure to state a claim, however the court determined that there was enough evidence to state a claim and the case will be considered in court and is on-going.
II. United States v. St. Bernard Parish2 - The Department of Justice filed a complaint against St. Bernard Parish alleging that the Parish violated the Fair Housing Act by limiting rental housing opportunities for African-Americans through exclusionary zoning practices after Hurricane Katrina. These practices included the establishment of a restrictive permit-approval process for single-family rentals, the elimination of multi-family zoning from most of the parish zoning map, and repeated attempts to block the construction of multi-family affordable-housing developments on pretextual grounds. The settlement reached was valued at more than $2.5 million to resolve separate lawsuits by the United States and private plaintiffs.
III. United States ex rel. Anti-Discrimination Center of metro New York, Inc. v. Westchester County, New York3 - On July 13, 2011, HUD notified the County that it had failed to meet a consent decree requirement when the County Executive vetoed legislation to incorporate corrective actions which promote source-of-income legislation and plans to overcome exclusionary zoning practices. That same year the Monitor submitted a report stating that Defendant breached its obligation in the consent decree. On May 29, 2013, after a long dispute the Court of Appeals affirmed the District Court decision, agreeing that Defendant violated the terms of the consent decree, and allowing the full adoption of the Monitor’s Report. 712 F.3d 761. This case is still ongoing.
IV. United States v. Sussex County4 – The Department of Justice filed suit alleging that the county’s planning and zoning commission denied land use approval for an affordable housing subdivision proposed by a developer which had a disparate impact on African Americans and Latinos. The consent decree requires the county to pay $750,000 to the developer, to reconsider the proposed land use using nondiscriminatory criteria, prevents the county from obstructing or delaying any affordable housing that is proposed by the developer without a substantial justification that is neutral on its face and consistent with applicable zoning laws and finally, requires the county to take affirmative steps to provide for future affordable housing.
United States v. City of New Orleans, 2012 WL 1767787 (E.D. La. April 24, 2013)
“Justice Department Charges St. Bernard Parish, Louisiana for Limited Rental Housing Opportunities for African-Americans,” Jan. 31, 2012. At: http://www.justice.gov/opa/pr/2012/January/12-crt-143.html. “Settlement Agreement between the United States and St. Bernard Parish,” May 10, 2013. At: http://www.justice.gov/crt/about/hce/documents/stbernardsettle.pdf.
United States ex rel. Anti-Discrimination Center of metro New York, Inc. v. Westchester County, New York, 712 F.3d 761 (2nd Cir. 2013).
United States v. Sussex Cnty., No. 12cv1591 (D. Del. Consent Decree filed Nov. 28, 2012)
1
2
3
4

Fair Housing Equity Assessment for the Central Puget Sound Region | Appendix 95
United States v. Wells Fargo Bank, NA 891 F. Supp2d 143 (D.D.C. 2012)5
V. Fair housing case of note not related to affirmatively furthering: United States v. Wells Fargo Bank, NA5 - Consent Decree was reached in the case which alleged that Wells Fargo engaged in a pattern or practice of discrimination against qualified African-American and Hispanic borrowers in its mortgage lending from 2004 to 2009. The settlement provides $125 million in compensation for borrowers who, because of their race or national origin, were steered into subprime mortgages or who paid higher fees and rates even when they qualified for prime mortgages and lower fees that were offered to white borrowers. Wells Fargo was also required to pay $50 million in direct down payment assistance to borrowers in communities around the country where the Department of Justice identified large numbers of discrimination victims and which were hard hit by the housing crisis.

Fair Housing Equity Assessment for the Central Puget Sound Region | Appendix 96
Introduction to Testing Methodology
Appendix III
Testing provides a snapshot of the housing market and gives voice to the experience of renters, particularly those in protected classes. Testing refers to the use of individuals who, without a bona fide intent to rent or purchase a home, apartment, or other dwelling, pose as prospective renters or purchasers to obtain information for the purpose of evaluating the compliance of housing providers with fair housing laws. In the landmark case, Havens v. Coleman, the United States Supreme Court recognized the importance, legality, and power of testing as a mechanism for measuring and correcting discriminatory housing practices.
Fair housing testing utilizes rigorous protocols to ensure that any discrepancies identified in the course of testing can be attributed to differential treatment. Because of the multiple variables involved in a housing transaction, testing results are not definitive measures of discriminatory conduct in the rental housing market. Nonetheless, the aggregate results of testing conducted in the region provide an objective opportunity to identify geographical and protected class trends critical to the identification of impediments to fair housing choice.
For the purposes of this report, testing results are defined as either “positive” or “negative.” A test will be defined as “positive” when one or more adverse differences are identified in the information provided to the protected class tester compared to their non-protected counterpart. For example, if a protected class tester is provided a higher quote for security deposit than the control tester, the test will be defined as “positive” because of its evidence of differential treatment. Tests are defined as negative when testers are provided equivalent information (or given equal treatment) regarding housing opportunities (no differential treatment). Overall, while testing may provide an objective means to identify differential practices, the presence of differences does not necessarily mean that a housing provider is engaging in housing discrimination. Likewise, the lack of observed differences at a particular site does not preclude the existence of discriminatory practices.

Fair Housing Equity Assessment for the Central Puget Sound Region | Appendix 97
Public Comment/Individual Interview Themes
Appendix IV
Access to High Opportunity Areas
Snohomish and Pierce County forum participants were distinguished in identifying challenges for rural communities in accessing or developing high opportunity areas.
King County participants identified differences between the City of Seattle and the rest of the county. The key distinction observed by participants in the King County forum was high opportunity areas in Seattle are more engaged in promoting opportunity whereas communities in suburban areas are protective of opportunity resources and discourage widening access to opportunity resources.
The Power of Institutions
Forum participants observed that social service, education, government, and business institutions operate on policies and practices that perpetuate the status quo of segregating high opportunity and low opportunity areas. Institutional policies and practices are focused on controlling behavior and using resources as an award for good behavior rather than improving access to opportunity.
Institutional racism was identified as being a persistent problem in the central Puget Sound region and a major contributor to limiting access to high opportunity areas. Institutional racism was identified as a top reason why opportunity gaps are geographically distinct.
Culture Gaps
Projects aimed at furthering access to opportunity often lack cultural competency. Forum participants observed that efforts to improve access to opportunity are “one size fits all”. Barriers to opportunity vary. Immigrants may require support around learning English as a second language or getting access to capital investments for their businesses. Blacks may need more support around fighting discriminatory practices in the private rental market. Efforts to bridge the opportunity gap need to be multimodal and have the flexibility to address the challenges of diverse communities.
“Not in My Backyard” (NIMBY)
Forum participants were quick to observe efforts to improve access to opportunity are met with resistance. People who live in high opportunity areas may oppose diversifying access to their resources because they believe they have a proprietary claim to resources and/or they believe extending resources to more people will diminish the benefit for their own communities. Participants observed racism was a significant influence in NIMBY attitudes.
Impact of Government Policy
Government policy was cited as an area with potential for influence in bridging the opportunity gaps in the central Puget Sound region. Communities in the region generally have shown support for progressive policies such as investing in housing or schools across region (Seattle Housing Levy, King County Veterans Levy/Landlord Liaison Program), but community support alone cannot ensure the success of these policies. Participants at the forum believed by educating politicians, policy-makers, and community leaders on issues such as housing discrimination, common barriers to opportunity, and the benefits of community-based/targeted public investments, they will be able to craft effective interventions.
The condition of the economy over the past five years combined with growing partisanship on the local, state, and federal level, makes it increasingly difficult to build the coalitions and infrastructure needed to improve access to opportunity.
Interestingly, land use rules were identified as a possible place to begin. Land use rules are a well-established area of governance. Similarly, land/property is a resource common to all localities. Significant gains could be made in bridging opportunity gaps by examining how land use practices could be tailored to promote affordable housing, transitioning people out of homelessness, and improving access to community resources (job training, child care, health care, education, and social services).

Fair Housing Equity Assessment for the Central Puget Sound Region | Appendix 98
Transportation/Jobs/Affordable Housing
The conversations about transportation, jobs, and access to housing were interconnected. Together, they are the three pillars supporting access to opportunity. When all three areas are secure and well-supported, access to opportunity resources is significantly improved. Unfortunately, having uncertainty in just one of the three areas can hinder access to opportunity resources and perpetuate poverty.
Transportation and transportation costs influence where people live and their jobs. People with conventional jobs—where they work eight hours a day, Monday through Friday—have great transportation options. Metro Transit, Sound Transit, and other regional public transportation systems are designed to provide reasonable commuting options during peak hours to urban areas. People who lived in low opportunity areas; however, are more likely to work in jobs that have non-standard hours or have more than one job. Another challenge can be a commute that may require more than one stop. For example, a single parent who needs to drop off his or her child to daycare may not be able to benefit from the use of public transportation unless the transfer points and time schedules are favorable.
The transportation infrastructure is also biased to deliver people to major downtown areas. People who are trying to get to one neighborhood to another may experience extremely long commutes. For example, a person trying to get to Burien from North Seattle will have to use two bus routes and spend nearly two hours on the trip. Similarly, it can take nearly two hours to get to parts of West Seattle and the Rainier Valley from North Seattle. Many people who live in low opportunity areas will devote more of their income toward maintaining their own transportation to avoid such significant time loss.
Areas with affordable housing lack transit access (Snohomish and Pierce Counties). Lack of transit options decreases employability because many low wage jobs have work schedules that don’t coincide with public transit schedules. Difficulty of reaching areas of higher opportunity as can be the result of tolls and transportation costs.
Employment and affordable housing are closely related. Living close to where one works is considered a great benefit of urban living. Participants in the
forums readily identified that people who live in low opportunity areas have no such benefit; instead, they face a dilemma: live in an area they can afford where there are no jobs, or try to live in an area with jobs with housing that may be too expensive to sustain.
Section 8 and Fair Market Rates
The affordable housing program that produced the most comments from the forum participants was the Housing Choice Voucher Program (Section 8). The payment standards used to determine the amount of subsidy program participants receive is not aligned to the Fair Market Rates (FMR) for rent in the high opportunity areas of the region. The Section 8 program allows program participants to contribute up to 40% of their household income for rent and utilities, but the FMR’s are increasing while the income of Section 8 participants remains flat. The effect results in Section 8 participants being unable to move to high opportunity areas even though they receive housing assistance.
Forum participants observed the majority of housing assistance programs are concentrated in urban areas, and generally rural areas do not have access to as many affordable housing resources. Some participants felt some programs are designed to increase the density of affordable housing, thus creating an urban bias.
Market Practices
Criminal background checks and application costs associated with renting were identified as being barriers to renting in high opportunity areas. Market assessments of criminal history, credit history, domestic violence, and history of homelessness impede employability and housing choice. An idea identified by forum participants was to create a portable background check or a background check registry.
The distribution of affordable housing for families overlaps in areas of high racial and ethnic concentration. For example: White Center and Skyway tend to have larger units but not areas of high opportunity. High opportunity areas do not have family-sized units that are affordable to the working poor.
Familial and Community Connections
Families living in low opportunity areas identified the
Fair Housing Equity Assessment for the Central Puget Sound Region | Appendix 99
need to be close to, or within easy transportation, of community services. Families often face the dilemma of choosing between opportunity and family/community connections. Families who have the resources to move to areas higher in the opportunity spectrum, like by using a Housing Choice Voucher, travel greater distances from established family and existing social support systems. Moving to a high opportunity area may offer tangible benefits, but fear of social isolation deters families from leaving their established communities.
