failure criterion for two-ply plain-weave cfrp...
TRANSCRIPT
Failure Criterion for Two-Ply Plain-Weave CFRP Laminates
H.M.Y.C. Mallikarachchi∗, Sergio Pellegrino
Graduate Aerospace Laboratories, California Institute of Technology1200 E. California Blvd MS 301-46, Pasadena, CA 91125
Abstract
We present an experimentally-based failure criterion for symmetric two-ply plain-weave lami-nates of carbon-fiber reinforced plastic. The criterion is formulated in terms of six force andmoment stress resultants and consists of a set of three inequalities, related to in-plane, bending,and combined in-plane and bending types of failure. All failure parameters in the criterion aremeasured directly from five sets of tests. The new criterion is validated against an extensive dataset of failure test results that use novel sample configurations to impose different combinationsof stress resultants. It is found that the proposed criterion is safe for all test conditions and yetavoids excessive conservatism.
Keywords:composite materials, failure criterion, plain weave, deployable structures
1. Introduction and Background
Predicting failure in composite materials is challenging. Even for the simple case of unidi-rectional laminates under in-plane loading conditions the recent World-Wide Failure Exercise [1]has shown that standard and now widely-used failure criteria have limited predictive accuracy.For woven laminates the situation is more complex as the weave geometry introduces stochasticvariations in the distribution and arrangement of the fibers that are responsible for stress concen-trations. These effects become more significant in thin laminates, i.e. laminates of only one ortwo plies, which are of particular interest for lightweight deployable space structures.
We have been working on stored-strain-energy composite deployable booms with tape-springhinges made from a two-ply laminate of plain weave carbon fiber reinforced plastic (CFRP) andhave developed high fidelity computer simulation techniques for folding and dynamic deploy-ment of these booms. [2, 3] In these simulations the laminate is modeled as a Kirchhoff thin platewith elastic properties provided by its ABD stiffness matrix, which relates the mid-plane strainsand curvatures to the corresponding force and moment resultants. This matrix, obtained frommicro-mechanical homogenization, defines a continuum-shell model of the boom with whichfolding and deployment analyses were successfully carried out.
The results of this macro-level analysis can be used to determine in detail the stress and straindistribution in the representative volume element which, in combination with a failure criterion
∗Currently at: Department of Civil Engineering, University of Moratuwa, Sri Lanka.Email addresses: [email protected] (H.M.Y.C. Mallikarachchi), [email protected] (Sergio Pellegrino)
Preprint submitted to Journal of Composite Materials April 14, 2012
such as Tsai and Wu [4] or Hashin and Rotem [5], should be able to provide an estimate forthe onset of failure at a point of the boom. This approach is well established and is generallyknown as Direct Micromechanics Method[6] but, when we applied it to the prediction of failureof two-ply laminates we obtained poor correlation between predictions and experiments.
The relevant literature on woven composites provides some useful clues but no definitive an-swer. Chou [7] summarizes various mechanics based models for stiffness and strength predictionof 2D and 3D woven composites. It reports that micro-mechanical models have been success-fully employed in predicting thermoelastic properties but their use for strength prediction undermulti-axial loading is still under development. Cox et al. [8] have developed a binary modelwhich performs Monte Carlo simulations of failure under monotonic and fatigue loading. Theyhave highlighted the importance of realistic representation of the pattern of reinforcing tows,random irregularity in tow positioning, randomness of the strengths of constituent elements andthe mechanics of stress distribution around sites of local failure. Whitcomb and Srirengan [9]have shown that quadrature order and mesh refinement of the finite element model have a signif-icant effect on the prediction of failure of plain weave composite subjected to in-plane extension.Song et al. [10] have shown that there is a significant difference between compressive failurestrength obtained from a single unit cell and multiple unit cells, for two-dimensional braidedtextile composites.
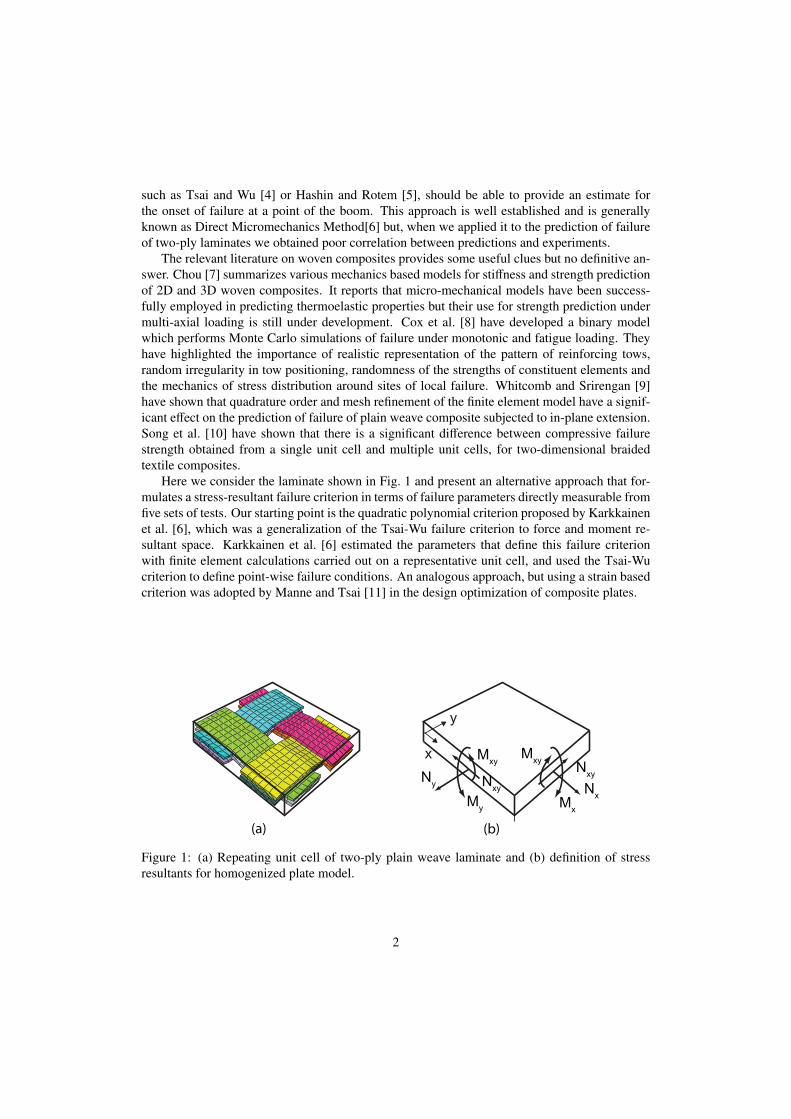
Here we consider the laminate shown in Fig. 1 and present an alternative approach that for-mulates a stress-resultant failure criterion in terms of failure parameters directly measurable fromfive sets of tests. Our starting point is the quadratic polynomial criterion proposed by Karkkainenet al. [6], which was a generalization of the Tsai-Wu failure criterion to force and moment re-sultant space. Karkkainen et al. [6] estimated the parameters that define this failure criterionwith finite element calculations carried out on a representative unit cell, and used the Tsai-Wucriterion to define point-wise failure conditions. An analogous approach, but using a strain basedcriterion was adopted by Manne and Tsai [11] in the design optimization of composite plates.
My
Mxy
Mxy
Mx
x
y
Ny
Nx
Nxy
Nxy
(a) (b)
Figure 1: (a) Repeating unit cell of two-ply plain weave laminate and (b) definition of stressresultants for homogenized plate model.
2
The failure criterion proposed by Karkkainen et al. [6] can be expressed in the general form
fiσi + fi jσiσ j = 1 (1)
where σi = Nx, Ny, Nxy,Mx, My, Mxy for i = 1, . . . , 6 are the stress resultants defined in Fig. 1.The parameters fi and fi j represent respectively 6 and 21 (note that fi j = f ji) failure coefficientssuch that Equation 1 defines a failure condition when its magnitude exceeds 1. The parametersfi and the diagonal terms fii correspond to individual loading conditions in which only one stressresultant is non-zero; the non-diagonal terms fi j with i , j, deal with coupling between differentstress resultants.
Due to the four-fold rotational symmetry about the z-axis of the laminate, the parameters fiand fi j should not change if x and y are exchanged. This is equivalent to requiring f1 = f2,f4 = f5 and f11 = f22, f44 = f55, f13 = f23, f14 = f15 = f24 = f25, f16 = f26, f34 = f35, f46 = f56.These equalities reduce the 27 failure coefficients to only 16.
The same four-fold symmetry also requires the strength of the laminate to be independentof the sign of the in-plane shearing and twisting resultants and it can also be shown that thestrength of the laminate is independent of the sign of the out-of-plane bending moment. Becausethe laminate is not symmetric with respect to its xy mid-plane, this last property can be shown byconsidering an alternative unit cell that is translated by half the width of the unit cell shown infig. 1a, and then arguing that since both unit cells have the same bending strength its magnitudehas to be independent of the sign of the moment. Thus it is concluded that all parameters thatmultiply a linear term in Nxy,Mx,My, or Mxy should also vanish and this condition sets fi = 0 fori = 3, . . . 6 and fi j = 0 for i = 1, . . . , 6 and j > i, apart from f12.
The net outcome of the stated symmetry conditions is that there are only 6 non-zero failureparameters: f1 = f2, f11 = f22, f12, f33, f44 = f55, f66 and so the failure criterion has theexpression:
f1(Nx + Ny) + f11(N2x + N2
y ) + f12NxNy + f33N2xy + f44(M2
x + M2y ) + f66M2
xy = 1 (2)
where the failure parameters can be obtained as follows. It should be noted that Karkkainen etal. [6] considered only the symmetry conditions fi = 0 for i = 3, . . . 6 in defining their locus.
Consider a purely tensile loading condition for the laminate, where the load is acting in thex-direction and F1t is the measured tensile strength. Substituting Nx = F1t and Ny = Nxy = Mx =
My = Mxy = 0 into Equation 2 gives
f1F1t + f11F21t = 1 (3)
Similarly, consider a purely compressive loading in the x-direction and denote by F1c themeasured compressive strength. Substituting Nx = −F1c and Ny = Nxy = Mx = My = Mxy = 0into Equation 2 gives
− f1F1c + f11F21c = 1 (4)
Equations 3 and 4 can be solved for f1 and f11
f1 =1
F1t− 1
F1c(5a)
f11 =1
F1tF1c(5b)
3
Similarly, considering pure shear, bending and twisting loading conditions one finds that
f33 =1
F23
(6a)
f44 =1
F24
(6b)
f66 =1
F26
(6c)
where F3, F4 and F6 are respectively the measured strengths in shear, bending and twisting.The last failure coefficient, f12, is in general difficult to determine experimentally. Liu and
Tsai [12] have shown that for typical carbon and glass fiber composites it can vary between-0.9
√f11 f22 and 0. They have also shown that a reasonable approximation is
f12 = −√
f11 f22
2(7)
which is referred to as generalized von Mises model.In conclusion, incorporating the previously noted symmetry conditions, the failure coeffi-
cients are given by:
f1 = f2 =1
F1t− 1
F1c(8a)
f11 = f22 =1
F1tF1c(8b)
f12 = −f11
2(8c)
f33 =1
F23
(8d)
f44 = f55 =1
F24
(8e)
f66 =1
F26
(8f)
where Fi represent directly measured strengths in the tow directions of the laminate, and thesubscripts t and c denote tension and compression, respectively.
In the next section we will present a set of five test configurations that provide the requiredfailure strengths, plus an additional set of five tests to measure the failure strengths under theaction of combined stress resultants. These additional results provide experimental data thatwill be used to validate the failure criterion. The results from these tests are presented in Sec-tion 3. Then, in Section 4 it is shown that the quadratic criterion in Equation 2 is unable to fullycapture the interaction between stress resultants and thus a new failure criterion is proposed inSection 5. The parameters for the new criterion are still obtained from the original set of five fail-ure strengths but the new criterion works much better for all combined loading cases. Section 6discusses the new failure criterion and Section 7 concludes the paper.
4
2. Strength Measurements
Useful background to the tests presented in this section is provided in Masters and Portanova[13]. Also, ASTM D6856 [14] provides general guidelines for testing textile composites aswell as some changes that should be made before using standards developed for unidirectionallaminates.
The strength properties of two-ply T300-1k/Hexcel 913 plain weave laminates were charac-terized by means of a range of failure tests on sets of nominally identical samples. All laminateswere made by impregnating T300-1k [15] plain weave dry fabric with Hexcel 913 [16] epoxyresin. Lay-ups of resin impregnated fabric were cut to the required dimensions and cured inan autoclave under vacuum for 1 h at 125◦C and under a pressure of 600 kPa. The fiber vol-ume fraction of the samples was 0.62, the areal density 280 g/mm2 and the average thickness0.22 mm.
All tests were done on an Instron 5569 materials testing machine, using either a 50 kN or a1 kN load cell. All strain measurements were made with Epsilon LE01 and LE05 laser exten-someters.
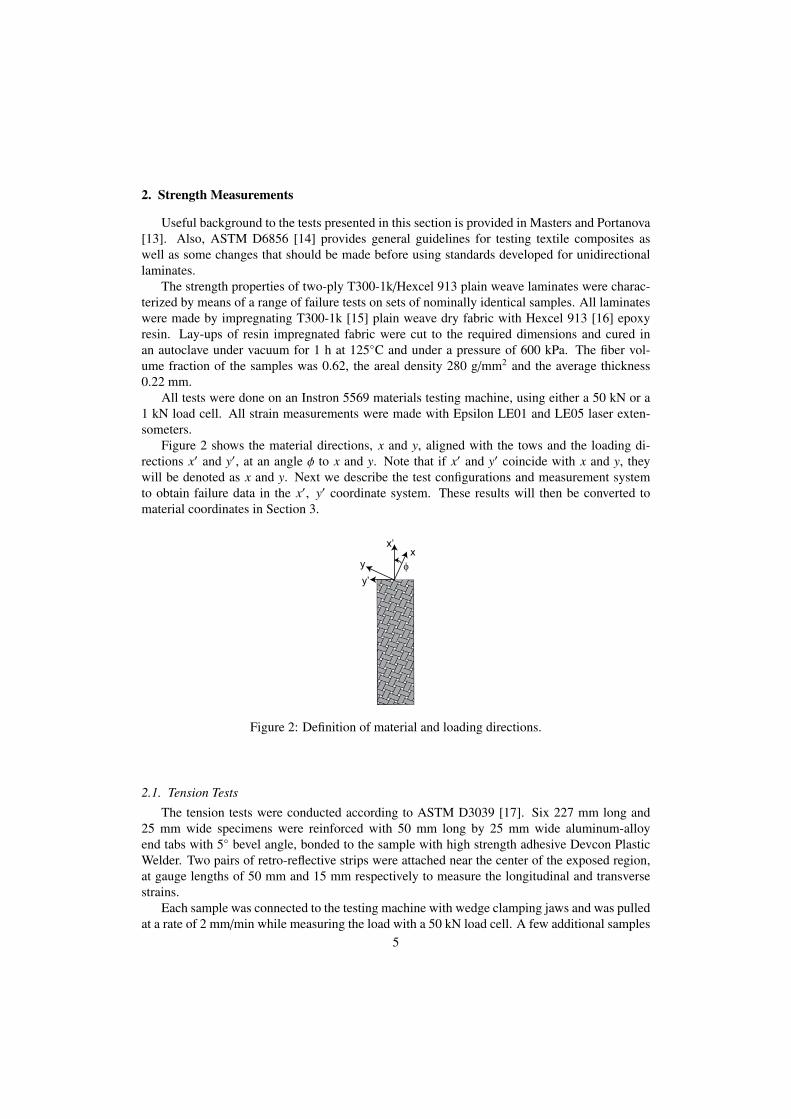
Figure 2 shows the material directions, x and y, aligned with the tows and the loading di-rections x′ and y′, at an angle ϕ to x and y. Note that if x′ and y′ coincide with x and y, theywill be denoted as x and y. Next we describe the test configurations and measurement systemto obtain failure data in the x′, y′ coordinate system. These results will then be converted tomaterial coordinates in Section 3.
xy
x’
y’
φ
Figure 2: Definition of material and loading directions.
2.1. Tension Tests
The tension tests were conducted according to ASTM D3039 [17]. Six 227 mm long and25 mm wide specimens were reinforced with 50 mm long by 25 mm wide aluminum-alloyend tabs with 5◦ bevel angle, bonded to the sample with high strength adhesive Devcon PlasticWelder. Two pairs of retro-reflective strips were attached near the center of the exposed region,at gauge lengths of 50 mm and 15 mm respectively to measure the longitudinal and transversestrains.
Each sample was connected to the testing machine with wedge clamping jaws and was pulledat a rate of 2 mm/min while measuring the load with a 50 kN load cell. A few additional samples
5
were subjected to four cycles with maximum load of 80% of failure to confirm linearity and lackof hysteresis.
2.2. Compression TestsStandard compression test procedures are not applicable to thin composites as failure would
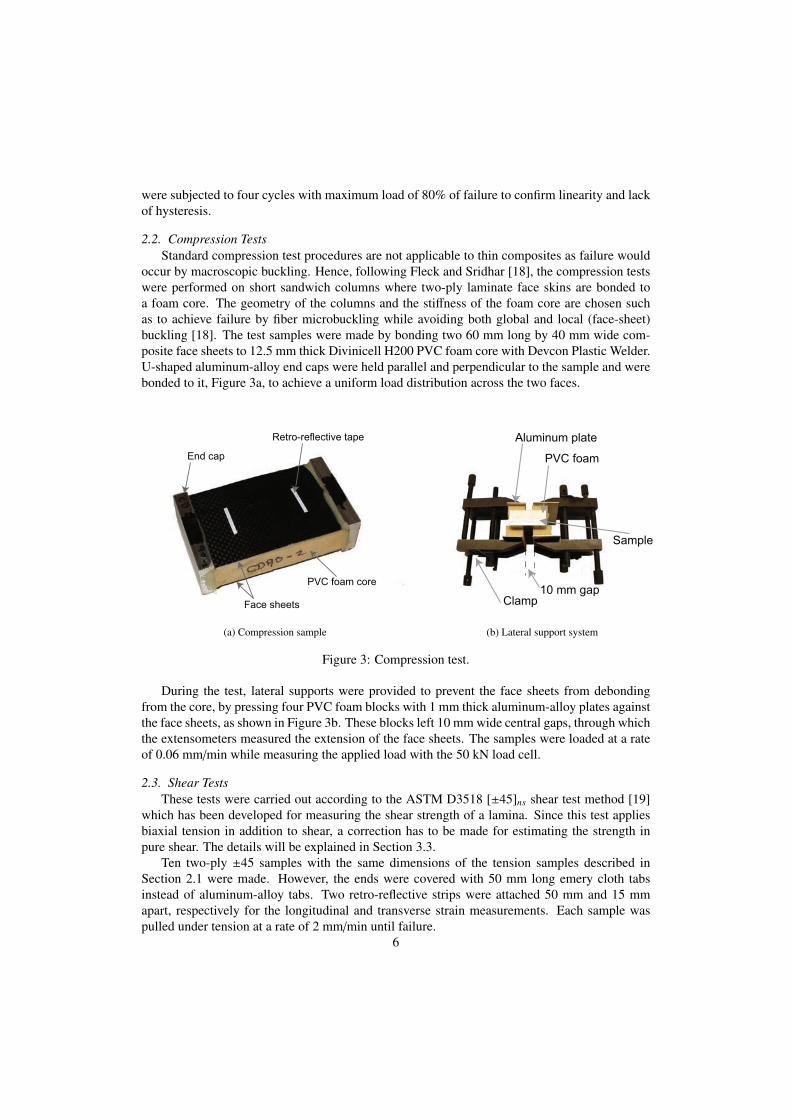
occur by macroscopic buckling. Hence, following Fleck and Sridhar [18], the compression testswere performed on short sandwich columns where two-ply laminate face skins are bonded toa foam core. The geometry of the columns and the stiffness of the foam core are chosen suchas to achieve failure by fiber microbuckling while avoiding both global and local (face-sheet)buckling [18]. The test samples were made by bonding two 60 mm long by 40 mm wide com-posite face sheets to 12.5 mm thick Divinicell H200 PVC foam core with Devcon Plastic Welder.U-shaped aluminum-alloy end caps were held parallel and perpendicular to the sample and werebonded to it, Figure 3a, to achieve a uniform load distribution across the two faces.
End cap
Retro-reflective tape
PVC foam core
Face sheets
(a) Compression sample
Aluminum plate
PVC foam
Sample
10 mm gapClamp
(b) Lateral support system
Figure 3: Compression test.
During the test, lateral supports were provided to prevent the face sheets from debondingfrom the core, by pressing four PVC foam blocks with 1 mm thick aluminum-alloy plates againstthe face sheets, as shown in Figure 3b. These blocks left 10 mm wide central gaps, through whichthe extensometers measured the extension of the face sheets. The samples were loaded at a rateof 0.06 mm/min while measuring the applied load with the 50 kN load cell.
2.3. Shear TestsThese tests were carried out according to the ASTM D3518 [±45]ns shear test method [19]
which has been developed for measuring the shear strength of a lamina. Since this test appliesbiaxial tension in addition to shear, a correction has to be made for estimating the strength inpure shear. The details will be explained in Section 3.3.
Ten two-ply ±45 samples with the same dimensions of the tension samples described inSection 2.1 were made. However, the ends were covered with 50 mm long emery cloth tabsinstead of aluminum-alloy tabs. Two retro-reflective strips were attached 50 mm and 15 mmapart, respectively for the longitudinal and transverse strain measurements. Each sample waspulled under tension at a rate of 2 mm/min until failure.
6
2.4. Bending Tests
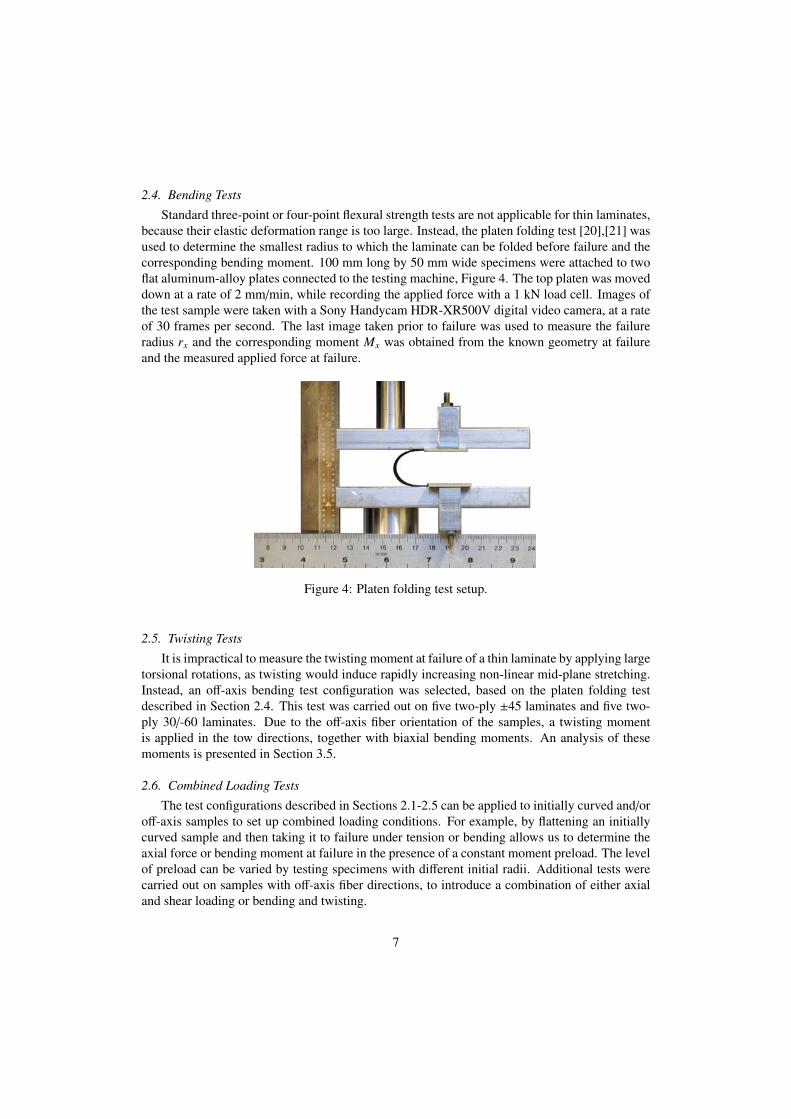
Standard three-point or four-point flexural strength tests are not applicable for thin laminates,because their elastic deformation range is too large. Instead, the platen folding test [20],[21] wasused to determine the smallest radius to which the laminate can be folded before failure and thecorresponding bending moment. 100 mm long by 50 mm wide specimens were attached to twoflat aluminum-alloy plates connected to the testing machine, Figure 4. The top platen was moveddown at a rate of 2 mm/min, while recording the applied force with a 1 kN load cell. Images ofthe test sample were taken with a Sony Handycam HDR-XR500V digital video camera, at a rateof 30 frames per second. The last image taken prior to failure was used to measure the failureradius rx and the corresponding moment Mx was obtained from the known geometry at failureand the measured applied force at failure.
Figure 4: Platen folding test setup.
2.5. Twisting Tests
It is impractical to measure the twisting moment at failure of a thin laminate by applying largetorsional rotations, as twisting would induce rapidly increasing non-linear mid-plane stretching.Instead, an off-axis bending test configuration was selected, based on the platen folding testdescribed in Section 2.4. This test was carried out on five two-ply ±45 laminates and five two-ply 30/-60 laminates. Due to the off-axis fiber orientation of the samples, a twisting momentis applied in the tow directions, together with biaxial bending moments. An analysis of thesemoments is presented in Section 3.5.
2.6. Combined Loading Tests
The test configurations described in Sections 2.1-2.5 can be applied to initially curved and/oroff-axis samples to set up combined loading conditions. For example, by flattening an initiallycurved sample and then taking it to failure under tension or bending allows us to determine theaxial force or bending moment at failure in the presence of a constant moment preload. The levelof preload can be varied by testing specimens with different initial radii. Additional tests werecarried out on samples with off-axis fiber directions, to introduce a combination of either axialand shear loading or bending and twisting.
7
2.6.1. In-Plane LoadingOff-axis tension tests are commonly used as biaxial loading tests to verify material properties
determined with standard uniaxial tests [22]. Five [30/-60]2 samples were tested; the sampleconfiguration and test procedure were similar to the shear tests described in Section 2.3, but thistime a combination of biaxial and shear loads was applied.
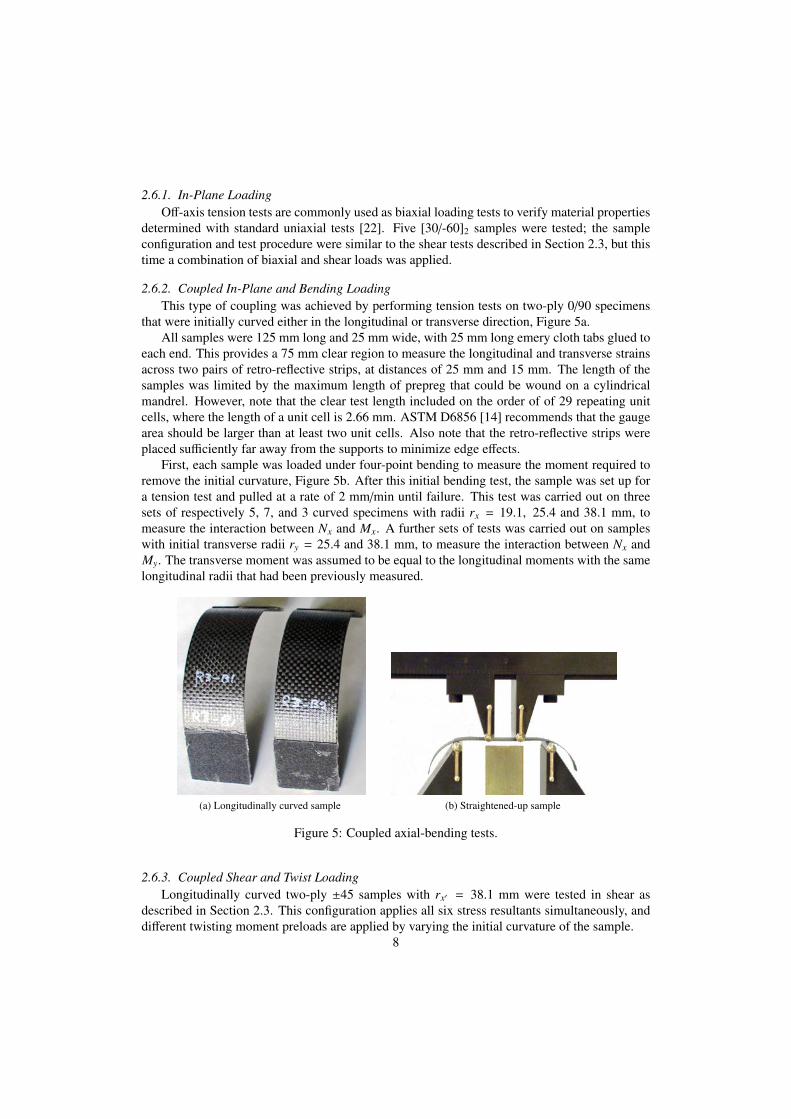
2.6.2. Coupled In-Plane and Bending LoadingThis type of coupling was achieved by performing tension tests on two-ply 0/90 specimens
that were initially curved either in the longitudinal or transverse direction, Figure 5a.All samples were 125 mm long and 25 mm wide, with 25 mm long emery cloth tabs glued to
each end. This provides a 75 mm clear region to measure the longitudinal and transverse strainsacross two pairs of retro-reflective strips, at distances of 25 mm and 15 mm. The length of thesamples was limited by the maximum length of prepreg that could be wound on a cylindricalmandrel. However, note that the clear test length included on the order of of 29 repeating unitcells, where the length of a unit cell is 2.66 mm. ASTM D6856 [14] recommends that the gaugearea should be larger than at least two unit cells. Also note that the retro-reflective strips wereplaced sufficiently far away from the supports to minimize edge effects.
First, each sample was loaded under four-point bending to measure the moment required toremove the initial curvature, Figure 5b. After this initial bending test, the sample was set up fora tension test and pulled at a rate of 2 mm/min until failure. This test was carried out on threesets of respectively 5, 7, and 3 curved specimens with radii rx = 19.1, 25.4 and 38.1 mm, tomeasure the interaction between Nx and Mx. A further sets of tests was carried out on sampleswith initial transverse radii ry = 25.4 and 38.1 mm, to measure the interaction between Nx andMy. The transverse moment was assumed to be equal to the longitudinal moments with the samelongitudinal radii that had been previously measured.
(a) Longitudinally curved sample (b) Straightened-up sample
Figure 5: Coupled axial-bending tests.
2.6.3. Coupled Shear and Twist LoadingLongitudinally curved two-ply ±45 samples with rx′ = 38.1 mm were tested in shear as
described in Section 2.3. This configuration applies all six stress resultants simultaneously, anddifferent twisting moment preloads are applied by varying the initial curvature of the sample.
8
2.6.4. Coupled Biaxial BendingThe bending test configuration described in Section 2.4 can be applied to 0/90 and ±45 trans-
versely curved samples to impose biaxial bending conditions. These samples were first flattenedand then subjected to longitudinal bending in the platen folding test, up to failure. The initialcurvature and the curvature applied during the test were in the opposite sense and hence the cur-vature changes were of the same sign. These tests were carried out by Yee and Pellegrino [23]and Yee [24], on the same laminates that are investigated in the present study, but cured withLTM45 epoxy resin instead of Hexcel 913. Since there are no significant differences in the prop-erties of these two resins the tests were not repeated, instead it was decided to use the publishedresults.
2.6.5. Coupled Bending and Twist LoadingThe biaxial bending test described in Section 2.6.4 on an off-axis sample applies both biaxial
bending and twisting in the material directions. Hence, this test configuration was applied totwo-ply ±45 samples with transverse radii ry′ = 25.4 and 38.1 mm.
3. Experimental Results
This section analyzes the results obtained from the experiments described in Section 2. Foreach experiment the sample average, x̄, standard deviation, sn−1, and coefficient of variation, CV ,were determined. These parameters are defined as
x̄ =
n∑i=1
xi
n(9a)
sn−1 =
√√√√√√√√ n∑i=1
x2i − nx̄2
(n − 1)(9b)
CV =100 × sn−1
x̄% (9c)
where xi is a general measured or derived property and n is the number of tested samples. Notethat, because of the brittle failure type that we are dealing with, for each set of tests the corre-sponding failure strength will be simply taken as the minimum value obtained from that set.
Since we are dealing with sets the full set of plate stress resultants and only a limited numberof them can be determined from direct measurements, the standard elastic relationship betweenout-of-plane stress resultants and the corresponding deformation variables will be used to deter-mine any stress resultants that cannot be measured. Modeling the laminate as a thin Kirchhoffplate and introducing a single correcting factor to account for geometry change effects in thelaminate near failure, this relationship has the form
∆Mx′
∆My′
∆Mx′y′
= α D11 D12 D16
D21 D22 D26D61 D62 D66
∆κx′
∆κy′
∆κx′y′
(10)
9
where the three by three constitutive matrix is the D matrix for the plate and α is a stiffnessreduction factor that is obtained experimentally. Its values are 0.6, 0.67 and 0.8, respectively for0/90, 30/-60 and ±45 laminates, see Sections 3.4 and 3.5 for details.
Experimentally validated D matrices for two-ply T300-1k/Hexcel 913 plain weave 0/90 lam-inate were obtained in Mallikarachchi and Pellegrino [2]. Assuming the tows in the two plies tobe in-phase[25] the following matrix was obtained:
D0 =
41.3 1.5 01.5 41.3 00 0 2.3
(11)
Standard transformations provide the ABD matrices for the two-ply ±45 and 30/60 lami-nates:
D45 =
23.6 19.1 019.1 23.6 0
0 0 19.9
(12)
and
D30 =
28.0 14.7 014.7 28.0 0
0 0 15.5
(13)
The units are N and mm for all of these matrices.
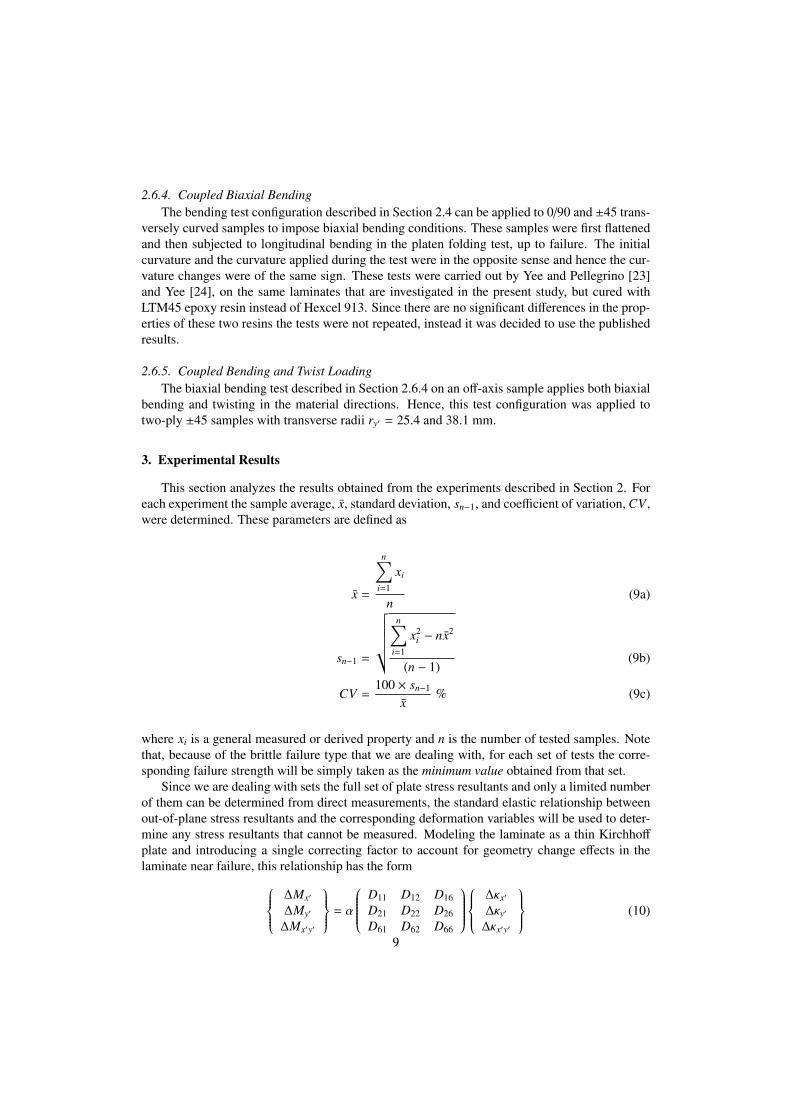
3.1. Tensile StrengthFigure 6 shows the typical Nx vs. εx response obtained from the tension tests and Table 1
summarizes the failure values that were obtained. Note that failure occurred at multiple loca-tions (failure code LMV in ASTM D3039 [17]). The cases in which failure occurred near theends of a sample are likely to have provided a lower bound on the actual strength, the smallestmeasurement was taken to define the strength of the laminate.
0 0.002 0.004 0.006 0.008 0.01 0.0120
20
40
60
80
100
120
140
ε
Nx (
N/m
m)
x
Figure 6: Typical tensile response.
The tensile strength is the smallest failure value reported in Table 1, hence:
F1t = F2t = 133.60 N/mm (14)10
Sample εx (%) Nx (N/mm)TD90-1 0.96 133.60TD90-2 1.05 135.80TD90-3 1.06 143.20TD90-4 1.04 141.00TD90-5 1.01 138.50TD90-6 0.99 144.70
x̄ 1.02 139.47sn−1 0.04 4.30
CV (%) 3.80 3.08
Table 1: Tensile failure data.
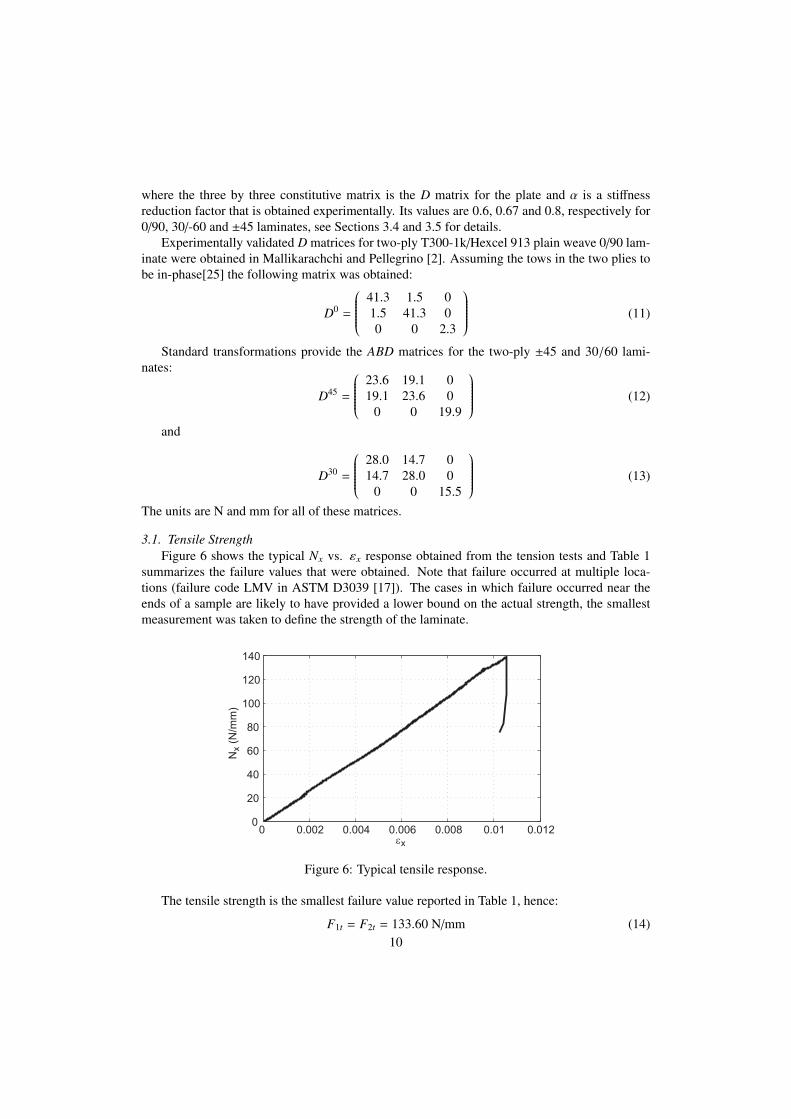
3.2. Compressive StrengthThe compressive failure strength is measured when failure occurs by fiber microbuckling,
Figure 7, however it should be noted that in a sandwich column it is quite rare for microbucklingof both face sheets to occur simultaneously. Hence only the extensometer reading for the failedside was considered and the failure stress-resultant was calculated by assuming that both sheetshad been equally loaded. This value was modified to account for the load taken by the foam core,which is
Nx =P − σcoreAcore
2w(15)
where, σcore is the stress in the core that corresponds to the measured failure strain of the sand-wich column, obtained from the stress-strain response curve for Divinicell H200 PVC foam, in[18] where P, A, and w denote the total applied force, cross-sectional area, and width of thecolumn, respectively.
Figure 7: Fiber microbuckling.
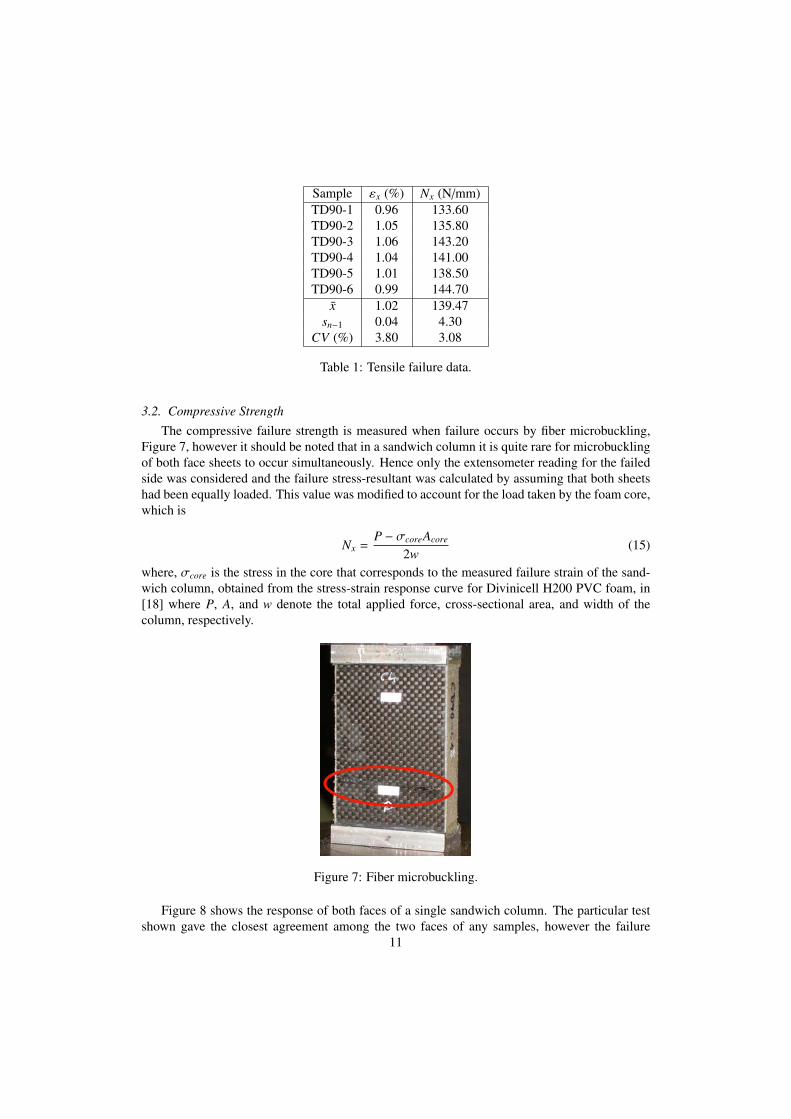
Figure 8 shows the response of both faces of a single sandwich column. The particular testshown gave the closest agreement among the two faces of any samples, however the failure
11
strengths obtained for other samples were also comparable, Table 2.
0 1 2 3 4 5 6 7
x 103
0
10
20
30
40
50
60
70
| −εx
|−N
x (
N/m
m)
front sheetback sheet
Figure 8: Compressive response measured on both sides of a specimen.
Sample |εx| |Nx|(%) (N/mm)
CD90-1 0.69 63.23CD90-2 0.70 77.89CD90-3 0.61 67.50CD90-4 0.64 60.56CD90-5 0.59 57.36CD90-6 0.66 64.96CD90-7 0.49 59.50CD90-8 0.56 59.49CD90-9 0.56 60.39CD90-10 0.61 63.66x̄ 0.61 63.42sn−1 0.06 5.75CV (%) 10.59 6.10
Table 2: Compressive failure data
The compressive strength is the smallest failure value reported in Table 2, hence:
F1c = F2c = 57.36 N/mm (16)
3.3. Shear StrengthTable 3 lists the measured tensile strengths of all two-ply ±45 specimens that were tested.
The force resultants in the tow directions can be obtained from Nx′ with the transformation
Nx = cos2 ϕ Nx′ (17a)
Ny = sin2 ϕ Nx′ (17b)Nxy = sin ϕ cos ϕ Nx′ (17c)
12
from whichNxy =
Nx′
2(18)
The shear strain is also calculated by a coordinate transformation, as follows:
γxy = εx′ − εy′ (19)
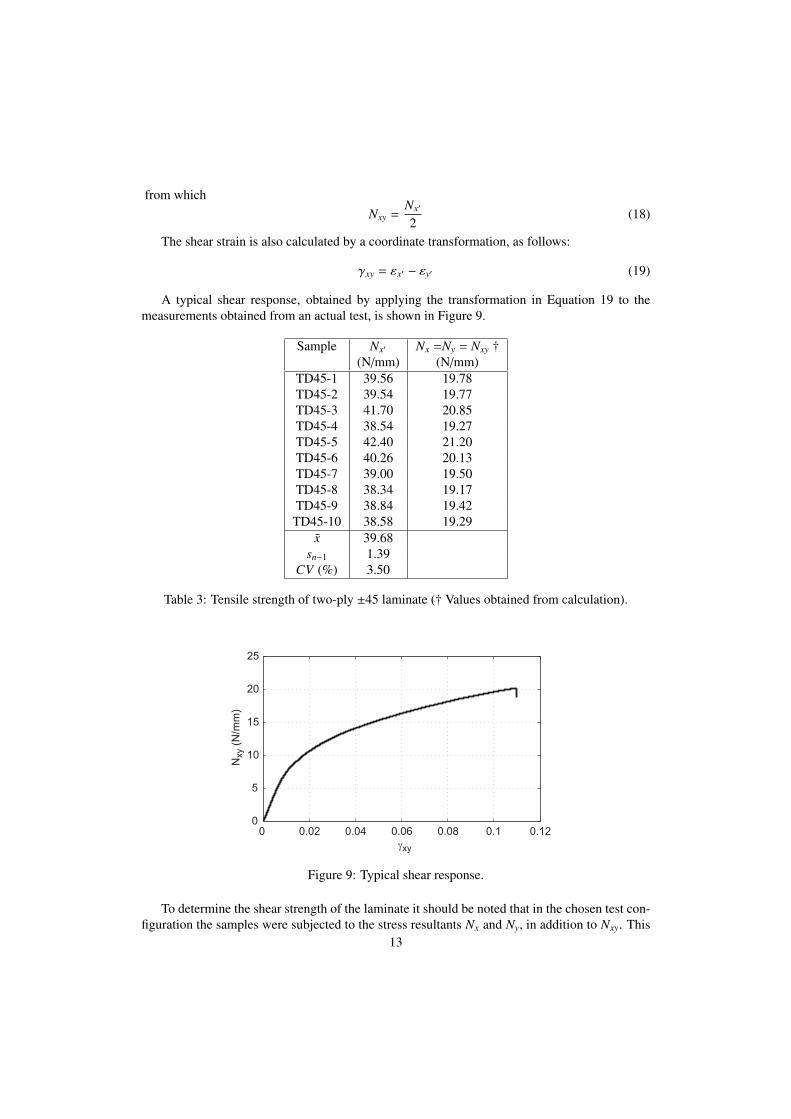
A typical shear response, obtained by applying the transformation in Equation 19 to themeasurements obtained from an actual test, is shown in Figure 9.
Sample Nx′ Nx =Ny = Nxy †(N/mm) (N/mm)
TD45-1 39.56 19.78TD45-2 39.54 19.77TD45-3 41.70 20.85TD45-4 38.54 19.27TD45-5 42.40 21.20TD45-6 40.26 20.13TD45-7 39.00 19.50TD45-8 38.34 19.17TD45-9 38.84 19.42TD45-10 38.58 19.29
x̄ 39.68sn−1 1.39
CV (%) 3.50
Table 3: Tensile strength of two-ply ±45 laminate († Values obtained from calculation).
0 0.02 0.04 0.06 0.08 0.1 0.120
5
10
15
20
25
γxy
Nxy (
N/m
m)
Figure 9: Typical shear response.
To determine the shear strength of the laminate it should be noted that in the chosen test con-figuration the samples were subjected to the stress resultants Nx and Ny, in addition to Nxy. This
13
biaxial loading is usually neglected for ±45 specimens made of unidirectional laminas [22], butin the present case we can use the failure criterion to estimate the pure shear strength by remov-ing the effects of the normal stress resultants. From Equation 17 the in-plane stress resultants inthe tow directions are Nx = Ny = Nxy = Nx′/2 and the moments are all zero. Hence, substitutingthese values into Equation 2, solving for f33 and then using Eq. 8 to evaluate F3 we obtain
F3 =1√f33=
|Nx′ |√4 − (4 f1Nx′ + (2 f11 + f12)N2
x′ )(20)
Hence the shear strength is calculated from Eq. 20 with the smallest value of Nx′ in Table 3,which gives:
F3 = 16.91 N/mm (21)
3.4. Bending Strength
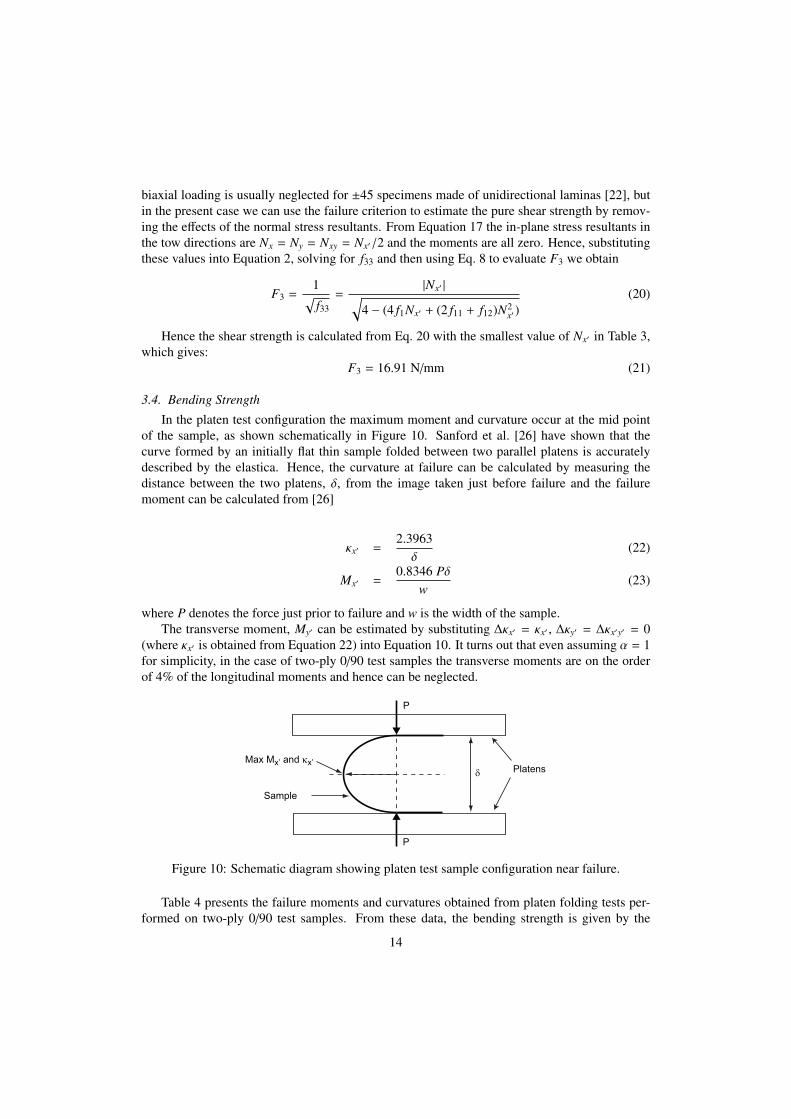
In the platen test configuration the maximum moment and curvature occur at the mid pointof the sample, as shown schematically in Figure 10. Sanford et al. [26] have shown that thecurve formed by an initially flat thin sample folded between two parallel platens is accuratelydescribed by the elastica. Hence, the curvature at failure can be calculated by measuring thedistance between the two platens, δ, from the image taken just before failure and the failuremoment can be calculated from [26]
κx′ =2.3963δ
(22)
Mx′ =0.8346 Pδ
w(23)
where P denotes the force just prior to failure and w is the width of the sample.The transverse moment, My′ can be estimated by substituting ∆κx′ = κx′ , ∆κy′ = ∆κx′y′ = 0
(where κx′ is obtained from Equation 22) into Equation 10. It turns out that even assuming α = 1for simplicity, in the case of two-ply 0/90 test samples the transverse moments are on the orderof 4% of the longitudinal moments and hence can be neglected.
Platens
P
P
Max Mx’ and κx’
Sample
δ
Figure 10: Schematic diagram showing platen test sample configuration near failure.
Table 4 presents the failure moments and curvatures obtained from platen folding tests per-formed on two-ply 0/90 test samples. From these data, the bending strength is given by the
14
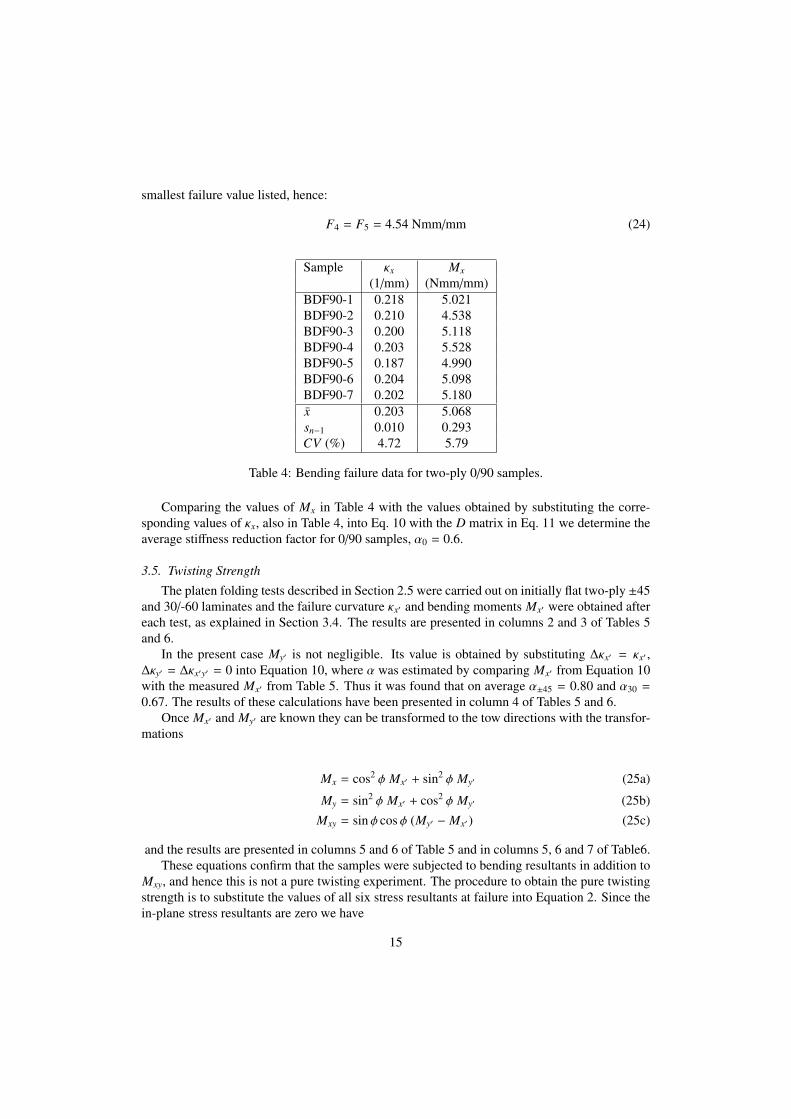
smallest failure value listed, hence:
F4 = F5 = 4.54 Nmm/mm (24)
Sample κx Mx
(1/mm) (Nmm/mm)BDF90-1 0.218 5.021BDF90-2 0.210 4.538BDF90-3 0.200 5.118BDF90-4 0.203 5.528BDF90-5 0.187 4.990BDF90-6 0.204 5.098BDF90-7 0.202 5.180x̄ 0.203 5.068sn−1 0.010 0.293CV (%) 4.72 5.79
Table 4: Bending failure data for two-ply 0/90 samples.
Comparing the values of Mx in Table 4 with the values obtained by substituting the corre-sponding values of κx, also in Table 4, into Eq. 10 with the D matrix in Eq. 11 we determine theaverage stiffness reduction factor for 0/90 samples, α0 = 0.6.
3.5. Twisting Strength
The platen folding tests described in Section 2.5 were carried out on initially flat two-ply ±45and 30/-60 laminates and the failure curvature κx′ and bending moments Mx′ were obtained aftereach test, as explained in Section 3.4. The results are presented in columns 2 and 3 of Tables 5and 6.
In the present case My′ is not negligible. Its value is obtained by substituting ∆κx′ = κx′ ,∆κy′ = ∆κx′y′ = 0 into Equation 10, where α was estimated by comparing Mx′ from Equation 10with the measured Mx′ from Table 5. Thus it was found that on average α±45 = 0.80 and α30 =
0.67. The results of these calculations have been presented in column 4 of Tables 5 and 6.Once Mx′ and My′ are known they can be transformed to the tow directions with the transfor-
mations
Mx = cos2 ϕ Mx′ + sin2 ϕ My′ (25a)
My = sin2 ϕ Mx′ + cos2 ϕ My′ (25b)Mxy = sin ϕ cos ϕ (My′ − Mx′) (25c)
and the results are presented in columns 5 and 6 of Table 5 and in columns 5, 6 and 7 of Table6.These equations confirm that the samples were subjected to bending resultants in addition to
Mxy, and hence this is not a pure twisting experiment. The procedure to obtain the pure twistingstrength is to substitute the values of all six stress resultants at failure into Equation 2. Since thein-plane stress resultants are zero we have
15
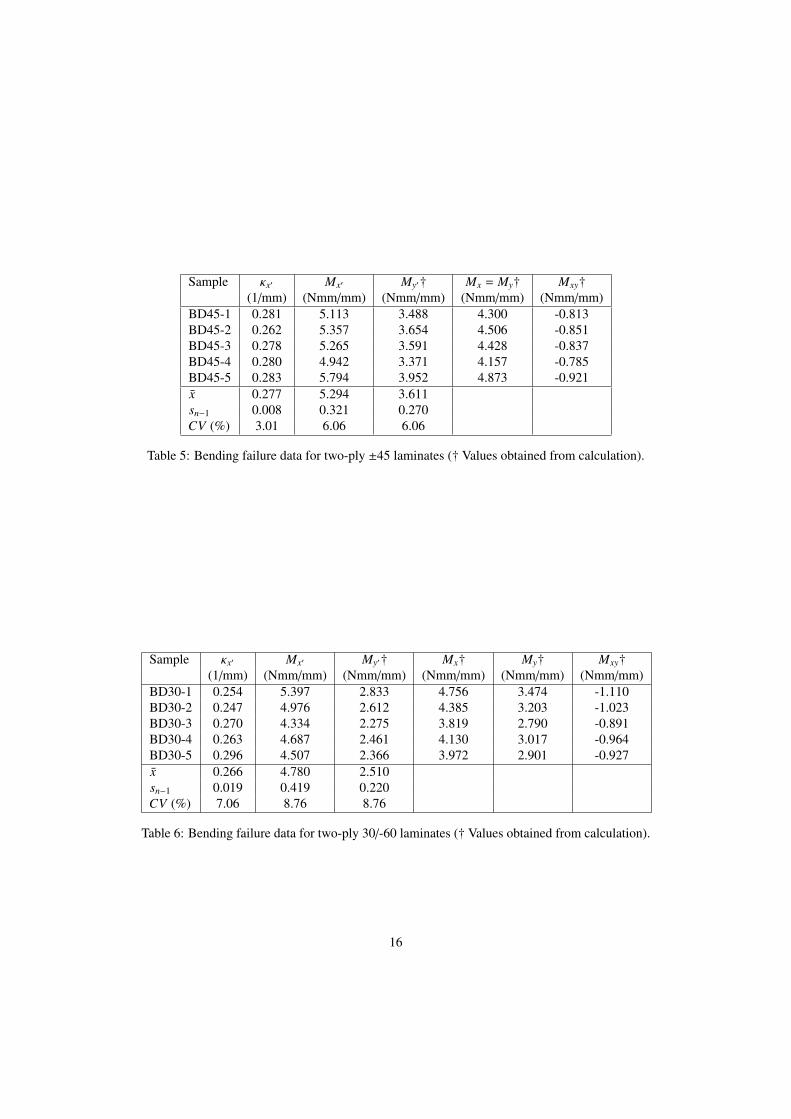
Sample κx′ Mx′ My′† Mx = My† Mxy†(1/mm) (Nmm/mm) (Nmm/mm) (Nmm/mm) (Nmm/mm)
BD45-1 0.281 5.113 3.488 4.300 -0.813BD45-2 0.262 5.357 3.654 4.506 -0.851BD45-3 0.278 5.265 3.591 4.428 -0.837BD45-4 0.280 4.942 3.371 4.157 -0.785BD45-5 0.283 5.794 3.952 4.873 -0.921x̄ 0.277 5.294 3.611sn−1 0.008 0.321 0.270CV (%) 3.01 6.06 6.06
Table 5: Bending failure data for two-ply ±45 laminates († Values obtained from calculation).
Sample κx′ Mx′ My′† Mx† My† Mxy†(1/mm) (Nmm/mm) (Nmm/mm) (Nmm/mm) (Nmm/mm) (Nmm/mm)
BD30-1 0.254 5.397 2.833 4.756 3.474 -1.110BD30-2 0.247 4.976 2.612 4.385 3.203 -1.023BD30-3 0.270 4.334 2.275 3.819 2.790 -0.891BD30-4 0.263 4.687 2.461 4.130 3.017 -0.964BD30-5 0.296 4.507 2.366 3.972 2.901 -0.927x̄ 0.266 4.780 2.510sn−1 0.019 0.419 0.220CV (%) 7.06 8.76 8.76
Table 6: Bending failure data for two-ply 30/-60 laminates († Values obtained from calculation).
16
f44(M2x + M2
y ) + f66M2xy = 1 (26)
From which we obtain:
F6 =1√f66=
|Mxy|√1 − f44(M2
x + M2y )
(27)
However, there is a problem with this result because, as it will be seen in Section 4, theassumption of a quadratic interaction between Mx and My leads to poor results. Hence we willuse the following modified equation to calculate F6 (the reason for making this change willbecome clear in Section 5.2)
F6 =1√f66=
|Mxy|√1 − f44M2
x
(28)
To evaluate F6 we substitute into Equation 28 all data sets in Tables 5 and 6, and we find thatthe critical set of moment resultants that gives the smallest F6 for flat ±45 and 30/-60 laminatesis Mx = 2.790 Nmm/mm and Mxy = -0.891 Nmm/mm. The corresponding twisting strength is
F6 = 1.10 Nmm/mm (29)
3.6. Combined Loading StrengthsThis section presents the results obtained from tests involving multiple stress resultants.
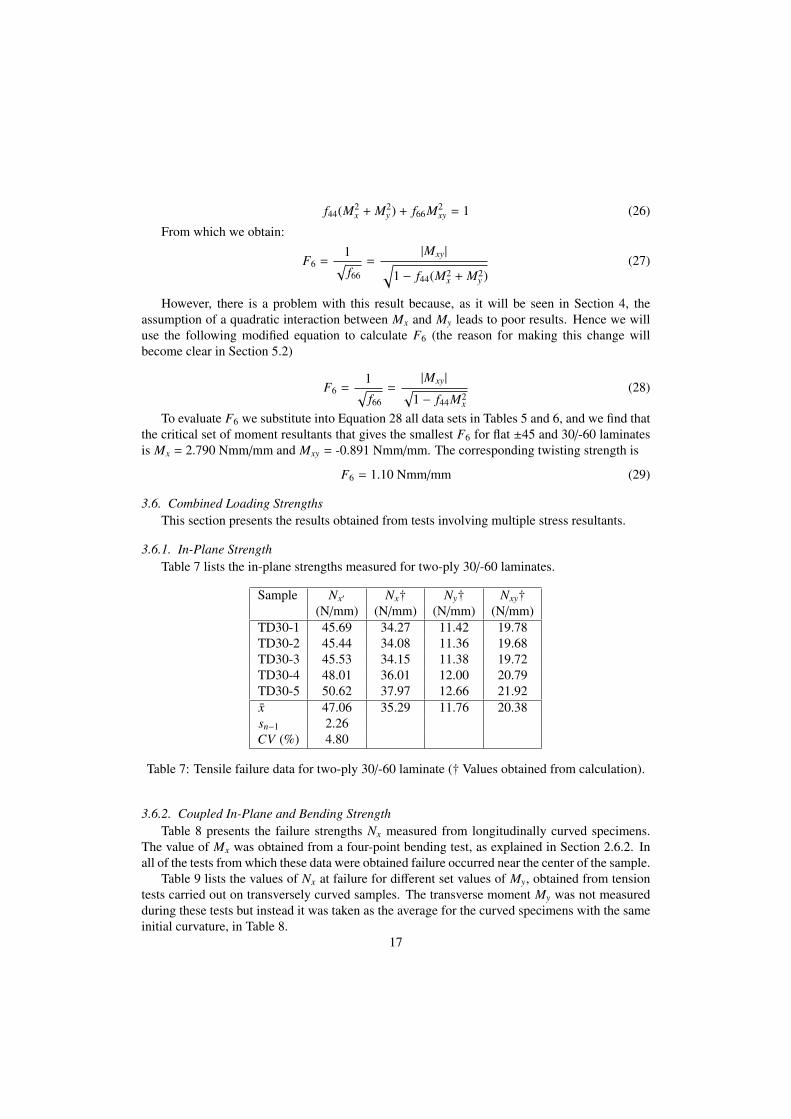
3.6.1. In-Plane StrengthTable 7 lists the in-plane strengths measured for two-ply 30/-60 laminates.
Sample Nx′ Nx† Ny† Nxy†(N/mm) (N/mm) (N/mm) (N/mm)
TD30-1 45.69 34.27 11.42 19.78TD30-2 45.44 34.08 11.36 19.68TD30-3 45.53 34.15 11.38 19.72TD30-4 48.01 36.01 12.00 20.79TD30-5 50.62 37.97 12.66 21.92x̄ 47.06 35.29 11.76 20.38sn−1 2.26CV (%) 4.80
Table 7: Tensile failure data for two-ply 30/-60 laminate († Values obtained from calculation).
3.6.2. Coupled In-Plane and Bending StrengthTable 8 presents the failure strengths Nx measured from longitudinally curved specimens.
The value of Mx was obtained from a four-point bending test, as explained in Section 2.6.2. Inall of the tests from which these data were obtained failure occurred near the center of the sample.
Table 9 lists the values of Nx at failure for different set values of My, obtained from tensiontests carried out on transversely curved samples. The transverse moment My was not measuredduring these tests but instead it was taken as the average for the curved specimens with the sameinitial curvature, in Table 8.
17
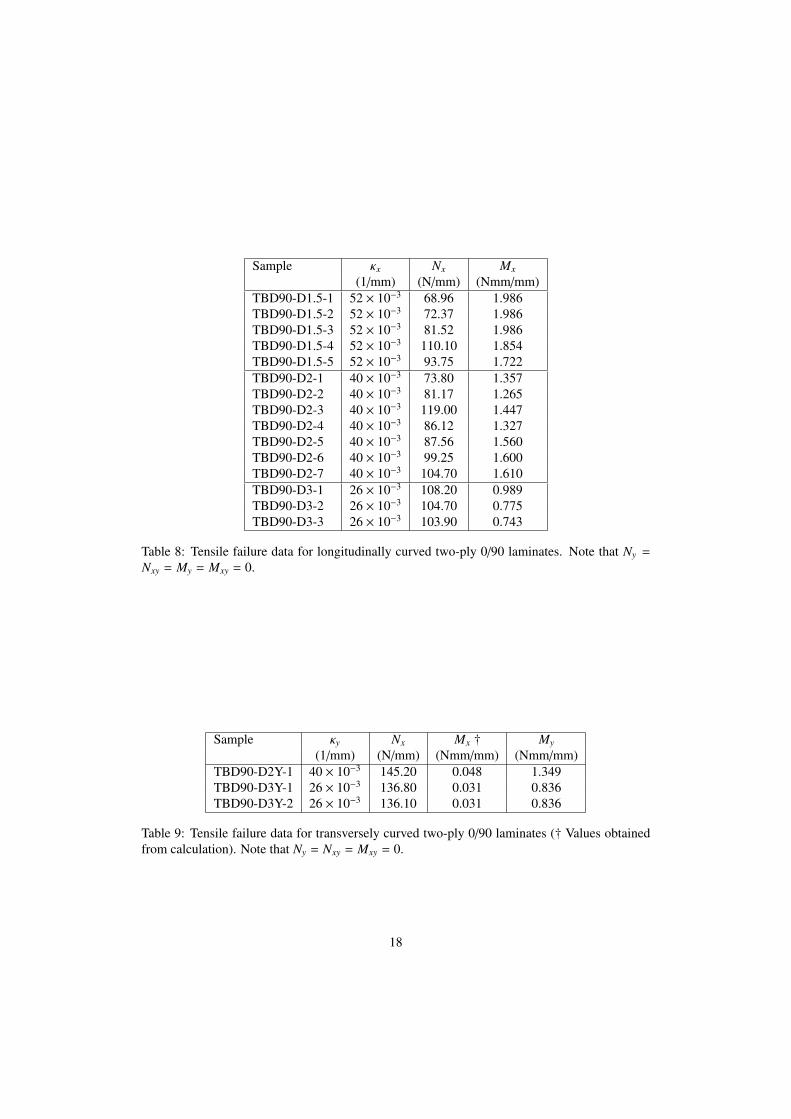
Sample κx Nx Mx
(1/mm) (N/mm) (Nmm/mm)TBD90-D1.5-1 52 × 10−3 68.96 1.986TBD90-D1.5-2 52 × 10−3 72.37 1.986TBD90-D1.5-3 52 × 10−3 81.52 1.986TBD90-D1.5-4 52 × 10−3 110.10 1.854TBD90-D1.5-5 52 × 10−3 93.75 1.722TBD90-D2-1 40 × 10−3 73.80 1.357TBD90-D2-2 40 × 10−3 81.17 1.265TBD90-D2-3 40 × 10−3 119.00 1.447TBD90-D2-4 40 × 10−3 86.12 1.327TBD90-D2-5 40 × 10−3 87.56 1.560TBD90-D2-6 40 × 10−3 99.25 1.600TBD90-D2-7 40 × 10−3 104.70 1.610TBD90-D3-1 26 × 10−3 108.20 0.989TBD90-D3-2 26 × 10−3 104.70 0.775TBD90-D3-3 26 × 10−3 103.90 0.743
Table 8: Tensile failure data for longitudinally curved two-ply 0/90 laminates. Note that Ny =
Nxy = My = Mxy = 0.
Sample κy Nx Mx † My
(1/mm) (N/mm) (Nmm/mm) (Nmm/mm)TBD90-D2Y-1 40 × 10−3 145.20 0.048 1.349TBD90-D3Y-1 26 × 10−3 136.80 0.031 0.836TBD90-D3Y-2 26 × 10−3 136.10 0.031 0.836
Table 9: Tensile failure data for transversely curved two-ply 0/90 laminates († Values obtainedfrom calculation). Note that Ny = Nxy = Mxy = 0.
18
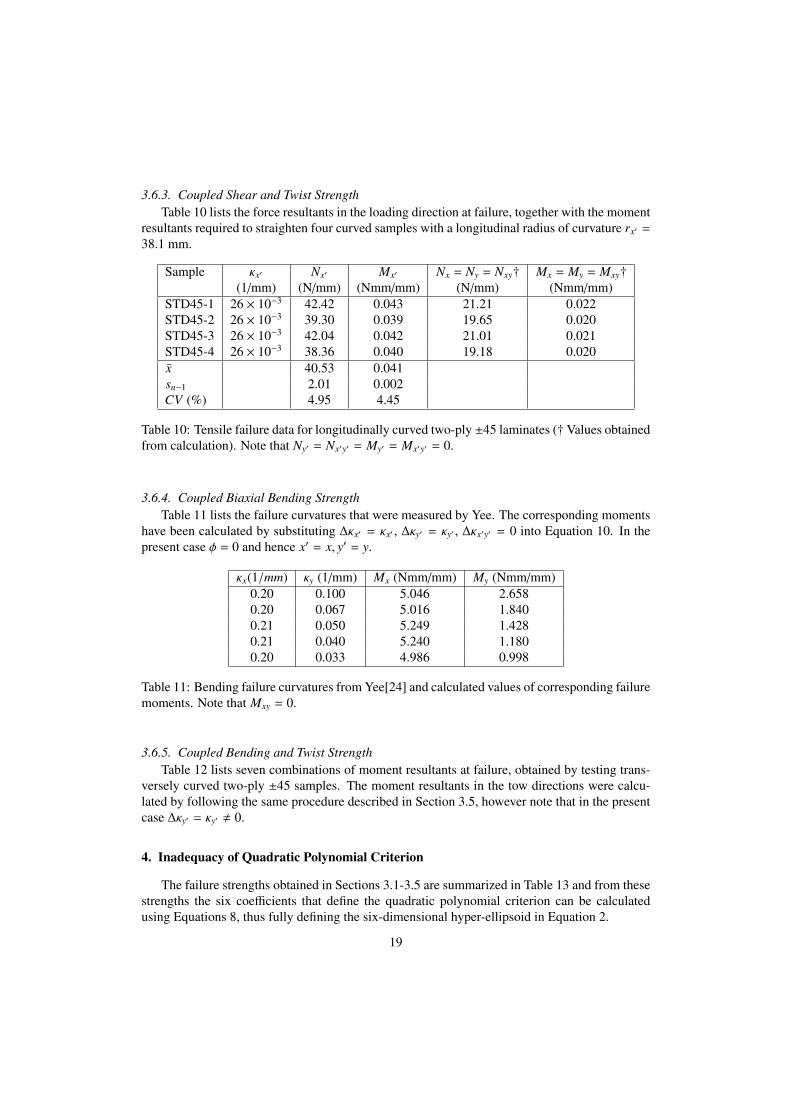
3.6.3. Coupled Shear and Twist StrengthTable 10 lists the force resultants in the loading direction at failure, together with the moment
resultants required to straighten four curved samples with a longitudinal radius of curvature rx′ =
38.1 mm.
Sample κx′ Nx′ Mx′ Nx = Ny = Nxy† Mx = My = Mxy†(1/mm) (N/mm) (Nmm/mm) (N/mm) (Nmm/mm)
STD45-1 26 × 10−3 42.42 0.043 21.21 0.022STD45-2 26 × 10−3 39.30 0.039 19.65 0.020STD45-3 26 × 10−3 42.04 0.042 21.01 0.021STD45-4 26 × 10−3 38.36 0.040 19.18 0.020x̄ 40.53 0.041sn−1 2.01 0.002CV (%) 4.95 4.45
Table 10: Tensile failure data for longitudinally curved two-ply ±45 laminates (†Values obtainedfrom calculation). Note that Ny′ = Nx′y′ = My′ = Mx′y′ = 0.
3.6.4. Coupled Biaxial Bending StrengthTable 11 lists the failure curvatures that were measured by Yee. The corresponding moments
have been calculated by substituting ∆κx′ = κx′ , ∆κy′ = κy′ , ∆κx′y′ = 0 into Equation 10. In thepresent case ϕ = 0 and hence x′ = x, y′ = y.
κx(1/mm) κy (1/mm) Mx (Nmm/mm) My (Nmm/mm)0.20 0.100 5.046 2.6580.20 0.067 5.016 1.8400.21 0.050 5.249 1.4280.21 0.040 5.240 1.1800.20 0.033 4.986 0.998
Table 11: Bending failure curvatures from Yee[24] and calculated values of corresponding failuremoments. Note that Mxy = 0.
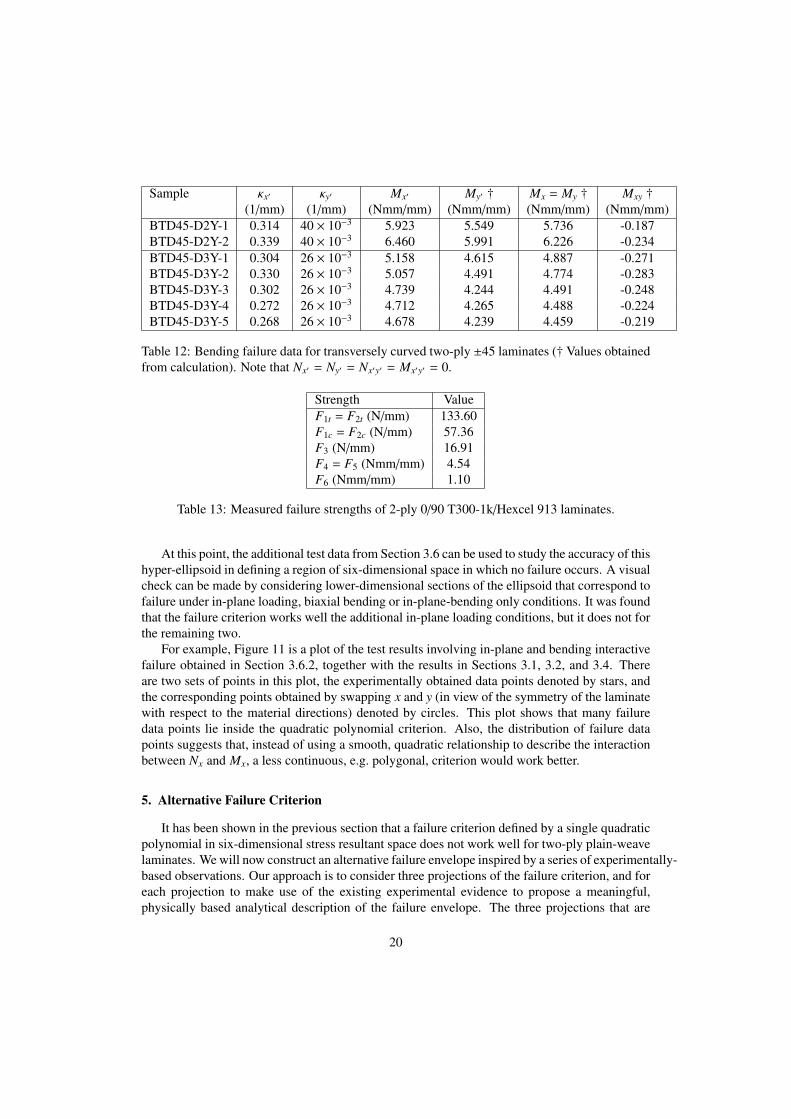
3.6.5. Coupled Bending and Twist StrengthTable 12 lists seven combinations of moment resultants at failure, obtained by testing trans-
versely curved two-ply ±45 samples. The moment resultants in the tow directions were calcu-lated by following the same procedure described in Section 3.5, however note that in the presentcase ∆κy′ = κy′ , 0.
4. Inadequacy of Quadratic Polynomial Criterion
The failure strengths obtained in Sections 3.1-3.5 are summarized in Table 13 and from thesestrengths the six coefficients that define the quadratic polynomial criterion can be calculatedusing Equations 8, thus fully defining the six-dimensional hyper-ellipsoid in Equation 2.
19
Sample κx′ κy′ Mx′ My′ † Mx = My † Mxy †(1/mm) (1/mm) (Nmm/mm) (Nmm/mm) (Nmm/mm) (Nmm/mm)
BTD45-D2Y-1 0.314 40 × 10−3 5.923 5.549 5.736 -0.187BTD45-D2Y-2 0.339 40 × 10−3 6.460 5.991 6.226 -0.234BTD45-D3Y-1 0.304 26 × 10−3 5.158 4.615 4.887 -0.271BTD45-D3Y-2 0.330 26 × 10−3 5.057 4.491 4.774 -0.283BTD45-D3Y-3 0.302 26 × 10−3 4.739 4.244 4.491 -0.248BTD45-D3Y-4 0.272 26 × 10−3 4.712 4.265 4.488 -0.224BTD45-D3Y-5 0.268 26 × 10−3 4.678 4.239 4.459 -0.219
Table 12: Bending failure data for transversely curved two-ply ±45 laminates († Values obtainedfrom calculation). Note that Nx′ = Ny′ = Nx′y′ = Mx′y′ = 0.
Strength ValueF1t = F2t (N/mm) 133.60F1c = F2c (N/mm) 57.36F3 (N/mm) 16.91F4 = F5 (Nmm/mm) 4.54F6 (Nmm/mm) 1.10
Table 13: Measured failure strengths of 2-ply 0/90 T300-1k/Hexcel 913 laminates.
At this point, the additional test data from Section 3.6 can be used to study the accuracy of thishyper-ellipsoid in defining a region of six-dimensional space in which no failure occurs. A visualcheck can be made by considering lower-dimensional sections of the ellipsoid that correspond tofailure under in-plane loading, biaxial bending or in-plane-bending only conditions. It was foundthat the failure criterion works well the additional in-plane loading conditions, but it does not forthe remaining two.
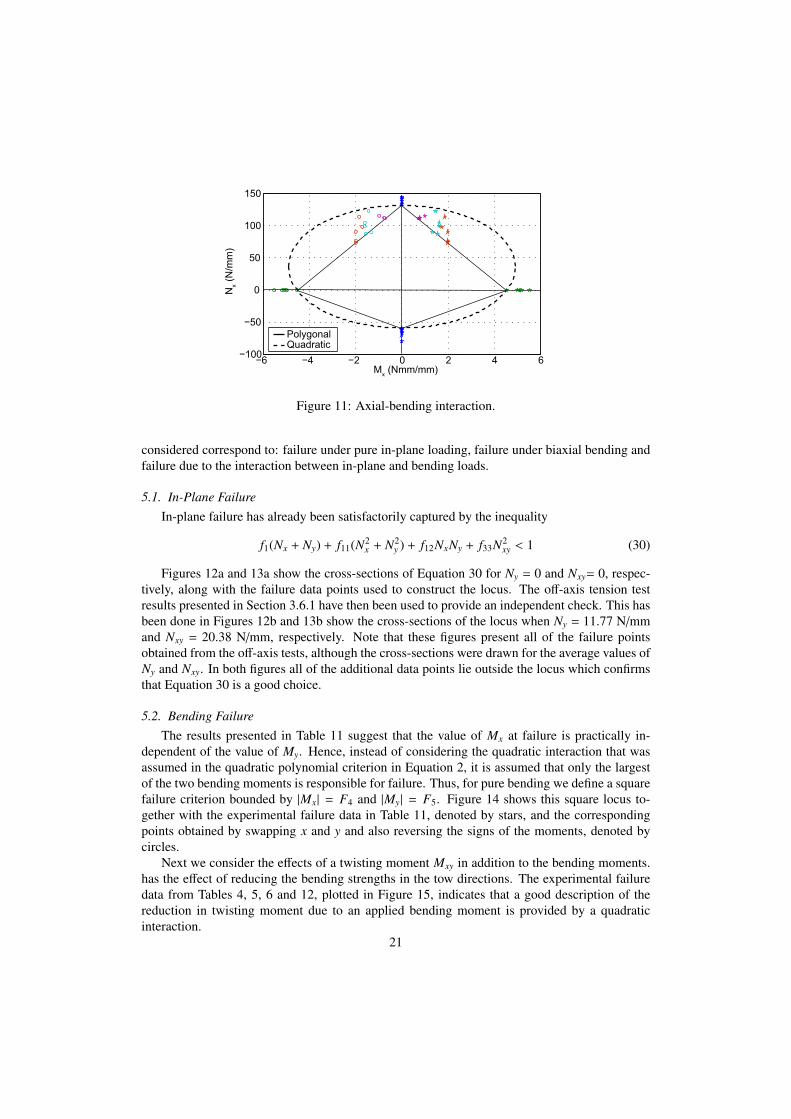
For example, Figure 11 is a plot of the test results involving in-plane and bending interactivefailure obtained in Section 3.6.2, together with the results in Sections 3.1, 3.2, and 3.4. Thereare two sets of points in this plot, the experimentally obtained data points denoted by stars, andthe corresponding points obtained by swapping x and y (in view of the symmetry of the laminatewith respect to the material directions) denoted by circles. This plot shows that many failuredata points lie inside the quadratic polynomial criterion. Also, the distribution of failure datapoints suggests that, instead of using a smooth, quadratic relationship to describe the interactionbetween Nx and Mx, a less continuous, e.g. polygonal, criterion would work better.
5. Alternative Failure Criterion
It has been shown in the previous section that a failure criterion defined by a single quadraticpolynomial in six-dimensional stress resultant space does not work well for two-ply plain-weavelaminates. We will now construct an alternative failure envelope inspired by a series of experimentally-based observations. Our approach is to consider three projections of the failure criterion, and foreach projection to make use of the existing experimental evidence to propose a meaningful,physically based analytical description of the failure envelope. The three projections that are
20
6
4
Nx (
N/m
m)
−6 −4 −2 0 2−100
−50
0
50
100
150
Mx (Nmm/mm)
PolygonalQuadratic
Figure 11: Axial-bending interaction.
considered correspond to: failure under pure in-plane loading, failure under biaxial bending andfailure due to the interaction between in-plane and bending loads.
5.1. In-Plane FailureIn-plane failure has already been satisfactorily captured by the inequality
f1(Nx + Ny) + f11(N2x + N2
y ) + f12NxNy + f33N2xy < 1 (30)
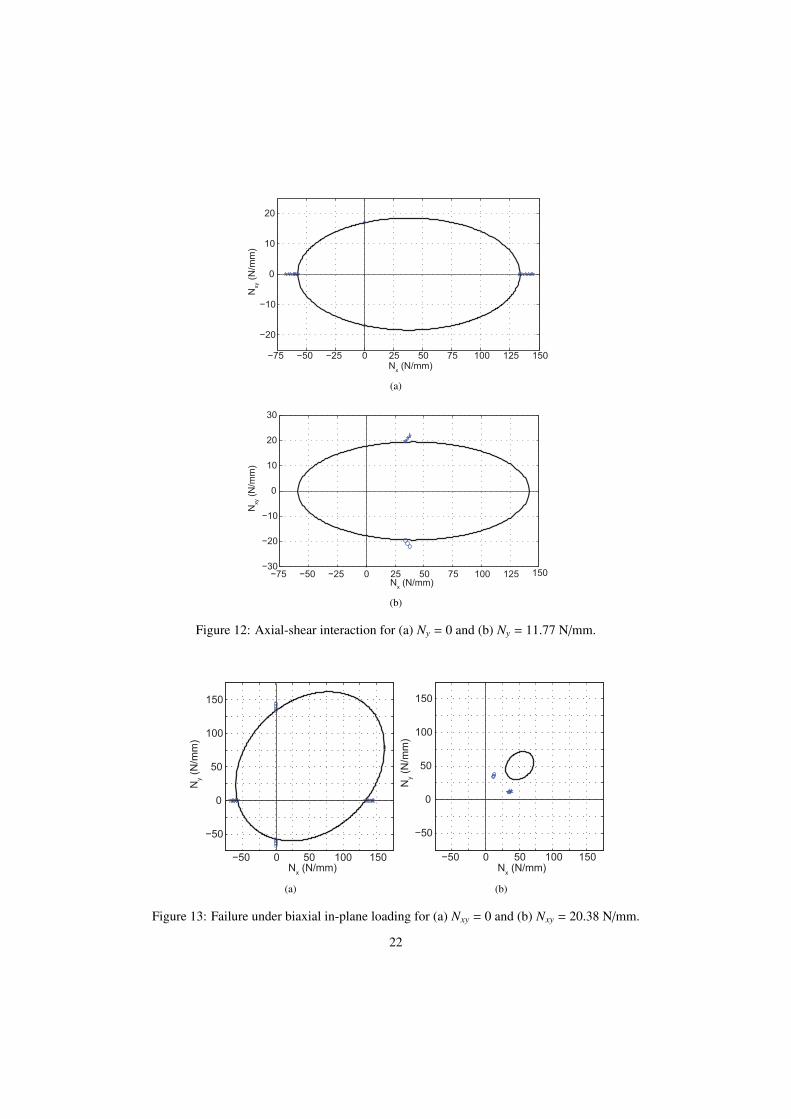
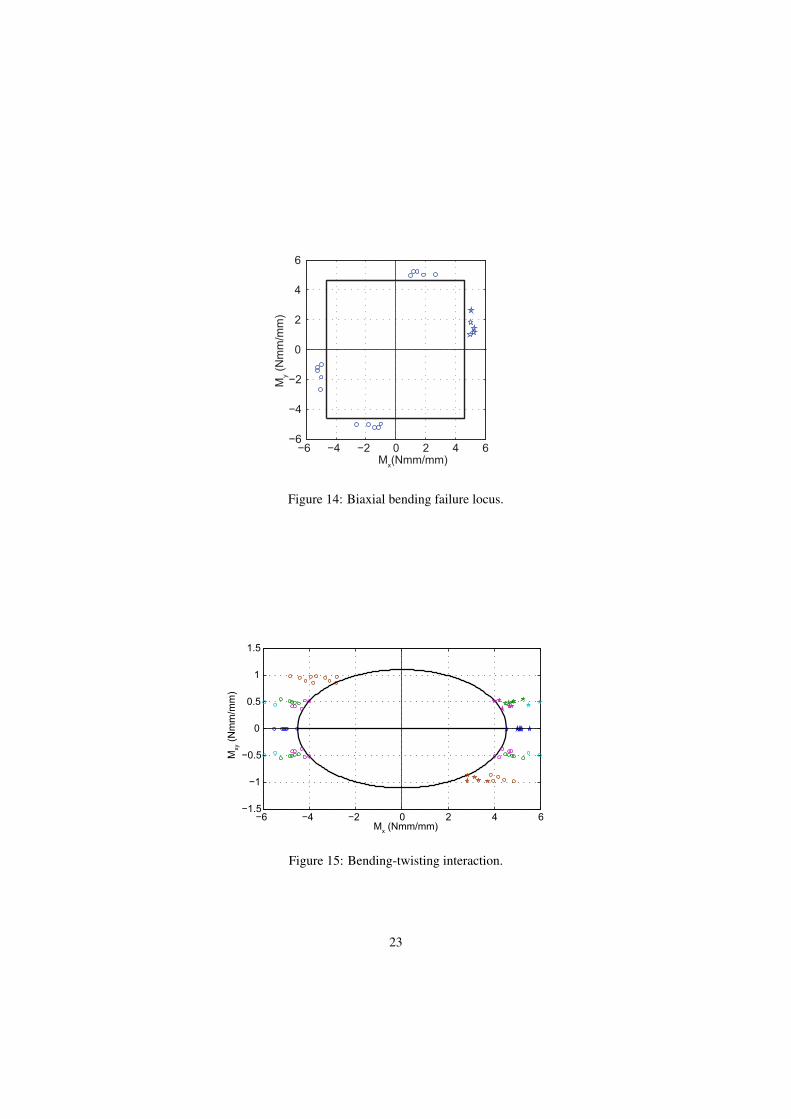
Figures 12a and 13a show the cross-sections of Equation 30 for Ny = 0 and Nxy= 0, respec-tively, along with the failure data points used to construct the locus. The off-axis tension testresults presented in Section 3.6.1 have then been used to provide an independent check. This hasbeen done in Figures 12b and 13b show the cross-sections of the locus when Ny = 11.77 N/mmand Nxy = 20.38 N/mm, respectively. Note that these figures present all of the failure pointsobtained from the off-axis tests, although the cross-sections were drawn for the average values ofNy and Nxy. In both figures all of the additional data points lie outside the locus which confirmsthat Equation 30 is a good choice.
5.2. Bending FailureThe results presented in Table 11 suggest that the value of Mx at failure is practically in-
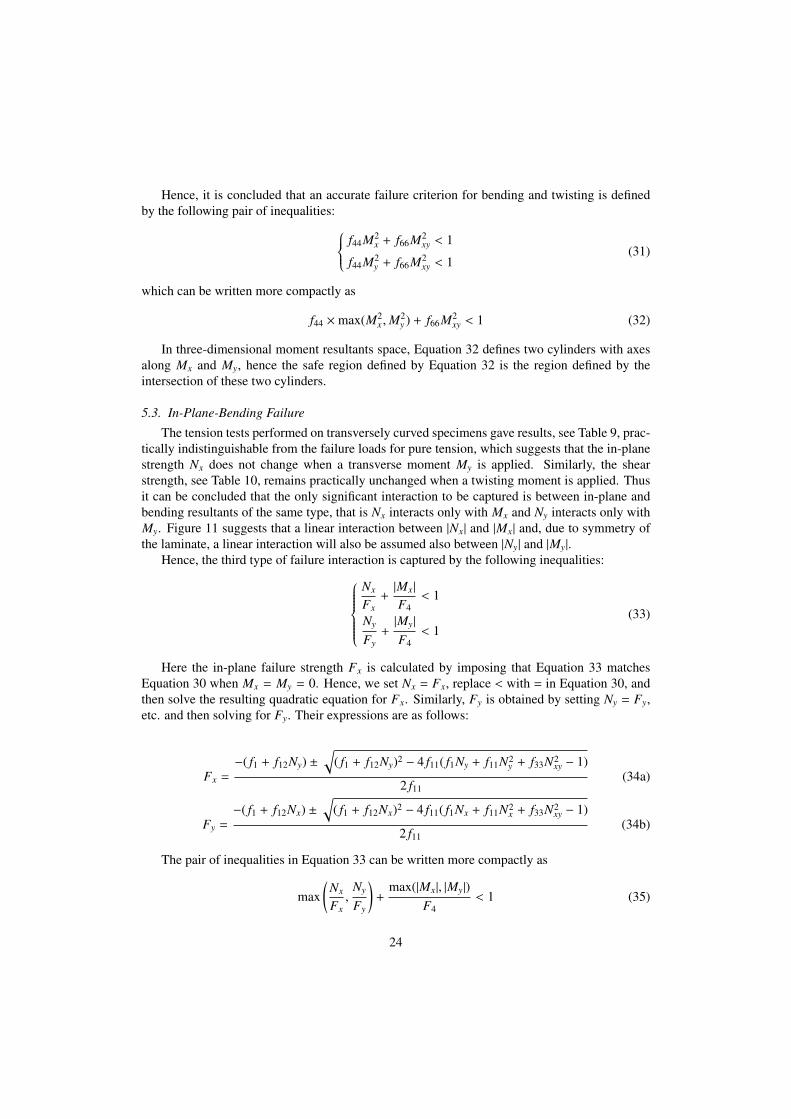
dependent of the value of My. Hence, instead of considering the quadratic interaction that wasassumed in the quadratic polynomial criterion in Equation 2, it is assumed that only the largestof the two bending moments is responsible for failure. Thus, for pure bending we define a squarefailure criterion bounded by |Mx| = F4 and |My| = F5. Figure 14 shows this square locus to-gether with the experimental failure data in Table 11, denoted by stars, and the correspondingpoints obtained by swapping x and y and also reversing the signs of the moments, denoted bycircles.
Next we consider the effects of a twisting moment Mxy in addition to the bending moments.has the effect of reducing the bending strengths in the tow directions. The experimental failuredata from Tables 4, 5, 6 and 12, plotted in Figure 15, indicates that a good description of thereduction in twisting moment due to an applied bending moment is provided by a quadraticinteraction.
21
−75 −50 −25 0 25 50 75 100 125 150
−20
−10
0
10
20
Nx (N/mm)
Nxy (
N/m
m)
(a)
150
−75 −50 −25 0 25 50 75 100 125−30
−20
−10
0
10
20
30
Nx (N/mm)
Nxy (
N/m
m)
(b)
Figure 12: Axial-shear interaction for (a) Ny = 0 and (b) Ny = 11.77 N/mm.
−50 0 50 100 150
−50
0
50
100
150
Nx (N/mm)
Ny (
N/m
m)
(a)
−50 0 50 100 150
−50
0
50
100
150
Nx (N/mm)
Ny (
N/m
m)
(b)
Figure 13: Failure under biaxial in-plane loading for (a) Nxy = 0 and (b) Nxy = 20.38 N/mm.
22
−6 −4 −2 0 2 4 6−6
−4
−2
0
2
4
6
Mx(Nmm/mm)
My (
Nm
m/m
m)
Figure 14: Biaxial bending failure locus.
−6 −4 −2 0 2 4 6−1.5
−1
−0.5
0
0.5
1
1.5
Mx (Nmm/mm)
Mxy (
Nm
m/m
m)
Figure 15: Bending-twisting interaction.
23
Hence, it is concluded that an accurate failure criterion for bending and twisting is definedby the following pair of inequalities: f44M2
x + f66M2xy < 1
f44M2y + f66M2
xy < 1(31)
which can be written more compactly as
f44 ×max(M2x ,M
2y ) + f66M2
xy < 1 (32)
In three-dimensional moment resultants space, Equation 32 defines two cylinders with axesalong Mx and My, hence the safe region defined by Equation 32 is the region defined by theintersection of these two cylinders.
5.3. In-Plane-Bending Failure
The tension tests performed on transversely curved specimens gave results, see Table 9, prac-tically indistinguishable from the failure loads for pure tension, which suggests that the in-planestrength Nx does not change when a transverse moment My is applied. Similarly, the shearstrength, see Table 10, remains practically unchanged when a twisting moment is applied. Thusit can be concluded that the only significant interaction to be captured is between in-plane andbending resultants of the same type, that is Nx interacts only with Mx and Ny interacts only withMy. Figure 11 suggests that a linear interaction between |Nx| and |Mx| and, due to symmetry ofthe laminate, a linear interaction will also be assumed also between |Ny| and |My|.
Hence, the third type of failure interaction is captured by the following inequalities:Nx
Fx+|Mx|F4< 1
Ny
Fy+|My|F4< 1
(33)
Here the in-plane failure strength Fx is calculated by imposing that Equation 33 matchesEquation 30 when Mx = My = 0. Hence, we set Nx = Fx, replace < with = in Equation 30, andthen solve the resulting quadratic equation for Fx. Similarly, Fy is obtained by setting Ny = Fy,etc. and then solving for Fy. Their expressions are as follows:
Fx =−( f1 + f12Ny) ±
√( f1 + f12Ny)2 − 4 f11( f1Ny + f11N2
y + f33N2xy − 1)
2 f11(34a)
Fy =−( f1 + f12Nx) ±
√( f1 + f12Nx)2 − 4 f11( f1Nx + f11N2
x + f33N2xy − 1)
2 f11(34b)
The pair of inequalities in Equation 33 can be written more compactly as
max(
Nx
Fx,
Ny
Fy
)+
max(|Mx|, |My|)F4
< 1 (35)
24
6. Summary and Discussion
We have proposed a failure criterion for two-ply plain weave laminates subjected to forceand moment resultants. The criterion is defined by the set of three inequalities:
f1(Nx + Ny) + f11(N2x + N2
y ) + f12NxNy + f33N2xy < 1
f44 ×max(M2x ,M
2y ) + f66M2
xy < 1
max(
Nx
Fx,
Ny
Fy
)+
max(|Mx|, |My|)F4
< 1
(36)
and, defining the three failure indices (FI):
FI#1 = f1(Nx + Ny) + f11(N2x + N2
y ) + f12NxNy + f33N2xy (37a)
FI#2 = f44 ×max(M2x ,M
2y ) + f66M2
xy (37b)
FI#3 = max(
Nx
Fx,
Ny
Fy
)+
max(|Mx|, |My|)F4
(37c)
avoiding failure simply requires that all three failure indices be < 1.This set of inequalities defines a six-dimensional region which is best visualized by consid-
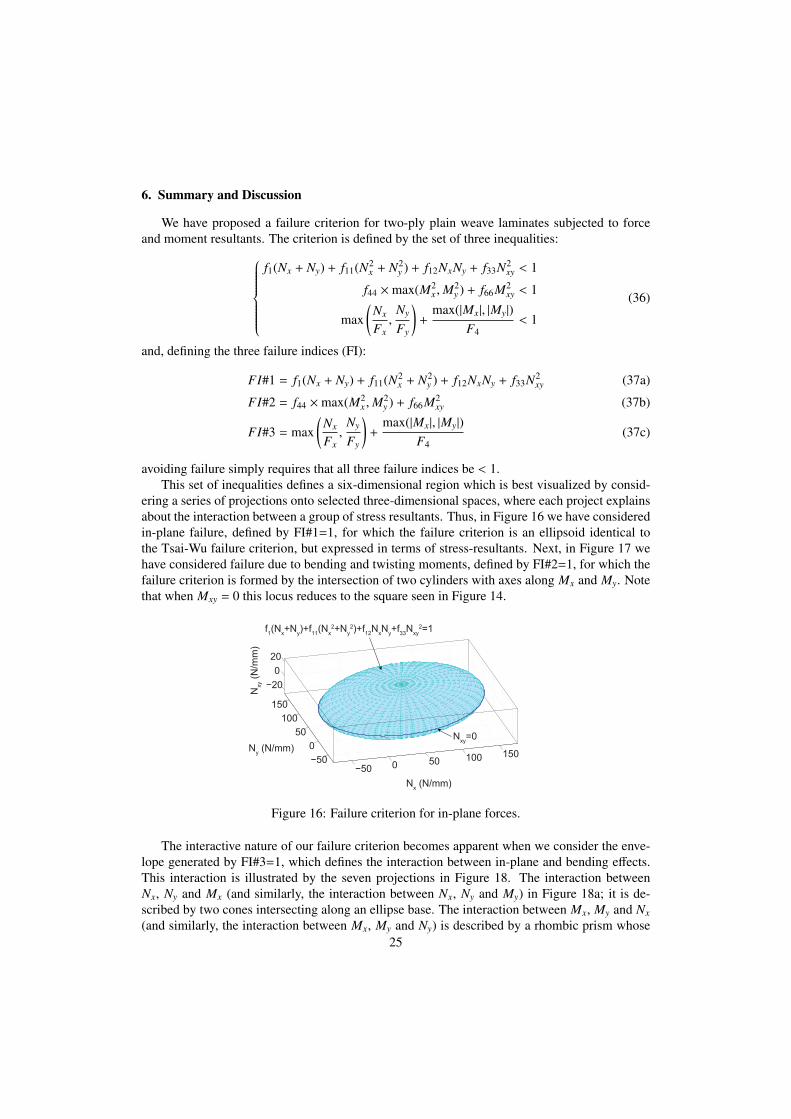
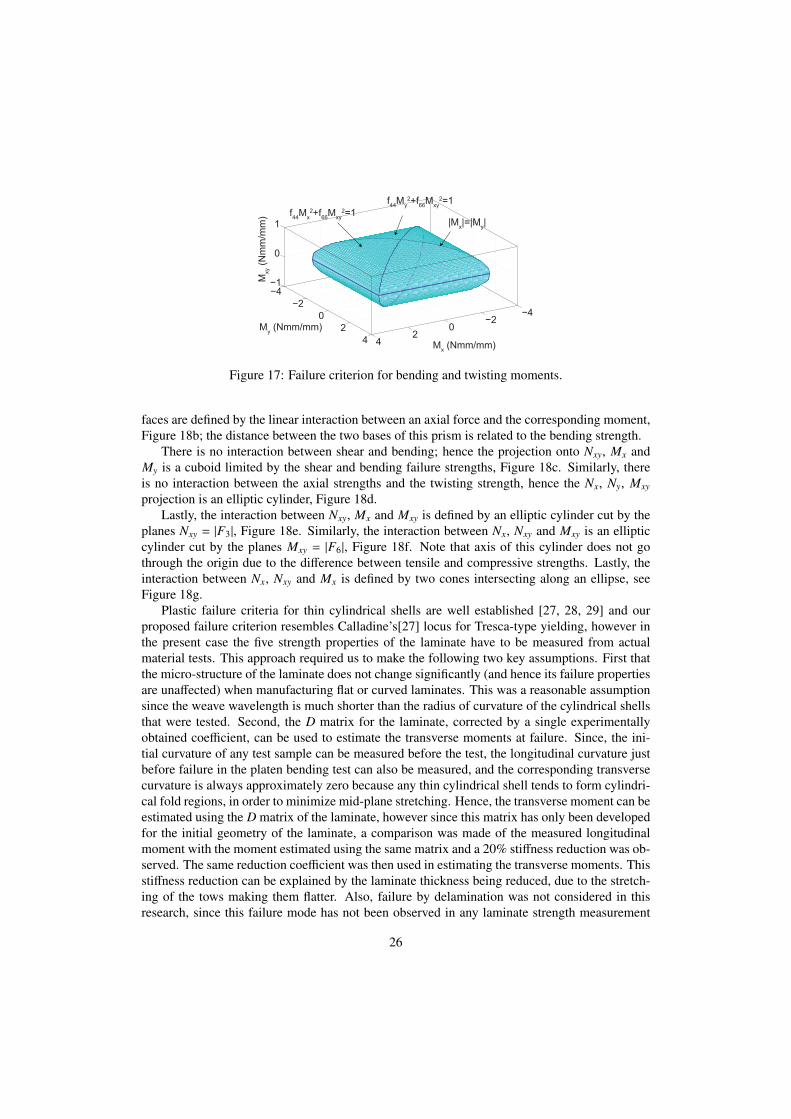
ering a series of projections onto selected three-dimensional spaces, where each project explainsabout the interaction between a group of stress resultants. Thus, in Figure 16 we have consideredin-plane failure, defined by FI#1=1, for which the failure criterion is an ellipsoid identical tothe Tsai-Wu failure criterion, but expressed in terms of stress-resultants. Next, in Figure 17 wehave considered failure due to bending and twisting moments, defined by FI#2=1, for which thefailure criterion is formed by the intersection of two cylinders with axes along Mx and My. Notethat when Mxy = 0 this locus reduces to the square seen in Figure 14.
−50 0 50 100 150−50
0
50
100
150
−20
0
20
Nx (N/mm)
Ny (N/mm)
Nxy (
N/m
m)
Nxy
=0
f1(N
x+N
y)+f
11(N
x2+N
y2)+f
12N
xN
y+f
33N
xy2=1
Figure 16: Failure criterion for in-plane forces.
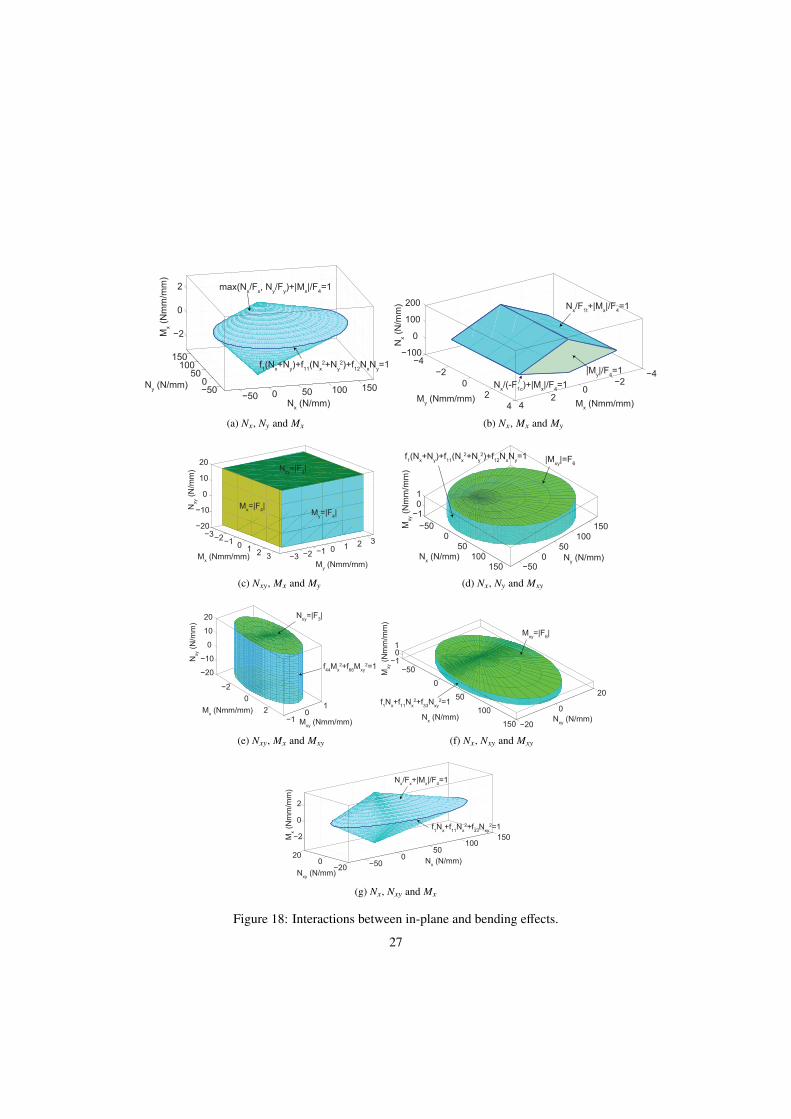
The interactive nature of our failure criterion becomes apparent when we consider the enve-lope generated by FI#3=1, which defines the interaction between in-plane and bending effects.This interaction is illustrated by the seven projections in Figure 18. The interaction betweenNx, Ny and Mx (and similarly, the interaction between Nx, Ny and My) in Figure 18a; it is de-scribed by two cones intersecting along an ellipse base. The interaction between Mx, My and Nx
(and similarly, the interaction between Mx, My and Ny) is described by a rhombic prism whose25
−4−2
02
4
−4
−2
0
2
4
−1
0
1
Mx (Nmm/mm)
My (Nmm/mm)
Mxy (
Nm
m/m
m) f
44M
x2+f
66M
xy2=1
f44
My2+f
66M
xy2=1
|Mx|=|M
y|
Figure 17: Failure criterion for bending and twisting moments.
faces are defined by the linear interaction between an axial force and the corresponding moment,Figure 18b; the distance between the two bases of this prism is related to the bending strength.
There is no interaction between shear and bending; hence the projection onto Nxy, Mx andMy is a cuboid limited by the shear and bending failure strengths, Figure 18c. Similarly, thereis no interaction between the axial strengths and the twisting strength, hence the Nx, Ny, Mxy
projection is an elliptic cylinder, Figure 18d.Lastly, the interaction between Nxy, Mx and Mxy is defined by an elliptic cylinder cut by the
planes Nxy = |F3|, Figure 18e. Similarly, the interaction between Nx, Nxy and Mxy is an ellipticcylinder cut by the planes Mxy = |F6|, Figure 18f. Note that axis of this cylinder does not gothrough the origin due to the difference between tensile and compressive strengths. Lastly, theinteraction between Nx, Nxy and Mx is defined by two cones intersecting along an ellipse, seeFigure 18g.
Plastic failure criteria for thin cylindrical shells are well established [27, 28, 29] and ourproposed failure criterion resembles Calladine’s[27] locus for Tresca-type yielding, however inthe present case the five strength properties of the laminate have to be measured from actualmaterial tests. This approach required us to make the following two key assumptions. First thatthe micro-structure of the laminate does not change significantly (and hence its failure propertiesare unaffected) when manufacturing flat or curved laminates. This was a reasonable assumptionsince the weave wavelength is much shorter than the radius of curvature of the cylindrical shellsthat were tested. Second, the D matrix for the laminate, corrected by a single experimentallyobtained coefficient, can be used to estimate the transverse moments at failure. Since, the ini-tial curvature of any test sample can be measured before the test, the longitudinal curvature justbefore failure in the platen bending test can also be measured, and the corresponding transversecurvature is always approximately zero because any thin cylindrical shell tends to form cylindri-cal fold regions, in order to minimize mid-plane stretching. Hence, the transverse moment can beestimated using the D matrix of the laminate, however since this matrix has only been developedfor the initial geometry of the laminate, a comparison was made of the measured longitudinalmoment with the moment estimated using the same matrix and a 20% stiffness reduction was ob-served. The same reduction coefficient was then used in estimating the transverse moments. Thisstiffness reduction can be explained by the laminate thickness being reduced, due to the stretch-ing of the tows making them flatter. Also, failure by delamination was not considered in thisresearch, since this failure mode has not been observed in any laminate strength measurement
26
−50 0 50 100 150−500
50100
150
−2
0
2
Nx (N/mm)
Ny (N/mm)
Mx (
Nm
m/m
m)
max(Nx/F
x, N
y/F
y)+|M
x|/F
4=1
f1(N
x+N
y)+f
11(N
x2+N
y2)+f
12N
xN
y=1
(a) Nx, Ny and Mx
−4−2
02
4
−4
−2
0
2
4
−100
0
100
200
Mx (Nmm/mm)
My (Nmm/mm)
Nx (
N/m
m)
Nx/(-F
1c)+|M
x|/F
4=1
Nx/F
1t+|M
x|/F
4=1
|My|/F
4=1
(b) Nx, Mx and My
−3−2−1 0 1 2 3 −3 −2 −1 0 1 2 3
−20
−10
0
10
20
My (Nmm/mm)
Mx (Nmm/mm)
Nxy (
N/m
m) N
xy=|F
3|
My=|F
4|
Mx=|F
4|
(c) Nxy, Mx and My
−500
50100
150 −500
50100
150
−101
Ny (N/mm)N
x (N/mm)
Mxy (
Nm
m/m
m)
|Mxy
|=F6
f1(N
x+N
y)+f
11(N
x2+N
y2)+f
12N
xN
y=1
(d) Nx, Ny and Mxy
−2
0
2−1
01
−20
−10
0
10
20
Mxy
(Nmm/mm)
Mx (Nmm/mm)
Nxy (
N/m
m)
Nxy
=|F3|
f44
Mx2+f
66M
xy2=1
(e) Nxy, Mx and Mxy
−50
0
50
100
150 −20
0
20
−101
Nxy
(N/mm)Nx (N/mm)
Mxy (
Nm
m/m
m)
Mxy
=|F6|
f1N
x+f
11N
x2+f
33N
xy2=1
(f) Nx, Nxy and Mxy
−500
50100
150
−200
20
−2
0
2
Nx (N/mm)
Nxy
(N/mm)
Mx (
Nm
m/m
m)
f1N
x+f
11N
x2+f
33N
xy2=1
Nx/F
x+|M
x|/F
4=1
(g) Nx, Nxy and Mx
Figure 18: Interactions between in-plane and bending effects.
27
tests or indeed in any tests on tape-spring hinges [2, 30, 31].The proposed failure criterion has a number of advantages over the quadratic polynomial
considered in Karkkainen et al. [6] and Manne and Tsai [11], which results in a single hyper-ellipsoid. Most importantly it has successfully excluded unsafe regions of the stress resultantspace, where the laminate is subjected to a combination of in-plane and bending stress resultants.Also, all material symmetries can be satisfied without having to reconcile any contradictionsbetween directly obtained test data that provided five strength parameters.
7. Conclusion
This paper has presented a failure locus for a symmetric two-ply plain weave laminate interms of force and moment resultants making a six dimensional loading space. Failure parame-ters were estimated from direct measurements through five sets of tests and five additional com-bined loading test configurations were tested to generate for validation.
Acknowledgments
We thank Dr Michael Sutcliffe (University of Cambridge, UK) for helpful discussions andHexcel, UK for providing materials. HMYCM thanks the Cambridge Commonwealth Trust andthe California Institute of Technology for financial support.
References
[1] M.J. Hinton, A.S. Kaddour, and P.D. Soden. Failure criteria in fibre-reinforced-polymer composites, the world-wide failure exercise. First edition, 2004.
[2] H.M.Y.C. Mallikarachchi and S. Pellegrino. Quasi-static folding and deployment of ultrathin composite tape-springhinges. Journal of Spacecraft and Rockets, 48(1):187–198, 2011.
[3] H.M.Y.C. Mallikarachchi and S. Pellegrino. Deployment dynamics of composite booms with integral slottedhinges. 50th AIAA/ASME/ASCE/AHS/ASC Structures, Structural Dynamics, and Materials Conference, PalmSprings, California, 4-7 May 2009.
[4] S.W. Tsai and E.M. Wu. A general theory of strength for anisotropic materials. Journal of Composite Materials, 5(1):58–80, 1971.
[5] Z. Hashin and A. Rotem. A fatigue failure criterion for fibre reinforced materials. Journal of Composite Materials,7:448–464, 1973.
[6] R.L. Karkkainen, B.V. Sankar and J.T. Tzeng. A direct micromechanical approach toward the development ofquadratic stress gradient failure criteria for textile composites. Journal of Composite Materials, 41(16):1917–1937,2007.
[7] T. Chou. Microstructural design of fiber compoistes. First edition, 1992.[8] B.N. Cox, W.C. Carter, and N.A. Fleck. A binary model of textile composites: I - formulation. Acta Metallurgica
et Materialia, 42(10):3463–3479, 1994.[9] J. Whitcomb and K. Srirengan. Effect of various approximations on predicted progressive failure in plain weave
composites. Composite Structures, 34(1):13–20, 1996.[10] S. J. Song, A.M. Waas, K.W. Shahwan, O. Faruque and X.R. Xiao. Compression response of 2D braided tex-
tile composites: single cell and multiple cell micromechanics based strength predictions. Journal of CompositeMaterials, 42(23):2461–2482, 2008.
[11] P.M. Manne and S.W. Tsai. Design optimization of composites plates: Part i - design criteria for strength, stiffness,and manufacturing complexity of composite laminates. Journal of Composite Materials, 332(6):544–570, 1998.
[12] K.S. Liu and S.W. Tsai. A progressive quadratic failure criterion for a laminate. Composite Science and Technology,58(7):1023–1032, 1998.
[13] J. E. Masters and M. A. Portanova. Standard test methods for textile composites. Contractor report 4751, NationalAeronautics and Space Administration, Hampton, Virginia, 1996.
28
[14] ASTM Standard D6856-2003. Standard guide for testing fabric-reinforced “textile” composite materials. Ameri-can Society for Testing and Materials, West Conshohocken, Pennsylvania, 2008.
[15] http://www.toraycfa.com/pdfs/T300DataSheet.pdf[16] http://www.hexcel.com/Resources/DataSheets/Prepreg-Data-Sheets/913 eu.pdf[17] ASTM Standard D3039/D3039M-2008. Standard test method for tensile properties of polymer matrix composite
materials. American Society for Testing and Materials, West Conshohocken, Pennsylvania, 2008.[18] N.A. Fleck and I. Sridhar. End compression of sandwich columns. Composites: Part A, 33(3):353–359, 2005.[19] ASTM Standard D3518/D3518M-1994. Standard test method for in-plane shear response of polymer matrix
composite materials by tensile test of a ±45◦ laminate. American Society for Testing and Materials, West Con-shohocken, Pennsylvania, 2007.
[20] J.C.H. Yee and S. Pellegrino. Folding of woven composite structures. Composites Part A-Applied Science andManufacturing, 36 (2): 273–278, 2005.
[21] T.W. Murphey, G.E. Sanford, and M.M. Grigoriev. Nonlinear elastic constitutive modeling of large strains in carbonfiber composite flexures. 16th International Conference on Composite Structures, Porto, 2011.
[22] D.F. Adams, L.A. Carlsson, and R.B. Pipes. Experimental characterization of advanced composite materials. Thirdedition, 2003.
[23] J.C.H. Yee and S. Pellegrino, Biaxial bending failure locus for woven-thin-ply carbon fibre reinforced plastic struc-tures. 46th AIAA/ASME/ASCE/AHS/ASC Structures, Structural Dynamics and Materials Conference, Austin, TX,2005, AIAA 2005-1811.
[24] J.C.H. Yee, Thin CFRP Composite Deployable Structures, PhD Dissertation, University of Cambridge, 2006.[25] O. Soykasap. Micromechanical models for bending behaviour of woven composites. Journal of Spacecraft and
Rockets, 43(5):1093–1100, 2006.[26] G. Sanford, A. Biskner, and T.W. Murphey. Large strain behavior of thin unidirectional composite flexures. 51st
AIAA/ASME/ASCE/AHS/ASC Structures, Structural Dynamics, and Materials Conference, Orlando, Florida, 12-15April 2010.
[27] C.R. Calladine. On the derivation of yield conditions for shells. J. Appl. Mech., 39(3):852–853, 1972.[28] P.G. Hodge Jr. The rigid-plastic analysis of symmetrically loaded cylindrical shells. J. Appl. Mech., 21:336–442,
1954.[29] A. Sawczuk and P.G. Hodge Jr. Comparison of yield conditions for circular cylindrical shells. Journal of the
Franklin Institute, 269(5):362–374, 1960.[30] H.M.Y.C. Mallikarachchi and S. Pellegrino. Optimized designs of composite booms with integral tape-spring
hinges. 51st AIAA/ASME/ASCE/AHS/ASC Structures, Structural Dynamics, and Materials Conference, Orlando,Florida, 12-15 April 2010.
[31] H.M.Y.C. Mallikarachchi and S. Pellegrino. Design and validation of thin-walled composite deployable booms withtape-spring hinges. 52nd AIAA/ASME/ASCE/AHS/ASC Structures, Structural Dynamics, and Materials Conference,Denver, Colorado, 4-7 April 2011.
29