failure bridge
TRANSCRIPT

8/10/2019 failure bridge
http://slidepdf.com/reader/full/failure-bridge 1/18
CHAPTER 1: INTRODUCTION
Malaysia is moving towards achieving the status of a developed nation by the year 2020.
The government has invested substantially, particularly in public infrastructure to develop the
economy. The Public Works Department (PWD) Malaysia has to ensure that the defects and
failures of infrastructure are avoided. Otherwise, the investment by the government will be
jeopardized and huge cost needed to reconstruct structural damages. Thus precautions steps
should be taken by monitoring the crack on the structure.
Detection of crack in concrete structure is critical to the safe maintenance of the structure.
Cracks may result from the material defects that occur during the build process due to excessive
crack propagation and material failure. Thus it is important to have crack detector, it is a one
method to verify the robustness of any structure. Besides that, this method is a vital for the
maintenance process of the structure. Crack inspection is a valuable nondestructive test method
and it is design to check the propagation of crack in the structure.
In order to avoid the failure occurs, it is important to check the structure of the
infrastructure from time to time. Therefore, in this paper we proposed our inspection system to
solve all these kind of failure. This inspection system used the theory of the eddy current flow todetect the crack in the structure. This paper will discussed more on the design the system, how
the system work and the expected results that will be responds.

8/10/2019 failure bridge
http://slidepdf.com/reader/full/failure-bridge 2/18
CHAPTER 2 LITERATURE REVIEW
2.1 Background
Internal crack on the building usually occurs when there have elastic deformation. The
elastic deformation may occur when the walls are unevenly loaded due to variation in stress in
different parts of wall. So, the crack may form in the walls. Other than that, shrinkage also may
occur in the walls that may lead to the internal crack. Shrinkage may occurs when the building
material absorb moisture from atmosphere and shrink whey they are dry. Cement made materials
shrink due to drying up of the moisture used in the construction. While the internal crack of the
bridge and building can escalate causing a catastrophic failure. Catastrophic failure is the
situation where there is a sudden and total failure of some system from which recovery is
impossible. Catastrophic failure often leads to cascading system failure. While cascading failure
is the situation where the failure in a system of interconnected parts in which the failure of a part
can trigger the failure of successive parts. Cascading failure usually begin when one part of the
system fails. When happened, the other components or nearby nodes also get failed due to the
failed components. Some example of the catastrophic failure of engineered structure includes:
Figure 1: Tay Bridge before collapse.
The Tay Bridge disaster on 1879 where the centre half mile of the bridge was completely
destroyed. The bridge was badly designed and its replacement was built as a separate structure
upstream of the old.
While in Malaysia, the most internal crack was due to excessive crack propagation and
material failures. The crack propagation is the situation where after the fracture initiation, any

8/10/2019 failure bridge
http://slidepdf.com/reader/full/failure-bridge 3/18
widening, lengthening or increase in the number of crack. This is normally happen to the brittle
material, but a stable crack growth can lead to significant energy absorption and therefore a
relatively tough behavior. Mean while material failure is the loss of load carrying material unit. In
fact, the material failure can be examine in different scales. From microscopic to macroscopic the
definition per se were introduced. The material failure can be distinguished in two broader
categories depending on the scale in which the material is examined. Problem in existing bridges
are often variously identified by term. Some of the term was “defects”. “Damage”,
“deterioration”, and even “bridge failure”.
2.2 BRIDGE COMPONENTS AND THEIR PROBLEM
A bridge is fundamentally a structural system comprising many components with their own
role that have different structural and functional roles. Deck slab, girders, abutments and piers are
the primary members that transmitting and bringing the load from the bridge deck down through
the foundation. The secondary member also important that included of expansion joints and
bearings, provide the articulation needed by the system to accommodate movement due to load
and temperature changes. Parapets serve to support the bridge with the load of the vehicle within
the carriageway while gullies and downpipes bring the water from the deck down to the ground
and away from the bridge components. Primary or secondary components, the role to the bridge
are still important. Once one of the components fails to function as designed, the problem would be arise and would make a bigger problem. The Road Engineering Association Malaysia
(REAM) bridge inspection guide has identified this entire problem as “damage”. The “damage”
describes each of them as a basis for condition rating. Some of the problem that usually occurs to
the bridge in Malaysia is:
1. Problems in concrete members
2. Problem in steel members
3. Bearing problems
4. Joint problems
5. Hydraulic problems
6. Excessive vibrations
7. Impact of vehicles
8. Vegetation growth
8/10/2019 failure bridge
http://slidepdf.com/reader/full/failure-bridge 4/18
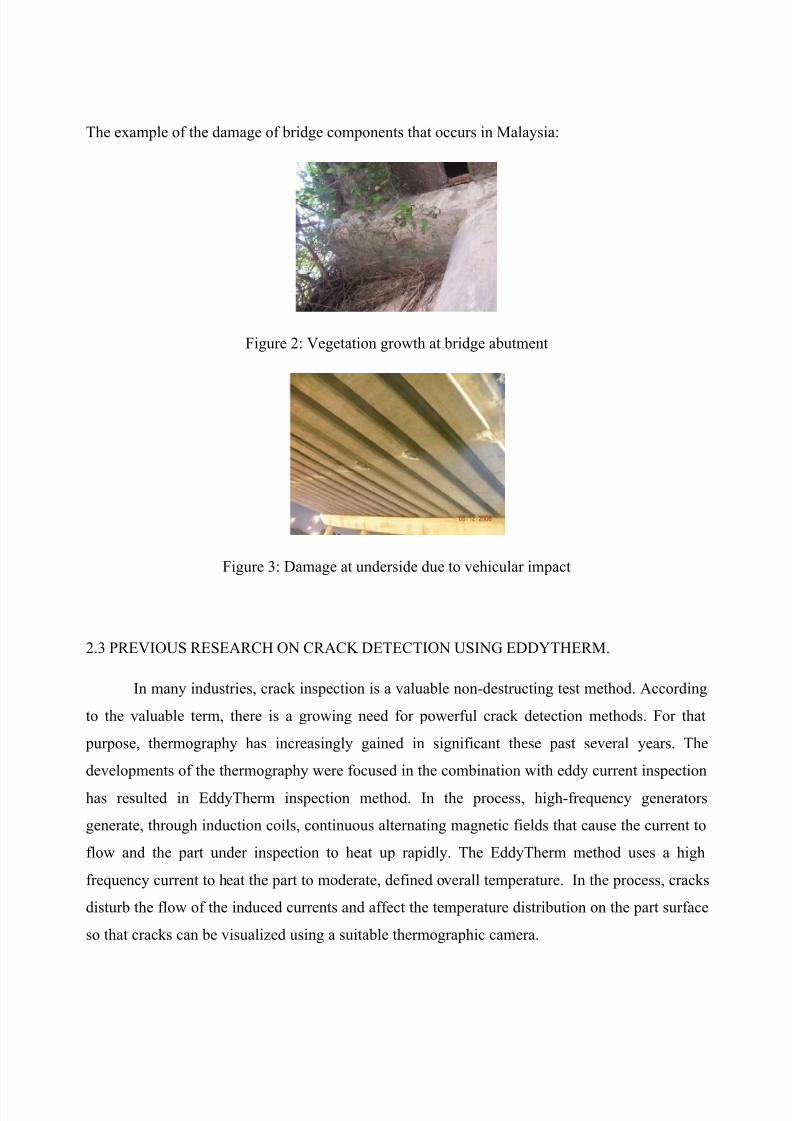
The example of the damage of bridge components that occurs in Malaysia:
Figure 2: Vegetation growth at bridge abutment
Figure 3: Damage at underside due to vehicular impact
2.3 PREVIOUS RESEARCH ON CRACK DETECTION USING EDDYTHERM.
In many industries, crack inspection is a valuable non-destructing test method. According
to the valuable term, there is a growing need for powerful crack detection methods. For that
purpose, thermography has increasingly gained in significant these past several years. The
developments of the thermography were focused in the combination with eddy current inspection
has resulted in EddyTherm inspection method. In the process, high-frequency generators
generate, through induction coils, continuous alternating magnetic fields that cause the current to
flow and the part under inspection to heat up rapidly. The EddyTherm method uses a high
frequency current to heat the part to moderate, defined overall temperature. In the process, cracks
disturb the flow of the induced currents and affect the temperature distribution on the part surface
so that cracks can be visualized using a suitable thermographic camera.

8/10/2019 failure bridge
http://slidepdf.com/reader/full/failure-bridge 5/18
Figure 4: The example of the current induced [2].
In the figure 4 shows that the induced current that flow in the inspection part. The flow of
the induced current was stable if the inspection part in the good condition (without crack). While
the cracked part make the flow of the Eddy Current not in linear and make the temperature
separation worst. The induced current would make the temperature rise. The induced current floe
in the uncraked part is smooth compared to the cracked part. As the result, the temperature
separation would be different. The different of the temperature can be seen by using suitable
thermographic camera. The schematic diagram shows that, the changed current flow through the
crack and the different in temperature at the crack tips and the colder regions at the crack flanks.
Figure 5: Computed temperature profile in the cracked metallic specimen [2].
In the figure 5 show that the different between the colder region and the hotter region due
to the difference in the induced current flow to the specimen. While the cracked specimen would
make the difference in the induced current flow that results the difference in temperature rising of
the specimen.
8/10/2019 failure bridge
http://slidepdf.com/reader/full/failure-bridge 6/18
CHAPTER 3 PRINCIPAL OF MEASUREMENT AND INSPECTION
The paper proposed non-destructive test by using eddy current. The principle of the eddy
current technique is based on the interaction between a magnetic field source and the test
material. Eddy currents are closed loops of induced current circular motion in planes
perpendicular to the magnetic flux. The fields generated can cause repulsive, attractive,
propulsion, drag and heating effects. The bigger the magnetic field produced, the faster the field
changes thus the higher the eddy current generated. When alternating current is applied to the
conductor, such as copper wire, a magnetic field develops in and around the conductor. This
magnetic field expands as the alternating current rises to maximum and collapses as the current is
reduced to zero. The current will be induced in this second conductor, if another electrical
conductor is brought into the close to this changing magnetic field. Eddy currents are induced
electrical currents that flow in a circular path. Eddy Current gets their name from “eddies” that
are formed when a liquid or gas flows in a circular path around obstacles when conditions are
right. Eddy currents travel parallel to the coil‟s winding and the flow is limited to the area of the
inducing magnetic field.
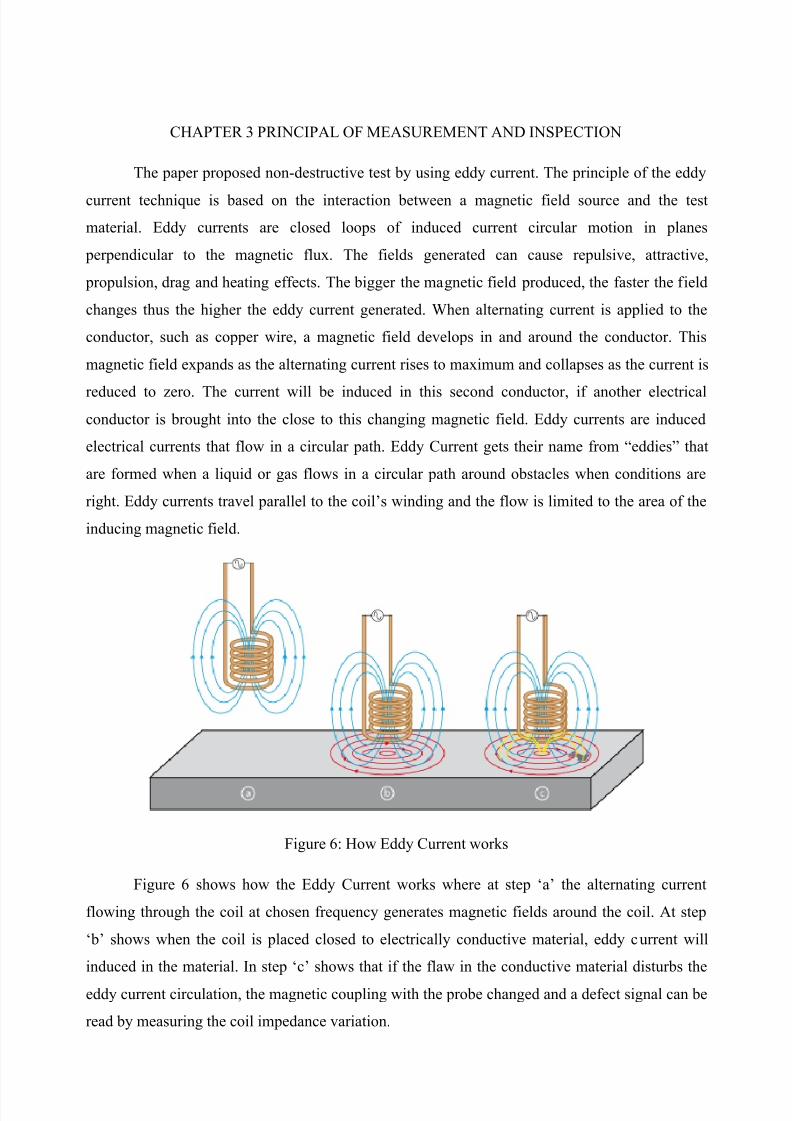
Figure 6: How Eddy Current works
Figure 6 shows how the Eddy Current works where at step „a‟ the alternating current
flowing through the coil at chosen frequency generates magnetic fields around the coil. At step
„b‟ shows when the coil is placed closed to electrically conductive material, eddy c urrent will
induced in the material. In step „c‟ shows that if the flaw in the conductive material disturbs the
eddy current circulation, the magnetic coupling with the probe changed and a defect signal can be
read by measuring the coil impedance variation.

8/10/2019 failure bridge
http://slidepdf.com/reader/full/failure-bridge 7/18
Eddy current focus near to the perpendicular surface to an excitation coil and their
strength decreases with distance from the coil. This phenomenon is known as the skin effect as
illustrate in Figure 6. Skin effect produce when the eddy currents flowing in the test object at any
depth produce magnetic field which oppose the primary field, thus reducing the net magnetic flux
and causing a decrease in current flow as the depth increases. The penetration depth can be
calculated using formula in equation 1 below:
√ Equation 1
Where:
= the penetration depth (m)
= the frequency (Hz)
= the magnetic permeability of material (H/m)
= the electrical conductivity of the material (S/m).
Besides that, eddy current suitable in the inspection of ferromagnetic and non-
ferromagnetic material. From the formula, non-ferromagnetic materials have the value of
magnetic permeability, value of 1 while ferromagnetic materials have the value of magnetic
permeability, value of larger than 1 [5].
The depth penetration of non ferromagnetic material is better than ferromagnetic material.
This means that, eddy current suitable to inspect the surface of ferromagnetic material such as
carbon steel surface material and it also suitable to inspect internal crack such as concrete
structural.
Figure 7: Illustrate diagram eddy current field depth of penetration and density [5].

8/10/2019 failure bridge
http://slidepdf.com/reader/full/failure-bridge 8/18
Every coil is characterized by the impedance parameter Z 0, which is a complex number
shows in the equation 2 and which represents the voltage-current ratio (V 0/ I 0) for a single
frequency sinusoidal excitation f . Impedance Z 0 has a magnitude | Z | and a phase :
Equation 2
A time-varying magnetic field creates when an alternating current energizes a coil. The
magnetic lines of flux tend to focus at the center of the coil. Eddy current inspection is involved
with Faraday‟s electromagnetic induction law. Equation 3 shows the Faraday electromagnetic
induction law. Faraday had found that a time-varying magnetic induction flux density induces
currents in an electrical conductor. The electromotive force ε is directly proportional to the time-
rate change of the magnetic induction flux density Φ B:
Equation 3
When an alternating energized coil of impedance Z 0 approaches an electrically conductive
non-ferromagnetic material, the primary alternating magnetic field penetrates the material and
generates continuous and circular eddy currents. The induced currents flowing within the test will
generate a secondary magnetic field that tends to oppose the primary magnetic field, as shown in
figure 8.
Figure 8: Primary and secondary magnetic field

8/10/2019 failure bridge
http://slidepdf.com/reader/full/failure-bridge 9/18
The primary magnetic field will has weakening effect because this opposing magnetic
field, coming from the conductive material. So, the new imaginary part of the coil impedance
decreases proportionally when the eddy current intensity in the test piece increases. Eddy currents
also contribute to the increasing of the power dissipation of energy that changes the real part of
coil impedance.
In order to generate currents for an inspection, a probe is used. A length of electrical
conductor which is formed into a coil is called the probe. The figure 5 shows the probe.
Figure 9: Example probes
The cracks can be detected by the change of the Eddy Current flow. The figure 6 shows
the comparison between cracks and non cracks that affect the flow of Eddy Current
Figure 10: comparison between cracks and non cracks that affect the flow of Eddy Current.

8/10/2019 failure bridge
http://slidepdf.com/reader/full/failure-bridge 10/18
CHAPTER 4 METHOD OF INSPECT
4.1 Eddy current scanning Method using differential probe
Eddy current scanning method is using probe as device to collect data from the specimen.
The test is implemented to gain reflection signal from the test piece and the signal being
processed and display based on the instrument settings. The instrument voltage range of peak
from 0 to 9v and the frequency range must within 5 to 10 MHz to penetrate the specimen. Both
impedance plane and voltage plane are used for testing. The differential probe of bi-directional
sensitivity is used to scan the specimens. The probe is can detect crack in plain and weld areas
especially steel components. It consists of two circular coils with axes parallel to the surface and
perpendicular to each other. The coil is used to compares the area that influenced by its own
magnetic field to the area influenced by the other coil. In the event, both coils are simultaneously
affected by the same material conditions; there will no signal, meaning that the bridge is
balanced. Any electromagnetic condition that is not common areas of the specimen being tested
will produce an imbalance in the system and will be detected in process, since the coils are
located in close proximity to each other, gradual changes caused by conductivity or permeability
are limited. Lift off effects are minimized, but not suppressed, as both coils are simultaneously
affected when the distance to probe surface changes. The maximum probe response is observed
when the crack is perpendicular to the direction of either winding coil. Minimal response occurwhen the crack is at a 45 degree angle from the direction of the winding coil having
approximately the same impedance, both coil are electrically connected to oppose each other.
Figure 11: Shows the scanning angle and direction of the Eddy Current method [1].
Figure 11 show a block diagram of eddy current device and its configuration. The device
used a single tone generator which is functioning to energize the test coil sensor. The frequency,
phase and amplitude are adjusted to optimum parameter for the work pieces. From the block
diagram the amplifier is used to control the frequency of eddy current in order it to penetrate
work pieces deeply and detect crack not only on the surface of test piece but fulfill the
requirement to test thick beam of metal since bridges are commonly made up from the greatthickness beam to support heavy load. When crack detected the coil impedance adaptation

8/10/2019 failure bridge
http://slidepdf.com/reader/full/failure-bridge 11/18
experience changes then the demodulator will extract the data signal that caused by the
impedance variation and visualize and display it on the screen of oscillator as XY plot graph.
Figure 12: Show block diagram and configuration of eddy current scanning device.
4.2 Standard Calibration Blocks and Crack Specimens
By using the surface of 2 reference standard steel specimens made from ASTM A588 (A709
Grade 50) and A36 (A709 Grade 36), 3 electro discharge machining (EDM) notches were
produced with different depths of 0.2mm, 0.5mm, and 1.0mm (±0.1mm). These specimens were
measured on the basic condition, where annealing and demagnetize was not apply to the
specimen. This allowed the study in effect of conductive coating on crack indications by the
surface of reference standard A588 steel specimen with inorganic zinc-based coating and lead-
based coating.
Power
source
Amplifier Impedance
adaptation Probe
Pre-filterDemodulator
Test piece
Oscillator

8/10/2019 failure bridge
http://slidepdf.com/reader/full/failure-bridge 12/18
Figure 13: EDM Standard Calibration Drawing.
In order to study and analyze the crack-depth profile and to compare a standard EDM
calibration curve with a fatigue crack-depth curve, a second set of 5 fatigue crack specimens was
used with specification of A36 (A709 Grade 36) as material, with depths of 0.8mm, 1.0mm,
1.5mm, 2.0mm, and 3.0mm (±0.25mm) and lengths of 20mm.
Figure 14: Fatigue Crack Specimen Drawing.

8/10/2019 failure bridge
http://slidepdf.com/reader/full/failure-bridge 13/18
Lastly, a third set of 3 steel specimens A588 is being tested with surface-breaking cracks.
2 of the specimens are welded with a tee joints representing either web/stiffener or web/flange
connections, then the third specimen is welded with a butt joint typically used for flange or web
splices. Both of the joints are a complete fillet weld and penetration groove welds respectively.
These specimens are subjected to the corrosive environment condition and represented as cracks.

8/10/2019 failure bridge
http://slidepdf.com/reader/full/failure-bridge 14/18
CHAPTER 5 EXPECTED RESULT
Figure 15: Eddy current distribution with depth in a thick plate and resultant phase lag
(IAEA-TECDOC, 2008) [8].
From the figure shown, the density of eddy current is exponential with depth. It also been
related to the standard depth of penetration because the density is decreasing to 1/e or in other
word 36.8% of the surface. The standard penetration showed that the plane wave electromagnetic
field excitation within the test sample. Based on the standard penetration, a formula has beenderived [7]:
Or
Where

8/10/2019 failure bridge
http://slidepdf.com/reader/full/failure-bridge 15/18
The eddy current density is influenced the sensitivity of a defect location. They are
decreasing rapidly in depth although eddy current ability can penetrates deeper than one standard
depth of penetration.
Figure 16: The Standard Depth of Penetration for Carbon Steel, Stainless Steel,
Aluminum and Copper [9].
From the figure 16 above, it shown that, the frequency affects the standard depth of
penetration. Based on the formula given it showed that the higher the frequency the lower the
depth of penetration. The effective depth of penetration usually defined as three time of the
standard depth where the eddy current density is decreasing to 5% of its initial value.
Figure 17: Typical eddy current instrument and display [9].

8/10/2019 failure bridge
http://slidepdf.com/reader/full/failure-bridge 16/18
From the figure 17 above, it shown that typical reading of eddy current machine based on
cracking of varying depths. In the graph shown, the cracking section can be detected through the
amplitude and the phase of response.
Figure 18: Impedance diagram showing the conductivity curve, and the thickness curve [7].
From the figure 18 above, the test frequency is set to 90 to be tested for the thickness of
the material. The operating point is absolutely at the bottom of the thickness curve, and the lift-
off curve from this point is approximately at 90 to the thickness curve. The eddy currentinstrument display is normally set up with the lift-off trace horizontal to the left. Material
significantly thicker use because the sensitivity to changes in thickness reduces rapidly below at
90 operating point. It also can be concluded that the thickness curve crosses the conductivity
curve as the thickness approaches the effective depth of penetration. This means that, when
operating in this region of the curve, the same lift-off trace would be obtained from two different
thicknesses of material.

8/10/2019 failure bridge
http://slidepdf.com/reader/full/failure-bridge 17/18
CONCLUSION
As the conclusion, this paper is about solving the structural problem in building and
bridges which is made ferrous and non ferrous material by recommends the use of crack
detections system. The system involves eddy current working principle as the basic knowledge to
design the crack detector for non ferrous and ferrous material. From the research, eddy current
principle is valid to check the crack propagation in neither building nor bridges structure. The
depth of eddy current for inspection can be defined by using the equation 1. This paper proposed
the crack detection system as shown in figure 12. The expected result from this system predicted
to be in graph. From the graph the types of crack can be determined based on the output signal
shown.

8/10/2019 failure bridge
http://slidepdf.com/reader/full/failure-bridge 18/18
REFERENCES
1. Highway Administration, November 2000. “Detection on Sizing of Cracks in
Structural Steel Using Eddy Current”. U.S department Transportation.
2. G. ZENZINGER , J. BAMBERG, M. DUMM, P. NUTZ. “Crack Detection Using Eddy
Therm”. MTU AERO E NGINES, D-80995 MUNICH, GERMANY.
3. Koichi Morita and Kazuya Noguchi. “Crack Detection Methods Using Radio
Frequency Identification and Electrically Conductive Materials”. National Institute
for Land and Infrastructure Management, Tsukuba-shi, Ibaraki-ken, 305-0802,
Japan.
4. Libor TOPOLAR, Lubos PAZDERA, Jaroslav SMUTNY, Vlastimil BILEK,
Marta KORENSKA, Veronika RODRIGUEZOVA (2012). “Crack Detection of
Concrete Slab made from Different Concrete Mixtures by Acoustic Emission
Method”. 30th European Conference on Acoustic Emission Testing & 7th
International Conference on Acoustic Emission University of Granada, 12-15
September 2012.
5. ND. Eddy Current Theory. Retrieve from:
www.innospection.com/pdfs/Eddy%20Current%20Theory.pdf. (Surf on 20
November 2011).
6. Hyeong-Gyeong Moon and Jung-Hoon Kim. “Intelligent Crack Detecting
Algorithm On The Concrete Crack Image Using Neural Network. Department of
Civil and Environmental Engineering, Yonsei University, Seoul, Korea.
7. Smith C.H., Schneider R.W., Dogaru T., and Smith S.T. (2003). EDDY-
CURRENT TESTING WITH GMR MAGNETIC SENSOR ARRAYS. Review of
Progress in Quantitative Non destructive Evaluation. Vol. 2323
8. Eddy Current Testing at Level 2: Manual for the Syllabi Contained in
IAEATECDOC-628/Rev. 2, „Training Guidelines for Non-Destructive Testing
Techniques‟
9. Hansen J. (2004). The Eddy Current Inspection Method, Part 1. History and
electrical theory. Insight. Vol. 46 No 5