facultyofengineering,science,andmedicine...facultyofengineering,science,andmedicine...
TRANSCRIPT

Faculty of Engineering, Science, and MedicineAalborg University
Department of Biotechnology, Chemistry, and Environmental Engineering.Section of Chemistry
TITLE:Modi�cation of Metal SurfacesUsing a Polystyrene Template- Electric Potential ControlledParticle Deposition
MASTER THESISSeptember 1st 2007 -May 31th 2008
PROJECT AUTHOR:Jeanette Rosa Pedersen
SUPERVISOR:Mogens Hinge
NUMBER OF COPIES: 4
REPORT PAGES: 63
APPENDIX PAGES: 8
ENCLOSURE PAGES: 1
TOTAL PAGES: 73
ENCLOSED: CD-rom
Abstract:
It was attempted to modify Cu, Al, and Cr surfaces by the useof a polystyrene template. The aim of the modi�cation wasa rough surface with a high water contact angle (CA). It wasattempted to create the polystyrene (PS) template by a com-bination of a thin liquid �lm deposition (TLFD) technique andan electric potential. The TLFD technique was applied to uti-lize lateral capillary forces. The electric potential was appliedbecause it, in literature, had been observed to enhance the lat-eral capillary forces. It was desired to achieve a template ofclosed-packed (CP) particles in mono-layer with a hexagonallattice on the metal surfaces, to obtain the smallest solid frac-tion possible. Scanning electron microscopy and contact anglemeasurements were used to analyse the samples. Furthermore,dynamic light scattering was used to analyse the particles.The characterization of the metal surfaces showed large crys-tals on the Al surface. Therefore, Al was not used for furtherexperiments. Cr had a porous surface and a CA of 95 ± 12◦.Cu had a planar surface and a CA of 84 ± 7◦.From experiments using the TLFD technique and glass slides,a PS concentration of 24 g/L and the withdrawal rates of3 · 10−2 and 1 · 10−1 mm/s were found to be optimal forfurther investigations.The metal surfaces responded di�erently to the TLFD tech-nique than the glass slides. This seemed to be caused by dif-ferent surface structures and wettabilities of the surfaces.With the TLFD technique multi-layers were formed on themetal surfaces. Therefore, a positively charged potential wasapplied on the surface. Cr was not conductive, thus, the e�ectof the potential could only be considered from the Cu samples.The potential resulted in particles being repelled from the sur-face, and a thinner �lm was achieved. The e�ect was distinctwhen applying a potential of 300 mV. CP particle mono-layerwith a hexagonal lattice were observed in some areas of thesurfaces.It was attempted to remove the particles from gold coated sam-ples. Heating of the sample for 2 hours at 550◦C resulted incrystals of several micrometers on the surface. Furthermore,the particles seemed to have shrunk, but had not been re-moved. The particles had also not been removed by the washwith toluene for 43 hours, but the sonication of samples intoluene for 5 minutes seemed to be the most e�ective method.

II

Det ingeniør-, natur-, og sunhedsvidenskabelige fakultetAalborg Universitet
Institut for bioteknologi, kemi og miljøteknik.Sektionen for kemi
TITEL:Modi�kation af metalover�aderved brug af en polystyrenskabelon- Elektrisk potentiale kontrolleretpartikel a�ejring
SPECIALE1. september 2007 -31. maj 2008
PROJEKTFORFATTER:Jeanette Rosa Pedersen
VEJLEDER:Mogens Hinge
ANTAL KOPIER: 4
RAPPORT SIDEANTAL: 63
APPENDIKS SIDEANTAL: 8
BILAG SIDEANTAL: 1
TOTAL SIDEANTAL: 73
VEDLAGT: CD-rom
Synopsis:
Det blev forsøgt at modi�cere Cu, Al og Cr over�ader vedbrug af en polystyren (PS) skabelon. Målet var, at opnå enru over�ade med en stor kontaktvinkel (CA) med vand. PSskabelonen var forsøgt dannet ved en kombination af en thinliquid �lm deposition (TLFD) teknik og et elektrisk poten-tiale. TLFD teknikken blev anvendt for at udnytte lateralkapillære krafter. Det elektriske potentiale blev påført, fordidet i litteraturen blev observeret, at det kunne forstærke delateral kapillære krafter. Det var ønsket at opnå en skabelonaf tæt-pakkede (CP) partikler i et monolag med et hexagonaltmønster på metalover�aderne. Scanning elektron mikroskopiog kontakt vinkel målinger blev brugt til analyse af prøverne.Karakteriseringen af metalover�aderne viste store krystaller påAl over�aden. Derfor blev Al ikke brugt til nogen videre forsøg.Cr havde en porøs over�ade og en CA på 95 ± 12◦. Cu havdeen plan over�ade og en CA på 84 ± 7◦.Udfra forsøg med TLFD teknikken og glasover�ader blev enPS koncentration på 24 g/L og trækhastighederne på3 · 10−2 og 1 · 10−1 mm/s fundet til at være optimale.Metalover�aderne reagerede anderledes på TLFD teknikkenend glasover�aderne. Dette syntes at skyldes, at over�adernehavde forskellige over�ade-strukturer og spændinger.Med TLFD teknikken blev der dannet multilag på metalover-�aderne, og derfor blev der tilført et positivt potentiale til over-�aderne. Cr ledte ikke strømmen, og derfor kunne e�ekten afpotentialet kun vurderes ud fra Cu prøverne. Potentialet re-sulterede i at partikler blev frastødt, og en tyndere �lm blevopnået. E�ekten var tydeligst ved et potentiale på 300 mV. CPpartikelmonolag med et hexagonalt mønster blev observeret inogle områder på nogle af prøverne.Det blev forsøgt at fjerne partiklerne fra guldbelagte prøver.Opvarmning til 550◦C i 2 timer resulterede i dannelse afkrystaller på over�aden. Desuden syntes partiklerne at haveskrumpet, men var ikke fjernet. Partiklerne blev heller ikkefjernet ved vask med toluen i 43 timer, men påvirkningen afultralyd i toluen syntes at være mest e�ektiv.

II

Preface
This report is a master thesis prepared at 9.-10. semester at the section of chemistry, Departmentof Biotechnology, Chemistry, and Environmental Engineering at Aalborg Universtity.
All references in the report are stated in accordance with the Harvard method and is listedalphabetically according to writer's surname in the end of the report.
The project is divided into chapters that are consecutive numbered. Figures, tables, and equa-tions are numbered similar to the chapter, but the �rst number is a reference to the givenchapter.
A CD-ROM containing all data from the di�erent analyses is enclosed. The notation "EnclosureCD - name of the folder" is used when referring to the CD. Additionally, experimental treatments,the referred articles, and a copy of the report (pdf) can be found on the CD.
I would like to express thanks to Jens Rafaelsen, Department of Physics and Nanotechnology,Aalborg University, for introducing and helping with the scanning electron microscopy. Further-more, I would like to acknowledge Teknologisk Institut, Århus, for contributing with the metalpre-coated slides in the project.
..............................................................Jeanette Rosa Pedersen
III

IV
Contents
1 Introduction 1
2 Background Theory 3
3 Experimental Design 93.1 Polystyrene Synthesis . . . . . . . . . . . . . . . . . . . . . . . . . . . . . . . . . 103.2 The Particle Template . . . . . . . . . . . . . . . . . . . . . . . . . . . . . . . . . 113.3 Sputter Coating and Particle Removal . . . . . . . . . . . . . . . . . . . . . . . . 133.4 Problem Statement . . . . . . . . . . . . . . . . . . . . . . . . . . . . . . . . . . . 14
4 Interaction Forces 154.1 DLVO-Theory . . . . . . . . . . . . . . . . . . . . . . . . . . . . . . . . . . . . . . 154.2 Non-DLVO Forces . . . . . . . . . . . . . . . . . . . . . . . . . . . . . . . . . . . 19
5 Experimental Methods 215.1 Synthesis and Characterization of Polystyrene Particles . . . . . . . . . . . . . . . 215.2 Deposition of Polystyrene Particles onto Surfaces . . . . . . . . . . . . . . . . . . 215.3 Removal of Particles from the Gold Coated Surface . . . . . . . . . . . . . . . . . 235.4 Scanning Electron Microscopy . . . . . . . . . . . . . . . . . . . . . . . . . . . . . 245.5 Contact Angle . . . . . . . . . . . . . . . . . . . . . . . . . . . . . . . . . . . . . . 25
6 Results 276.1 Characterization of Polystyrene Particles . . . . . . . . . . . . . . . . . . . . . . . 276.2 Withdrawal Rate and Polystyrene Concentration . . . . . . . . . . . . . . . . . . 286.3 Characterization of the Metal Surfaces . . . . . . . . . . . . . . . . . . . . . . . . 356.4 Application of an Electric Potential . . . . . . . . . . . . . . . . . . . . . . . . . . 396.5 Removal of Particles from the Gold Coated Surface . . . . . . . . . . . . . . . . . 47
V

CONTENTS
7 Discussion 517.1 Particle Size . . . . . . . . . . . . . . . . . . . . . . . . . . . . . . . . . . . . . . . 51
7.2 Thin Liquid Film Deposition . . . . . . . . . . . . . . . . . . . . . . . . . . . . . 51
7.3 Application of an Electric Potential . . . . . . . . . . . . . . . . . . . . . . . . . . 53
7.4 Removal of Particles from the Gold Coated Surface . . . . . . . . . . . . . . . . . 54
7.5 Superhydrophobic Metal Surfaces . . . . . . . . . . . . . . . . . . . . . . . . . . . 55
7.6 In a Larger Scale . . . . . . . . . . . . . . . . . . . . . . . . . . . . . . . . . . . . 56
8 Conclusion 57
9 Future Work 59
Bibliography 61
Appendices 65
A Surface Wettability 65
B Modeling of the Particle System 67
C The "Dipper" and the Set-up 71
Enclosures 71
I Calibration of the Potentiostat 73
VI

Chapter 1Introduction
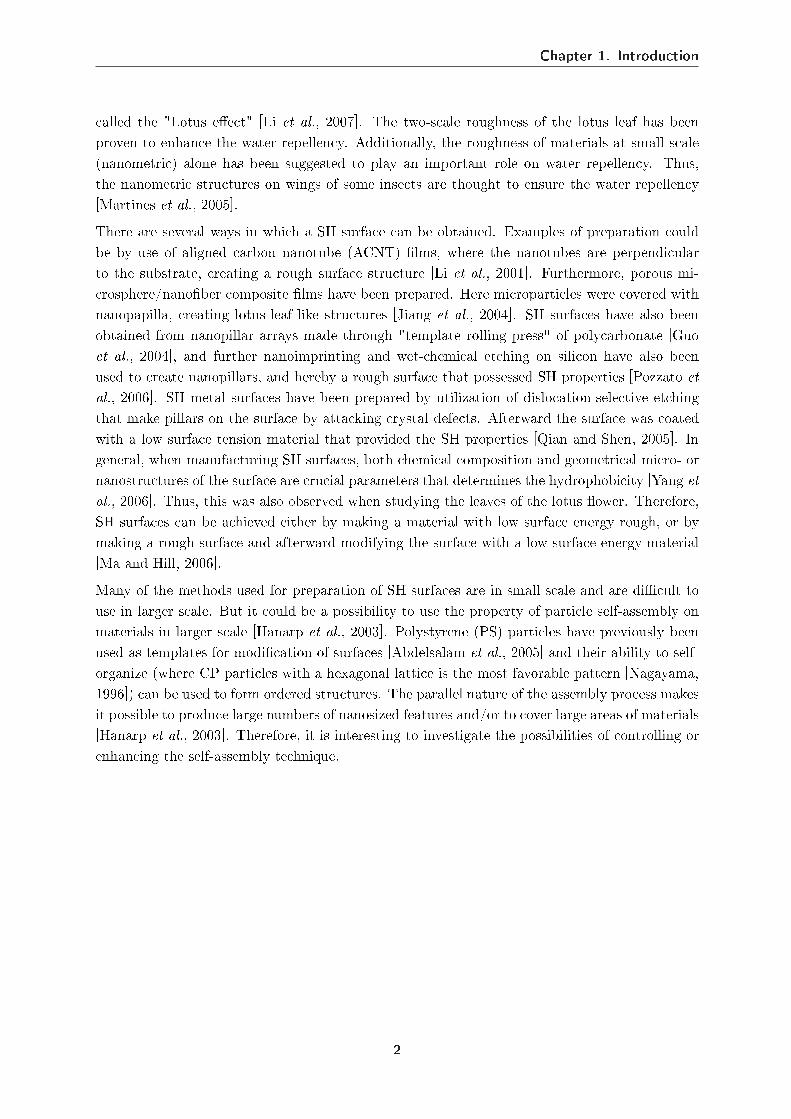
Super-hydrophobic (SH) surfaces are of special interest because of anti-sticking, anti-conta-mination, and self-cleaning properties etc. The properties of the SH surfaces could have in-dustrial and biological applications such as anti-biofouling paints for boats, anti-sticking of snowfor antennas and windows, self-cleaning windshields for automobiles etc. [Li et al., 2007]. A SHsurface is characterized as a surface with a contact angle (CA) higher than 150◦ [Li et al., 2007].Many examples of SH surfaces are seen in nature, such as water strider legs, butter�y wings,duck feathers, and the leaves of the lotus �ower [Quere, 2005]. The leaves of the lotus �owerhave a two-scale roughness, one around 10 µm and one around 100 nm, shown in Figure 1.1 [Liet al., 2007].
Figure 1.1: A SEM image of the lotus leave showing the two-scale roughness [Baumann et al., 2003].
Furthermore, the leaves of the �ower secrete epicuticular wax, containing predominantly -CH2-groups, and hereby the wax possesses a water CA of about 110◦ [Ma and Hill, 2006; Li et al.,2007]. Altogether, the micro- and nanoscale structures and the low surface energy of the waxcontribute to a water CA of 161± 2.7◦ and a CA hysteresis of 2◦ [Li et al., 2007]. The CAhysteresis gives information on the solid-liquid interaction. If the hysteresis is low, the dropis in the Cassie-Baxter ("slippy") state, and a high hysteresis denotes the Wenzel ("sticky")state [Martines et al., 2005]. Thus, the low hysteresis of the water CA on the lotus leaf causesthe water droplets to roll of the leaves while collecting contaminants. A self-cleaning e�ect,
1
Chapter 1. Introduction
called the "Lotus e�ect" [Li et al., 2007]. The two-scale roughness of the lotus leaf has beenproven to enhance the water repellency. Additionally, the roughness of materials at small scale(nanometric) alone has been suggested to play an important role on water repellency. Thus,the nanometric structures on wings of some insects are thought to ensure the water repellency[Martines et al., 2005].
There are several ways in which a SH surface can be obtained. Examples of preparation couldbe by use of aligned carbon nanotube (ACNT) �lms, where the nanotubes are perpendicularto the substrate, creating a rough surface structure [Li et al., 2001]. Furthermore, porous mi-crosphere/nano�ber composite �lms have been prepared. Here microparticles were covered withnanopapilla, creating lotus-leaf-like structures [Jiang et al., 2004]. SH surfaces have also beenobtained from nanopillar arrays made through "template rolling press" of polycarbonate [Guoet al., 2004], and further nanoimprinting and wet-chemical etching on silicon have also beenused to create nanopillars, and hereby a rough surface that possessed SH properties [Pozzato etal., 2006]. SH metal surfaces have been prepared by utilization of dislocation-selective etchingthat make pillars on the surface by attacking crystal defects. Afterward the surface was coatedwith a low surface tension material that provided the SH properties [Qian and Shen, 2005]. Ingeneral, when manufacturing SH surfaces, both chemical composition and geometrical micro- ornanostructures of the surface are crucial parameters that determines the hydrophobicity [Yang etal., 2006]. Thus, this was also observed when studying the leaves of the lotus �ower. Therefore,SH surfaces can be achieved either by making a material with low surface energy rough, or bymaking a rough surface and afterward modifying the surface with a low surface energy material[Ma and Hill, 2006].
Many of the methods used for preparation of SH surfaces are in small scale and are di�cult touse in larger scale. But it could be a possibility to use the property of particle self-assembly onmaterials in larger scale [Hanarp et al., 2003]. Polystyrene (PS) particles have previously beenused as templates for modi�cation of surfaces [Abdelsalam et al., 2005] and their ability to self-organize (where CP particles with a hexagonal lattice is the most favorable pattern [Nagayama,1996]) can be used to form ordered structures. The parallel nature of the assembly process makesit possible to produce large numbers of nanosized features and/or to cover large areas of materials[Hanarp et al., 2003]. Therefore, it is interesting to investigate the possibilities of controlling orenhancing the self-assembly technique.
2
Chapter 2Background Theory
Many investigations have been done on assembling of particles onto surfaces, and many di�erentmethods have been applied. This chapter summarises some of the previous works.
Structuring of Gold Surfaces by a Template
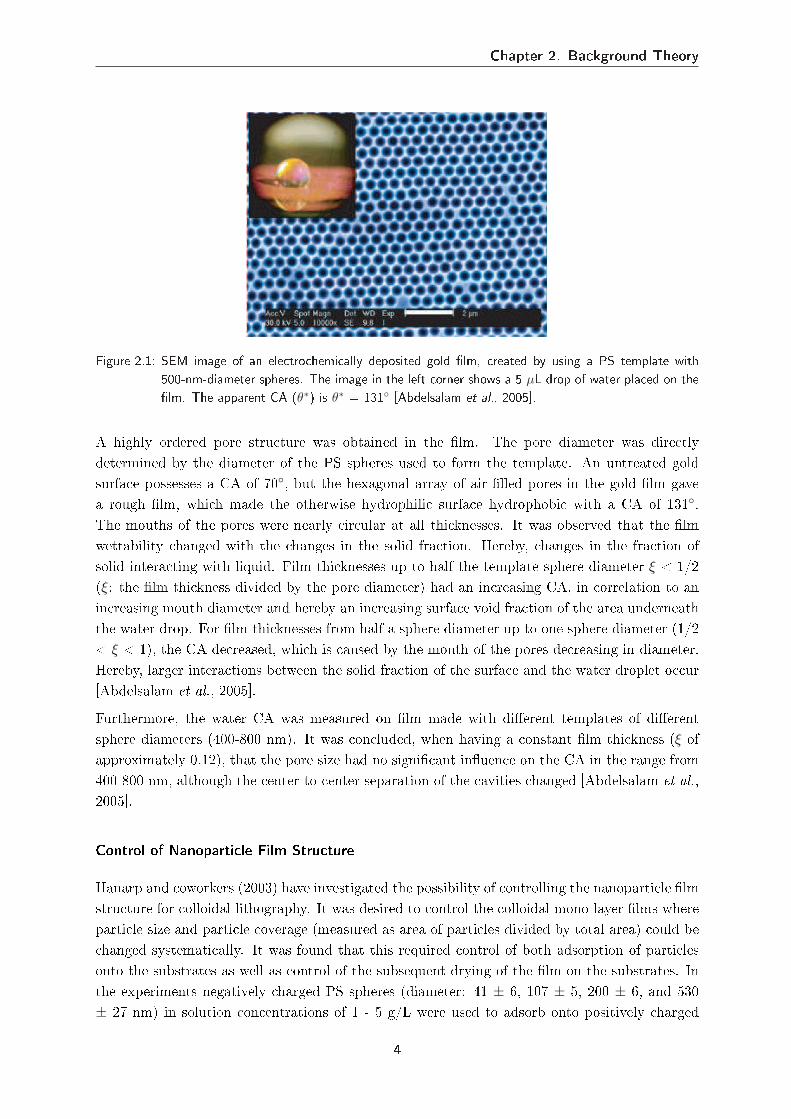
Abdelsalam and coworkers (2005) have reported a study of the wetting of regularly structuredgold surfaces. The surface was obtained by using gold electrodes as substrates and 500 nm PSspheres in a mono-layer as template. The PS particles were deposited in a thin layer cell (2 cm× 1.5 cm) made of a gold electrodes deposited with cysteamine and a clean uncoated microscopecoverglass. The gold electrode and the coverglass were held 100 µm apart by para�lm, and thespace between the two plates was �lled with an aqueous 1wt% (10 g/L) suspension of PS spheres.The cell was held vertically in an incubator to control the rate of evaporation from the cell. Whendry the templates were robust, adhered to the gold substrate and were opalescent. Gold was thenelectrochemically deposited on the template-coated gold substrate. After the deposition of gold,the spheres were removed from the substrate by dissolving the PS spheres in tetrahydrofuranand left was a porous metal �lm with regular cavities �lled with air, as seen in Figure 2.1.
3
Chapter 2. Background Theory
Figure 2.1: SEM image of an electrochemically deposited gold �lm, created by using a PS template with500-nm-diameter spheres. The image in the left corner shows a 5 µL drop of water placed on the�lm. The apparent CA (θ∗) is θ∗ = 131◦ [Abdelsalam et al., 2005].
A highly ordered pore structure was obtained in the �lm. The pore diameter was directlydetermined by the diameter of the PS spheres used to form the template. An untreated goldsurface possesses a CA of 70◦, but the hexagonal array of air-�lled pores in the gold �lm gavea rough �lm, which made the otherwise hydrophilic surface hydrophobic with a CA of 131◦.The mouths of the pores were nearly circular at all thicknesses. It was observed that the �lmwettability changed with the changes in the solid fraction. Hereby, changes in the fraction ofsolid interacting with liquid. Film thicknesses up to half the template sphere diameter ξ < 1/2(ξ: the �lm thickness divided by the pore diameter) had an increasing CA, in correlation to anincreasing mouth diameter and hereby an increasing surface void fraction of the area underneaththe water drop. For �lm thicknesses from half a sphere diameter up to one sphere diameter (1/2< ξ < 1), the CA decreased, which is caused by the mouth of the pores decreasing in diameter.Hereby, larger interactions between the solid fraction of the surface and the water droplet occur[Abdelsalam et al., 2005].
Furthermore, the water CA was measured on �lm made with di�erent templates of di�erentsphere diameters (400-800 nm). It was concluded, when having a constant �lm thickness (ξ ofapproximately 0.12), that the pore size had no signi�cant in�uence on the CA in the range from400-800 nm, although the center-to-center separation of the cavities changed [Abdelsalam et al.,2005].
Control of Nanoparticle Film Structure
Hanarp and coworkers (2003) have investigated the possibility of controlling the nanoparticle �lmstructure for colloidal lithography. It was desired to control the colloidal mono-layer �lms whereparticle size and particle coverage (measured as area of particles divided by total area) could bechanged systematically. It was found that this required control of both adsorption of particlesonto the substrates as well as control of the subsequent drying of the �lm on the substrates. Inthe experiments negatively charged PS spheres (diameter: 41 ± 6, 107 ± 5, 200 ± 6, and 530± 27 nm) in solution concentrations of 1 - 5 g/L were used to adsorb onto positively charged
4

�at titanium oxide substrates. The positively charged surface on titanium oxide substrates wasachieved, by coating the substrate with a triple layer of poly(diallyldimethylammonium chloride)(PDDA)/ poly(sodium 4-styrenesulfonate) (PSS)/ aluminium chloride hydroxide (ACH). NaClconcentrations between 0 and 100 mM were applied to the solution of particles. Adsorptiontime onto the substrates was varied between 1 and 30 minutes to allow adsorption saturation.Excess particles on the substrates were removed with running water and the surfaces were driedwith nitrogen gas. It was attempted to prevent particle aggregation during drying because itwas desired to maintain the distances between the particles. Two methods were applied, 1)adsorption of silica particles in between the larger PS particles and 2) heat treatment of thePS particles by placing the substrate in a beaker with boiling water for 30 s directly after thedeposition of particles. Furthermore, oxygen plasma treatments was used to modify the particlesize.
The triple layer of PDDA/PSS/ACH on the substrate seemed to have an in�uence on the ad-sorption of particles. This layer gave an excellent quality �lm compared to when only PDDA orACH were used. The particle coverage of a speci�c particle �lm was mainly controlled by theionic strength in the solution. The higher the salt concentration, the more the electrostatic re-pulsion between the particles was screened, and the particles could adsorb closer together. Thus,higher salt concentration leads to higher particle coverage. For particles with a diameter of 107nm, a low particle coverage limit of 0.12 was found with no salt added (electrolyte < 0.02 mM).Changing the particle concentrations did not seem to have any in�uence on the particle coverage.To obtain lower particle coverages than 0.12, oxygen plasma treatments were used. A particlecoverage of 0.40 was obtained with a salt concentration of 10 mM and with 107 nm particles.For higher particle coverages, a higher ionic strength was applied. The higher ionic strengthincreased the particle coverage, but did also induce particle aggregation and resulted in clustersof particles with empty spaces between the clusters. A salt concentration of 40 mM resultedin 3D aggregation of the particles. Aggregation of the particle �lm was observed when dryingthe �lm. The solution to this problem was found from both above-mentioned methods becausechanges in the drying method was found to prevent the particles from aggregating, and herebythe separation between the particles was maintained. An increasing aggregation was found whenusing larger particles, and this indicate stronger intermolecular forces (capillary forces). Thelarger particles did not seem to be in�uenced by the heat treatments, but the absorption of silicaparticles between the large particles helped keeping them apart [Hanarp et al., 2003].
Thin Liquid Film Depositions Technique
Dimitrov and Nagayama (1996) have used a thin liquid �lm deposition (TLFD) technique in aninvestigation of how to control the growth of particle arrays. The technique utilizes the self-assembly of particles. When a substrate is withdrawn from a liquid in a vertical direction, theparticles become trapped in a thin liquid layer, and a growth of particle array starts in oppositedirection of the substrate withdrawing direction. This is caused by evaporation of liquid from thesubstrate, which initiates particle self-assembly, when the layer thickness (h) equals the particlediameter. This is because the liquid layer is deformed when the particles is protruding theirheads from the solvent surface. Hereby, a strong attraction between the particles arises. This is
5

Chapter 2. Background Theory
also named lateral capillary forces or more speci�c lateral immersion forces. The deformation ofthe liquid surface is related to the wetting properties of the particle surface and not the gravitywhich would have been the case of �oating particles (lateral �otation forces). The �otation andimmersion forces can be both attractive and repulsive, and for two identical particles the lateralcapillary force will always be attractive. The immersion forces may be one of the main reasonsfor the self-assembly of small colloid particles [Kralchevsky and Nagayama, 2000]. Furthermore,the evaporation of water (j e) induced by the TLFD technique gives a �ux of water (jw) towardthe substrate in the suspension, to compensate the evaporated water. This induces a �ux ofparticles (j p) toward the substrate, which gives an aggregation of the particles on the substrateas illustrated in Figure 2.2 [Dimitrov and Nagayama, 1996].
Figure 2.2: An illustration of the thin liquid �lm deposition (TLFD) technique. je is evaporation of water, jwand jp is the �ux of water and particles toward the substrate, respectively. h is the �lm thickness[Dimitrov and Nagayama, 1996].
The approach of Dimitrov and Nagayama (1996) was to have a linear, continuous growth of thearrays, where the substrate was withdrawn from a suspension with a continuous rate. Further-more, this should be the same rate as the growing arrays. Secondly, a quantitative analysis of thearray growth rate was desired, and hereby it was wanted to clarify the parameters that governthe growth process. The idea was to make it possible to make large-sized homogeneous arrays,and further to control the acceleration or deceleration of the array production by changing theenvironmental conditions such as humidity, temperature, and particle volume fraction.From previous experiments it was known, that when having a atmosphere relatively saturatedwith water vapors, the initiation of the assembling of particles was extremely slowly, whereaswhen having an unsaturated atmosphere the particles were assembling rather quickly. In the last-mentioned case, the rate of the assembling, caused by the evaporation of water from the �lm,becomes much higher than the rate of assembling, caused by lateral capillary forces. Using glassslides, coated with sodium dodecyl sulfate (SDS), as surface, polycrystalline mono-layers wereachieved with the �lm formation technique. This was obtained using particles with diameters
6

ranging from approximately 80 to approximately 2100 nm. The particles and the glass slideused for this assembling was both negatively charged, and thereby an electrostatic repulsionbetween the surface and the particles was present, when close contact occurred. The interparticleelectrostatic repulsion and the hydrodynamic water in�ux pressure determined the dense packingof the particles. Moreover, the close neighboring particles was attracted to each other by lateralcapillary immersion forces, which did also contribute to the close-packing of particles. Specialattention was given to particles with diameters larger than 400 nm, in that the centimeter-sizedmono-layer particle arrays made from these particles showed opalescence. The experiments wereperformed at a temperature of 23.7 ± 0.5 ◦C and with a relative humidity of 50 ± 2%. Thesubstrates was withdrawn with a rate from 0.1 to 30 µm/s (1 · 10−4 to 3 · 10−2 mm/s) [Dimitrovand Nagayama, 1996].
The simplest way to initiate and maintain a linear growth of particle arrays was by dippinga wettable solid surface in a suspension of particles. When the surface was kept stationary,spontaneously mono- and multi-layers of particles start to grow on the surface, from the surface-suspension-air contact line down to the bulk suspension. When withdrawing the surface carefully,a homogeneous formation of mono- and multi-layer could be achieved. When the withdrawalrate equaled the growth rate, the arrays could be continuously formed to any size. The growth ofparticle arrays was found to start because of the water evaporation from the �lm. Hence, whenthe particles protrude their heads. The lateral capillary force can not initiate the particle arraygrowth [Dimitrov and Nagayama, 1996].
It was concluded that the technique worked without pitfalls if no impurities was present in thesuspension, the atmosphere around the experimental cell, the substrate plate, and the cell itself.Furthermore, the substrate plate should be completely wettable by the suspension, the particlesshould be monodispersed and should not adsorb onto the substrate. Polydispersity of the parti-cles can create instability in the array growth. Slightly di�erent particle sizes creates dislocationswhich often only in�uences small sizes of the domain. Impurities and particle aggregations cancause multi-layers. When the particles do not adsorb onto the surface, the particles have anability of sliding on the surface before the �lm dries. Hence, the attractive coulomb forces be-tween a positively and a negatively charged surface hinders the mobility of the particles. In caseof adsorbing particles, a formation of amorphous layers is expected. Moreover, it is generallyimportant that the suspension, from which the substrate was withdrawn, was stable. Thus,particle sinking must be prevented in case of larger particles ( ≈ 1 µm and above). Water vaporsaturated atmosphere was essential to prevent particle aggregation at the suspension surface,and to restrict the evaporation to be mainly near the particle �lm. Furthermore, the evaporationfrom the �lm should be slow enough, to make sure that the array �lm is not ruptured or stripped[Dimitrov and Nagayama, 1996].
Electrohydrodynamic Manipulation of Particle Deposition
Trau and coworkers (1996) have reported on a method allowing layer-by-layer deposition of 2Dand 3D colloidal crystals on electrode surfaces through electrohydrodynamic manipulation.
Submono-layers of PS particles were electrophoretic deposited onto an indium tin oxide (ITO)electrode. The �lm deposition was performed with PS particles (2 µm) from a dilute suspension,
7

Chapter 2. Background Theory
and the particle suspension was stabilized by ionic and nonionic surfactants. When a weakelectric �eld (≈ 0.5 V) was applied to the system or when the particles settled onto the electrode"gaseous" 2D structures was formed across the dilute suspension. The particles was not adheredto the electrode, but could freely move in two dimensions through Brownian motions. The2D mobility of the particles was present regardless of the large electrostatic attraction betweenthe positively charged electrode and the negatively charged particles. Thus, it seemed to be aconsequence of the stabilization of the PS particles. When the voltage was increased (from 0.5 to1.5 V) the particles moved toward one another across the electrode surface. The lateral attractionbetween the particles acted normal in spite of the applied �eld and was strong enough to bringthe particles together to form stable 2D colloid crystals of particles. When raising the voltageeven more they observed that the crystal formation was reversible. When the �eld was removedthe particles were stirred by Brownian motions and again the "gaseous" phase was formed. Bychanging the magnitude of the current the strength of the lateral attraction (particle-particleinteraction) could be controlled to give "gaseous", "liquid", and crystal 2D structures. This wasalso observed in experiments using nano-sized particles [Trau et al., 1996].
Electrophoretically deposited particles were observed to migrate toward one another over dis-tances larger than �ve particle diameters. Coalescence of particles with the same charge wasobserved, even though it would have been expected that electrostatic forces would hinder thisaggregation of particles. But the attractive interaction seemed strong enough to overcome theelectrostatic repulsion. The coalescence seemed to be a result of the electrohydrodynamic �uid�ow that is an e�ect of the ionic current �owing through the solution. Manipulation of the"lateral attraction" between particles is possible by adjusting the �eld strength or the frequency[Trau et al., 1996].
Knowledge gained from this chapter will be used when making the experimental design regardingthe particle template.
8

Chapter 3Experimental Design
It is desired to prepare SH metal surfaces, and therefore a roughening of the material must beperformed. In this work, it will be investigated whether a rough surface can be achieved usinga particle template in the surface modi�cation process. The particle template will be depositedon the surface and afterwards sputter coated with a metal to create pillars of metal between theparticles. Then, the particles will be removed, and the sputter coated metal will constitute therough surface, as illustrated in Figure 3.1.
Figure 3.1: A sketch of the fundamental idea of the method utilized in this work. Particles are coated onto thesurface, which creates a template. The sample is then sputter coated with metal, and the sputtercoating results in pillars of metal in the hole created in the pattern of the template. Afterward theparticles are removed.
It is desired to obtain a SH surface that is "slippy", and when this is the case the Cassie-Baxter(CB) model describes the apparent CA of the obtained rough surface (Details can be found inAppendix A)(Equation 3.1).
cos(θC) = f(1 + cos(θ))− 1 (3.1)
The apparent CA (cos(θC)) is according to the CB model a sole function of the solid fraction (f )for a given θ. To achieve superhydrophobicity, the solid fraction should be as small as possible.When the solid fraction is as small as possible the highest air fraction is achieved (AppendixA). To gain as small a fraction of metal as possible on the surface, the template shall be a CPmono-layer of particles with a hexagonal lattice (illustrated in Figure 3.2), hence, the naturalform of close-packing of monodisperse particles [Nagayama, 1996].
9

Chapter 3. Experimental Design
Figure 3.2: A sketch of a CP area of particles with a hexagonal lattice, and the solid fraction that is expectedto be achieved if a mono-layer of particles in a hexagonal lattice is successfully used as template.
As PS particles can be obtained monodispersed and with a wide range of surface chemistriesand charges, these particles could be used as a model system [Hanarp et al., 2003]. The size ofthe PS particles can be controlled by factors as ionic strength, initiator concentration, monomerconcentration, and temperature [Goodwin et al., 2005]. Furthermore, the PS particles can bedissolved by organic solvents, which could become useful when the particle template shall beremoved [Abdelsalam et al., 2005].
The size of the particles and the coating height of the metal, that are coated between the particles,are expected to be the factors that in�uence the surface roughness, and hereby the SH propertiesof the modi�ed surface. This is because the size of the particles and the coating height of themetal are the parameters, in this system, that in�uences the solid fraction, if the particles areCP in a hexagonal lattice. Therefore, the optimal particle size and the optimal coating heightwill be determined by a mathematical model. To estimate the optimal particle size (rparticle)and coating height (n), the solid fraction (f ) will be derived as a function of these. The modelcan be seen in Appendix B. When deriving the solid fraction as a function of the particle sizeonly, it was observed that no matter what particle size, the solid fraction was 0.093. Therefore,it was chosen to synthesize particles of 400 nm in average diameter, concerning all particlesused in the further investigations. Hence, the particle size will be kept constant to ease thesubsequent comparison of the results. Furthermore, it was from the modeling determined thatthe coating height should be equal to the particle radius to obtain the highest water CA of themodi�ed surface, which was also in accordance with the observations done by Abdelsalam andcoworkers (2005) (Appendix B). Additionally, according to the model it should be possible toobtain a water CA for rough surfaces obtained from chrome, aluminum, and copper, of about153.4◦,153.2◦, and 156.7◦, respectively.
3.1 Polystyrene Synthesis
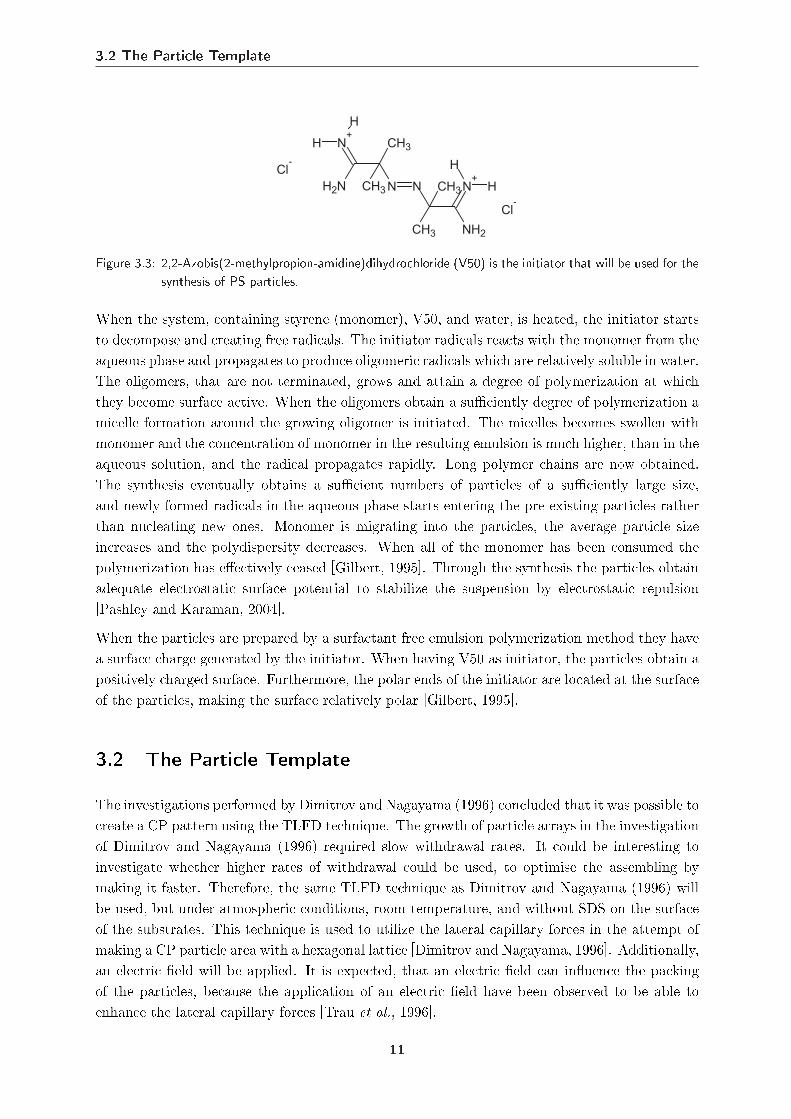
The synthesis of the particles is chosen to be a surfactant free emulsion polymerization ofstyrene in water with 2,2-Azobis(2-methylpropion-amidine)dihydrochloride (V50) as initiator.The molecular structure of the initiator is seen in Figure 3.3.
10
3.2 The Particle Template
N N
CH3
CH3
CH3
CH3
NH2
N+H
H
N+
NH2
H
H
Cl-
Cl-
Figure 3.3: 2,2-Azobis(2-methylpropion-amidine)dihydrochloride (V50) is the initiator that will be used for thesynthesis of PS particles.
When the system, containing styrene (monomer), V50, and water, is heated, the initiator startsto decompose and creating free radicals. The initiator radicals reacts with the monomer from theaqueous phase and propagates to produce oligomeric radicals which are relatively soluble in water.The oligomers, that are not terminated, grows and attain a degree of polymerization at whichthey become surface active. When the oligomers obtain a su�ciently degree of polymerization amicelle formation around the growing oligomer is initiated. The micelles becomes swollen withmonomer and the concentration of monomer in the resulting emulsion is much higher, than in theaqueous solution, and the radical propagates rapidly. Long polymer chains are now obtained.The synthesis eventually obtains a su�cient numbers of particles of a su�ciently large size,and newly formed radicals in the aqueous phase starts entering the pre-existing particles ratherthan nucleating new ones. Monomer is migrating into the particles, the average particle sizeincreases and the polydispersity decreases. When all of the monomer has been consumed thepolymerization has e�ectively ceased [Gilbert, 1995]. Through the synthesis the particles obtainadequate electrostatic surface potential to stabilize the suspension by electrostatic repulsion[Pashley and Karaman, 2004].
When the particles are prepared by a surfactant free emulsion polymerization method they havea surface charge generated by the initiator. When having V50 as initiator, the particles obtain apositively charged surface. Furthermore, the polar ends of the initiator are located at the surfaceof the particles, making the surface relatively polar [Gilbert, 1995].
3.2 The Particle Template
The investigations performed by Dimitrov and Nagayama (1996) concluded that it was possible tocreate a CP pattern using the TLFD technique. The growth of particle arrays in the investigationof Dimitrov and Nagayama (1996) required slow withdrawal rates. It could be interesting toinvestigate whether higher rates of withdrawal could be used, to optimise the assembling bymaking it faster. Therefore, the same TLFD technique as Dimitrov and Nagayama (1996) willbe used, but under atmospheric conditions, room temperature, and without SDS on the surfaceof the substrates. This technique is used to utilize the lateral capillary forces in the attempt ofmaking a CP particle area with a hexagonal lattice [Dimitrov and Nagayama, 1996]. Additionally,an electric �eld will be applied. It is expected, that an electric �eld can in�uence the packingof the particles, because the application of an electric �eld have been observed to be able toenhance the lateral capillary forces [Trau et al., 1996].
11
Chapter 3. Experimental Design
3.2.1 Thin Liquid Film Deposition
An experiment using only the TLFD technique will be performed as a reference. Hereby, it ispossible to investigate how many particles that reaches the substrate, and how they arrange onthe surface, when using only the TLFD technique. In this way, an optimal PS concentrationof particles and withdrawal rate can be estimated. Glass slides will be used as surface in thisexperiment, because of a limited number of metal pre-coated slides. The glass slides used forthis experiments will be cleaned before use by soaking them into concentrated sulfuric acid andafterward a nitric acid solution [Mori, 2007]. This is done to remove possible organic substancesand other impurities from the surface. Scanning Electron Microscopy (SEM) will be used toanalyse the samples.
Polystyrene Suspensions and Withdrawal Rates
PS suspensions with concentrations around 5, 10, and 24 g/L will be prepared in accordancewith the work done by Hanarp and coworkers (2003) and Abdelsalam and coworkers (2005). Thewithdrawal rates are chosen to be 6.7 · 10−3, 3 · 10−2, and 1 · 10−1 mm/s with accordance tothe work done by Dimitrov and Nagayama (1996).
Properties of the Metals
The wettability properties of the metals will be investigated, because this is important whenusing the TLFD technique [Dimitrov and Nagayama, 1996]. In the literature Cu, Al, and Cr arefound to possess water CAs of 97◦, 81◦ [Min and Webb, 2001] ,and 82±5◦[Wang et al., 1999],respectively. The CA of the metals will be measured and additionally, the water CA will bemeasured for the cleaned glass slides, which in the literature are found to possess a water CAof 20◦ [Mori, 2007]. Furthermore, an experiment using only the TLFD technique and metalsubstrates will be performed to investigate the response of the metal surfaces to this technique.This is the reference sample for the "Application of an Electric Field" investigations. SEM willbe used to analyse the respond of the metal surfaces to the TLFD technique.
3.2.2 Application of an Electric Field
When the TLFD technique is applied an electric potential, the electric potential will be providedand controlled by a potentiostat. The potentiostat regulates the current to keep a constantelectric potential between the working and reference electrodes [Harris, 2002]. Glass slides pre-coated with metals (Cr, Al, and Cu, recieved from Teknologisk Institut in Århus) will be usedas substrate (working electrode, WE), a Pt wire will be used as counter electrode (CE), and acalomel electrode will be used as reference electrode (RE). The substrate (WE) and the calomelelectrode (RE) will be placed as close to each other as possible. The set-up of electrodes isillustrated in Figure 3.4. Furthermore, the set-up can be seen in Appendix C.
12

3.3 Sputter Coating and Particle Removal
Figure 3.4: The electrochemical set-up. The experiments will be performed in a plastic beaker. The plasticbeaker contains a PS suspension. At the left a glass slide pre-coated with metal is placed (WE),in the middle, a calomel electrode (RE), and at the right a Pt wire (CE). The substrate will stillbe withdrawn from the suspension by the "Dipper".
In this experiment, it will be attempted to let the particles move primarily by Brownian motionsand the forces and �ux from the TLFD technique. Therefore, the electric �eld applied shouldbe a weak electric �eld, so the forces, that a �eld would normally exert on the particles, isalmost negligible. Note, the �eld is applied to retain the PS particles on or repel them from thesubstrate, not to migrate the particles toward the substrate. A weak electric �eld is achievedwhen applying 500 mV, and therefore voltages in the range of 0 - 500 mV will be investigated.The analysis of the surfaces will be by SEM, and furthermore current measurements will becollected.
3.3 Sputter Coating and Particle Removal
After deposition of the particles on the surface, the surface will be sputter coated with a metal.The metal will in these investigations be Au, because Au is sputter coated onto the surfaces beforeSEM analysis. When the substrate with the template has been sputter coated, the particles willbe removed. Di�erent methods of removing the particles will be investigated.
First, it will be investigated whether a heating of the sample can remove the particles. Thesamples will be heated up to 550◦C for two hours, because this temperature is known to destroyorganic materials without loosing larger amounts of inorganic material [DSA, 1980].
Another method, that will be investigated in the attempt of removing particles from the goldcoated surface, is a washing method, were the surface will be washed in an organic solvent todissolve the particles. The surface will in these investigations be washed with toluene, becauseof the chemicals known ability of quickly dissolving PS.
Finally, a method involving sonication of the sample for 5 minutes in toluene will be investigated.The application of ultra sound is known to fragment macromolecules and have been used formixing, solubilization, driving chemical reactions etc. [Soanes and Stevenson, 2005; Wang et al.,2008; Hlavac and Rouer, 1997].
The results of the removal investigations will be veri�ed by SEM.
13

Chapter 3. Experimental Design
3.4 Problem Statement
From the ideas presented in the experimental design, following problem statement will be inves-tigated:
Is it possible to achieve a nanostructuring of metal surfaces using polystyrene par-ticles as template?This gives rise to following questions:
1. Is it possible to obtain an arrangement of CP particle mono-layer with a hexagonal latticeusing positively charged polystyrene particles and metal surfaces?
2. Can the self-assembly of the particles be controlled or enhanced when applying an electricpotential on the surface in a thin liquid �lm deposition process?
3. Can the particles be removed from the surface after coating, leaving a nanostructuredsurface?
14

Chapter 4Interaction Forces
Di�erent forces can be expected to interfere when depositing particles onto the substrates. Inthis chapter, the forces acting between surfaces in the PS suspension are therefore examined.Particle-particle and particle-�at surface interactions will be present in the suspension. Thus,the DLVO theory and the non-DLVO forces are described. Furthermore, the in�uence of surfaceroughness on the van der Waals and electrostatic forces will be mentioned. The term "particle"are in this and following chapters de�ned as spherical particles.
4.1 DLVO-Theory
When working with a colloidal suspension the particles are electrostatic stabilized. This iscaused by the fact, that most solids release ions to some extend when immersed in a highdielectric liquid such as water. This is caused by dissociation of ions from the surface. Thedissociated ions will be of high density, which will induce repulsive forces between the equallycharged ions. Furthermore their will be a strong attraction between the dissociated ions andthe surface [Pashley and Karaman, 2004]. Therefore, the charges on the surface is balanced bythe dissociated ions, where some of the ions are bound to the surface and form the Stern layer.The remaining ions form a di�use electric double layer in the liquid close to the charged surface.In this layer electrostatic attractive forces pull the ions toward the surface and entropic forcespushes the ions apart from each other and away from the surface to increase the entropy [Mate,2008].This di�usive layer of ions is also present when immersing glass substrates in water because theglass surface hydroxylates, as given in Equation (4.1) [Mate, 2008].
SiOH −→ SiO− + H+ (4.1)
4.1.1 Particle-particle Interactions
When to surfaces with similar charge approaches each other in a liquid, their electric doublelayer starts to overlap. This increases the ion concentration near the surface, which leads to
15

Chapter 4. Interaction Forces
an decrease in entropy and an entropic repulsive interaction is generated [Mate, 2008]. Besidesthe electric double layer force, long-range van der Waals forces, that are always attractive, arealways present between two the surfaces [Pashley and Karaman, 2004].
In the DLVO theory, the total potential energy is expressed as the sum of the attractive (VA)and repulsive (VR) potential energy (Equation 4.2) [Hamley, 2006].
V = VR + VA (4.2)
where the repulsive force, for a particle-particle interaction, when having a constant potential,a di�usive layer at size of the particle radius, and particles of equal radii, is given by Equation(4.3) [Goodwin, 2004].
VR = 2πεrε0aψ2δexp(−κH) (4.3)
or with constant potential and a thin di�usive layer (Equation 4.4)[Goodwin, 2004].
VR = 2πεrε0aψ2δ ln [1 + exp(−κH)] (4.4)
where H is the distance between the surfaces, κ is the Debye-Hückel screening length, εr is therelative permittivity, ε0 is the vacuum permittivity, a is the radius of the particle and ψδ isthe surface potential. When the particles are of the same radii, the attractive force is given byEquation (4.5) [Goodwin, 2004].
VA = − A
12H
[1 +
H
2a + H+
H
aln
(H
2a + H
)](4.5)
where A is the Hamaker constant, that is a function of both the electronic polarisability and thedensity of the material. The attractions between particles in a medium is weakened due to anadditionally attraction with the medium. The attractive potential should therefore be calculatedas the geometric mean of that of the particle (Aparticle) and that of the medium (Amedium) withrespect to their values in vacuum. The Hamaker constant is given by Equation (4.6) [Eastman,2005].
A =(√
Aparticle −√
Amedium
)2(4.6)
The repulsive potential is due to overlapping electrical double layers and the attractive potentialis due to van der Waals forces [Hamley, 2006]. For a stable suspension the plot of the potentialenergies can look like given in Figure 4.1.
16

4.1 DLVO-Theory
Figure 4.1: An example of the plot of the potential energies, and the sum curve, as a function of the distancebetween two particles for a stable suspension [Pashley and Karaman, 2004].
The colloidal suspension will in this example be stable because of the large kinetic barrier, thathas a higher potential than in the primary minimum. The lowest potential is found in the primaryminimum [Hamley, 2006].
4.1.2 Particle-plate Interactions
The interactions between two equally sized particles do not equal the interactions between aparticle and a plate. The particle-plate repulsive potential energy is given as Equation (4.7)[Goodwin, 2004].
VR = 4πεrε0aψ2δexp(−κH) (4.7)
for κ a < 5 at weak overlap. At close approach the repulsive potential is given by Equation (4.8)[Goodwin, 2004].
VR = 4πεrε0aψ2δ ln [1 + exp(−κH)] (4.8)
This repulsive force described above is when assuming the surface potential of the particle andthe plate to be equal. This is not believed to be the case of the system in this work. From thecite [Goodwin, 2004] a repulsive force describing when a particle (with radius a1) interacts withanother particle (with radius a1) and the two surfaces have di�erent surface potential, and isgiven by Equation (4.9) [Goodwin, 2004].
VR =πεrε0a1a2
a1 + a2(ψ2
δ1 + ψ2δ2)
{2ψ2
δ1 + ψδ2
ψδ1 + ψ2δ2
}ln
[1 + exp(−κH)1− exp(−κH)
]+ ln [1− exp(−2κH)] (4.9)
17

Chapter 4. Interaction Forces
Assuming a1 to be very small and hereby negligible, because a2 is a much larger substrate, anexpression like in Equation (4.10) could be an approximation of the repulsive forces between aparticle and a plate of di�erence surface potentials, which is expected in this work.
VR =πεrε0a2
a2(ψ2
δ1 + ψ2δ2)
{2ψ2
δ1 + ψδ2
ψδ1 + ψ2δ2
}ln
[1 + exp(−κH)1− exp(−κH)
]+ ln [1− exp(−2κH)] (4.10)
Equation (4.10) can be reduced to Equation (4.11).
VR = πεrε0(ψ2δ1 + ψ2
δ2)
{2ψ2
δ1 + ψδ2
ψδ1 + ψ2δ2
}ln
[1 + exp(−κH)1− exp(−κH)
]+ ln [1− exp(−2κH)] (4.11)
The attractive forces are given by Equation (4.12) [Goodwin, 2004].
VA = −Aa
6H(4.12)
Both the repulsive and attractive force in the particle-plate interaction, when disregarding theapproximation of the repulsive forces (Equation 4.11), is twice that of two similar sphericalparticles [Goodwin, 2004].
4.1.3 Surface Roughness
Surface roughness of material is stated to a�ect the van der Waals and the electrostatic inter-actions. Surface roughness have been observed on glass, PS, and acrylic particles ranging from43 to 6350µm in diameter [Suresh and Walz, 1996]. By assuming to have a rough particle and asmooth surface, both with a surface potential of 50 mV, the forces can be modeled. When mod-eling the attractive van der Waals forces as a function of the surface roughness, it has been foundthat the van der Waals forces increase with increasing asperity size (surface roughness) (asperityradius of 0 nm, 20 nm, 30 nm, and 40 nm were used). Hence, the van der Waals attractionis larger at larger separation distances. The in�uence of surface roughness on the electrostaticforces has been modeled at larger separation distances. Again the electrostatic forces increaseswith increasing asperity size (surface roughness) (asperity radius of 0 nm, 20 nm, 30 nm, and 40nm were used)[Suresh and Walz, 1996].When determining the e�ect of the surface roughness on the total interaction energy, it is ob-served that the increasing roughness lowers the depth of the secondary minimum and pushesthe minimum to a larger separation distance. Additionally, at these larger separation distancesan increasing electrostatic repulsion is achieved, as an e�ect of the surface roughness, and theparticles are pushed further away from each other. Moreover, at smaller separation distances theasperities have a greater impact on the van der Waals forces, and the potential energy barrier islowered substantially. The summary of this is, that the electrostatic forces are more sensitive tothe asperities at larger separation distances than the van der Waals forces. At smaller distances,the reverse is true. A general e�ect of the roughness is that the secondary minimum is reducedand shifted toward a larger separation distance and the height of the primary repulsive energybarrier greatly lowered [Suresh and Walz, 1996].
18

4.2 Non-DLVO Forces
4.2 Non-DLVO Forces
When two surfaces or particles approach closer than a few nanometers the theory of attractivevan der Waals forces and repulsive electrostatic double-layer forces often fail to describe theirinteractions. This is either because one or both of these theories are not valid at small separationsor because non-DLVO forces comes into play. The non-DLVO forces are also both attractive andrepulsive forces and these forces can be much stronger than the DLVO forces at small separations[Israelachvili, 1995]. The particles in colloidal suspensions of PS are separated by water. Becausewater is a liquid with a high dielectric contant and a high degree of hydrogen bonding betweenthe water molecules, it leads to some distinct forces; electrostatic double layer forces, hydrationrepulsion, and hydrophobic attraction [Mate, 2008]. The electrostatic double-layer force is therepulsive force that occur when double-layers overlap, and is similar to the force that is describedin Section 4.1. Therefore, only hydration forces and hydrophobic attraction will be described inthis section.
A strong network of hydrogen bonding exist between water molecules in bulk water. Therefore,when an surface is immersed into the water, the water molecules in the immediate vicinityrearrange themselves to obtain the most favorable interaction in their new situation, also whenthis rearranging entails an interfering with the hydrogen bonding between the water molecules.When the distance between two surfaces are a few molecular diameters, the water becomes furtherdisrupted. This leads to either repulsive or attractive forces between the surfaces depending onwhether the surface is hydrophilic or hydrophobic, respectively [Mate, 2008].
4.2.1 Hydration Repulsion
The precise nature of the hydration repulsion forces between two hydrophilic surfaces is stillunclear. The repulsion is thought to be caused by water molecules adjacent to the surface, whichis hydrogen bonding to the hydrophilic surface groups, such as hydroxyl (-OH) and with hydratedsurface ions. Energy is needed to disrupt the hydrogen bonding network su�ciently, to squeezewater out from between two surfaces, that are approaching each other. The hydration repulsionenergy is found to decay exponentially with the distance between the surfaces [Mate, 2008].
4.2.2 Hydrophobic Attraction
Hydrophobic surfaces repel water (water CA of ≥ 90◦), therefore, when two hydrophobic surfacesin water approach each other, the water is spontaneously repelled from between the surfaceswhen the separation is su�ciently small. The �ight of the water molecules is associated with anattractive force (hydrophobic attraction) acting between the two hydrophobic surfaces. Also thehydrophobic attraction is found to decay exponentially with the distance between the surfaces[Mate, 2008].
At molecular level the nature of the hydrophobic attraction between surfaces is still unclear, as thenature of the hydration repulsion. But when looking at similar hydrophobic attraction betweenhydrophobic molecules dissolved in water, a hydrophobic attraction is seen because of the watermolecules have di�culties of hydrogen bonding to the hydrophobic molecule. Instead the water
19

Chapter 4. Interaction Forces
molecules form a hydrogen bonding network around the hydrophobic molecules, and herebymaximizes the hydrogen bonding between adjacent water molecules. This hydrogen bondingnetwork has a more ordered structure in proportion to liquid water, and this entails a increasein free energy due to a reduction in entropy. When two hydrophobic molecules, which aresurrounded with their structured water shells, come together, a decrease in free energy occur.This is caused by structured water molecules being released to a more disordered liquid bulkstate. A similar e�ect is thought to be due to hydrophobic attraction between hydrophobicsurfaces [Mate, 2008].
Another possible explanation of the hydrophobic attraction is that dissolved gas forms "nanobub-bles" (bubbles of nanometer size) on the hydrophobic surface. When two hydrophobic surfacesare brought together the "nanobubbles" will coalesce to bridge the gap between the surfaces.The bubbles have a water CA > 90◦ and therefore, this creates a meniscus that exerts an at-tractive force. This bubble bridging leads to a di�erent much longer range type of hydrophobicattraction, than the one gained from the �rst explanation. Hydrophobic attraction induced by"nanobubbles" can appear at tens of nanometers separations [Mate, 2008].
20

Chapter 5Experimental Methods
This chapter contains information about materials and methods used when synthesizing andcharacterizing PS particles. Furthermore, the materials, methods, and conditions used whendepositing particles onto surfaces and testing the removal of particles from gold coated surfacesare described.
5.1 Synthesis and Characterization of Polystyrene Particles
500 mL deionized water, 0.3 mol/L styrene (>99%, Sigma-Aldrich Chemie GmbH, Steinheim,Germany) and 0.003 mol/L 2,2-Azobis(2-methylpropion-amidine)dihydrochloride (V50) (97%,Sigma-Aldrich Chemie, Steinheim, Germany) were used for the synthesis of PS. First, the in-hibitor was removed from the styrene using a column containing glass wool and Al2O3 (anhy-drous, Merck, Damstadt, Germany). A �ve-necked �ask were placed in a water bath at 70 ◦Cand most of the deionized water was added to the �ask. The rest of the deionized water was usedto dissolve the initiator. A gas �ow of nitrogen was added to the �ask, and the system was leftfor about 30 minutes. Styrene and the dissolved V50 were then added and the synthesis reactedovernight.The PS particles was puri�ed by �ltrating the suspension three times through glass wool and here-after 6 days of dialysis (12-14kDa, Medicell International Ltd, London) in deionized water (thewater was changed every day). Afterwards, the size (Zetamaster S, Malvern instruments),andthe zeta potential (Zetamaster S, Malvern instruments) of the particles were estimated. Theconcentration of the suspension was estimated by performing a dry weight measurement (after�ltration and dialysis). A sample of the suspension was placed at 75 ◦C (Model: T5042E, Her-aeus electronic, Kendro Laboratory Products) for two days (the dry weight measurements wereperformed in triplicate). The particle achievement was veri�ed by SEM.
5.2 Deposition of Polystyrene Particles onto Surfaces
The deposition of particles onto surfaces was done �rst by using only the TLFD techniqueon glass slides (Microscope slides, 76×26mm, Knittel Gläser). From this an optimal rate and
21

Chapter 5. Experimental Methods
concentration was estimated. These were used for the further investigations, where the TLFDtechnique was added an electric potential. Here metal pre-coated slides were used as WE.
5.2.1 Investigation of Optimal Rate and Concentration of Particles
Glass slides used for this experiment were cleaned before use, by �rst soaking them into con-centrated sulfuric acid (95-97%, J.T. Baker, Malinckrodt Baker, Holland) overnight, then inconcentrated nitric acid solution (62%, Bie & Berntsen AS, Denmark) for 7 hours. Afterwardthe glass slides were rinsed with deionized water. The glass slides was then stored in deionizedwater in a plastic beaker according to Mori (2007).
Thin Liquid Film Deposition
PS suspensions with concentrations of 5, 10, and 24 g/L were prepared. Glass slides werewithdrawn from three di�erent suspensions with three di�erent withdrawal rates 6.7 · 10−3, 3· 10−2, and 1 · 10−1 mm/s using the "Dipper" illustrated in Figure 5.1. The "Dipper" is anapparatus, specially constructed for this project, that can withdraw slides vertical, and withdi�erent rates (details and a picture of the "Dipper" can be found in Appendix C). When usingthe "Dipper", the slide holder was placed so the slide was as close to the bottom of the "Dipper" aspossible. A plastic beaker was placed below the slide. The suspension of PS particles was pouredinto the beaker, and the withdrawal of the slide was started immediately. The investigation wasduplicated to see whether the results could be reproduced and the samples were analysed bySEM.
Figure 5.1: A sketch of the "Dipper" used to coat PS particles onto di�erent surfaces.
Thin Liquid Film Deposition with metal as substrate
The response of the TLFD technique when using a metal pre-coated slide as substrate insteadof a glass slide was tested. The metal pre-coated slide was withdrawn using the "Dipper", in theexact same way as when depositing particles on the glass slides. The optimal concentration ofPS and withdrawal rate found in the previous experiment were used.
22

5.3 Removal of Particles from the Gold Coated Surface
5.2.2 Application of an Electric Potential
Before the investigations of depositing PS particles onto the substrates using a combinationthe TLFD technique and an electric potential, the potentiostat was calibrated regarding theapplied voltage and the current of the system. Afterwards, a test of the set-up was performedusing a 20 g/L NaCl (99.5%, BDH, AnalaR, VWR International Ltd, United Kingdom) solutionin deionized water, a Cr substrate (as-received from Teknologisk Institut in Århus), a calomelelectrode (Ref 401, calomel, Radiometer analytical S.A., France), and a Pt wire. The systemwas checked varying the voltage applied (through the Pt wire) to the system, and measuring theoutput voltage and current (between the substrate and the reference electrode) with a multimeter(Digital multimeter, DT 9201). The system was ventilated and the test was performed at roomtemperature (22◦C).
When applying the potential to the TLFD technique, glass slides pre-coated with metals (as-received from Teknologisk Institut, Århus) were used. The optimal concentration of PS andwithdrawal rate from the previous experiment (cf. "Subsection 5.2.1") were used, and voltagewas applied to obtain a substrate surface potential in range from 0-300 mV.
Stability of the zeta potential of the particles
The PS suspension was applied an electric �eld several times, and therefore the zeta potentialof the particles, in the PS suspension, was measured to test the stability. This was done byextracting 40 µL of the suspension from the beaker and this was diluted until a volume of 20 mLwas achieved. The zeta potential of the suspension was measured in between the preparation ofthe samples, where the electric potential of the surface was varied from 0-300 mV.
5.3 Removal of Particles from the Gold Coated Surface
It was tested whether particles could be removed from samples sputter coated with Au from theSEM analysis.
Two samples were heated up (Model: K10, Scandia-ovnen AS, Denmark) in air, with a rate of1000◦C/hours until 550◦C. The temperature was held constant at 550◦C for two hours, and thesamples were afterward slowly cooled down.
Two other samples were placed in a blue-cap �ask with toluene (pure, Bie & Berntsen, Denmark).The slide was placed so the ends of the slide were supported by the inside of the �ask and so theside of the slide, that was coated with both particles and Au, was facing the cap of the �ask (asillustrated in Figure 5.2). A magnet was added to the �ask to stir the liquid and the �ask wasclosed. The slide was left in toluene, while the toluene was stirred for 43 hours. The sample wasremoved from the blue-cap �ask and was placed in a fume hood for half an hour.
23

Chapter 5. Experimental Methods
Figure 5.2: Sketch of the washing method, which was one of the methods tested for the ability of removingparticles from the surfaces.
Finally, two samples were placed in a blue-cap �ask with toluene, and the slide was again placedas previous described (illustrated in Figure 5.2). This time the blue-cap �ask was placed in asonicater (Output: 100 Watts, 42 kHz ± 6%)(Branson 2510, Branson Ultrasonics Corporation,USA), and the samples were sonicated for 5 minutes. The sample was removed from the blue-cap�ask and was placed in a fume hood for half an hour.
All the samples were analyzed by SEM.
5.4 Scanning Electron Microscopy
Before the analyses by SEM (Zeiss EVO 60, Brock & Michelsen A/S, United Kingdom), thesamples were coated (Model S150B sputter coater, Edwards, United Kingdom) with 20-30 nmof Au. The coating was a plasma coating. The samples were analyzed using EHT (earthed hightension): 4 kV when analyzing particle �lm deposited onto glass slides, and EHT: 6 kV when theparticle �lm was deposited onto metal pre-coated slides. Furthermore, the images taken wereall with a magni�cation of 5000 (unless otherwise stated) to ease the subsequent comparison ofthe samples. When characterizing the metal surfaces and their respond to the TLFD technique,the samples were not sputter coated with gold, and therefore EHT: 4 kV was used. Also thesamples from the "Removal of Particles from the Gold Coated Surface" test (Section 5.3) wereanalyzed using EHT: 4 kV. The samples were analyzed by taken approximately 10 images atrandom places at the sample.
5.4.1 Average Particle Area Fraction
The average particle area fraction was estimated using the picture analysis program "ImageJ1.38x". This was done by �rst extracting the area of the picture above the toolbar, because thiswould interfere in the analysis (Rectangular selections, image→ crop). Then, the background wassubtracted (Process → Subtract Background (radius 15, marking from "Light B" is removed)).Furthermore, also a �lter was used to improve the analysis (Process→ Filters→ Median (radius2)). The area fraction on the picture was found by adjusting the threshold so only the particleswere represented (Image → Adjust → Threshold). The area fraction was measured (Ctrl + M).
24

5.5 Contact Angle
5.5 Contact Angle
The CA measurements were manually performed by placing a droplet of water to the concernedsurfaces and take a picture (Image Point, Photometrics, Korea). The pictures were taken about1 minute after the droplet was placed, to ensure that equilibrium state was achieved. Whenmeasuring the CA of the glass slides (the more hydrophilic surfaces) 5 µL deionized water wasused. 6.5 µL deionized water was used when measuring the CA of the metal surfaces (themore hydrophobic surfaces). Furthermore, the measurements were performed under atmosphericpressure and room temperature. The CAs (θ) were calculated from Equation (5.1).
θ =[π − 2
(atan
(DW
2 ·DH
))]· 180
π(5.1)
DW is the drop width and DH is the drop height, and these parameters were estimated from theimages using "ImageJ 1.38x" as illustrated in Figure 5.3.
Figure 5.3: An example of a CA measurement image, where the width (DW) and the height(DH) measured,using "ImageJ 1.38x", are marked at the image.
25

Chapter 5. Experimental Methods
26

Chapter 6Results
This chapter is divided into �ve parts. First, the characterization of the particles synthesizedfor preparation of the particle template. Second, investigations of depositing particles onto glasssurfaces using the TLFD technique. Third, characterization of the metal pre-coated surfaces,which were used when an electric potential was applied. Fourth, application of an electricpotential to the TLFD technique. Finally, removal of the particles after the template have beencoated with gold. The results will be presented and partially discussed.
6.1 Characterization of Polystyrene Particles
Two Surfactant free emulsion polymerizations of styrene were performed and PS particles wereobtained, as seen in Figure 6.1.
Figure 6.1: SEM image of particles from batch 1.
Size and zeta potential of the two batches were measured and the results are given in Table 6.1.It was desired to obtain batches of particles with the same average size to ease the comparisonof the later results. The two batches prepared contained particles with an average size around400 nm, and the small di�erences in average size should not have an in�uence on the properties
27

Chapter 6. Results
of the resulting modi�ed surfaces. If CP particles with a hexagonal lattice are achieved, thetemplate will give a solid fraction of 0.093, no matter what size the particles posses. Moreover,the particles were observed to posses a positively charged surface, which was also expected whenusing V50 as initiator. The batches had di�erent zeta potentials, however, the in�uence of thisdi�erence can be avoided if particles from the same batch are used for the same investigation.The number of the batch used in the investigation will be stated before each investigation.
Table 6.1: The size, zeta potential, and concentration of the PS particles in the di�erent batches. Furthermore,the standard deviation is given.
Batch number Average size Zeta potential Concentration[nm] [mV] [g/L]
1 418 ± 9 66 ± 2 24.472 392 ± 3 55 ± 2 28.77
6.2 Withdrawal Rate and Polystyrene Concentration
It was from this investigation attempted to �nd the optimal rate of withdrawal of the substrateand optimal concentration of particles in the suspension, from which the substrate was with-drawn. Furthermore, it was investigated whether it was possible to obtain a CP mono-layer, asobtained by Dimitrov and Nagayama (1996), when the evaporation from the �lm was not con-trolled and no modi�cation was performed on the glass slides prior to the deposition of particles.Three di�erent rates and three di�erent concentrations were chosen, and glass slides were used assubstrate. The samples were withdrawn from suspensions made from batch 1. The designationsof the samples are given in Table 6.2.
Table 6.2: The samples prepared for the investigation of optimal rate of withdrawal of the substrate andoptimal concentration of particles. The samples will be designated in the text as seen in the table.Thus, sample A5 is withdrawn with a rate of 6.7 · 10−3 mm/s and is withdrawn from a 5 g/Lsuspension of PS particles. The suspensions were prepared from batch 1.
Rate Concentration[mm/s] [g/L]
5 10 246.7 · 10−3 A5 A10 A243 · 10−2 B5 B10 B241 · 10−1 C5 C10 C24
The investigation was duplicated to see whether the results could be reproduced. The resultswere reproducible as the same tendencies were observed from the two independently performedexperiments. The SEM images can be found on the Enclosure CD - "Results" - "Investigationof Rate and Concentration".
28
6.2 Withdrawal Rate and Polystyrene Concentration
When the samples were withdrawn from the suspension, a dull white layer was observed at allslide surfaces. Moreover, the �lm seemed relatively homogeneously distributed on the surface.From the SEM analysis it was veri�ed that particles were adsorbed onto all the glass slides.Furthermore, the particle �lm was present at both sides of the slide. All samples showed a littleopalescence, which was observed as mostly green colors dependent on the angle the slide was heldin. The opalescence is due to a systematic packing of particles. The opalescence was especiallydistinct for sample A24, and A10 showed a little more opalescence than the rest of the samples.When analyzing sample A24 by SEM, a more systematically packing of the sample was observed,which can be seen in Figure 6.2, A24 image 2. The formation of a systematically packed layerseemed to be caused by multi-layering of the particles.
The SEM analysis of samples A5 showed areas of mono-layers with particles distributed withlarge distances between the particle aggregates. The average area fraction of particles in mono-layer was 31 %± 9% (Figure 6.2, A5 2). Furthermore, some areas with multi-layers were observedat the sample (Figure 6.2, A5 1). The analysis of sample A10 showed also particles that werewidely distributed in a mono-layer on the surface. However, the average area fraction of particleswas 35% at sample A10, and hereby the area fraction was larger than on sample A5. Particlemulti-layers were only observed on sample A10 in one of the experiments (Figure 6.2, A10). Onthe surface of sample A24 only large areas of multi-layers were observed (Figure 6.2, A24).
All samples withdrawn with 6.7 · 10−3 mm/s showed multi-layers, which can be caused by the slowwithdrawal rate. The particles are in this TLFD technique primary led to the sample by Brownianmotion and the water �ux toward the slide during withdrawal of the slide. When withdrawingthe slide slowly, it could be possible that more particles have time to reach the slide, whichexplain the formation of multi-layers. In that respect, it would have been expected that sampleA10 would have shown multi-layer areas in both of the independently performed experiments.The images of the samples were taken at six random places on the sample. Therefore, it is likelythat multi-layers were present on both of the A10 samples, but just not observed when analyzingthe sample. Maybe, also more widely distributed particle areas were present at sample A24,but was not observed. The particle concentration used when preparing sample A24 was 24 g/L.Accordingly, it is likely that more particles had adsorbed to sample A24 given primary areas ofmulti-layers. Nevertheless, it was distinct from the analysis, that the PS concentration has anin�uence on the samples, and that sample A24 contained larger and more areas of multi-layersthan sample A5 and A10.
29

Chapter 6. Results
A5
A10
A24
Figure 6.2: SEM images of the deposition of particles onto glass substrates using the TLFD technique. Thesamples withdrawn with 6.7 · 10−3 mm/s (designated A) from suspensions with three di�erent PSconcentration (batch 1); 5, 10, and 24 g/L. The rest of the images can be found on the EnclosureCD - "Results" - "Investigation of Rate and Concentration".
Sample B5 was found to have mono-layers with an average particle area fraction of 27 %± 11%,which was a lower particle area fraction than the one observed on sample A5. No multi-layerswere present at sample B5 (Figure 6.3, B5). Sample B10 had mono-layers with a average particlearea fraction of 28 %± 3%, which was also a lower fraction than the particle area fraction onsample A10 (Figure 6.3, B5 1). Furthermore, double-layers were observed in one of the samplesof B10 (Figure 6.3, B10). Again, randomly taken images could be the reason of this di�erence
30
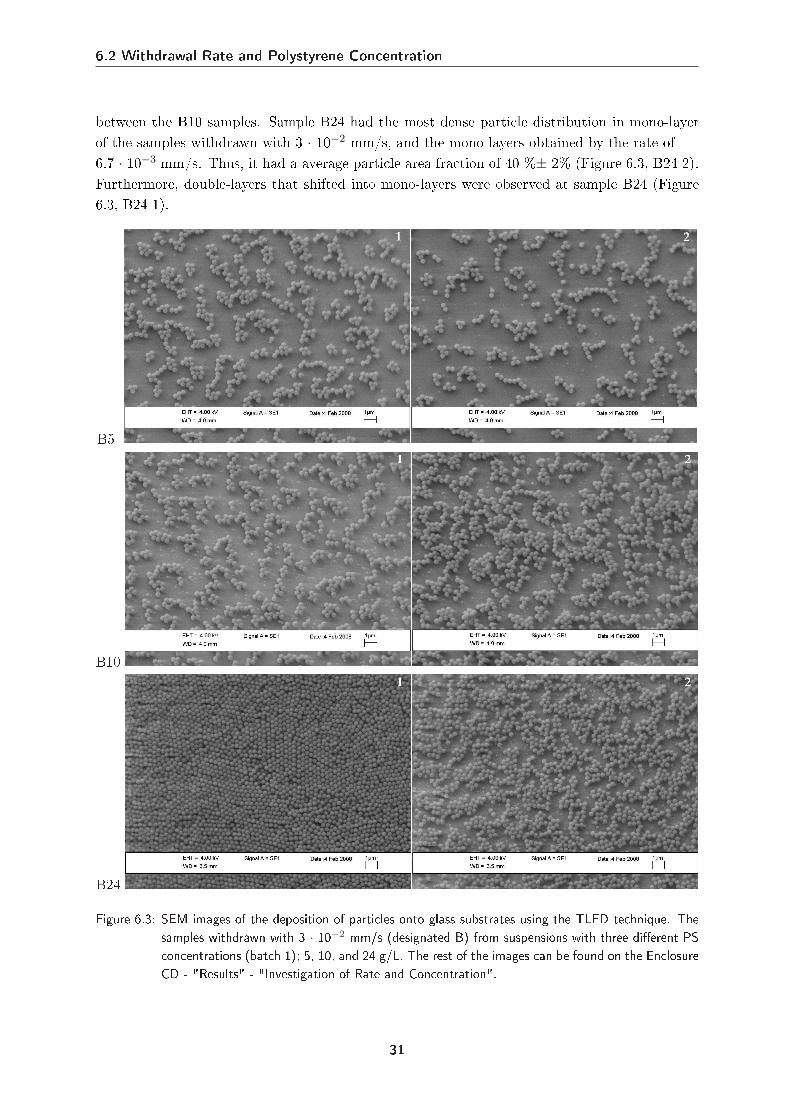
6.2 Withdrawal Rate and Polystyrene Concentration
between the B10 samples. Sample B24 had the most dense particle distribution in mono-layerof the samples withdrawn with 3 · 10−2 mm/s, and the mono-layers obtained by the rate of6.7 · 10−3 mm/s. Thus, it had a average particle area fraction of 40 %± 2% (Figure 6.3, B24 2).Furthermore, double-layers that shifted into mono-layers were observed at sample B24 (Figure6.3, B24 1).
B5
B10
B24
Figure 6.3: SEM images of the deposition of particles onto glass substrates using the TLFD technique. Thesamples withdrawn with 3 · 10−2 mm/s (designated B) from suspensions with three di�erent PSconcentrations (batch 1); 5, 10, and 24 g/L. The rest of the images can be found on the EnclosureCD - "Results" - "Investigation of Rate and Concentration".
31

Chapter 6. Results
Sample C5 had mono-layers with an average particle area fraction of 21 %± 4%, and hereby lessparticles adsorbed in the mono-layer than sample A5 and B5. No multi-layers were observed atthis sample. This can be due to the higher rate of withdrawal (Figure 6.4, C5). Sample C10 hadmono-layers with an average particle area fraction of 28 %± 5% (Figure 6.4, C10).
C5
C10
C24
Figure 6.4: SEM images of the deposition of particles onto glass substrates using the TLFD technique. Thesamples withdrawn with 1 · 10−1 mm/s (designated C) from suspensions with three di�erent PSconcentrations (batch 1); 5, 10, and 24 g/L. The rest of the images can be found on the EnclosureCD - "Results" - "Investigation of Rate and Concentration".
Furthermore, a phenomenon not seen at the other samples was observed at sample C10. Largeareas were found, where the particles were not equally distributed on the surface as seen from
32

6.2 Withdrawal Rate and Polystyrene Concentration
the mono-layers at the other surfaces. Instead particles lay close together, and with large almostparticle-free areas around it. This could be because of the faster rate of withdrawal destroyingthe progress of the �lm. It was not seen at the other samples withdrawn with the same rate,therefore the phenomenon can be a result of the exact combination of rate and PS concentration(Figure 6.4, C10). Accordingly, the phenomenon would maybe be observed again if investigatingmore combination. Sample C24 was found to have a particle area fraction of 34 %± 5%, andhereby a higher particle area fraction than sample C5 and C10. Double-layers were observed inone of the experiments, also. Sample C24 had a lower particle area fraction than sample B24(Figure 6.4, C24). The average area fractions of the samples are summarised in Table 6.3.
Table 6.3: Summary of the measurements of the average particle area fractions on the glass substrates, Thearea fractions were found using "ImageJ". Six images were taken at six random places at thesample. Furthermore, it is stated if multi-layer and double-layer were observed.
Rate [mm/s] Concentration [g/L]5 10 24
6.7 · 10−3 31 ± 9% / multi-layers 35% / multi-layers multi-layers3 · 10−2 27 ± 11% 28 ± 3%/ double-layers 40 ± 2% / double-layers1 · 10−1 21 ± 4% 28 ± 5% 34 ± 5% / double-layers
In spite of both multi-layers and mono-layers on some of the samples the �lm deposition seemedmuch uniform. The same tendencies of shifts between mono-layers and multi-layers were observedon many of the samples and the particle mono-layers on the samples seemed to be equallydistributed on the surface area. It was observed that a higher withdrawal rate, contributed toless particles being deposited on the surface. Moreover, a higher PS concentration, contributedto more particles being deposited onto the surface, as expected.For further investigations it is chosen to continue the work with two of the combinations ofwithdrawal rate and PS concentration. Sample B24 was the sample which came closest to thedesired surface adsorption, because it was observed to have the mono-layer with the highestparticle area fraction (cf. Table 6.3). Therefore, the withdrawal rate of 3 · 10−2 mm/s anda PS concentration of 24 g/L will be used in further investigations. There was also observeddouble-layers at this sample. However, the further investigation will entail an electric potential,and if this investigation is interpreted as an indication of how many particles that reach thesurface with the given rate and particle concentration, there should be enough particles to coverthe hole surface. Therefore, it is hoped that the application of potential to the substrate, andhereby an electric �eld in the system, eliminates the double-layers. This should of course be in anappropriate way, by �lling out the empty places by rearrangement of the present particles. Theparticles will to some extend be a�ected by the electric potential. This is of course dependenton the strength of the applied �eld, and at some strength the in�uence can be almost negligible.If applying a positive potential to the substrate, particles could be repelled from the surface,therefore, a concentration and rate where double-layers could be formed would be suitable. If anegative potential is applied, the particles would move towards the substrate. Furthermore, thean electric �eld is known to enhance the lateral capillary forces. Again, this is dependent on thestrength of the �eld. If the lateral capillary forces are enhanced from the used �eld strength,
33

Chapter 6. Results
the lateral capillary forces could be expected to be enhanced between particles at the substrate,and between particles at the substrate and in the surrounding liquid. Therefore, it is chosen alsoto do further investigations using sample C24, withdrawn with 1 · 10−1 mm/s and from a PSconcentration of 24 g/L. At this combination of concentration and rate, mostly mono-layers wereobserved and with an average particle area fraction of 34% ± 5% (Tabel 6.3). Hence, if moreparticles are led to the substrate, it might be better to have a substrate with less multi-layersand with room for migrating particles.
6.2.1 Vertical Surface Investigation of the Polystyrene Particle Film
In the previous investigations many of the samples were observed to have both areas of particlemono-layers and areas of particle multi-layers. It was then desired to know whether the mono-layer areas was primary present at the top and the multi-layers primary present nearer the bottomof the slide. Thus, this could be due to the slide surface nearer the bottom being immersed fora longer time, than the top of the slide. Therefore, sample B24, which was observed to containmono-layers and double-layers, was analyzed by SEM, �nding what seemed to be the top of the�lm, which was then the starting point (length = 0 mm). Then an image was taken at every3 mm in vertical direction. The images will not be shown here (the images can be seen onthe Enclosure CD - "Results" - "Vertical Surface Investigation of the Film"), but instead theobserved layers will be described and displayed in Table 6.4. When talking about mono-layersand double-layer, the images will be approximately similar to the images shown in Figure 6.3,where a mono-layer is seen at image 2 and double-layer is seen at image 1. An illustration of theanalyse method is seen beside the table.
The mono- and double-layers are not located primary at the top or at the bottom of the slide.Therefore, this will not be a problem in later experiment. In addition, this makes the sampleeven more appropriate for the further investigation. When having both not adequately packedmono-layers and double-layers, particles from the double-layers should be able to �ll out theempty places at the slide. This is attempted by applying an electric potential, which could beable to rearrange the particles at the slide. Horizontal lines were observed at sample A5-A24 andB5-B24. Hence, these horizontal lines is also seen at the image illustrating the analysis of thesurface. Therefore, the same shift between layers are most likely to occur in the other sampleswere the horizontal lines were observed. Furthermore, no horizontal lines were observed at thesamples C5-C24, and the SEM analysis showed primarily mono-layers (cf. Section 6.2). Thisindicates that the horizontal lines observed on the surfaces are due to shifts between mono-layersand multi-layers or between multi-layers of di�erent magnitudes.
34

6.3 Characterization of the Metal Surfaces
Table 6.4: A vertical investigation of sample B24 performed by taken images from the top and down. Thestarting point was made where the �lm was assumed to start (length = 0 mm), and then imageswere taken every time the focus was moved 3 mm in vertical direction and until the bottom. Whenboth mono- and double-layer are written at the same length, it means that a shift from mono-layerto a double-layer is observed at the image. An illustration of the analysis of the surface is seen atthe left of the table.
Length [mm] layer0 mono3 mono6 mono9 mono12 mono/ double15 double18 mono/ double21 mono24 double27 double30 double33 mono36 mono39 mono42 mono/ double45 mono
6.3 Characterization of the Metal Surfaces
A metal surface will be used when applying an electric potential to the TLFD technique. There-fore, the wettability of the metals were investigated. Cu, Al, and Cr surfaces were in this workcandidates when attempting to modify the surfaces. Additionally, an experiment using the TLFDtechnique on the metals without applying a potential was performed. From this the respond ofthe metal surfaces to this technique in proportion to when using glass surfaces were observed.In connection to this, CA measurements of a glass slide (cleaned according to Mori (2004)) wereperformed.
6.3.1 Contact Angle Measurements
The Cr surface was observed to possess the highest water CA, Al the second highest CA, and Cupossessed the lowest water CA. The theoretical and measured water CA of the di�erent surfacescan be seen in Table 6.5. Moreover, images from the analysis can be seen in Figure 6.5. TheCAs found for Cu and Cr deviated from the theoretical value with 13% and 16%, respectively.This are relatively high deviation in proportion to the CA measurement of the Al surface, thatdeviated with 5% from the theoretical value.
35

Chapter 6. Results
Table 6.5: Theoretical and measured water CAs of the metal surfaces and a glass substrate cleaned accordingto Mori (2004). The pictures were taken when the droplet was in equilibrium state. "ImageJ" wasused to estimate the CAs.
Sample Theoretical MeasuredCA [◦] CA [◦]
Cu 97 84 ± 7Al 81 85 ± 7Cr 82 95 ± 12
Glass 20 20 ± 12
From the CA measurements, it was observed that the glass slide possessed a low CA and herebywas hydrophilic, in proportion to the metal surfaces, that were more hydrophobic, especially Cr(hydrophobic surface: CA > 90 ◦). Therefore, the respond of the metal surfaces to the TLFDtechnique is expected to be di�erent from the respond of the glass slide, according to Dimitrovand Nagayama (1996).
Figure 6.5: Images from the CA measurements of the Cu, Al, Cr and glass surface, respectively. The glasssurface was before analysis cleaned according to Mori (2007).
6.3.2 Metal as Substrate in the Thin Liquid Film Deposition Technique
It was tested how the use of a metal substrate, instead of a glass substrate, in�uenced the particledeposition, when using only the TLFD technique. Di�erent adsorption properties in proportionto the glass substrate was expected. It was observed, that a �lm of particles was deposited ontothe three di�erent metal surfaces, and that the �lm on the Al surface looked similar to the �lmdeposited on the glass substrate. Furthermore, the �lm on the three di�erent surfaces, seen inFigure 6.6, were observed to be di�erent from each other.
36

6.3 Characterization of the Metal Surfaces
Figure 6.6: Particle deposition on Cu, Al, and Cr substrates using the TLFD technique. The metal pre-coatedsubstrates were withdrawn from a 24g/L suspension of PS and with a rate of 3·10−2 mm/s.
The �lm on the Cu surface was not homogeneously distributed. It seemed like the particles weremore concentrated near the bottom of the slide than in the top of the slide (see Figure 6.6).When analyzing the surface, by SEM, primary large areas of particle multi-layers were observed,as seen in Figure 6.7 image 1. Furthermore, particle mono-layer areas with low particle areafraction were observed. Moreover, the Cu surface was observed to be planar as seen in Figure6.7 image 2.
Figure 6.7: SEM image of a Cu pre-coated substrate withdrawn from a PS suspension of 24 g/L (batch 1)with a rate of 3·10−2 mm/s. The rest of the images can be seen at the enclosure CD - "Results"- "Characterization of the Metal Surfaces".
The �lm on the Al slide was observed to be much similar to the �lms deposited on the glass slides(see Figure 6.6). When analyzing the sample by SEM, it was observed, that the particles wererelatively equally distributed on the surface, like the particles on the glass surfaces (see Figure6.8). However, the particles had not assembled in minor groups as seen on the glass surfaces.The relatively equally deposition of particles seemed to be due to the surface structure of Al.Unlike the planar Cu surface, the surface of the Al was more rough, and it seemed like metalpieces of about 1µm×1µm were present. Because the metal pieces are larger than the particlesused for particle assembling, the metal pieces have a major impact on the applicability of Al for
37

Chapter 6. Results
deposition experiments. Thus, the metal pieces would hinder the assembling and thereby theCP of the particles.
Figure 6.8: SEM image of an Al pre-coated substrate withdrawn from a PS suspension of 24 g/L (batch 1)with a rate of 3·10−2 mm/s. The rest of the images can be seen on the Enclosure CD - "Results"- "Characterization of the Metal Surfaces".
The �lm on the Cr pre-coated substrate was also much similar to the �lm deposited on the glassslides. Although, it seemed like the �lm peeled of some places on the surface (see Figure 6.6).Furthermore, the �lm seemed thinner than on the Al, Cu, and the glass slides. When analyzingthe sample using SEM, it was observed, that less particles had deposited on the surface, thanon the Cu surface. Furthermore, mono-layers that were relatively closed packed were observedat many areas of the surface, as seen in Figure 6.9 image 1. This was also observed as a littleopalescence on the surface. In addition, the Cr surface was observed to be porous, as seen inFigure 6.9 image 2. Thus, the surface was not rough like the Al surface, but had small holes,smaller than the particles. This porous surface could also be the explanation of the di�erencein the theoretical water CA and the measured water CA. Thus, roughening of a surface cancontribute to a higher water CA (cf. Equation 3.1).
38

6.4 Application of an Electric Potential
Figure 6.9: SEM image of a Cr pre-coated substrate withdrawn from a PS suspension of 24 g/L (batch 1)with a rate of 3·10−2 mm/s. Image 2 has a larger magni�cation (18000) to make it possible tosee the surface structure of the Cr substrate. The rest of the images can be seen at the enclosureCD - "Results" - "Characterization of the Metal surfaces".
The metal surfaces were observed to respond relatively di�erent on the TLFD technique, thanthe glass slides. The di�erences in hydrophobicity/hydrophilicity could play an important role.Furthermore, the particle �lm was not as systematically deposited on the metal surfaces, as onthe glass slides. The �lm on the metals was more heterogeneous. Additionally, the respond of theAl surface to the TLFD technique, is probably due to the rough surface structure. Because therough surface would hinder the assembling of particles it is concluded, that the Al surface cannot be used in further experiments. Hence, only the Cu and Cr surfaces will be used in furtherexperiments. From the Cu sample it was observed that multi-layers were formed. Therefore, itis decided that the metal substrates will be applied a positive potential. Hereby, the particleswill be repelled/pushed away from the substrate. The chrome reference did not contain the sameamount of multi-layers, but seemed to contain mono-layers and double-layers. Still the chromesurfaces will also be applied a positive potential. Thus, to be able to determine an eventuallye�ect of the potential application, when comparing the results from the di�erent metal surfacesin the further investigations.
6.4 Application of an Electric Potential
The TLFD technique was added an electric potential using the substrate (metal surfaces) as aworking electrode (cf. Subsection 3.2.2). Before the investigations could be started, a calibrationof the potentiostat regarding voltage and current was performed (the calibration curves can beseen in Enclosure I). Furthermore, a test of the system was performed (see Figure 6.10). Fromthis test it was seen, that the desired voltage that was applied (Voltage (set) [mV]) to the solutionof sodium chloride was also the voltage measured between the substrate (WE) and the RE. Thisindicates that the system works, and the investigations of application of an electric potential tothe TLFD technique can be performed.
39

Chapter 6. Results
y = 0,9989x - 0,4817
R2 = 1
0
200
400
600
800
1000
1200
0 200 400 600 800 1000 1200
Voltage (set) [mV]
Vo
ltag
e (
measu
red
) [m
V]
Figure 6.10: The voltage measured between the reference electrode (RE) and the substrate (WE) as a functionof the voltage (set).
Reference samples were performed by withdrawing the substrate with the two rates chosen fromprevious experiments and from a 24 g/L suspension of PS particles i.e. no potential was appliedto the substrates (as in Section 6.3.2, these Cr and Cu samples is used as one of the Cr refBand Cu refB samples in the duplicate of the present investigation in this section). Furthermore,samples applied a potential of 0 mV, 60 mV, and 300 mV were prepared. The samples and theirdesignations can be seen in Table 6.6. The reference sample is not equal to the sample applied apotential of 0 mV. This is because the potential of the metal surfaces in a liquid is not known,when this is not controlled by the potentiostat. The PS suspension was prepared from batch 2.
Table 6.6: Samples prepared for the "Application of an Electric Potential" investigations. The rates are stillnamed with B and C, as in the previous experiments (cf. Subsection 6.2.1). The suspension usedwas prepared from batch 2.
Substrate Electric Potential [mV] Rate B: 3·10−2[mm/s] Rate C: 1·10−1[mm/s]Cu reference Cu refB Cu refCCu 0 Cu 0B Cu 0CCu 60 Cu 60B Cu 60CCu 300 Cu 300B Cu 300CCr reference Cr refB Cr refCCr 0 Cr 0B Cr 0CCr 60 Cr 60B Cr 60CCr 300 Cr 300B Cr 300C
6.4.1 Stability of the Particle Zeta Potential
The stability of the zeta potential of the particles was tested. The samples, from Table 6.6, wereprepared from the same suspension of PS particles. The samples were prepared in the order; CurefB - Cu 300B, Cr refB - Cr 300B, Cu refC - Cu 300C, and Cr refC - Cr 300C. The zeta potential
40

6.4 Application of an Electric Potential
of the PS suspension was measured in between the preparations of the di�erent samples. Thezeta potential of the particles was before this investigation measured to be 55 ± 2 (cf. Table 6.1).Because of problems with the PS particles contaminating the measure cell (in the Zetamaster S)the zeta potential after the preparation of Cr refB and Cr 60B are not present at the bar chart,that displays the results of the investigation, seen in Figure 6.11.
The zeta potential of the PS suspension was observed to be relatively stable throughout thepreparations of the samples. All potentials lay around 50 mV. Only the zeta potential measuredafter the preparation of Cr 0C had a signi�cant lower zeta potential. This lower potential seemedto be due to the problems with the apparatus during the measurements. The variations in theapplied potential, and hereby the �eld applied to the suspension, did not have an in�uence onthe particle zeta potential (Figure 6.11).
0
10
20
30
40
50
60
70
Cu
ref
B
Cu
0B
Cu
60B
Cu
300
B
Cr
0B
Cr
60B
Cu
ref
C
Cu
0C
Cu
60C
Cu
300
C
Cr
refC
Cr
0C
Cr
60C
Cr
300C
Zet
a p
ote
nti
al [
mV
]
Figure 6.11: The zeta potential of the particles in the PS suspension during the investigation of application ofpotential. The samples were prepared in the order seen in the bar chart, starting with sample CurefB and ending with Cr 300C. The column represents the zeta potential of the PS suspensionmeasured after the preparation of the sample.
6.4.2 Application of an Electric Potential with Chrome as Substrate
From the measurements of current collected when applying an electric potential it was observed,that the Cr samples did not conduct electricity. The current measurements showed a constantvalue of zero, with minor deviations. This was the case when using both withdrawal rates, whichcan be seen in Figure 6.12 (a) and (b).
41

Chapter 6. Results
-100
-50
0
50
100
150
200
0 500 1000 1500 2000
Time [sec]
Cu
rren
t [µ
A]
0 mV 60 mV 300 mV 0 mV duplicate 60 mV duplicate 300 mV duplicate
(a)
-100
-50
0
50
100
150
200
0 100 200 300 400 500 600
Time [sec]
Cu
rren
t [µ
A]
0 mV 60 mV 300 mV 0 mV duplicate 60 mV duplicate 300 mV duplicate
(b)
Figure 6.12: The current measurements during the preparation of the Cr samples with the potentials 0 mV,60 mV, and 300 mV and the duplicate samples, with withdrawal rate (a): 3·10−2 mm/s and (b):1·10−1 mm/s.
Furthermore, the SEM analysis showed no e�ect of the potential (the images can be seen on theenclosure CD - "Results" - "Potential experiments SEM"). Thus, the samples looked alike andwere all comparable to the reference (cf. Figure 6.9). Because of the diverse depositions observedon the chrome surfaces, it was also di�cult to see an e�ect of the faster withdrawal. However,the faster withdrawal seemed to contribute to less particles being deposited onto the surfaces,which was also expected from the results gained in Section 6.2. Besides, several of the curves inFigure 6.12 were observed to be oscillatory.
6.4.3 Application of an Electric Potential with Copper as Substrate
The potential was observed to contribute to a color change of the surface of the copper substratei.e. from a normal "copper" color to a multicolored surface, as seen in Figure 6.13. This isexpected to be due to oxidation of the surface, hence, the Cu substrates become coated with
42

6.4 Application of an Electric Potential
verdigris. Furthermore, di�erences were observed between the four samples. It seemed like the�lm became thinner and more homogeneous with increasing potential. This indicates an e�ectof the applied potential is achieved. The distinct horizontal lines seen Cu 0B, Cu 60B, and Cu300B is due to interruption of the �lm deposition.
Figure 6.13: The samples of Cu withdrawn with 3·10−2 mm/s and with varying electric potential of the Cusubstrate. The electric potential of the substrate was varied from 0 - 300 mV.
The current measurement during the preparation of the Cu samples were observed to di�er fromeach other in proportion to the current measurements of chrome, as seen in Figure 6.14. Thismust be due to the ability of Cu to conduct electricity.The current measurement of the Cu samples prepared with rate : 3·10−2mm/s, showed di�erencesof the samples prepared with 60 mV and 300 mV, from the sample prepared with a 0 mV potential(see Figure 6.14 (a)). No current was present at 0 mV, and the current increased with increasingpotential. Furthermore, the measurements were reproducible. Only minor deviations were seenbetween the curves of a sample and its duplicate. The curves of both the 60 mV samples andthe 300 mV samples were with time moving toward a current of 0 µA. This is due to the areaof the substrate (WE) immersed in the suspension becoming smaller because of the withdrawal.Thus, a current of 0 µA must indicate that a minor area or nothing of the substrate is immersedin the suspension (Figure 6.14 (a)).The current measurement of the Cu samples prepared with rate : 1·10−1 mm/s, showed likethe last-mentioned measurements, di�erences of the samples prepared with 60 mV and 300 mVfrom the sample prepared with a 0 mV potential (see Figure 6.14 (b)). This time the di�erencesbetween the three curves were more distinct. Again, no current was present at 0 mV, and thecurrent increased with increasing potential. The measurements were reproducible. Again, thecurves of both the 60 mV samples and the 300 mV samples were moving toward a current of 0µA as a function of time. This time the decline was observed to be faster and with a larger slope,especially for the 300 mV samples. Again, this must be due to the area of the substrate (WE)immersed in the suspension becoming smaller because of the withdrawal. The earlier occurrenceof the slope must be due to the faster withdrawal. Hence, the area of the substrate decreasesfaster. Moreover, a stagnation was observed in Figure 6.14 (b) for the 300 mV samples fromaround 0 sec and until around 150 sec. This is caused by the potentiostat not being able tocontribute with the power needed. This could indicate, that the potentiostat was not able to
43

Chapter 6. Results
apply the desired 300 mV on the substrate. Again, Oscillating curves were observed, only thecurves of the samples applied 300 mV had no distinct oscillating features (Figure 6.14).
-200
-100
0
100
200
300
400
500
600
0 300 600 900 1200 1500
Time [sec]
Cu
rren
t [µ
A]
0 mV 60 mV 300 mV 0 mV duplicate 60 mV duplicate 300 mV duplicate
(a)
-200
-100
0
100
200
300
400
500
600
0 100 200 300 400 500
Time [sec]
Cu
rren
t [µ
A]
0 mV 60 mV 300 mV 0 mV duplicate 60 mV duplicate 300 mV duplicate
(b)
Figure 6.14: The current measurements during the preparation of the Cu samples with the potentials 0 mV,60 mV, and 300 mV and the duplicate samples, with withdrawal rate (a): 3·10−2 mm/s and (b):1·10−1 mm/s.
Additionally to the e�ect of the potential, seen in the current measurement and on the surfaceon the macroscopic level, the SEM analysis showed an e�ect of the applied potential.
The SEM analysis of the samples withdrawn with the rate of 3·10−2 mm/s, seen in Figure 6.15,showed that the reference sample had large cracks in the �lm, which could indicate that largemulti-layers were formed and hereby many particles were deposited on the Cu substrate (Figure6.15, Cu refB). The sample applied a potential of 0 mV resembled the reference sample (Figure6.15, Cu 0B). When applying a potential of 60 mV to the substrate, less cracks were observed,which could be caused by less particles being deposited on the surface (Figure 6.15, Cu 60B).Furthermore, a thinner �lm on sample Cu 60B observed in Figure 6.13, in proportion to Cu 0B,
44

6.4 Application of an Electric Potential
also indicates that the potential is pushing particles away. With a potential of 300 mV the e�ectof the potential starts to be more marked. The substrate on the sample is now visible severalplaces, which is due to the particles being repelled because of the positive substrate potential.In general, less particles were observed at the sample applied an electric potential of 300 mV(Figure 6.15, Cu 300B).
Figure 6.15: SEM images from the analyses of Cu refB, Cu 0B, Cu 60B, and Cu 300B. The samples wereheterogeneous, therefore, the images shown are believed to represent the sample the best. Therest of the images can be seen on the Enclosure CD - "Results" - "Application of Potential" -"Potential Experiments SEM".
When withdrawing the samples with the rate of 1·10−1 mm/s, generally less particles wereobserved to be deposited on the substrate, which was also expected from the higher withdrawalrate (see Figure 6.16). From the analysis of the reference sample, Cu refC, it was observedthat the particles was now packing like it was observed at the Cr reference sample. The samplecontained mono-layers where the particles were relatively CP with the desired hexagonal lattice,but still large areas where no packing occured were observed (Figure 6.16, Cu refC). The sameobservations, as the for the reference sample, is observed for the sample applied 0mV. Slightmore particles seemed to be present at Cu 0C, though (Figure 6.16, Cu 0C). The sample applieda potential of 60 mV resembled the 0 mV sample (Figure 6.16, Cu 60C). Again, when applying a300 mV potential, less particles were deposited on the surface. Primary mono-layers are observedwhich are relatively packed (Figure 6.16, Cu 300C).
45
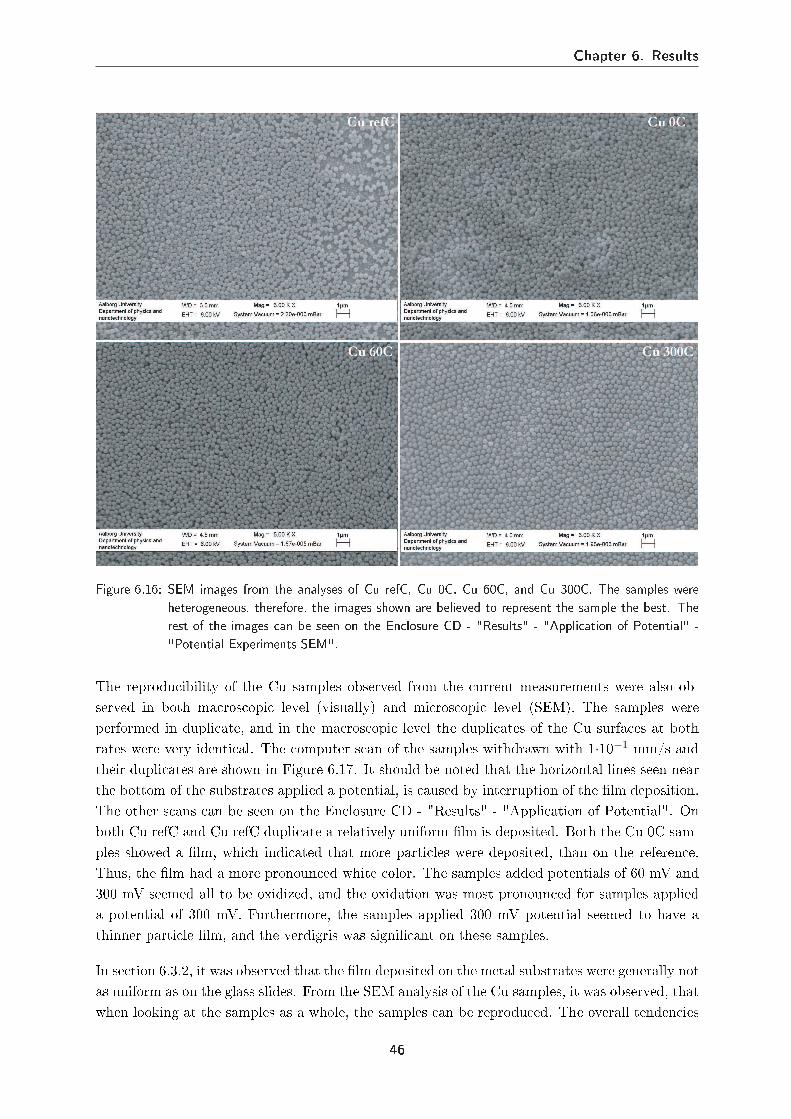
Chapter 6. Results
Figure 6.16: SEM images from the analyses of Cu refC, Cu 0C, Cu 60C, and Cu 300C. The samples wereheterogeneous, therefore, the images shown are believed to represent the sample the best. Therest of the images can be seen on the Enclosure CD - "Results" - "Application of Potential" -"Potential Experiments SEM".
The reproducibility of the Cu samples observed from the current measurements were also ob-served in both macroscopic level (visually) and microscopic level (SEM). The samples wereperformed in duplicate, and in the macroscopic level the duplicates of the Cu surfaces at bothrates were very identical. The computer scan of the samples withdrawn with 1·10−1 mm/s andtheir duplicates are shown in Figure 6.17. It should be noted that the horizontal lines seen nearthe bottom of the substrates applied a potential, is caused by interruption of the �lm deposition.The other scans can be seen on the Enclosure CD - "Results" - "Application of Potential". Onboth Cu refC and Cu refC duplicate a relatively uniform �lm is deposited. Both the Cu 0C sam-ples showed a �lm, which indicated that more particles were deposited, than on the reference.Thus, the �lm had a more pronounced white color. The samples added potentials of 60 mV and300 mV seemed all to be oxidized, and the oxidation was most pronounced for samples applieda potential of 300 mV. Furthermore, the samples applied 300 mV potential seemed to have athinner particle �lm, and the verdigris was signi�cant on these samples.
In section 6.3.2, it was observed that the �lm deposited on the metal substrates were generally notas uniform as on the glass slides. From the SEM analysis of the Cu samples, it was observed, thatwhen looking at the samples as a whole, the samples can be reproduced. The overall tendencies
46

6.5 Removal of Particles from the Gold Coated Surface
Figure 6.17: Computer scans of the samples Cu refC, Cu 0C, Cu 60C, and Cu 300C and their duplicates.
in the samples were rediscovered (Enclosure CD - "Results" - "Application of Potential"). Bothin macroscopic and microscopic level, the samples were relatively reproducible.
6.5 Removal of Particles from the Gold Coated Surface
Di�erent methods of removing particles from gold coated surfaces were investigated. No sur-faces with CP mono-layer of particles with a hexagonal lattice were obtained, therefore, theseinvestigation were performed on the Cr samples from the experiments in Subsection 6.4.2. Thesesamples were chosen, because all of the samples were generally similar, because no potential hadbeen applied. Furthermore, mostly mono-layers and double-layers were observed. Hence, theinvestigations can be related to if the CP mono-layer of particles with a hexagonal lattice wereobtained, and the particles were to be removed. The Cr samples had been coated with 20-30 nmAu before the SEM analysis.
From the investigations of heating the sample to 550◦ for 2 hours, the samples had obtaineda more intense dark gold like color, than the gold color that had been observed straight afterthe coating of the sample. The images from the SEM analysis, see Figure 6.18 showed sphericalmaterial, which could be the PS particles. Yet, the size of the particles were smaller than the
47

Chapter 6. Results
initial size. Thus, degradation of the particles may have taken place, but not enough to removethe particles completely. Furthermore, large crystals of several micrometers were found on thesurface after heating, which was probably due to the annealing of the Cr substrate. The largecrystals of several micrometers and the smaller spherical materials with sizes in the nanometerscale seen from Figure 6.18, results in a two-scale structure, that could be compared to theleaves of the lotus �ower. Unfortunately, the deformation of the samples during heating made itimpossible to measure a water CA of the surface.
Figure 6.18: SEM image of the heat treated samples. The rest of the images can be seen on the EnclosureCD - "Results" - "Removal Test".
Moreover, it was from Figure 6.19 observed that these large crystals seemed to be relativelyequally distributed all over the surface
(a) (b)
Figure 6.19: SEM image of the heat treated surface, showing the microscale structure (a), and (b) an enlarge-ment of the area marked in image (a). The rest of the images can be seen on the Enclosure CD- "Results" - "Removal Test".
The SEM analysis of the samples washed with toluene for 43 hours, see Figure 6.20, showed alot of particles, thus, the washing method did not seem to have any signi�cant e�ect of particleremoval. Deformed particles were observed on the surface, though. Therefore, toluene had been
48

6.5 Removal of Particles from the Gold Coated Surface
able to reach the particles, but not dissolve them totally.
Figure 6.20: SEM image from a samples that have been washed in toluene for 43 hours. The rest of theimages can be seen on the Enclosure CD - "Results" - "Removal Test".
The SEM images of the samples that had been sonicated in toluene for 5 minutes, see Figure 6.21,showed that the particles had been removed from the surface. Only few particles were observedon the surface during the analysis. It is from this experiment di�cult to estimate, whether thegold coating, that has been deposited between the particles, were still present on the surface,or if the sonication had removed both particles and gold coating. This is mainly because of thethin layer of gold coated onto the surface. Moreover, the SEM images showed di�erent shades ofgray on the surface, which was not observed on the chrome surfaces from the other experiment.
(a) (b)
Figure 6.21: SEM image from a sample sonicated for 5 minutes in toluene (a), and (b) an enlargement of thearea marked in image (a). The rest of the images can be seen on the Enclosure CD - "Results"- "Removal Test".
49

Chapter 6. Results
50

Chapter 7Discussion
The use of the thin liquid �lm techniques, the di�erences of the substrates, the application ofan electric potential, and the removal of particles from a metal sputter coated surface, will bediscussed on the basis of the results from the various analyses performed. Furthermore, thepossibility of achieving a SH metal surface from the basic idea of the surface modi�cation isdiscussed.
7.1 Particle Size
A model of the particle template system were prepared and it was from this concluded that theparticle size did not have an in�uence on the CA obtained after modi�cation. This was alsocon�rmed from the work done by Abdelsalam and coworkers (2005). Nevertheless, it can bediscussed whether there is an optimal particle size in connection to the technique used for thedeposition of particles. Hanarp and coworkers (2003) found indications of stronger capillary forceswith increasing particles size. Additionally, the brownian movements di�ers between di�erentsized particles, hence, smaller particles moves faster than the larger particles. Whether thedi�erence in kinetic energy of the di�erent sized particles are able to in�uence the techniques isunknown.
7.2 Thin Liquid Film Deposition
From the investigation of "Withdrawal Rate and Polystyrene Concentration" (cf. Section 6.2)no CP particle mono-layer with a hexagonal lattice was achieved with the chosen rates andconcentrations. Glass slides, which become negatively charged when immersed in water, andpositively charged particles, were used for this investigation. This was according to Dimitrovand Nagayama (1996) a bad choice, because of large attractive coulomb forces hindering packingof the particles. Although, the mobility of the particles should be hindered by the attractivecoulomb forces, the particles on samples with mono-layer seemed to assemble in smaller groups.The reason of the smaller groups could be because only the closest particles were able to attractone another enough to reach each other and assemble. It was also observed that sample B24 and
51

Chapter 7. Discussion
C24 formed larger groups of particles than the other samples and this could be due to a largeramount of particles present and hereby smaller interparticle distances and, therefore, attractionsbetween the particles was observed. A high evaporation of water from the �lm on the preparedsamples would also be an explanation of the lack of CP particle mono-layer with a hexagonallattice. Because no humidity control is performed, the �lm dries to fast and hinders the mobilityof the particles.
When using metal surfaces as substrate for the TLFD technique a di�erent particle depositionwas observed, than when using glass slides as substrates. More particles reached the surface.This could be due to the di�erence in surface energy, and hereby, the wettability. The glasssurface was observed to be hydrophilic with a water CA of 20 ± 12◦, and it is believed, thatthe particles possess a polar surface. This could be contributing to a hydration repulsion. Thus,water molecules will bound to the substrate and the particle surface, and hereby create a watershell around the surfaces. Moreover, both Cu and Al were observed to have a slightly hydrophobicsurface, with water CA of 84 ± 7◦ and 85 ± 7◦, respectively. In addition, chrome had a waterCA of 95 ± 12◦ and was hydrophobic. Cu and Al seemed to have a relatively similar wettability.Still, large multi-layers were formed on the Cu substrates and mono- and double-layers on Aland Cr. It is di�cult to involve the Al surface, because the particle deposition on this surfacecould mainly be due to the rough surface structure that hinders particle movement, and furtheracted like barbs when the Al substrate was withdrawn. But exactly the rough surface structureis a common feature of both Cr and Al. On Cr and Al less particles seemed to deposited, and thehigher repulsion of these surfaces could be due to this structure. It was from the literature foundthat an increasing surface roughness contributed to increasing electrostatic forces [Suresh andWalz, 1996]. The van der Waals forces were also increased with increasing surface roughness,so whether the observation of less particle being deposited on the Al and Cr substrates, canbe directed to the surface roughness is uncertain. However, the di�erent depositions on therough Al and Cr substrates in proportion to the smooth Cu substrates, in spite of the relativelysimilar water CA, indicates that surface roughness could play an important role. In addition,the multi-layers on the Cu substrates could be due to a slightly hydrophobic surface. Whenhaving a hydrophobic surface, hydrophobic attraction can occur. The PS particles possess apolar surface, but do still contain a hydrophobic core. Therefore, it is likely that a hydrophobicattraction could be present.
It was observed that the particles on the Cr refB and Cu refC had areas of CP particles in mono-layer with a hexagonal lattice. Hence, the particles seemed to have better possibilities of packing.This could be due to the surface possessing a positively charged surface, when immersed in water,which in accordance with Dimitrov and Nagayama (1996) would give the particles mobility andhereby larger possibilities of assembling. Many surfaces immersed in water possesses a negativelysurface charge, though. Again, the enhanced mobility could also be due to wettability di�erencesbetween the metal surfaces and the glass slides.
Whether wettability could be an explanation of, why the mono-layer/multi-layer shifts observedas horizontal lines on the glass substrates, was not observed on the metal substrates, is unknown.
52

7.3 Application of an Electric Potential
7.3 Application of an Electric Potential
Cr was observed not to conduct the electricity applied in the investigations. This could bebecause Cr is oxidizing and a chromium oxide layer is formed on the surface. This layer seemedto stick to the surface and hereby functioned as an insulator. Therefore, it could have beeninvestigated if larger voltages could have been conducted by Cr, and then an eventually e�ectof the potential could have been investigated. If larger voltages is applied, and these voltagesexceeds 500 mV, particles will start migrating. In the system used in this work, the substrateswere applied a positive potential to repel surplus particles. When the substrate is positivelycharged, the particles are positively charged, and the potential of the substrate is high to achievean e�ect, there is a risk of too many particles migrating away from the surface. Only mono-layersand double-layers was observed on the Cr reference sample, so if too much particles migratesaway from the surface, maybe, not enough particles will reach the surface to create a mono-layer.
From the current measurement when preparing the Cu samples, it was observed that di�erentmagnitudes of current was conducted. Of course, when shifting from 60 mV to 300 mV an increas-ing magnitude of conducted current would be expected. Still, larger magnitudes of conductedcurrent was seen for a withdrawal rate of 1·10−1 mm/s than when withdrawing the substrateswith 3·10−2 mm/s. From the SEM analysis of the samples it was observed, that less particleswas deposited with a higher withdrawal rate. Therefore, the higher withdrawal rate, the largermagnitude of conductivity. This indicates, that when particles are present at the substrate theconductivity and hereby the resistance of the substrate is changed. The less particles, the higherconductivity.
An e�ect of the applied potential was observed as particles being repelled from the substrate.From the literature it was predicted that an electric �eld could enhance the lateral capillaryforce. Areas of CP particle mono-layer with a hexagonal lattice occurred when the metal surfaceswere used, also without potentials, so an enhancement of the lateral capillary forces could notbe concluded on the basis of these investigations. Maybe, if the �eld strength is increased,an enhancement of the capillary forces would be observed, as a larger attraction between theparticles, and hereby close-packing of the particles. The e�ect was also by Trau and coworkers(1996) observed, to be large at higher voltages.
It could be investigated whether the conductivity of the sample can be a measure of when theformation of mono-layer is achieved. It would be a possibility of avoiding other more time-consuming analyses. Another property, that could be an indicator of when a CP particle mono-layer with a hexagonal lattice was achieved, is opalescence. Opalescence should be due to asystematic packing of particles, but still opalescence was observed on many of the samples in thiswork. This was especially on sample A24 in the investigation "Withdrawal Rate and PolystyreneConcentration" (cf. Section 6.2). The particles were systematically packed in large areas of thesubstrate, but multi-layer of particles were present. Therefore, one should be careful usingthis as an indicator of CP particle mono-layer with a hexagonal lattice. Additionally, moreor less opalescence was observed on all samples in the investigation "Withdrawal Rate andPolystyrene Concentration" even though no packing was achieved. The slight opalescence onmany of the samples could be due to that the samples contained mono-layers, where the particleswere relatively equally distributed. Whether this relatively systematic packing can contribute to
53

Chapter 7. Discussion
the opalescence is unclear. But if this was the case, maybe, the magnitude of the opalescencecould be an indicator of when a CP mono-layer of particles with a hexagonal lattice is achieved.
It was observed, that areas of CP mono-layer of particles with a hexagonal lattice turned up,when withdrawing the Cu reference with a higher rate. This could indicate the desired possibilityof enhancing the withdrawal rate, and make the process faster. More investigations could be doneon the application of potential to see, whether a optimal potential could be found that would formparticle mono-layer with the concerned withdrawal rate. Furthermore, it could be interesting toinvestigate if a negative potential and an even faster withdrawal could create the CP mono-layerof particles with a hexagonal lattice. A faster withdrawal would in this case be necessary becauseof the coloumb forces that would be present, when having opposite charged surfaces. Dimitrovand Nagayama (1996) determined surfaces of same charge to be an criteria if a CP mono-layer ofparticles should be achieved. In proportion, it was from the investigations of Trau and coworkers(1996) observed that the application of an electric �eld was able to enhance the lateral capillaryforces. Therefore, the opposite charges of the surfaces may not be important when combiningthe TLFD technique with an electric potential. Still, the opportunity of particle assemble couldbe hindered by this faster withdrawal, because of faster water evaporation from the �lm.
Oscillatory curves were observed from the current measurements. Direct current was used, so thiscan not be the reason. The potentiostat functions as a feedback system, why it could be possible,that the regulation of the surface potential of the electrode could cause the oscillations. Theoscillating curves were observed for almost all current measurement from the sample preparationof Cu. But for the sample applied a potential of 300 mV at a rate of 1x10⁻¹ mm/s, no oscillationswere observed. The stagnation of the curve was determined to be caused by the potentiostatnot being able to contribute with the power needed, and therefore, it could be possible thatthe feedback system keep the current �ow at the highest level. This is not enough to reach thedesired potential, and no oscillating curves are seen because of regulation. Another possibilitycould be that the observed oscillations were due to noise.
7.4 Removal of Particles from the Gold Coated Surface
From the investigation "Removal of Particles from the gold coated Surface" it was observed thatonly the method of sonicating the sample in toluene was able to remove the particles from thesurface. Whether or not the gold was still present on the surface could not be concluded from theinvestigations. The samples were removed from the toluene and placed in a fume hood withoutfurther treatment. Therefore, the dissolved PS was present in the liquid, and may therefore havebeen deposited as a lipid layer on the surface, when drying the sample. The di�erent gray colorsobserved on the surface could be due to this lipid layer. It could be an idea to rinse the surfacewith pure toluene, and maybe also water, after the removal of the sample from the sonicationbath, and before the drying of the sample. The method, where the samples was left in toluene for43 hours, showed particles that were partially dissolved. Maybe, if the duration was prolonged,the particles would have been dissolved. Furthermore, it could be a possibility to test the samemethod with another chemical. This should of course be a chemical, that generally, was observedto be able to dissolve PS particles. It can further be discussed whether changes in the stirring
54

7.5 Superhydrophobic Metal Surfaces
rate would be able to alter the solvation of the particles. The heat treated samples showedlarge crystals on the surface. These crystals could be due to an oxidation of the surface formingchromium oxides. The crystals were observed to form islands on the surface. This could bedue to the chromium oxide crystal minimizing there surface energy. Whether these large crystalscould have been avoided, by lowering the heating temperature or a shorter duration, is unknown.From the investigation it seemed like the particles were still present at the surface, but had onlyshrunk. The temperature of 550◦C for 2 hours should have removed all organic materials on thesurface. Maybe, the gold layer hindered the decomposition of the particles. Still, the sphericalmaterial were observed all over the substrate surface, and they were observed to be of di�erentsizes. Therefore, it is di�cult to decide if it is PS or not. If the spherical material is the PSparticles, lowering of the heating temperature or shortening the duration will not improve theremoval of particles.
7.5 Superhydrophobic Metal Surfaces
From the modeling of the particle system a estimation of the water CA, that could be achievedwith the di�erent metals, was performed. According to the model a water CA of 153.2◦- 156.7◦can be obtained, with the metal candidates in this work. A SH surface posses a water CAhigher than 150◦. Therefore, it would be desirable if a higher CA, than the estimated, couldbe achieved. The wettability, and hereby the surface energy of the material that is modi�ed,plays an important role. More speci�c, the surface energy of the material that the water dropis in contact with, plays an important role. The material that should be sputter coated ontothe surfaces should possess a high water CA. Thus, the higher water CA the metal that is usedfor sputter coating posses, the higher CA of the modi�ed surface can be achieved. Hence, aninvestigation of di�erent materials and their CA could give an alternative to the metal candidatesin this work. Furthermore, the size of the pillars play an important role in the obtained waterCA. The smaller the area fraction of solid in contact with the water droplet, the higher a CAcan be achieved. When working with particle templates, as in the present work, a smaller areafraction could be obtained, if, as an example, soft particles were used and these could be pressedtogether. Hereby, creating a smaller separation between the particles which would provide smallerpillars after the sputter coating and removal of the particles. Abdelsalam and coworkers (2005)achieved a water CA of 131◦ for a structured gold surface, and plane gold surface do normallyposses a CA of 70◦. From the modi�cation in this work, nanopillars were expected, instead ofthe network structure, observed in the work by Abdelsalam and coworkers (2005). A larger solidfraction is expected from the network structure, than from an nanopillar structure. Therefore, itis probable that a successful modi�cation with the technique and the metals in this work, couldhave given CA in the range estimated from the model. But, more work have to be done on thetechnique.
55

Chapter 7. Discussion
7.6 In a Larger Scale
The preparation of a particle template was investigated partially because the particle self-assemble was believed to function on a larger scale, in proportion to many other surface modi-�cation methods. If using the technique from the present work, the probability of using this ona larger scale can be discussed. The deposition on glass slides and pre-coated glass slide wereinvestigated. Whether it would produce problems when depositing onto something larger thanthat, is not known. Furthermore, the withdrawal part of the method could create some problemsif a particle �lm was to be deposited on curved surfaces.
56

Chapter 8Conclusion
From the investigations it was found that a higher withdrawal rate contributed to less particlesbeing deposited on the surface. Furthermore, more particles were deposited on the substrateswith increasing polystyrene (PS) concentrations.
It was found, that the thin liquid �lm deposition (TLFD) technique was in�uenced by thewettability of the substrate and the surface of the particles that was to be deposited onto thesubstrate. Hydration repulsion seemed to be observed from the deposition of particles (with polarsurfaces) on the hydrophilic glass substrate. A hydrophobic interaction seemed to take placebetween the hydrophobic substrate and the hydrophobic core of the particles. Furthermore, thedi�erences of a planar and a rough surface structure seemed to give rise to an increased repulsion,which was observed by less particles being deposited on the rough surfaces in proportion to theplanar surfaces.
Because of the formation of double- and multi-layers on the metal surfaces, when no potentialwas applied, it was decided to apply a positive potential to the substrates. The application of theelectric potential was found to be able to control the particle deposition in the TLFD technique,by controlling the amount of particles deposited on the Cu surfaces. When applying a positivepotential, less particles were deposited. No enhancement of the lateral capillary forces caused bythe electric potential could be stated from this work.
No surfaces covered totally with CP particles in mono-layer with a hexagonal lattice were ob-tained from neither the TLFD alone, nor from the combination of the TLFD and an electricpotential. Areas of CP particle mono-layer with a hexagonal lattice were observed at both Cuand Cr surfaces, but the �lm on the metal surfaces were also found to be heterogeneous.
Three di�erent methods of removing particles from the sputter coated surface were investigated.Only the method of sonicating the sample in toluene for 5 minutes had removed the particles.Further investigation of the removal, including variation of the coating height of gold, must beperformed to determine whether the particles can be removed and if the gold is still present atthe surface. From this, it should also be possible to decide whether it is possible to obtain arough structure on metal surfaces using a PS template.
57

Chapter 8. Conclusion
58

Chapter 9Future Work
It was from the investigations "Application of an Electric Potential" (cf. Section 6.4) observedthat the potentiostat was, in case of sample Cu 300C, unable to contribute with enough e�ciencyto reach the desired potential. Therefore, a potentiostat with larger e�ciency could be used infurther investigations of the application of an electric potential to the substrates.
An investigation of the application of a potential of opposite charge than the particles could beperformed. Then, when having opposite charges of the surfaces, it could be tested whether itwas possible to apply a high potential (>500mV) and have a higher rate of withdrawal. Thee�ect of the potential on the lateral capillary was not observed from the present work, but it isbelieved that a higher potential could be able to enhance these forces. This could be a possibilityof making the process of �lm deposition faster, and of achieving the CP particle mono-layer witha hexagonal lattice.
Only few tests were performed on the removal of particles from a gold coated surface. Theremoval of the particles after the assembly and sputter coating is of signi�cant importance to ideaof modifying the surface with the particle template. Therefore, the methods including toluenecould be performed with other organic solvents. These properties of the solvent could before thestart of using be investigated, regarding to the their e�ciency of solvating PS particles. Moreover,further investigations can be performed on the sonication method. Tests can be performed, wheredi�erent amount of gold is sputter coated onto the surface, and the particles is attempted to beremoved. From an experiment like this, it could possibly also be concluded whether the gold isstill present at the surface or not.
59

Chapter 9. Future Work
60

Bibliography
[Abdelsalam et al., 2005] M. E. Abdelsalam , P. N. Bartlett , T. Kelf, and J. Baumberg. Wettingof Regularly Structured Gold Surfaces. Langmuir, 21:1753�1757, 2005.
[Baumann et al., 2003] M. Baumann , G. Sakoske , L. Poth, and G. Tünker. Learning from theLotus Flower - Selfcleaning Coatings on Glass, 2003.
[Brett and Brett, 2000] C. M. A. Brett and A. M. O. Brett. Electrochemistry; Principles, Meth-ods, and Applications. Oxford University Press, New York, 2000.
[Dimitrov and Nagayama, 1996] A. S. Dimitrov and K. Nagayama. Continuous Convective As-sembling of Fine Particles into Two-Dimensional Arrays on Solid Surfaces. Langmuir, 12:1303�1311, 1996.
[DSA, 1980] DSA. Determination of Total Residue and Total Fixed Residue in Water, Sludgeand Sediment. Danish Standards Association, 1:DS 204, 1980. In Danish.
[Eastman, 2005] J. Eastman. Colloid Stability. In Book: Colloid Science; Principles, Methods,and Applications, Editor: T. Cosgrove, Blackwell Publishing Ltd, 2005.
[Gilbert, 1995] R. G. Gilbert. Emulsion Polymerization - A Mechanistic Approach. AcademicPress, 1995.
[Goodwin et al., 2005] J.W. Goodwin , J. Hearn , C.C. Ho, and R.H. Ottewill. Studies on thePreparation and Characterization of Monodisperse Polystyrene Latices. Colloid & PolymerScience, 68:2495�2532, 2005.
[Goodwin, 2004] J. Goodwin. Colloids and Interfaces with Surfactants and Polymers - An In-troduction. John Wiley & and Sons, 2004.
[Guo et al., 2004] C. Guo , L. Feng , J. Zhai , G. Wang , Y. Song , L. Jiang, and D. Zhu.Large-Area Fabrication of a Nanostructure-Induced Hydrophobic Surface from a HydrophillicPolymer. ChemPhysChem, 5:750�753, 2004.
[Hamley, 2006] I. W. Hamley. Introduction to Soft Matter; Polymers, Colloids, Amphiphiles andLiquid Crystals. John Wiley & and Sons, New York, 2006.
61

BIBLIOGRAPHY
[Hanarp et al., 2003] P. Hanarp , D. S. Sutherland , J. Gold, and B. Kasemo. Control of Nanopar-ticle Film Structure for Colloidal Lithography. Colloids and Surfaces, 214:23�36, 2003.
[Harris, 2002] D. C. Harris. Quantitative Chemical Analysis. W. H. Freeman and Company, NewYork, 6th edition, 2002.
[Hlavac and Rouer, 1997] F. Hlavac and E. Rouer. Expression of the Protein-Tyrosine Kinasep56lck by the ptrx Vector Yields a Highly Soluble Protein Recovered by Mild Sonication.Protein Expression and Puri�cation, 11:227�232, 1997.
[Israelachvili, 1995] J. Israelachvili. Intermolecular & Surface Forces. Academic Press, 2nd edi-tion, 1995.
[Jiang et al., 2004] L. Jiang , Y. Zhao, and J. Zhai. A Lotus-Leaf-like Superhydrophobic Sur-face: A Porous Microsphere/Nano�ber Composite Film Prepared by Electrohydrodynamics.Angewandte Chemie Int. Ed., 43:4338�4341, 2004.
[Kralchevsky and Nagayama, 2000] P. A. Kralchevsky and K. Nagayama. Capillary Interactionsbetween Particles Bound to Interfaces, Liquid Films and Biomembranes. Advances in Colloidand Interface Science, 85:145�192, 2000.
[Li et al., 2001] H. Li , X. Wang , Y. Song , Y. Liu , Q. Li , L. Jiang, and D. Zhu. Super-"Amphiphobic" Aligned Carbon Nanotube Films. Angewandte Chemie Int. Ed., 40:1743�1746,2001.
[Li et al., 2007] X.M. Li , D. Reinhoudt, and M. Crego-Calama. What Do We Need for aSuper-Hydrophobic Surface? A Rewiew on the Recent Progress in the Preparation of Super-Hydrophobic Surfaces. Chemical Society Rewiews, 36:1350�1368, 2007.
[Ma and Hill, 2006] M. Ma and R. M. Hill. Superhydrophobic Surfaces. Current Opinion inColloid & Interface Science, 11:193�202, 2006.
[Martines et al., 2005] E. Martines , K. Seunarine , H. Morgan , N. Gadegaard , C. D. W. Wilkin-son, and M. O. Riehle. Superhydrophobicity and Superhydrophilicity of Regular Nanopatterns.Nano Letters, 5:2097�2103, 2005.
[Masliyah and Bhattacharjee, 2006] J. H. Masliyah and S. Bhattacharjee. Electrokinetic andColloid Transport Phenomena. John Wiley & and Sons, New Jersey, 2006.
[Mate, 2008] C. M. Mate. Tribology on the Small Scale; A Bottom Up Approach to Friction,Lubrication, and Wear. Oxford University Press, New York, 2008.
[Min and Webb, 2001] J. Min and R. L. Webb. Condensate Formation and Drainage on TypicalFin Materials. Experimental Thermal and Fluid Science, 25:101�111, 2001.
[Mori, 2007] Y. Mori. E�ect of Surface Hydrophobicity on Interaction between Particle and FlatPlate at Final Stage of Wet Coating Process. Colloids and Surfaces A, 311:61�66, 2007.
[Nagayama, 1996] K. Nagayama. Two-Dimensional Self-Assembly of Colloids in Thin LiquidFilms. Colloids and Surfaces, 109:363�374, 1996.
62

BIBLIOGRAPHY
[Pashley and Karaman, 2004] R. M. Pashley and M. E. Karaman. Applied Colloid and SurfaceChemistry. John Wiley & and Sons, United Kingdom, 2004.
[Pozzato et al., 2006] A. Pozzato , S.D. Zilio , G. Fois , D. Vendramin , G. Mistura , M. Belotti ,Y. Chen, and M. Natali. Superhydrophobic Surfaces Fabricated by Nanoimprint Lithography.Microelectronic Engineering, 83:884�888, 2006.
[Qian and Shen, 2005] B. Qian and Z. Shen. Fabrication of Superhydrophobic Surfaces byDislocation-Selective Chemical Etching on Aluminum, Copper, and Zinc Substrates. Lang-muir, 21:9007�9009, 2005.
[Quere, 2005] D. Quere. Non-Sticking Drops. Reports on Progress in Physics, 68:2495�2532,2005.
[Soanes and Stevenson, 2005] C. Soanes and A. Stevenson. The Oxford Dictionary of English.Oxford University Press, revised edition, 2005.
[Suresh and Walz, 1996] L. Suresh and J. Y. Walz. E�ect of Surface Roughness on the InteractionEnergy between a Colloidal Sphere and a Flat Plate. Journal of Colloid and Interface Science,183:199�213, 1996.
[Trau et al., 1996] M. Trau , D. A. Saville, and I. A. Aksay. Field-Induced Layering of ColloidalCrystals. Science, 272:706�709, 1996.
[Wang et al., 1999] D.-Y. Wang , K.-W. Weng , C.-L. Chang, and W.-Y. Ho. Synthesis of Cr3C2
Coatings for Tribological Applications. Surface and Coatings Technology, 120-121:622�628,1999.
[Wang et al., 2008] X. Wang , J. A. Kluge , G. G. Leisk, and D. L. Kaplan. Sonication-InducedGelation of Silk Fibroin for Cell Encapsulation. Biomaterials, 29:1054�1064, 2008.
[Yang et al., 2006] C. Yang , U. Tartaglino, and B.N.J. Persson. In�uence of Surface Roughnesson Superhydrophobicity. Physical Rewiew Letters, 97:116103, 2006.
63

BIBLIOGRAPHY
64

Appendix ASurface Wettability
A direct expression of the wettability of a surface is given by Young's equation, which expressesthe wettability by means of a CA of a water droplet on a �at surface (Equation A.1)[Li et al.,2007].
cosθ =γSV − γSL
γLV(A.1)
γSV , γSL, and γLV refer to the interfacial surface tensions between solid(S), liquid(L), andvapour(V). Young's angle (θ) results from the thermodynamic equilibrium of the free energyat the solid-liquid-vapor interface. Young's angle determines whether the surface properties arehydrophobic (θ > 90◦) or hydrophilic (θ < 90◦). Low surface tension materials contributes tohigh CAs [Ma and Hill, 2006]. Two types of CA are used; static and dynamic CAs. The staticCA is corresponding to Young's angle when having a �at surface. When measuring the staticCA, a drop is placed on a surface and the value is obtained by a goniometer. The dynamic CAsare non-equilibrium CAs, which are measured during growth (advancing CA, θa) and shrinkage(receding CA, θr) of a water droplet. The di�erence between θa and θr is de�ned as the CAhysteresis (∆θ). SH surfaces possess, as mentioned earlier, a water CA higher than 150◦. Thisvery high CA is normally called apparent CA because the value does not represent the "real"CA value corresponding to �at surfaces [Li et al., 2007].
When having a rough surface, a water droplet can either penetrate the pillars or suspend abovethe pillars, as illustrated in Figure A.1.
65

Appendix A. Surface Wettability
Figure A.1: Illustration of the Wenzel model (left) and the Cassie-Baxter model (right)
In both cases much higher CAs are obtained, than when having a water droplet on a �at surface.The penetration of the water droplet is described by the Wenzel (W) model. When having athermodynamic equilibrium, a linear relationship between the apparent CA and the roughnessfactor appear, given by Equation (A.2)[Li et al., 2007].
cosθW = rcosθ (A.2)
θW corresponds to the apparent CA (when having the W state), and θ represent the Young'sangle. r represents the roughness factor and is de�ned by the actual surface area divided bythe projected surface area. A rough surface thereby gives r > 1. Wenzel's prediction for ahydrophobic surface gives θW > θ > 90◦ and a hydrophilic surface gives θW < θ < 90◦. Theroughness of the surface enhances both hydrophobicity and hydrophilicity depending on thenature of the corresponding �at surface. For a hydrophobic surface the CA and its hysteresisincreases as the roughness increases. A steadily increase of the CA with roughness is seen untilr > 1.7. Then the CA hysteresis decreases contrary to the Wenzel's prediction. This decrease inCA hysteresis is attributed to the switch from W state to the Cassie-Baxter (CB) state, whichis caused by the increasing roughness contributing to increased air fraction. This leads to asuspension of the water droplet on top of the pillars (a composite state) which is described bythe CB model. The switch from the W to the CB state entails that the apparent CA is nowdescribed as the sum of all the contributions of the di�erent phases, given by Equation (A.3) [Liet al., 2007].
cosθC = f1cosθ1 + f2cosθ2 (A.3)
θC is the apparent CA (when having the CB state), f 1 is the surface fraction of phase 1, whichis the area in contact with liquid divided by the projected area, and f 2, surface fraction of phase2, is the area in contact with air divided by the projected area. θ1 and θ2 is the CA of phase 1and 2, respectively. When having only one type of pillars, and given that f is the solid fraction,then the air fraction can be described by (1 - f ). With θ2 = 180◦, the CA can be calculated fromEquation (A.4) [Li et al., 2007].
cosθC = f(1 + cosθ)− 1 (A.4)
The apparent CA is, when using the CB model, a sole function of the solid fraction for a given θ.To obtain a SH surface, the contribution of the solid fraction must be as small as possible or/andthe used material must posses as low a surface energy as possible. Both theories, Wenzel andCB, do only give a qualitatively information of the CA on a rough surface. Hence, the decisionof which theory to use is di�cult [Li et al., 2007].
66

Appendix BModeling of the Particle System
This model is made to decide the particle size and the coating height that are optimal whenmodifying the metal surfaces. Furthermore, the model gives an estimation of the CA that canbe obtained from the used method. This is of cause dependent on the water CA's of the metalsurfaces. Cr, Al, and Cu with water CA's of 82 ±5◦[Wang et al., 1999], 81◦, and 97◦ [Min andWebb, 2001], respectively, are the metal surfaces available.It is desired to obtain particles self-assembled in a CP hexagonal pattern. This pattern can bedescribed by the repeating unit given i Figure B.1). By the red triangle (the repeating unit) thesolid fraction after coating, which is represented by the gray "triangle" between the particles,can be calculated as follows.
Figure B.1: An illustration of the repeating unit marked with a red triangle, which is expected in a CP hexagonalpattern. The grey area corresponds to the pillar that will be left after coating and removal of theparticles.
The particles used to form the template are expected to be monodisperse. It is seen from therepeating unit, that 1/6 of each of the three particle cross-sectional areas (Aparticle) contributesto the repeating unit. This corresponds to the cross-sectional area of half a particle, that is givenby Equation (B.1).
Aparticle =12πr2
particle (B.1)
The area of the repeating unit Arepeating (sketched in Figure B.1) is calculated from the cosinerelation, as seen from Equation (B.2)-(B.3).
67

Appendix B. Modeling of the Particle System
A =12· height · width (B.2)
A =12· Ccos(30) · C (B.3)
Where C is the center-to-center distance. In this case C equals two times the radius of a particle,and therefore Arepeating is given by Equation (B.4).
Arepeating = 2 · r2particlecos(30) (B.4)
Apillar is then given by Equation (B.5).
Apillar = Arepeating −Aparticle (B.5)
that becomes:Apillar = 2 · r2
particlecos(30)− 12πr2
particle (B.6)
The solid fraction is given by the area of the pillar divided by the total area (the area of therepeating unit)(Equation B.7).
f =Apillar
Arepeating(B.7)
When looking at the solid fraction as a function of particle size only it is given by Equation(B.8).
fparticle size =2r2
particlecos(30)− 12πr2
particle
2r2particlecos(30)
(B.8)
When reducing Equation (B.8) it gives :
fparticle size =2cos(30)− 1
2π
2cos(30)=
cos(30)− 14π
cos(30)≈ 0.093 (B.9)
From Equation (B.8) it is found, that the particle size has no in�uence on the solid fraction, butgives a constant solid fraction of 0.093.
Figure B.2: An illustration of how the coating height in�uences the particle cross-sectional area, and herebythe area left after coating and removal of the particles.
68

From Figure B.2 it can be seen that the coating height will have an in�uence on the solid fraction.Furthermore, this was also observed in the work by Abdelsalam and coworker (2005) (cf. Chapter2). This is caused by a varying in cross-sectional area of the particle as a function of coatingheight (still, half a particle area contributes to the repeating unit). The cross-sectional area asa function of coating height (n) is give by Equation (B.10).
Across =12π(r2
particle − (n− rparticle)2) (B.10)
The solid fraction is then given by Equation (B.11):
fcoating height =Arepeating −Across
Arepeating(B.11)
which results in Equation (B.12):
fcoating height =2r2
particlecos(30)− 12π(r2
particle − (n− rparticle)2
2r2particlecos(30)
(B.12)
The solid fraction as a function of coating height is entered into the Cassie-Baxter equation, andEquation (B.13) is obtained.
cosθC =
(1− π(r2
particle − (n− rparticle))2
4r2particlecos(30)
)(1 + cos(θ))− 1 (B.13)
θC plotted as a function of coating height shows, that the optimal coating height is n = rparticle
and that according to the model a θC for Cr, Al, and Cu, of about 153.4◦,153.2◦, and 156.7◦ canbe obtained, respectively (see Figure B.3).
Figure B.3: The apparent water CA as a function of the coating height obtained using the Cassie-Baxtermodel. The data is calculated using copper as the material, rparticle = 200 nm and n varyingfrom 0 to 2rparticle .
In the range from 1-199 nm, the model in Figure B.3 do not �t the system, because the modelassumes that the variation in coating height is as seen in Figure B.4.
69

Appendix B. Modeling of the Particle System
Figure B.4: An illustration of the coating height variations assumed by the model.
This is not expected to be the case in the system in the present work. An alternative could beassuming that the curve looks like in Figure B.5, because the pillars are expected to have thesame cross-sectional area until after 200 nm.
Figure B.5: The apparent water CA as a function of the coating height obtained using the Cassie-Baxtermodel. The data is calculated using copper as the material, rparticle = 200 nm and n varyingfrom 0 to 2rparticle .
Still, the CA when having a coating height of 0 nm will not give rise to a contact angle of 156.7◦,but instead the surface will possess a CA of a planar Cu surface. From this model the highestwater CA possible, seems to be obtained when the coating height equals the radii of the particles.Coating heights in the range of 1-199 nm are not believed all to give rise to a contact angle of156.7◦, but whether some of them could, can not be concluded from this model.
70

Appendix CThe "Dipper" and the Set-up
The "Dipper" is an apparatus, specially constructed for this project, and was used when thestudying the possibility of creating colloidal templates on various substrates. The "Dipper" wasused to perform a TLFD technique and can withdraw substrates vertical, and with di�erentrates.
Materials
� Motor : 23 frame size hybrid stepper motor, 200 steps/rev.
� Control PCB: 4 phase unipolar step motor drive board.
� 2×33 ohm, 25W power resistors and an aluminum cooling plate (with ribs) mounted witha 24 V fan as cooling system for the power resistors.
� Gearbox: 25:1.
� Power supply: Siemens SITOP, DIN-rail, PSU, 24V, 5A.
Furthermore, a slide holder was made. The apparatus can be seen in Figure C.1 in the set-upfor the investigations of applying an electric potential.
71

Appendix C. The "Dipper" and the Set-up
Figure C.1: The set-up for the investigations of applying an electric potential to the TLFD technique.
72

Enclosure ICalibration of the Potentiostat
Calibration of the program and the potentiostat. The voltage and the current were calibratedby applying a voltage and measure the output voltage with a multimeter, the result is seen inFigure I.1(a), and applying a voltage and then read o� the current at the display in the program(Enclosure CD - "Program") and at the display at the multimeter, result seen in Figure I.1 (b).
y = 1,0687x - 0,5357
R2 = 1
0
200
400
600
800
1000
1200
1400
0 200 400 600 800 1000bit
Vo
ltag
e [
mV
]
(a)
y = -0,2427x + 484,85
R2 = 0,9879
0
10
20
30
40
50
60
70
80
90
100
1600 1700 1800 1900 2000
bit
Cu
rren
t [µ
A]
C1 C2 C3
(b)
Figure I.1: Calibration of (a) : the voltage and (b): the current. The C1-C3 are three di�erent calibrationseries, where C1 and C2 were measured at the same time. The duplicate was made just after the�rst measurement. Calibration 3 was a data-set made separate from the other calibrations. Theroom temperature was 22◦C while calibrating the current.
In Figure I.1 (b), calibration curve 3 (C3) was observed to di�er from the other calibrationscurves. This di�erence was observed to be due to heating up of the resistance and the capacitorduring the three calibrations. Therefore, only C1 and C2 are concluded to be valid, becausein�uence of the heat-up of the equipment is not as marked at these samples.
73