faculty leadership conference revenue forecast report and budget update
DESCRIPTION
Faculty Leadership Conference Revenue Forecast Report and Budget Update. Bernard M. Hannon Senior Assoc Commissioner & CFOApril 23 , 2010. INDIANA’S HIGHER EDUCATION SYSTEM AND STATE FUNDING. Total FY 10 estimated expenditures by all Indiana public postsecondary institutions - PowerPoint PPT PresentationTRANSCRIPT

Faculty Leadership ConferenceRevenue Forecast Report and Budget
Update
Bernard M. HannonSenior Assoc Commissioner & CFO April 23, 2010

INDIANA’S HIGHER EDUCATION SYSTEM AND STATE FUNDING
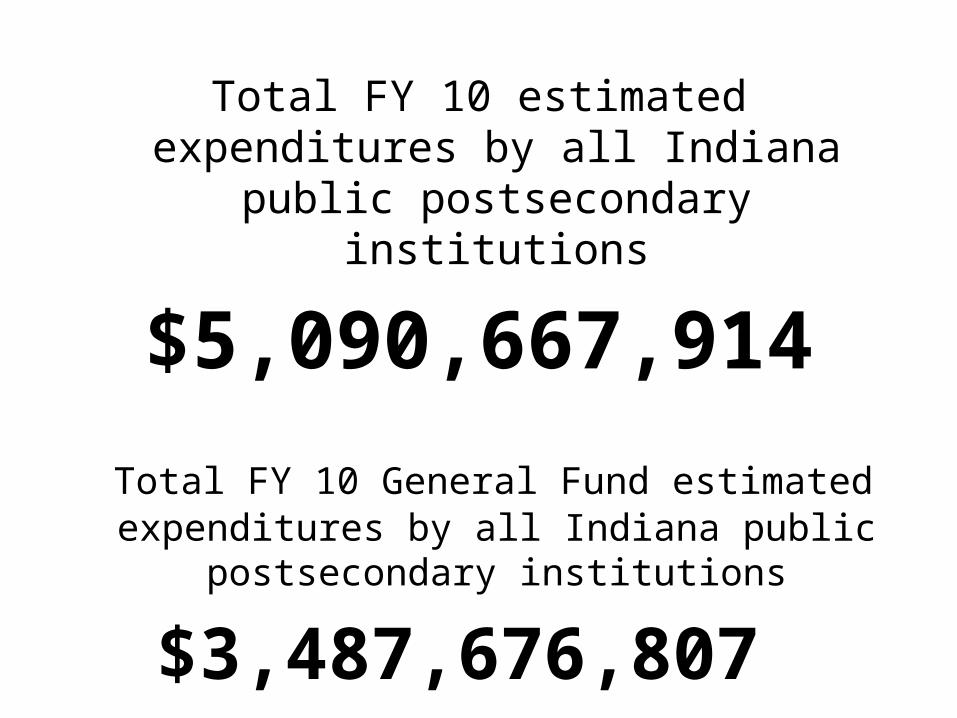
Total FY 10 estimated expenditures by all Indiana public postsecondary institutions
$5,090,667,914
Total FY 10 General Fund estimated expenditures by all Indiana public postsecondary institutions
$3,487,676,807

Indiana’s Public Higher Education System
4
• 5 four-year Public Postsecondary Institutions
• 2 two-year Public Institutions• 31 Public Campuses and 12 Instructional
Sites• 407,000 Students in 2008-09• 1,500 buildings worth $12B• $2.3B in salary and compensation

State Operating Appropriations as % of Institutional Expenditures
Indiana Univ.
Purdue Univ.
statewide avg.
Ball St. Univ.
Univ. Southern Indiana
Indiana St. Univ.
ITCCI Vincennes Univ.
0.0%
10.0%
20.0%
30.0%
40.0%
50.0%
60.0%
70.0%
% of total exp from state operating appropriations
% of Operating exp from state operating appropriations
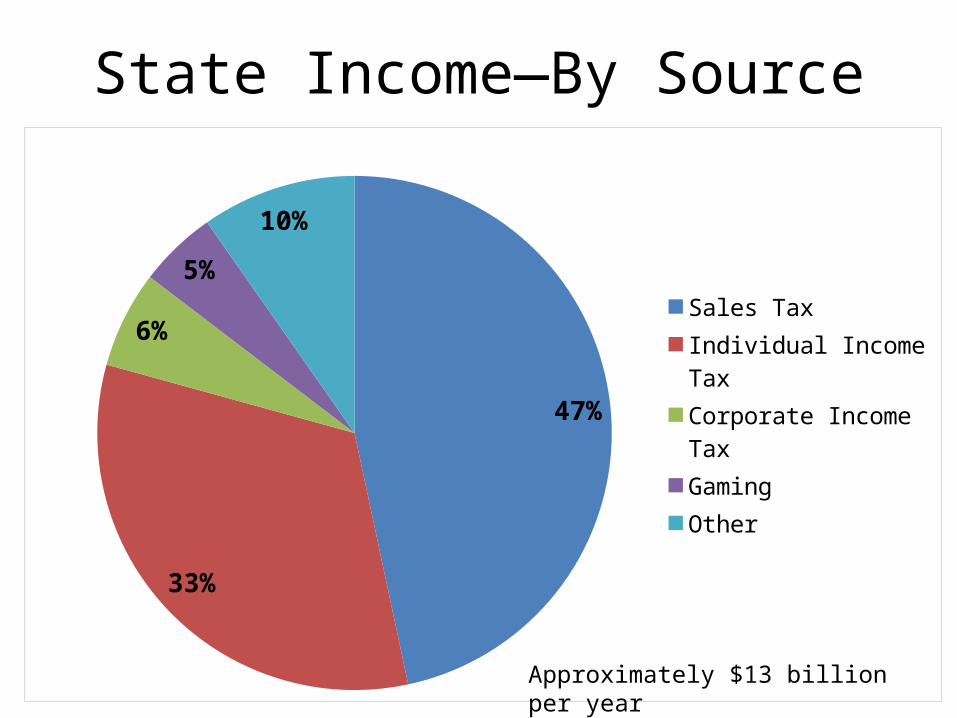
State Income—By Source
47%
33%
6%
5%
10%
Sales TaxIndividual Income TaxCorporate Income TaxGamingOther
Approximately $13 billion per year
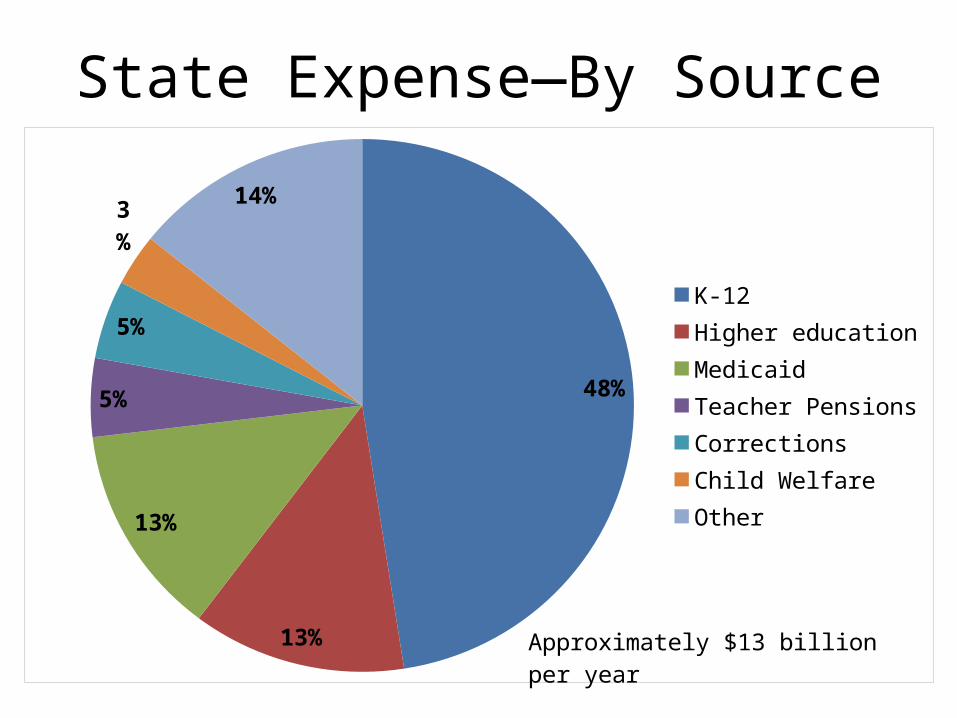
State Expense—By Source
48%
13%
13%
5%
5%
3%
14%
K-12 Higher educationMedicaidTeacher PensionsCorrectionsChild WelfareOther
Approximately $13 billion per year

Percentage of state General Fund appropriated to IHEs
5.0%
10.0%
15.0%
20.0%
25.0%
19
75
-76
19
76
-77
19
77
-78
19
78
-79
19
79
-80
19
80
-81
19
81
-82
19
82
-83
19
83
-84
19
84
-85
19
85
-86
19
86
-87
19
87
-88
19
88
-89
19
89
-90
19
90
-91
19
91
-92
19
92
-93
19
93
-94
19
94
-95
19
95
-96
19
96
-97
19
97
-98
19
98
-99
19
99
-00
20
00
-01
20
01
-02
20
02
-03
20
03
-04
20
04
-05
20
05
-06
20
06
-07
20
08
-09
20
09
-10

State Appropriations to Public IHEs
1975-76
1976-77
1977-78
1978-79
1979-80
1980-81
1981-82
1982-83
1983-84
1984-85
1985-86
1986-87
1987-88
1988-89
1989-90
1990-91
1991-92
1992-93
1993-94
1994-95
1995-96
1996-97
1997-98
1998-99
1999-00
2000-01
2001-02
2002-03
2003-04
2004-05
2005-06
2006-07
2007-08
2008-09
2009-10
2010-11 $-
$200,000,000
$400,000,000
$600,000,000
$800,000,000
$1,000,000,000
$1,200,000,000
$1,400,000,000
state appropriations 1976 - 2011
Compound Annual Growth Rate: 4.7%
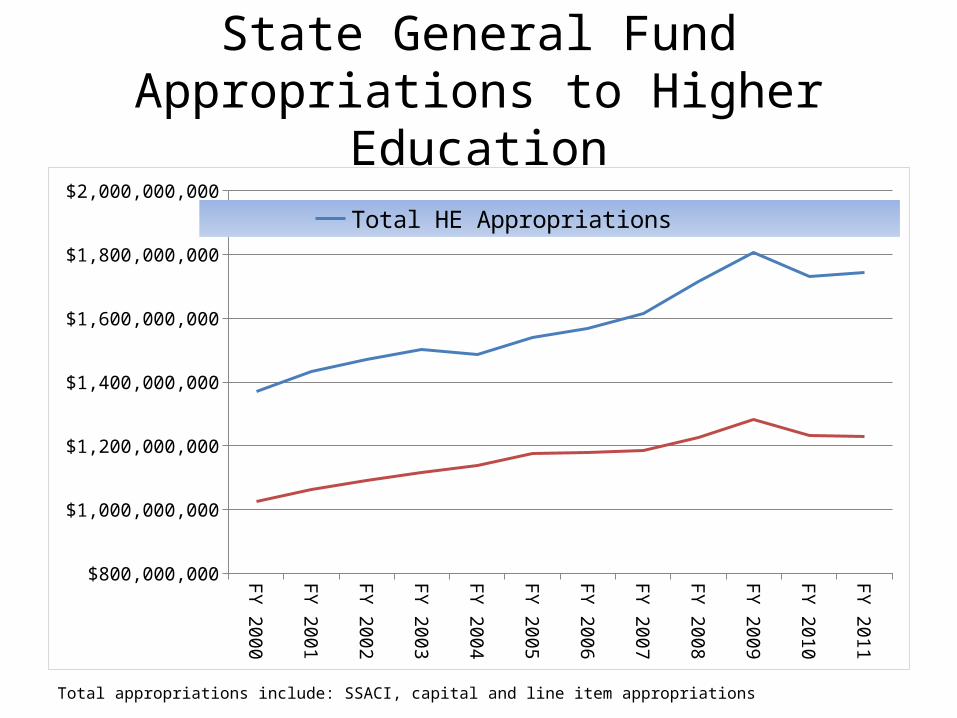
State General Fund Appropriations to Higher Education
FY 2000
FY 2001
FY 2002
FY 2003
FY 2004
FY 2005
FY 2006
FY 2007
FY 2008
FY 2009
FY 2010
FY 2011
$800,000,000
$1,000,000,000
$1,200,000,000
$1,400,000,000
$1,600,000,000
$1,800,000,000
$2,000,000,000
Total HE Appropriations Campus Operating Appropriations
Total appropriations include: SSACI, capital and line item appropriations

HIGHER EDUCATION STATE FUNDING NATIONAL CONTEXT

FY 2009 State Appropriations per FTE
Wyom
ingAlaskaHaw
aiiIdahoN
orth CarolinaO
klahoma
Nevada
Georgia
New
Mexico
ConnecticutN
ew York
TexasAlabam
aM
arylandLouisianaKentuckyArkansasTennesseeIllinoisN
ew Jersey
Mississippi
ArizonaN
ebraskaU
SCaliforniaM
aineFloridaW
isconsinW
ashingtonW
est VirginiaU
tahM
innesotaM
issouriIow
aVirginiaSouth CarolinaDelaw
areKansasM
assachusetts
PennsylvaniaN
orth DakotaM
ichiganO
regonO
hioRhode IslandIndianaM
ontanaColoradoSouth DakotaN
ew Ham
pshireVerm
ont
$-
$2,000
$4,000
$6,000
$8,000
$10,000
$12,000
$14,000
$16,000
Indiana$4,752
U.S. Avg.$6,934

FY 2009 Net Tuition Revenue per FTE
Vermont
Delaware
Rhode IslandPennsylvaniaM
ichiganN
ew Ham
pshireM
aineN
ew Jersey
Maryland
West Virginia
North Dakota
South CarolinaVirginiaConnecticutIow
aAlabam
aIndianaSouth DakotaO
hioKentuckyColoradoM
innesotaArizonaO
klahoma
ArkansasM
ontanaM
assachusetts
Oregon
AlaskaM
issouriU
SKansasM
ississippiTennesseeTexasW
isconsinN
ebraskaN
ew York
IllinoisU
tahHaw
aiiIdahoLouisianaN
evadaN
orth CarolinaFloridaW
ashingtonG
eorgiaW
yoming
New
Mexico
California
$-
$2,000
$4,000
$6,000
$8,000
$10,000
$12,000
$14,000
U.S. Avg.$4,095
Indiana$5,379

FY 2009 Total Educ. Revenue per FTE
Wyom
ingAlaskaDelaw
areN
ew Jersey
Maryland
Vermont
Maine
ConnecticutPennsylvaniaRhode IslandO
klahoma
Alabama
KentuckyM
ichiganHaw
aiiTexasArkansasW
est VirginiaIdahoN
orth DakotaN
ew York
ArizonaTennesseeIow
aM
ississippiVirginiaIllinoisN
evadaM
innesotaN
orth CarolinaU
SN
ebraskaG
eorgiaSouth CarolinaN
ew Ham
pshireLouisianaW
isconsinM
issouriN
ew M
exicoO
hioM
assachusetts
IndianaKansasO
regonU
tahColoradoM
ontanaFloridaW
ashingtonSouth DakotaCalifornia
$-
$2,000
$4,000
$6,000
$8,000
$10,000
$12,000
$14,000
$16,000
$18,000
$20,000
U.S. Avg.$10,991
Indiana$10,102

2009 Tax Revenue per Capita
AlaskaN
ew York
Wyom
ingConnecticutN
ew Jersey
Hawaii
Massachusett
sM
arylandCaliforniaVerm
ontM
innesotaRhode IslandIllinoisM
aineW
ashingtonDelaw
areU
.S.PennsylvaniaVirginiaW
isconsinN
evadaKansasN
orth DakotaN
ebraskaLouisianaO
hioFloridaColoradoN
ew M
exicoM
ichiganArizonaIow
aN
ew Ham
pshireN
orth CarolinaG
eorgiaTexasM
ontanaO
regonW
est VirginiaU
tahIndianaO
klahoma
Missouri
ArkansasKentuckyIdahoSouth CarolinaSouth DakotaM
ississippiTennesseeAlabam
a
$-
$1,000
$2,000
$3,000
$4,000
$5,000
$6,000
$7,000
$8,000
U.S. Avg.$4,242 Indiana
$3,332

2009 Total Taxable Resources per Capita*
Delaware
ConnecticutW
yoming
AlaskaN
ew Jersey
New
YorkM
assachusetts
Maryland
Nevada
VirginiaCaliforniaW
ashingtonN
ew Ham
pshireColoradoIllinoisM
innesotaRhode IslandHaw
aiiU
.S.South DakotaTexasFloridaN
ebraskaLouisianaN
orth DakotaPennsylvaniaKansasO
regonIow
aVerm
ontW
isconsinN
orth CarolinaG
eorgiaO
hioIndianaM
issouriArizonaTennesseeO
klahoma
Utah
New
Mexico
Montana
Maine
Michigan
IdahoAlabam
aKentuckySouth CarolinaArkansasW
est VirginiaM
ississippi
$-
$10,000
$20,000
$30,000
$40,000
$50,000
$60,000
$70,000
$80,000
$90,000
U.S. Avg.$52,754 Indiana
$45,213
*Total Taxable Resources per capita from U.S. Treasury Department: www.treas.gov/offices/economic-policy/resources/estimates.html

Indiana per Capita Income as Percentage of U.S. Average
19691970
19711972
19731974
19751976
19771978
19791980
19811982
19831984
19851986
19871988
19891990
19911992
19931994
19951996
19971998
19992000
20012002
20032004
20052006
200784.0%
86.0%
88.0%
90.0%
92.0%
94.0%
96.0%
98.0%
100.0%

Higher Education Appropriations per $1,000 of Personal Income
New
Mexico
Alabama
Mississippi
North Carolina
Wyom
ingHaw
aiiLouisianaAlaskaN
orth DakotaW
est VirginiaArkansasKentuckyN
ebraskaU
tahG
eorgiaSouth CarolinaO
klahoma
IdahoIow
aKansasCaliforniaTennesseeM
innesotaTexasDelaw
areIndianaU
nited StatesSouth DakotaW
ashingtonArizonaFloridaW
isconsinM
arylandM
aineM
ichiganM
ontanaN
evadaO
hioIllinoisVirginiaO
regonConnecticutN
ew York
Missouri
New
JerseyPennsylvaniaRhode IslandM
assachusetts
Vermont
ColoradoN
ew Ham
pshire
$0.00
$2.00
$4.00
$6.00
$8.00
$10.00
$12.00
$14.00
$16.00
$18.00
$20.00
U.S. Avg.$6.80
Indiana$6.95

State Revenue Performance

State General Fund Revenue Growth
1998 1999 2000 2001 2002 2003 2004 2005 2006 2007 2008 2009 2010 2011-10.0%
-5.0%
0.0%
5.0%
10.0%
15.0%
6.9%5.4%
2.9%
-0.8%
-3.6%
13.1%
7.4% 7.5%5.7%
4.5%2.4%
-7.4%-6.4%
6.3%
Note: FY 10 and FY 11 per December 2009 Revenue Forecast
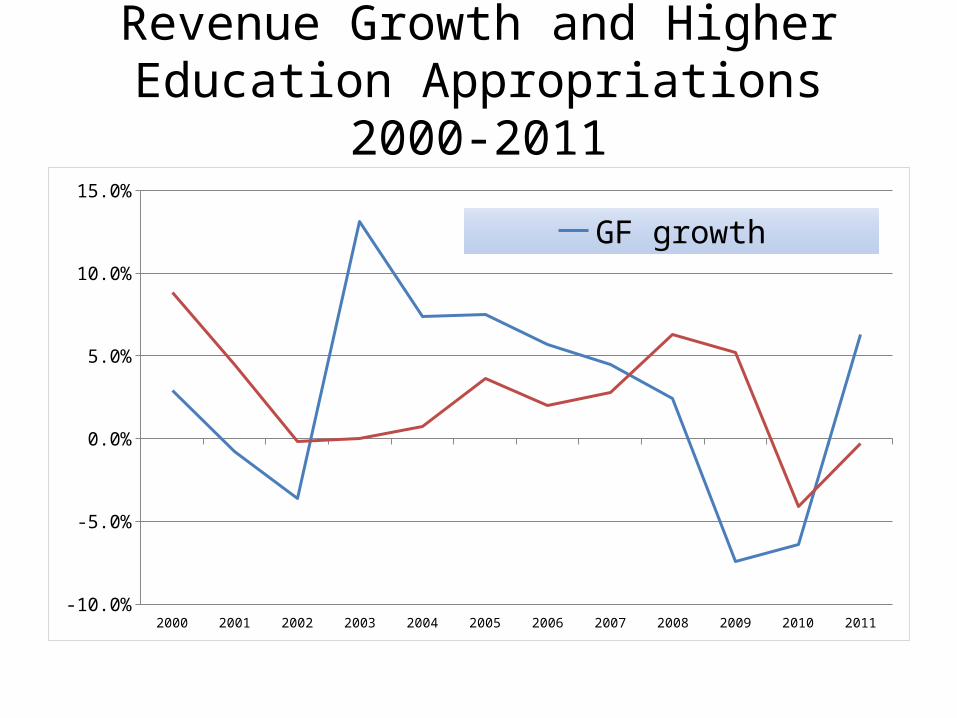
Revenue Growth and Higher Education Appropriations 2000-2011
2000 2001 2002 2003 2004 2005 2006 2007 2008 2009 2010 2011-10.0%
-5.0%
0.0%
5.0%
10.0%
15.0%
GF growth HE approps

State Expenditure Growth
F1996 F1997 F1998 F1999 F2000 F2001 F2002 F2003 F2004 F2005 F2006 F2007 F2008 F2009-----
1%
2%
3%
4%
5%
6%
7%
8%
9%
10%
6.5%
9.7%
4.9%
8.0%
7.1%
5.1%
0.8%
4.1%
7.6%
2.7%1.9%
2.8%
3.9%
0.5%
2.3% CAGR 2006-20095.6% CAGR 1996-2005

Real Per Capita Expenditures*
FY 2004 FY 2005 FY 2006 FY 2007 FY 2008 FY 2009$2,100
$2,150
$2,200
$2,250
$2,300
$2,350
$2,400
CAGR = -1.3%
* Includes Major Moves Investments

Revenue Collections FY 2006 – FY 2011
FY06 FY07 FY08 FY09 FY10 FY11$11,000
$11,500
$12,000
$12,500
$13,000
$13,500
$14,000
$14,500
$13,135
$13,701
$14,005
$12,906
$12,076*
$12,836*
*projected

25
Ju
ly
Au
gu
st
Se
pte
mb
er
Oc
tob
er
No
ve
mb
er
De
ce
mb
er
Ja
nu
ary
Fe
bru
ary
Ma
rch
Ap
ril
Ma
y
Ju
ne
-25%
-20%
-15%
-10%
-5%
0%
5%
10%
15%
Percent Change (FY2010 vs. FY2009)
Targets from May Forecast
Targets from Decem-ber Forecast
Year-to-date = -10.5%Last year = -7.4%
Comparison of Forecasted to Actual Revenue

The Good News is: We Entered the Recession in a Strong
Financial Position

Budget Surplus/Deficit
1998 1999 2000 2001 2002 2003 2004 2005 2006 2007 2008 2009
(1,500.0)
(1,000.0)
(500.0)
-----
500.0
1,000.0

State Reserves (Cash – Liabilities)
2001 2002 2003 2004 2005 2006 2007 2008 2009
-400
-200
0
200
400
600
800
1000
1200
1400
1600
-179.199999999991
1329

The Bad News is: The Challenges are Unprecedented
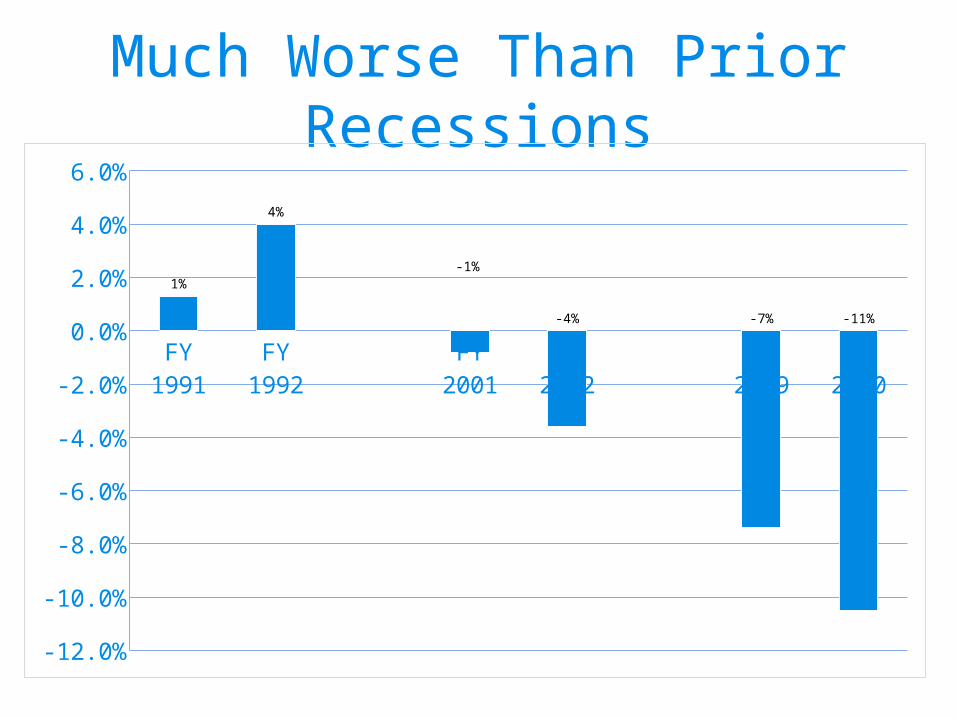
Much Worse Than Prior Recessions
FY 1991 FY 1992 FY 2001 FY 2002 FY 2009 FY 2010
-12.0%
-10.0%
-8.0%
-6.0%
-4.0%
-2.0%
0.0%
2.0%
4.0%
6.0%
1%
4%
-1%
-4% -7% -11%

Sales Tax: CY 2009 vs. CY 2008
TOTAL General Utilities Gas Vehicles Hospitality Home Impr Apparel Appliance/Electronics
-30%
-25%
-20%
-15%
-10%
-5%
0%
-9%
-4% -4%
-25%
-9% -9% -10%
-4%
-11%

Budgeted Revenue: FY 2010-11
23,000
24,000
25,000
26,000
27,000
28,000
29,000
28,143
27,452
26,748
24,913
Dec-08 Apr-09 May-09 Dec-09
Current Spend
Forecast reduced over $3 billion in one year. Missed forecast 17 straight months

6/30/09 3/1/10 6/30/10 6/30/11
($1,500)
($1,000)
($500)
$0
$500
$1,000
$1,500
$1,329
$379 $211
($909)
Total State Reservesin millions
Without Budget Management, State Reserves would be Depleted by End of Biennium
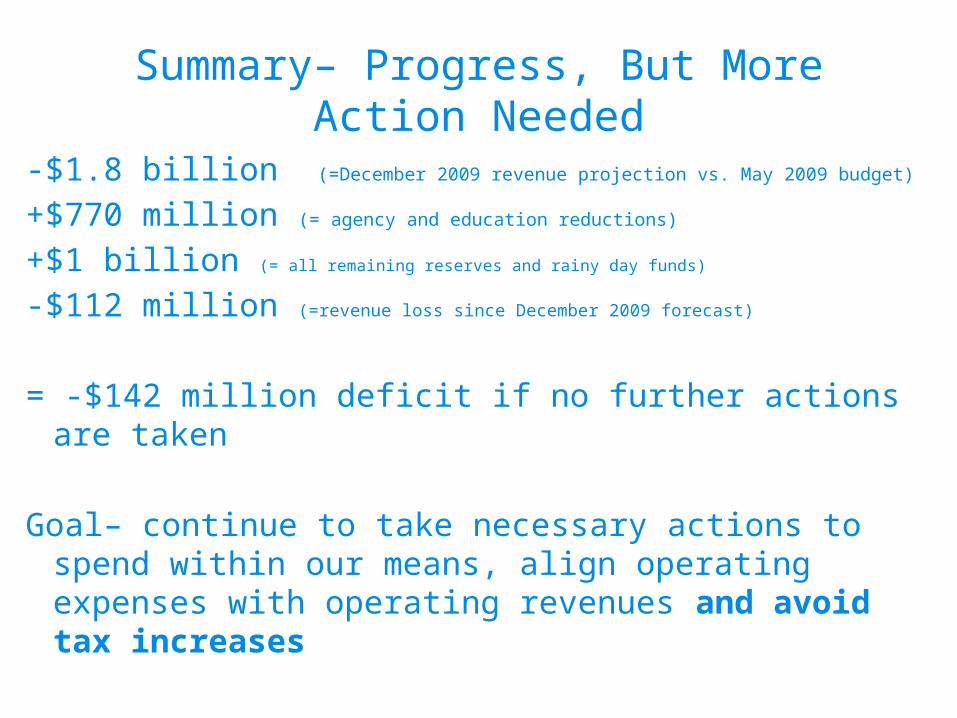
Summary– Progress, But More Action Needed
-$1.8 billion (=December 2009 revenue projection vs. May 2009 budget)
+$770 million (= agency and education reductions)
+$1 billion (= all remaining reserves and rainy day funds)
-$112 million (=revenue loss since December 2009 forecast)
= -$142 million deficit if no further actions are taken
Goal– continue to take necessary actions to spend within our means, align operating expenses with operating revenues and avoid tax increases
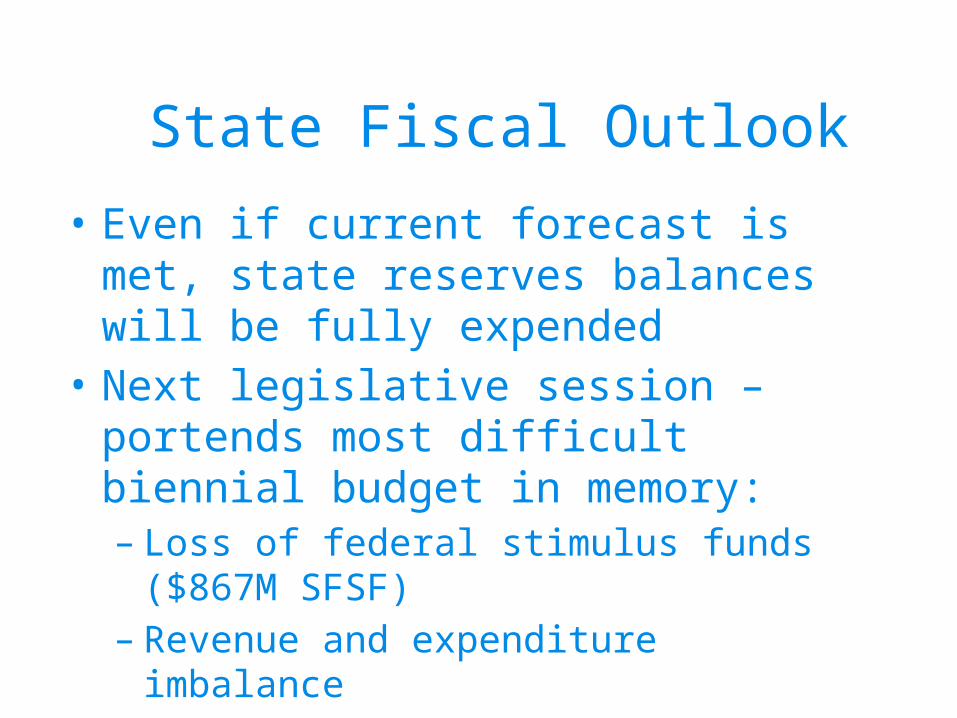
State Fiscal Outlook
• Even if current forecast is met, state reserves balances will be fully expended
• Next legislative session – portends most difficult biennial budget in memory:– Loss of federal stimulus funds ($867M SFSF)– Revenue and expenditure imbalance– No state reserves to draw down

Distributing Scarce Resources

37
Commission Budget Responsibilities and Priorities
• Debt Service• College Completion Incentives:
– Number of Degrees– On-Time Degrees– Low Income Degrees
• Enrollment/Student Course Success Incentive• Research Funding Incentive• R&R• Economic Development • Two-Year Transfer Incentive• Student access and success (SSACI)

Evolution of CHE Funding Recommendations
2001 2003 2005 2007 2009
Enrollment Change (credit hours enrolled)
Enrollment Change (credit hours enrolled)
Enrollment Change (credit hours enrolled)
Enrollment Change (credit hours enrolled)
Enrollment Change (successfully completed credit hours)
Inflation Adjustments Inflation Adjustments Inflation Adjustments Inflation Adjustments
Equity Adjustment Equity Adjustment Equity Adjustment Equity Adjustment
Plant Expansion/leases Plant Expansion/leases
Program Adjustment
Research Support Incentive
Research Support Incentive
Research Support Incentive
Research Support Incentive
Change in number of degrees
Change in number of degrees
Change in On-Time graduation Rate
Change in On-Time graduation Rate
Two Year Transfer Incentive
Two Year Transfer Incentive
Low Income Degree Completion Incentive
Workforce Development Incentive (funding non-credit coursework)