facultad de matematica, astronomia y física - unc seminario...
TRANSCRIPT
Maestria en Aplicaciones Espaciales de Alerta y Respuesta Temprana a EmergenciasInstituto de Altos Estudios Espaciales “Mario Gulich” - CONAE / UNC
Facultad de Matematica, Astronomia y Física - UNC
MEW 9 Seminario
Dra. Veronica Andreo
October, 2013
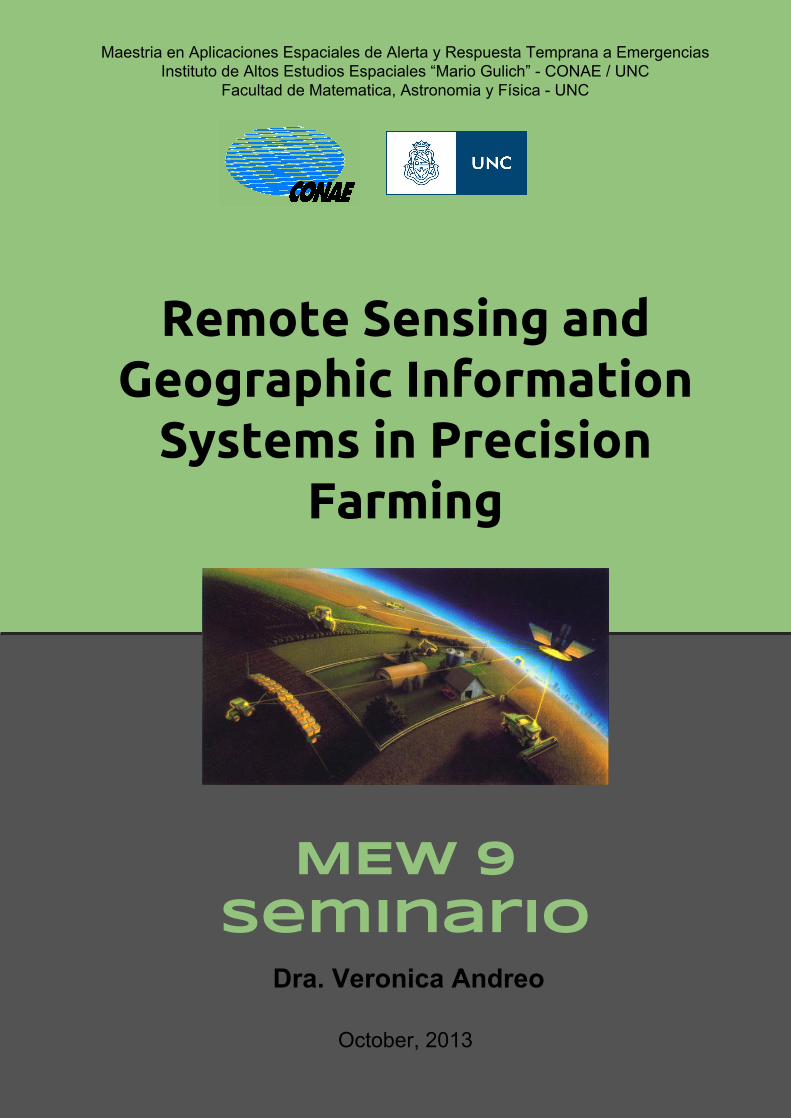
Remote Sensing and Geographic Information
Systems in Precision Farming

INDEX
ABSTRACT...............................................................................................................................................1
1. INTRODUCTION.........................................................................................................................1
1.1. What is precision farming?.............................................................................................. 2
1.2. Objectives of precision farming....................................................................................... 3
1.3. A history hitched to technology........................................................................................ 4
1.4. Stages and Implementation of Precision Farming........................................................... 8
2. Remote Sensing and Precision Farming...................................................................................... 11
2.1. Satellite remote sensing................................................................................................. 13
2.2. Proximal remote sensing of crops for precision farming............................................... 16
2.3. Hyper-spectral remote sensing in precision farming..................................................... 18
2.4. Knowledge gaps for remote sensing in precision farming............................................. 20
2.5. The future in PF: UAS (unmanned aircraft system)...................................................... 21
3. Geographic Information Systems in Precision Farming............................................................. 22
3.1. Interpolation................................................................................................................... 23
3.2. Geo-statistics.................................................................................................................. 24
3.3. Spatial Econometry........................................................................................................ 25
3.3.1. Spatial regression.................................................................................................. 26
3.3.2. Management zones................................................................................................ 26
3.4. GIS Software currently used in PF................................................................................. 27
4. Precision farming in Argentina................................................................................................... 27
5. CONCLUSION........................................................................................................................... 29
6. REFERENCES............................................................................................................................ 30

RS and GIS in Precision Farming MEW 9 – Verónica Andreo
Remote Sensing and Geographic Information Systems in
Precision Farming
ABSTRACT
Precision farming (PF) refers to the use of geographical information to determine field variability, ensure optimal
use of inputs and maximize the output from a farm (yield). Precision farming gained popularity after the realization that
diverse fields of land hold different properties. Large tracts of land usually have spatial variations of soils types, moisture
content, nutrient availability and so on. Therefore, with the use of remote sensing (RS), geographical information systems
(GIS) and global positioning systems (GPS), farmers can more precisely determine what inputs to put exactly where and in
what quantities. This information helps farmers to effectively use expensive resources such as fertilizers, pesticides and
herbicides, and more efficiently use water resources. In the end, farmers who use this method would not only maximize
their yields but also reduce their operating expenses, thus increasing their profits. This seminar addresses then, the use of
geo-spatial technologies in precision farming, focusing on how geo-spatial data is collected, analyzed and used in the
decision making process to maximize on yields.
1. INTRODUCTION
Since the agrarian revolution that hit Europe and America during the 18 th century, the use of technology
to improve the effectiveness and efficiency of farming practices has increased tremendously. During the 20 th and
21st century, for instance, discoveries in the field of science and technology have enabled farmers to effectively
use their input resources to maximize yield. These advances have been greatly assisted by the use of
sophisticated machines, changes in planting practices, use of fertilizers, herbicides and pesticides, etc. Farming
systems, in fact, are in continuous change in response to economic, technological and social trends. In this sense,
farming practices are becoming questioned not only by farmers but by the public, in general. Concerns are not
only profitability but environmental impact of the different practices. Therefore, farmers look to adopt new
technology and the trend over the past two decades has been to reduce tillage systems (direct seeding) and
increase the use of fertilizers and herbicides. However, the cost savings of reduced tillage do not outweigh the
added cost of crop chemicals, so profit margins for most crops (except for RR-soybean) have remained narrow.
Labor costs are really high and natural resources finite so, the need to adopt new and efficient technology to
maintain competitiveness in a world market is dramatic. Therefore, the success of large-scale farming nowadays
highly relies on geographic information technology through what is know as precision farming.
Maestría en Aplicaciones Espaciales de Alerta y Respuesta Temprana a Emergencias - CONAE - UNC 1

RS and GIS in Precision Farming MEW 9 – Verónica Andreo
1.1. What is Precision Farming?
Precision Farming (PF), also called Precision Agriculture (PA) or site specific crop management (SSCM)
is an integrated information- and production-based farming system that is designed to increase long term, site-
specific and whole farm production efficiency, productivity and profitability while minimizing unintended
impacts on wildlife and the environment” (Earl et al., 1996). The basic principle of PF is to maximize the
efficiency of inputs as measured by outputs, which is to optimize inputs according to field variability in order to
maximize yields diminishing production costs and environmental impacts of agricultural practices, by giving the
right amount of input at the right place and the right time. In this sense, PF can relate to any agricultural
production system and can be considered as the application of information technologies, together with
production experience, to:
1. optimize production efficiency
2. optimize quality
3. minimize environmental impact
4. minimize risk
- all, at the site-specific level (Earl et al., 1996). These are not particularly new concepts in agriculture. There
are essays on this topic dating from the early 18th century. What is new is the scale at which we are able to
implement these aims.
The development and application of PF has its roots on the spatial and temporal variation normally
observed in fields and yields under the same treatments (seed density, fertilizer, herbicide, etc.). If spatial or
temporal variability does not exist (but mainly spatial) then PF does not make sense and a uniform management
system is both the cheapest and most effective management strategy. Based on these considerations, PF is at
present operating on a zonal rather than a completely site-specific basis (Figure 1).
Precision agriculture management practices can significantly reduce the amount of nutrient and other
crop inputs used while boosting yields. Farmers thus obtain a return on their investment by saving on
phytosanitary and fertilizer costs. The second, larger-scale benefit of targeting inputs—in spatial, temporal and
quantitative terms -concerns environmental impacts. Applying the right amount of inputs in the right place and at
the right time benefits crops, soils and groundwater, and thus the entire crop cycle. Consequently, precision
agriculture has become a cornerstone of sustainable agriculture, since it respects crops, soils and farmers.
Sustainable agriculture seeks to assure a continued supply of food within the ecological, economic and social
limits required to sustain production in the long term. Precision agriculture therefore seeks to use high-tech
systems in pursuit of this goal. The adoption of precision farming is based on the following basic premises:
• significant within-field variability exists in factors that influence crop yield;
Maestría en Aplicaciones Espaciales de Alerta y Respuesta Temprana a Emergencias - CONAE - UNC 2

RS and GIS in Precision Farming MEW 9 – Verónica Andreo
• the causes of this variability can be identified and measured;
• information from these measurements can be used to effectively modify crop management practices;
• the improvement in economic yield justifies the cost.
Figure 1. The evolving timeline of precision farming
1.2. Objectives of Precision Farming
1. Optimizing Production Efficiency
In general, the main aim of PA is to optimize returns across a field. Unless a field has a uniform yield
potential (and therefore a uniform yield goal), the identification of variability in yield potential may offer
possibilities to optimize production quantity at each site or within each “zone” using differential management.
2. Optimizing Quality
Production efficiency is measured in terms of yield (quantity), mainly because yield and biomass sensors
are the most reliable and commonplace sensors. The ability to site-specifically collect grain quality data will
allow growers to consider production efficiency from the perspective of either yield, quality or their interaction.
3. Minimizing Environmental Impact
If better management decisions are made to adapt inputs in order to meet production needs then by
default there must be a decrease in the net loss of any applied input to the environment. This is not to say that
there is no actual or potential environmental damage; however the risk of environmental damage is reduced.
Maestría en Aplicaciones Espaciales de Alerta y Respuesta Temprana a Emergencias - CONAE - UNC 3

RS and GIS in Precision Farming MEW 9 – Verónica Andreo
4. Minimizing Risk
Risk management is a common practice today for most farmers and can be considered from two points
of view: income and environmental. Generally, minimizing income risk is seen as more important than
minimizing environmental risk but PF attempts to offer a solution that may allow both positions to be considered
in risk management. This improved management strategy will come about through a better understanding of the
environment-crop interaction and a more detailed use of emerging and existing information technologies (e.g.
short and long term weather predictions and agro-economic modeling).
1.3. A history hitched to technology
Though the concept of PF has been around since very early in the development of agriculture, it can be
said that the practice of PF was enabled by the development of technology that allowed to quantify and
differentially manage the natural variability of fields. Particularly, the advent of GPS and GNSS (global
navigation satellite systems) triggered the process (Goddard et al., 1995).
The farmer's and/or researcher's ability to locate their precise position in a field allows for the creation of
maps of the spatial variability of as many variables as can be measured (e.g. crop yield, terrain
features/topography, organic matter content, moisture levels, nitrogen levels, pH, EC, Mg, K, etc.). Further, these
maps can be interpolated onto a common grid for comparison (Whelan and McBratney, 2003). Spatial and
temporal variability of crop variables are at the heart of PF, while the spatial and temporal behaviors of that
variability are key to defining amendment strategies, or 'recipe maps'.
Precision agriculture has also been enabled by technologies like crop yield monitors mounted on GPS
equipped harvesters, the development of variable rate technology like seeders, sprayers, etc., the development of
an array of real-time vehicle mountable sensors that measure everything from chlorophyll levels to plant water
status, multi- and hyper-spectral aerial and satellite imagery, information technology, and geospatial tools.
Altogether, they enable farmers to use electronic guidance aids to direct equipment movements more accurately,
provide precise positioning for all equipment actions and chemical applications and, analyze all of that data in
association with other sources of data (agronomic, climatic, etc). These advances add up to a new and powerful
toolbox of management tools for the progressive farm manager. Precision farming technologies affect the entire
production and management functioning of a farm.
The technological tools often include the global positioning system, geographical information system,
yield monitor, variable rate technology, and remote sensing.
Maestría en Aplicaciones Espaciales de Alerta y Respuesta Temprana a Emergencias - CONAE - UNC 4

RS and GIS in Precision Farming MEW 9 – Verónica Andreo
1. The global positioning system (GPS) is a network of satellites developed for and managed by the U.S.
Defense Department. The GPS constellation orbiting the earth transmits precise satellite time and location
information to ground receivers. The ground receiving units are able to receive this location information from
several satellites at a time and thus, determine its exact location. This information is provided in real time,
meaning that continuous position information is provided while in motion. Having precise location information
at any time allows crop, soil and water measurements to be mapped. GPS receivers, either carry to the field or
mounted on implements allow users to return to specific locations to sample or treat those areas. GPS-based
applications in precision farming are being used for farm planning, field mapping, soil sampling, tractor
guidance, crop scouting, variable rate applications, and yield mapping. GPS allows farmers to work during low
visibility field conditions such as rain, dust, fog, and darkness. GPS equipment manufacturers have developed
several tools to help farmers and agribusinesses become more productive and efficient in their precision farming
activities. Today, many farmers use GPS-derived products to enhance operations in their farming businesses.
Location information is collected by GPS receivers for mapping field boundaries, roads, irrigation systems, and
problem areas in crops such as weeds or disease. The accuracy of GPS allows farmers to create farm maps with
precise acreage for field areas, road locations and distances between points of interest. GPS allows farmers to
accurately navigate to specific locations in the field, year after year, to collect soil samples or monitor crop
conditions. The ability to geo-reference activities gives producers the option to map and visually display farm
operations. This provides insights into both production variability as well as inefficiencies in crop production
and farm operations.
2. A geographical information system (GIS) consists of a hardware-software database system used to capture,
store, retrieve, manipulate, analyze, and display, in map like form, spatially referenced geographical information
(Figure 2). In the simplest terms, GIS is the merging of cartography, statistical analysis, and database technology.
GIS maps are interactive. On the computer screen, map users can scan a GIS map in any direction, zoom in or
out, and change the nature of the information contained in the map. Balancing the inputs and outputs on a farm is
fundamental to its success and profitability. The ability of GIS to analyze and visualize agricultural environments
and workflows has proved to be very beneficial to those involved in the farming industry (Orellana et al., 2006).
While natural inputs in farming cannot be controlled, they can be better understood and managed with GIS
applications such as crop yield estimates, soil amendment analysis, and erosion identification and remediation.
Enhancing a GIS with land-cover data layers has proved helpful to crop growers’ associations, crop insurance
companies, seed and fertilizer companies, farm chemical companies, libraries, universities, federal and state
governments, and value-added remote-sensing/GIS companies.
Maestría en Aplicaciones Espaciales de Alerta y Respuesta Temprana a Emergencias - CONAE - UNC 5

RS and GIS in Precision Farming MEW 9 – Verónica Andreo
Figure 2. Screenshots of different propietary GIS available on the market. a). Farm Works; b). ESRI
ArcView; c) MapInfo; d). CorView (PROGAP-INIA, Chile).
3. Yield monitors are crop yield measuring devices installed on harvesting equipment (Figure 3). The yield data
from the monitor is recorded and stored at regular intervals (of time or distance) along with positional data
received from the GPS unit. They also track other data such as distance and bushels per load, number of loads
and fields. Using GIS software it is possible to produce yield maps (Figure 4).
Figure 3. Some of the most disseminated yield monitors.
Figure 4. Example of a yield map for a maize crop
Maestría en Aplicaciones Espaciales de Alerta y Respuesta Temprana a Emergencias - CONAE - UNC 6

RS and GIS in Precision Farming MEW 9 – Verónica Andreo
4. Variable rate technology (VRT) consists of farm field equipment with the ability to precisely control the rate
of application of crop inputs and tillage operations. Variable rate controllers are available for granular, liquid and
gaseous fertilizer materials (Figure 5). Variable rates can either be manually controlled by the driver or
automatically controlled by an on board computer with an electronic prescription map. This technology package
allows the grower to apply the quantity of crop inputs needed at a precise location in the field based on the
individual characteristics of that location. Crop inputs that can be varied in their application commonly include
tillage, fertilizer, weed control, insect control, plant variety, plant population, and irrigation. Typical VRT system
components include a computer controller, GPS receiver, and GIS map database. The computer controller adjusts
the equipment application rate of the crop input applied. The computer controller is integrated with the GIS
database, which contains the flow rate instructions for the application equipment. A GPS receiver is linked to the
computer. The computer controller uses the location coordinates from the GPS unit to find the equipment
location on the map provided by the GIS unit. The computer controller reads the instructions from the GIS
system and varies the rate of the crop input being applied as the equipment crosses the field. The computer
controller will record the actual rates applied at each location in the field and store the information in the GIS
system, thus maintaining precise field maps of materials applied (Bragachini et al., 2006; Bongiovani, 2006).
Figure 5. Variable rate application monitor for chemicals.
5. Remote sensing image data from the soil and crops is processed and then added to the GIS database. There are
3 sources of remote sensing data commonly used in agriculture: proximal sensors, airborne sensors and satellite
sensors. Proximal hand-held sensors are mainly used for basic research, i.e. data obtained by this kind of sensors
is used to establish relationships between spectral behavior and biophysical parameters of crops under certain
stress (nutritional, thermal, water). Field research using spectral sensors address two approaches: establish direct
relationships between spectral reflectance and green biomass (Tucker et al., 1985); or estimate the proportion of
incident solar energy that is absorbed by the crop canopy and then relate it with production of biomass or grain
(Rudorff et al., 1997; Oviedo y Rudorff, 2000). In general, these field data is transformed into vegetation indexes
Maestría en Aplicaciones Espaciales de Alerta y Respuesta Temprana a Emergencias - CONAE - UNC 7
RS and GIS in Precision Farming MEW 9 – Verónica Andreo
that are then related to agronomical parameters such as foliar area index, productivity, biomass, etc. Among
airborne sensors, the most used are cameras, scanners, video cameras and radars (LiDAR sensors are also a
possibility in same cases but a quite expensive one). The most commonly used is the photographic camera that
obtains high quality data in a region going from 350 to 900 nm. Satellite remote-sensing images are used to
monitor and map agricultural areas. These images have some advantages over aerial images, i.e.: periodicity,
lower cost, wider vision, spectral analysis. The developing and availability of hyper-spectral and high resolution
images is promising for one of the most important issues in PF, the determination of homogeneous management
zones. However, the drawbacks of these images are their high cost and the small coverage area. According to
various studies physical features, such as organic matter content, texture and permeability of soil may be
correlated with the spectral response recorded by remote-sensing images (King et al., 1995; Leone et al., 1995;
Thompson y Robert, 1995). Land surface temperature (obtained from thermal images) have also been used to
study water content and soil compaction. In any case, the most widely used RS-derived tool is NDVI, which has
been related to different crop variables but mainly yield and has been used to identify variability in field
conditions. All these RS information is then useful to guide soil and crop samplings and assist decision making
process regarding property management (Moreira and Mantovani, 2006).
1.4. Stages and Implementation of Precision Farming
PF cycle is illustrated in Figure 6 and detailed in Table 1. It is important to remember, however, that we
are talking of a continuous management strategy. Initially, some form of monitoring and data analysis is needed
to form a decision. Nevertheless, it is just as important to continue to monitor and analyze the effect of decisions
and use this information to feed subsequent management decisions. The concept is the same as for adaptive
management. With some variations according to different authors, precision farming is a five-stage process
(Whelan and Taylor, 2013):
1. Geo-location of data
Geo-locating a field enables the farmer to overlay information gathered from analysis of soils and residual
nitrogen, and information on previous crops and soil resistivity. Geo-location is done in two ways:
a. The field is delineated using an in-vehicle GPS receiver as the farmer drives a tractor around the field.
b. The field is delineated on a basemap derived from aerial or satellite imagery. The base images must
have the right level of resolution and geometric quality to ensure that geolocation is sufficiently accurate.
Maestría en Aplicaciones Espaciales de Alerta y Respuesta Temprana a Emergencias - CONAE - UNC 8

RS and GIS in Precision Farming MEW 9 – Verónica Andreo
Figure 6. Precision farming cycle indicating spatial referencing as the enabling technology that drives the other
parts of the cycle.
2. Crop, Soil and Climate Monitoring
Intra- and inter-field variability may result from a number of factors. These include climatic conditions
(hail, drought, rain, etc.), soils (texture, depth, nitrogen levels), cropping practices (no-till farming), weeds and
disease. Permanent indicators—chiefly soil indicators—provide farmers with information about the main
environmental constants. Point indicators allow them to track a crop’s status, i.e., to see whether diseases are
developing, if the crop is suffering from water stress, nitrogen stress, or lodging, whether it has been damaged by
ice and so on. This information may come from weather stations and other sensors (soil electrical resistivity,
detection with the naked eye, satellite imagery, etc.). Soil resistivity measurements combined with soil analysis
make it possible to precisely map agro-pedological conditions.
Many sensors and monitors already exist for in-situ and on-the-go measurement for a variety of crop,
soil and climatic variables. These include yield sensors, biomass and crop response sensors (aerial and space-
borne multi- and hyper-spectral cameras), radio or mobile phone networked weather stations, soil apparent
electrical conductivity (EC) sensors and gamma-radiometric soil sensors, just to name a few. A huge amount of
research is currently being carried out to identify how to make use of the outputs from these sensors to improve
production. Agricultural scientists also need to continue to assess which and how multiple crop and production
indicators can be measured.
Two very useful inputs are: topographic maps made by means of DGPS, that are useful when
interpreting yield maps and weed maps as well as planning for grassed waterways and field divisions; and
Maestría en Aplicaciones Espaciales de Alerta y Respuesta Temprana a Emergencias - CONAE - UNC 9

RS and GIS in Precision Farming MEW 9 – Verónica Andreo
salinity maps (GPS can be coupled to a salinity meter sled which is towed behind an ATV or pickup) which are
valuable in interpreting yield maps and weed maps as well as tracking the change in salinity over time.
3. Attribute Mapping
Crop, soil and climate sensors often produce large, intensive data sets. The observations are usually
irregularly spaced and need to be ‘cleaned’ and interpolated onto a surface to allow for statistical analysis.
Software for mapping and displaying data from different sources on a common platform is improving annually.
The development of GIS specifically for agriculture is allowing this to occur however the adaptation and
adoption of this technology for use in PF on individual farms is still in its infancy. The main issues still to be
resolved are the development of a user friendly advanced data filtering system and the determination of initial
and future sampling schemes to ensure that the variability of the system is properly characterized.
4. Decision Support Systems
Precision farming may produce an explosion in the amount of records available for farm management.
Electronic sensors can collect a lot of data in a short period of time. Lots of disk space is needed to store all the
data as well as the maps resulting from the data. Electronic controllers on-board of seeders, fertilizers and
sprayers can also be designed to provide signals that are recorded electronically. Therefore, a lot of new data is
generated every year (yields, weeds, etc). Farmers will want to keep track of the yearly data to study trends in
fertility, yields, salinity and numerous other parameters. Techniques for data presentation, storage and analysis,
such as GIS, are already available and should be relatively easily applied, with none or a few modifications, to
agriculture. However, Decision Support Systems (DSS) are not so flexible and it is in this area that much
research needs to be done. Decision Support Systems use agronomic and environmental data, combined with
information on possible management techniques, to determine the optimum management strategy for production.
Most commercial DSS are based on ‘average’ crop response across a field. The majority of engineering
companies currently supplying SSCM technology are not producing DSS to support the differential use of their
equipment in a production system. Therefore the burden is falling on individual industry bodies, and to a lesser
extent government agencies, to fill the gap. Initially it may be sufficient to adapt existing agricultural DSS such
as WHEATMAN, COTTONLOGIC or APSIM to site-specific situations. In the long run however a DSS that is
able to site-specifically model plant-environment interactions in terms of yield and quality will be needed.
5. Differential Action
The differential application of inputs using VRA technology is essentially an engineering problem. Due
to the commercial potential of VRA technology, much of this engineering development is being driven by the
Maestría en Aplicaciones Espaciales de Alerta y Respuesta Temprana a Emergencias - CONAE - UNC 10
RS and GIS in Precision Farming MEW 9 – Verónica Andreo
private sector. The main input required for VRA implements is accurate information on required application rates
and associated locations or times for the applications. VRA equipment should also record the actual application
procedure for a posteriori quality control. The biggest barrier to adoption is the lack of information from a DSS
on where, and by how much, inputs should be varied. Controllers are available to electronically turn booms on
and off, and alter the amount (and blend) of herbicide applied. Moreover, several manufacturers are currently
producing guidance systems using high precision DGPS that can accurately position a moving vehicle within a
foot or less. These guidance systems may replace conventional equipment markers for spraying or seeding and
may be a valuable field scouting tool.
Table 1. Summary of PF stages according to AGCO, 2005.
Stage Technology involved Activities
Collecting and importing data GPS – DGPSGISTopographic instrumentsRemote sensorsDirect sensors
Topographic measurementSoil sampling by zonesweeds and diseases detectiondirect measurement of soil and croppropertiessatellite yield monitoringremote-sensing images from cropand soil
Analysis, processing and interpreting information
GISStatistical softwareTechnician and operator experience
Map digitizingspatial autocorrelation analysismaps of evaluation and prescription
Differential application VRTGPS assisted sprayerSpecialized software
Variable application of nutrientsVariable application of chemicalsDifferential sowing
2. Remote Sensing and Precision Farming
Given its characteristics, RS offers the opportunity of mapping and monitoring crop and soil variability
and an efficient way of mapping and monitoring the effects of any condition that affects plant health, yield, or
quality of a crop. Mainly based on reflectance differences among red and near infrared bands, different analysis
are done regarding biomass, stress condition, growth rate, among others. But above all, RS imagery is used as
input in GIS-based analysis to guide field samplings that aid in the understanding of observed patterns and assist
in decisions about present or future management of fields. Therefore, RS is a very useful tool for general
analysis to characterize the field, and used in combination with other management tools as crop simulation
models, producers can answer questions about past events and make predictions for a certain combination of
circumstances in the future. Besides, temporal analysis of RS data may help to get an image of the behavior of a
Maestría en Aplicaciones Espaciales de Alerta y Respuesta Temprana a Emergencias - CONAE - UNC 11

RS and GIS in Precision Farming MEW 9 – Verónica Andreo
field in yield terms. This can be done with yield maps if available, but if they are not, yield has proven to be
highly correlated to NIR reflectance, so these images may be used as a control tool to make management
decisions even before the harvest.
Remote sensing applications in precision agriculture began with sensors for soil organic matter, and have
quickly diversified to include satellite, aerial, and hand held or tractor mounted sensors. Wavelengths of
electromagnetic radiation initially focused on a few key visible or near infrared bands. Today, electromagnetic
wavelengths in use range from the ultraviolet to microwave portions of the spectrum, enabling advanced
applications such as light detection and ranging (LiDAR), fluorescence spectroscopy, and thermal spectroscopy,
along with more traditional applications in the visible and near infrared portions of the spectrum. Spectral
bandwidth has decreased dramatically with the advent of hyper-spectral remote sensing, allowing improved
analysis of specific compounds, molecular interactions, crop stress, and crop biophysical or biochemical
characteristics. A variety of spectral indexes now exist for various precision agriculture applications, rather than
a focus on only normalized difference vegetation indexes. Spatial resolution of aerial and satellite remote sensing
imagery has improved from 100’s of m to sub-metre accuracy, allowing evaluation of soil and crop properties at
fine spatial resolution at the expense of increased data storage and processing requirements. Temporal frequency
of remote sensing imagery has also improved dramatically. At present there is considerable interest in collecting
remote sensing data at multiple times in order to conduct near real time soil, crop and pest management (Mulla,
2013).
Remote sensing applications in agriculture are based on the interaction of electromagnetic radiation with
soil or plant material. Typically, remote sensing involves the measurement of reflected radiation, rather than
transmitted or absorbed radiation. Remote sensing refers to non-contact measurements of radiation reflected or
emitted from agricultural fields. The platforms for making these measurements include satellites, aircraft,
tractors and hand-held sensors. Measurements made with tractors and hand-held sensors are also known as
proximal sensing, especially if they do not involve measurements of reflected radiation. In addition to
reflectance, transmittance and absorption, plant leaves can emit energy by fluorescence (Apostol et al., 2003) or
thermal emission (Cohen et al., 2005). Thermal remote sensing for water stress in crops is based on emission of
radiation in response to temperature of the leaf and canopy, which varies with air temperature and the rate of
evapotranspiration.
The amount of radiation reflected from plants is inversely related to radiation absorbed by plant
pigments, and varies with the wavelength of incident radiation. Plant pigments such as chlorophyll absorb
radiation strongly in the visible spectrum from 400 to 700 nm (Pinter et al., 2003), particularly at wavelengths
such as 430 (blue or B) and 660 (red or R) nm for chlorophyll-a; and 450 (B) and 650 (R) nm for chlorophyll-b.
In contrast, plant reflectance is high in the near infrared (NIR 700-1300 nm) region as a result of leaf density and
Maestría en Aplicaciones Espaciales de Alerta y Respuesta Temprana a Emergencias - CONAE - UNC 12

RS and GIS in Precision Farming MEW 9 – Verónica Andreo
canopy structure effects. This sharp contrast in reflectance behavior between the red and NIR portions of the
spectrum is the motivation for development of spectral indexes that are based on ratios of reflectance values in
the visible and NIR regions (Sripada et al., 2006). These spectral indexes are often used to assess various
attributes of plant canopies, such as leaf area index (LAI), biomass, chlorophyll content or N content.
The amount of radiation reflected by bare soils is affected primarily by soil moisture and organic matter
content, but also by clay minerals and calcium carbonate or iron oxides (Viscarra Rossel et al., 2006). Each soil
constituent has a specific spectral region where reflectance is the strongest (Ben-Dor, 2010), and a specific
spectral signature. Bare soil and crop canopies are often both present, and the mixture of the two spectral
signatures often confounds the interpretation of reflectance data. Spectral unmixing algorithms (Huete &
Escadafal, 1991), derivative spectra (Demetriades-Shah et al., 1990) or spectral indexes that adjust for soil
effects (Haboudane et al., 2002, 2004) are often used to isolate information about plant characteristics when the
reflectance is affected by both sources.
Remote sensing applications in agriculture are typically classified according to the type of platform for
the sensor, including satellite, aerial, and ground based platforms. These platforms and their associated imaging
systems can be differentiated based on the altitude of the platform, the spatial resolution of the image, and the
minimum return frequency for sequential imaging. Spatial resolution affects the area that can be identified. As
spatial resolution improves, the area of the smallest pixel decreases, and the homogeneity of soil or crop
characteristics within that pixel increases. Poor spatial resolution implies large pixels with increased
heterogeneity in soil or plant characteristics. Return frequency is important for assessment of temporal patterns
in soil or plant characteristics. The availability of remote sensing images from satellite and aerial platforms is
often severely limited by cloud cover (Moran et al., 1997), whereas ground based remote sensing is less affected
by this limitation.
Remote sensing applications in agriculture have focused on a wide range of endeavors (Adamchuk et al.,
2004; Moran et al., 1997; Pinter et al., 2003). These include crop yield and biomass (Shanahan et al., 2001; Yang
et al., 2000), crop nutrient and water stress (Clay et al., 2006; Moller et al., 2007; Tilling et al., 2007),
infestations of weeds (Thorp and Tian, 2004), insects and plant diseases (Seelan et al., 2003), and soil properties
such as organic matter, moisture and clay content, and pH (Christy, 2008), or salinity (Corwin and Lesch, 2003).
2.1. Satellite remote sensing
Satellites have been used for remote sensing imagery in agriculture (Table 2) since the early 1970’s.
They were mainly used to perform large scale crop classifications (Bauer and Cipra, 1973; Jewel, 1989;
Panigrahy and Sharma, 1997). These applications of remote sensing in conventional agriculture soon led to
Maestría en Aplicaciones Espaciales de Alerta y Respuesta Temprana a Emergencias - CONAE - UNC 13

RS and GIS in Precision Farming MEW 9 – Verónica Andreo
applications in precision agriculture. The first application of remote sensing in precision agriculture occurred
when Bhatti et al. (1991) used Landsat imagery of bare soil to estimate spatial patterns in soil organic matter
content, which were then used as auxiliary data along with ground based measurements to estimate spatial
patterns in soil phosphorus and wheat grain yield (Mulla, 1997). The spatial resolution of Landsat, SPOT and
IRS satellites is fairly coarse (20-30 m) for current applications in precision agriculture.
Efforts were subsequently started to design satellite imaging systems that had the higher spatial
resolution and quicker revisit cycles required for precision agriculture (Table 2). As new improved spatial and
spectral sensors appeared, better correlations were found. For example, Seelan et al. (2003) used IKONOS
images to identify N deficiencies in sugarbeet, fungicide performance efficiency in wheat and field sites that had
inadequate artificial drainage in wheat. Bausch and Khosla (2010) showed that QuickBird estimates of
normalized green normalized difference vegetation index (NGNDVI) were strongly correlated with spatial
patterns in nitrogen sufficiency in irrigated maize. Garcia Torres et al. (2008) showed that QuickBird images of
olive orchards in Spain could be used to estimate areas of olive plantations, numbers of trees, and spatial patterns
in projected area of tree canopies, and olive yields. These two satellites have steadily gained a substantial base of
commercial subscribers interested in precision agriculture applications, in contrast to older satellite technology
such as Landsat or SPOT.
Table 2. Satellite remote sensing platforms and their spectral or spatial resolution, return frequency, and
suitability for precision farming. P: purple, G: green, R: red, IR: infrared, NIR: near infrared, MIR: middle
infrared, TIR: thermal infrared. Suitability class L: low, M: medium, H: high. (Source: Mulla, 2013).
Several trends are apparent in satellite based remote sensing (Table 2). First, the spatial resolution of
imaging systems has improved from 80 m with Landsat to sub-metre resolution with GeoEye and WorldView.
Second, the return visit frequency has improved from 18 days with Landsat today with WorldView. Third, the
number of spectral bands available for analysis has improved from four bands (band-widths greater than 60 nm)
Maestría en Aplicaciones Espaciales de Alerta y Respuesta Temprana a Emergencias - CONAE - UNC 14

RS and GIS in Precision Farming MEW 9 – Verónica Andreo
with Landsat to eight or more bands (bandwidths greater than 40 nm) with WorldView. Hyper-spectral imaging
systems such as Hyperion on the NASA's earth observing 1 (EO 1) satellite provided even greater spectral
resolution, with imaging from 400 to 2500 nm in 10 nm increments. As the spatial and spectral resolution of
satellite imagery has improved, the suitability of using reflectance data from these platforms for precision
agriculture applications has increased (Table 2). The most appropriate spatial and spectral resolution for
precision agriculture applications depends on factors such as crop management objectives, capacity of farm
equipment to vary farm inputs, and farm unit area. Estimation of spatial patterns in crop biomass or yield
requires better spatial and spectral resolution (1-3 m) than variable rate application of fertilizer (5-10 m).
Accuracy of variable rate application of fertilizer is often limited by fertilizer spreader delay times (Chan et al.,
2004). Variable rate spraying of herbicides for spot weed control requires better spatial and spectral resolution
(0.5-1 m) than variable rate irrigation (5-10 m). Larger commercial farms can often afford to pay for remote
sensing data with higher spatial and spectral resolution than smaller farms in developing countries.
Satellite and/or aerial imagery is frequently used to estimate spatial patterns in crop biomass (Yang et al.,
2000) and potential crop yield (Doraiswamy et al., 2003) using the Normalized Difference Vegetation Index
(NDVI). Although widely used, NDVI has several limitations (Thenkabail et al., 2000). The advent of yield
monitors provided finer scale resolution yield measurements across large spatial areas that could be used to
improve the capacity of remote sensing to predict crop structural characteristics such as LAI, biomass, and yield.
Many broadband spectral indexes (Table 3) other than NDVI are available for use in precision
agriculture (Miao et al., 2009; Sripada et al., 2006; Sripada et al., 2008). These indexes reflect two historical
trends in remote sensing for crop characteristics; namely, the prediction of ratios of reflectance in the red (R) and
NIR bands versus ratios in the green (G) and NIR bands. The normalized red (NR) index focuses on the portion
of the spectrum where chlorophyll strongly absorbs radiation. In contrast, the normalized green (NG) index
focuses on the portion of the spectrum where pigments other than chlorophyll absorb radiation. Similarly, there
are two forms of the ratio vegetation index (RVI), one that consists of the ratio of NIR to R reflectance and the
other, the green-red vegetation index (GRVI) that consists of the ratio of NIR to G reflectance. Also, two forms
of the NDVI exist, one that involves NIR and R reflectance, the other green normalized difference vegetation
index (GNDVI) involves NIR and G reflectance. The difference vegetative index (DVI) was developed using the
difference between reflectance in the NIR and R bands to compensate for effects of soil reflectance (Tucker,
1979). Sripada et al. (2006) found that economically optimum N rate in corn was better correlated with green
difference vegetation index (GDVI) (NIR-G) than DVI (NIR-R), and these indexes that compensated for soil
effects performed better than NIR and R ratio indexes such as NDVI and RVI that did not compensate for soil
effects. A wide range of other indexes have been developed to compensate for soil effects, including soil
adjusted vegetation index (SAVI), green soil adjusted vegetation index (GSAVI), optimized soil adjusted
Maestría en Aplicaciones Espaciales de Alerta y Respuesta Temprana a Emergencias - CONAE - UNC 15

RS and GIS in Precision Farming MEW 9 – Verónica Andreo
vegetation index (OSAVI), green optimized soil adjusted vegetation index (GOSAVI) and modified soil adjusted
vegetation index (MSAVI).
Moran et al. (1997) and Yao et al. (2010) summarized the major challenges for using satellite remote
sensing for precision agriculture. Satellite imagery in the visible and NIR bands are limited to cloud free days,
and are most usable when irradiance is relatively consistent across time. Only radar imagery collected using
satellites or airplanes is unaffected by cloud cover. Other challenges include calibrating raw digital numbers to
true surface reflectance, correcting imagery for atmospheric interferences and/or off-nadir view angles, and geo-
rectifying pixels using GPS-based ground control locations.
Table 3. Multi-spectral broad-band vegetation indexes available for use in precision agriculture. G: green, NIR:
near infrared, and R: red reflectances, respectively (source: Mulla, 2013).
2.2. Proximal remote sensing of crops for precision farming
Given the limitations of satellite remote sensing for precision agriculture, there has been significant
interest in proximal remote sensing techniques to assess crop growth and crop stress. Proximal remote sensing
involves sensors mounted on tractors, spreaders, sprayers or irrigation booms, which allow real time site specific
management of fertilizer, pesticides or irrigation. The foundation for a transition from remote sensing to
proximal sensing based assessment of crop status was established by Schepers et al., (1992), who used a Minolta
soil plant analysis development (SPAD) meter to measure leaf greenness (chlorophyll) in maize crops at the
silking stage under a range of applied N fertilizer rates. After that, a whole set of sensors and spectral indexes
were developed to record different crop properties (Table 4) that were then related to N stress in plants and set
the basis for VRT.
Maestría en Aplicaciones Espaciales de Alerta y Respuesta Temprana a Emergencias - CONAE - UNC 16

RS and GIS in Precision Farming MEW 9 – Verónica Andreo
Table 4. Innovations in remote and proximal leaf sensing in precision agriculture (Source: Mulla, 2013).
One limitation of the chlorophyll meter, GreenSeeker (Figure 7a), YaraN (Figure 7b) and Crop Circle
sensors, however, is that they cannot directly estimate the amount of N fertilizer needed to overcome crop N
stress (Samborski et al., 2009). Scientists have conducted comparisons of sensor readings with readings in
reference strips receiving sufficient N fertilizer (Blackmer & Schepers, 1995; Kitchen et al., 2010; Raun et al.,
2002; Sripada et al., 2008). They have used these data to develop N fertilizer response functions that relate
sensor readings to the amount of N fertilizer needed to overcome crop N stress (Scharf et al., 2011). Much
research is still needed in this direction to be able to cover for plant N needs “on-the-go”.
Figure 7. a) Green seeker sensor. b) Yara N functioning.
Maestría en Aplicaciones Espaciales de Alerta y Respuesta Temprana a Emergencias - CONAE - UNC 17

RS and GIS in Precision Farming MEW 9 – Verónica Andreo
2.3. Hyper-spectral remote sensing in precision farming
Hyper-spectral remote sensing collects reflectance data over a wide spectral range at small spectral
increments (typically 10 nm). It provides the ability to investigate spectral response of soils and vegetated
surfaces in narrow spectral bands (10 nm wide) across a wide spectral range. When collected across large spatial
extents at fine spatial resolution, hyper-spectral imaging provides powerful insight into the spatial and spectral
variability in reflectance for a bare or vegetated surface.
The first hyper-spectral sensor was the airborne visible/infrared imaging spectrometer (AVIRIS),
launched in 1987. This sensor provides continuous imagery from 380 to 2500 in bands that have a spectral
resolution of 10 nm and a spatial resolution of 20 m. The satellite based Hyperion sensor, launched aboard EO-1
by NASA in 2000, has hyper-spectral imaging capabilities similar to AVIRIS. Hyper-spectral imagery collected
by EO-1 Hyperion via the advanced land imager (ALI) sensor continues to be collected and is available for
public use through the US Geological Survey, Center for Earth Resources Observation and Science (EROS).
Datt et al. (2003) showed that ALI hyper-spectral data could be used to more accurately predict spatial patterns
in rice yield grown in Australia with derivative indexes and red edge position in comparison with predictions
based on NDVI. Wu et al. (2010) showed that vegetative indexes based on red edge reflectance from hyper-
spectral ALI data could be used to accurately estimate canopy chlorophyll content and leaf area index for a broad
range of agricultural crops in China. An aerial hyper-spectral imaging system, the compact airborne
spectrographic imager (CASI), has also been widely used (Haboudane et al., 2002, 2004). There are also hand-
held boom-mounted hyper-spectral and multi-spectral imaging systems, including the CropScan (CropScan Inc,
Rochester, MN, USA) sensor.
Hyper-spectral imaging differs from multi-spectral imaging in the continuity, range and spectral
resolution of bands. In theory, it offers the capability of sensing a wide variety of soil and crop characteristics
simultaneously, including moisture status, organic matter, nutrients, chlorophyll, carotenoids, cellulose, leaf area
index and crop biomass (Goel et al., 2003; Haboudane et al., 2002; Zarco-Tejada et al., 2005). Specific
wavelengths are most sensitive to each type of soil or crop characteristic. A red band centered at 687 nm is
sensitive to crop leaf area index and biomass, while a NIR band centered at 970 nm is sensitive to crop moisture
status (Thenkabail et al., 2010). Further examples of linking specific soil and crop characteristics with
reflectance are given for 33 hyper-spectral bands by Thenkabail et al. (2010). In contrast, multi-spectral imaging
is often limited to analysis of single broadband combinations such as NDVI, which become insensitive to
chlorophyll and other plant characteristics at LAI values exceeding 3.0 (Thenkabail et al., 2000), and are
strongly interfered with by bare soil reflectance at low LAI values. Thenkabail et al. (2000) showed that hyper-
spectral data can be used to construct three general categories of predictive spectral indexes, including 1) optimal
Maestría en Aplicaciones Espaciales de Alerta y Respuesta Temprana a Emergencias - CONAE - UNC 18

RS and GIS in Precision Farming MEW 9 – Verónica Andreo
multiple narrow band reflectance indexes (OMNBR), 2) narrow band NDVI, and 3) SAVI. Only two to four
narrow bands were needed to describe plant characteristics with OMNBR. The greatest information about plant
characteristics in OMNBR includes the longer red wavelengths (650-700 nm), shorter green wavelengths (500-
550 nm), red-edge (720 nm), and two NIR (900-940 nm and 982 nm) spectral bands. The information in these
bands is only available in narrow increments of 10-20 nm, and is easily obscured in broad multi-spectral bands
that are available with older satellite imaging systems. The best combination of two narrow bands in NDVI-like
indexes was centered in the red (682 nm) and NIR (920 nm) wavelengths, but varied depending on the type of
crop (corn, soybean, cotton or potato) as well as the plant characteristic of interest (LAI, biomass, etc.).
Advanced statistical methods for chemometric analysis of reflectance spectra have been used to interpret
hyper-spectral remote sensing data, including partial least squares (Viscarra Rossel et al., 2006), principal
components analysis (Geladi, 2003), and pattern classification and recognition techniques including object
oriented (Frohn et al., 2009) and decision tree (Wright and Gallant, 2007) classification techniques. Partial least
squares (PLS) regression is perhaps more powerful than principal components analysis (PCA) in that PLS (like
PCA) not only identifies factors that describe spectral variance, but also eliminates spectral bands that contain
redundant information (Alchanatis and Cohen, 2010).
A variety of narrow band hyper-spectral indexes (Table 5) are available for use in precision agriculture
(Haboudane et al., 2002, 2004; Li et al., 2010; Miao et al., 2007, 2009). Many of these have the same form as
broadband spectral indexes, but differ in that the reflectance bands for hyper-spectral indexes are narrower.
These indexes have shown to respond to canopy or leaf scale effects of leaf area index, chlorophyll, specific
pigments, or nitrogen stress. New hyper-spectral indexes are continuously being tested and developed (Li et al.,
2010).
Potential applications of hyper-spectral remote sensing in precision agriculture have recently been
reviewed by Yao et al. (2010). These applications include: 1) bare soil imaging for management zone
delineation, 2) weed mapping, 3) crop N stress detection, 4) crop yield mapping, and 5) pest and disease
detection. Perhaps of greatest interest for PF is using hyper-spectral remote sensing for variable rate, in-season
management of nitrogen fertilizer based on spatial patterns in chlorophyll content. For example, the
MCARI/OSAVI705 index outperformed all other vegetation indexes evaluated when studying chlorophyll
content in a variety of agricultural canopy types in China (Wu et al., 2010).
Maestría en Aplicaciones Espaciales de Alerta y Respuesta Temprana a Emergencias - CONAE - UNC 19

RS and GIS in Precision Farming MEW 9 – Verónica Andreo
Table 5. Hyper-spectral narrow-band vegetation indexes available to use in PF. R: red, NIR: near infrared.
(Source: Mulla, 2013).
2.4. Knowledge gaps for remote sensing in precision farming
Rapid advances in remote sensing for precision agriculture have occurred over the last twenty five years.
Satellite imagery has improved in spatial resolution, return visit frequency and spectral resolution. Aerial hyper-
spectral imagery has revolutionized the ability to distinguish multiple crop characteristics, including nutrients,
water, pests, diseases, weeds, biomass and canopy structure. Ground-based sensors have been developed for on-
the-go monitoring of crop and soil characteristics such as N stress, water stress, soil organic matter and moisture
content.
There is a significant potential in precision agriculture for combining archived remote sensing data with
real-time data for improved agricultural management (Thenkabail, 2003). Historical archives of satellite remote
sensing data are available at many locations for Landsat, SPOT, IRS, IKONOS, and QuickBird. These data
typically include reflectance in the B, G, R and NIR bands, at spatial resolutions of from 0.6 to 30 m spatial
resolution. Images at a fixed location could be analyzed across multiple crop growth stages, seasons and years in
order to identify relatively homogeneous sub-regions of fields that differ from one another in leaf area index,
NDVI, and potential yield. Auxiliary data at these same sites, including crop yield maps, digital elevation models
and soil series maps could be combined, via GIS-related techniques, with historical remote sensing data to
Maestría en Aplicaciones Espaciales de Alerta y Respuesta Temprana a Emergencias - CONAE - UNC 20

RS and GIS in Precision Farming MEW 9 – Verónica Andreo
identify potential management zones where precision agricultural input operations can be implemented. Real
time remote sensing with high spatial and spectral resolution satellites such as EO-1 Hyperion or the upcoming
NASA Hyper-spectral Infrared Imager (HyspIRI, http://hyspiri.jpl.nasa.gov/) satellite could then be used for real
time precision agricultural decision making and to refine the location of management zones identified using
historical imaging and auxiliary data.
With this in mind, there are several needs for future research in precision farming. These include the
following:
# More emphasis is needed on chemo-metric or spectral decomposition/derivative methods of analysis since
spatial and spectral resolution of hyper-spectral sensing systems are now adequate for most precision agriculture
applications
# Sensors are needed for direct estimation of nutrient deficiencies without the use of reference strips
# Spectral indexes should continue to be developed that simultaneously allow assessment of multiple crop
characteristics (e.g. LAI, biomass) and stresses (e.g. water and N; weeds and insects, etc.)
# Historical archives of satellite remote sensing data at moderate to high spatial resolution and traditional
spectral moderate to high spatial resolution and traditional spectral resolution should be integrated with real-time
remote sensing data at high spatial and spectral resolution for improved decision making in precision agriculture.
2.5. The future in PF: UAS (unmanned aircraft system)
High-resolution satellite imagery is now quite commonly used to study variations of crop and soil
conditions. However, the availability and the often prohibitive costs of such imagery would suggest an
alternative product for this particular application in PF. Specifically, images taken by low altitude remote sensing
platforms, or small unmanned aerial systems (UAS, Figure 8), are shown to be a potential alternative given their
low cost of operation in environmental monitoring, high spatial and temporal resolution, and their high
flexibility in image acquisition programming (Hunt et al., 2013). Results of recent studies indicate that, to
provide a reliable end product to farmers, advances in platform design, production, standardization of image
georeferencing and mosaicing, and information extraction workflow are required. Moreover, it is suggested that
such endeavors should involve the farmer, particularly in the process of field design, image acquisition, image
interpretation and analysis (Zhang and Kovacs, 2012). Other researchers have shown that very low-weight, low-
cost, hyper-spectral, stereoscopic and spectro-directional 3D UAV-remote sensing is now possible (Honkavaara
et al., 2012). This cutting edge technology is powerful and cost efficient in time-critical, repetitive and locally
operated remote sensing applications.
Maestría en Aplicaciones Espaciales de Alerta y Respuesta Temprana a Emergencias - CONAE - UNC 21

RS and GIS in Precision Farming MEW 9 – Verónica Andreo
Figure 8. Example of UAS and field images obtained with them.
3. Geographic Information Systems in Precision Farming
Geographic Information Systems (GIS) are an important element in the management of data generated
by PF. However, information stored in the GIS should be also treated with other software applications that make
data interpretation and appropriate management-taking decisions possible (McBratney and Whelan, 2001). In the
last few years several GIS for PF have become available. These are programs relatively easy to use and which
allow yield monitor data manipulation and appropriate file specification for VRT equipment and machinery.
However, the routines they use are too simple and it is difficult to guarantee suitable interpretation and
management decision-taking (McBratney and Whelan, 2001). The development of Decision-Support Systems
(DSS) in PF undoubtedly remains a pending assignment.
Geographic Information Systems allow for the association of a group of graphic information (plans and
maps) with digital data bases. This means that GIS allows for an integrated management of graphic and alpha-
numeric information to address high complexity issues. In PF, the idea of having the proper information in the
proper time and place is crucial to make management decisions when facing an emergency (for which previous
modeling and simulations are indispensable) as well as to increase productivity and yield of parcels. Therefore,
GIS is a basic tool to administrate and manage field information, since it enables the building, storing, updating,
integration, and visualization of geographical information from different sources (Orellana et al., 2006).
A concept that is gaining space is that of information in process, which refers to active information, the
automatic and rapid construction of information each time the system is fed and updated with new data. For this
Maestría en Aplicaciones Espaciales de Alerta y Respuesta Temprana a Emergencias - CONAE - UNC 22

RS and GIS in Precision Farming MEW 9 – Verónica Andreo
to actually work and reach farmers a lot of research and analysis of the great amount of information available has
to be done to tune models to different production scenarios. There is no doubts that GIS technology has triggered
a structural change in both the theoretical and practical planning of resource management not only in PF, but
almost everywhere else (Orellana et al., 2006).
The importance of GIS is rooted in that solutions for several problems require the access to several types
of information that may only be related by geographic position (spatial association). Then, only GIS technology
allows to store and manipulate information based on geography of elements to analyze patterns, relationships
and tendencies that aid and assist the decision making process. In fact, the kind of questions a GIS may answer
are:
• Localization: What is in...?
• Condition: Where does...?
• Tendencies: What has changed...? In which direction...?
• Routes: Which is the optimal route to...?
• Models: What would happen if...?
Several tools to quantitatively assess spatial relationships within and between layers of environmental
information have been developed in the last years. These tools allow to quantitatively establish if a certain
variable has some sort of spatial pattern or structure, or if it can be related to other(s) and in that way explain
and/or predict the productive and quality behavior of a crop. Undoubtedly, the mere graphic representation of
data has important implications in our capacity to understand or visualize probable associations between, for
example, environmental variables and yield. However, we are neither able to see if those associations are
meaningful, nor if associations or patterns are obscured by different sources of error or stochasticity. Therefore,
here is where the statistical analysis play their most important role, allowing to quantify and numerically
characterize the spatial associations present in the field.
3.1. Interpolation
To represent the variables of interest we have to fill the spaces without information with estimated or
interpolated data. For the interpolation to be plausible, data of the variable of interest must have a spatial
structure, i.e.: places that are closer should have more similar values than those that are far away in geographic
space. This is what is termed as spatial autocorrelation. Only if this correlation exists, the interpolation is
possible. There are several indexes to establish if a variable shows spatial autocorrelation. The most used are
“G” (Geary index) and “I” (Moran index).
Once it has been established that there is indeed autocorrelation among values of the variable under
Maestría en Aplicaciones Espaciales de Alerta y Respuesta Temprana a Emergencias - CONAE - UNC 23

RS and GIS in Precision Farming MEW 9 – Verónica Andreo
study, the next step is to model it through an interpolation technique in order to get a surface map of the variable
of interest (Figure 9). There are numerous techniques to characterize and model the spatial distribution of a data
set:
• “Nearest Neighbor” assigns the value of the nearest point to the point where the estimation is needed. •
“Inverse Weighted Distance” (IWD) is the simplest interpolation method. It performs the average of the samples
in a certain window, so the influence of a point decreases with quadratic distance.
• “Modified Shepard’s Method” a minimum squared inverse distance is used which diminishes the bull-eye
effect that is common in IWD.
• “Radial Basis Function”: non linear functions are used in the interpolation to determine the weight.
• “Triangulation Method”: identifies the optimal set of triangles that connect every sampling points and then
converts that to a grid.
• “Minimum curvature”: this method is analogous to fit an elastic grid to each sampling point by minimizing the
bending.
• “Polynomial regression”: a polynomial equation is fit to the whole set of sampling points. This is more a map
generalization technique rather than an interpolation method.
Using the techniques previously described we can obtain maps with which it is possible to perform from
simple mathematical operations (map algebra) to more complex geo-statistical analysis (Best and Leon, 2006).
Figure 9. General scheme to obtain a surface continuous map from point field data through interpolation
(Source: Best and Leon, 2006).
3.2. Geo-statistics
All of the above described interpolation methods do not assume any parametric distribution for data.
There is another technique, however, that assumes a continuous and normal distribution of values of a variable in
the geographic space of a field. This technique is called Geo-statistics. Mapping of the variables sampled using
Maestría en Aplicaciones Espaciales de Alerta y Respuesta Temprana a Emergencias - CONAE - UNC 24

RS and GIS in Precision Farming MEW 9 – Verónica Andreo
geo-statistical methods and a reference grid (raster map or surface map), is a recommendable measure (Plant,
2001). Geo-statistics is basically a probabilistic method of spatial interpolation. The final construction of a map
corresponding to a parcel is performed based on the estimation (with error) of the values of a variable at non-
sampled points, using the spatial variability structure of the sampled data (variogram) and an interpolation
method (kriging). It is based on the study and modeling of the correlation or semivariance of a variable
according to distance among sample points. The tool most widely used for the spatial description of data sets is
the variogram or semi-variogram, which is a mathematical description of the relationship between variance
among pairs of observations and the distance among them. Several models may then be fit to the experimental
variogram (the one based on observations in the field) which are then used as a basis for kriging interpolation
methods (Best and Leon, 2006).
Kriging is an optimal interpolation based on regression against observed values of surrounding data
points, weighted according to spatial covariance values. All interpolation algorithms (inverse distance squared,
splines, radial basis functions, triangulation, etc.) estimate the value at a given location as a weighted sum of
data values at surrounding locations. Almost all assign weights according to functions that give a decreasing
weight with increasing separation distance. Kriging, instead, assigns weights according to a (moderately) data-
driven weighting function, rather than an arbitrary function. In any case, it is still just an interpolation algorithm
and will give very similar results to others in many cases (Isaaks and Srivastava, 1989), particularly:
- If the data locations are fairly dense and uniformly distributed throughout the study area, you will get fairly
good estimates regardless of interpolation algorithm.
- If the data locations fall in a few clusters with large gaps in between, you will get unreliable estimates
regardless of interpolation algorithm.
However, some advantages of kriging are that:
- Helps to compensate for the effects of data clustering, assigning individual points within a cluster less weight
than isolated data points (or, treating clusters more like single points)
- Gives an estimate of estimation error (kriging variance or residual map), along with estimate of the variable
- The availability of estimation error provides basis for stochastic simulation of possible realizations of the
variable.
3.3. Spatial Econometry
The generalized spread of GIS has generated the need for a methodology that allows to manage spatial
models and autocorrelation. Anselin (2001) has defined Spatial Econometry as the collection of techniques that
addresses the peculiarities caused by space in statistical modeling. This technique differs from geo-statistic in its
Maestría en Aplicaciones Espaciales de Alerta y Respuesta Temprana a Emergencias - CONAE - UNC 25

RS and GIS in Precision Farming MEW 9 – Verónica Andreo
basic principles. Geo-statistics assumes that spatial variation is continuous while spatial econometry assumes
that the covariance is a result of the interaction among discrete objects. This premise requires the specification of
a spatial stochastic process represented by a matrix of spatial weights (Anselin, 2001).
3.3.1. Spatial regression
In order to be able to generate proper recommendations for site-specific management, it is basic to
consider site-specific variation and spatial structure of data in models used to understand and explain the
relationship between yield and crop conditions. The spatial regression provides tools to diagnose and manage
spatial autocorrelation. These models may be split in two types regarding the shape of the spatial dependency
among observations (Anselin, 2001): spatially weighted models and spatial error models. Both types of
autocorrelation can be corrected by the estimation of spatial correlation coefficients, which implies the use of a
matrix of spatial weights estimated as a function of distance among observations.
3.3.2. Management zones
One of the objectives of PF is to identify and delineate areas or zones of different productive potential
within a parcel in order to apply different management strategies (Figure 10, McBratney and Whelan, 2001;
Bramley et al., 2005). For zone delineation of a parcel, information about the yield variation pattern is a very
interesting starting point. These areas, called management zones, normally differ in terms of soil properties,
slope and microclimate. The use of cluster analysis is the recommended classification methodology to allow
zoning at parcel level (Bramley and Hamilton, 2004; Taylor et al., 2007). Through an iterative process this
procedure enables the clustering of values interpolated from the maps into homogeneous groups (classes) in
relation to the variables chosen for the analysis. It is possible to preset the number of groups (hard k-means
algorithm or fuzzy k-means algorithm), and delineation of 2 to 5 classes is the general recommendation
(Bramley and Hamilton, 2004). The final goal is to zone the parcel taking into consideration the classes provided
by cluster analysis.
Whelan and McBratney (2003) articulate a number of approaches that are currently being used to define
management zones, these include hand drawn polygons on yield maps, supervised and unsupervised
classification procedures on satellite or aerial images (cluster analyses, classification and regression trees),
identification of yield stability patterns across seasons, etc. Among these many approaches there is a phyto-
geomorphological approach which ties multi-year crop growth stability/characteristics to topological terrain
attributes. The interest in the phytogeomorphological approach stems from the fact that the geomorphology
component typically dictates the hydrology of the farm field. Multi-year datasets are now becoming available
that show this stability and these effects, however, there is a lot of work remaining to create an actual DSS
Maestría en Aplicaciones Espaciales de Alerta y Respuesta Temprana a Emergencias - CONAE - UNC 26

RS and GIS in Precision Farming MEW 9 – Verónica Andreo
system that could universally help farmers.
Figure 10. Example of delineation of management zones and differential action according to zonification.
(Source: Arnò et al., 2009)
3.4. GIS Software currently used in PF
Aside from the widely known proprietary GIS that has developed special plug-ins or modules for PF
applications (ArcGIS, MapInfo, etc.), there is a growing market of especially designed GIS for PF. The most
used of these latter are Farm works (http://www.farmworks.com/), SST Toolbox software
(http://www.sstsoftware.com/), geoagro GIS (http://geoagro.com/en/content/geoagro-gis), MapShots
(http://www.mapshots.com/), etc. Some of them also have on-line access and mobile and tablet applications.
Some free and open source software with general and specific GIS applications for PF are also available and
used mainly in the academic field, such as: GeoDa (which also includes geostatistical analysis tools), QGIS,
GRASS GIS and R.
4. Precision farming in Argentina
Argentina is the country with the highest level of adoption of PF in Latin America. It is also the country
with the highest level of development and manufacturing of VRT with satellite guide. This positioning of the
country has been possible because since 1995 the National Institute of Agricultural Technology (INTA) has been
Maestría en Aplicaciones Espaciales de Alerta y Respuesta Temprana a Emergencias - CONAE - UNC 27

RS and GIS in Precision Farming MEW 9 – Verónica Andreo
carrying out research projects, diffusion campaigns and training courses for professionals, farmers and
machinery operators on PF all over the country. INTA-Manfredi (Cordoba) was the experimental station leading
the process that now includes stations in three other provinces (Buenos Aires, Santa Fe and Entre Rios). The
main activities of these stations are adaptive experiencing and extension (Bongiovanni and Lowenberg-DeBoer,
2006).
PF does not enhance commodities price, nor solve transportation or financial problems, but Argentinian
producers are interested in PF technology because it improves production efficiency. Yield monitors, GPS-
guidance systems and remote sensing images are the most widely adopted technologies in the country, since they
provide immediate benefits. On the other hand, VRT is not yet widely spread because of the lack of information
to make proper recommendations by management zone.
Within limiting factor for the adoption of PF are: high inversion cost, high production risk faced by
Argentinian producers compared to developed countries farmers, lower induced variability, and generalized use
of contractors to carry out the different field works. On the contrary, factors that encourage adoption of PF are:
large productive farms, highly trained managers, available technology, local technological developments and,
highly valuable information provided by yield monitors.
The use of RS images in Argentina is mainly related to: get tax exemptions in case of flooding,
determine land quality and flooding risk prior to rent or buy, and establish management zones based on DEMs,
vegetation indexes, etc. Yield monitors are also used as a tool to diagnose weed problems, diseases, underground
water, fertility, salinity, different tillage methods, etc. RS and yield maps are then the tools more widely used for
decision making regarding management of fields in Argentina.
The biggest limitation to make site-specific management recommendations in Argentina is that only a
50% of soils are regularly sampled to examine nutrient content (García, 2003). Therefore, given that there are
still no clear strategies to transform data collected in the field into management recommendations, only a few
VR seeders and fertilizer machines were sold. Argentinian manufacturers have included VRT and controllers to
machinery mainly for VR application of nitrogen. There are already some producers in Buenos Aires, Cordoba
and Santa Fe that apply variable dose of N according to topography. There are several private companies that
provide PF comprehensive services. The package includes soil samplings, DEMs, soil compaction
measurements, soil analysis, crop tracking, satellite images, management zones delineation, fertilization
recommendations, etc.
The use of remote sensing in agriculture is also increasing in Argentina. Some producers or related
professionals use satellite imagery along with soil maps to determine productive aptitude of soils and drainage
before buying or renting land. Some of them also use RS to re-structure field divisions.
There is still a long way to go for PF (as described) to reach middle and small size farmers in Argentina.
Maestría en Aplicaciones Espaciales de Alerta y Respuesta Temprana a Emergencias - CONAE - UNC 28

RS and GIS in Precision Farming MEW 9 – Verónica Andreo
Costs of RS are very high, since high spatial and spectral resolution images are controlled by foreign companies
or agencies.
In conclusion, the most important challenges for the adoption of PF in Argentina include:
· Training of machinery operators so they collect high quality information;
· Training of professionals so they are able to analyze data gathered, interpret results and translate them in
management recommendations
· Help producers to understand the variability of their fields and the advantages of PF approach in terms of
efficiency and profitability
· Carry out field experiments according to farmers need and available machinery to be able to make proper
management recommendations
5. CONCLUSION
It is clear that precision farming has several advantages, but it can make farm planning and management
both easier and more complex. It does not happen as soon as a farmer purchases a GPS unit or a yield monitor. It
occurs over time as the farmer increases his level of knowledge regarding precision farming technologies and
realizes that PF is an integrative approach to manage the whole farm and not only increase yields. What is
perhaps the most important for the success of precision farming, at least initially, is the increased knowledge that
a farmer needs of his natural resources in the field. This includes a better understanding of soil types, hydrology,
microclimates and aerial photography. A farmer should identify the variance of factors within the fields that
affect crop yield before a yield map is acquired. A yield map should only serve as verification data to quantify
the consequences of the variation that exists in a field. Management strategies and prescriptions will likely rely
on sources other than yield maps. Yield maps, however, have been (and in some cases, still are) of fundamental
importance for the development of PF. The parcels with greatest opportunities for PF are those which reveal a
high degree of variation and a strong spatial structure in that variation. A high degree of variation will mean
higher VRA of inputs and, therefore, greater economic and environmental benefit in comparison with uniform
management. A strong spatial structure is also desirable, as the variable-rate machinery will operate more
efficiently when the areas for differential treatment are larger and are defined clearly and regularly. However,
decision-making remains the cornerstone of PF. The parameters and methods used for zoning, the variables to be
sampled on site or the actions to be adopted in each zone, are some examples of the decisions that have to be
taken and on which the success or failure of the proposed site-specific management will depend.
The amount of data recorded by proximate and remote sensors, and generated as a result of GIS-based
operations grows larger every day. Thus, more work is needed to analyse and interpret the data to be able to
Maestría en Aplicaciones Espaciales de Alerta y Respuesta Temprana a Emergencias - CONAE - UNC 29

RS and GIS in Precision Farming MEW 9 – Verónica Andreo
produce useful management recommendations with regards to the use of fertilizer, herbicides and pesticides,
irrigation and so on. Most importantly, the data that has been generated needs to be stored in a systematic
manner for future reference. This is essential, as it will increase the effectiveness and efficiencies of future
surveys. Therefore, farmers implementing precision farming will likely work closer with several professionals in
the agricultural, GIS and computing sciences. However, to be able to generate useful management strategies, on-
farm trials and experiments are needed to understand the causes of variation, as well as basic and applied
research in remote sensing tools, statistical analysis and VR technology.
Getting started usually involves strategic soil and plant testing on 2 or 3 paddocks in the first year and
then ramp things up in the following seasons. Once the management zones have been defined and there is a
knowledge of nutrient loads and awareness of any other yield limiting factors, prescription maps can be built and
management recommendations be made. The adoption of PF may seem expensive and slow at the beginning but
once the functioning of a particular parcel or field and the causes of its productivity variability are understood,
the benefits become evident.
With all technology available, it is important however, to keep in mind the basic functionning of nature and the local knowledge of
farmers...
6. REFERENCES
• Adamchuk, V. I., Hummel, J. W., Morgan, M. T., & Upadhyaya, S. K. (2004). On-the-go soil sensors for precisionagriculture. Computers and Electronics in Agriculture, 44, 71-79.
• AGCO. 2005. http://www.fieldstar.com/agco/FieldStar/FieldStarUK/System/DataCollection.htm• Alchanatis, V., & Cohen, Y. (2010). Spectral and spatial methods of hyperspectral image analysis for estimation of
biophysical and biochemical properties of agricultural crops. Ch. 13. In P. S. Thenkabail, J. G. Lyon, & A. Huete(Eds.), Hyperspectral remote sensing of vegetation (pp. 705). Boca Raton, FL: CRC Press.
• Anselin, L. (2001). Spatial Econometrics. In: B. Baltagi (ed.), A Companion to Theoretical Econometrics. Oxford:Basil Blackwell, pp. 310-330.
• Apostol, S., Viau, A. A., Tremblay, N., Briantais, J.-M., Prasher, S., Parent, L.-E., et al. (2003). Laser-inducedfluorescence signatures as a tool for remote monitoring of water and nitrogen stresses in plants. Canadian Journalof Remote Sensing, 29, 57-65.
• J. Arnó, J.; Martínez-Casasnovas, J.A.; Ribes-Dasi, M.; Rosell, J.M. (2009). Precision Viticulture. Research topics,
Maestría en Aplicaciones Espaciales de Alerta y Respuesta Temprana a Emergencias - CONAE - UNC 30

RS and GIS in Precision Farming MEW 9 – Verónica Andreo
challenges and opportunities in site-specific vineyard management. Spanish Journal of Agricultural Research, 7,779-790.
• Bauer, M. E., & Cipra, J. E. (1973). Identification of agricultural crops by computer processing of ERTS MSS data.LARS Technical Reports. Paper 20. http://docs.lib.purdue.edu/larstech/20. W. Lafayette, IN: Purdue Univ.
• Bausch, W. C., & Khosla, R. (2010). QuickBird satellite versus ground-based multi-spectral data for estimatingnitrogen status of irrigated maize. Precision Agriculture, 11, 274-290.
• Ben-Dor, E. (2010). Characterization of soil properties using reflectance spectroscopy. Ch. 22. In P. S. Thenkabail,J. G. Lyon, & A. Huete (Eds.), Hyperspectral remote sensing of vegetation (pp. 705). Boca Raton, FL: CRC Press.
• Best, S.; Leon, L. (2006). Geoestadística. In: AGRICULTURA DE PRECISIÓN: Integrando conocimientos parauna agricultura moderna y sustentable. Bongiovanni R.; Montovani, E.C.; Best, S.; Roel, A. Eds. PROCISUR/IICA2006. Montevideo, Uruguay. pp. 147-161.
• Bhatti, A. U., Mulla, D. J., & Frazier, B. E. (1991). Estimation of soil properties and wheat yields on complexeroded hills using geostatistics and thematic mapper images. Remote Sensing of Environment, 37, 181-191.
• Blackmer, T. M., & Schepers, J. S. (1995). Use of a chlorophyll meter to monitor nitrogen status and schedulefertigation for corn. Journal of Production Agriculture, 8, 56-60.
• Bongiovanni, R. (2006) Econometría Espacial. In: AGRICULTURA DE PRECISIÓN: Integrando conocimientospara una agricultura moderna y sustentable. Bongiovanni R.; Montovani, E.C.; Best, S.; Roel, A. Eds.PROCISUR/IICA 2006. Montevideo, Uruguay. pp. 162-167.
• Bongiovanni, R.; Lowenberg-DeBoer, J. (2006). Agricultura de Precisión en Argentina. In: AGRICULTURA DEPRECISIÓN: Integrando conocimientos para una agricultura moderna y sustentable. Bongiovanni R.; Montovani,E.C.; Best, S.; Roel, A. Eds. PROCISUR/IICA 2006. Montevideo, Uruguay. pp. 203-218.
• Bragachini, M.; Méndez, A.; Scaramuzza, F.; Proietti, F. (2006). Cultivos Tradicionales. In: AGRICULTURA DEPRECISIÓN: Integrando conocimientos para una agricultura moderna y sustentable. Bongiovanni R.; Montovani,E.C.; Best, S.; Roel, A. Eds. PROCISUR/IICA 2006. Montevideo, Uruguay. pp. 45-54.
• Bramley R.G.V., Hamilton R.P. (2004). Understanding variability in winegrape production systems. 1. Withinvineyard variation in yield over several vintages. Aust J Grape Wine Res 10, 32-45.
• Bramley R.G.V., Lanyon D.M., Panten K. (2005). Whole-of-vineyard experimentation – An improved basis forknowledge generation and decision making. Proc VECPA-Eur Conf on Precision Agriculture. Uppsala, Sweden,June 8-11. pp. 883-890.
• Chan, C. W., Schueller, J. K., Miller, W. M., Whitney, J. D., & Cornell, J. A. (2004). Error sources affectingvariable rate application of nitrogen fertilizer. Precision Agriculture, 5, 601-616.
• Christy, C. D. (2008). Real-time measurement of soil attributes using on-the-go near infrared reflectancespectroscopy. Computers and Electronics in Agriculture, 61, 10-19.
• Claret, M.; Best, S.; León, L. (2006). Sistema de Posicionamiento Global (GPS). In: AGRICULTURA DEPRECISIÓN: Integrando conocimientos para una agricultura moderna y sustentable. Bongiovanni R.; Montovani,E.C.; Best, S.; Roel, A. Eds. PROCISUR/IICA 2006. Montevideo, Uruguay. pp. 23-38.
• Clay, D. E., Kim, K.-I., Chang, J., Clay, S. A., Dalsted, K. (2006). Characterizing water and nitrogen stress in cornusing remote sensing. Agronomy Journal, 98, 579-587.
• Cohen, Y., Alchanatis, V., Meron, M., Saranga, Y., Tsipris, J. (2005). Estimation of leaf water potential by thermalimagery and spatial analysis. Journal of Experimental Botany, 56, 1843-1852.
• Corwin, D. L., Lesch, S. M. (2003). Application of soil electrical conductivity to precision agriculture: theory,principles, and guidelines. Agronomy Journal, 95, 455-471.
• Datt, B., Jupp, D., McVicar, T., Van Niel, T. (2003). Time series analysis of EO-1 Hyperion data for yieldestimation at an agricultural site. Geoscience and Remote Sensing Symposium IGARSS Proceedings IEEEInternational, 1, 564-566.
• Demetriades-Shah, T. H., Steven, M. D., Clark, J. A. (1990). High resolution derivative spectra in remote sensing.Remote Sensing of Environment, 33, 55-56.
• Doraiswamy, P. C., Moulin, S., Cook, P. W., Stern, A. (2003). Crop yield assessment from remote sensing.Photogrammetric Engineering and Remote Sensing, 69, 665-674.
• Earl, R.; Wheeler, P.N.; Blackmore, B.S.; Godwin, R.J. (1996). Precision farming - the management of variability.The Journal of the Institution of Agricultural Engineers, 51, 18-23.
• Frohn, R., Reif, M., Lane, C., Autrey, B. (2009). Satellite remote sensing of isolated wetlands using object-oriented
Maestría en Aplicaciones Espaciales de Alerta y Respuesta Temprana a Emergencias - CONAE - UNC 31

RS and GIS in Precision Farming MEW 9 – Verónica Andreo
classification of LANDSAT-7 data. Wetlands, 29, 931-941.• Geladi, P. (2003). Chemometrics in spectroscopy. Part 1. Classical chemometrics. Spectrochimica Acta Part B, 58,
767-782. • Goddard, T.W., Lachapelle, G., Cannon, M.E., Penney, D.C., McKenzie, R.C. (1995) The potential of GPS and
GIS in precision agriculture. Proc. Geomatique V: "La Route De L'Innovation". November 9-10, Montreal, P.Q., Canada
• Goel, P. K., Prasher, S. O., Landry, J. A., Patel, R. M., Bonnell, R. B., Viau, A. A., et al. (2003). Potential ofairborne hyperspectral remote sensing to detect nitrogen deficiency and weed infestation in corn. Computers andElectronics in Agriculture, 38, 99-124.
• Haboudane, D., Miller, J. R., Pattey, E., Zarco-Tejada, P. J., Strachan, I. B. (2004). Hyperspectral vegetationindices and novel algorithms for predicting green LAI of crop canopies: modeling and validation in the context ofprecision agriculture. Remote Sensing of Environment, 90, 337-352.
• Haboudane, D., Miller, J. R., Tremblay, N., Zarco-Tejada, P. J., Dextraze, L. (2002). Integrated narrow-bandvegetation indices for prediction of crop chlorophyll content for application to precision agriculture. RemoteSensing of Environment, 81, 416-426.
• Honkavaara, E.; Kaivosoja, J.; Mäkynen, J.; Pellikka, I.; Pesonen, L.; Saari, H.; Salo, H.; Hakala, T.; Marklelin, L.;Rosnell, T. (2012). Hyperspectral reflectance signatures and point clouds for precision agriculture by light weightuav imaging system. ISPRS Annals of the Photogrammetry, Remote Sensing and Spatial Information Sciences,Volume I-7, 2012 XXII ISPRS Congress, Melbourne, Australia
• Huete, A. (1988). A soil adjusted vegetation index (SAVI). Remote Sensing of Environment, 25, 295e309.• Huete, A. R., Escadafal, R. (1991). Assessment of biophysical soil properties through spectral decomposition
techniques. Remote Sensing of Environment, 35, 149-159.• Hunt, E.R.; Daughtry, C.S.T.; Mirsky, S.B.; Hively, W.D. (2013) Remote sensing with unmanned aircraft systems
for precision agriculture applications. Second International Conference on Agro-Geoinformatics, 12: 131-134.• Isaaks, E.H.; Srivastava, R.M. (1989). Applied Geostatistics. Oxford University Press, New York. pp. 592.• Jewel, N. (1989). An evaluation of multi-date SPOT data for agriculture and land use mapping in the United
Kingdom.International Journal of Remote Sensing, 10, 939-951.• King, B.A.; Brady, R.A.; McCann, I.R.; Stark, J.C. 1995. Variable rate water application through sprinkler
irrigation. In: Proc. Site-Specific Management. For Agricultural Systems, Minneapolis, 1994. Anals. Madison:ASA-CSSA-SSSA, pp. 485-493.
• Kitchen, N. R., Sudduth, K. A., Drummond, S. T., Scharf, P. C., Palm, H. L., Roberts, D. F., et al. (2010). Ground-based canopy reflectance sensing for variable-rate nitrogen corn fertilization. Agronomy Journal, 102, 71-84.
• Leone, A.P.; Wright, G.G.; Corves, C. 1995. The application of satellite remote sensing for soil studies in uplandareas of Southern Italy. Int. J. Remote Sensing, 16, 1087-1105.
• Li, F., Miao, Y., Hennig, S. D., Gnyp, M. L., Chen, X., Jia, L., et al. (2010). Evaluating hyperspectral vegetationindices for estimating nitrogen concentration of winter wheat at different growth stages. Precision Agriculture, 11,335-357.
• Mcbratney, A.; Whelan, B.; Ancev, T.; Bouma, J. (2005). Future directions of precision agriculture. Precis Agric 6,7-23.
• Miao, Y., Mulla, D. J., Randall, G. W., Vetsch, J. A., Vintila, R. (2007). Predicting chlorophyll meter readings withaerial hyperspectral remote sensing for in-season site-specific nitrogen management of corn. In J. V. Stafford (Ed.),Precision agriculture ’07 (pp. 635-641). The Netherlands: Wageningen Acad. Publ.
• Miao, Y., Mulla, D. J., Randall, G., Vetsch, J., Vintila, R. (2009). Combining chlorophyll meter readings and highspatial resolution remote sensing images for in-season site-specific nitrogen management of corn. PrecisionAgriculture, 10, 45-62.
• Moller, M., Alchanatis, V., Cohen, Y., Meron, M., Tsipris, J., Naor, A., et al. (2007). Use of thermal and visibleimagery for estimating crop water status of irrigated grapevine. Journal of Experimental Botany, 58, 827-838.
• Moran, M. S., Inoue, Y., Barnes, E. M. (1997). Opportunities and limitations for image-based remote sensing inprecision crop management. Remote Sensing of Environment, 61, 319-346.
• Mulla, D. J., Bhatti, A. U. (1997). An evaluation of indicator properties affecting spatial patterns in N and Prequirements for winter wheat yield. In J. V. Stafford (Ed.). Precision agriculture ’97: Spatial variability in soil andcrop, Vol. 1 (pp. 145-154). Oxford, UK: BIOS Sci. Publ.
Maestría en Aplicaciones Espaciales de Alerta y Respuesta Temprana a Emergencias - CONAE - UNC 32
RS and GIS in Precision Farming MEW 9 – Verónica Andreo
• Mulla, D.J. (2013). Twenty five years of remote sensing in precision agriculture: Key advances and remainingknowledge gaps. Biosystems Engineering, 114, 358-371.
• Orellana, J.; Best, S.; Claret, M. (2006). Capítulo 7. Sistemas de Información Geográfica (SIG). In:AGRICULTURA DE PRECISIÓN: Integrando conocimientos para una agricultura moderna y sustentable.Bongiovanni R.; Montovani, E.C.; Best, S.; Roel, A. Eds. PROCISUR/IICA 2006. Montevideo, Uruguay. pp. 131-144.
• Oviedo, A.F.P.; Rudorff, B.F.T. 2000. Índice de Área Foliar e resposta espectral da cultura do trigo (Triticumaestivum L.) submetida ao estresse hídrico. Revista Biociência, Taubaté, 6, 39-47.
• Panigrahy, S., Sharma, S. A. (1997). Mapping of crop rotation using multidate Indian remote sensing satellitedigital data. ISPRS Journal of Photogrammetry and Remote Sensing, 52, 85e91.
• Pinter, P. J., Jr., Hatfield, J. L., Schepers, J. S., Barnes, E. M., Moran, M. S., Daughtry, C. S. T., et al. (2003).Remote sensing for crop management. Photogrammetric Engineering and Remote Sensing, 69, 647-664.
• Plant, R.E. (2001). Site-specific management: the application of information technology to crop production.Comput Electron Agric 30, 9-29.
• Raun, W. R., Solie, J. B., Johnson, G. V., Stone, M. L., Mullen, R. W., Freeman, K. W., et al. (2002). Improvingnitrogen use efficiency in cereal grain production with optical sensing and variable rate application. AgronomyJournal, 94, 815-820.
• Roel, A. (2006). Análisis de cluster y CART. In: AGRICULTURA DE PRECISIÓN: Integrando conocimientospara una agricultura moderna y sustentable. Bongiovanni R.; Montovani, E.C.; Best, S.; Roel, A. Eds.PROCISUR/IICA 2006. Montevideo, Uruguay. pp. 167-170.
• Rudorff, B.F.T.; Moreira, M.A.; Oviedo, A.; de Freitas, J.G. 1997. Efeito do nitrogênio e do déficit hídrico naresposta espectral de cultivares de trigo. CD-ROM. Simp. Latino-Americano de Percepção Remota, Mérida,Venezuela: SELPER, 1, 1-9.
• Samborski, S. M., Tremblay, N., Fallon, E. (2009). Strategies to make use of plant sensors-based diagnosticinformation for nitrogen recommendations. Agronomy Journal, 101, 800-816.
• Scharf, P. C., Shannon, D. K., Palm, H. L., Sudduth, K. A., Drummond, S. T., Kitchen, N. R., et al. (2011). Sensor-based nitrogen applications out-performed producer-chosen rates for corn in on-farm demonstrations. AgronomyJournal, 103, 1683-1691.
• Schepers, J. S., Francis, D. D., Vigil, M., Below, F. E. (1992). Comparison of corn leaf nitrogen concentration andchlorophyll meter readings. Communications in Soil Science and Plant Analysis, 23, 2173-2187.
• Seelan, S. K., Laguette, S., Casady, G. M., Seielstad, G. A. (2003). Remote sensing applications for precisionagriculture: a learning community approach. Remote Sensing of Environment, 88, 157-169.
• Shanahan, J. F., Schepers, J. S., Francis, D. D., Varvel, G. E., Wilhelm, W. W., Tringe, J. M., et al. (2001). Use ofremote sensing imagery to estimate corn grain yield. Agronomy Journal, 93, 583-589.
• Sripada, R. P., Heiniger, R. W., White, J. G., Weisz, R. (2006). Aerial color infrared photography for determininglate-season nitrogen requirements in corn. Agronomy Journal, 97, 1443-1451.
• Sripada, R. P., Schmidt, J. P., Dellinger, A. E., Beegle, D. B. (2008). Evaluating multiple indices from a canopyreflectance sensor to estimate corn N requirements. Agronomy Journal, 100, 1553-1561.
• Taylor J.A., Mcbratney A.B., Whelan B.M. (2007). Establishing management classes for broadacre agriculturalproduction. Agron J 99(5), 1366-1376.
• Thenkabail, P. S. (2003). Biophysical and yield information for precision farming from near-real-time andhistorical Landsat TM images. International Journal of Remote Sensing, 24, 2879-2904.
• Thenkabail, P. S., Lyon, J. G., Huete, A. (2010). Hyperspectral remote sensing of vegetation and agricultural crops:knowledge gain and knowledge gap after 40 years of research. Ch. 28. In P. S. Thenkabail, J. G. Lyon, & A. Huete(Eds.), Hyperspectral remote sensing of vegetation (pp. 705). Boca Raton, FL: CRC Press.
• Thenkabail, P. S., Smith, R. B., De Pauw, E. (2000). Hyperspectral vegetation indices and their relationships withagricultural crop characteristics. Remote Sensing of Environment, 71, 158-182.
• Thompson, W.; Robert, P.C. 1995. Valuation of mapping strategies for variable rate applications. In: Proc. Site-Specific Management for Agricultural Systems, Minneapolis, 1994. Annals. Madison: ASA-CSSA-SSSA, pp. 303-323.
• Thorp, K. R., Tian, L. F. (2004). A review on remote sensing of weeds in agriculture. Precision Agriculture, 5, 477-508.
Maestría en Aplicaciones Espaciales de Alerta y Respuesta Temprana a Emergencias - CONAE - UNC 33

RS and GIS in Precision Farming MEW 9 – Verónica Andreo
• Tilling, S. K., O’Leary, G. J., Ferwerda, J. G., Jones, S. D., Fitzgerald, G. J., Rodriguez, D., et al. (2007). Remotesensing of nitrogen and water stress in wheat. Field Crops Research, 104, 77-85.
• Tucker, C. J. (1979). Red and photographic infrared linear combinations for monitoring vegetation. RemoteSensing of Environment, 8, 127-150.
• Tucker, C.L.; Vanpraet, C.; Sharman, M.L.; Van Ittersum, G. 1985. Satellite remote sensing of total herbaceousbiomass production in Senegalese Sahel: 1980-1984. Remote Sensing of Environment, 17(3), 233-49.
• Viscarra Rossel, R. A., Walvoort, D. J. J., McBratney, A. B., Janik, L. J., & Skjemstad, J. O. (2006). Visible, nearinfrared, mid infrared or combined diffuse reflectance spectroscopy for simultaneous assessment of various soilproperties. Geoderma, 131, 59-75.
• Whelan, B.; McBratney, A. (2003). Definition and interpretation of petential management zones in Australia.Solutions for a better environment, WEB: Australian Society of Agronomy.
• Whelan, B.; Taylor, J. (2013). Precision Agriculture For Grain Production Systems. Collingwood, Australia:CSIRO Publishing. pp. 208.
• Whelan, B.M., McBratney, A.B., 2003. Definition and Interpretation of potential management zones in Australia, In: Proceedings of the 11th Australian Agronomy Conference, Geelong, Victoria, Feb. 2-6 2003.
• Wright, C., Gallant, A. (2007). Improved wetland remote sensing in Yellowstone National Park using classificationtrees to combine TM imagery and ancillary environmental data. Remote Sensing of Environment, 107, 582-605.
• Wu, C., Wang, L., Niu, Z., Gao, S., Wu, M. (2010). Nondestructive estimation of canopy chlorophyll content usingHyperion and Landsat/TM images. International Journal of Remote Sensing, 31, 2159e2167.
• Yang, C., Everitt, J. H., Bradford, J. M., Escobar, D. E. (2000). Mapping grain sorghum growth and yieldvariations using airborne multispectral digital imagery. Transactions of the ASAE, 43, 1927-1938.
• Yao, H. L., Tang, L., Tian, Brown, R. L., Bhatnagar, D., & Cleveland, T. E. (2010). Using hyperspectral data inprecision farming applications. Ch. 25. In P. S. Thenkabail, J. G. Lyon, & A. Huete (Eds.), Hyperspectral remotesensing of vegetation (pp. 705). Boca Raton, FL: CRC Press.
• Zarco-Tejada, P., Berjon, A., Lopez-Lozano, R., Miller, J., Martın, P., Cachorro, V., et al. (2005). Assessingvineyard condition with hyperspectral indices: leaf and canopy reflectance simulation in a row-structureddiscontinuous canopy. Remote Sensing of Environment, 99, 271-287.
• Zhang, C.; Kovacs, J.M. (2012). The application of small unmanned aerial systems for precision agriculture: areview. Precision Agriculture, 13, 693-712.
Maestría en Aplicaciones Espaciales de Alerta y Respuesta Temprana a Emergencias - CONAE - UNC 34