facts figures - files.taxfoundation.org · in 1941, we introduced our first edition of facts &...
TRANSCRIPT

2018
HOW DOES YOUR STATE COMPARE?&FACTS FIGURES

In 1941, we introduced our first edition of Facts & Figures. “There is need for concise and accurate data,” we wrote. “Facts give a broader perspective; facts dissipate predilections and prejudices. . . [and] this collection of data is an important step to meet the challenge presented by the broad problems of public finance.”
Facts & Figures 2018: How Does Your State Compare? builds on these seven decades of tradition. Mailed to every state legislator and governor, this handbook is designed to be a pocket- and purse-sized guide to state rankings on tax rates, collections, burdens, and more. For easy accessibility, this publication is also available in our free Tax Foundation mobile app.
These tables were compiled by Tax Foundation staff and updated by Policy Analyst Morgan Scarboro. We hope these facts contribute to a healthy public debate.
Tax Foundation1325 G Street NW, Suite 950
Washington, DC 20005202.464.6200
TaxFoundation.org
© 2018 Tax Foundation. All rights reserved.Printed in the United States of America
ISBN: 978-1-942768-20-3
Scott A. Hodge PresidentTax [email protected].
Scott Drenkard Director of State Projects Tax [email protected]

Number Title DateTaxes and Tax Measures
1 Tax Freedom Day by State 20172 State-Local Tax Burdens 20123 State Business Tax Climate Index 20184 State Tax Collections per Capita 20165 State Revenue per Capita 20156 State & Local Tax Collections per Capita 20157 State & Local Revenue per Capita 20158 Sources of State & Local Tax Collections 20159 Federal Aid as a Percentage of State
General Revenue2015
10 Federal Income Tax Payments by Income Percentile
2015
11 Selected Federal Tax Rates 2018
Individual Income Taxes12 State Individual Income Tax Rates 201813 State Individual Income Tax Collections
per Capita2016
14 State & Local Individual Income Tax Collections per Capita
2015
Corporate Income Taxes 15 State Corporate Income Tax Rates 201816 State Corporate Income Tax Collections
per Capita2016
17 State & Local Corporate Income Tax Collections per Capita
2015
18 State Gross Receipts Taxes 2018
Sales Taxes19 State & Local Sales Tax Rates 201820 State General Sales Tax Collections per
Capita2016
21 State & Local General Sales Tax Collections per Capita
2015
22 State Sales Tax Breadth 2016
Facts & Figures 2018 How Does Your State Compare?
Table of Contents

Table of Contents, Continued
Excise Taxes23 State Gasoline Tax Rates 201824 Share of State & Local Road Spending
Covered by State & Local Tolls, User Fees, & User Taxes
2015
25 State Cigarette Excise Tax Rates 201826 State & Local Vapor Excise Tax Rates 201827 State Recreational Marijuana Excise Tax
Rates2018
28 State Spirits Excise Tax Rates 201829 State Wine Excise Tax Rates 201830 State Beer Excise Tax Rates 201831 State & Local Cell Phone Tax Rates 201732 Sales Tax Treatment of Groceries, Candy,
& Soda2018
33 State & Local Excise Tax Collections per Capita
2015
Property Taxes34 Property Taxes Paid as a Percentage of
Owner-Occupied Housing Value2016
35 State & Local Property Tax Collections per Capita
2015
36 State Capital Stock Tax Rates 2018
Estate and Inheritance Taxes37 State Estate Tax Rates & Exemptions 201838 State Inheritance Tax Rates & Exemptions 2018
State Debt39 State Debt per Capita 201540 State & Local Debt per Capita 201541 Funded Ratio of Public Pension Plans 2015
Data42 Income per Capita by State 201643 People per Household by State 2015-2016

Taxes & Tax Measures
Tax Freedom Day by StateCalendar Year 2017
Note: Tax Freedom Day represents how long into the year Americans work before they have earned enough money to pay all federal, state, and local taxes for the year. New Tax Freedom Day data is released every spring at www.TaxFreedomDay.org. D.C.’s rank does not affect states’ ranks, but the figure in parentheses indicates where it would rank if included.
Source: Tax Freedom Day 2017, which is based on data from the Bureau of Economic Analysis.
StateTax Freedom
Day RankU.S. April 23Ala. April 9 4Alaska April 10 6Ariz. April 15 16Ark. April 13 12Calif. May 1 46Colo. April 24 37Conn. May 21 50Del. April 18 24Fla. April 20 27Ga. April 17 19Hawaii April 19 26Idaho April 15 16Ill. April 30 44Ind. April 17 19Iowa April 14 14Kans. April 20 27Ky. April 11 8La. April 10 6Maine April 17 19Md. April 29 43Mass. May 5 47Mich. April 23 32Minn. April 30 44Miss. April 5 1Mo. April 13 12
Mont. April 17 19Nebr. April 14 14Nev. April 23 32N.H. April 22 31N.J. May 13 49N.M. April 9 4N.Y. May 11 48N.C. April 16 18N.D. April 26 39Ohio April 20 27Okla. April 11 8Ore. April 24 37Pa. April 23 32R.I. April 28 42S.C. April 11 8S.D. April 8 3Tenn. April 7 2Tex. April 17 19Utah April 21 30Vt. April 18 24Va. April 23 32Wash. April 27 40W.Va. April 12 11Wis. April 27 40Wyo. April 23 32D.C. April 26 (39)
StateTax Freedom
Day Rank
TABLE 1.

Taxes & Tax Measures
State-Local Tax Burdens per Capita & as a Percentage of IncomeFiscal Year 2012
State
State-Local Tax Burden as a Share
of State Income RankTotal Tax Burden
(per Capita)US 9.9% $4,420Ala. 8.7% 39 $3,067Alaska 6.5% 50 $3,229Ariz. 8.8% 36 $3,276Ark. 10.1% 17 $3,519Calif. 11.0% 6 $5,237Colo. 8.9% 35 $4,304Conn. 12.6% 2 $7,869Del. 10.2% 16 $4,412Fla. 8.9% 34 $3,738Ga. 9.1% 32 $3,426Hawaii 10.2% 14 $4,576Idaho 9.3% 26 $3,318Ill. 11.0% 5 $5,235Ind. 9.5% 22 $3,585Iowa 9.2% 31 $4,037Kans. 9.5% 23 $4,131Ky. 9.5% 24 $3,298La. 7.6% 45 $2,950Maine 10.2% 13 $3,997Md. 10.9% 7 $5,920Mass. 10.3% 12 $5,872Mich. 9.4% 25 $3,631Minn. 10.8% 8 $5,185Miss. 8.6% 41 $2,742Mo. 9.3% 29 $3,591Mont. 8.7% 38 $3,389Nebr. 9.2% 30 $4,197Nev. 8.1% 43 $3,349N.H. 7.9% 44 $3,961N.J. 12.2% 3 $6,926
TABLE 2.

Taxes & Tax Measures
State-Local Tax Burdens per Capita & as a Percentage of IncomeFiscal Year 2012
Note: Data for years 1977 to 2012 are available at www.TaxFoundation.org/burdens. Payments made to out-of-state governments are tallied in taxpayer’s state of residence where possible. D.C.’s rank does not affect states’ ranks, but the figure in parentheses indicates where it would rank if included. See Table 43 for people per household by state.
Source: Tax Foundation, State-Local Tax Burden Rankings FY 2012.
N.M. 8.7% 37 $3,141N.Y. 12.7% 1 $6,993N.C. 9.8% 20 $3,659N.D. 9.0% 33 $4,867Ohio 9.8% 19 $3,924Okla. 8.6% 40 $3,515Ore. 10.3% 10 $4,095Pa. 10.2% 15 $4,589R.I. 10.8% 9 $4,998S.C. 8.4% 42 $2,936S.D. 7.1% 49 $3,318Tenn. 7.3% 47 $2,805Tex. 7.6% 46 $3,340Utah 9.6% 21 $3,556Vt. 10.3% 11 $4,557Va. 9.3% 27 $4,623Wash. 9.3% 28 $4,541W.Va. 9.8% 18 $3,331Wis. 11.0% 4 $4,734Wyo. 7.1% 48 $4,407D.C. 10.6% (10) $7,541
State
State-Local Tax Burden as a Share
of State Income RankTotal Tax Burden
(per Capita)
TABLE 2, Cont.

Taxes & Tax Measures
2018 State Business Tax Climate IndexAs of July 1, 2017
State
Overall Index Rank
Ranking on Five Component Taxes
Corp. Tax
Ind. Income
Tax Sales Tax
Unemp. Ins. Tax
Prop. Tax
Ala. 35 22 22 49 11 12Alaska 3 26 1 5 25 38Ariz. 21 13 18 47 15 6Ark. 39 39 30 44 32 22Calif. 48 32 50 41 13 13Colo. 18 18 15 39 35 14Conn. 44 31 37 27 19 49Del. 15 50 34 1 3 20Fla. 4 19 1 29 2 10Ga. 36 10 42 28 38 23Hawaii 27 14 31 23 27 16Idaho 20 25 23 26 46 3Ill. 29 36 16 35 42 45Ind. 9 23 10 9 10 4Iowa 40 48 33 19 34 39Kans. 23 38 19 31 12 19Ky. 33 27 29 14 47 36La. 42 40 27 50 4 30Maine 28 41 26 8 44 41Md. 43 20 46 18 24 42Mass. 22 35 12 12 49 46Mich. 12 8 14 11 48 21Minn. 46 43 45 25 37 28Miss. 24 24 20 38 5 35Mo. 16 5 28 24 7 7Mont. 6 12 21 3 20 9Nebr. 25 28 24 13 9 40Nev. 5 33 1 42 45 8N.H. 7 45 9 2 43 44N.J. 50 42 49 46 36 50
TABLE 3.

Taxes & Tax Measures
2018 State Business Tax Climate IndexAs of July 1, 2017
N.M. 34 24 35 40 16 1N.Y. 49 7 49 43 30 47N.C. 11 3 13 20 6 32N.D. 30 16 36 34 14 2Ohio 45 47 47 30 8 11Okla. 32 9 38 36 1 15Ore. 10 34 32 4 31 18Pa. 26 44 17 21 50 33R.I. 41 30 39 22 23 43S.C. 37 15 41 32 29 24S.D. 2 1 1 33 39 25Tenn. 14 21 8 45 22 29Tex. 13 49 6 37 26 37Utah 8 4 11 17 21 5Vt. 47 37 44 16 18 48Va. 31 6 40 10 41 31Wash. 17 46 6 48 17 27W.Va. 19 17 25 15 28 17Wis. 38 29 43 7 40 26Wyo. 1 1 1 6 33 34D.C. (47) (26) (43) (34) (30) (45)
State
Overall Index Rank
Ranking on Five Component Taxes
Corp. Tax
Ind. Income
Tax Sales Tax
Unemp. Ins. Tax
Prop. Tax
Note: The State Business Tax Climate Index measures how each state’s tax laws affect economic performance. A rank of 1 means the state’s tax system is more favorable for business; a rank of 50 means the state’s tax system is less favorable for business. Component rankings do not average to the total. States without a given tax rank equally as number 1. D.C.’s rank does not affect states’ ranks, but the figure in parentheses indicates where it would rank if included.
Source: Tax Foundation, 2018 State Business Tax Climate Index.
TABLE 3, Cont.

Taxes & Tax Measures
State Tax Collections per CapitaFiscal Year 2016
Note: D.C., not listed, is included only in combined state and local data. See Table 43 for people per household by state.
Source: Census Bureau; Tax Foundation calculations.
StateCollections per Capita Rank
U.S. $2,869Ala. $2,041 41Alaska $1,405 50Ariz. $2,124 39Ark. $3,163 13Calif. $3,950 8Colo. $2,314 37Conn. $4,249 5Del. $3,697 9Fla. $1,822 49Ga. $2,080 40Hawaii $4,843 3Idaho $2,506 34Ill. $2,854 20Ind. $2,651 28Iowa $3,053 17Kans. $2,772 22Ky. $2,655 27La. $1,987 45Maine $3,105 14Md. $3,468 11Mass. $3,998 7Mich. $2,762 23Minn. $4,559 4Miss. $2,566 31Mo. $2,010 44
Mont. $2,530 32Nebr. $2,682 26Nev. $2,730 24N.H. $1,979 46N.J. $3,514 10N.M. $2,619 29N.Y. $4,101 6N.C. $2,580 30N.D. $4,909 2Ohio $2,469 35Okla. $2,165 38Ore. $2,703 25Pa. $2,924 19R.I. $3,088 15S.C. $1,926 47S.D. $2,028 42Tenn. $2,013 43Tex. $1,868 48Utah $2,327 36Vt. $4,950 1Va. $2,522 33Wash. $3,060 16W.Va. $2,804 21Wis. $3,050 18Wyo. $3,272 12
StateCollections per Capita Rank
TABLE 4.

Taxes & Tax Measures
State Revenue per CapitaFiscal Year 2015
Note: “Revenue” refers to the Census Bureau’s General Revenue classification. This measure includes revenue such as taxes, fees, licenses, and intergovernmental revenue but excludes revenue from government enterprises such as utilities and liquor stores, as well as insurance trust revenue. D.C. is included only in combined state and local data. See Table 43 for average people per household by state.
Source: Census Bureau; Tax Foundation calculations.
StateRevenue per
Capita RankU.S. $5,768Ala. $5,068 37Alaska $10,418 2Ariz. $4,571 45Ark. $6,507 17Calif. $6,782 15Colo. $5,285 34Conn. $7,418 10Del. $8,006 7Fla. $3,921 49Ga. $3,868 50Hawaii $8,252 6Idaho $4,789 43Ill. $5,443 31Ind. $5,293 32Iowa $6,504 18Kans. $5,537 29Ky. $6,019 24La. $5,014 39Maine $6,025 22Md. $6,460 19Mass. $7,650 9Mich. $6,019 23Minn. $7,372 11Miss. $6,181 20Mo. $4,609 44
Mont. $6,076 21Nebr. $5,252 35Nev. $4,521 46N.H. $4,814 42N.J. $6,773 16N.M. $8,316 5N.Y. $7,921 8N.C. $4,946 40N.D. $11,627 1Ohio $5,630 28Okla. $5,515 30Ore. $6,990 13Pa. $5,837 25R.I. $6,972 14S.C. $5,044 38S.D. $4,857 41Tenn. $4,187 48Tex. $4,516 47Utah $5,229 36Vt. $9,598 4Va. $5,287 33Wash. $5,779 27W.Va. $7,090 12Wis. $5,800 26Wyo. $10,314 3
StateRevenue per
Capita Rank
TABLE 5.
Taxes & Tax Measures
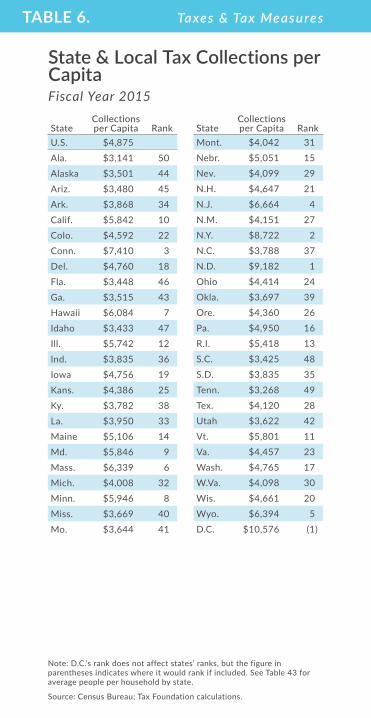
State & Local Tax Collections per CapitaFiscal Year 2015
Note: D.C.’s rank does not affect states’ ranks, but the figure in parentheses indicates where it would rank if included. See Table 43 for average people per household by state.
Source: Census Bureau; Tax Foundation calculations.
StateCollections per Capita Rank
U.S. $4,875Ala. $3,141 50Alaska $3,501 44Ariz. $3,480 45Ark. $3,868 34Calif. $5,842 10Colo. $4,592 22Conn. $7,410 3Del. $4,760 18Fla. $3,448 46Ga. $3,515 43Hawaii $6,084 7Idaho $3,433 47Ill. $5,742 12Ind. $3,835 36Iowa $4,756 19Kans. $4,386 25Ky. $3,782 38La. $3,950 33Maine $5,106 14Md. $5,846 9Mass. $6,339 6Mich. $4,008 32Minn. $5,946 8Miss. $3,669 40Mo. $3,644 41
Mont. $4,042 31Nebr. $5,051 15Nev. $4,099 29N.H. $4,647 21N.J. $6,664 4N.M. $4,151 27N.Y. $8,722 2N.C. $3,788 37N.D. $9,182 1Ohio $4,414 24Okla. $3,697 39Ore. $4,360 26Pa. $4,950 16R.I. $5,418 13S.C. $3,425 48S.D. $3,835 35Tenn. $3,268 49Tex. $4,120 28Utah $3,622 42Vt. $5,801 11Va. $4,457 23Wash. $4,765 17W.Va. $4,098 30Wis. $4,661 20Wyo. $6,394 5D.C. $10,576 (1)
StateCollections per Capita Rank
TABLE 6.

Taxes & Tax Measures
State & Local Revenue per CapitaFiscal Year 2015
Note: “Revenue” here refers to the Census Bureau’s General Revenue classification. This measure includes revenue such as taxes, fees, licenses, and intergovernmental revenue but excludes revenue from government enterprises such as utilities and liquor stores, as well as insurance trust revenue. D.C.’s rank does not affect states’ ranks, but the figure in parentheses indicates where it would rank if included. See Table 43 for average people per household by state.
Source: Census Bureau; Tax Foundation calculations.
StateCollections per Capita Rank
U.S. $9,085Ala. $7,553 42Alaska $13,999 4Ariz. $6,825 47Ark. $7,934 36Calif. $10,704 7Colo. $9,121 19Conn. $10,928 6Del. $9,687 17Fla. $7,101 46Ga. $6,579 50Hawaii $10,581 10Idaho $6,803 48Ill. $9,110 20Ind. $7,820 37Iowa $9,780 16Kans. $8,386 29Ky. $7,946 35La. $8,107 32Maine $8,681 25Md. $9,875 15Mass. $10,690 8Mich. $8,459 27Minn. $10,311 12Miss. $8,601 26Mo. $7,307 44
Mont. $8,424 28Nebr. $9,057 21Nev. $7,233 45N.H. $8,012 33N.J. $10,672 9N.M. $10,333 11N.Y. $14,463 3N.C. $7,757 38N.D. $14,634 2Ohio $8,689 24Okla. $7,723 39Ore. $10,002 13Pa. $8,917 22R.I. $9,979 14S.C. $7,988 34S.D. $7,644 40Tenn. $6,670 49Tex. $7,636 41Utah $7,488 43Vt. $11,176 5Va. $8,181 31Wash. $9,308 18W.Va. $8,897 23Wis. $8,361 30Wyo. $15,382 1D.C. $19,519 (1)
StateCollections per Capita Rank
TABLE 7.

Taxes & Tax Measures
State PropertyGeneral
SalesIndividual Income
Corporate Income
Other Taxes
(a)U.S. 31.1% 23.5% 23.5% 3.7% 18.2%Ala. 17.2% 29.9% 22.6% 3.5% 26.9%Alaska 57.2% 8.9% 0.0% 8.8% 25.1%Ariz. 29.8% 39.1% 15.8% 2.9% 12.4%Ark. 18.1% 37.0% 23.1% 4.1% 17.6%Calif. 24.8% 21.8% 34.1% 3.9% 15.3%Colo. 30.1% 26.3% 25.4% 2.7% 15.5%Conn. 38.4% 15.3% 30.8% 2.6% 12.9%Del. 18.0% 0.0% 26.6% 9.0% 46.4%Fla. 35.7% 34.2% 0.0% 3.2% 26.9%Ga. 32.0% 25.6% 27.0% 2.8% 12.7%Hawaii 17.6% 36.9% 22.8% 0.8% 21.8%Idaho 28.1% 25.8% 26.0% 3.8% 16.3%Ill. 36.4% 17.7% 21.6% 5.5% 18.9%Ind. 25.4% 28.7% 25.4% 3.6% 16.9%Iowa 33.0% 22.6% 24.1% 3.1% 17.2%Kans. 32.8% 31.5% 17.7% 3.6% 14.3%Ky. 20.7% 19.5% 32.1% 5.4% 22.3%La. 22.0% 38.5% 16.2% 1.4% 22.0%Maine 40.2% 18.9% 22.6% 2.5% 15.8%Md. 26.6% 12.6% 37.6% 2.9% 20.3%Mass. 35.6% 13.5% 33.6% 5.2% 12.1%Mich. 34.5% 23.2% 23.4% 3.0% 16.0%Minn. 25.8% 17.3% 31.8% 4.5% 20.6%Miss. 26.5% 31.2% 16.2% 4.9% 21.2%Mo. 27.2% 26.5% 28.1% 2.3% 15.9%Mont. 37.3% 0.0% 28.3% 4.0% 30.4%
Sources of State & Local Tax Collections, Percentage of Total from Each SourceFiscal Year 2015
TABLE 8.

Taxes & Tax Measures
Nebr. 37.5% 22.6% 23.4% 3.6% 12.9%Nev. 23.4% 39.7% 0.0% 0.0% 36.9%N.H. 65.7% 0.0% 1.6% 9.3% 23.4%N.J. 46.1% 15.3% 22.2% 4.3% 12.0%N.M. 18.6% 37.4% 16.0% 2.9% 25.2%N.Y. 30.9% 16.7% 32.0% 7.0% 13.4%N.C. 25.1% 24.9% 29.4% 3.5% 17.1%N.D. 13.3% 23.2% 7.7% 2.7% 53.1%Ohio 28.8% 27.6% 26.9% 0.5% 16.2%Okla. 18.3% 33.0% 22.5% 2.7% 23.5%Ore. 32.2% 0.0% 41.6% 4.0% 22.2%Pa. 29.9% 16.9% 25.8% 4.7% 22.7%R.I. 43.2% 16.8% 21.2% 3.1% 15.7%S.C. 33.0% 24.1% 22.3% 2.3% 18.4%S.D. 36.0% 40.5% 0.0% 0.1% 23.4%Tenn. 26.4% 40.7% 1.4% 6.5% 25.0%Tex. 42.0% 36.3% 0.0% 0.0% 21.7%Utah 26.9% 24.3% 29.1% 3.4% 16.3%Vt. 43.8% 10.4% 19.5% 3.1% 23.1%Va. 34.1% 13.7% 31.9% 2.2% 18.2%Wash. 29.6% 45.9% 0.0% 0.0% 24.5%W.Va. 21.7% 17.3% 25.6% 2.5% 32.9%Wis. 34.7% 19.6% 26.3% 3.8% 15.6%Wyo. 36.7% 28.0% 0.0% 0.0% 35.3%D.C. 31.7% 18.5% 26.3% 6.3% 17.2%
Sources of State & Local Tax Collections, Percentage of Total from Each SourceFiscal Year 2015
(a) “Other Taxes” include excise taxes (such as those on alcohol, tobacco, motor vehicles, utilities, and licenses), severance taxes, stock transfer taxes, estate and gift taxes, and other miscellaneous taxes.
Note: Percentages may not add to 100 due to rounding.
Source: Census Bureau; Tax Foundation calculations.
State PropertyGeneral
SalesIndividual Income
Corporate Income
Other Taxes
(a)
TABLE 8, Cont.

Taxes & Tax Measures
Federal Aid as a Percentage of State General RevenueFiscal Year 2015
Note: Figures are calculated by dividing each state’s “Intergovernmental Revenue” into its “General Revenue.” “General Revenue” includes all tax revenue but excludes utility revenue, liquor store revenue, and investment income from state pension funds. D.C. is included only in combined state-local data.
Source: Census Bureau; Tax Foundation calculations.
State
Fed. Aid as a Percentage of General Revenue Rank
U.S. 22.5%Ala. 35.1% 13Alaska 36.8% 10Ariz. 39.8% 3Ark. 35.9% 11Calif. 30.4% 35Colo. 27.0% 43Conn. 25.8% 45Del. 25.2% 46Fla. 32.7% 25Ga. 34.3% 17Hawaii 22.8% 48Idaho 32.5% 27Ill. 27.6% 40Ind. 33.3% 22Iowa 32.0% 28Kans. 24.1% 47Ky. 39.5% 4La. 42.2% 1Maine 34.3% 18Md. 30.8% 33Mass. 28.0% 39Mich. 34.0% 19Minn. 27.2% 42Miss. 42.1% 2Mo. 37.5% 9
Mont. 39.1% 6Nebr. 29.8% 37Nev. 30.3% 36N.H. 31.7% 31N.J. 28.6% 38N.M. 39.3% 5N.Y. 33.1% 23N.C. 31.8% 30N.D. 18.4% 50Ohio 35.7% 12Okla. 32.5% 26Ore. 39.1% 7Pa. 30.6% 34R.I. 32.9% 24S.C. 32.0% 29S.D. 35.1% 14Tenn. 38.0% 8Tex. 33.4% 21Utah 26.8% 44Vt. 35.0% 15Va. 21.5% 49Wash. 31.2% 32W.Va. 35.0% 16Wis. 27.5% 41Wyo. 33.5% 20
State
Fed. Aid as a Percentage of General Revenue Rank
TABLE 9.

Taxes & Tax Measures
Federal Income Tax Payments by Income PercentileCalendar Year 2015
Note: There are 141,204,625 total federal income tax filers. Total adjusted gross income (AGI) is $10,142,620,000,000. The top 1% of earners have AGI above $480,930; the top 5% have AGI above $195,778; the top 10% have AGI above $138,031; the top 25% have AGI above $79,655; and the top 50% have AGI above $39,275.
Source: Tax Foundation, “Summary of the Latest Federal Income Tax Data, 2017 Update”.
Income Percentile
Income Taxes Paid
($ millions)
Group's Share of Total AGI
Group's Share of Income Taxes
Average Income
Tax RateAll Taxpayers $1,454,325 100.0% 100.0% 14.3%Top 1% $567,697 20.7% 39.0% 27.1%Top 5% $866,447 36.1% 59.6% 23.7%Top 10% $1,026,601 47.4% 70.6% 21.4%Top 25% $1,259,698 69.0% 86.6% 18.0%Top 50% $1,413,200 88.7% 97.2% 15.7%Bottom 50% $41,125 11.3% 2.8% 3.6%
TABLE 10.
Taxes & Tax Measures
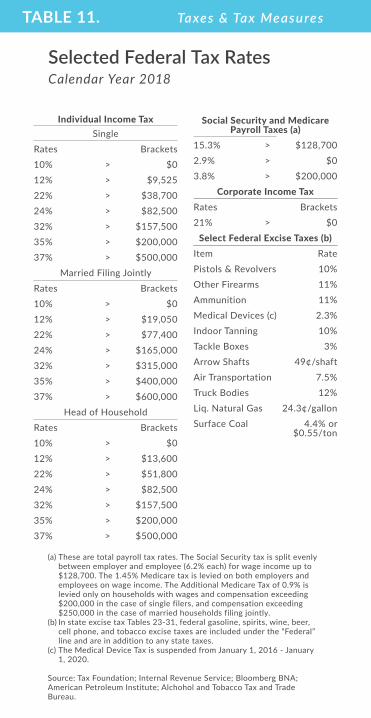
Selected Federal Tax RatesCalendar Year 2018
(a) These are total payroll tax rates. The Social Security tax is split evenly between employer and employee (6.2% each) for wage income up to $128,700. The 1.45% Medicare tax is levied on both employers and employees on wage income. The Additional Medicare Tax of 0.9% is levied only on households with wages and compensation exceeding $200,000 in the case of single filers, and compensation exceeding $250,000 in the case of married households filing jointly.
(b) In state excise tax Tables 23-31, federal gasoline, spirits, wine, beer, cell phone, and tobacco excise taxes are included under the “Federal” line and are in addition to any state taxes.
(c) The Medical Device Tax is suspended from January 1, 2016 - January 1, 2020.
Source: Tax Foundation; Internal Revenue Service; Bloomberg BNA; American Petroleum Institute; Alchohol and Tobacco Tax and Trade Bureau.
Individual Income TaxSingle
Rates Brackets10% > $012% > $9,52522% > $38,70024% > $82,50032% > $157,50035% > $200,00037% > $500,000
Married Filing JointlyRates Brackets10% > $012% > $19,05022% > $77,40024% > $165,00032% > $315,00035% > $400,00037% > $600,000
Head of HouseholdRates Brackets10% > $012% > $13,60022% > $51,80024% > $82,50032% > $157,50035% > $200,00037% > $500,000
Social Security and Medicare Payroll Taxes (a)
15.3% > $128,7002.9% > $03.8% > $200,000
Corporate Income TaxRates Brackets21% > $0
Select Federal Excise Taxes (b)Item RatePistols & Revolvers 10%Other Firearms 11%Ammunition 11%Medical Devices (c) 2.3%Indoor Tanning 10%Tackle Boxes 3%Arrow Shafts 49¢/shaftAir Transportation 7.5%Truck Bodies 12%Liq. Natural Gas 24.3¢/gallonSurface Coal 4.4% or
$0.55/ton
TABLE 11.

Indiv idual Income Taxes
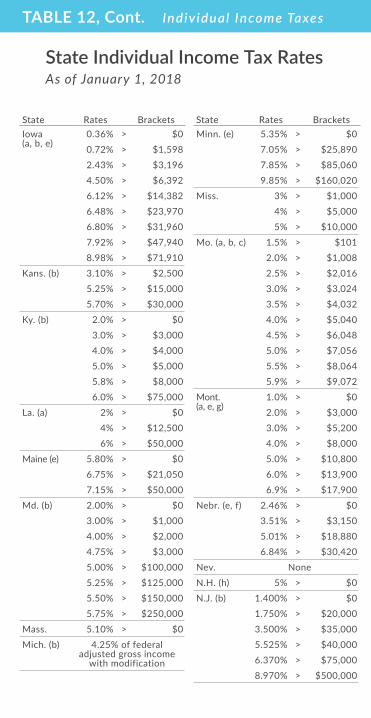
State Individual Income Tax RatesAs of January 1, 2018
State Rates BracketsAla. (a, b) 2% > $0
4% > $500 5% > $3,000
Alaska NoneAriz. (c) 2.59% > $0
2.88% > $10,346 3.36% > $25,861 4.24% > $51,721 4.54% > $155,159
Ark. (c, d, e, f)
0.9% > $0 2.5% > $4,299 3.5% > $8,399 4.5% > $12,599 6.0% > $20,999 6.9% > $35,099
Calif. (c, e, g)
1.0% > $0 2.0% > $8,223 3.0% > $19,495 4.0% > $30,769 8.0% > $42,711 9.3% > $53,980
10.3% > $275,738 11.3% > $330,884 12.3% > $551,473 13.3% > $1,000,000
Colo. 4.63% of federal taxable income
Conn. (f) 3.00% > $0 5.00% > $10,000 5.50% > $50,000 6.00% > $100,000 6.50% > $200,000 6.90% > $250,000 6.99% > $500,000
Del. (b) 2.20% > $2,000 3.90% > $5,000 4.80% > $10,000 5.20% > $20,000 5.55% > $25,000 6.60% > $60,000
Fla. NoneGa. 1% > $0
2% > $750 3% > $2,250 4% > $3,750 5% > $5,250 6% > $7,000
Hawaii 1.40% > $0 3.20% > $2,400 5.50% > $4,800 6.40% > $9,600 6.80% > $14,400 7.20% > $19,200 7.60% > $24,000 7.90% > $36,000 8.25% > $48,000 9.00% > $150,000
10.00% > $175,000 11.00% > $200,000
Idaho (c, e, g)
1.6% > $0 3.6% > $1,472 4.1% > $2,945 5.1% > $4,417 6.1% > $5,890 7.1% > $7,362 7.4% > $11,043
Ill. 4.95% of federal adjusted gross income
with modificationsInd. (b) 3.23% of federal
adjusted gross income with modifications
State Rates Brackets
TABLE 12.
Indiv idual Income Taxes
Iowa (a, b, e)
0.36% > $0 0.72% > $1,598 2.43% > $3,196 4.50% > $6,392 6.12% > $14,382 6.48% > $23,970 6.80% > $31,960 7.92% > $47,940 8.98% > $71,910
Kans. (b) 3.10% > $2,500 5.25% > $15,000 5.70% > $30,000
Ky. (b) 2.0% > $0 3.0% > $3,000 4.0% > $4,000 5.0% > $5,000 5.8% > $8,000 6.0% > $75,000
La. (a) 2% > $0 4% > $12,500 6% > $50,000
Maine (e) 5.80% > $0 6.75% > $21,050 7.15% > $50,000
Md. (b) 2.00% > $0 3.00% > $1,000 4.00% > $2,000 4.75% > $3,000 5.00% > $100,000 5.25% > $125,000 5.50% > $150,000 5.75% > $250,000
Mass. 5.10% > $0Mich. (b) 4.25% of federal
adjusted gross income with modification
Minn. (e) 5.35% > $0 7.05% > $25,890 7.85% > $85,060 9.85% > $160,020
Miss. 3% > $1,000 4% > $5,000 5% > $10,000
Mo. (a, b, c) 1.5% > $101 2.0% > $1,008 2.5% > $2,016 3.0% > $3,024 3.5% > $4,032 4.0% > $5,040 4.5% > $6,048 5.0% > $7,056 5.5% > $8,064 5.9% > $9,072
Mont. (a, e, g)
1.0% > $0 2.0% > $3,000 3.0% > $5,200 4.0% > $8,000 5.0% > $10,800 6.0% > $13,900 6.9% > $17,900
Nebr. (e, f) 2.46% > $0 3.51% > $3,150 5.01% > $18,880 6.84% > $30,420
Nev. NoneN.H. (h) 5% > $0 N.J. (b) 1.400% > $0
1.750% > $20,000 3.500% > $35,000 5.525% > $40,000 6.370% > $75,000 8.970% > $500,000
State Rates Brackets State Rates Brackets
TABLE 12, Cont.
State Individual Income Tax RatesAs of January 1, 2018

Indiv idual Income Taxes
N.M. 1.7% > $0 3.2% > $5,500 4.7% > $11,000 4.9% > $16,000
N.Y. (b, f) 4.00% > $0 4.50% > $8,500 5.25% > $11,700 5.90% > $13,900 6.45% > $21,400 6.65% > $80,650 6.85% > $215,400 8.82% > $1,077,550
N.C. 5.499% > $0N.D. (c, e) 1.10% > $0
2.04% > $38,700 2.27% > $93,700 2.64% > $195,450 2.90% > $424,950
Ohio (b, c, e, g)
1.980% > $10,650 2.746% > $16,000 2.969% > $21,350 3.465% > $42,650 3.960% > $85,300 4.597% > $106,650 4.997% > $213,350
Okla. 0.5% > $0 1.0% > $1,000 2.0% > $2,500 3.0% > $3,750 4.0% > $4,900 5.0% > $7,200
Ore. (a, e, b) 5.0% > $0 7.0% > $3,400 9.0% > $8,500 9.9% > $125,000
Pa. (b) 3.07% > $0
R.I. (e) 3.75% > $0 4.75% > $62,550 5.99% > $149,150
S.C. (e) 3% > $2,930 4% > $5,860 5% > $8,790 6% > $11,720 7% > $14,650
S.D. NoneTenn. (h) 3% > $0 Tex. NoneUtah 5% > $0 Vt. (c, e) 3.55% > $0
6.80% > $37,9007.80% > $91,8508.80% > $191,6508.95% > $416,650
Va. 2.00% > $0 3.00% > $3,000 5.00% > $5,000 5.75% > $17,000
Wash. NoneW.Va. 3.0% > $0
4.0% > $10,000 4.5% > $25,000 6.0% > $40,000 6.5% > $60,000
Wis. (c, e) 4.00% > $0 5.84% > $11,230 6.27% > $22,470 7.65% > $247,350
State Rates Brackets State Rates Brackets
TABLE 12, Cont.
State Individual Income Tax RatesAs of January 1, 2018

Indiv idual Income Taxes
(a) These states allow some or all of federal income tax paid to be deducted from state taxable income.
(b) Local income taxes are excluded. Fourteen states have county- or city-level income taxes; the average rate within each jurisdiction is: 0.5% in Alabama; 0.63% in Delaware; 1.56% in Indiana; 0.45% in Iowa; <0.01% in Kansas; 2.08% in Kentucky; 2.89% in Maryland; 1.70% in Michigan; 0.5% in Missouri; 0.50% in New Jersey; 1.94% in New York; 2.25% in Ohio; 0.37% in Oregon; and 2.95% in Pennsylvania. Weighted local rates are from the Tax Foundation, 2018 State Business Tax Climate Index.
(c) 2017 brackets due to data availability. (d) Rates apply to individuals earning more than $75,000. Two special tax
tables exist for low- and middle-income individuals: one for individuals below $21,000 in income, and one for those between $21,000 and $75,000. Additionally, those between $75,000 and $80,000 in income receive a small bracket adjustment.
(e) Bracket levels are adjusted for inflation each year.(f) Arkansas, Connecticut, Nebraska, and New York have “tax benefit
recapture,” by which many high-income taxpayers pay their top tax rate on all income, not just on amounts above the bracket threshold.
(g) Laws in California, Idaho, Montana, and Ohio prevent revenue officials from inflation indexing brackets until midyear.
(h) Tax applies to interest and dividend income only. Note: Brackets are for single taxpayers. Some states double bracket widths for joint filers (Ala., Ariz, Conn., Hawaii, Idaho, Kans., La., Maine, Nebr., Ore.). New York doubles all except the 6.85% bracket, which is effective at $300,000. California doubles all but the top bracket. Some states increase but do not double brackets for joint filers (Ga., Minn., N.M., N.C., N.D., Okla., R.I., Vt., Wis.). Maryland decreases some and increases others. New Jersey adds a 2.45% rate and doubles some bracket widths. Consult the Tax Foundation website for tables for joint filers.
Source: Tax Foundation; state tax statutes, forms, and instructions; Bloomberg BNA.
Wyo. NoneD.C. 4.00% > $0
6.00% > $10,000 6.50% > $40,000 8.50% > $60,000 8.75% > $350,000 8.95% > $1,000,000
State Rates Brackets
TABLE 12, Cont.
State Individual Income Tax RatesAs of January 1, 2018

Indiv idual Income Taxes
State Individual Income Tax Collections per CapitaFiscal Year 2016
(a) State has no individual income tax.(b) State does not tax wage income but does tax interest and dividend
income. Note: D.C. is included only in combined state and local data. See Table 43 for average people per household by state.
Source: Census Bureau; Tax Foundation calculations.
StateCollections per Capita Rank
U.S. $1,068Ala. $719 35Alaska (a) $0 --Ariz. $574 40Ark. $931 29Calif. $2,055 4Colo. $1,173 14Conn. $2,106 3Del. $1,168 17Fla. (a) $0 --Ga. $1,012 23Hawaii $1,481 8Idaho $905 30Ill. $1,076 22Ind. $787 31Iowa $1,135 20Kans. $768 33Ky. $965 26La. $612 38Maine $1,166 18Md. $1,414 10Mass. $2,115 2Mich. $937 27Minn. $1,943 5Miss. $603 39Mo. $989 25
Mont. $1,137 19Nebr. $1,177 13Nev. (a) $0 --N.H. (b) $66 42N.J. $1,488 7N.M. $676 37N.Y. $2,345 1N.C. $1,186 12N.D. $465 41Ohio $703 36Okla. $764 34Ore. $1,882 6Pa. $933 28R.I. $1,169 16S.C. $780 32S.D. (a) $0 --Tenn. (b) $49 43Tex. (a) $0 --Utah $1,108 21Vt. $1,171 15Va. $1,454 9Wash. (a) $0 --W.Va. $1,009 24Wis. $1,297 11Wyo. (a) $0 --
StateCollections per Capita Rank
TABLE 13.

Indiv idual Income Taxes
State & Local Individual Income Tax Collections per CapitaFiscal Year 2015
(a) State has no individual income tax.(b) State does not tax wage income but does tax interest and dividend
income. Note: D.C. is included only in combined state and local data. See Table 43 for average people per household by state.
Source: Census Bureau; Tax Foundation calculations.
StateCollections per Capita Rank
U.S. $1,144Ala. $709 36Alaska (a) $0 --Ariz. $551 41Ark. $895 31Calif. $1,991 5Colo. $1,168 18Conn. $2,279 2Del. $1,267 12Fla. (a) $0 --Ga. $947 29Hawaii $1,389 10Idaho $893 32Ill. $1,237 13Ind. $975 28Iowa $1,145 21Kans. $778 34Ky. $1,215 15La. $639 39Maine $1,153 19Md. $2,200 3Mass. $2,133 4Mich. $938 30Minn. $1,900 6Miss. $596 40Mo. $1,025 27
Mont. $1,143 22Nebr. $1,181 17Nev. (a) $0 --N.H. (b) $72 42N.J. $1,479 8N.M. $662 38N.Y. $2,789 1N.C. $1,115 24N.D. $709 37Ohio $1,186 16Okla. $832 33Ore. $1,814 7Pa. $1,276 11R.I. $1,151 20S.C. $764 35S.D. (a) $0 --Tenn. (b) $46 43Tex. (a) $0 --Utah $1,054 25Vt. $1,133 23Va. $1,420 9Wash. (a) $0 --W.Va. $1,048 26Wis. $1,225 14Wyo. (a) $0 --D.C. $2,780 (2)
StateCollections per Capita Rank
TABLE 14.

Corporate Income Taxes
State Corporate Income Tax RatesAs of January 1, 2018
State Rates BracketsAla. 6.5% > $0 Alaska 0.0% > $0
2.0% > $25,000 3.0% > $49,000 4.0% > $74,000 5.0% > $99,000 6.0% > $124,000 7.0% > $148,000 8.0% > $173,000 9.0% > $198,000 9.4% > $222,000
Ariz. 4.9% > $0 Ark. 1.0% > $0
2.0% > $3,000 3.0% > $6,000 5.0% > $11,000 6.0% > $25,000 6.5% > $100,000
Calif. 8.84% > $0 Colo. 4.63% > $0 Conn. (a) 8.25% > $0 Del. (b) 8.7% > $0 Fla. 5.5% > $0 Ga. 6% > $0 Hawaii 4.4% > $0
5.4% > $25,000 6.4% > $100,000
Idaho 7.4% > $0 Ill. (c) 9.5% > $0 Ind. (d) 6% > $0 Iowa 6% > $0
8% > $25,000 10% > $100,000 12% > $250,000
Kans. 4% > $0 7% > $50,000
Ky. 4% > $0 5% > $50,000 6% > $100,000
La. 4% > $0 5% > $25,000 6% > $50,000 7% > $100,000 8% > $200,000
Maine 3.50% > $0 7.93% > $25,000 8.33% > $75,000 8.93% > $250,000
Md. 8.25% > $0 Mass. 8% > $0 Mich. 6% > $0 Minn. 9.8% > $0 Miss. 3% > $0
4% > $5,000 5% > $10,000
Mo. 6.25% > $0 Mont. 6.75% > $0 Nebr. 5.58% > $0
7.81% > $100,000
Nev. (b)N.H. 8.2% > $0 N.J. (e) 9.0% > $100,000 N.M. 4.8% > $0
5.9% > $500,000 N.Y. 6.5% > $0 N.C. 3.0% > $0 N.D. 1.41% > $0
3.55% > $25,000 4.31% > $50,000
Ohio (b)Okla. 6% > $0
State Rates Brackets
TABLE 15.

Corporate Income Taxes
Ore. 6.6% > $0 7.6% > $1,000,000
Pa. 9.99% > $0 R.I. 7% > $0 S.C. 5% > $0 S.D. NoneTenn. 6.5% > $0 Texas (b)Utah 5% > $0 Vt. 6.0% > $0
7.0% > $10,000 8.5% > $25,000
State Rates Brackets
(a) Rate includes a 10% surtax, which effectively increases the rate from 7.5% to 8.25%. Surtax is required by businesses with at least $100 million annual gross income.
(b) Nevada, Ohio, Texas, and Washington do not have a corporate income tax but do have a gross receipts tax with rates not strictly comparable to corporate income tax rates. See Table 18 for more information. Delaware and Virginia have gross receipts taxes in addition to corporate income taxes.
(c) Illinois’ rate includes two separate corporate income taxes, one at a 7.0% rate and one at a 2.5% rate.
(d) The tax rate in Indiana will decrease to 5.75% on July 1, 2018.(e) Corporations with entire net income greater than $100,000 pay 9%
on all taxable income, companies with entire net income greater than $50,000 and less than or equal to $100,000 pay 7.5% on all taxable income, and companies with entire net income less than or equal to $50,000 pay 6.5% on all taxable income.
Note: In addition to regular income taxes, many states impose other taxes on corporations such as gross receipts taxes (Table 18) and capitol stock taxes (Table 36). Some states also impose an alternative minimum tax and special rates on financial institutions.
Source: Tax Foundation; state tax statutes, forms, and instructions; Bloomberg BNA.
Va. (b) 6% > $0 Wash. (b)W.Va. 6.5% > $0 Wis. 7.9% > $0 Wyo. NoneD.C. 9% > $0
State Rates Brackets
TABLE 15, Cont.
State Corporate Income Tax RatesAs of January 1, 2018

Corporate Income Taxes
State Corporate Income Tax Collections per CapitaFiscal Year 2016
(a) No corporate income tax. May include special taxes on financial corporations.
(b) The Census Bureau does not classify revenue from gross receipts taxes such as those in Delaware, Nevada, Ohio, Texas, Virginia, and Washington as corporate tax revenue. See Table 18 for gross receipts taxes.
Note: D.C., not listed, is included only in combined state and local data. See Table 43 for people per household by state.
Source: Census Bureau; Tax Foundation calculations.
StateCollections per Capita Rank
U.S. $145Ala. $77 40Alaska $286 4Ariz. $83 38Ark. $151 19Calif. $252 7Colo. $113 27Conn. $201 11Del. (b) $334 3Fla. $110 29Ga. $95 33Hawaii $76 41Idaho $112 28Ill. $262 6Ind. $156 17Iowa $120 25Kans. $135 24Ky. $137 21La. $37 45Maine $103 32Md. $187 13Mass. $342 2Mich. $90 34Minn. $274 5Miss. $155 18Mo. $54 43
Mont. $115 26Nebr. $161 15Nev. (a, b) $0 --N.H. $525 1N.J. $248 8N.M. $55 42N.Y. $211 10N.C. $105 31N.D. $136 22Ohio (a, b) $3 --Okla. $84 37Ore. $149 20Pa. $192 12R.I. $136 23S.C. $89 36S.D. (a) $38 44Tenn. $231 9Tex. (a, b) $0 --Utah $110 30Vt. $158 16Va. (b) $89 35Wash. (a, b) $0 --W.Va. $79 39Wis. $171 14Wyo. (a) $0 --
StateCollections per Capita Rank
TABLE 16.
Corporate Income Taxes
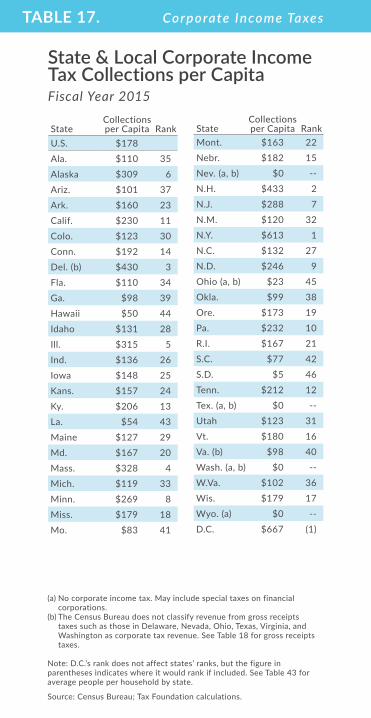
State & Local Corporate Income Tax Collections per CapitaFiscal Year 2015
(a) No corporate income tax. May include special taxes on financial corporations.
(b) The Census Bureau does not classify revenue from gross receipts taxes such as those in Delaware, Nevada, Ohio, Texas, Virginia, and Washington as corporate tax revenue. See Table 18 for gross receipts taxes.
Note: D.C.’s rank does not affect states’ ranks, but the figure in parentheses indicates where it would rank if included. See Table 43 for average people per household by state.
Source: Census Bureau; Tax Foundation calculations.
StateCollections per Capita Rank
U.S. $178Ala. $110 35Alaska $309 6Ariz. $101 37Ark. $160 23Calif. $230 11Colo. $123 30Conn. $192 14Del. (b) $430 3Fla. $110 34Ga. $98 39Hawaii $50 44Idaho $131 28Ill. $315 5Ind. $136 26Iowa $148 25Kans. $157 24Ky. $206 13La. $54 43Maine $127 29Md. $167 20Mass. $328 4Mich. $119 33Minn. $269 8Miss. $179 18Mo. $83 41
Mont. $163 22Nebr. $182 15Nev. (a, b) $0 --N.H. $433 2N.J. $288 7N.M. $120 32N.Y. $613 1N.C. $132 27N.D. $246 9Ohio (a, b) $23 45Okla. $99 38Ore. $173 19Pa. $232 10R.I. $167 21S.C. $77 42S.D. $5 46Tenn. $212 12Tex. (a, b) $0 --Utah $123 31Vt. $180 16Va. (b) $98 40Wash. (a, b) $0 --W.Va. $102 36Wis. $179 17Wyo. (a) $0 --D.C. $667 (1)
StateCollections per Capita Rank
TABLE 17.

Corporate Income Taxes
State Gross Receipts TaxesAs of January 1, 2018
(a) Virginia’s tax is locally levied and rates vary by business and jurisdiction. Approximately half of the counties do not levy the tax. Some counties instead levy a capital stock tax.
Note: Gross receipts taxes are complex business taxes imposed at a low rate but on a wide base of transactions, resulting in high effective tax rates that can vary by industry. These taxes also often have minimum taxes that can result in much higher effective rates for some small businesses.
Source: Bloomberg BNA; state revenue departments; Weldon Cooper Center for Public Service.
State Name of Tax Range of RatesDel. Manufacturers' & Merchants'
License Tax0.0945% - 0.7468%
Nev. Commerce Tax 0.051% - 0.331%Ohio Commercial Activities Tax (CAT) 0.26%Tex. Margin Tax 0.375% - 3.75%Va. (a) Business/Professional/
Occupational License Tax (BPOL)0.02% - 0.58%
Wash. Business & Occupation Tax (B&O) 0.13% - 3.3%
TABLE 18.

Sales Taxes
StateState Tax
Rate Rank
Avg. Local Tax Rate (a)
Combined Rate Rank
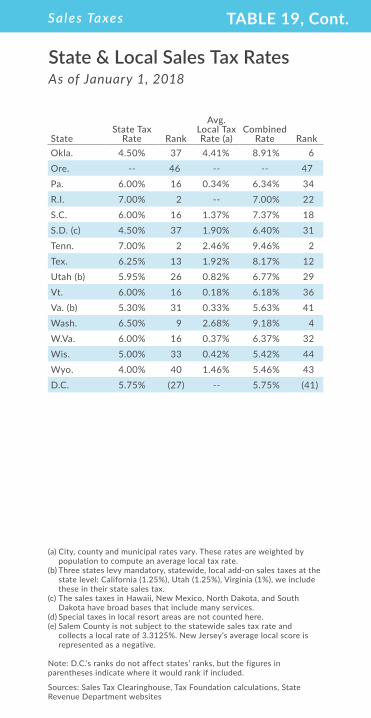
Ala. 4.00% 40 5.10% 9.10% 5Alaska -- 46 1.76% 1.76% 46Ariz. 5.60% 28 2.73% 8.33% 11Ark. 6.50% 9 2.91% 9.41% 3Calif. (b) 7.25% 1 1.29% 8.54% 9Colo. 2.90% 45 4.62% 7.52% 16Conn. 6.35% 12 -- 6.35% 33Del. -- 46 -- -- 47Fla. 6.00% 16 0.80% 6.80% 28Ga. 4.00% 40 3.15% 7.15% 20Hawaii (c) 4.00% 40 0.35% 4.35% 45Idaho 6.00% 16 0.03% 6.03% 37Ill. 6.25% 13 2.45% 8.70% 7Ind. 7.00% 2 -- 7.00% 22Iowa 6.00% 16 0.80% 6.80% 27Kans. 6.50% 9 2.18% 8.68% 8Ky. 6.00% 16 -- 6.00% 38La. 5.00% 33 5.02% 10.02% 1Maine 5.50% 29 -- 5.50% 42Md. 6.00% 16 -- 6.00% 38Mass. 6.25% 13 -- 6.25% 35Mich. 6.00% 16 -- 6.00% 38Minn. 6.875% 6 0.55% 7.42% 17Miss. 7.00% 2 0.07% 7.07% 21Mo. 4.225% 39 3.80% 8.03% 14Mont. (d) -- 46 -- -- 47Nebr. 5.50% 29 1.39% 6.89% 25Nev. 6.85% 7 1.29% 8.14% 13N.H. -- 46 -- -- 47N.J. (e) 6.625% 8 -0.03% 6.60% 30N.M. (c) 5.125% 32 2.54% 7.66% 15N.Y. 4.00% 40 4.49% 8.49% 10N.C. 4.75% 36 2.20% 6.95% 24N.D. (c) 5.00% 33 1.80% 6.80% 26Ohio 5.75% 27 1.40% 7.15% 19
State & Local Sales Tax RatesAs of January 1, 2018
TABLE 19.
Sales Taxes
Okla. 4.50% 37 4.41% 8.91% 6Ore. -- 46 -- -- 47Pa. 6.00% 16 0.34% 6.34% 34R.I. 7.00% 2 -- 7.00% 22S.C. 6.00% 16 1.37% 7.37% 18S.D. (c) 4.50% 37 1.90% 6.40% 31Tenn. 7.00% 2 2.46% 9.46% 2Tex. 6.25% 13 1.92% 8.17% 12Utah (b) 5.95% 26 0.82% 6.77% 29Vt. 6.00% 16 0.18% 6.18% 36Va. (b) 5.30% 31 0.33% 5.63% 41Wash. 6.50% 9 2.68% 9.18% 4W.Va. 6.00% 16 0.37% 6.37% 32Wis. 5.00% 33 0.42% 5.42% 44Wyo. 4.00% 40 1.46% 5.46% 43D.C. 5.75% (27) -- 5.75% (41)
State & Local Sales Tax RatesAs of January 1, 2018
(a) City, county and municipal rates vary. These rates are weighted by population to compute an average local tax rate.
(b) Three states levy mandatory, statewide, local add-on sales taxes at the state level: California (1.25%), Utah (1.25%), Virginia (1%), we include these in their state sales tax.
(c) The sales taxes in Hawaii, New Mexico, North Dakota, and South Dakota have broad bases that include many services.
(d) Special taxes in local resort areas are not counted here.(e) Salem County is not subject to the statewide sales tax rate and
collects a local rate of 3.3125%. New Jersey’s average local score is represented as a negative.
Note: D.C.’s ranks do not affect states’ ranks, but the figures in parentheses indicate where it would rank if included.
Sources: Sales Tax Clearinghouse, Tax Foundation calculations, State Revenue Department websites
StateState Tax
Rate Rank
Avg. Local Tax Rate (a)
Combined Rate Rank
TABLE 19, Cont.

Sales Taxes
State General Sales Tax Collections per CapitaFiscal Year 2016
(a) No state-level general sales tax. (b) The sales taxes in Hawaii, New Mexico, North Dakota, and South
Dakota have broad bases that include many services, so figures are not strictly comparable to other states.
Note: Some states levy gross receipts taxes in addition to sales taxes, which the Census Bureau includes in sales tax collections data. D.C. is included only in state-local combined data. See Table 18 for information on gross receipts taxes. See Table 43 for average people per household by state.
Source: Census Bureau; Tax Foundation calculations.
StateCollections per Capita Rank
U.S. $898Ala. $534 42Alaska (a) $0 --Ariz. $964 22Ark. $1,109 8Calif. $997 21Colo. $514 44Conn. $1,046 15Del. (a) $0 --Fla. $1,079 12Ga. $531 43Hawaii (b) $2,244 1Idaho $928 24Ill. $707 33Ind. $1,101 10Iowa $1,010 19Kans. $1,114 7Ky. $781 30La. $680 37Maine $1,022 17Md. $748 31Mass. $892 27Mich. $922 25Minn. $1,011 18Miss. $1,105 9Mo. $581 41
Mont. (a) $0 --Nebr. $935 23Nev. $1,451 3N.H. (a) $0 --N.J. $1,032 16N.M. (b) $1,000 20N.Y. $682 36N.C. $708 32N.D. (b) $1,346 4Ohio $1,052 14Okla. $630 39Ore. (a) $0 --Pa. $799 29R.I. $921 26S.C. $659 38S.D. (b) $1,124 6Tenn. $1,054 13Tex. $1,151 5Utah $684 35Vt. $596 40Va. $467 45Wash. $1,862 2W.Va. $704 34Wis. $876 28Wyo. $1,097 11
StateCollections per Capita Rank
TABLE 20.

Sales Taxes
State & Local General Sales Tax Collections per CapitaFiscal Year 2015
Note: Some states levy gross receipts taxes in addition to sales taxes, which the Census Bureau includes in collections data. D.C.’s rank does not affect states’ ranks, but the figure in parentheses indicates where it would rank if included. See Table 18 for information on gross receipts taxes. See Table 43 for average people per household by state.
Source: Census Bureau; Tax Foundation calculations.
StateCollections per Capita Rank
U.S. $1,146Ala. $938 32Alaska $313 47Ariz. $1,359 13Ark. $1,433 11Calif. $1,276 15Colo. $1,208 18Conn. $1,137 23Del. $0 --Fla. $1,178 19Ga. $900 36Hawaii $2,247 1Idaho $896 37Ill. $1,015 28Ind. $1,100 24Iowa $1,075 25Kans. $1,381 12Ky. $738 42La. $1,521 8Maine $965 30Md. $734 43Mass. $854 39Mich. $928 33Minn. $1,026 26Miss. $1,144 21Mo. $966 29
Mont. $0 --Nebr. $1,139 22Nev. $1,629 5N.H. $0 --N.J. $1,021 27N.M. $1,554 6N.Y. $1,457 10N.C. $942 31N.D. $2,129 3Ohio $1,219 17Okla. $1,221 16Ore. $0 --Pa. $838 40R.I. $908 35S.C. $825 41S.D. $1,553 7Tenn. $1,330 14Tex. $1,495 9Utah $880 38Vt. $605 46Va. $609 45Wash. $2,187 2W.Va. $710 44Wis. $915 34Wyo. $1,791 4D.C. $1,958 (4)
StateCollections per Capita Rank
TABLE 21.

Sales Taxes
State Sales Tax BreadthFiscal Year 2016
(a) The sales taxes in Hawaii, New Mexico, North Dakota, and South Dakota have broad bases that include many business-to-business services.
Note: Sales tax breadth is defined as the ratio of the implicit sales tax base to state personal income.
Source: Professor John Mikesell (Indiana University).
StateSales Tax Breadth Rank
Ala. 36% 23Alaska -- --Ariz. 40% 11Ark. 43% 8Calif. 27% 35Colo. 34% 30Conn. 23% 42Del. -- --Fla. 39% 14Ga. 32% 31Hawaii (a) 107% 1Idaho 39% 13Ill. 23% 44Ind. 38% 17Iowa 36% 22Kans. 35% 26Ky. 38% 18La. 39% 16Maine 42% 9Md. 26% 38Mass. 22% 45Mich. 42% 10Minn. 36% 21Miss. 44% 7Mo. 31% 32
Mont. -- --Nebr. 34% 29Nev. 49% 6N.H. -- --N.J. 24% 41N.M. (a) 54% 4N.Y. 27% 36N.C. 36% 25N.D. (a) 54% 3Ohio 35% 27Okla. 31% 33Ore. -- --Pa. 26% 37R.I. 26% 39S.C. 28% 34S.D. (a) 64% 2Tenn. 35% 28Tex. 40% 12Utah 36% 24Vt. 25% 40Va. 23% 43Wash. 39% 15W.Va. 36% 20Wis. 37% 19Wyo. 50% 5
StateSales Tax Breadth Rank
TABLE 22.

Excise Taxes
State Excise TaxOther Taxes
and Fees Total RankFederal 18.40¢Ala. 18.00¢ 2.91¢ 20.91¢ 41Alaska 8.95¢ 3.35¢ 12.30¢ 50Ariz. 18.00¢ 1.00¢ 19.00¢ 45Ark. 21.50¢ 0.30¢ 21.80¢ 40Calif. 41.70¢ 11.79¢ 53.49¢ 2Colo. 22.00¢ 0.00¢ 22.00¢ 39Conn. 25.00¢ 14.30¢ 39.30¢ 9Del. 23.00¢ 0.00¢ 23.00¢ 36Fla. 4.00¢ 37.59¢ 41.59¢ 8Ga. 26.80¢ 4.79¢ 31.59¢ 21Hawaii 17.00¢ 29.03¢ 46.03¢ 4Idaho 32.00¢ 1.00¢ 33.00¢ 18Ill. 19.00¢ 16.22¢ 35.22¢ 14Ind. 28.00¢ 13.90¢ 41.90¢ 7Iowa 30.50¢ 0.00¢ 30.50¢ 23Kans. 24.00¢ 0.03¢ 24.03¢ 33Ky. 24.60¢ 1.40¢ 26.00¢ 31La. 20.00¢ 0.01¢ 20.01¢ 43Maine 30.00¢ 0.01¢ 30.01¢ 24Md. 25.50¢ 8.30¢ 33.80¢ 16Mass. 24.00¢ 2.54¢ 26.54¢ 30Mich. 26.30¢ 16.08¢ 42.38¢ 6Minn. 28.50¢ 0.10¢ 28.60¢ 28Miss. 18.00¢ 0.79¢ 18.79¢ 47Mo. 17.00¢ 0.35¢ 17.35¢ 48Mont. 31.50¢ 0.75¢ 32.25¢ 20Nebr. 28.40¢ 0.90¢ 29.30¢ 27Nev. 23.00¢ 10.52¢ 33.52¢ 17N.H. 22.20¢ 1.63¢ 23.83¢ 35N.J. 10.50¢ 26.60¢ 37.10¢ 10N.M. 17.00¢ 1.88¢ 18.88¢ 46N.Y. 8.05¢ 36.25¢ 44.30¢ 5N.C. 35.10¢ 0.25¢ 35.35¢ 13
State Gasoline Tax Rates (Cents per Gallon)As of January 1, 2018
TABLE 23.

Excise Taxes
N.D. 23.00¢ 0.00¢ 23.00¢ 36Ohio 28.00¢ 0.01¢ 28.01¢ 29Okla. 16.00¢ 1.00¢ 17.00¢ 49Ore. 34.00¢ 2.77¢ 36.77¢ 11Pa. 0.00¢ 58.70¢ 58.70¢ 1R.I. 33.00¢ 1.00¢ 34.00¢ 15S.C. 20.00¢ 0.75¢ 20.75¢ 42S.D. 28.00¢ 2.00¢ 30.00¢ 25Tenn. 24.00¢ 1.40¢ 25.40¢ 32Tex. 20.00¢ 0.00¢ 20.00¢ 44Utah 29.40¢ 0.01¢ 29.41¢ 26Vt. 12.10¢ 18.62¢ 30.72¢ 22Va. 19.90¢ 2.50¢ 22.40¢ 38Wash. 49.40¢ 0.00¢ 49.40¢ 3W.Va. 20.50¢ 15.20¢ 35.70¢ 12Wis. 30.90¢ 2.00¢ 32.90¢ 19Wyo. 23.00¢ 1.00¢ 24.00¢ 34D.C. 23.50¢ 0.00¢ 23.50¢ (32)
State Gasoline Tax Rates (Cents per Gallon)As of January 1, 2018
Note: The American Petroleum Institute (API) has developed a methodology for determining the average tax rate on a gallon of fuel. Rates may include any of the following: excise taxes, environmental fees, storage tank taxes, other fees or taxes, and general sales tax. In states where gasoline is subject to the general sales tax, or where the fuel tax is based on the average sale price, the average rate determined by API is sensitive to changes in the price of gasoline. States that fully or partially apply general sales taxes to gasoline are California, Connecticut, Georgia, Illinois, Indiana, Michigan, and New York. D.C.’s rank does not affect states’ ranks, but the figure in parentheses indicates where it would rank if included.
Source: American Petroleum Institute.
State Excise TaxOther Taxes
and Fees Total Rank
TABLE 23, Cont.

Excise Taxes
State
Gasoline & License
Taxes RankTolls & User
Fees
Total: Tolls, User Fees, & User Taxes Rank
U.S. 41.7% 10.2% 52.0%Ala. 36.6% 30 0.5% 37.1% 40Alaska 7.9% 50 5.3% 13.2% 50Ariz. 44.2% 18 1.0% 45.2% 27Ark. 36.6% 30 0.5% 37.0% 42Calif. 58.2% 4 4.5% 62.7% 8Colo. 44.5% 16 6.8% 51.3% 18Conn. 37.0% 29 0.1% 37.1% 40Del. 26.7% 45 45.6% 72.3% 1Fla. 48.4% 8 18.4% 66.8% 3Ga. 42.0% 19 0.4% 42.5% 30Hawaii 63.1% 2 0.9% 64.0% 6Idaho 46.3% 12 3.7% 50.1% 20Ill. 33.3% 38 13.1% 46.4% 25Ind. 42.0% 19 0.2% 42.2% 32Iowa 44.3% 17 0.4% 44.7% 28Kans. 36.4% 33 5.9% 42.3% 31Ky. 35.7% 35 0.2% 35.9% 43La. 30.2% 42 2.2% 32.4% 45Maine 37.3% 26 14.5% 51.8% 17Md. 41.0% 21 21.2% 62.3% 9Mass. 32.3% 41 15.7% 48.0% 22Mich. 55.5% 6 4.4% 60.0% 11Minn. 36.5% 32 2.8% 39.3% 37Miss. 37.2% 28 1.0% 38.2% 39Mo. 40.4% 23 0.8% 41.1% 33Mont. 40.6% 22 2.6% 43.2% 29Nebr. 37.3% 26 2.5% 39.7% 36Nev. 44.9% 15 0.9% 45.8% 26N.H. 35.8% 34 12.2% 48.0% 22N.J. 25.6% 47 43.4% 69.0% 2N.M. 32.5% 40 1.1% 33.6% 44N.Y. 28.1% 44 35.5% 63.6% 7
Share of State & Local Road Spending Covered by State & Local Tolls, User Fees, & User TaxesFiscal Year 2015
TABLE 24.

Excise Taxes
N.C. 64.3% 1 0.3% 64.6% 4N.D. 21.2% 48 1.7% 22.9% 48Ohio 46.6% 9 5.4% 52.0% 16Okla. 46.2% 13 9.7% 55.9% 14Ore. 60.8% 3 3.8% 64.6% 4Pa. 39.1% 24 11.6% 50.8% 19R.I. 32.8% 39 8.3% 41.1% 33S.C. 52.1% 7 3.8% 55.9% 14S.D. 26.3% 46 1.0% 27.3% 47Tenn. 58.2% 4 0.1% 58.3% 12Tex. 46.6% 9 14.2% 60.7% 10Utah 46.5% 11 3.5% 50.0% 21Vt. 20.9% 49 0.5% 21.4% 49Va. 33.9% 37 6.9% 40.8% 35Wash. 45.6% 14 11.0% 56.5% 13W.Va. 38.0% 25 8.6% 46.7% 24Wis. 34.4% 36 4.0% 38.4% 38Wyo. 30.1% 43 2.0% 32.1% 46D.C. 13.4% (49) 0.0% 13.4% (46)
Note: D.C.’s ranks do not affect states’ ranks, but the figures in parentheses indicate where it would rank if included.
Source: Tax Foundation calculations from the Census Bureau, state and local government finance and Federal Highway Administration data. The state and local table includes state and local road expenses but excludes federal aid.
State
Gasoline & License
Taxes RankTolls & User
Fees
Total: Tolls, User Fees, & User Taxes Rank
TABLE 24, Cont.
Share of State & Local Road Spending Covered by State & Local Tolls, User Fees, & User TaxesFiscal Year 2015

Excise Taxes
State Cigarette Excise Tax Rates (Dollars per 20-pack)As of January 1, 2018
Note: Local taxes are not included and can be substantial. D.C.’s rank does not affect states’ ranks, but the figure in parentheses indicates where it would rank if included.
Source: Bloomberg BNA; state statutes.
State Tax Rate RankFed. $1.0066Ala. $0.675 39Alaska $2.00 14Ariz. $2.00 14Ark. $1.15 33Calif. $2.87 9Colo. $0.84 37Conn. $4.35 1Del. $2.10 13Fla. $1.339 29Ga. $0.37 48Hawaii $3.20 5Idaho $0.57 44Ill. $1.98 19Ind. $0.995 36Iowa $1.36 28Kans. $1.29 31Ky. $0.60 42La. $1.08 34Maine $2.00 14Md. $2.00 14Mass. $3.51 4Mich. $2.00 14Minn. $3.04 7Miss. $0.68 38Mo. $0.17 50
Mont. $1.70 22Nebr. $0.64 40Nev. $1.80 20N.H. $1.78 21N.J. $2.70 10N.M. $1.66 24N.Y. $4.35 1N.C. $0.45 46N.D. $0.44 47Ohio $1.60 25Okla. $1.03 35Ore. $1.33 30Pa. $2.60 11R.I. $4.25 3S.C. $0.57 44S.D. $1.53 26Tenn. $0.62 41Tex. $1.41 27Utah $1.70 22Vt. $3.08 6Va. $0.30 49Wash. $3.025 8W.Va. $1.20 32Wis. $2.52 12Wyo. $0.60 42D.C. $2.50 (11)
State Tax Rate Rank
TABLE 25.

Excise Taxes
State & Local Vapor Excise Tax RatesAs of January 1, 2018
State Tax RateAlaska 45% of wholesale (a); 55% of wholesale (b)Calif. 65.08% of wholesaleDel. $0.05/mlIll. $0.80/unit plus $0.55/ml (c); $0.20/ml (d)Kans. $0.05/ml La. $0.05/mlMd. 30% of wholesale (e)Minn. 95% of wholesale (f)N.C. $0.05/ml Pa. 40% of wholesaleW.Va. $0.075/mlD.C. 60% of wholesale
(a) Tax is only applicable in Juneau, NW Arctic Borough, and Petersburg.(b) Tax is only applicable in Mat-Su Valley.(c) Tax is only applicable in the city of Chicago. (d) Tax is only applicable in Cook County. (e) Tax is only applicable in Montgomery County.(f) Tax is on the wholesale cost of any product containing or derived from
tobacco. The tax on an e-cigarette starter kit is calculated on the total cost unless the nicotine cartridges are sold separately and then the tax is levied only on the value of the nicotine cartridge.
Source: State statutes; Bloomberg BNA.
TABLE 26.

Excise Taxes
State Recreational Marijuana Excise Tax RatesAs of January 1, 2018State Tax RateAlaska $50/ounceCalif. 15% sales tax (gross receipts)
$9.25/oz flowers & $2.75/oz leaves cultivation taxColo. 15% excise tax (average retail market rate)
15% sales tax Maine (a) 10% sales tax Mass. (b) 10.75% sales tax Nev. 15% excise tax (wholesale price) 10% retail sales
taxOre. 17% sales tax Wash. 37% sales tax
(a) Maine legalized recreational marijuana in November 2016 by ballot initiative, but the state has not implemented a legal market.
(b) Massachusetts will not begin recreational sales until mid-2018. Note: D.C. voters approved legalization and purchase of marijuana in 2014 but federal law prohibits any action to implement it. The New Hampshire Legislature voted this year to legalize the possession and growing of marijuana, but sales are not permitted. Alabama, Georgia, Idaho, Indiana, Iowa, Kansas, Kentucky, Louisiana, Minnesota, Nebraska, Oklahoma, Rhode Island, Tennessee, and Wisconsin impose a controlled substance tax on the purchase of illegal products.
Source: Tax Foundation, “Massachusetts Increases Marijuana Tax Rate” (2017); state statutes; Bloomberg BNA.
TABLE 27.

Excise Taxes
State Spirits Excise Tax Rates (Dollars per Gallon)As of January 1, 2018
(a) Different rates also applicable according to alcohol content, place of production, size of container, or place purchased (on- or off-premise or onboard airlines).
(b) Control states, where the government controls all sales. Products can be subject to ad valorem mark-up as well as excise taxes.
(c) Includes the wholesale tax rate of 11%, converted to a gallonage excise tax rate.(d) Includes case fees and/or bottle fees which may vary with size of container.(e) Includes sales taxes specific to alcoholic beverages.(f) Includes the retail (17%) and distributor (5/10%) license fees, converted into a
gallonage excise tax rate.Note: Rates are those applicable to off-premise sales of 40% alcohol by volume (a.b.v.) distilled spirits in 750ml containers. At the federal level, spirits are subject to a tiered tax system. For 2018-2019, the federal rates are $2.70 per proof gallon on the first 100,000 gallons per calendar year, $13.34/proof gallon for more than 100,000 gallons but less than 22,230,000, and $13.50/proof gallon for more than 22,230,000 gallons. D.C.’s rank does not affect states’ ranks, but the figure in parentheses indicates where it would rank if included.
Source: Distilled Spirits Council of the United States.
State Tax Rate RankFed. $13.50Ala. (b) $18.27 4Alaska (a) $12.80 8Ariz. $3.00 43Ark. (d, e) $7.73 17Calif. (a) $3.30 40Colo. $2.28 47Conn. (a) $5.40 29Del. (a) $4.50 34Fla. (a) $6.50 21Ga. (a) $3.79 37Hawaii $5.98 24Idaho (b) $10.95 10Ill. (a) $8.55 14Ind. (a) $2.68 44Iowa (b) $13.07 7Kans. $2.50 45Ky. (c) $7.86 16La. (a) $3.03 42Maine (b) $5.83 25Md. (a, e) $5.00 31Mass. (a) $4.05 36Mich. (b) $11.99 9Minn. (d, e) $8.96 13Miss. (b) $8.15 15Mo. $2.00 48
Mont. (b) $9.78 12Nebr. $3.75 38Nev. (a) $3.60 39N.H. (b) -- --N.J. $5.50 27N.M. $6.06 23N.Y. (a) $6.44 22N.C. (b) $14.63 6N.D. (a, e) $4.66 33Ohio (b) $9.87 11Okla. $5.56 26Ore. (b) $22.75 2Pa. (b) $7.24 20R.I. (a) $5.40 29S.C. (d) $5.42 28S.D. (a, e) $4.67 32Tenn. (d) $4.46 35Tex. (a) $2.40 46Utah (b) $15.38 5Vt. (b) $7.72 18Va. (b) $19.93 3Wash. (e, f) $32.52 1W.Va. (b) $7.67 19Wis. $3.25 41Wyo. (b) -- --D.C. (e) $6.17 (25)
State Tax Rate Rank
TABLE 28.
Excise Taxes
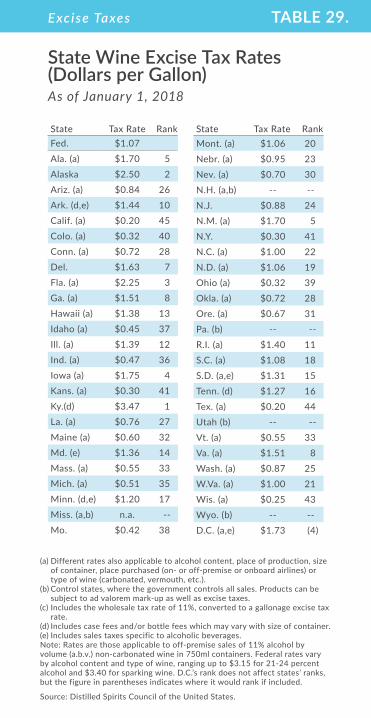
State Wine Excise Tax Rates (Dollars per Gallon)As of January 1, 2018
(a) Different rates also applicable to alcohol content, place of production, size of container, place purchased (on- or off-premise or onboard airlines) or type of wine (carbonated, vermouth, etc.).
(b) Control states, where the government controls all sales. Products can be subject to ad valorem mark-up as well as excise taxes.
(c) Includes the wholesale tax rate of 11%, converted to a gallonage excise tax rate.
(d) Includes case fees and/or bottle fees which may vary with size of container.(e) Includes sales taxes specific to alcoholic beverages.Note: Rates are those applicable to off-premise sales of 11% alcohol by volume (a.b.v.) non-carbonated wine in 750ml containers. Federal rates vary by alcohol content and type of wine, ranging up to $3.15 for 21-24 percent alcohol and $3.40 for sparking wine. D.C.’s rank does not affect states’ ranks, but the figure in parentheses indicates where it would rank if included.
Source: Distilled Spirits Council of the United States.
State Tax Rate RankFed. $1.07Ala. (a) $1.70 5Alaska $2.50 2Ariz. (a) $0.84 26Ark. (d,e) $1.44 10Calif. (a) $0.20 45Colo. (a) $0.32 40Conn. (a) $0.72 28Del. $1.63 7Fla. (a) $2.25 3Ga. (a) $1.51 8Hawaii (a) $1.38 13Idaho (a) $0.45 37Ill. (a) $1.39 12Ind. (a) $0.47 36Iowa (a) $1.75 4Kans. (a) $0.30 41Ky.(d) $3.47 1La. (a) $0.76 27Maine (a) $0.60 32Md. (e) $1.36 14Mass. (a) $0.55 33Mich. (a) $0.51 35Minn. (d,e) $1.20 17Miss. (a,b) n.a. --Mo. $0.42 38
Mont. (a) $1.06 20Nebr. (a) $0.95 23Nev. (a) $0.70 30N.H. (a,b) -- --N.J. $0.88 24N.M. (a) $1.70 5N.Y. $0.30 41N.C. (a) $1.00 22N.D. (a) $1.06 19Ohio (a) $0.32 39Okla. (a) $0.72 28Ore. (a) $0.67 31Pa. (b) -- --R.I. (a) $1.40 11S.C. (a) $1.08 18S.D. (a,e) $1.31 15Tenn. (d) $1.27 16Tex. (a) $0.20 44Utah (b) -- --Vt. (a) $0.55 33Va. (a) $1.51 8Wash. (a) $0.87 25W.Va. (a) $1.00 21Wis. (a) $0.25 43Wyo. (b) -- --D.C. (a,e) $1.73 (4)
State Tax Rate Rank
TABLE 29.

Excise Taxes
State Beer Excise Tax Rates (Dollars per Gallon)As of January 1, 2018
(a) Different rates also applicable according to alcohol content, place of production, size of container, or place purchased (on- or off-premise or onboard airlines).
(b) Includes statewide local rate in Alabama ($0.52) and Georgia ($0.53).(c) Includes sales taxes specific to alcoholic beverages.(d) Includes case fees and/or bottle fees which may vary with the size of container.(e) Includes the wholesale tax rate in Kentucky (10.5%) and Tennessee (17%),
converted into a gallonage excise tax rate. Note: Rates are those applicable to off-premise sales of 4.7% a.b.v. beer in 12 ounce containers. At the federal level, beer is subject to differing tax rates. Small domestic brewers are taxed between $0.11/gallon and $0.516/gallon. All other brewers are taxed at rates between $0.516/gallon and $0.58/gallon. D.C.’s rank does not affect states’ ranks, but the figure in parentheses indicates where it would rank if included.
Source: Distilled Spirits Council of the United States; Tax Foundation.
State Tax Rate RankFed. $0.58Ala. (b) $1.05 3Alaska $1.07 2Ariz. $0.16 36Ark. (c, d) $0.34 19Calif. $0.20 30Colo. $0.08 46Conn. $0.23 27Del. $0.26 24Fla. (a) $0.48 11Ga. (a,b) $1.01 4Hawaii (a) $0.93 5Idaho (a) $0.15 38Ill. $0.23 28Ind. $0.12 43Iowa (a) $0.19 32Kans. (a) $0.18 33Ky. (e) $0.85 6La. $0.40 15Maine $0.35 18Md. (c) $0.53 9Mass. $0.11 44Mich. $0.20 29Minn. (a, c) $0.49 10Miss. $0.43 12Mo. $0.06 49
Mont. $0.14 40Nebr. $0.31 20Nev. $0.16 36N.H. $0.30 21N.J. $0.12 42N.M. $0.41 14N.Y. $0.14 39N.C. (a) $0.62 8N.D. (a) $0.39 17Ohio (a) $0.18 34Okla. (a) $0.40 15Ore. $0.08 45Pa. $0.08 46R.I. (d) $0.12 41S.C. $0.77 7S.D. $0.27 22Tenn. (e) $1.29 1Tex. (a) $0.20 31Utah (a) $0.41 13Vt. $0.27 23Va. (a) $0.26 26Wash. (a) $0.26 25W.Va. $0.18 35Wis. (a) $0.06 48Wyo. $0.02 50D.C. (c) $0.70 (6)
State Tax Rate Rank
TABLE 30.

Excise Taxes
State & Local Cell Phone Tax RatesAs of July 1, 2017
(a) The federal tax listed is the federal Universal Service Fund (USF). Note: The local tax rate is calculated as the average of the tax in the largest city and the capital city. D.C.’s rank does not affect states’ ranks, but the figure in parentheses indicates where it would rank if included.
Source: Tax Foundation, “Wireless Taxes and Fees in 2017.”
State
Average State-Local
Tax Rate RankFed. (a) 6.34%Ala. 9.92% 28Alaska 15.53% 6Ariz. 12.25% 20Ark. 14.81% 8Calif. 12.82% 15Colo. 12.06% 21Conn. 7.75% 43Del. 6.45% 46Fla. 14.76% 10Ga. 10.74% 26Hawaii 7.63% 44Idaho 2.41% 48Ill. 18.25% 4Ind. 11.46% 24Iowa 8.98% 33Kans. 14.33% 11Ky. 10.92% 25La. 9.64% 29Maine 8.85% 34Md. 13.35% 14Mass. 8.66% 37Mich. 8.09% 40Minn. 10.11% 27Miss. 9.41% 30Mo. 14.79% 9
Mont. 6.40% 47Nebr. 18.75% 2Nev. 2.35% 49N.H. 8.81% 35N.J. 9.04% 32N.M. 12.51% 17N.Y. 18.30% 3N.C. 8.69% 36N.D. 12.61% 16Ohio 8.48% 39Okla. 11.61% 23Ore. 1.98% 50Pa. 15.98% 5R.I. 15.04% 7S.C. 12.30% 18S.D. 13.97% 12Tenn. 12.30% 18Tex. 11.68% 22Utah 13.75% 13Vt. 8.50% 38Va. 6.81% 45Wash. 19.24% 1W.Va. 8.05% 41Wis. 9.21% 31Wyo. 7.90% 42D.C. 11.83% (22)
State
Average State-Local
Tax Rate Rank
TABLE 31.

Excise Taxes
State
State General
Sales TaxGrocery
Treatment
Candy Treated as Groceries?
Soda Treated as Groceries?
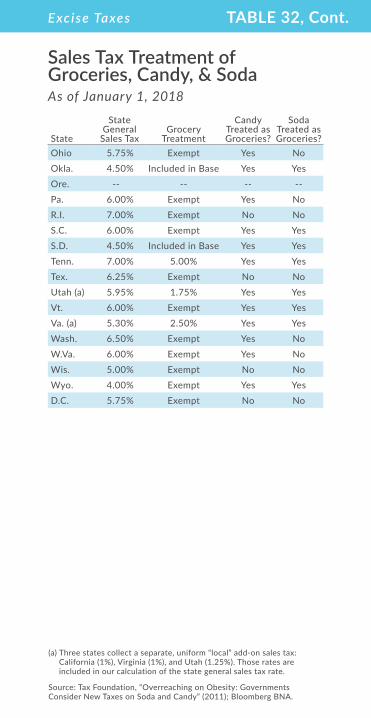
Ala. 4.00% Included in Base Yes YesAlaska -- -- -- --Ariz. 5.60% Exempt Yes YesArk. 6.50% 1.50% No NoCalif. (a) 7.75% Exempt Yes NoColo. 2.90% Exempt No NoConn. 6.35% Exempt No NoDel. -- -- -- --Fla. 6.00% Exempt No NoGa. 4.00% Exempt Yes YesHawaii 4.00% Included in Base Yes YesIdaho 6.00% Included in Base Yes YesIll. 6.25% 1.00% No NoInd. 7.00% Exempt No NoIowa 6.00% Exempt No NoKans. 6.50% Included in Base Yes YesKy. 6.00% Exempt No NoLa. 5.00% Exempt Yes YesMaine 5.50% Exempt No NoMd. 6.00% Exempt No NoMass. 6.25% Exempt Yes YesMich. 6.00% Exempt Yes YesMinn. 6.875% Exempt No NoMiss. 7.00% Included in Base Yes YesMo. 4.225% 1.225% Yes YesMont. -- -- -- --Nebr. 5.50% Exempt Yes YesNev. 6.85% Exempt Yes YesN.H. -- -- -- --N.J. 6.625% Exempt No NoN.M. 5.125% Exempt Yes YesN.Y. 4.00% Exempt No NoN.C. 4.75% Exempt No NoN.D. 5.00% Exempt No No
Sales Tax Treatment of Groceries, Candy, & SodaAs of January 1, 2018
TABLE 32.
Excise Taxes
Sales Tax Treatment of Groceries, Candy, & SodaAs of January 1, 2018
(a) Three states collect a separate, uniform “local” add-on sales tax: California (1%), Virginia (1%), and Utah (1.25%). Those rates are included in our calculation of the state general sales tax rate.
Source: Tax Foundation, “Overreaching on Obesity: Governments Consider New Taxes on Soda and Candy” (2011); Bloomberg BNA.
Ohio 5.75% Exempt Yes NoOkla. 4.50% Included in Base Yes YesOre. -- -- -- --Pa. 6.00% Exempt Yes NoR.I. 7.00% Exempt No NoS.C. 6.00% Exempt Yes YesS.D. 4.50% Included in Base Yes YesTenn. 7.00% 5.00% Yes YesTex. 6.25% Exempt No NoUtah (a) 5.95% 1.75% Yes YesVt. 6.00% Exempt Yes YesVa. (a) 5.30% 2.50% Yes YesWash. 6.50% Exempt Yes NoW.Va. 6.00% Exempt Yes NoWis. 5.00% Exempt No NoWyo. 4.00% Exempt Yes YesD.C. 5.75% Exempt No No
State
State General
Sales TaxGrocery
Treatment
Candy Treated as Groceries?
Soda Treated as Groceries?
TABLE 32, Cont.

Excise Taxes
State & Local Excise Tax Collections per CapitaFiscal Year 2015
Note: Excise taxes are sales and other special taxes imposed on select items, such as tobacco products, alcoholic beverages, and motor fuels. This table also includes excise taxes, or selective sales taxes, on amusements, insurance premiums, parimutuels, and public utilities. D.C.’s rank does not affect states’ ranks, but the figure in parentheses indicates where it would rank if included. See Table 43 for average people per household by state.
Source: Census Bureau; Tax Foundation calculations.
StateCollections per Capita Rank
U.S. $549Ala. $578 20Alaska $478 32Ariz. $303 50Ark. $485 30Calif. $501 26Colo. $437 36Conn. $688 12Del. $545 22Fla. $601 16Ga. $341 46Hawaii $923 3Idaho $313 49Ill. $774 7Ind. $529 23Iowa $476 33Kans. $407 41Ky. $649 15La. $583 19Maine $546 21Md. $816 5Mass. $418 40Mich. $422 39Minn. $849 4Miss. $523 24Mo. $385 44
Mont. $593 17Nebr. $322 48Nev. $945 2N.H. $730 9N.J. $445 35N.M. $403 42N.Y. $668 13N.C. $430 37N.D. $761 8Ohio $475 34Okla. $424 38Ore. $492 29Pa. $714 11R.I. $650 14S.C. $339 47S.D. $505 25Tenn. $485 31Tex. $587 18Utah $403 43Vt. $1,068 1Va. $497 27Wash. $720 10W.Va. $787 6Wis. $497 28Wyo. $382 45D.C. $649 (14)
StateCollections per Capita Rank
TABLE 33.

Property Taxes
Property Taxes Paid as a Percentage of Owner-Occupied Housing ValueCalendar Year 2016
Note: The figures in this table are mean effective property tax rates on owner-occupied housing (total real taxes paid/total home value). As a result, the data exclude property taxes paid by businesses, renters, and others. D.C.’s rank does not affect states’ ranks, but the figure in parentheses indicates where it would rank if included.
Source: 2016 American Community Survey, available from the Census Bureau; Tax Foundation calculations.
StateEffective Tax Rate Rank
U.S. 1.13%Ala. 0.40% 49Alaska 1.02% 22Ariz. 0.70% 38Ark. 0.63% 42Calif. 0.76% 34Colo. 0.59% 43Conn. 1.62% 8Del. 0.56% 44Fla. 0.99% 25Ga. 0.94% 27Hawaii 0.29% 50Idaho 0.75% 36Ill. 2.03% 2Ind. 0.87% 28Iowa 1.44% 13Kans. 1.32% 15Ky. 0.80% 32La. 0.51% 48Maine 1.23% 16Md. 1.03% 20Mass. 1.15% 18Mich. 1.50% 11Minn. 1.12% 19Miss. 0.64% 41Mo. 1.02% 21
Mont. 0.76% 33Nebr. 1.67% 7Nev. 0.75% 35N.H. 1.99% 3N.J. 2.16% 1N.M. 0.67% 39N.Y. 1.40% 14N.C. 0.85% 30N.D. 1.00% 24Ohio 1.60% 9Okla. 0.86% 29Ore. 1.01% 23Pa. 1.48% 12R.I. 1.53% 10S.C. 0.56% 45S.D. 1.21% 17Tenn. 0.75% 37Tex. 1.70% 6Utah 0.65% 40Vt. 1.72% 5Va. 0.84% 31Wash. 0.96% 26W.Va. 0.53% 47Wis. 1.77% 4Wyo. 0.55% 46D.C. 0.59% (44)
StateEffective Tax Rate Rank
TABLE 34.

Property Taxes
State & Local Property Tax Collections per CapitaFiscal Year 2015
StateCollections per Capita Rank
U.S. $1,518Ala. $540 50Alaska $2,001 11Ariz. $1,036 34Ark. $699 48Calif. $1,451 21Colo. $1,382 26Conn. $2,847 3Del. $855 45Fla. $1,232 29Ga. $1,125 32Hawaii $1,070 33Idaho $964 39Ill. $2,087 9Ind. $975 37Iowa $1,569 15Kans. $1,440 22Ky. $781 46La. $869 43Maine $2,055 10Md. $1,555 16Mass. $2,258 8Mich. $1,382 25Minn. $1,534 17Miss. $972 38Mo. $990 35
Mont. $1,509 19Nebr. $1,895 12Nev. $959 40N.H. $3,054 2N.J. $3,074 1N.M. $770 47N.Y. $2,697 4N.C. $952 41N.D. $1,222 30Ohio $1,271 28Okla. $678 49Ore. $1,404 24Pa. $1,481 20R.I. $2,339 7S.C. $1,130 31S.D. $1,381 27Tenn. $863 44Tex. $1,731 13Utah $976 36Vt. $2,542 5Va. $1,520 18Wash. $1,409 23W.Va. $888 42Wis. $1,616 14Wyo. $2,347 6D.C. $3,350 (1)
StateCollections per Capita Rank
Note: D.C.’s rank does not affect states’ ranks, but the figure in parentheses indicates where it would rank if included. See Table 43 for people per household by state.
Source: Census Bureau; Tax Foundation calculations.
TABLE 35.
Property Taxes
State Capital Stock Tax RatesAs of January 1, 2018
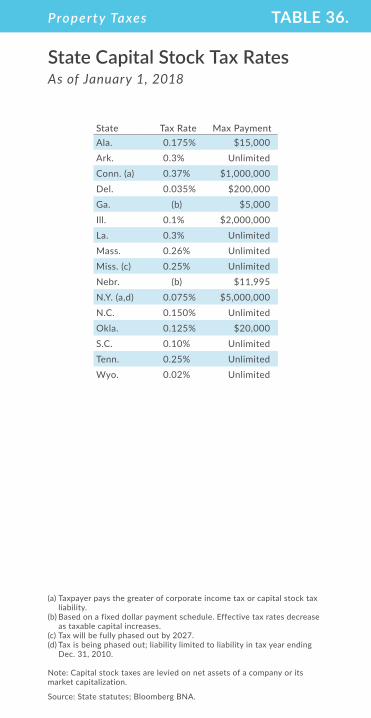
State Tax Rate Max PaymentAla. 0.175% $15,000Ark. 0.3% UnlimitedConn. (a) 0.37% $1,000,000Del. 0.035% $200,000Ga. (b) $5,000Ill. 0.1% $2,000,000La. 0.3% UnlimitedMass. 0.26% UnlimitedMiss. (c) 0.25% UnlimitedNebr. (b) $11,995N.Y. (a,d) 0.075% $5,000,000N.C. 0.150% UnlimitedOkla. 0.125% $20,000S.C. 0.10% UnlimitedTenn. 0.25% UnlimitedWyo. 0.02% Unlimited
(a) Taxpayer pays the greater of corporate income tax or capital stock tax liability.
(b) Based on a fixed dollar payment schedule. Effective tax rates decrease as taxable capital increases.
(c) Tax will be fully phased out by 2027.(d) Tax is being phased out; liability limited to liability in tax year ending
Dec. 31, 2010. Note: Capital stock taxes are levied on net assets of a company or its market capitalization.
Source: State statutes; Bloomberg BNA.
TABLE 36.

Estate & Inher itance Taxes
State Estate Tax Rates & ExemptionsAs of January 1, 2018
State Exemption Rate (Min. to Max.)Conn. $2,600,000 7.2% - 12.0%Hawaii $11,200,000 10.0% - 15.7%Ill. $4,000,000 0.8% - 16.0%Maine $5,600,000 8.0% - 12.0%Md. (a) $4,000,000 16.0%Mass. $1,000,000 0.8% - 16.0%Minn. (b) $2,400,000 13.0% - 16.0%N.Y. $5,250,000 3.06% - 16.0%Ore. $1,000,000 10.0%-16.0%R.I. $1,537,656 0.8% - 16.0%Vt. $2,750,000 16.0%Wash. $2,193,000 10.0% - 20.0%D.C. $11,200,000 6.4% - 16.0%
(a) Maryland has both an estate and an inheritance tax. See Table 38.(b) Exemption increases to $2.7 million in 2019, and $3 million in 2020.
Source: Bloomberg BNA; state statutes.
TABLE 37.

Estate & Inher itance Taxes
State Inheritance Tax Rates & ExemptionsAs of January 1, 2018
State Heir type ExemptionRate
(Min. to Max.)Iowa (a) Class A 100% exempt 0%
Class B No exemption 5% - 10%Class C No exemption 10% - 15%Class D No exemption 15%Class E No exemption 10%Class F No exemption 5%Class G 100% exempt 0%
Ky. Class A 100% exempt 0%Class B $1,000 4% - 16%Class C $500 6% - 16%
Md. (b) Spouse/Lineal Heirs 100% exempt 0%All others No exemption 10%
Nebr. (c) Immediate Relative $40,000 1%Remote Relative $15,000 13%
All others $10,000 18%N.J. (b, d) Class A 100% exempt 0%
Class C $0 11% - 16%Class D $0 15% - 16%Class E 100% exempt 0%
Pa. (e) Spouses 100% exempt 0%Lineal Heirs No exemption 4.5%
Siblings No exemption 12%Others No exemption 15%
Note: Inheritance taxes are levied on the posthumous transfer of assets based on relationship to the decedent. Generally, Class A beneficiaries are spouses, children, and often siblings. Class B beneficiaries are non-immediate family members. Class C beneficiaries are non-family members. Unlike estate taxes, the term “exemption” here applies not to the size of the estate but to the size of the gift itself.
(a) Class D is for-profit organizations; Class E, foreign charitable organizations; Class F, unknown heirs; and Class G, recognized charities.
(b) Maryland has both an estate and an inheritance tax. See Table 37.(c) Nebraska’s inheritance tax is levied at the county level.(d) New Jersey’s inheritance tax only applies to estates over $1M. Class E
is charitable organizations.(e) Parent-to-child transfers to children 21 years and under, transfers of
farms and farming equipment, and transfers of some family-owned businesses are exempt.
Source: Family Business Coalition; state statutes.
TABLE 38.

State Debt
State Debt per CapitaFiscal Year 2015
Note: This shows total outstanding debt at the end of the fiscal year. D.C., not listed, is included only in combined state and local data. See Table 43 for average people per household by state.
Source: Census Bureau; Tax Foundation.
StateDebt per
Capita RankU.S. $3,578Ala. $1,846 41Alaska $7,757 4Ariz. $2,086 39Ark. $1,674 44Calif. $3,876 14Colo. $3,152 27Conn. $9,845 2Del. $5,249 10Fla. $1,643 45Ga. $1,297 47Hawaii $6,117 8Idaho $2,227 38Ill. $4,994 11Ind. $3,393 21Iowa $1,959 40Kans. $2,604 34Ky. $3,115 28La. $3,767 19Maine $3,770 18Md. $4,427 13Mass. $11,084 1Mich. $3,350 23Minn. $3,052 31Miss. $2,497 36Mo. $3,181 26
Mont. $3,104 29Nebr. $954 49Nev. $1,160 48N.H. $6,170 7N.J. $7,471 5N.M. $3,232 25N.Y. $6,939 6N.C. $1,739 43N.D. $2,727 33Ohio $2,851 32Okla. $2,275 37Ore. $3,242 24Pa. $3,675 20R.I. $8,525 3S.C. $3,089 30S.D. $3,828 16Tenn. $913 50Tex. $1,756 42Utah $2,497 35Vt. $5,336 9Va. $3,368 22Wash. $4,495 12W.Va. $3,863 15Wis. $3,827 17Wyo. $1,424 46
StateDebt per
Capita Rank
TABLE 39.

State Debt
State & Local Debt per CapitaFiscal Year 2015
Note: This shows total outstanding debt at the end of the fiscal year. D.C.’s rank does not affect states’ ranks, but the figure in parentheses indicates where it would rank if included. See Table 43 for average people per household by state.
Source: Census Bureau; Tax Foundation.
StateDebt per
Capita RankU.S. $9,327Ala. $6,198 39Alaska $12,265 4Ariz. $7,016 35Ark. $5,581 43Calif. $10,754 9Colo. $10,290 11Conn. $13,071 3Del. $8,061 24Fla. $7,334 33Ga. $5,497 44Hawaii $10,355 10Idaho $3,832 49Ill. $11,550 5Ind. $7,678 29Iowa $5,922 41Kans. $9,730 15Ky. $9,043 17La. $8,445 21Maine $5,947 40Md. $8,503 20Mass. $13,713 2Mich. $7,706 28Minn. $9,366 16Miss. $4,738 48Mo. $7,714 27
Mont. $4,988 46Nebr. $8,173 22Nev. $9,917 14N.H. $8,114 23N.J. $11,175 7N.M. $7,442 31N.Y. $17,485 1N.C. $4,993 45N.D. $7,957 25Ohio $7,383 32Okla. $4,836 47Ore. $8,660 19Pa. $9,930 13R.I. $10,991 8S.C. $8,867 18S.D. $6,773 37Tenn. $6,784 36Tex. $10,108 12Utah $6,761 38Vt. $7,309 34Va. $7,765 26Wash. $11,359 6W.Va. $5,677 42Wis. $7,607 30Wyo. $3,379 50D.C. $20,714 (1)
StateDebt per
Capita Rank
TABLE 40.

State Debt
Funded Ratio of Public Pension PlansFiscal Year 2015
StateFunded
Ratio RankAla. 67% 32Alaska 67% 32Ariz. 63% 38Ark. 82% 15Calif. 74% 26Colo. 60% 43Conn. 49% 47Del. 89% 9Fla. 87% 10Ga. 81% 16Hawaii 62% 40Idaho 92% 6Ill. 40% 48Ind. 65% 34Iowa 85% 13Kans. 65% 34Ky. 38% 49La. 63% 38Maine 83% 14Md. 68% 30Mass. 62% 40Mich. 64% 37Minn. 80% 18Miss. 62% 40Mo. 81% 16
Mont. 75% 23Nebr. 91% 8Nev. 75% 23N.H. 65% 34N.J. 37% 50N.M. 71% 28N.Y. 98% 2N.C. 95% 4N.D. 70% 29Ohio 76% 21Okla. 79% 19Ore. 92% 6Pa. 56% 46R.I. 57% 45S.C. 58% 44S.D. 104% 1Tenn. 95% 4Tex. 76% 21Utah 86% 12Vt. 68% 30Va. 75% 23Wash. 87% 10W.Va. 77% 20Wis. 98% 2Wyo. 73% 27
StateFunded
Ratio Rank
Note: Funded ratio is defined as the level of assets in proportion to accrued pension liability.
Source: The Pew Charitable Trusts, “The State Pension Funding Gap: 2015” (2017).
TABLE 41.

Data
Income per Capita by StateCalendar Year 2016
Note: Per capita personal income is total personal income divided by total midyear population. All dollar estimates are in current dollars (not adjusted for inflation). D.C.’s rank does not affect states’ ranks, but the figure in parentheses indicates where it would rank if included.
Source: Bureau of Economic Analysis, Census Bureau.
StateIncome per
Capita RankU.S. $49,246Ala. $38,896 47Alaska $55,646 8Ariz. $40,415 42Ark. $39,722 43Calif. $56,374 6Colo. $51,999 14Conn. $69,311 1Del. $47,869 21Fla. $45,953 27Ga. $42,159 40Hawaii $50,363 18Idaho $39,470 45Ill. $51,817 15Ind. $43,097 34Iowa $46,000 26Kans. $47,228 23Ky. $38,926 46La. $42,298 38Maine $44,053 31Md. $58,052 5Mass. $64,235 2Mich. $44,253 30Minn. $52,038 13Miss. $35,484 50Mo. $42,926 36
Mont. $42,947 35Nebr. $50,029 19Nev. $43,567 32N.H. $55,954 7N.J. $61,472 3N.M. $38,474 48N.Y. $59,563 4N.C. $42,244 39N.D. $54,627 10Ohio $44,593 29Okla. $42,692 37Ore. $45,399 28Pa. $50,742 16R.I. $50,427 17S.C. $39,517 44S.D. $47,834 22Tenn. $43,326 33Tex. $46,274 25Utah $40,925 41Vt. $49,984 20Va. $52,957 12Wash. $54,579 11W.Va. $36,624 49Wis. $46,762 24Wyo. $55,116 9D.C. $76,108 (1)
StateIncome per
Capita Rank
TABLE 42.
Data
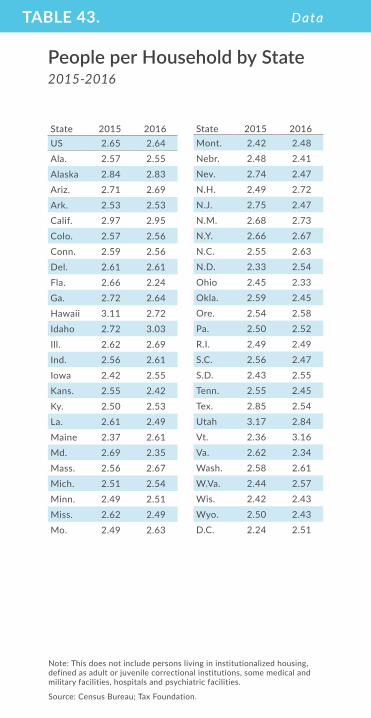
Note: This does not include persons living in institutionalized housing, defined as adult or juvenile correctional institutions, some medical and military facilities, hospitals and psychiatric facilities.
Source: Census Bureau; Tax Foundation.
State 2015 2016US 2.65 2.64Ala. 2.57 2.55Alaska 2.84 2.83Ariz. 2.71 2.69Ark. 2.53 2.53Calif. 2.97 2.95Colo. 2.57 2.56Conn. 2.59 2.56Del. 2.61 2.61Fla. 2.66 2.24Ga. 2.72 2.64Hawaii 3.11 2.72Idaho 2.72 3.03Ill. 2.62 2.69Ind. 2.56 2.61Iowa 2.42 2.55Kans. 2.55 2.42Ky. 2.50 2.53La. 2.61 2.49Maine 2.37 2.61Md. 2.69 2.35Mass. 2.56 2.67Mich. 2.51 2.54Minn. 2.49 2.51Miss. 2.62 2.49Mo. 2.49 2.63
Mont. 2.42 2.48Nebr. 2.48 2.41Nev. 2.74 2.47N.H. 2.49 2.72N.J. 2.75 2.47N.M. 2.68 2.73N.Y. 2.66 2.67N.C. 2.55 2.63N.D. 2.33 2.54Ohio 2.45 2.33Okla. 2.59 2.45Ore. 2.54 2.58Pa. 2.50 2.52R.I. 2.49 2.49S.C. 2.56 2.47S.D. 2.43 2.55Tenn. 2.55 2.45Tex. 2.85 2.54Utah 3.17 2.84Vt. 2.36 3.16Va. 2.62 2.34Wash. 2.58 2.61W.Va. 2.44 2.57Wis. 2.42 2.43Wyo. 2.50 2.43D.C. 2.24 2.51
People per Household by State2015-2016
State 2015 2016
TABLE 43.

The Tax Foundation is the nation’s leading independent tax policy research organization. Our research and analysis is guided by the principles of sound tax policy:
SIMPLICITY: Administrative costs are a loss to society, and complicated taxation undermines voluntary compliance by creating incentives to shelter and disguise income. TRANSPARENCY: Tax legislation should be based on sound legislative procedures and careful analysis. A good tax system requires that taxpayers be informed and understand how tax assessment, collection, and compliance works. There should be open hearings, and revenue estimates should be fully explained and replicable.
NEUTRALITY: Taxes should not encourage or discourage certain economic decisions. The purpose of taxes is to raise needed revenue, not to favor or punish specific industries, activities, and products.
STABILITY: When tax laws are in constant flux, long-range financial planning is difficult. Lawmakers should avoid enacting temporary tax laws, including tax holidays and amnesties.
Visit taxfoundation.org for data, research, analysis, and commentary on important tax issues.
CONNECT: facebook.com/taxfoundation @taxfoundation linkedin.com/company/tax-foundation taxfoundation.org/subscribe
ALSO AVAILABLE: The Facts & Figures App

ALSO AVAILABLE
THE FACTS & FIGURES APP ACCURATE DATA AT YOUR FINGERTIPS
WHERE DOES YOUR STATE RANK?
Explore our new web tool to see how well structured your state’s tax code is and how it compares.
statetaxindex.org
2018 State Business Tax Climate Index