factors that affect quality of teaching staff in
TRANSCRIPT

FACTORS THAT AFFECT QUALITY OF TEACHING
STAFF IN UNIVERSITIES IN KENYA
JOSEPH OBWOGI
DOCTOR OF PHILOSOPHY
(Human Resource Management)
JOMO KENYATTA UNIVERSITY OF
AGRICULTURE AND TECHNOLOGY
2011

Factors That Affect Quality of Teaching Staff in Universities in Kenya
Joseph Obwogi
A Thesis Submitted In Partial Fulfillment for the Degree of Doctor of
Philosophy in Human Resource Management in the Jomo Kenyatta
University of Agriculture and Technology
2011

ii
DECLARATION
This thesis is my original work and has not been presented for a degree in any other
University.
Signature ………………………… Date ……………………………
Joseph Obwogi
This thesis has been submitted for examination with our approval as University
supervisors.
Signature ……………………………… Date ………………………
Dr. Elegwa Mukulu
JKUAT, Kenya
Signature ……………………………… Date ………………………
Dr. Maurice Sakwa
JKUAT, Kenya
iii
DEDICATION This thesis is dedicated to my wife Tabitha, my children, Joe, Peter and Sheila for
their moral support and prayers throughout the study.

iv
ACKNOWLEDGEMENT
This research thesis was completed with the direct and indirect support and
contribution of many people. Direct contribution came from my supervisors, Dr.
Elegwa Mukulu and Dr. Maurice Sakwa who were always available and kept me on
toes as they wanted progress reports after every two weeks. Their guidance at all
stages was very fruitful and unmatched, contributing to timely completion of this
thesis.
Indirect support came from the Department of Entrepreneurship and Procurement
Chairman, Mr. Mike Iravo and my lecturers, Dr. Robert Gichira, Dr. Kihoro and Dr.
Karanja for preparing me enough for this research, through group interactions.
Finally, I send my gratitude to all my classmates and colleagues for providing a
challenging and interesting learning environment, with dynamic academic approaches
and social interactions. The group discussions and presentations during our
coursework were great, participatory and rich in content. Thank you all and be
blessed.

v
TABLE OF CONTENTS
DECLARATION .......................................................................................................... ii
DEDICATION ............................................................................................................. iii
ACKNOWLEDGEMENT ........................................................................................... iv
TABLE OF CONTENTS ..............................................................................................v
LIST OF TABLES ..................................................................................................... viii
LIST OF FIGURES .......................................................................................................x
LIST OF ABBREVIATIONS ..................................................................................... xii
DEFINITION OF TERMS ........................................................................................ xiii
ABSTRACT ................................................................................................................. xv
CHAPTER 1 ..................................................................................................................1
INTRODUCTION .........................................................................................................1
1.1 Background ........................................................................................................... 1
1.2 Statement of the Problem ..................................................................................... 10
1.3 Objectives .......................................................................................................... 12
1.4 Hypothesis ........................................................................................................... 13
1.5 Significance of the Study ..................................................................................... 14
1.6 Scope ................................................................................................................... 14
1.7 Limitations........................................................................................................... 15

vi
1.8 Chapter Summary ................................................................................................ 15
CHAPTER 2 ................................................................................................................ 17
LITERATURE REVIEW............................................................................................ 17
2.1 Introduction ......................................................................................................... 17
2.2 Theoretical Review .............................................................................................. 22
2.2.1 Models for Quality and Quality Assurance at Universities ................................. 22
2.2.2 Conceptual Framework ..................................................................................... 24
2.3 Government and Government Agencies Contribution to Quality .......................... 26
2.4 Human Resource Management (HRM) practices and Quality ............................... 35
2.5 The Effect of Continuing Professional Development on Quality........................... 40
2.6 The Effect of Teaching Facilities on Quality ........................................................ 51
2.7 The Challenges in Maintaining Quality of Teaching Staff .................................... 60
2.8 Chapter Summary ............................................................................................... 73
CHAPTER 3 ................................................................................................................ 74
RESEARCH METHODOLOGY ................................................................................ 74
3.1 Introduction ......................................................................................................... 74
3.2 Research Design .................................................................................................. 74
3.3 Population of Study ............................................................................................. 75
3.4 Sampling ............................................................................................................. 76
3.5 Data Collection Instrument .................................................................................. 77
3.5 Data Collection .................................................................................................... 79
3.6 Data Analysis....................................................................................................... 80

vii
CHAPTER 4 ................................................................................................................ 82
RESEARCH FINDINGS AND DISCUSSIONS ......................................................... 82
4.1. Introduction ........................................................................................................ 82
4.2 The Role of Government and Government Agencies in promoting quality ........... 85
4.3 Effect of Human Resource Management practices on Quality of teaching staff .... 99
4.4 Continuing Professional Development and Quality ............................................ 109
4.5 Effect of Teaching Facilities on Quality of Teaching Staff ................................. 122
4.6 Challenges in Maintaining Quality ..................................................................... 130
CHAPTER 5 .............................................................................................................. 142
SUMMARY, CONCLUSIONS AND RECOMMENDATIONS .............................. 142
5.1 Introduction ....................................................................................................... 142
5.2 Summary ........................................................................................................... 142
5.3 Conclusions ....................................................................................................... 148
5.4 Recommendations .............................................................................................. 154
REFERENCES .......................................................................................................... 159
APPENDICES ........................................................................................................... 171

viii
LIST OF TABLES Table 3.1: Population used ...................................................................................... 75
Table 3.2: Sampling Frame ..................................................................................... 77
Table 4.1.1: Age in years .......................................................................................... 83
Table 4.1.2: Analysis by Designation ........................................................................ 84
Table 4.1.3: Analysis by University .......................................................................... 85
Table 4.2.1: Relationship between Universities and Government .............................. 86
Table 4.2.2: Government and CHE Roles in Promoting Quality ................................ 88
Table 4.2.3: Chi-square Test on University Autonomy .............................................. 89
Table 4.2.4: Factor Analysis on Government Contribution to Quality ....................... 96
Table 4.3.2: Factors Analysis on HRM practices ......................................................105
Table 4.4.1: Effect of Staff Development on Quality ................................................113
Table 4.4.2: Factor Analysis, Continuous professional development ........................119
Table 4.5.1: Teaching facilities and Quality .............................................................123
Table 4.5.2: Factor Analysis, Teaching Facilities .....................................................127
Table 4.5.3: Correlations between E-Learning, Internet and Computers ...................129
Table 4.6.1: Quality Challenges ...............................................................................131
Table 4.6.3: Correlations Between Cross Border Higher Education, Universities,

ix
Economic Disparities and Transnational Education ...............................138
Table 4.6.4: Factors Affecting Service Quality .........................................................139
Table 4.6.5: Correlations between Government, HRM, Staff Development, and
Teaching Facilities................................................................................141

x
LIST OF FIGURES
Figure 2.1: Quality Model ........................................................................................... 23
Figure 2.2: Educational Activities Model .................................................................... 24
Figure 2.3: Conceptual framework .............................................................................. 25
Figure 2.4: Continuous professional development model ............................................ 47
Figure 4.1: Response by Gender ................................................................................. 82
Figure 4.2: Resource Disbursement............................................................................. 90
Figure 4.3: Guidelines for Quality Assurance.............................................................. 91
Figure 4.4: Regulation of both Private and Public Universities .................................... 92
Figure 4.5: Government Role in Projects, P.Contracts and Student Learning............... 94
Figure 4.6: Factor Analysis on Government Role in Quality ....................................... 97
Figure 4.7: Training/Couching Low Performers ........................................................ 101
Figure 4.8: Promotions are based on Merit ................................................................ 103
Figure 4.9: Feedback ............................................................................................... 104
Figure 4.10: Factor Analysis on HRM Practices......................................................... 106
Figure 4.11: Policies,Syllabus, Cirriculum and Examination Involvement................. 109
Figure 4.12: Curriculum Development ....................................................................... 114
Figure 4.13: Community Relationships and Self Control............................................ 115
Figure 4.14: Work Environment and Remuneration ................................................... 117
Figure 4.15: Factor Analysis on Staff Development ................................................... 120
Figure 4. 16: Government Support,Financial Compensation, Poor Materials ............ 125

xi
Figure 4.17: Physical Teaching facilities are visually appealing ................................ 126
Figure 4.18: Factor Analysis on effect of Facilities ................................................... 128
Figure 4.19: Brain Drain challenges .......................................................................... 132
Figure 4.20: Financial Resources and Staff Development.......................................... 134
Figure 4.21: Quality Challenges ................................................................................ 136

xii
LIST OF ABBREVIATIONS
ANOVA Analysis of Variance
CHE Commission for Higher Education
GDP Gross Domestic Product
HE Higher Education
HEQC Higher Education Quality Council
HRM Human Resource Management
HRD Human Resource Development
IUCEA Inter-University Council of East Africa
ICT Information and Communication Technology
ISO International Organization for Standardization
JKUAT Jomo Kenyatta University of Agriculture and Technology
MOEST Ministry of Education, Science and Technology
QA Quality Assurance
QAA Quality Assurance Agency
QI Quality Improvement
QMS Quality Management System
TQM Total Quality Management
UNICEF United Nations Children Education Fund
USIU Unites States International University
USLS University Student Loan Scheme

xiii
DEFINITION OF TERMS
The following terms will be used frequently throughout the thesis.
Quality
According to Newton (2000), Quality refers to an acquired trait; accomplishment;
acquisition a superior birth or station; high rank; elevated character or that which
makes, or helps to make, anything such as it is; anything belonging to a subject, or
predicable of it; distinguishing property, characteristic, or attribute; peculiar power,
capacity, or virtue; distinctive trait; as, the tones of a flute differ from those of a violin
in quality; the great quality of a statesman.
Total Quality Management
Total Quality Management (TQM) is a comprehensive and structured approach to
organizational management that seeks to improve the quality of products and services
through ongoing refinements in response to continuous feedback (Billing, 2004).
Quality Assurance
Quality assurance refers to all actions taken to ensure that standards and procedures
are adhered to and that delivered products or services meet performance
requirements. It is the planned systematic activities necessary to ensure that a

xiv
component, module, or system conforms to established technical requirements
(Arcaro, 1995).
Academic Quality
Academic quality is a description of how well the learning opportunities available to
students help them achieve their award. It is ensuring that appropriate and effective
teaching, research, support, assessment and learning opportunities are provided
(Billing, 2000).
University
The term “University ” means an educational institution in any state that admits as
regular students only persons having a certificate of graduation from a school
providing secondary education, or the recognized equivalent of such a certificate; is
legally authorized within such State to provide a program of education beyond
secondary education; Provides an educational program for which the institution
awards a bachelor’s degree , post graduate degree or provides not less than a 2-year
program that is acceptable for full credit toward such a degree(Bradley,2000).

xv
ABSTRACT
Quality in higher education has been important for decades. In Kenya, quality in
universities was embraced some years back by facilitating the vigorous vetting of
programmes; matching the programmes with the existing capacity and competent sourcing
of human resources to run the programmes.
The study sought to determine the factors affecting quality of teaching staff in
universities. Descriptive design was adopted with eight universities/university
colleges considered for the sample. Stratified random sampling was used and a total
of 120 questionnaires were administered. Out of these, 102 questionnaires were
returned. Analysis was done and a number of tests done using varied statistical tools.
Research findings indicate that human resource management (HRM) practices at
universities remains the biggest challenge to quality. Some of the HRM activities like
feedback on performance and recommendation for training/couching are poor. The
applicability of HRM tools in driving university activities such as use of performance
based management, reward and motivation is minimal.
The findings also indicated a mismatch between resource allocation by the
Government and growth in student population. The staff capacity constraints in both
the established universities and the constituent colleges continue to be felt. Teaching

xvi
facilities are getting overstretched thus reducing quality as found in this research.
Also, contribution of university staff to society in terms of research and technology
transfer is also demeaning. The university teaching staffs are not adequately
facilitated in research and publications.
The need to address human resource management (HRM) gaps as well encourage
continuous professional development of the teaching staff is therefore urgent.
Universities need to set aside proportional amount of funds for staff development, so
as to encourage staff to continuously undertake research and publications. A review
of remuneration and work environment will also discourage brain drain and motivate
teaching staff.
Of importance also is embracing e-leaning as a model for knowledge dissemination at
universities. E-content development is a clear driver that will facilitate greater
outreach for university education in Kenya, and attend to the long-term human
resource gaps that cannot be adequately addressed with the growth in demand for
higher education in Kenya.

1
CHAPTER 1
INTRODUCTION
1.1 Background
Recognition of quality in achieving customer satisfaction and competing in the global
marketplace began in the late 1980s and into the 1990s. Quality refers to “fitness for
purpose” meeting or conforming to generally accepted standards as defined by quality
assurance bodies and appropriate academic and professional communities. In the diverse
arena of higher education, fitness for purpose varies tremendously by field and program
(Hayward, 2006).
Quality management systems (QMS) in higher education (HE) have been developed for a
number of years to improve professional standards. The higher education is looking for a
management concept that would direct the collective efforts of all managers and
employers towards satisfying customer expectations by continually improving activities
(Ajayi, et al, 1996).
Quality assurance is a planned and systematic review process of an institution or program
to determine whether or not acceptable standards of education, scholarship, and
infrastructure are being met, maintained and enhanced. A broad range of factors affect
quality in tertiary institutions including their vision and goals, the talent and expertise of

2
the teaching staff, the quality of the library and laboratories, access to the Internet,
governance, leadership, relevance, value added, and a host of others. A tertiary institution
is only as good as the quality of its teaching staff; they are the heart of the institution
producing its graduates, its research products, and its service to the institution,
community, and nation (Hayward, 2006).
While researchers are not always so pessimistic, it has been very difficult to find a
common definition of quality teaching that all agree on. However a number of traits have
been fronted that flow well across many national lines on quality teaching. These traits of
quality teachers include: A capacity to respond appropriately to students, individually and
collectively, and to the context, through their teaching practice; a refusal to let anything
get in the way of their own or their students’ learning, and what they perceive as needing
to be addressed. A capacity to engender a high level of respect and even affection from
their students and colleagues, a by-product of their hard work and professionalism; a
great capacity for engagement in professional learning through self-initiated involvement
in various combinations of professional development activities, some provided by the
employing authority while others are sought out by the individual and a great capacity to
contribute to the professional learning of others, and a willingness to do so (Akiba &
LeTendre, 2009).
For a country’s adaptability and economic and social development, indeed its standing in
the international competition for power and influence is important. Many countries are

3
currently undertaking an overhaul and revamping of their university system – often at
considerable cost and at a daunting scale. The quality of higher education will determine
the scientific discovery, innovation and exploration of the future. While the competition
among institutions of higher learning remains a powerful driver of innovation and change
within individual countries or among some select countries, this competition now occurs
increasingly and quite publicly at the global scale, as a consequence of the increased
globalization of academic concerns (Hayward, 2006).
The adoption of outcomes based education in a number of countries such as Australia,
New Zealand, the United States, Canada, the United Kingdom and South Africa has been
a steering mechanism in the higher education sector for curriculum reform to reflect
student competence in disciplinary content, thinking and critical skills. Associated with
this move has been the demand by Governments, employers and the public for greater
accountability from higher education institutions (Hayward, 2006).
In Africa, during the period immediately following independence, most ministries and
departments of education gained legal authority and oversight over higher education,
though the level of authority varied widely from one country to another. Some
Governments established highly centralized authority over higher education (as in
Cameroon, Nigeria, and Madagascar) while others provided for high levels of autonomy
for public and/or private education by law (Hayward, 2006).

4
National Governments had their own interests and priorities which were not always in
accord with those of the universities. They included increased access, expectations of
university contributions to the development of the nation, and in some cases, the desire to
control political dissent which was often seen as originating from universities (Hayward,
2006).
The rapid growth in student enrollments at most higher education institutions in Africa
during the 1980s and 1990s posed additional problems. Higher education enrollments in
Ghana, for example, grew from 11,857 in 1991/92 to 63,576 in 2003/2004 an increase of
over 400%. Nigeria too saw a tremendous expansion in the number of universities from
six in 1970 to 55 universities in 2003 with an estimated student enrollment of 700,000.
While the enrollment in Nigeria represented only about 8% of the university age
population, that growth had profound negative effects on the quality of teaching and
training of university students (Hayward, 2006).
Yet, in spite of the increases in student numbers over the last several decades, Africa
remains far behind the rest of the world in terms of access and enrollments with an
average gross enrollment rate of only 5% in 2002/2003. That added to public and
Government pressure to increase access. While the annual enrollment growth rate was
increasing, the average public expenditures per student in higher education fell
tremendously during this period with detrimental effects on quality (Hayward, 2006).

5
The Government of Kenya introduced free primary education immediately after the
December 2002 elections. The elimination of school fees, an obstacle to education for
impoverished families in many African Countries, has, at a stroke, put the Country “on
track” to reach the high enrolment and low parity objectives, at least in primary
education. In 2004 the UN Children’s Fund (UNICEF) estimated that the Country’s total
primary school enrolment was nearly 7.4 million, compared to less than 6 million in the
Millennium year of 2000. Equally impressive has been Kenya’s success in reducing
dropout rates from 4.9 per cent in 1999 to just 2 per cent in 2003, despite the difficulties
that followed the introduction of free education (MOEST, 2006).
In Kenya, the need to regulate, coordinate and assure quality in higher education was felt
as a result of the rapid growth and expansion experienced in the sub sector prior to the
establishment of the Commission for Higher Education in 1985. At independence in
1963, Kenya had an enrolment of 30,000 pupils in the 151 secondary schools at the time.
This Figure shot up to 600,000 pupils enrolled in 3,000 secondary schools which had
been established by 1991. Yet during most of this period, there was only one University
College in Kenya, the Nairobi University College, which between 1963 and 1970 had an
enrolment of about 1,000 students (Chacha, 2004).
Higher education in Kenya can be traced back to 1922 when the then Makerere College
in Uganda was established as a small technical college which was then expanded to meet
the needs of the three East African countries i.e. Kenya, Uganda and Tanganyika and

6
Zanzibar, as well as Zambia and Malawi. In the 1940s and early 50s it is only this college
that was providing university education in East Africa. This lasted until 1956 when the
Royal Technical College was established in Nairobi (Chacha, 2004).
In 1963, the Royal Technical College became the University College, Nairobi, following
the establishment of the University of East Africa with three constituent colleges in
Nairobi, Dares Salaam and Kampala (Makerere). The University of East Africa offered
programmes and degrees of the University of London till 1966. In 1970, the University of
East Africa was dissolved to create three autonomous universities of Nairobi, Dares
Salaam and Makerere. The University of Nairobi was thus established as the first
university in Kenya (Chacha, 2004).
On becoming a fully-fledged university in 1970, the University of Nairobi gradually
increased its enrolment to 8,900 in 1984.The increased enrolment was partially achieved
through the additional places offered at its two constituent colleges, Kenyatta University
College and Egerton University College. The pressure on the Government to increase
enrolment at the University was such that it became necessary to establish more
universities.
Throughout the 1970s the Government strengthened and expanded the University of
Nairobi, the only one then, as a conscious effort to provide university education to all
qualified Kenyans and as a move to develop the necessary human resource for the private

7
and public sectors. As years went by, the number of Kenyans seeking university
education exceeded the capacity of the University of Nairobi. This led to the
establishment of Moi University in 1984 as the second university in Kenya following the
recommendations of the Presidential Working Commission – the Mackay Report – which
collected views from many people and found an overwhelming support by Kenyans for
the establishment of a second and technologically oriented university in the country
(Chacha, 2004).
.
From then, university education in Kenya has expanded with a rise in student enrolments,
expansion of universities, diversity of programmes and setting up of new universities and
campuses. Kenyatta University which had operated as a constituent college of the
University of Nairobi since 1972 became a full-fledged university in 1985. A previous
agricultural college also gave way to Egerton University in 1988(Chacha, 2004).
Enrolment in the four public universities increased steadily to about 20,000 students by
1989/90. University enrolment skyrocketed with the 1990 intake of 21,450 students
which increased the total enrolment to 41,000 students. It was by now, evident that the
Government was no longer able to cope with the ever increasing demand for more
University places or even to provide the adequate resources required (Chacha, 2004).
The thirst for university education and opportunities in the sub sector were not lost to the
private sector. It is therefore not surprising that, between 1970 and 1984, ten (10)

8
privately funded institutions offering University level education, mainly Theological
based, were established. These institutions however, offered limited enrolment and few
programmes. By the year 1994/95, private university institutions had increased to twelve
(12) with an enrolment of slightly more than 4,000 students, which was but a drop in the
ocean of the high demand for university places. Due to this, Kenyans increasingly turned
to foreign universities for university education. The number of Kenyan students in
universities abroad has continued to grow every year (MOEST, 2006).
It was against this background that the Commission for Higher Education was
established in 1985 through an Act of Parliament, “The Universities Act Cap 210B”, to
regulate growth and ensure quality in higher education in Kenya. The establishment of
other public Universities, Jomo Kenyatta University of Agriculture and Technology
(JKUAT) 1994; Maseno University 2000 and the Masinde Muliro University 2002 were a
further attempt to address the problem of the high demand in University education
(Chacha, 2004).
In the meantime the number of private university institutions also increased to 17 with an
enrolment of nearly 9,000 students. By 2002, there were six private universities which
were fully chartered, by the Commission, five granted letters of Interim Authority and
six, registered by the Commission. In addition, public universities had introduced part
time (module II) degree programmes, which target both the public and private sector
employees and school leavers. Consequently, enrolment in the entire University sector

9
rose from 59,193 in 2000/2001 to 91,541 in 2004/2005. The number grew to 112,500 in
2006. It is estimated that the country has 122,874 university students of which
approximately 80 percent are in public universities (Kenya National Bureau of Statistics,
2009).
With the increase in demand for higher education in Kenya by both the locals and foreign
students, the Government of Kenya, through the Kenya gazette, also converted some
middle level colleges into constituent university colleges in the years 2007 to 2010. These
include: Kenya Polytechnic University, Mombasa Polytechnic University, Pwani
University College, Narok University College, Kenya Science University College, Kisii
University College, Kimathi University College, Multi Media University College, Meru
University College of Science and Technology, Chuka University College, Laikipia
University College, South Eastern University College, Kabianga University College
Bondo University College, Chepkoilel University College and Karatina University
College.
Kenya also has a number of public middle level colleges that offer diplomas in certain
fields including engineering, education, and computer science. A number of these
institutions were among those recently elevated to university college status.
Notwithstanding the expansion in the past several years, the capacity of the higher
education sector in Kenya is still limited and only three percent of the university aged
cohort are enrolled in university education. In 2007, for example, of the 82,000 students

10
who officially qualified for university admission on the basis of their KCSE results (out
of the 276,000 students who took the examination), only 10,000 were selected for
Government sponsorship, 10,000 entered university on a self-paying basis and 5,000
entered the private sector, leaving 57,000 qualified students unable to enter higher
education.
1.2 Statement of the Problem
Universities exist to fulfill certain mandates. These mandates include: training, research
and innovation, technology transfer, maximizing the stakeholders’ interest, social
responsibility, ethics, and market leadership. However, the achievement of this mandate
has not been easier due to increased demand for university education in Kenya while the
resources are still minimal. The Government, as the chief financier of university
education in Kenya, has reduced its contribution to universities over the years, while at
the same time pushing the same institutions to admit more students. This has led to
universities resorting to other income generating activities to subsidize Government
sources, thus overstretching the internal resources that in turn affect quality (Chacha,
2004).
The Kenyan Government has established systems of external quality assurance (QA) to
enable Government to gain greater control over higher education institutions in an
international policy context which now sees higher education as critical for national

11
competitiveness. This has been done through the Ministry of Higher Education Science
and Technology (MOHEST) and the Commission for Higher Education, that was
established by the Universities Act, Cap 201B 1985. While the Government has been
willing to accommodate the higher education sector’s wish for more focus on quality
improvement (QI) through broader evaluation of university effectiveness within the
systems of external quality assurance (QA), there is a gap as the quality policies and
quality indicators used by universities in Kenya, across the region and across the globe
are not standard (Bradley, 2005).
Most institutions have developed quality assurance units whose core responsibilities
include maintaining the quality and standards of the universities that are commensurate
with other international universities. The development of these offices has been re-
emphasized by the Commission for Higher Education (CHE), the inter-university council
of East Africa (IUCEA) and other regional and international quality assurance bodies so
as to ensure academic quality among the teaching staff in the member universities. The
effectiveness of these bodies in ensuring that the right staff are teaching at various levels
at universities needs to be established. This research sought to ascertain the driving
factors of quality of the teaching staff at universities in Kenya.
Notable also, issues of educational quality, rather than mass production, need to move to
the forefront of the educational agenda of policy makers at this level of education in
Kenya. Considering this huge public and private investment in university education, there

12
is an urgent need to evaluate the effectiveness of this investment by examining the quality
of the educational infrastructure, the cadre of qualified tutors and teaching facilities in
place, and the quality of teaching and learning. This is necessary in order to determine
how universities in Kenya translate the resources at their disposal into learning outcomes
(Unesco, 2003). The study sought to establish the factors affecting quality of teaching
staff at universities in Kenya.
1.3 Objectives
1.3.1 General objective
The general objective of this study was to establish the factors that affect quality of
teaching staff at universities in Kenya.
1.3.2 Specific Objectives of the Study The specific objectives of this study include:
1. To establish the contribution of Government and Government agencies in
promoting quality of teaching staff at universities in Kenya.
2. To establish the effect of human resource management (HRM) practices on
quality of teaching staff at universities in Kenya.
3. To examine the effect of continuing professional development on quality of
teaching staff at universities in Kenya.

13
4. To examine the effect of teaching facilities on quality of teaching staff
universities in Kenya.
5. To establish the challenges in maintaining quality of teaching staff at universities
in Kenya.
1.4 Hypothesis
H1: The Government contributes to quality of teaching staff at universities
In Kenya
H2: Effective human resource management (HRM) practices at universities
Contribute to good quality of teaching staff
H3: Effective continuing professional development practices contribute to high
Quality of teaching staff
H4: Quality of delivery of teaching staff is dependent on teaching facilities
H5: There exist a number of other challenges to quality of teaching staff
At Universities in Kenya

14
1.5 Significance of the Study
1.5.1 Universities
The study sought to determine the driving force behind quality of teaching staff at
universities in Kenya. The study therefore, provides opportunities for managers to
identify and lay emphasis on these key drivers to quality.
1.5.2 Stakeholders
The study sought to provide information to the stakeholders on teaching quality
sustainability at universities that will facilitate development of the higher education
sector in Kenya as well as identify best practices for enhancing customer satisfaction.
1.5.3 Academicians and Researchers
The study has discovered other research areas for consideration by other researchers that
will contribute to existing knowledge on teacher quality at universities. one of this is on
the relationship between staff development and brain drain at universities in Kenya that
has developed to negatively affect higher educational goals.
1.6 Scope
This study was conducted at sampled universities in Kenya, both private and public that
were in operation during the years 2009 to 2010. Respondents were the teaching staff at
these Universities.

15
1.7 Limitations
This study had a number of limitations including failure of some teaching staff especially
in the private universities to respond to a number of items in the questionnaire, while
others never responded at all. There were also low response rates from the higher cadre of
staff in the level of professor. In private universities, the major limitation was the low
established levels of fulltime teaching staff and limited respondents at higher levels
(professor level). Another limitation was delayed response to the questionnaires by some
staff while others lost them in the process, making me to frequently provide additional
copies. By using the sampling frame that had higher composition of respondents from the
public as opposed to private universities, the challenges of low levels of establishment at
private universities were addressed. Also, this sampling method was scientifically
considered adequate in measuring similar items conceptually, from a large set of
correlated variables from the other universities (Norusis, 1990).
1.8 Chapter Summary
In this chapter, there are seven subsections namely: background, statement of the
problem, research objectives, and research questions, significance of the study, scope and
limitation of the study. The next chapter shall represent a review of the literature related

16
to the problem of the study by expounding more on the key issues directly related to the
research objectives and includes the Government regulations on quality assurance
through the Government agencies, the effects of quality assurance on teaching and
learning, the quality assurance indicators at Universities, and the challenges of quality
assurance at Universities.

17
CHAPTER 2
LITERATURE REVIEW
2.1 Introduction
The definition of quality teaching depends on the meaning one chooses to give to the concept
of quality. Quality is indeed a multi-layered and complex word. As Biggs (2001) points out,
“quality” can alternatively define an outcome, a property, or a process. Therefore it is hardly
surprising that the phrase “Quality Teaching” has been given several definitions.
Harvey and Green (1993) distinguish four definitions of quality that can help us to
understand what Quality Teaching might be. First, quality as “excellence”- the traditional
conception of quality- is the dominant one in many old elite higher education institutions.
Second, quality can be defined as “value for money”- a quality institution in this view is one
that satisfies the demands of public accountability. Third, quality may be seen as “fitness for
purpose”- the purpose being that of the institution, for instance getting students to learn
sciences efficiently. The last definition listed by Harvey & Green is that of quality as
“transforming”. According to this definition, Quality Teaching is teaching that transforms
students’ perceptions and the way they go about applying their knowledge to real world
problems (Harvey & Green 1993).
As also noticed by Harvey et al. (1992), there are many ways to define quality in higher
education because definitions of quality are “stakeholder relative”. Stakeholders here

18
includes students, employers, teaching and non-teaching staff, government and funding
agencies, creditors, auditors, assessors, and the community at large.
Quality assurance is a planned and systematic review process of an institution or program
to determine whether or not acceptable standards of education, scholarship, and
infrastructure are being met, maintained and enhanced. A broad range of factors affect
quality in tertiary institutions including their vision and goals, the talent and expertise of
the teaching staff, the quality of the library and laboratories, access to the Internet,
governance, leadership, relevance, value added, and a host of others. A tertiary institution
is only as good as the quality of its teaching staff; they are the heart of the institution
producing its graduates, its research products, and its service to the institution,
community, and nation (Hayward, 2006).
Quality Teaching has become an issue of importance as the landscape of higher education has
been facing continuous changes. The student body has considerably expanded and
diversified, both socially and geographically. New students call for new teaching methods.
Modern technologies have entered the classroom, thus modifying the nature of the
interactions between students and professors. The governments, the students and their
families, the employers, the funds providers increasingly demand value for their money and
desire more efficiency through teaching (Fabrice &Soleine, 2008).
Teaching quality lacks of clear definitions and to some extent can’t be disconnected from
debates on Quality or Quality culture in higher education that remain controversial terms.

19
Some scholars regard quality primarily as an outcome, others as a property. Some consider
teaching as the never ending process of reduction of defects and so Quality Teaching can
never be totally grasped and appraised. In fact, conceptions of teaching quality happen to be
stakeholder relative: Students, teachers or evaluation agencies do not share the definition of
what “good” teaching or “good” teachers is (Fabrice &Soleine, 2008).
The literature stresses that “good teachers” have empathy for students, they are generally
experienced teachers and most of all they are organized and expressive. “Excellent teachers”
are those who have passions: Passions for learning, for their field, for teaching and for their
students. But research also demonstrates that “good teaching” depends on what is being
taught and on other situational factors. Research points out that Quality Teaching is
necessarily student-centred; its aim is most and for all student learning. Thus, attention
should be given not simply to the teacher’s pedagogical skills, but also to the learning
environment that must address the students’ personal needs: Students should know why they
are working, should be able to relate to other students and to receive help if needed (Fabrice
&Soleine, 2008).
Adequate support to staff and students (financial support, social and academic support,
support to minority students, counseling services, etc) also improves learning outcomes.
Learning communities, groups of students and/or teachers who learn collaboratively and
build knowledge through intellectual interaction, are judged to enhance student learning by
increasing students’ and teachers’ satisfaction (Fabrice &Soleine, 2008).

20
Improving teacher quality has become the educational mantra of the international
community since the turn of the millennium. As Akiba and LeTendre (2009) outlined,
educational policymakers around the world have paid attention to teacher quality as a
major vehicle to improve student learning. Attracting competent candidates for the
teaching profession, retaining highly-qualified teachers by providing support and
incentives, and ensuring students’ access to high quality teaching have been major focus
of educational reforms in many countries. Teacher quality is seen as the crucial driving
force for improving student achievement thus promoting a nation’s economic
competitiveness in this global society (Akiba & LeTendre, 2009).
Being quality minded in higher education means caring about the expectations of students
and other customers as well as all involved parties, and ensuring they are met. Students’
perceptions thus provide important information for lecturers if learners’ needs are to be
fulfilled. An assessment of the quality of teaching programmes and staff comes at a time
when the concern for quality in higher education is probably at an all-time high. All
processes in any organization (University) contribute directly or indirectly to quality as
the customer (student) defines it. This will determine whether students’ needs have been
met (Arcaro, 1995).
Quality assurance in higher education helps in improving professional standards by
comparing them with international educational qualifications. Several attempts have been

21
made to develop quality certifications in this field such as the method ISO 9000 and
others that derive from the manufacturing industry (Dolinsek &Rupnik, 1999).
Institutions of higher education are critical catalysts for a country’s adaptability and
economic and social development, indeed its standing in the international competition for
power and influence. Many countries are currently undertaking an overhaul and
revamping of their university system – often at considerable cost and at a daunting scale.
The quality of higher education will determine the scientific discovery, innovation and
exploration of the future. While the competition among institutions of higher learning
remains a powerful driver of innovation and change within individual countries or among
some select countries, this competition now occurs increasingly and quite publicly at the
global scale, as a consequence of the increased globalization of academic concerns.
Universities are highly regarded as key vehicles for the pursuit of all of the national and
continental development aspirations intrinsic to political, economic, and intellectual
decolonization. In terms of the ‘core business’, this means the production of both
knowledge and people equipped with the intellectual capacities needed to pursue national
and regional advancement (Ajayi, et al , 1996).
Recognizing their importance, and responding to pressure from Governments and
employers, universities have started to change teaching and learning practice to take
account of the concept of graduateness, implied in the set of skills and attributes. For

22
example, it is recognized that in order to achieve this, it is necessary to move from a
teacher-centred approach to a learner-centred approach which emphasizes the education
experience of students and allows them to take their place in the emerging knowledge
society (Huba & Freed, 2000).
2.2 Theoretical Review
2.2.1 Models for Quality and Quality Assurance at Universities
A number of different quality models exist. A quality evaluation models developed by the
Higher Education Quality Council (HEQC) and the Quality Assurance Agency (QAA)
for Higher Education in the UK (1996) are very relevant for programme review, research
projects and community services, that is applicable for the teaching resources at
universities (Vroeijenstijn, 2001).
Specific adaptations to this model would be necessary within the Kenyan university
context, incorporating the vision, mission, goals and objectives and expected outcomes of
the institution. The adapted model takes cognizance of the factors affecting quality of
teaching staff at universities in Kenya. The model takes account of the inputs in terms of
resources required; the processes in terms of what the inputs have to go though and
outputs in terms graduates, scientific production (innovations) and service impact to the
community. These interactions are as presented in Figure 2.1.

23
Figure 2.1 Quality Model Source: Vroeijenstijn, 2001
The other model looks at the linkages between the inputs and outputs in achieving
university goals and objectives. Inputs considered in this case includes the students, staff,
teaching facilities and the internal quality assurance mechanisms while the outputs
include the achieved standards, pass rate/drop- out rates, graduation and cost of running
the programme per student (Figure 2.2) . For the university goals and objectives to be
achieved therefore, inputs must be processed into desired outputs.
Mission statement Goals and objectives Expected outputs
Human resources Scientific
production
Continuous professional devt.
Output
Graduates
Research projects
Government and agencies
Inputs
Facilities
Mission statement Goals and objectives Expected outputs
Services
Process
Study programmes
Community service

24
Figure 2.2 Educational Activities Model Source: Vroeijenstijn, 2001
The attributes of the two models have been adapted to suit the Kenyan universities
context and aligned to the research objectives to develop the conceptual framework that
is used in this study.
2.2.2 Conceptual Framework
The conceptual framework of this study is based on five independent variables namely:
The Government and commission of higher education; HRM as a tool for quality; Staff
G O A L S A N D O B J E C T I V E S
Staff
Graduation
Facilities
Output
Achieved standards
Pass rate / Drop rate
Students
Inputs
Internal quality assurance
G O A L S A N D O B J E C T I V E S
Cost per unit

25
continuous professional development; effect of teaching facilities on quality of human
capital and the challenges encountered on maintaining quality human capital at
universities. The influence of the independent variables on the dependent variable is
illustrated in Figure 2.3.
Figure 2.3 Conceptual framework
Continuous Professional Development
Teaching facilities
Quality of teaching staff in Universities
Government and Government agencies
Independent variables Dependent variable
Quality Challenges
HRM practices

26
2.3 Government and Government Agencies Contribution to Quality
2.3.1 Government Contribution
Over the last two decades there has been a great increases in Government participation in
higher education with a move away from a system for the socially and economically
privileged; a decrease in per capita funding in many Anglophone Countries; a shift
towards user pays; the incorporation into the concept of the modern university of a much
broader mission; and significant increases in the numbers of students taught by each
member of academic staff. Enrolment of fee paying students from other Countries has
become a major source of income for institutions, regions and indeed whole Countries.
More recently, the critical role of Universities in underpinning the innovation system as
they generate new knowledge has begun to be recognized (Bradley, 2005). Paradoxically
as the percentage of the institution’s income deriving from national or state Governments
has declined, the perceived importance to Governments of higher education as an activity
has grown and the desire to gain greater control over it has grown also.
The ‘quality’ literature (Billing, 2004; Gordon, 2002; El-Khawas, 2001) rarely challenges
the reasons which Governments have used to justify national quality regimes. It largely
centres on implementation issues- the best way to establish and maintain such regimes. It
is not often that the stated purposes themselves are challenged in the manner of Vidovich

27
(2001)’s trenchant analysis of the Australian discourse. In some of the more recent
literature in the field, when the writer is critical (Harvey 2002, Biggs 2001, Newton,
2001), the major question is whether the regime leads to better outcomes- in particular
better student learning.
Vidovich(2001), demonstrates how the various definitions of quality- standards,
assurance, improvement, have been used to advance Government control of Universities.
Discussions and contemporary debates within the higher education sector in Australia
would support Vidovich’s contention that greater control of the higher education sector
was a major reason for the use of the quality discourse by Government, an interpretation
held elsewhere, as Newton’s work (1999) in a Higher Education College in the UK
suggests. There the academics had no doubt that the external quality assurance (QA)
initiatives with which they were working were led by accountability rather than
improvement concerns. Harvey concludes that External quality monitoring is primarily to
ensure accountability and conformity (Harvey, 2002).
With such high international comparison of higher education systems, Kenyan
Universities cannot be left behind in the process of becoming part of the other
universities that value quality. Quality assurance of higher education institutions, their
pedagogical, research and other activities, represent the priority of strategic issues, such
as the current emphasis by the inter-university council of East Africa, and the global
perspective that has opened all Universities to scrutiny. In particular, clear guidelines are

28
provided on the level of competences and skills required to handle specific groups of
students in the teaching and learning process.
In Kenya, most universities have established quality assurance systems, as a regular self-
evaluation activity inside the higher education institutions and formal commissions.
The Ministry of Higher Education, Science and Technology has a Directorate of Quality
Assurance that monitors the standards that was recently reformed in the realization of the
need to strengthen quality assurance at all levels of education and training. This entails
effective monitoring of curriculum, development, implementation and evaluation. In
addition, the department monitors teacher-training programmes as well as organizing in-
service training programmes for serving teachers and education managers in conjunction
with other agencies of the Ministry.
The new national quality systems ensure that external scrutiny is brought to bear on
institutions that have been largely closed to this form of public assessment. Until
relatively recently peer assessment of the performance of individuals and groups both
within and among institutions has been the norm, based upon a shared commitment to
academic autonomy. Vidovich (2001) would argue that the major intention of the QA
policy initiatives of the last decade or more has been to establish greater control over the
national system of higher education.
29
Harvey (2002) concurs, pointing to connections between what has happened in higher
education and the characteristics of the ’new managerialism’ with its development of
pseudo markets, assessment of organizations’ systems of control, action to steer at a
distance and creation of experts whose knowledge is the basis of an audit regime.
However, there has been surprisingly little challenge in much of the formal academic
literature to Government initiatives to establish national QA systems. This may be
because representatives of the higher education sector have found it hard to argue against
‘quality’ in any of its forms and, thus, have not spent much time challenging
Government’s mandate or real intentions but rather, as El-Khawas (2001) argues, put
effort into the “need to get it right”.
For the last two decades of change in higher education in many Countries, great increases
in participation, greater diversity of entrants, decreased or stable per capita funding and
institutional reshaping have led to many questions. Everywhere both individuals and
the media ask - Is this a proper university? Is this degree competitive? Are students being
taught effectively? How do I know that this university is doing a good job? (Bradley,
2005). In a globalizing world where higher education has become a service industry,
and some might argue a commodity, the answers to such questions for people trying to
decide with which overseas university to study are possibly even more critical than they
are to those who ask these questions with some local cultural context on which to base
their interpretation of the answers.

30
The aim of Government in establishing national quality regimes is to gain greater control
over the activities of higher education institutions (Harvey, 2002). In the process of
establishment of such regimes, sector representatives seek to incorporate broader aims
into the process of QA. In part, they wish to ensure that the richness and diversity of
what Universities do is incorporated into the ambit of the QA system but, too, they seek
to subvert the Government’s desire for control (Macintyre, 2004).
Quality assurance is also an aspect of the mass system of higher education, a device for
improving the efficiency and effectiveness of large, complex institutions that are vital to
the nation’s needs and in which Government, business, professional associations and
hundreds of thousands of domestic and international students have a keen interest .Thus
the justification of the creation of the Commission for Higher Education by the Kenya
Government through the Act of parliament in 1985(Chacha,2004).
2.3.2 Government Agency Contribution
National quality assurance regimes are generally underpinned by four components- an
agency at arm’s length from Government and institutions, self review/evaluation,
institutional visits and reports (El-Khawas, 2001). The agency determines the evaluation
criteria, framed by the ostensible purposes for which it has been established by
Government. Billing suggests, after interrogating a number of surveys of QA systems,

31
that there is considerable commonality at the heart of national QA, in the shape of a
spectrum from the ’softer’ (developmental) improvement/informational functions to the
‘harder’ (judgmental) legal/financial/planning functions (Billing, 2004).
In quality assurance, even through Government’s intention in all Countries has been to
gain greater control; the purposes espoused publicly by ministers have very commonly
been about public accountability, the rights of consumers and assistance to institutions in
identification and dissemination of good practice. Quality improvement (QI) has been the
rhetorical selling point. Within this elaborate charade, the higher education sector has
been cooperative in working with Government to develop methodologies which allow
assessments with a QI focus (Billing, 2004).
Some sector representatives have sought to turn Government intentions to control
through operation of a relatively narrow conception of QA towards a regime which is
more acceptable- more participatory, more connected to the broader and deeper purposes
of education and more focused on improvement rather than accountability. So they have
wanted to move from QA to QI. If it has been inevitable that a national quality system
will be introduced then sector representatives have sought something that might serve
broader purposes (Newton, 2002). The passion to identify a few robust performance
indicators which would enable the gauging of success of the sector or compare the
performance of institutions is, not unique. Thus there have been some very good reasons,

32
strategic and tactical, for sector representatives to work with Government to bring a
broader perspective (Billings, 2004).
The accommodation between Government and higher education in most Countries has
been to negotiate the establishment of an external QA regime(in this case, the
Commission for Higher Education) premised upon Partnership between Government and
higher education, mutual respect, the primacy of educational issues and Participation of
educational experts in decisions on educational issues (El-Khawas, 2001). There are
various reasons for working with such a regime. First, it’s very difficult to run a public
argument against ‘quality’. Second, it may be that the external regime gives institutional
managers a lever to address issues which have been hard to resolve in collegiate
environments (Scott et-al, 2003).
Gordon (2002), Biggs (2001) and Newton (1999) point to the growth of the power of
executive leadership in modern Universities and the decline of older concepts of collegial
governance. Through this, it is easier for an academic manager to deal internally with
controversial initiatives which touch upon issues of academic autonomy like compulsory
evaluation of teaching with the threat of an external audit hanging over an institution
(Bradley, 2005).
In Kenya, the Government established the Commission for Higher Education, as a
regulatory agency in 1985, under the provisions of the Universities Act, with some of the
33
following major functions: To promote the objectives of university education namely the
development, processing, storage and dissemination of knowledge for the benefit of
mankind; To advise the minister on the establishment of public universities; To accredit
universities; To coordinate the long term planning, staff development, scholarship and
physical development of university education and to promote national unity and identity
in universities(Universities Act,1985).
Other functions include; To liaise with Government departments and public and private
sectors of the economy in matters relating to overall national manpower development and
requirements; To cooperate with Government in the planned development of university
education; To examine and approve proposals for courses of study and course regulations
submitted to it by private universities and to receive and consider applications from
persons seeking to establish private universities in Kenya and make recommendations
thereon to the Minister for Higher Education(Universities Act,1985)..
Although these functions gave considerable statutory powers to CHE to run university
education, a number of criticisms have been leveled on the operations of the organization.
According to Sifuna (1998), only one of CHE’s statutory functions, the accreditation of
private universities, has been its main preoccupation since its secretariat became
operational in 1986. The mushrooming of private universities has focussed the
Commission’s energies in developing accreditation instruments to regulate and permit the
award of charters.

34
According to its statutory powers, CHE was expected to play an active role in the
planning, development, budgetary matters and maintaining quality education. The
politicisation of planning and development of university education seems to have
effectively denied the Commission this particular role (Sifuna, 1998).
Government action in decision making also made it difficult for CHE to play an active
role in public university budgetary matters. In practice, after the establishment of CHE,
public universities continued to argue their individual budgetary submissions with the
treasury, liaising with each other and collectively through the committee of vice-
chancellors. Interestingly, Vice-Chancellors who are normally represented on CHE and
praise its work on accreditation of private universities, effectively bypass the CHE when
it comes to their own plans and budgets. They defend their institutional autonomy which
each university enjoys by virtue of its own statute, and clearly resisting the notion of
ceding part of it to CHE. They believe that rationalisation of departments and related
planning issues are best handled by freely negotiating them among themselves (Sifuna,
1998).
CHE statutory requirement to make regulations in respect of admission of persons
seeking to enroll in universities and provide central admissions service to public
universities, as well as the maintenance of standards for courses and examinations, were

35
rendered inoperative through the creation by the Vice-Chancellors of the Joint
Admissions Board (Chacha,2004).
2.4 Human Resource Management (HRM) practices and Quality
Human Resource Management (HRM) practices such as recruitment and selection,
training, promotion, career development, feedback on performance, motivation and
compensation can potentially affect quality along three parallel channels. The first one is
a control based channel, which refers to all practices taken by the organization in order to
sustain productivity and efficiency in the service process. The second way in which HRM
might affect quality is through a knowledge based channel, in which HRM practices are
adjusted to the service delivery process. By shaping practices in a service oriented
manner employees will be more aware of the service delivery process and quality (Tzafrir
& Gur 2007). The third way is via a motivational based channel, in which the
organisation promotes practices that are focused on employees’ well being.
Research by Tzafrir & Gur (2007) has shown that adopting HRM practices that
employees perceive as positive and considerate, such as employment security or a
compensation system that acknowledges employee efforts and contributions, results in
more service committed employees. The current research is focused on the knowledge
and motivational based channels because such practices are directed toward employees’
well being as well as quality.

36
Employees in organizations that are characterized by high levels of service view the
organizational leadership as putting a strong emphasis on meeting customer needs and
delivering excellence in service through clearly stated goals and objectives. Leadership
and supervision may contribute to quality in two ways. First, from the knowledge based
aspect, managers, by being responsive to employees’ questions and concerns and
providing them with the information necessary to promote high quality service, can
enhance the quality of service given by employees (Tzafrir & Gur 2007). And secondly,
from the motivational based aspect, the way managers treat staff affects employees’
feelings of being valued, thereby affecting their morale and motivation to act according to
the managers’ expectations.
Promotion and career development could be related to quality in knowledge as well as
motivational aspects. From the knowledge based view, caring for career development and
promoting service employees who are already service minded and customer oriented will
strengthen the perceptions of employees as well as customers that the organization is
service oriented. From the motivational view, the promoted employees feel valued by the
organization, and understand that the organization is willing to invest in them in the long
term. In this way they are motivated to reciprocate to the organization by investing efforts
to provide quality service to customers (Tzafrir & Gur 2007).

37
Training is also a recognized essential component of high performance work systems.
From the knowledge perspective, such service workers should be trained to identify and
resolve problems, to promote changes in work methods and to take responsibility for
quality. Adequate training enables the generation of a work force that is multi skilled,
adaptable to rapid changes and has wide conceptual knowledge of the production system.
From the motivational perspective, it is reasonable that employees would feel valued by
the organization that chooses to invest in their professional development. Positive
perceptions of training are associated with employees’ perceptions of the organization as
having a strong service orientation (Tzafrir & Gur 2007).
Compensation is another important facet of organizational success. First, it is a concern
of equity and fairness. Employees whom expend more efforts and creativity in doing their
job and see that their results benefit the employer will expect remuneration in exchange
for their efforts. If employees do not receive any appreciable return, it is reasonable to
expect that they will stop trying. Second, contingent compensation serves as a
motivational tool, because employees know that they will share in the results of their
work. Therefore, a compensation system based on excellence will result in increased
employee performance. Internal equity of compensation was found to be related to
employees’ perceptions of the organization as having a strong service orientation (Tzafrir
& Gur 2007).

38
In Kenya however, Universities, especially public ones, have almost exclusively
depended on the Government for remunerating their staff. The little income generated
internally goes to subsidize staff salaries as the Government funding is not enough to
sustain the payroll as well as provide for operation and maintenance of university
facilities. The salaries of teaching staff are standard across universities, save for
compensation from other extra activities such as consultancy and part-time teaching. This
has led to a situation where staff are not paid as well as their counterparts in the more
developed societies. In the private universities, the teaching staff are loaded with more
teaching units without providing for opportunities for research and development.
Feedback is a basic requirement for enhancing employee performance. From the
knowledge aspect, employees need to know whether they are performing their job
satisfactorily, and if not, how they might improve their job activities. Providing
employees with structured and accurate information about their performance together
with suggestions for improvement is an acceptable strategy that is likely to help them to
focus on the evaluation of problematic areas, and hence, lead to better levels of
performance.
From the motivational aspect, employees who make an effort to improve their service
performance will be more motivated to do so if they feel that the organization and their
managers recognize their efforts. A comprehensive and accepted evaluation system can

39
provide valuable feedback to employees and assist managers in making decisions
regarding the individual employee (Tzafrir & Gur 2007).
In a study concerning quality assurance for university teaching, Sandra Griffiths
associates staff development to quality assurance in which the key determinants of
quality are attitudes and behaviour of staff. According to Griffiths, a comprehensive and
positive staff development policy is essential to help staff deal with a changing demands
and circumstances. In this case, total quality management may be conceived as a massive
exercise in staff development, and the requirement is that organizations should make
sustained commitment to staff development and training. Griffiths concludes that as good
teaching is becoming crucial, staff development promotes quality assurance in university
teaching (Griffiths, 1993).
Any university that wants its faculty to be motivated to teach well must hold as central to
the institution’s mission and commitment to high-quality teaching. A university in which
good teaching is truly an organizational commitment finds ways to bring teaching issues
into prominence. When teaching becomes a primary institutional goal, it should be
reflected in the ways in which faculty are evaluated and rewarded. Formal and informal
rewards for good teaching serve as strong incentive. In addition to formal rewards,
universities can show interest in teaching and offer incentives to faculty through more
informal means. For example, awards for high quality teaching – bestowed with the same

40
respect and honour attending research awards – can serve as incentives (Rice and Austin,
1993).
2.5 The Effect of Continuing Professional Development on Quality
In differentiating faculty or staff development, Menges (1997) identified three
perspectives on faculty development, which, according to his argument, differ
significantly depending on whether one takes the perspective of the organization, the
perspective of professional development of programme or the perspective of the faculty.
From organization’s perspective, Menges (1997) views faculty or staff development as
human resource management. This ‘people side of the organization’ as a term began to
appear in the 1950s. The ‘human element’ in organization has been acknowledged
somewhere else as including ‘people as individuals and groups, their recruitment,
selection, assignment, motivation, compensation, and retirement’ (Tracey, 1991).
Universities, like other educational organizations, should be seen as providers of services
rather than as producers of goods, when considering human resource management. The
current tendency to adopt the phrase “human resource” from the business world as an
alternative to staff development is objected on the grounds that it signifies a management
attitude of manipulation. The question raised is whether staff can be developed? In a
sense, if we are humans blessed with free will, we can only develop ourselves, choosing
to accept or reject the attempts of politicians, managers and trainers to alter our

41
knowledge, skills, values, and performance (Oldroyd, 1995). Instead, Oldroyd calls for a
replacement of the term “staff development” by the phrase “continuing professional
development (CPD)” to signify the notion of career long learning as an entitlement and
necessity in rapidly changing modern societies.
Oldroyd explained that as individual staff and their groups strive to cope with new
curriculum, increasing school autonomy and changing social norms and expectations, the
imperative for continuous learning grows. In this consideration, the tension between the
needs of the individual and of the team and school remains a central challenge to the
managers and providers of continuing professional development (Oldroyd, 1995). It was
gathered from this perspective that the task of faculty development is to manage human
resources in ways that create and maintain a climate consistent with the organization’s
mission, that is, a climate that emphasizes the quality of teaching and learning.
The second perspective on faculty development is the teacher-centred development, also
referred to as professional development. It was proposed that those who work in college
and university centers for faculty development and teaching improvement commonly
refer to their work as “professional development, defined as ‘maintaining and improving
the professional competence of the individual faculty member within the context of the
many roles the faculty member has in fulfilling his or her obligation to specific
institution” (Menges, 1997).

42
Menges (1997) offers three-dimensional approaches intended for planning and assessing
faculty development. The first dimension is temporal, referring to career stage or amount
of experience, ranging from trainees (Graduate students) to Professors. The second
dimension delineates the roles that faculty fulfills; namely, instructional, scholarly /
creative, service and personal, since faculty development activities should specify which
role or roles they are addressing. The third dimension deals with organizational level at
which faculty development is targeted, ranging from the individual faculty member
through particular units in the organization, to the academic and profession and non-
academic community (Menges, 1997).
Members of staff at universities can retain their credibility and claim to professionalism if
their declarations, whether by word or action, stands up to scrutiny. The more their
services contribute to society’s welfare, the more they are likely to gain appreciation and
prestige. Once their occupational practice proves consistently trustworthy, through
internal and external quality audit, society and its political forces would be more inclined
to accord them higher degrees of autonomy and self-control. The combined factors
eventually lead to higher social status often accompanied by material rewards. The
combined attributes constitute the characteristics of professional bodies (Farrugia, 1996).
The above description of the processes that enhance a group’s professional standing has
several implications. First, the development towards professional standing involves
progression, often a long and tortuous one to ensure that professional knowledge and

43
practice are enhanced. Second, individuals in the group are to be engaged in continuous
vocational development and training that is maintained beyond academic graduation and
acceptance into the profession. Third, an individual’s “professing”, manifested by one’s
words and actions, form only one part of a two-way communication process since
professing in the wilderness is a futile exercise. An audience or a clientele has to receive,
understand, appreciate and accept the professional’s services (Farrugia, 1996).
The traditional approach to distinguish between professional and non-professional
occupations relied on the identification of specific qualities which professional
occupations were reputed to possess, and which non-professional occupations lacked.
Professional people, show central occupational characteristics. According to the
traditional professions attributes model, these characteristics were identified with
medicine, law, theology and university teaching. This model is far too rigid and fails to
acknowledge the evolutionary, sometimes revolutionary, progress that contributes to the
development of many occupations (Farrugia, 1996).
The continuous professional development model retains the idea central to the traditional
professions attributes model; namely, that certain occupations can develop to a very high
degree specialized characteristics or attributes. In the case of university lecturers, the
model evaluates professionalism through the acquisition of knowledge and understanding
of educational theory applied to adult learners; application and refinement of validated
pedagogy for tertiary-level teaching and learning; practice of instructional and managerial

44
autonomy coupled with accountability; exercising of organizational authority governed
by internalized control to fulfill educational objectives and growth of a professional ethos
within a university environment(Farrugia,1996).
The continuous professional development model provides five education-related
activities uses to evaluate the degree of professionalism. These include the following:
i. Educational theory
The educational theory looks at four components based on knowledge and understanding
and includes; human growth and development as applied to adult learners; learning
theories that relate to tertiary education; social considerations of teaching and learning
and ethical implications of education. The theory necessitates the need to ensure that only
qualified lecturers are allowed to teach.
ii. Application and the refinement of validated pedagogy
The application and refinement of validated pedagogy for tertiary-level teaching and
learning is divided into; mastery over the teaching content; ability to engage in
curriculum development; ability to motivate students and retain their interest; the use of
instructional and communication techniques; the application of evaluative and remedial
procedures; classroom management; school administration; interpersonal skills, and other

45
pedagogy-related competences. This implies that all lecturers without teaching
background needs to be exposed to the effective teaching methods while there is also a
need to introduce new guides for lectures who trained long ago.
iii. Instructional and managerial autonomy
Instructional and managerial autonomy facilitates freedom to apply informed classroom
practices; participation in departmental and faculty policies; participation in the
formulation of national curricula and examinations; and participation in the selection of
syllabuses and teaching methods. To achieve this, the contribution of individual lecturers
must be appreciated by management.
iv. Lecturers’ development
Lecturers’ development is measured by the rate of improvement in the teaching and
working environment; lecturers’ conditions of work; remuneration; the degree of
dialogue with an institution’s administration; and the degree of collective decision
making and peer-group selection. The lecturer must be facilitated to deliver in through
provision of adequate resources and his/her services appreciated.

46
v. Professional ethics
The rate of progress in lecturers’ professional ethos can be evaluated by their
commitment to the service ideal; contribution to the community’s welfare; collegiality;
degree of self-control and regulation; the level of appreciation of their work by the
community; and their esteem and prestige in the community.
The continuous development model created provisions for institution to undertake
determined training and promotional efforts to persuade staff and students to adopt
modern and effective teaching/learning methods. The model illustrate that, within the
constraints of increased student numbers, quality assurance and academic audit measures
can guarantee high standards, that restructured schedules ensure personal contacts with
students, and that the university’s ethos and high reputation are preserved. At the same
time, the university will aim to prove to the community, and the politicians, that greater
student numbers make higher demands on the institution, that substantial growth requires
changes in attitudes and processes, and that these take time to take root and bear fruit
(Farrugia, 1996).
The new model in Figure 2.1(Farrugia, 1996) retains also the concept of evolution which
is the basis of the professions continuum. The continuum is represented by the horizontal
axis which sets the rating scale of five benchmarks denoting negligible, low, moderate,

47
high, and outstanding rates of development or growth. The continuum concept in the
model reinforces the dynamic characteristics of constant development so that while some
occupations flourish and progress through sustained efforts at professional evolution,
others stagnate due to lack of professional growth (Farrugia, 1996).
Staff training is another area which lags behind and impacts negatively on teaching and
research. Up to two-thirds of university teachers have had no initial pedagogical training.
Most of these institutions are relying on individuals who have not acquired their highest
level of academic training as lecturers. To improve their efficiency and effectiveness in
delivering their services, staff, and especially the academic staff, must be trained
continually in relevant areas. Universities must have a clear training policy, outlining
Negligible (1)
Low (2)
Moderate (3)
High (4)
Outstanding (5)
Knowledge and understanding of educational theory
Development and application of pedagogy
Operational autonomy with accountability
Organizational authority and responsibility control
Professional ethos in education development
Figure 2.4: Continuous professional development model

48
their strategy for human resource development, instead of the ad- hoc procedures
currently followed in most of these institutions (Chacha, 2004).
In emphasizing the importance of staff development in increasing effectiveness in the
university, it was argued that staff development facilitates personnel and professional
development for individuals and groups, enabling them to achieve their potential and
contribute to the provision of excellence in teaching and research in the university
(Chacha, 2004).
In another contribution, Anyamele (2007) pointed out the importance of staff
development in the current changing higher education landscape. According to Anyamele
higher education institutions are highly recommended to put in place appropriate staff
development strategies to support all staff and encourage involvement in the development
and implementation of university-wide policies and strategies, because effective staff
development is essential to support new approaches to learning and teaching, and
meeting changing needs of institutions. Anyamele hinted that in a competitive global
educational market, universities are keen to be awarded national prizes and investor in
people (IIP) award through a framework of an institution-wide staff development
strategy.
Higher education institutions should recognize that their staff are their vital and valued
asset. The university should therefore, commit itself to encouraging and enabling staff to

49
realize their potential by providing opportunities for all colleagues to gain the knowledge,
skills, and experience necessary for them to enhance their contribution to meeting
individual, area, and organizational objectives. Not only that staff development should be
among a clutch of institutional innovations thrust upon universities, it is a technique or
tool to increase quality, efficiency and output, it can be associated with high quality
professional performance resulting in career advancement, strategic development, and
initiative to sustain change (Duke, 1992).
Continuous education, as a form of staff development is important because it will prevent
knowledge obsolescence. Continuous education of staff plays a key role of advancing
knowledge and skills of staff for them to play new roles. It prepares staff for development
needs as well as for better teaching and research. In addition, continuous education is
seen as a way in which staff are empowered to perform well in teaching and research
roles. As universities are faced with accelerating changes in their environment, teachers
need to improve their skills in the acquisition and management of new knowledge. The
aim here is that staff working in the university will acquire the skills and knowledge
needed for pedagogic purposes and for teachers to have teaching skills (Anyamele, 2007).
As a tool for increased quality, efficiency and output, staff development is associated
with high quality professional development and performance, resulting to career
advancement. Staff development can also assist in strategic development; when broadly
conceived to initiate change: it is a way of producing strategic training programmes for

50
clients organizations, involving the classification of future purposes and objectives, the
identification of training needs within this framework and encourage staff at all levels to
see staff education and training as a key support of organizational change (Anyamele,
2007).
In addition, Staff development is critical to building a learner-centred higher education
institution. Education in general and higher education in particular is concerned with the
development of human potential and the quality of the human resources. Consequently,
as one of the key functions of human resource department of an institution, staff
development, by providing these range of services such as staff training and
development, individual coaching, management support and development, the
institution’s mission is achieved (Anyamele, 2007).
The importance of continuous education and training is that institution’s competitiveness
in a global or national setting will depend on the expertise of the staff. If the competence
of staff is continually maintained and developed, they will gain a lasting motivation. This
approach to staff development is lent support by a study by Kautto-Koivula (1997)
concerning Nokia’s Technology Education and Training Programmes (NTETP). One of
the findings of the study show that it was realized that in order to cope with ever-
increasing global competition, Nokia had to offer its employees better opportunities to
develop and educate themselves while remaining in full time employment, as a means of
providing long-term training and education that were highly motivating. Hence staff

51
education and training does not only upgrading an individual teacher’s professional skills
but must serve the whole institution.
2.6 The Effect of Teaching Facilities on Quality
Current and probably converging models of Government sanctioned quality assurance in
higher education assure the public that an independent group is systematically addressing
whether institutions meet what might be seen as minimum requirements but they don’t
address many of the deep issues about quality improvement which bedevil institutional
leaders. With quality assurance(QA) regimes in place in so many Countries it is time to
begin to look much more carefully at whether this now almost universal model of
Government sanctioned external assessment leads to better teaching and to improved
learning outcomes(Billing, 2004).
The question as to whether the external QA model with its powerful pressures allow
external scrutiny of the institution’s management and its outcomes hinders improvements
in teaching and learning at the institutional level is still subjective(Bradley,2005). These
external pressures mean the institution acts to identify an acceptable institution wide
model for ’delivery ‘ of teaching and evaluation of learning; to implement it; to collect
comparable data across a often narrow set of indicators about the impact of teaching; and
to reward good practice as the institution so defines it. What is done is basically
systematizing and perhaps even industrializing the processes of teaching and learning.

52
With such an approach the dangers are that we alienate the teachers and encourage them
to hide problems and innovate with great caution because innovation by its very nature
means a great risk of failure. Indeed, very little is known about the broad impact on
student learning of existing internal institutional quality assurance systems (Bradley,
2005).
Trust and collegial approaches are most of what we need to build effective teaching
approaches in higher education (Ramsden, 1992). It is academics who innovate in
teaching, not administrators, and that they will do that when they feel some sense of
control over what they are doing, have time to think and reflect on what they have learnt
from previous attempts to teach better and feel their efforts are valued (Bradley, 2005).
Internationally, all academics, however surveyed, now comment unfavorably on staff
student ratios, the rising tide of administrative reporting and the loss of a sense of control
over their work (Bradley, 2005).
Quality assurance (QA) in universities has more of the characteristics of administrative
burden than an exciting intellectual journey. It badgers teachers rather than working
alongside them. These characteristics seem to be present whether an intensive subject
inspection system or a ‘lighter touch’ of periodic institutional audit is employed. The
variation is in degree rather than character (Ramsden, 2003).

53
Ramsden (2003) argues that the quality assurance systems in most Countries encourage
compliance and not commitment, reinforce unsophisticated theories of learning and
engender a culture of lack of trust of academics. Such views about the effects of external
QA are shared by Knight and Trowel (2000) who are critical of Ramsden’s views about
effective academic leadership but, like him; warn that attempts to improve the practice of
teaching in universities by coercive approaches will fail. If that is so, who is researching
the impact of external QA on teaching and learning outcomes in Universities? Isn’t it
time for the ‘quality’ literature to make some connections with the literature on teaching
and learning in universities? There is a very large area of enquiry about effectiveness to
be addressed.
Macintyre (2004) argues that the life of institutional managers consists of management
tasks, formulating strategies and reporting outcomes, reconciling ends and means,
encouraging good practice and dealing with the consequences of bad. Managers share a
bureaucratic rationality which has quality as one of its guiding values and the greatest
challenge is to persuade the skeptics that managers are doing something useful.
The Large class sizes and inadequate teaching / learning facilities are some of the factors
hindering effective teaching (Ngware & Ndirangu, 2005). For instance, enrolment in
public Universities in Kenya grew from 3,443 in 1970 to 9,044 in 1984 (162.7 per cent
increase in 14 years) and to 43,038 in 1994 (375.9 per cent in 10 years). In the 1990s,
there was a rapid increase (of 375.9 per cent) in the student population in universities

54
without an improvement in the quality and quantity of teaching resources and other
teaching facilities (Abagi, 1999).
The increased enrolment was attributable to a presidential decree that ordered a doubling
of the intake in one academic year in order to accommodate two groups of students, (the
last A-level class of the former 7-4-2-3 system of education, and the first O-level class of
the new 8-4-4 education system) that were waiting to join the university, without giving
the institutions ample time to plan for such an intake.
The implementation of Free Primary Education in the primary school sub-sector in the
year 2003 resulted in substantial growth in enrolment from 5.9 million children in 2002
to 8.2 million children in 2008. In the year 2008, free secondary education was also
introduced resulting in higher transition rates to universities. While the planned transition
rates have not been achieved by the Government, the current student population in public
universities has grown to over 100,000 in 2010. These Figures could have been higher
had admission to public universities through the joint admission programmes not been
begged to bed capacities.
Abagi (1999) observes that the increase in student numbers over the years has not been
matched by a corresponding expansion in teaching/learning facilities, and class sizes of
above 300 are not uncommon in public universities, especially in humanities and
education courses. Libraries, laboratories, lecture theatres and halls of residence are all

55
overstretched (Abagi, 1999; Court, 1999; Hite et al., 2003). Some university academics
moved elsewhere for better pay. The increase in student population has not resulted in
more recruitment of teaching staff, resulting in those who have remained being
manifestly over-loaded.
The teaching of large classes and marking many scripts is still very common, while poor
teaching facilities and inadequate teaching/learning resources in all public and private
universities is still a challenge. This calls into question the quality of learning provided
by the universities and the level of morale of the teaching staff. The effects of all this
spills over to the university customers (Ngware & Ndirangu, 2005).
The World Bank (2002) has recently linked higher education to economic productivity
and to Countries’ ability to compete in the global knowledge economy. The World Bank
pointed out the need for universities to continuously upgrade the knowledge, skills and
attitudes of the labour force so that the workers are relevant to the dynamic global
knowledge economy. Lifelong-learning and training have thus become important in
inculcating and upgrading new knowledge, skills and attitudes.
Against this backdrop, most advanced economies have recognized the power of
investment in education. First, universities are well positioned to provide the needed
support to the knowledge-driven economic growth strategies by educating and training
scientists, civil service, researchers, health care professionals, technicians, teachers in

56
basic and secondary education, and business leaders; generating new knowledge and
technological innovations through research and development; and building the capacity
of Information and communication technology(ICT) technologists and librarians to
access existing stores of global knowledge and human capital around the world and adapt
them for local use (World Bank, 2002).
Second, higher education offers better opportunities for low-income and minority
students to become employable and move up the social ladder, thus reducing income
inequality. Third, institutions of higher education inculcate norms, values, attitudes,
ethics, and knowledge for civil society. Finally, they facilitate nation-building by
promoting greater social cohesion, trust in democratic processes, and appreciation of
diversity in gender, ethnicity, religion and social class (World Bank, 2002; Yizengaw,
2003).
Around the world, the swiftness of ICT developments, their increasing spread and
availability, the nature of their content and their declining prices, are having major
implications for learning. There is need to tap the potential of ICT to enhance data
collection and analysis, and to strengthen management systems in educational
institutions; to improve access to education by remote and disadvantaged communities; to
support initial and continuing professional development of teachers; and to provide
opportunities to communicate across classrooms and cultures. Most universities in Kenya
have very limited access to modern computing and communications technology, so it is

57
increasingly difficult for teachers and students to keep abreast of current developments in
their academic areas (Chacha, 2004).
The lag for most developing Countries can be attributed to a variety of reasons, but one
of them is the influence of the World Bank Report (1988), Education in Sub-Saharan
Africa: Policies for Adjustment, Revitalization and Expansion, and the economists of the
day who influenced the report. The consensus of that day argued that investment in
higher education in developing Countries brought meager social returns compared to
investment in primary and secondary schools. Consequently, from the mid-1980s up to
the end of twentieth century, higher education received less funding, with the result that
the quality of higher education in most sub-Saharan African Countries deteriorated
substantially.
It was not until the mid-1990s that the World Bank (2000, 2002) began to question its
earlier wisdom of neglecting investment in higher education in developing Countries.
According to World Bank reports (2000, 2002), institutions of higher education are still
chronically under-funded in spite of escalating demands for higher education. The quality
and relevance of their research is poor. They operate with overcrowded and deteriorating
physical facilities, limited and obsolete library resources, inadequate laboratories,
insufficient equipment and instructional materials, outdated curricula, and poorly
prepared secondary students. Their teaching staff are unqualified and under qualified,
poorly compensated and, hence, largely unmotivated.

58
Most Universities in developing nations function at the periphery of the international
scientific community, unable to participate in the creation, production and adaptation of
knowledge necessary to confront their Countries’ most important economic and social
problems. The net result is that most universities in sub-Saharan Africa are finding it
difficult to compete in the global market for knowledge creation and production. Yet the
main challenge facing Governments of developing Countries today is how to build
human capital through sustained investment in higher education so as to produce highly
qualified and trained people who can compete in the global knowledge economy
(Nafukho, 2004).
Higher education is considered the most significant contributor to national development.
Recent comparative analysis of social and private rates of return in developing Countries,
for example, shows that social returns are higher than private returns (Nafukho, 2004;
World Bank 2000). In Kenya for example, the president rolled out free secondary
education in January 2008 after the successful free primary education that was launched
in 2003. A total of Kenya shillings 2.9 billion was released as the first tranche of funds
for the programme. From the allocation, Kenya shillings 10,265 was to cater for fees per
student per year with other costs such as boarding fees and personal expenses left to the
parents/guardian.

59
During the launch of free secondary education in Kenya, the president was very clear that
the Government will not allow or tolerate schools which impose unauthorized levies,
since they will undermine the successful implementation of the Free Secondary
Education policy whose main objective is to ensure that deserving children from poor
families do not miss out on secondary education. With this directive however, the
national, provincial and district schools continued to charge fees ranging from Kenya
shillings 35,000 to Kenya shillings 60,000 per year. The gaps in fees continue to be met
by the poor parents, thus making it very difficult to successfully finance the secondary
education.
For higher education, funding is based on the number of students admitted through the
Joint Admission Board (JAB) and not the unit cost for running the programmes.
Institutions have to therefore look for other sources to finance the high expensive
programmes such as Engineering, Architecture, Medicine, Science and Agriculture.
Funding to these institutions by the Government has also been static over the past four
years, despite the growth in demand for university education. Out of the 7% allocation for
education, most of the funding is directed to basic education, which is primary and
secondary schools, with public universities and tertiary institutions receiving not more
than 20%.

60
2.7 The Challenges in Maintaining Quality of Teaching Staff
The challenges related to the maintenance of quality of teaching staff at Kenyan
universities include the following:
2.7.1. Financial Constraints
Like most African countries, higher education in Kenya was historically free, with the
public purse covering both tuition and living allowances. The rationale for free higher
education in Kenya was based, among other things, on the country’s desire to create
highly trained manpower that could replace the departing colonial administrators. In
return, graduates were bound to work in the public sector for a minimum of three years
(Chacha, 2004).
By 1974, provision of education in general had expanded dramatically and the number of
students seeking university education had grown to an extent that it was becoming
increasingly difficult to adequately finance university education by providing full
scholarships and grants by the Government. The Government therefore introduced the
University Students Loans Scheme (USLS), which was managed by the Ministry of
Education. Under the scheme, Kenyan students pursuing higher education at Makerere,
Nairobi and Dares Salaam universities received loans to cover their tuition and personal
needs, which they would repay on completion of their education (Chacha, 2004).

61
The USLS was plagued with a number of problems right from the onset. It lacked the
legal basis to recover matured loans from loanees. In addition, the general public and
university students wrongly perceived that the loan was a grant from the Government,
which was not to be repaid (Chacha, 2004).
In order to address this problem, in July 1995, the Government, through an Act of
Parliament established the Higher Education Loans Board to administer the Student
Loans Scheme. In addition, the Board was also empowered to recover all outstanding
loans given to former university students by the Government of Kenya since 1952 and to
establish a revolving fund from which funds can be drawn to lend out to needy Kenyan
students pursuing higher education. The establishment of a revolving fund was also
expected to ease pressure on the exchequer in financing education (Chacha, 2004).
With the rolling of free primary and free secondary education in 2003 and 2008 by the
president of the republic of Kenya, President Mwai Kibaki, the demand for higher
education short up. The revolving fund from the Higher Education Loans Board was not
able to meet the increased demand from the high number of qualified candidates seeking
higher education at both public and private universities.
The Kenya Government’s expenditure on education is 7% of the country’s gross
domestic product (GDP). This is the highest expenditure level per student based on the

62
average education GDP in Africa. However, most of the funding is directed to basic
education, which is primary and secondary schools, with public universities and tertiary
institutions receiving not more than 15%.
Public universities in Kenya have traditionally relied on Government funding to carry out
their activities. Due to the harsh economic situations witnessed by the region over the
recent past, Government support to these institutions has seen a steady decline, and the
universities have been forced to operate under very tight budgets. The situation has not
been made any better by the structural adjustment programmes prescribed by our bilateral
partners. The universities have therefore been forced to rethink their strategy, and
possibly look for extra sources of financing including establishing income-generating
activities (Chacha, 2004).
The funding from Government is also based on the number of students admitted through
the Joint Admission Board (JAB) and not the unit cost for running the programmes.
Institutions have to therefore look for other sources to finance the high expensive
programmes such as Engineering, Architecture, Medicine, Science and Agriculture.
Funding to these institutions by the Government has also been static over the past four
years, despite the growth in demand for university education (Chacha, 2004).
Private universities in Kenya depend for their revenue on the tuition fees they generate
from their students. Such heavy dependence on tuition coupled with lack of alternative

63
income sources has made these institutions expensive and thus unaffordable for most
Kenyans, in effect, limiting their services to the children of high socio economic status
(Chacha, 2004).
As elsewhere in Africa, private expansion sprang forth largely due to the public system’s
failure to meet the demand for higher education. Private higher education has registered
steady increases in enrolment, especially after the rollout of free primary and free
secondary education. Some universities in Kenya, such as university of Nairobi,
Strathmore University and Jomo Kenyatta University of Agriculture and Technology,
have waiting lists of applicants especially for the postgraduate programmes.
2.7.2 Lack of Professional Quality Assurance Expertise
Most of the persons running quality assurance units in most Universities have no
professional expertise on quality issues. Most of the quality assurance representatives are
either lacking experience or have never previously worked in quality assurance,
especially those people from Countries that do not have any established quality assurance
(Magagula, 2005).
Education in Kenya is in a fix, caught between severe budget cuts and a flood of students
in search of education. The free primary and free secondary education programme has
resulted in high number of students at all levels. Class sizes have grown over the years

64
and the student teacher/lecturer ratio shot up at universities. Teaching at universities is
becoming exam-centred and classes are only conducted in order to prepare students for
examinations, rather than following the syllabi. The tutorial classes that used to be run at
universities are no longer done. The Government has also given emphasis to quantitative
expansion of teaching facilities to take care of the increased demand for education, than
the qualitative improvement of higher education.
2.7.3 Political / Leadership Challenges
In many African Countries the majorities of higher education institutions (HEI) is public
and are as such owned by the state. They are regulated, dominated and financed by the
Government through the ministries of higher education. Appointments to key positions
are vetted and influenced by the Government. The members of university council at state
universities are political appointees. There is therefore great political influence on the
institutions and on the quality of teaching staff at such institutions. The private higher
education institutions are also regulated and dominated by the ministries of higher
education. Thus there is great political influence intervening with competition on quality
assurance within higher education institutions (Chacha, 2004).
Globally, the environment of higher education is facing relentless and rapid change.
These circumstances underscore the crucial role of leadership and management in
maintaining morale, enhancing productivity, and helping staff at all institutional levels
65
cope with momentous and rapid change. Those in higher education management and
leadership positions are finding it essential that they understand shifting demographics,
new technologies, and the commercialization of higher education, the changing
relationships between institutions and Governments and the move from an industrial to an
information society (Chacha, 2004).
2.7.4 Lack of a standardized model
The lack of a single model for quality assurance implies that it is extremely complex to
adapt and harmonize different reference points. Many international initiatives, without
any monitoring of their implementation and use, remain a series of good intentions and
exhortations with no indication as to their effectiveness (Magagula, 2005; Sabaya, 2004).
2.7.5 The Challenges of Cross-Border Higher Education in Kenya
The greatest disadvantage of cross-border higher education for developing Countries is
its one-sidedness when compared to the well-established and well-resourced universities
in developed economies. Higher education in most developing Countries is conceived as
a public good, but cross-border higher education is not necessarily driven by
humanitarian motives or by the self-interest of developing Countries’ Governments.
Rather, it is driven by the profit motives of foreign and private-for-profit providers. As a

66
result it threatens Governments’ sovereignty over higher education by challenging their
regulatory powers (Redelinghuys, 2005).
Another disadvantage is that e-learning is not necessarily cheap. Accessing e-
programmes depends on the ability of national citizens to pay for computers, Internet
access, tuition costs and needed supplies. Given the high level of unemployment and
unequal distribution of wealth in developing Countries, only a privileged few are able to
afford this educational track. As Knight (2004) points out, three classes of graduates are
likely to emerge in developing Countries: those who registered with high-quality,
reputable international providers; those who registered with low-quality, cross-border
private, for-profit institutions, and those who registered with underfunded public
universities.
The unregulated cross-border higher education causes inequity, economic disparities and
social tensions in developing Countries. National Governments will likely divert their
critically limited resources to what they perceive as the more pressing challenges of
poverty, high unemployment and the HIV/AIDS pandemic. Even if public funding of
higher education continues, almost certainly it cannot keep pace with the investment
funding of foreign and private for-profit providers of cross-border higher education
(Magagula, 2005).

67
2.7.6 Accreditation of programmes/systems
Accreditation is another challenge facing developing Countries. Currently, no
internationally agreed upon standards of accreditation and quality assurance exist parallel
to the International Organisation for Standardization (ISO) standards for goods and
services. Some Countries have national accreditation procedures for assessing the quality
of both their own and also of foreign and private commercial providers of cross-border
higher education. However, other developing Countries will probably not have the
capacity or the political will to establish accreditation and quality monitoring systems.
Furthermore, even if accreditation procedures were in place, they would not necessarily
cover the complicated issues of cross-border higher education mobility, cultural
nuisances and jurisdictional systems (Magagula, 2005).
2.7.7 The brain drain Challenges
Socio-economic and political developments, in combination with processes of
globalization, and the space-time compression that has come with developments in the
area of information and communication technologies, have contributed towards the flow
of highly skilled individuals from one end of the world to the other. The brain drain has
basically been caused by the push and pull factors (Tettey, 2006).

68
The former is driven by such concerns as economic constraints, political turmoil or
intolerance, as well as social and psychological pressures. In addition to these push
factors; industrialized countries are attractive to many professionals from poorer
countries for a variety of reasons which constitute the pull factors. These include the
promise of economic success or political sanctuary. These pull factors have been
facilitated by the increasing shortage of skilled labor (Tettey, 2006).
Developed Countries are able to attract highly skilled workers from developing
Countries, especially in the critical fields of science and ICT. There is a growing mobility
of academics, professional and skilled workers, especially given the usually less
attractive terms and conditions of service, salary structures and work environments in
developing Countries. Clearly, the assumption that both developed and developing
economics compete fairly in an open market for human capital and that developing
Countries have equal chances of attracting highly skilled human capital is faulty
(Magagula, 2005).
While the literature on brain drain from the developing world tends to point to the
industrialized world as the beneficiaries, it is important not to lose sight of the nodes of
attraction within the developing world as well. This is illustrated in the Southern African
context, where Lesotho had only 1,839 nurses listed in its medical and dental register in
mid-1998, while many of them flocked to South Africa to take up positions because of
better salaries and working conditions (Tettey, 2006).

69
Another dimension of the brain drain that is not discussed much, but which is very
relevant to the sustainability of academic institutions, in particular, is the internal brain
drain. This refers to movements of highly skilled professionals away from institutions of
higher education to other sectors within the same country. The reasons for these outflows
from academia are varied, but largely economic. In fact, academic staff are also lured
away by a variety of Government agencies, where salaries are often better and the
working environment more comfortable. In many cases, the salaries and benefits in
universities are lower than comparative positions in and outside of the civil service
(Tettey, 2006).
These realities erode the capability of academic institutions to build the human capacity
needed for socio-economic and political development in other areas of society. While
individuals who move to other organizations may contribute to the specific activities of
that organization, their departure from academe means that the synergies that come with a
group of academics working together is diminished, and the impact and scope of
knowledge production and dissemination is lessened (Tettey, 2006)
Universities, especially public ones, have almost exclusively depended on the
Government for remunerating their staff. This has led to a situation where staff are not
paid as well as their counterparts in the more developed societies, or even in some of the
private universities. Many professors have therefore decamped to other countries in

70
search of better pay, affecting the teaching needs of Kenyan universities. Demand for
better pay has often led to standoffs between the Government and the university
academic staff union (Chacha, 2004).
2.7.8 The Diversity of Education Systems in East Africa
Because Kenya follows an 8-4-4 system while Tanzania and Uganda follow a 7-4-2-3
system of education, public Universities in Uganda require that the Kenyan candidates
undergo A – level studies for 2 years while the private Universities insist on a 6-9 months
bridging course before candidates can join the institutions (Maviiri,2007).In Tanzania,
the Kenyan and Ugandan students have to sit for the Matriculation examination and this
has resulted in fewer foreign students going to study in Tanzania.
2.7.9 Lack of Harmonized Admission/Accreditation Criteria
Another challenge is the evaluation of the credentials of international students. With the
mushrooming of new and private institutions admitting many foreign students, vetting
students’ credentials is not easy and quality is thus not assured. Regulating of these many
institutions is made even more difficult by their numbers as well as the lack of adequate
staff and logistical policies as to how to carry out inspections and evaluations. There is
also lack of harmonized means of accreditation of universities within the region (Maviiri,
2007).

71
2.7.10 Differences in Education Priorities
The market approach of cross-border higher education, with its emphasis on maximizing
profits and minimizing costs, has made Universities to concentrate on offering courses
with high market demand. Even though less popular and more costly courses might be
crucial for social-economic and political development, they are likely to become the
responsibility of public/non-profit institutions (Knight, 2004). This split will invariably
lead to a differentiated discipline-based menu for programmes and courses for foreign
and for profit providers and for the non-profit providers.
The dawn of a global knowledge society also with information-driven economies and
expansions in international higher education markets is placing new demands on them to
search for more innovative approaches in academic course provisions; revenue
generation; uncertain educational quality; institutional governance, and human resource
management and to address longstanding difficulties caused by rapid enrolments;
financial constraints; frequent labour strife and brain drain (Chacha, 2004).
2.7.11 Cultural Challenges
In addition to differences in educational priorities, another challenge is that foreign and
private for-profit providers of cross-border higher education do not necessarily share the
72
same cultural values of each of the individual Countries. Cross border higher education
might then become a tool for eroding national cultural identities (Magagula, 2005).
There is also the challenge of developing Countries being flooded with foreign and
private providers delivering essentially profitable subjects and in these areas they will
pose a serious competition to local Universities, leaving the latter to deal with “non-
profitable” subjects in arts, humanities, science and technology, so vital for a Country’s
development. This is a result of heavy investment in terms of qualified human resources,
equipment and facilities, that must go into these so called “not profitable” subjects. In
addition, other pertinent issues and challenges exist in the provision of cross border
Higher Education in East Africa, with its diversity in culture, economic status and
educational policy issues (Maviiri, 2007).
The participation of women in higher education is very low in Kenya, in large part
because of traditional cultural values that emphasize women's roles as wife and mother.
Women in Kenya are underrepresented in higher education (HE) institutions as students
and as workers. While gender disparities in students' enrolment exist at all levels of HE,
they are particularly wide at higher degree levels and in science, mathematics and
technology oriented subjects. At the same time, women are underrepresented in teaching
and in the administration of these institutions. Further, women academics are
concentrated in the lower ranks of the hierarchy and in the traditional ‘female' social

73
science and education disciplines while as administrators they are few and far in between
in the higher ranks of HE administration(Chacha,2004).
2.8 Chapter Summary
This chapter broadly covered the literature on quality at institution of higher learning by
looking at the general review of quality , the conceptual framework , the key parameters
affecting quality of teaching staff at universities including the Government and
Commission for Higher Education (CHE) ; human resource management practices;
continuing professional development (staff development); teaching facilities and the
general challenges in sustaining quality at Kenyan universities.

74
CHAPTER 3
RESEARCH METHODOLOGY
3.1 Introduction
This chapter provides information on the methodology that is used in the study, research
design, population of the study, sampling method and data collection Instruments used.
The chapter also explains data collection procedures and analysis.
3.2 Research Design
The design this study adopted is a quantitative research approach. Quantitative research
relies on the principle of verifiability making it possible to establish the cause and effect
relationship. The quantitative research approach was in form of a survey describing a
phenomenon associated with subject population or estimating proportions of the
populations with certain characteristics (Kothari, 2009; Mugenda & Mugenda, 1999).
A survey design was appropriate in establishing the role of Government and Government
agencies in promoting quality of teaching staff at Kenyan universities; ascertaining the
effects of human resource management (HRM) practices on service quality;
establishing the effects of continuing professional development (staff development) on
quality of teaching staff at Kenya universities; examining the effect of teaching facilities

75
on quality of service and establishing the challenges associated with maintenance of
quality. Taking account of all the research questions, the factors affecting the quality of
teaching staff at institutions of higher learning was ascertained.
3.3 Population of Study
The target population was university teaching staff from all the public and private
universities in Kenya, which is 4,000. The respondents were differentiated in terms of
gender and designation in the private and public universities. The population distribution
used is summarized in Table 3.1.
Table 3.1: Population used
S/no Stratum Size Percentage
1 Public universities staff 3,480 87
2 Private universities staff 520 13
Total 4,000 100
Source: MOEST (2006)

76
3.4 Sampling
The method of sampling used was stratified random sampling (Kothari, 2009). The 5
public universities and 3 private universities formed the stratum for this study. These are:
Kenyatta University, Jomo Kenyatta University of Agriculture and Technology,
University of Nairobi, Egerton University, Narok University College, United States
International University (USIU), Kabarak University and KCA University. The criteria
used for stratification across the strata were gender, age and designation.
The sampling frame of the study was lecturers distributed based on the weighted
percentage in the stratum, targeting at least 120 respondents, derived as per Table 3.2.
This is based on optimal allocation with fixed sample size (Neyman allocation). Under
this method, considering the high number of lecturers in public universities as opposed to
private universities, the sample for stratum h (nh) is computed as:
nh =n (Nh*σh) / Σ (Ni* σi) .
Where: nh is the sample size for stratum h
Nh is the population size for stratum h
σh is the standard deviation for stratum h
Σ Ni is summation of population for the strata
Σ σi is the summation of standard deviation for the strata
n is the total sample size.

77
Using the above formula, the resulting percentages and number of respondents from the
two stratums are as given in Table 3.2. The respondents from the 5 public universities
and 3 private universities were selected randomly across the departments (Kothari, 2009).
This method was considered appropriate so as to maximize precision given a stratified
sample with fixed sample size.
Table 3.2 Sampling Frame
3.5 Data Collection Instrument
The instrument of data collection was a questionnaire, developed by the researcher (see
Appendix 1). The questionnaire was used to obtain information about the study by
linking all the items to the specific objectives and research questions. The instrument had
questions on the role of Government and Government agencies in promoting quality of
S/no Stratum Size Percentage Standard
Deviation
Weighted
population
Percentage Sample
Public universities
Staff
3,480 87 1 3,480 77 592888
290806
8800
Private universities
Staff
520 13 2 1,040 23 2928
Total 4,000 100 4,520 100 120

78
teaching staff, the effect of HRM on quality, the effect of continuous professional
development on quality and the effect of teaching facilities on quality of teaching staff.
The instrument had also a global question on challenges in maintaining quality of
teaching staff at universities in Kenya.
The questionnaire had items with a combination of open-ended, closed-ended,
contingency and matrix questions. The Likert’s four point scale and summated scale was
used for measuring attitudes (Kothari, 2009). In this study, a four point scale was used to
produce a forced choice measure to avoid possibilities of indifferent opinion (neither
agree nor disagree). Also, use of the four point scale reduces the central tendency bias
where participants may avoid extreme response categories and concentrate on the middle
values (neither agree nor disagree) that cannot be objectively used to make a decision or a
conclusion.
The questionnaire also provided for clear differentiation of respondents in terms of
gender, age and designation. Through this, the respondent had a complete freedom of
response, with a list of alternative possible answers. This type of questionnaire also
provided more information to the responded and also provided an opportunity to measure
other attributes that could have not easily been obtained through other methods of data
collection. The method adopted was useful in reducing subjectivity and also facilitated
use of quantitative analysis (Kothari, 2009).

79
The instrument was pre-tested with 10 respondents at Jomo Kenyatta University of
Agriculture and Technology (JKUAT). During pre-testing, the respondents were
encouraged to make comments and suggestions concerning instructions, clarity of
questions and relevance (Mugenda & Mugenda, 1999). The pre-testing done facilitated a
review and rephrasing of some of the items that were vague and not clear, while
maintaining the same meaning to all subjects. Pre-testing also enhanced adequacy,
reliability and quality of the questionnaire (Mugenda & Mugenda, 1999).
3.5 Data Collection
In this research, drop and pick was used in the data collection (Kothari, 2009). This
method was considered appropriate considering the nature of the items in the
questionnaire, the length of the questionnaire, the availability of the respondents and the
geographical dispersion of the sample selected. The instruments were dropped and picked
by the researcher between the months of October 2009 and February 2010 at the various
universities. For universities outside Nairobi, most of the data was collected in the
months of November and December 2009 while universities around Nairobi spread to
February 2010.
Questionnaires were administered by the researcher to the teaching staff at the sampled
universities. All cadres of teaching staff were considered in this research ranging from
Teaching Assistants to Professors. Respondents were given adequate time to fill the
80
questionnaires, which were later picked by the researcher at various convenient intervals.
Though there was representation at all levels of the teaching staff, lecturers and assistant
lecturers were the majority in responses to the research questionnaire. Some Universities
especially private had nil responses for professors since they are yet to have full staff
establishment at the higher levels. Out of the 120 questionnaires distributed, a total of
102 were responded to. By applying the principles of Schiffman and Kanuk (1997) that
small sample sizes can provide highly reliable findings depending on the sampling
procedures adopted, the responses received were considered adequate and representative
of the total population of teaching staff at universities.
3.6 Data Analysis
The data collected was analyzed using the Statistical Package for Social Scientists (SPSS)
software, Microsoft excel and other systems. All the questionnaires received were
referenced and items in the questionnaires coded to facilitate data entry and ensure
uniqueness. The reliability of the data collected was judged through tests. During
analysis, reliability tests were undertaken to check on any unusual cases, using
Cronbach’s Alpha. For all cases, reliability test using Cronbach’s Alpha gave very high
values (high of 0.918 and low of 0.856) with an average index of 0.9, signifying the
reliability of the data collected1. Face and content validity was proved through internal
1 Results of reliability test using cronbach alpha are in the appendix 2

81
checkups. The positive correlation matrix between the different items was also prove of
the convergent validity.
Descriptive statistics reports, representing the various research items were developed
during the analysis. The tables generated gave absolute means and percentage responses
to all the items in questionnaire using the four point likert scales. The measurement tool
ranged from 1 to 4 with 1 representing the minimum score and 4 the maximum rated
score.
Factor analysis was also done for the five research hypothesis, using principal component
analysis method. Through this, it was possible to reduce data from all the original
measures, while still maintaining all the information contained. This method was
considered important for the study in measuring similar items conceptually, from a large
set of correlated variables. Other tests done are analysis of variance (ANOVA), chi-
square test, correlations, paired sample tests, paired sample correlations, pareto test, t-test
and independent sample tests were undertaken (Norusis,1990).
Cross tabulations was also used to assess the relationship between two categorical
variables. According to Norusis (1990), cross tabulations can be used to statistically test
whether two categorical variables are independent or dependent. Pearson chi-square
values and associated probability values (P-values) were used to ascertain the statistical
significance of relationships.

82
CHAPTER 4
RESEARCH FINDINGS AND DISCUSSIONS
4.1. Introduction
This chapter contains information on the analysis of the responses and explanations for
all the items in the questionnaire as derived from the research objectives and research
questions in chapter 1. The data collected from respondents is presented and summarized
using Tables, graphs and descriptive statistics. In this research, a total of 102
questionnaires consisting of 71 % male and 29 % female were responded to from the
sampled universities as provided in Figure 4.1.
Figure 4.1: Response by Gender
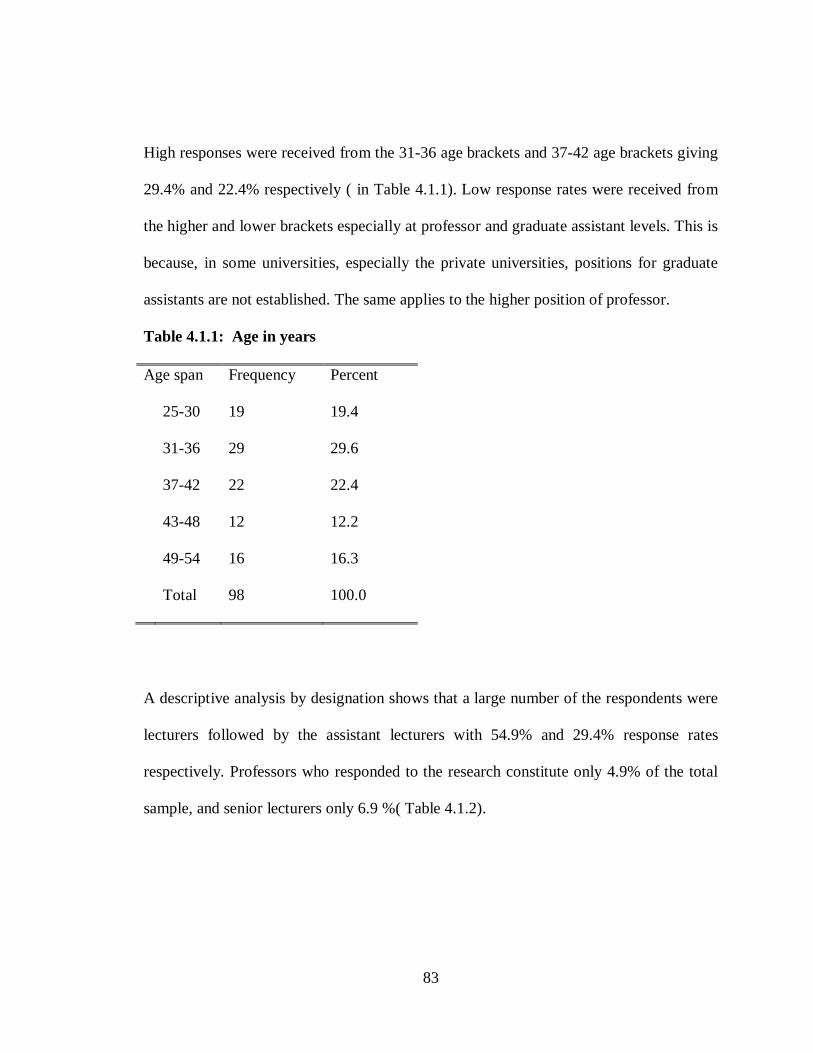
83
High responses were received from the 31-36 age brackets and 37-42 age brackets giving
29.4% and 22.4% respectively ( in Table 4.1.1). Low response rates were received from
the higher and lower brackets especially at professor and graduate assistant levels. This is
because, in some universities, especially the private universities, positions for graduate
assistants are not established. The same applies to the higher position of professor.
Table 4.1.1: Age in years
Age span Frequency Percent
25-30 19 19.4
31-36 29 29.6
37-42 22 22.4
43-48 12 12.2
49-54 16 16.3
Total 98 100.0
A descriptive analysis by designation shows that a large number of the respondents were
lecturers followed by the assistant lecturers with 54.9% and 29.4% response rates
respectively. Professors who responded to the research constitute only 4.9% of the total
sample, and senior lecturers only 6.9 %( Table 4.1.2).

84
Table 4.1.2: Analysis by Designation
Designation Frequency Percent
1 Graduate assistant 4 3.9
2 Assistant lecturer 30 29.4
3 Lecturer 56 54.9
4 Senior lecturer 7 6.9
5 Professor 5 4.9
Total 102 100.0
In this research, the highest responses were received from Kenyatta University, Jomo
Kenyatta University, Egerton University, Narok University College, University of
Nairobi and KCA University. Very low responses were received from Kabarak
University and the United States International University (Table 4.1.3). In total 22,
questionnaires were received from private universities and 80 from public universities, a
proportionate representation from each stratum.

85
Table 4.1.3: Analysis by University
University Frequency Percent Cumulative
Percent
University of Nairobi 12 11.8 11.8
Kenyatta University 18 17.6 29.4
Jomo Kenyatta University of Agriculture
and Technology
19 18.6 48.0
United States International University 4 3.9 52.0
KCA University 11 10.8 62.7
Egerton University 18 17.6 80.4
Narok University College 13 12.7 93.1
Kabarak University 7 6.9 100.0
Total 102 100.0
4.2 The Role of Government and Government Agencies in promoting quality
In the study, the mean levels of acceptance on the level of autonomy and accountability
to the Government recorded were 3.34 and 3.23 respectively out of 42. The maximum and
minimum in this case refers to the maximum and minimum scores given to the two
attributes by the respondents. From the results, most of the respondents accept that
2 The interpretation of means is as follows: strongly disagree (1.00-1.74), disagree (1.75-2.49), agree (2.50-3.24), strongly agree (3.25-4.0)

86
universities in Kenya are semi-autonomous (Table 4.2.1). Though semi autonomous
however, 81% of the respondents agree that the universities are accountable to the
Government either directly or indirectly through the regulatory Government agencies.
Table 4.2.1 Relationship between Universities and Government Universities are semi-
autonomous
Universities are accountable to
the Government
N 102 102
Mean 3.34 3.23
Median 3.00 3.00
Std. Deviation .589 .595
Minimum 2 2
Maximum 4 4
Percentage 83.5 81
Ninety percent of the respondents also agree that the Kenya Government supports student
learning at public universities. This is partly because of the Government’s commitment to
drive education for all across the country as part of its commitment to human resource
development (Table 4.2.2).
Disbursements of financial resources to the public universities are not prompt and the
Government has reduced its daily contribution in the affairs of the universities. The
research also indicates that the hiring of senior managers at universities by the
Government is not competitively handled and the Government role in the attraction and
retention of staff at public universities is minimal (Table 4.2.2).

87
Although the commission of higher education (CHE) is involved in the regulation of
programmes by private universities, their contribution in curriculum development is
minimal, with a cumulative 56.5% discrediting the Government’s (CHE) contribution.
Other areas that the Government and commission for higher education is not actively
facilitating includes contribution to quality improvement of university programmes,
provision of quality and quality assurance guidelines for university resources and
facilitation of external quality assurance by the commission (Table 4.2.2).

88
Table 4.2.2: Government and CHE Roles in Promoting Quality 1 2 3 43
% % % %
1 Universities are semi- autonomous4 5.9 53.9 40.2
2 Universities are accountable to the Government 8.8 59.8 31.4
3 Government has a direct hand running of universities 10.8 47.1 24.5 17.6
4 The Government is involved in staffing 14.3 33.7 38.8 13.3
5 Staffing is competitively handled by the Government 18.0 54.0 27.0 1.0
6 remuneration for managers are competitive 17.3 23.5 43.9 15.3
7 Kenyan Government supports projects in universities 7.8 17.6 64.7 9.8
8 Disbursement of financial resources is prompt 19.4 34.7 43.9 2.0
9 Governments supports student learning in public universities 1.0 8.8 64.7 25.5
10 The Governments supports student learning in private
universities
8.0 33.0 52.0 7.0
11 Government is able to monitor performance 7.1 36.4 47.5 9.1
12 The Government monitors curriculum on offer 13.9 42.6 37.6 5.9
13 Universities provide quarterly /annual returns/reports to
Government on performance
7.7 19.8 65.9 6.6
14 The Government is adequately represented in major
decisions of universities
15.2 26.1 50.0 8.7
15 Government encourages staff development 9.0 32.0 48.0 11.0
16 The Government regulates private and public universities
through CHE
1.0 17.8 56.4 24.8
17 The commission accredits all programmes offered 10.0 22.0 57.0 11.0
18 The commission is involved in university quality 8.1 39.4 39.4 13.1
19 The commission facilitates external quality assurance 6.1 42.9 40.8 10.2
20 The commission issues guidelines on quality 3.3 39.6 44.0 13.2
3 1= strongly disagree;2= disagree; 3=agree;4=strongly agree 4 see appendix 1

89
An analysis undertaken to ascertain levels of university autonomy as per responses
received using the Chi-square Test gave positive results of 0.75 using Pearson chi-square,
0.730 using the likelihood ratio and 0.529 using linear by linear association. These are as
tabulated in Table 4.2.3. The results justify the earlier high percentage acceptance that
universities are autonomous.
Table 4.2.3: Chi-square Test on University Autonomy
Value Degrees of
freedom
Asymp. Sig.
(2-sided)
Pearson Chi-square .576(a) 2 .750
Continuity Correction
Likelihood Ratio .629 2 .730
Linear-by-Linear
Association
.397 1 .529
N of Valid Cases 102
On resource disbursement, majority of the respondents disagree that disbursement to
universities is prompt. Only 44 % of the respondents do agree that it is prompt with 2%
strongly agreeing (Figure 4.2). Resources, being a contributor to university operational
efficiency, require to be disbursed in a timely manner and the large negative response of
19% and 35% needs to be addressed. This supports an earlier research by Bradley in 2005
that the percentage of the institution’s income derived from national or state

90
Governments has declined even with the growth in the perceived importance of higher
education to Governments.
Figure 4.2 Resource Disbursement
From the results of the study, 13% strongly agree that the commission issues from time to
time guidelines for quality assurance while 44% agree, giving a cumulative percentage
of 57 % (Figure 4.3) . This is a satisfactory response from the stakeholders about the
commission’s mandate. However, according to its statutory powers, CHE is expected to
play an active role in the planning, development, budgetary matters and maintaining

91
quality education. The politicisation of quality of university education seems to have
effectively denied the Commission this particular role, thus the 43% negative responses
on its ability to monitor and ensure quality of programmes at institutions of higher
learning, especially the public universities. This will even be worse with time with the
additional number of university colleges that were established in the years 2007 to 2010.
Figure 4.3 Guidelines for Quality Assurance
While the Kenya Government monitors the development of curriculum at public
universities through the respective performance contracts and representation during
development and implementation, programmes in private universities are first considered
and approved by the commission for higher education before roll out. This is aimed at
enhancing quality and supports an earlier research by Vidovich (2001) and Billing
(2004).

92
The regulatory role of the commission on both private and public universities, as earlier
researched, is still strong with 55.9% of the respondents agreeing and 24.5% strongly
agreeing (Figure 4.4). It therefore means that the universities adequately understand the
regulatory role of the commission as provided in its mandate, and continues to be
represented in the commission board, though the commission does not have enough teeth
to bite, as provided in its mandate.
Figure 4.4 Regulation of both Private and Public Universities
In reality, even after the establishment of CHE, public universities continued to argue
their individual budgetary submissions with the treasury, liaising with each other and
collectively through the committee of vice-chancellors, irrespective of the provisions of
the mandate for CHE. The conflicting mandate of CHE and statutes of the public

93
universities provide for this confusion. Interestingly, the Government recognizes and
supports this autonomy as they deal with the public universities direct in day to day
activities, budgetary allocations and performance contracting, with each public university
having an autonomous gazetted University Council.
This confusion, however, does not appear to be serious in the private universities where
the mandate of examining and approving proposals for courses of study and course
regulations submitted to it by private universities and receiving and considering
applications from persons seeking to establish private universities in Kenya is adequately
premised within the Commission(Universities Act,1985).
Though limited in capacity, the Commission for Higher Education has actively been
involved in provision of guidelines to ensure quality of programmes and quality of
service at universities. For example, all private universities with charters had to show
their human resource capacity for various programmes before approvals are made to
allow them offer those programmes. The Commission of Higher Education has also
provided guidelines for curriculum development across all universities and unless and
until any new programmes have satisfactory met all these requirements, they cannot be
rolled out. This almost cements Harvey’s earlier research on External quality monitoring
to ensure accountability and conformity (Harvey, 2002).
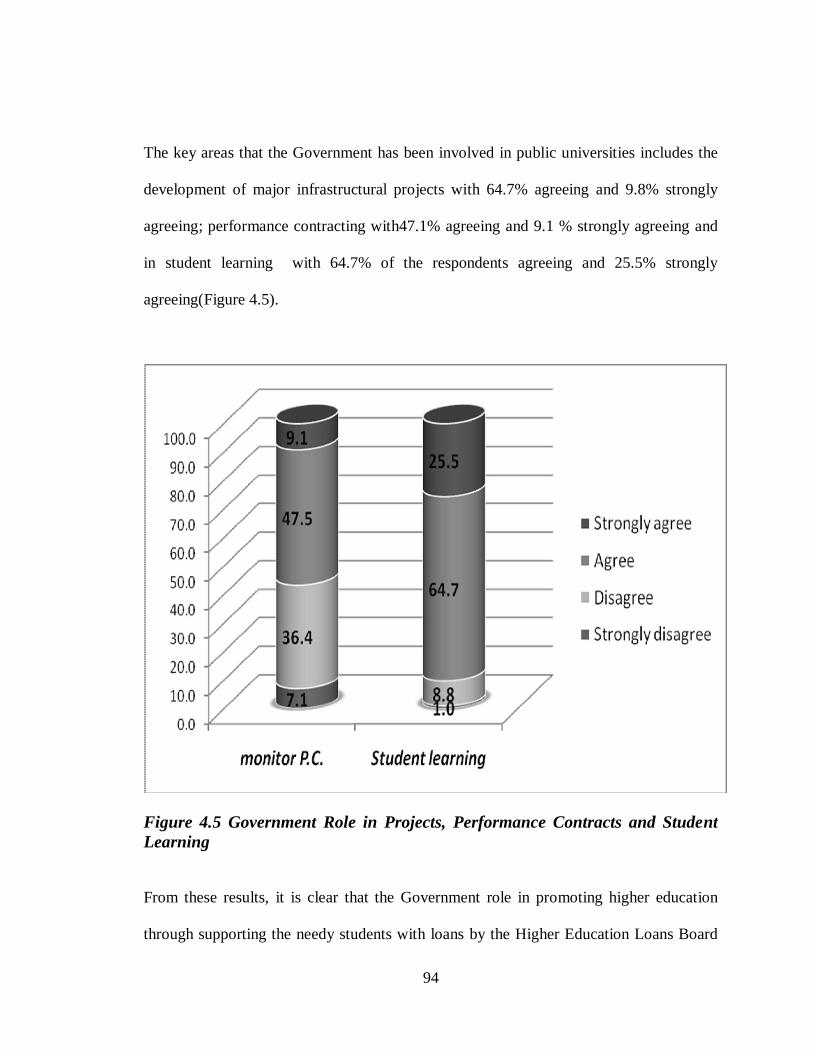
94
The key areas that the Government has been involved in public universities includes the
development of major infrastructural projects with 64.7% agreeing and 9.8% strongly
agreeing; performance contracting with47.1% agreeing and 9.1 % strongly agreeing and
in student learning with 64.7% of the respondents agreeing and 25.5% strongly
agreeing(Figure 4.5).
Figure 4.5 Government Role in Projects, Performance Contracts and Student Learning
From these results, it is clear that the Government role in promoting higher education
through supporting the needy students with loans by the Higher Education Loans Board

95
is strongly recognized and has addressed the challenge that was there before its
enactment in July 1985, when the University Students Loans Scheme (USLS), which
was managed by the Ministry of Education lacked the legal basis to administer loans as
well as the mandate to recover loans from students after completion of their education.
Other areas where the Government role is strongly felt includes monitoring and
evaluation through quarterly and annual performance contracts reports to the Government
(72.5%), representation in key issues of the universities (58.7%) and involvement in staff
development through provision of research and innovation funds (59%). Indeed, the
Government, through the National Council of Science and Technology (NCST), has been
funding research by lecturers at universities.
This supports the earlier research on Government’s desire for control, especially to assure
on diversity and richness of what universities do. Such activities are part of the
Governments’ commitments in improving the efficiency and effectiveness of large,
complex institutions that are vital to the nation’s needs and in which Government,
business, professional associations and hundreds of thousands of domestic and
international students have a keen interest.
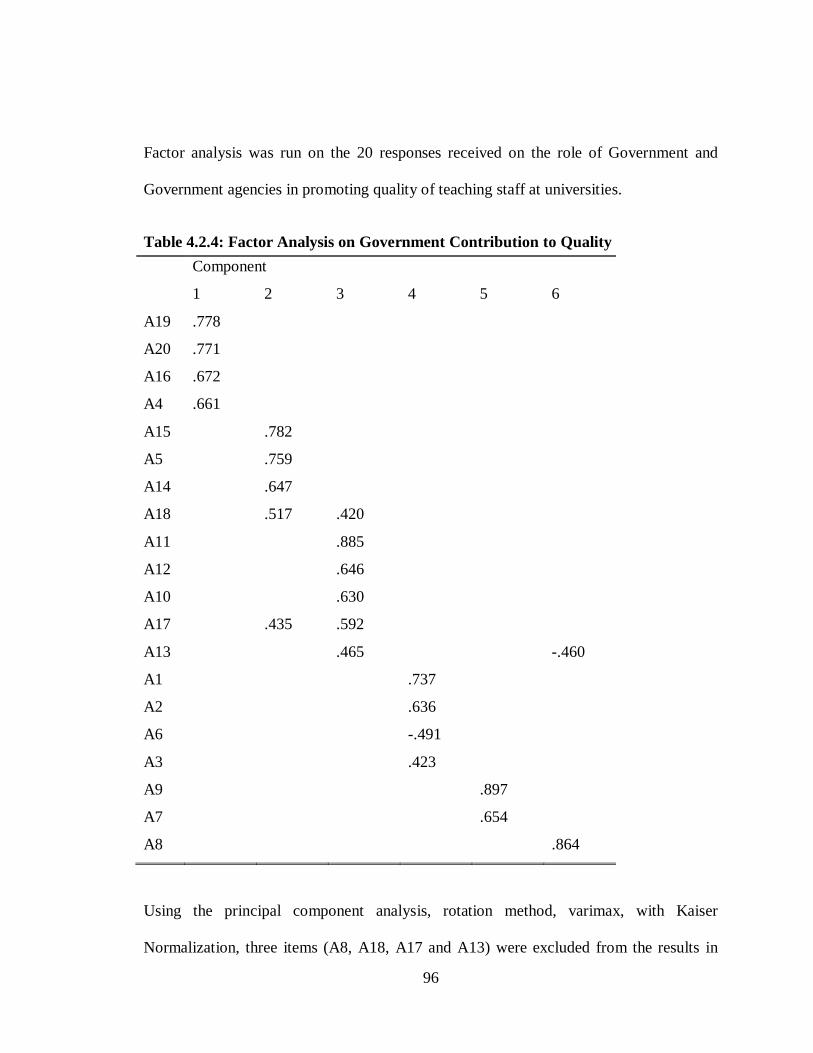
96
Factor analysis was run on the 20 responses received on the role of Government and
Government agencies in promoting quality of teaching staff at universities.
Table 4.2.4: Factor Analysis on Government Contribution to Quality Component
1 2 3 4 5 6
A19 .778
A20 .771
A16 .672
A4 .661
A15 .782
A5 .759
A14 .647
A18 .517 .420
A11 .885
A12 .646
A10 .630
A17 .435 .592
A13 .465 -.460
A1 .737
A2 .636
A6 -.491
A3 .423
A9 .897
A7 .654
A8 .864
Using the principal component analysis, rotation method, varimax, with Kaiser
Normalization, three items (A8, A18, A17 and A13) were excluded from the results in

97
table 4.2.4, resulting into five factors (Figure 4.6). The five factors include: quality
assurance; staffing and staff development; performance based management; autonomy
and mandate of universities and financial resources (support)5.
Figure 4.6 Factor Analysis on Government Role in Quality
From the results, the Government role as a regulatory organ of the universities came
highest with a mean of 3.02 while the human resources management practices at
universities was rated least with a mean of 2.41. These results give a clear statement that
universities remain to be autonomous as provided in the various Acts that created them
in contract to the supervisory role that the commission for higher education was created
to provide. The Commission for Higher Education, though mandated to monitor quality 5 The interpretation of means is as follows: strongly disagree (1.00-1.74), disagree (1.75-2.49), agree (2.50-3.24), strongly agree (3.25-4.0)
Quality assurance (A19, A20, A16). Mean 2.70
Human resource management (A15, A5, A14) Mean 2.41
Performance management (A11, A12, A10) Mean 2.51
Financial resource (A7, A9) Mean 2.96
Regulatory organs (A1, A2, A3) Mean 3.02
Government role in quality

98
of programmes on offer at both public and private universities, is not directly able to
control the running of these universities as also earlier proved by Sifuna (1998) and
Chacha (2004). The missing link on the role of the commission for higher education on
university education, especially public universities therefore continues to persist.
The poor ratings on resource and performance management at the universities imply that
universities are not able to meet their obligations as and when they fall due as a result of
these limitations. This factor has an impact on all the other factors as they rely on
financial resources. As also earlier researched by Chacha(2004), funding for higher
education by the Government must be re-defined to factor in the unit cost of running the
programmes as well as the timely provision of these resources to support the teaching
and learning.
On performance management, the Government role in monitoring performance gave a
mean of 2.51. The low ratings on performance however, arose out of the poor response
rates on the ability and role of Government to monitor curriculum development,
implementation and evaluation. From the results therefore, it comes out that while the
Government is in the forefront crusading for quality at universities, it does not have
elaborate mechanisms to ensure that quality is enhanced and maintained at these
universities. The factor also indicates that the Government role and ability to support
student learning in private universities as well as monitor performance of key managers
at universities is low.

99
4.3 Effect of Human Resource Management practices on Quality of teaching staff
To ascertain the role of human resource management in improving quality, a descriptive
analysis was done on a number of items as given in Table 4.3. The analysis found that
managers understand the university goals and objectives (89.5%); are responsive to
employees’ questions and concerns (60%); enhance quality of service given by
employees (59.6%) and regularly appraise their employees (55%). However usage of
other human resource management tools for improving quality were rated below average
including caring for career development(43.1%); promoting staff on merit(48.6%); hiring
only competent staff(44.5%); investing in professional development (47.1%) and having
attractive compensation as compared to other institutions (42.7%).
The biggest challenge in human resource development however rests in recommending
low performer for training/couching (22.4%), providing prompt feedback (24.8%),
ensuring that compensation is equitable and fair (31.3%) and enhancing performance
based pay (29%). This therefore creates a complete disconnect on the role of human
resource management is supposed to play in improving the quality of teaching at
universities. The results negate the HRM practices that managers must implement to
strengthen the perceptions of employees as well as customers that the organization is
service oriented and is above board.

100
Table 4.3.1: HRM practices and Quality
1 2 3 46
% % % %
1 The university managers clearly understand university goals and
objectives
5.3 5.3 66.3 23.2
2 The university managers provide employees with the information
necessary to promote high quality service
6.1 46.9 35.7 11.2
3 The university managers are responsive to employees' questions
and concerns
5.0 35.0 42.0 18.0
4 The university leaders enhance the quality of service given by
employees
2.0 38.4 47.5 12.1
5 The managers care for career development for employees 15.8 35.6 44.6 4.0
6 Promotions are based on merit at the university 22.5 34.3 40.2 2.9
7 Only qualified and competent staff are hired 22.8 32.7 38.6 5.9
8 The university invests in professional development for staff 15.7 37.3 36.3 10.8
9 Training needs assessment is clear and unbiased 17.2 53.5 25.3 4.0
10 Compensation is attractive compared to other training institutions 15.3 41.8 35.7 7.1
11 Compensation is performance based 14.0 57.0 27.0 2.0
12 Compensation is equitable and fair 16.2 52.5 30.3 1.0
13 Employees are regularly appraised/evaluated 10.0 35.0 51.0 4.0
14 Employees receive feedback on their performance 21.4 33.7 34.7 10.2
15 Feedback is prompt 25.7 49.5 24.8
16 There is recognition/reward for high performers 18.6 43.1 35.3 2.9
17 Low performers are recommended for training/couching 26.5 51.0 20.4 2.0
From the results, 27% of the respondents strongly disagree that the low performers are
recommended for training/couching and 51% disagree (Figure 4.7). Generally, this is an
indication that universities are not keen in enhancing performance of their staff through
6 1= strongly disagree;2= disagree; 3=agree;4=strongly agree
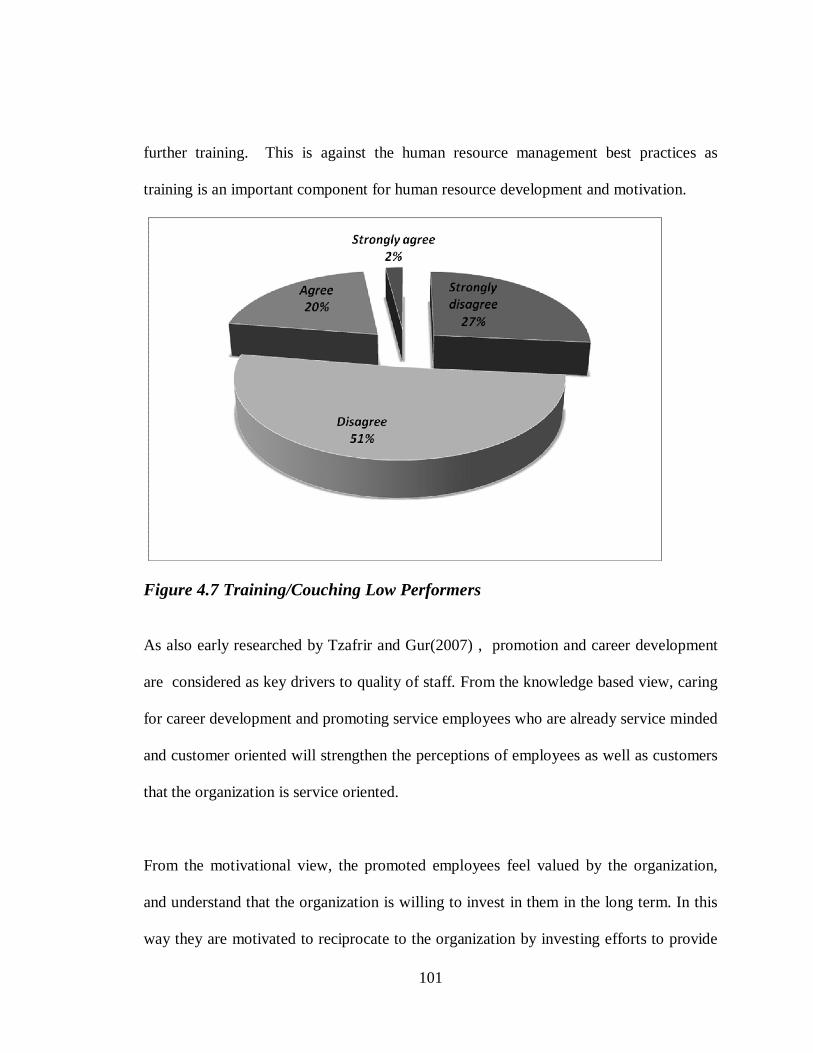
101
further training. This is against the human resource management best practices as
training is an important component for human resource development and motivation.
Figure 4.7 Training/Couching Low Performers
As also early researched by Tzafrir and Gur(2007) , promotion and career development
are considered as key drivers to quality of staff. From the knowledge based view, caring
for career development and promoting service employees who are already service minded
and customer oriented will strengthen the perceptions of employees as well as customers
that the organization is service oriented.
From the motivational view, the promoted employees feel valued by the organization,
and understand that the organization is willing to invest in them in the long term. In this
way they are motivated to reciprocate to the organization by investing efforts to provide

102
quality service to customers (Tzafrir & Gur 2007). From the results of the research
therefore, management is poorly applying the human resource tools for promoting quality
as little emphasis is given to training, pay packages for staff, merit based promotions and
feedback on performance.
Generally, the bureaucratic red-tape that tends to surround promotion and appointment
processes was realized. This is supported by the 22.5% strongly disagreeing and 34.3% %
of the respondents disagreeing that promotion are based on merit (Figure 4.8). For the
teaching staff, the minimum benchmark for promotion from one level to another may not
be standard from one institution to the other. This is the case especially for the new
constituent university colleges that were created in the year 2008, which had to bend their
criteria in order to attract teaching staff from the established public universities.
The 40.2 % of respondents supporting the promotion criteria in use may have been the
beneficiaries of these new Constituent Colleges. Also, the criteria and procedures for
promotion and permanent appointment are long, stressful and cumbersome in some of the
established public universities, contributing to the low evaluation recorded on this item.
For example, appointments are held up for inordinately long periods of time because
external assessors delay in submitting their evaluation.

103
Figure 4.8 Promotions are based on Merit
On feedback, 25.7% of the respondents strongly disagreed that it is prompt while 49.5%
disagreed. Only 24.8% are happy with the timeliness of feedback on their performance
(Figure 4.9). This therefore means that the lecturers are not able to quickly detect areas of
weakness or poor performance so as to improve. This means that little emphasis is given
on feedback as a mechanism for communicating performance of the teaching staff.

104
As earlier also suggested by Tzafrir & Gur in 2007, a comprehensive and accepted
appraisal system can provide valuable feedback to employees and assist managers in
making decisions regarding the individual employee, so as to give strategic direction on
institutional human resource position and needs.
Figure 4.9 Feedback
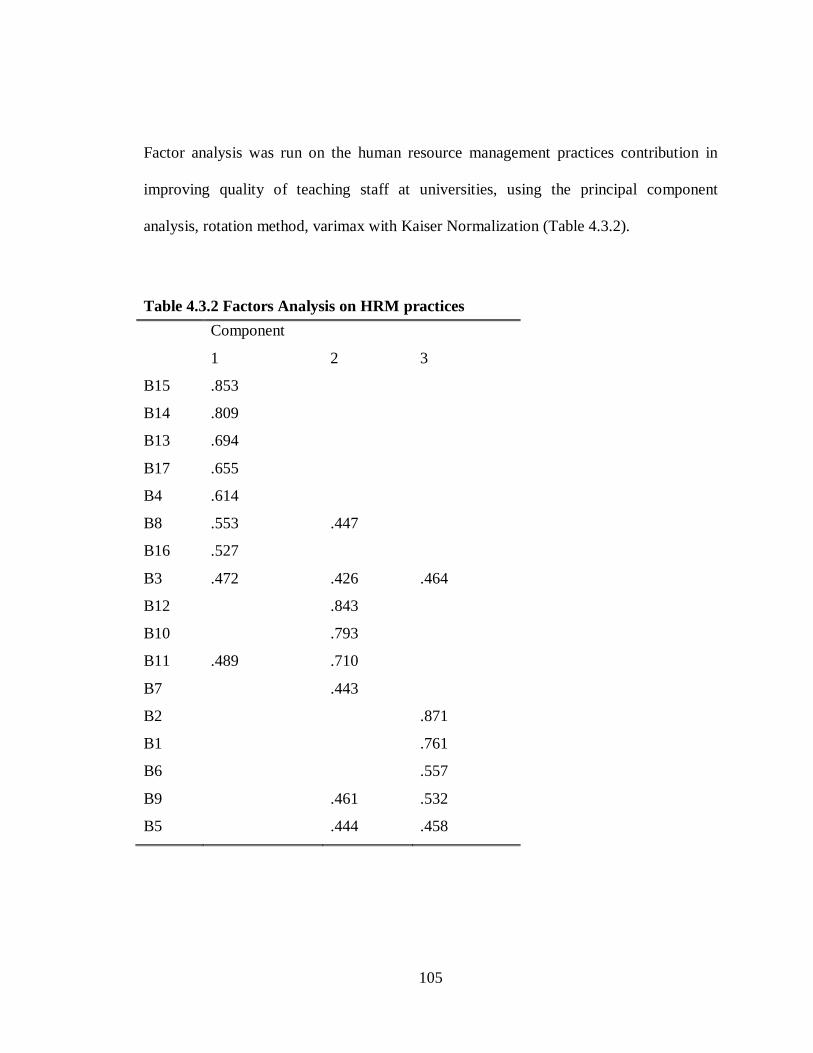
105
Factor analysis was run on the human resource management practices contribution in
improving quality of teaching staff at universities, using the principal component
analysis, rotation method, varimax with Kaiser Normalization (Table 4.3.2).
Table 4.3.2 Factors Analysis on HRM practices Component
1 2 3
B15 .853
B14 .809
B13 .694
B17 .655
B4 .614
B8 .553 .447
B16 .527
B3 .472 .426 .464
B12 .843
B10 .793
B11 .489 .710
B7 .443
B2 .871
B1 .761
B6 .557
B9 .461 .532
B5 .444 .458

106
The rotation converged in 5 iterations, resulting into three factors relating to
reward/sanctions; compensation; and university management style (Figure 4.10).
Figure 4.10 Factor Analysis on HRM Practices
From the results of factors analysis, the compensation factor is the least rated with a mean
of 2.26 followed by reward/sanctions with mean of 2.29 and management with mean of
2.61. The two factors of compensation and reward/sanctions are rated below the average
of at least 2.507. The biggest challenge on compensation is that it is never equitable and
fair (Table 4.3.2). Also compensation received is not very attractive as compared to
earnings in other places. As also earlier researched by Tettey (2006), academic staff are
also affected by the internal brain drain where the teaching staff move from institutions of 7 The interpretation of means is as follows: strongly disagree (1.00-1.74), disagree (1.75-2.49), agree (2.50-3.24), strongly agree (3.25-4.0)
Rewards/Sanctions (B15, B14, B13, B17, B4, B16) Mean 2.29
Compensation (B12, B10, B7) Mean 2.26
Management style (B2, B1, B6) Mean2.61
HRM and Quality
107
higher education to other sectors within the same country. The reasons for these outflows
from academia are varied, but are largely economic.
In fact, academic staff are also lured away by a variety of Government agencies, where
salaries are often better and the working environment more comfortable. In many cases,
the salaries and benefits in universities are lower than comparative positions in and
outside of the civil service. For instance, a comparative salary analysis in Kenya currently
reveal that salary levels in sectors such as energy, finance, revenue collection, and the
media are all higher than those of the universities.
From the reward/sanctions factor, items on the university systems for recognizing low
performers for training and couching, reward systems, feedback and appraisal were all
scored very low. Of interest here is failure to give feedback on performance on time and
also failure to recommend the low level performers for further training. The resulting
impact is that these same teaching staff continues to teach even though they may be weak
therefore compromising on quality as good quality at universities is an important avenue
towards nurturing the teachers needed for universal primary education, the experienced
doctors, nurses and community workers needed for better water and health facilities, the
accountants, economists, and journalists required for better private business and better
governance.

108
Factor analysis on the university management system however, had positive responses on
management understanding university goals and objectives and also on their
responsiveness on employee concerns and questions. The management style that has in
place mechanisms that ensure the nurturing of intellectual potentials, and providing the
environment that sustains them, is vital to the development and maintenance of a
competitive edge in the global market place of ideas, which recognizes teaching staff as
an important human resource in higher education. However, the challenge on promotions
for teaching staff needs to be addressed as most of the respondents were negative on this
subject.
As also earlier recommended by Tettey (2006), management should avoid the frustration
and tardiness of appointment and promotion processes and foster transparency, by
ensuring that they are devolved to faculties, and anchored in a representative committee
system at every level. University management should also give cognizance to the
weighting of teaching against research, in promotions and permanent appointment
decisions. With the current university setups however, lecturers sometimes get
overloaded with the teaching work load and have little time to research and provide the
minimum required papers for promotion. There is therefore need to consider such
exceptional cases for promotions so as to motivate the teaching staff.

109
4.4 Continuing Professional Development and Quality
From the analysis results, the university lecturers actively participate in the development
of departmental and faculty polices with 39.2% strongly agreeing and 45.1 % agreeing.
As also suggested by Griffiths (1993), a comprehensive and positive staff development
policy is essential in helping staff deal with a changing demands and circumstances.
positive responses were also seen in the selection of syllabus and the teaching methods
with 15% strongly agreeing and 55% agreeing; in curriculum/programme development
with 23.5% strongly in agreement and 65.7% in agreement and in the formulation of
national curricula and examinations with 49.2% agreeing and 22.2 strongly agreeing
(Figure 4.11).
Figure 4.11 Policies,Syllabus, Cirriculum and Examination Involvement

110
The commitment to staff development and the belief in the performance appraisal and
planning process is the integral part of individual and institutional development. This
process is designed to improve job understanding on the part of the staff and the
promotion of more effective job performance, and establish future goals for career
growth. Staff development programmes also assist staff in understanding their job
responsibilities and leaders’ performance expectations (Anyamele, 2007). The good
responses on staff development as well as provision for continuous growth of the
lecturers (Table 4.4.1) are a strong commitment to job performance by the universities.
Indeed, only 8% of the respondents feel that there is no policy providing for growth of
teaching staff. the high ratings on policy for growth of teaching staff also supplements the
earlier continuous professional development model by Farrugia(1996), that provided
that for teaching staff, professionalism is measured through the acquisition of knowledge
and understanding of educational theory ; application and refinement of validated
pedagogy for tertiary-level teaching and learning; practice of instructional and managerial
autonomy coupled with accountability and exercising organizational authority governed
by internalized control.
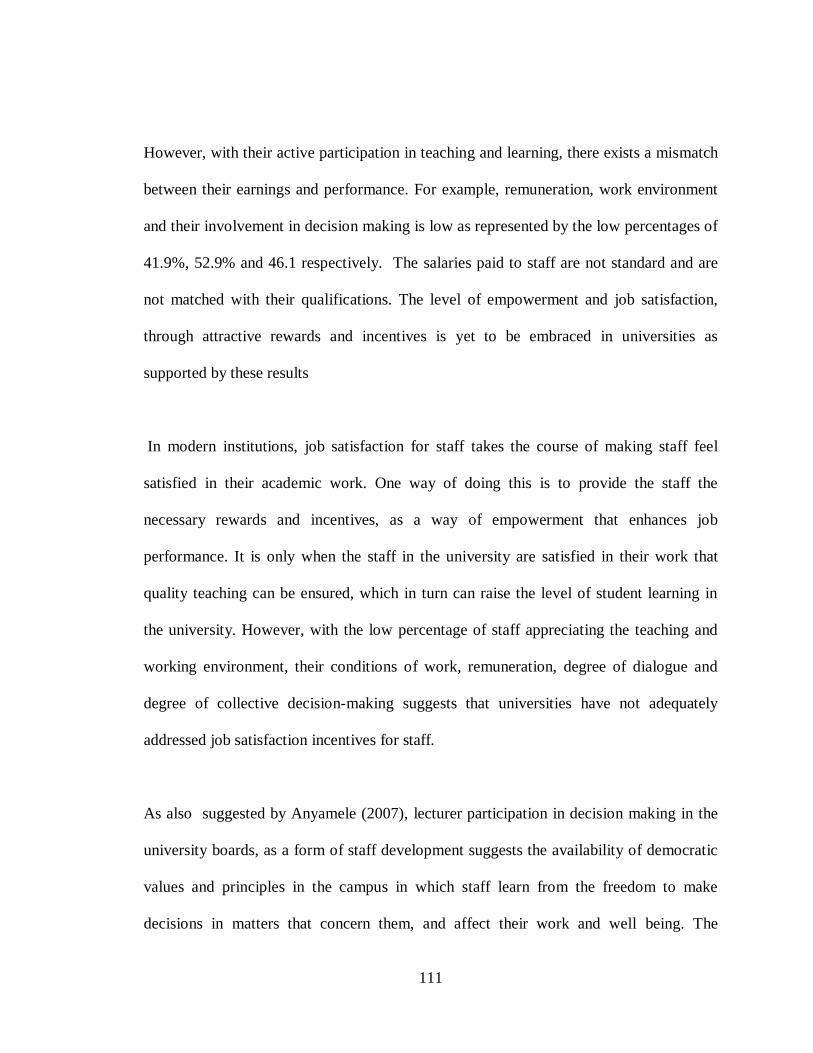
111
However, with their active participation in teaching and learning, there exists a mismatch
between their earnings and performance. For example, remuneration, work environment
and their involvement in decision making is low as represented by the low percentages of
41.9%, 52.9% and 46.1 respectively. The salaries paid to staff are not standard and are
not matched with their qualifications. The level of empowerment and job satisfaction,
through attractive rewards and incentives is yet to be embraced in universities as
supported by these results
In modern institutions, job satisfaction for staff takes the course of making staff feel
satisfied in their academic work. One way of doing this is to provide the staff the
necessary rewards and incentives, as a way of empowerment that enhances job
performance. It is only when the staff in the university are satisfied in their work that
quality teaching can be ensured, which in turn can raise the level of student learning in
the university. However, with the low percentage of staff appreciating the teaching and
working environment, their conditions of work, remuneration, degree of dialogue and
degree of collective decision-making suggests that universities have not adequately
addressed job satisfaction incentives for staff.
As also suggested by Anyamele (2007), lecturer participation in decision making in the
university boards, as a form of staff development suggests the availability of democratic
values and principles in the campus in which staff learn from the freedom to make
decisions in matters that concern them, and affect their work and well being. The

112
participation in meetings held by their respective departments and faculties prepare them
for future challenges in the administration of their units. Participation of staff in
curriculum development and in the department/ faculty issues is highly re-emphasized by
the respondents’ outcomes.
While staff development satisfies individual learning needs as well as the enhancement of
institutional capacity to manage and thrive in a new environment, many staff are never
given opportunities to develop. The learning and change that are required must take
place within individuals but as a result, the organization develops. In its capacity to
engage with and adapt to new circumstances, organizational learning occurs. From the
results however, rarely are teaching staff, other than heads of departments and other staff
assigned administrative duties involved in management decision making, with only
46.1% of the respondents agreeing that the degree of collective decision-making and peer
group selection is good.

113
Table 4.4.1: Effect of Staff Development on Quality
Item8 1 2 3 4 % % % %
There exists a policy for staff development 8.0 18.0 64.0 10.
0
The university provides for continuous growth for lecturers 7.8 25.5 52.0 14.
7
Lecturer are involved in curriculum/programme
development
3.9 6.9 65.7 23.
5
Lecturer participate in departmental and faculty policies 1.0 14.7 45.1 39.
2
Lecturer participate in formulation of national curricula
and examinations
9.1 19.2 49.5 22.
2
Lecturer participation in the selection of syllabuses and
teaching methods
6.0 24.0 55.0 15.
0
The teaching and working environment is good 14.7 32.4 48.0 4.9
lecturers' conditions of work are reasonable 11.8 39.2 44.1 4.9
Remuneration is reasonable and commensurate with
qualifications
15.3 42.9 38.8 3.1
The degree of dialogue of staff with the institution's
administration is cordial
9.2 37.8 51.0 2.0
The degree of collective decision making and peer-group
selection is good
9.8 44.1 42.2 3.9
Lecturers contribution to the community's welfare 8.4 29.5 57.9 4.2
The degree of self-control and regulation is high 11.2 24.5 57.1 7.1
Level of appreciation of lecturers work by the community
is modest
14.4 24.7 55.7 5.2
On curriculum development alone, 66% of the respondents agree on their participation in
curriculum development with 23% strongly agreeing. This is a strong test of staff
8 1= strongly disagree;2= disagree; 3=agree;4=strongly agree

114
commitment to their core business of teaching with a deserving high cumulative of 89 as
opposed to 11% as given in Figure 4.12.
Figure 4.12 Curriculum Development
Staff participation in development projects is also as a form of staff development. The
lecturer’s contribution to community welfare, the degree of self control and regulation
and their level of appreciation by the community is high. From the results, 55.7% of the
respondents agree lecturers contribute to the community with 5.2% strongly in
agreement. For self control and regulation, 57.1% of the respondents agree that it is high
with 7.1% strongly agreeing. Also the level of appreciation of lecturers work by the
community is considered as modest by with 57.9 % agreeing and 4.2% in strong
agreement (Figure 4.13).

115
Figure 4.13 Community Relationships and Self Control
To test the respondents’ opinion on the relationship between what the lecturers are paid
against their qualification, 38.8% of the respondents agree that the remuneration is
reasonable and commensurate with their qualifications while 3.1% strongly agree. For
work environment, 44.1% of the respondents agree that the conditions of work are
reasonable with 4.9% strongly agreeing. For both work environment and remuneration
however, this is below the 50% (Figure 4.14). While emphasis may be given on quality

116
and quality assurance for teaching staff standing to profess their contribution to
humanity, as earlier suggested by Farrugia in 1996, material or financial rewards is also a
big contributor to quality.
Generally, academics are likely to leave an institution where they feel that their autonomy
is compromised, their desire for innovation is not supported, and collegiality a mirage. In
effect, the nature of the institutional climate within which these academics work will
strongly influence the extent to which they are willing to remain at an institution (Tettey,
2006). As found in this research, the work environment for teaching staff at universities is
still a challenge (Figure 4.14). Forty seven percent (47%) of the respondents were
dissatisfied with the existing work environment.
Some lecturers still have no access to some of the basic teaching facilities like offices,
desks, computers and internet. This is much more so in the public universities where
resources have not been adequately matched with facilities. This confirms what was
observed earlier by Abagi (1999) that in many cases the increase in student numbers over
the years is not matched by a corresponding expansion in teaching/learning facilities.
Quality can therefore only be assured if such disparities are addressed.
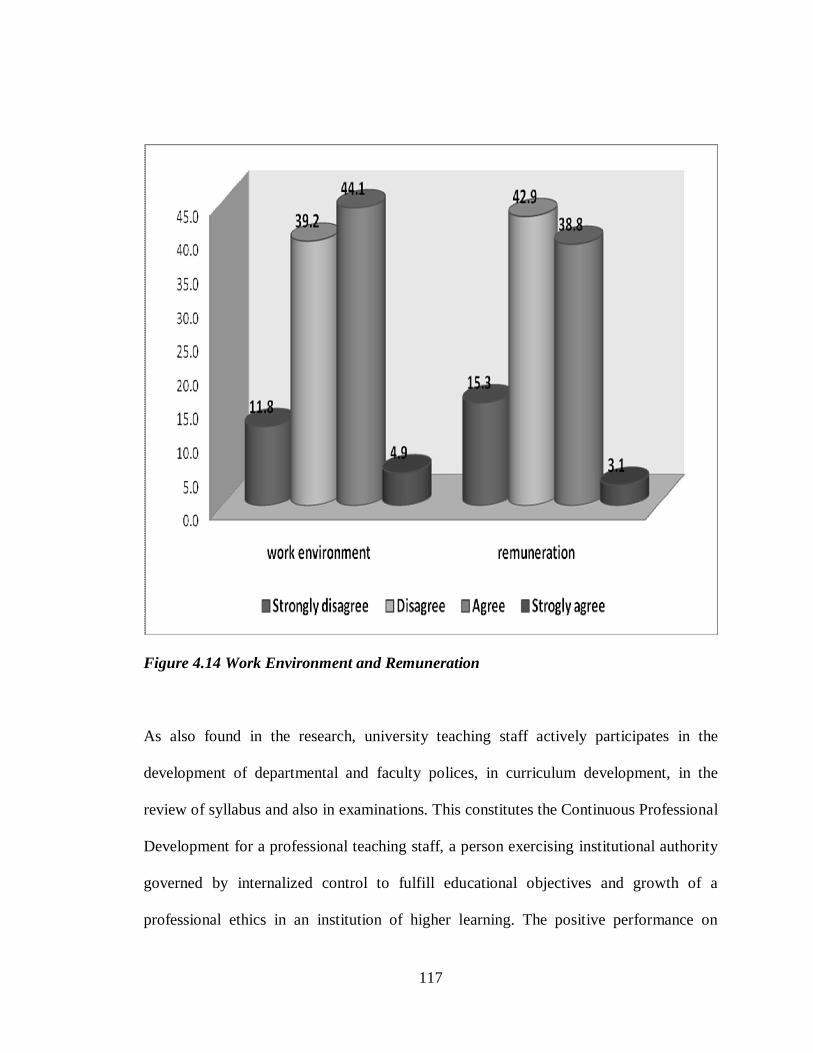
117
Figure 4.14 Work Environment and Remuneration
As also found in the research, university teaching staff actively participates in the
development of departmental and faculty polices, in curriculum development, in the
review of syllabus and also in examinations. This constitutes the Continuous Professional
Development for a professional teaching staff, a person exercising institutional authority
governed by internalized control to fulfill educational objectives and growth of a
professional ethics in an institution of higher learning. The positive performance on

118
continuous professional development supports an earlier study by Farrugia in 1996,
which provided for enhancement of professionalism through the educational theory,
application and the refinement of validated pedagogy, instructional and managerial
autonomy, lecturers’ development and professional ethics.
The nature of governance within an institution goes a long way in influencing satisfaction
or lack thereof among academics. Participation by academics in decision-making help
them feel part of the organization and give them a sense of ownership in the outcomes of
those decisions. From the respondents, 74% agree that they participate in the faculty and
departmental policies (Figure 4.11).
Factor analysis was done on the effect of continuing professional development on quality
of teaching staff, using principal component analysis, rotation method, varimax with
Kaiser Normalization (Table 4.4.2).
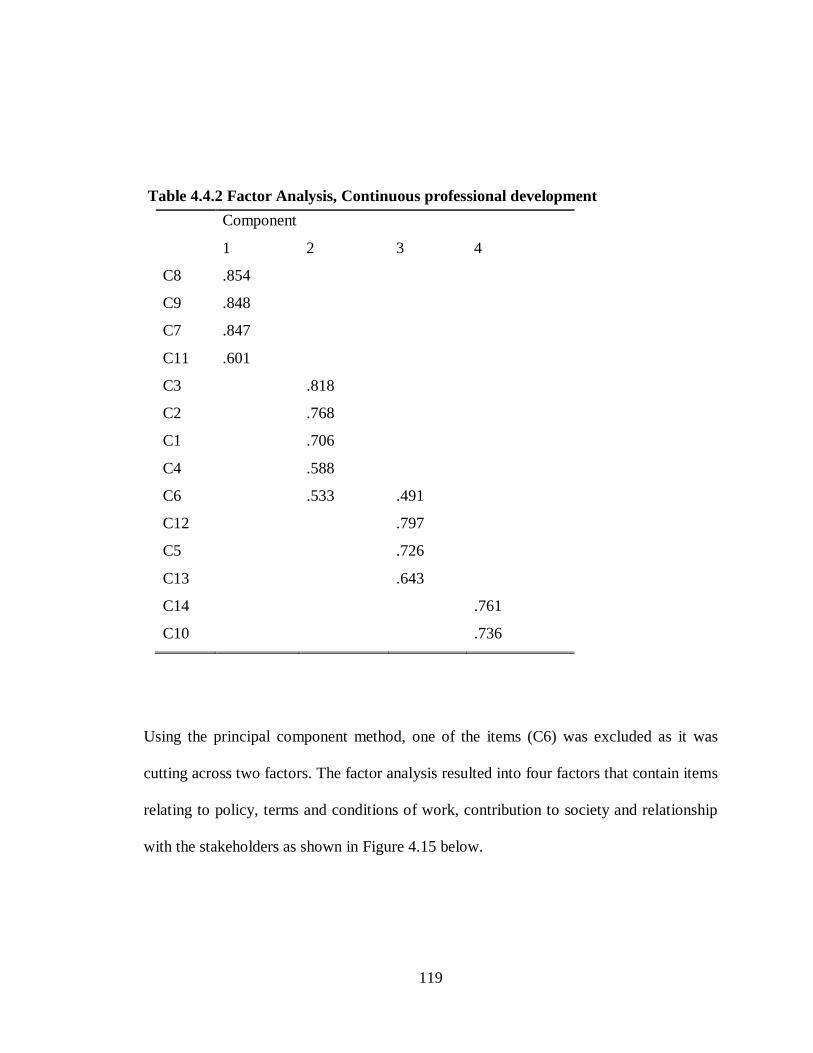
119
Table 4.4.2 Factor Analysis, Continuous professional development Component
1 2 3 4
C8 .854
C9 .848
C7 .847
C11 .601
C3 .818
C2 .768
C1 .706
C4 .588
C6 .533 .491
C12 .797
C5 .726
C13 .643
C14 .761
C10 .736
Using the principal component method, one of the items (C6) was excluded as it was
cutting across two factors. The factor analysis resulted into four factors that contain items
relating to policy, terms and conditions of work, contribution to society and relationship
with the stakeholders as shown in Figure 4.15 below.

120
Figure 4.15 Factor Analysis on Staff Development
From the factor analysis on the relationship of continuous professional development to
quality, policy factor, terms and conditions of work, contribution to society and
relationship with stakeholders had mean scores of 2.95, 2.39, 2.68 and 2.49 respectively9.
The mean for terms and conditions of work is the least (2.39). Under this factor, the
subject considered included the teaching and working environment, lecturers’ conditions
of work, remuneration and the degree of collective decision making and peer group
selection. Contemporary theory on human resource management agitates for the
exploitation of existing synergies among employees as opposed to individualism. In this 9 The interpretation of means is as follows: strongly disagree (1.00-1.74), disagree (1.75-2.49), agree (2.50-3.24), strongly agree (3.25-4.0)
Staff Development
Terms and conditions of work (C8, C9, C7, C11) Mean 2.39
Policy (C3, C2, C1, C4 Mean 2.95
Contribution to society (C12, C5, C13) Mean 2.68
Relationship with the stakeholders (C14, C10) Mean 2.49

121
case, the lecturers were asked to shed the light on degree of collective decision making
and peer group selection. Good remuneration increases job satisfaction among the staff
and enhances the quality of service expected from them (Chimanikire et al, 2007). With
the high percentage of respondents indicating that remuneration is not reasonable and is
not commensurate with qualifications, there is need for universities to address this
subject.
Another factor that received low rating was interaction with community and stakeholders
(2.49). The interpersonal relations within the universities are low with most of the
respondents negative on the degree of dialogue of staff with the universities
administration.

122
4.5 Effect of Teaching Facilities on Quality of Teaching Staff
The existence of teaching facilities had a direct bearing on quality. From the analysis,
majority of the respondents accept that e-leaning is a major resource for knowledge
dissemination and the existence of internet teaching facilities and use of computers
provides opportunities for greater service delivery giving high positive rates of 97% and
98% respectively.
From the research, it came out clearly that the large class sizes, inadequate teaching and
learning facilities, delays in procurement of teaching materials, use of substandard
teaching and learning materials and the limited financial resources affect effective service
delivery. These results are similar to the earlier one by Ngware & Ndirangu in 2005 that
showed that the teaching of large classes and marking many scripts is still very common,
while also poor teaching facilities and inadequate teaching/learning resources in all
public and private universities is still a challenge. This calls into question the quality of
learning provided by the universities.

123
Table 4.5.1: Teaching facilities and Quality
1 2 3 410
% % % %
1 11E-learning is an important resource for knowledge
dissemination
2.0 1.0 24.8 72.3
2 Existence of internet teaching facilities provide
opportunities for greater service delivery
2.0 24.5 73.5
3 Use of computers and computer accessories facilitate
service delivery
2.9 30.4 66.7
4 The large class sizes affect effective teaching 2.0 36.6 61.4
5 The inadequate teaching and learning teaching facilities
affect effective teaching
2.9 19.6 77.5
6 Delays in procurement of teaching materials affect the
teaching process
1.0 5.0 30.7 63.4
7 The use of sub-standard teaching materials affect quality 4.0 1.0 26.7 68.3
8 Mismatch of services with financial compensation affects
quality
5.9 9.8 30.4 53.9
9 The limited Government support to universities has
affected quality
3.9 8.8 35.3 52.0
10 The physical teaching facilities are visually appealing 16.2 24.2 39.4 20.2
11 The Faculty/School has up to date equipments 35.7 36.7 16.3 11.2
10 1= strongly disagree;2= disagree; 3=agree;4=strongly agree
11 appendix 1

124
The declining Government support towards higher education is a serious hindrance to
quality. From the results for example, 52% of the respondents strongly believe that the
limited Government funding to the universities over the years has a serious impact on
quality with also 35% of the respondents in support. With the limited financial support
for example, institutions have opened up for more students without necessarily matching
with the existing teaching facilities (Figure 4.16).
An earlier survey by World Bank in 2002 also indicated the Government neglect in
investment in higher education in developing Countries. According to World Bank
report, institutions of higher education were chronically under-funded in spite of
escalating demands for higher education. Out of the limited funding, the universities end
up purchasing cheaper materials for teaching and learning. From the responses received,
68.3% strongly believe that the substandard teaching materials affect quality, 26.7%
agree and only less than 5% disagree (Figure 4.16).
With such limited funding from the Government and the inability of the institutions to
sustain their operations through the internally generated funds, the institutions of higher
learning are also facing another challenge of inability to adequately compensate their
staff for the services rendered. This therefore means that the financial compensation to
the teaching staff is not matched to the services rendered. From the study findings, 53.9%
of the respondents strongly agree to this challenge facing the universities and 30.4%
agree (Figure 4.16).

125
Figure 4. 16 Government Support,Financial Compensation, Poor Materials
The physical teaching facilities also pose the biggest challenge to quality at institutions of
higher learning. From the results, only 39.39% of the respondents appreciate the state of
these teaching facilities with 20.2% strongly appreciating.

126
Cumulatively, 40.4 % of the respondents have reservations of the status of physical
teaching facilities at universities, giving a strong indication of the existing mismatch
between the current condition of teaching facilities against the market needs(Figure 4.17).
Figure 4.17 Physical Teaching facilities are visually appealing

127
Factor analysis was undertaken on the lecturers’ response to the effects of teaching
facilities on quality of teaching staff at universities in Kenya using Principal Component
Analysis, Rotation method, varimax with Kaiser Normalization (Table 4.5.2).
Table 4.5.2 Factor Analysis, Teaching Facilities Component
1 2 3
D6 .885
D7 .829
D4 .826
D8 .822
D5 .656
D9 .545
D2 .951
D3 .932
D1 .867
D11 .864
D10 .863

128
The analysis resulted into three factors on e-resources, financial resources and physical
facilities, as can be seen in Figure 4.18.
Figure 4.18 Factor Analysis on effect of Facilities.
The mean of the scales constructed on the basis of these three factors are 3.66 for e-
resources, 3.51 for financial resources and 2.33 for the physical facilities12. From these
results, the physical teaching facilities pose the biggest challenge to the quality of service
by lecturers. The positive impact of e-resources and financial resources towards quality
of the teaching staff as well as the quality of academic programmes were recognized
(Figure 4.18).
12 The interpretation of means and all other means for this study is: strongly disagree (1.00-1.74), disagree (1.75-
2.49), agree (2.50-3.24), strongly agree (3.25-4.0)
Effect of teaching facilities on quality
E-resources
(D1, D2, D3) Mean 3.66
Financial Resources
(D4, D5, D6, D7, D8, D9)
Mean 3.51
Physical Facilities
(D10, D11) Mean 2.33
129
On the e-resources factor, an analysis was undertaken to test the relationship between e-
learning as resource for knowledge dissemination (D1); the availability of internet
teaching facilities in providing opportunities for greater service delivery (D2) and the use
of computers to facilitate service delivery (D3). A correlation was run using Pearson
correlation. From the results, there exists a strong correlation of 0.714, 0.695 and 0.739
respectively (Table 4.5.3), implying that there is a strong relationship between e-learning
as a resource and the availability of computers and internet teaching facilities to facilitate
the e-learning process.
Table 4.5.3: Correlations between E-Learning, Internet and Computers
E-learning internet
teaching
facilities
Accessible
computers
E-learning Pearson Correlation 1 .714(**) .695(**)
Sig. (2-tailed) .000 .000
N 101 101 101
internet teaching
facilities
Pearson Correlation .714(**) 1 .739(**)
Sig. (2-tailed) .000 .000
N 101 102 102
Accessible
computers
Pearson Correlation .695(**) .739(**) 1
Sig. (2-tailed) .000 .000
N 101 102 102
** Correlation is significant at the 0.01 level (2-tailed).

130
4.6 Challenges in Maintaining Quality
From the results of the survey, a number of factors have strained the quality of human
capital at universities. These includes financial constraints, lack of professional expertise,
the ineffective communication channels, political interference, cross-border higher
education, mushrooming of universities in Kenya, the inequities and economic disparities
across the East African region, brain drain, self interest and political motives of some
universities, lack of harmonized accreditation and quality monitoring systems in the
region and lack of harmonized admission criteria in the region. These were rated as the
major challenges that affect quality by over 75% of the respondents (Table 4.6.1). Others
include low levels of independence of the senior managers, lack of logistic policies for
quality assurance staff development, transnational education and the recent opening of
regional constituent colleges across the Country.

131
Table 4.6.1: Quality Challenges
1 2 3 4
%
%
% %
1 13Financial constraints on HR 1.0 5.1 26.5 67.3
2 Lack of Professional expertise on HR 1.0 9.0 50.0 40.0
3 Ineffective communication channels for HRM 4.9 42.2 52.9
4 political interference on appointments 2.0 11.1 56.6 30.3
5 low level of independence of senior managers 3.2 17.9 60.0 18.9
6 No harmonized/standard model of reference for HRD 1.0 13.4 61.9 23.7
7 Effects of cross border higher education on quality 6.3 15.6 47.9 30.2
8 Effect of many universities in Kenya 3.9 30.4 24.5 41.2
9 Inequity, economic disparities and social tensions within
E.A.
5.1 13.1 48.5 33.3
10 Lack of logistic policies for quality assurance 3.0 21.8 51.5 23.8
11 Brain drain effects of staff at universities 3.9 13.7 41.2 41.2
12 Effect of transnational education on quality 19.0 30.0 27.0 24.0
13 Opening up of many constituent colleges across Kenya 4.1 30.6 37.8 27.6
14 Effect of self-interest and profit motives 5.0 9.9 40.6 44.6
15 The cultural diversity 20.8 32.3 34.4 12.5
16 Lack of a single HRM model for quality 6.3 21.9 52.1 19.8
17 Diverse education systems within East African region 13.1 34.3 36.4 16.2
18 The non-harmonized accreditation and quality monitoring
systems
1.0 22.9 45.8 30.2
19 Effects of Diverse admission criteria within the region 6.9 15.8 46.5 30.7
13 appendix 1

132
The results also indicated that brain drain remains a major challenge in Kenya, with over
82% of the respondents listing it as threat to quality. The responses are as given in Figure
4.19. Since 2008, the drain is becoming significant with the opening of constituent
colleges and award of more charters to new private universities.
Figure 4.19 Brain Drain challenges
From the research, it is patent that there is a growing mobility of academics, especially
given the usually less attractive terms and conditions of service, salary structures and
work environments in Kenya, a developing country. From the results, it is also evident
that the assumption that both developed and developing economics compete fairly in an
open market for lecturers and that developing Countries have equal chances of attracting
highly skilled human capital cannot be supported. This is similar to earlier research by

133
Magagula (2005) that also indicated the same. Therefore, Kenya is yet to competitively
attract teaching staff at institutions of higher learning. This growing mobility of
academics, professional and skilled workers, has really impacted on public universities in
Kenya as found in this study. This is because training of teaching staff takes longer to
complete and some staff undergo specialized training outside the country for programmes
that universities in Kenya have no capacity to run.
In public universities, the salaries and salary structures have in the past been based on
civil service precedents. Yet now there is competition from private sector institutions of
higher education with deeper pockets and differing reward systems. How realistic it is to
consider relating pay to performance and what effect will this have on the demand for
staff development in Kenyan universities is a choice to be made to reduce the drain.
Since retention of staff has been a major challenge as shown in this research, the
questions that the stakeholders and managers of the universities need to ask themselves
include the ability of the Government to compete by stressing on non-pay benefits such
as the status of a professorial title; the ability of institutions to retain good people; the
possibility for incentive systems, as institutions’ earnings from the commercial sector
increase. Others include compensating staff for the extra income generated from non-
Governmental sources, proportionate with potential for such earning. This will probably
address the brain drain challenges that universities continue to face as supported by this
research.

134
The study also sought to check on the effect of financial constraints on staff development.
As given in Figure 4.20, over 67% of the respondents strongly agree that staff
development is dependent on the existing financial resources at universities. Research,
innovation and staff training are dependent on the availability of funds as highly
supported in this research. This therefore means that institutions of higher learning must
identify alternate sources of financial resources to facilitate their staff development, on
top of what the Government and University internal resources are able to offer / generate.
Figure 4.20 Financial Resources and Staff Development

135
Using principal component analysis, rotation method, varimax with Kaiser
Normalization, factor analysis was undertaken on the responses to the quality challenges
at universities in Kenya (Table 4.6.2).
Table 4.6.2 Factor Analysis, Quality Challenges
Component
1 2 3 4 5 6
E14 .789
E8 .746
E12 .618
E7 .534
E11 .426
E15 .795
E17 .783
E13 .688
E3 .751
E10 .727
E5 .620
E6 .601
E1 .817
E9 .658
E16 .516 .569
E19 .877
E18 .650 .444
E4 .857
E2 .510

136
For statistical reasons, three items relating to human resource model for quality assurance, the
effects of diverse admission criteria and the non harmonized accreditation and quality
monitoring systems were excluded. The factor analysis resulted into five factors that
contained the effects, diversity, management, economic and professional expertise (Figure
4.21).
Figure 4.21: Quality Challenges
The means of scales constructed on the basis of these six factors are 3.01 for effects, 2.61 for
diversity, 3.12 for management, 3.32 for economic and 3.22 for professionalism14. From the
results, majority of the respondents agree that financial limitation and the economic 14 strongly disagree (1.00-1.74), disagree (1.75-2.49), agree (2.50-3.24), strongly agree (3.25-4.0)
Effects (E14, E8, E12, E7, E11) Mean 3.01
Management (E3, E10, E5, E6)
Mean 3.12
Professionalism
(E4, E2) Mean 3.22
Diversity (E15, E17, E13) Mean 2.61
Economic (E1, E9)
Mean 3.35
Quality Challenges

137
disparities, in-equity and social tensions are the biggest challenges to the quality of teaching
staff at universities in Kenya. From the results however, the opening of many constituent
colleges across the country, the different educational systems within the region and the
cultural diversity in Kenya and within the region has not diluted quality of teaching staff
(Table4.6.1) but has provided opportunities for growth for the teaching staff. This is against
the earlier research by Magagula (2005) on cross border higher education challenges where
the mushrooming of the many universities, the different admission criteria and varied
education systems were listed as a compromise to quality. As to whether these results could
have been dissimilar if respondents included non-teaching staff is not known.
In establishing the relationship between the four factors relating to effects, diversity,
Management and economic factors, a correlation was run on cross border higher education
(E7); the opening of many universities in Kenya (E13); logistical policies for quality
assurance (E10); the inequity, economic and regional disparities and logistic polices for
quality assurance (E9)15 giving results as indicated in Table 4.6.3, using Pearson correlation
coefficient. The results indicated that there is significant correlation at both 0.01 and 0.05
levels, implying a strong relationship on these factors.
15 see appendix 1

138
Table 4.6.3: Correlations Between Cross Border Higher Education, growth in
number of Universities, inequity/economic Disparities and Transnational Education
Cross
border
higher
education
High
number of
universities
Inequity
,economic
disparities
Logistic
policies
Cross border higher
education
Pearson
Correlation
1 .377(**) .420(**) .322(**)
Sig. (2-tailed) .000 .000 .001
High number of
universities
Pearson
Correlation
.377(**) 1 .292(**) .183
Sig. (2-tailed) .000 .003 .067
Inequity ,economic
disparities
Pearson
Correlation
.420(**) .292(**) 1 .453(**)
Sig. (2-tailed) .000 .003 .000
Logistic policies for
quality assurance
Pearson
Correlation
.322(**) .183 .453(**) 1
Sig. (2-tailed) .001 .067 .000
** Correlation is significant at the 0.01 level (2-tailed). * Correlation is significant at the 0.05 level (2-tailed).
To ascertain the ranking by the respondents on each of the research objective(research
question) on the factors that affect service quality of teaching staff at universities in
Kenya, a mean percentage of responses was taken using descriptive statistics. From the
results, human resource management practices, as a factor to service quality, remains

139
the least addressed at universities in Kenya. This is revealed by the low level of scores
manifested in HRM as compared to other factors (Table 4.6.4). Out of a possible
minimum score of 20 and a maximum score of 8016, HRM practices were given a rate of
47, just below the 50% mark..
Table 4.6.4: Factors Affecting Service Quality
N Minimum Maximum Mean Std. Deviation
Facilities 102 32.73 80.00 66.9430 7.97347
Challenges 102 40.00 80.00 60.3305 9.21648
Government and CHE 102 33.00 67.00 53.4880 7.16415
Staff development(CPD) 102 27.14 77.14 53.1457 8.86646
HRM 102 22.35 74.12 47.2265 9.85727
From this research therefore, human resource management remains the least addressed
factor by universities and the highest risk to service quality at universities. As a key
resource, the human resource factors such as compensation, recognition and reward
management styles and performance management needs to be addressed. From the
motivational view, highly values employees are willing to invest much of their time in
their teaching and also providing service quality to their customers (Tzafrir & Gur, 2007).
16 The mean are as follows: strongly disagree(20-34),disagree(35-49),agree(50-64),strongly agree(65-80)

140
Teaching facilities were the highly rated in this study (66.94%).While the demand for
higher education has overstretched the existing teaching facilities at universities, efforts
to embrace e-learning as an important resource for knowledge dissemination and also the
expansion of internet and internet teaching facilities positively contribute to service
quality. As also earlier researched by Chimanikire et al (2007), the existence of teaching
facilities had a direct bearing on the quality of service of the teaching staff.
The study also shows a strong relationship between Government and Government
agency, Human Resource Management practices, Staff development and teaching
facilities. This is demonstrated by a dominant correlation between these independent
variables as shown in Table 4.6.5. The results therefore indicate that while some of the
factors may have a higher input to quality, a balance between all these factors is
necessary for effective quality service by the teaching staff. There is no one factor that
can independently enhance high quality without the others.

141
Table 4.6.5: Correlations between Government, HRM, Staff Development, and Teaching Facilities Government
and CHE
HRM Staff
Development
Facilities
Government
and CHE
Pearson
Correlation
1 .489(**) .444(**) .200(*)
HRM Pearson
Correlation
.489(**) 1 .751(**) .227(*)
Staff
development
Pearson
Correlation
.444(**) .751(**) 1 .334(**)
Sig. (2-tailed) .000 .000 .001
Teaching
Facilities
Pearson
Correlation
.200(*) .227(*) .334(**) 1
** Correlation is significant at the 0.01 level (2-tailed).
* Correlation is significant at the 0.05 level (2-tailed).

142
CHAPTER 5
SUMMARY, CONCLUSIONS AND RECOMMENDATIONS
5.1 Introduction
This chapter provides a summary of the key elements of the study, the conclusions
reached based on the information gathered and recommendations for ensuring quality of
teaching staff at universities in Kenya as well as recommendations for further research.
5.2 Summary
The purpose of this study was to establish the factors that affect quality of teaching staff
at universities with an emphasis on the role of Government and Commission for Higher
Education (CHE) in promoting quality at universities in Kenya; the effect of the HRM
practices on quality at universities in Kenya ; the effect of continuing professional
development on quality service at universities in Kenya; the effect of teaching facilities
on quality and the challenges in maintaining quality at universities in Kenya.
In this research, a descriptive study in form of a survey describing a phenomenon
associated with subject population or estimating proportions of the populations with
certain characteristics was undertaken. The target population was university teaching

143
staff from all the public and private universities in Kenya totaling to 3,000. Stratified
random sampling was used so as to achieve desired representation from various sub-
groups in the population generating a sample of 120 teaching staff members distributed
across the universities and a total of 102 questionnaires were received.
Data was analyzed using quantitative techniques including reliability tests, descriptive
statistics, factor analysis, correlation, analysis of variance (ANOVA), pareto tests, chi-
square tests, paired sample test, t-test and paired sample correlations. From the analysis,
Tables, Figures, frequencies, charts and graphs representing various research questions
were drawn. Qualitative data was also analyzed and summarized based on frequency of
responses to the various items in the questionnaire.
Financial constraints in Kenya mean that the Government can no longer fund higher
education to the same extent as previously. The Government contribution to institutions
of higher learning has been demeaning over the years. Apart from asking students and
their parents to share the cost, the Government’s response has been to call for continued
efficiency savings (or simple cuts) in institutional budgets, which has led to more severe
staff student ratios and heavier workloads for academic staff. For example, the
Government of Kenya has committed all public agencies including public universities in
cost savings through the cost savings as their targets in the performance contracts that
were introduced in the year 2005. One incongruity of the situation is that institutional
budgets for human resource development are often the first to be cut, just when they are

144
most needed, in times of severe financial difficulty.
Another Government response on the limited financing is the encouragement of the
institutions of higher learning to generate more of their income from non-Governmental
sources such as through running the self sponsored programmes, involvement in internal
income generating units, generation of revenue through research outputs, consultancies
and technology transfer. This places new demands on academic staff that are expected to
master entrepreneurial skills in converting their specialist knowledge into market-
oriented services. With such internally generated funds however, the staff expect to share
part of the income as bonus, honorarium or consultancy.
From the results of the research, the Kenya Government is yet to seriously meet its
obligations as required to the institutions of higher learning. For example, even with the
demeaning financing, the disbursement of these resources to the public universities is not
prompt. This implies that in most scenarios, universities are not be able to meet their
obligations if full reliance is on Government disbursements. Such delays have trickle
down effects on quality of staff as compensation and monthly remuneration is delayed,
thus providing a window for staff to think beyond the box.
While the Kenya Government has embraced free primary and free secondary education,
such demeaning levels of contribution to the universities for facilities, operation and
maintenance and salaries makes education at the universities far from free. This is

145
because the potential students are unable to further their studies out of the high cost of
learning at universities.
The commission of higher education, which is a regulatory Government agent for private
universities, is challenged in enhancing quality. From the results, it is clear that with the
growth in number of public and private universities in Kenya, the Commission has not
been keen in fulfilling its mandate as defined by universities Act and has not developed
enough human resource capacity to check on quality of programmes at these universities.
Notably in this research is the inability of the commission to vet programmes on offer at
public universities, a situation that may impact on quality of such programmes at the
expense of the customers and the industry.
It has also not been possible for the commission to fully implement its mandate of
making better provisions for the advancement of university education in Kenya and for
connected purposes. Emphasis by the commission has been as per the universities Act,
Cap 210B, legal notice number 112 of 15th October 2004 that includes validation of
programmes, preparation for course standards, upgrading of programmes and approval
for collaborations with other established institutions. Most of the commission’s effort has
been in private universities.

146
The research also indicates that the hiring of senior managers at universities by the
Government is not competitively handled and that Government’s role in the attraction
and retention of staff at public universities is minimal. For example, representation in
major council meetings by the Government, including during times of hiring senior
university staff at public universities, has not been consistent and in some situations, such
representation is by low level managers who cannot bind the Government on decisions
made in such forums. There is no aggressive intervention mechanism by the Government
to retain staff in the public universities as supported by this research.
The research also indicates that though the commission of higher education (CHE), as a
Government agency, is involved in the regulation of programmes by private universities,
their contribution in curriculum development is minimal. For instance, the commission
involvement during curriculum development so as to align them to industrial or market
needs, or at least to provide guidelines for such programme development is nominal. The
small direct contribution to quality improvement of university programmes; provision of
quality and quality assurance guidelines for university resources and facilitation of
external quality assurance by the commission indicates that Interaction between the
Government, the commission of higher education and the universities on quality related
issues is still short.

147
The university managers understand the university goals and objectives and provide
employees with the information necessary to promote high quality service. However, the
level of application of most of the management concepts such as employee resourcing,
performance based management, recognition and reward is however low. This is
indicated by the low means given on promotion criterion, on training needs assessment,
compensation, performance appraisal systems, and performance feedback. There is,
therefore, a need to review the entire appraisal system in order to improve quality.
The university teaching staff are very active in their official assignments including
development of departmental and faculty polices, in curriculum/programme development,
development syllabus and examinations. Policies for staff development exist and
universities provide /support lecturers’ growth. However, remuneration of lecturers, their
working environment and their involvement in decision-making process is low.
The study also considered E-leaning as a major resource for knowledge dissemination at
universities. With the growth in application of e-resources, university teaching staff are
able to share with their students online and provide prompt feedback on assignments and
continuous assessment tests. Through e-learning, the teaching staff are able to share with
students who may be disadvantaged by their geographical location and also provide
opportunities for increased access to higher education. This is a good strategy especially
for Kenya where the surge for higher education has tremendously grown with the recent
introduction of free primary and secondary education.

148
The revolution associated with internet has also impacted positively on the quality at
institutions of higher learning, as students and staff are able to work and share with their
colleagues at all times and from any location. However, the increasing trend towards
large class sizes, inadequate teaching and learning teaching facilities at universities, the
delays in procurement of teaching and learning materials, and use of substandard
teaching and learning materials has negative impacts on quality.
5.3 Conclusions
From the results of this study, human resource management practices, as a major factor
that contributes to quality of teaching staff at universities in Kenya, remains the least
addressed. As a key resource, the human resource management practices such as
recruitment and selection, training, promotion, career development, performance,
motivation and compensation requires more focus.
The motivational perspective that will encourage teaching staff to invest much of their
time in faculty activities as well as deliver quality services to their customers needs to
be strengthened. Also adopting HRM practices that employees will perceive as positive
and considerate, such as employment security, better remuneration or compensation
system that acknowledges employee efforts and contributions, rewarding/recognizing the
high performing staff and creating opportunities for continuous learning will result in

149
more service committed employees. This supports our second hypothesis that effective
human resource management (HRM) practices at universities contribute to good quality
of teaching staff
Career development and acquisition of new knowledge and skills is one of the key
responses to the imperatives of surviving, adapting and evolving. Investment in training,
career/professional development at universities needs to be enhanced so as to improve
quality. Universities also need to have clear and unbiased training policy to provide equal
opportunities for qualifying and deserving staff. Career development and training
prepares faculty for better teaching and research that will allow staff to grow and be
judged in the context of organizational learning and development. This is in agreement to
the hypothesis that effective continuing professional development practices contribute to
quality of teaching staff.
The study also indicates a growing mobility of teaching staff to the newly created
constituent colleges, now being refereed as internal brain drain. This has caused panic in
the public universities, with some ignoring the growth path in promoting internal staff so
as to ring fence them from joining competitors. The new colleges have brought uneven
and unfair competition in the market for faculty staff at institutions of higher learning,
thus creating unequal chances of attracting highly skilled human capital. The effect of
such internal brain drain on academic quality cannot be underestimated. The challenge,
still remains on having adequate staff and teaching facilities at these new colleges to

150
teach and supervise students, especially at postgraduate level. If unchecked, this will
result into falling academic standards across the country. With the limited financial and
human resources, most of these constituent colleges are yet to establish quality assurance
units, responsible for monitoring teaching and learning.
Improving or enhancing the professional competencies of academic staff of the university
is of crucial importance. As a way of keeping staff current in their respective fields, the
most forward thinking institutions must incorporate staff development into budget and
performance expectations. Such activities are significant in the face of increasingly
diverse campuses and in the light of scholarship and global diversity that has transformed
the knowledge base. Staff development will open the lecturers for such dynamics as
policy development, curriculum review/ development, adoption of the modern teaching
methodologies and contribution to the society.
As a result of demeaning financing to universities, staff development through research
and publication has not been spared either. This challenge is especially so in the private
universities where staff have to sponsor themselves for research as well as for conference
proceedings. As a consequence, such faculty looks for alternative revenue streams to
finance research, resulting to high teaching workloads. The non participatory approaches
to new research and research outputs have other consequences that may also contribute to
poor quality. Similarly, the teaching staff will have no opportunities for growth and

151
advancement as staff development is traditionally tied on the number of publications
made.
To strengthen quality at universities in Kenya and across the region, the university
management must be committed to staff development and have to acknowledge the
crucial role it will play in assisting the delivery of the academic plan; for staff
development is among a clutch of institutional innovations thrust upon the universities in
managing the professional competencies of their academic staff. The resulting output of
such commitment are high student completion rates, quality graduates, high academic
standards, low cost of running programmes, high research outputs and greater impact on
society.
The Government role in promoting quality of the teaching staff at universities also
requires to be improved. Worth consideration is the prompt disbursement of funds to
universities by the Government. Delayed disbursement implies that the universities are
not able to meet their obligations in a timely manner. Also, resource disbursements to
universities have not been matched with the high demand for higher education in Kenya.
For example, while the funding for education in Kenya is high as compared to other
Government activities, most of this funding is directed to basic education. Whereas this is
the case for many developing countries, the effect on universities will continue to be a
challenge. An increase in the number of students at universities without a corresponding
growth in other teaching facilities and human resources will create a gap providing for

152
low quality levels. There is therefore a strong relationship between the government
financial contribution to universities, the teaching facilities and quality output by the
teaching staff.
With such gaps in financing, the commitments in the Kenya vision 2030 to achieving a
higher adult literacy rate; school enrolment rate and transition rate to universities by the
year 2012 may take a little longer to realize. This is because it may not be possible to
increase this transition rates without reducing the cost of higher education, improving the
human resource capacities, delinking student learning with accommodation capacities
and facilitating expansion of teaching facilities at these institutions. All the public
universities and constituent colleges for example limit their admission to bed capacities.
Most of the universities are overstretched by the growing demand for higher education in
Kenya and the continuous decline in Government budget for expansion of university
facilities. The Government is yet to finance public universities based on unit cost, thereby
discouraging running of some expensive programmes especially in Agriculture,
Architecture, Science, Engineering, Medicine and Technology. This for instance has
made most of the private universities to only roll out programmes in social science and
other related areas, leaving the other programmes to the publicly owned universities. For
example, even with the growth in student population across universities in Kenya, there is
no private university that has ventured into Agriculture, Architecture, Engineering and
Medicine programmes.

153
The public Universities are themselves not able to admit more because of the limited and
overstretched facilities. The numbers admitted for programmes that are expensive to
mount are still very low because of the recommended student lecturer ratios. In some
programmes, classes are merged due to the limited space and students admitted through
the joint admission board (JAB) are getting alternative accommodation as bed capacities
are overstretched. To a large extent, most of the universities are not able to continuously
sustain these ratios, thus diluting quality. For social sciences in both private and public
universities, the class sizes are swelling and the lecture-student ration becoming un-
proportional. With such emerging challenges, the impact of the planned double intake
for the 2011/2012 and 2012/2013 academic years for all public universities and
constituent colleges is still a tall order.
Based on the hypothesis and results of this study, effective quality and quality teaching
by faculty is four dimensional, taking recognition of Government, human resource
management practices, continuous professional development and teaching facilities.
Although the level of significance differs, all the factors considered have a considerable
influence on quality of teaching at Universities in Kenya.

154
5.4 Recommendations
5.4.1 Areas for Improvement
From this research, quality of teaching staff is still a challenge that must be addressed by
all the players, and in particular, ensuring that proper human resource management
(HRM) practices are in place as well encouraging continuous professional development
of the teaching staff. With the increased demand for higher education, universities need
to set aside proportional amount of funds for staff development. This will encourage staff
to continuously undertake research so as to be able to present relevant papers in
international conferences and seminars. Also, the need to therefore address the working
conditions of teaching staff is necessary, including provision of furnished offices.
At most universities, up to two-thirds of university lecturers have had no initial
pedagogical training. Most of these institutions are relying on individuals who have not
acquired their highest level of academic training as lecturers. To improve their efficiency
and effectiveness in delivering their services, the academic staff must be trained
continuously in relevant areas. The universities must therefore, have clear training
policies, outlining their strategy for human resource development, instead of the ad- hoc
procedures currently followed in most of these institutions.

155
The need to recognize staff as important resource in the university set-up is also
important. In this study, most of the HRM issues including ways of hiring of staff,
professional development, performance management, compensation, recognition and
reward were lowly rated. For instance, staff appraisal system came out uniquely low.
Universities must therefore improve their HRM practices and recognize the performers as
well as ensure that the approaches used for attracting and retaining staff are above board.
Motivation of staff will reduce levels of brain drain. It is also recommended to review the
appraisal system to enhance objectivity and enrich acceptability by the staff.
Expansion of teaching facilities is also necessary to enhance quality. The existing
physical teaching facilities as well as their status were a point of reference by the
respondents. With growth in student numbers, increase in provision for capital projects is
necessary to cater for expanded library facilities, lecture halls, recreational facilities,
catering and accommodation facilities, modern laboratory equipments, modern teaching
aids and increased access to internet facilities. It is therefore recommended that the
Government and the various university council boards to increase budget for facility
expansion.
The Commission for Higher Education needs to come out strongly in regulation of
programmes at private universities and enhancing quality of programmes across all
universities. The commission should also ensure that only competent and qualified staff
are allowed to teach. The diverse entry levels into university programmes in the region

156
are still a challenge and many are the times that Kenyan students cross borders to access
the same programmes that they did not qualify for in the country. As a result of
commercialization of university education, some private universities, though having been
approved to offer specific programmes with specific programme centred guidelines, often
flexi their admission criteria to attract more students. This needs to be discouraged by all
universities since the quality of graduates remains differentiated.

157
5.4.2 Areas for Further Research
In this research, human resource management practices, as an instrument for improving
quality at universities in Kenya remained below the minimum standard. The relationship
between HRM, as a key element to quality was not strong. There existed a big vacuum on
the appraisal system for staff, especially for recognition or reward and for identifying
training needs.
With the growth in university education in Kenya, internal brain drain is becoming
common and a challenge across all universities. While universities have adopted retention
strategies for teaching staff, mobility of staff has grown over the last few years. A
relationship between staff development and job mobility requires further consideration.
In the research, e-leaning was rated as a major resource for knowledge dissemination at
universities. However, even with the current Information and Communication
Technology (ICT) infrastructure in most of the universities, e-content development is yet
to take root in Kenya. E-content is a clear driver that will justify greater investment in
computers by universities so as to facilitate self guided materials for students, as well as
reach remote localities therefore making university education easily accessible.
Building capacity for e-content is an investment that will address the current lecturer
shortages that cannot be adequately addressed in the long-run. Also there is a pressing

158
need to design ICT based curricula rather than treating ICT as a separate education
product. With the trend towards embracing ICT and e-content for universities, this area
will also require further research so as to balance e-content as a model for knowledge
delivery, as an HR quality improvement and also as a resource to the Kenyan
student/learner.

159
REFERENCES
Abagi, O. (1999). Revitalizing financing of higher education in Kenya “resource
Utilization in Public Universities in Kenya”. Research report, Association of
African Universities. Accra, Ghana.
Ajayi, J. F., Goma, L.K.H., & Ampah-Johnson, G. (1996). The African experience with
Higher education. The Association of African Universities, Accra In
association with London: James Currey and Athens:Ohio University Press.
Akiba, M., & G. LeTendre (2009). Improving Teacher Quality: The U.S. Teaching
Force in Global Context. New York: Teachers College Press.
Anyamele, S.C. (2007). Managing professional competence of teaching staff in
the university: Views of Finish university leaders. Academic Leadership:
The Online Journal, 5(1).
Arcaro, J. S. (1995). Quality in Education. An implementation handbook. Delary
Beach, FL: St Lucie Press.

160
Biggs, J. (2001). The reflective institution: assuring and enhancing the quality of
Teaching and learning. Journal of Higher Education, 41, 221-238.
Billing, D. (2004). International comparisons and trends in external quality assurance:
commonality or diversity. Journal of Higher education, 47, 113-137.
Billing, D., &Thomas, H. (2000). The international transferability of quality assessment
systems for higher education: The Turkish experience. Quality in higher
education, 6 (1), 31-40.
Bradley, D.A.O. (2005). To what End? The Effectiveness of Quality Assurance
in Higher Education. Biennial Conference on Quality, Assurance and
Diversity.
Chimanikire, P., Mutandwa, E., Gadzirayi, C. T., Muzondo, N.,& Mutandwa, B.(2007).
Factors affecting job satisfaction among academic professionals in tertiary
institutions in Zimbabwe. African Journal of Business Management, 1(6),
166-175.
Chacha, N. C. (2004). Reforming Higher Education in Kenya: Challenges, Lessons and
Opportunities. State University of New York Workshop with the

161
Parliamentary Committee on Education, Science and Technology.
Naivasha, Kenya.
Carrington, W.J. & Detragiache, E. (1999). How Extensive Is the Brain Drain. Journal
of Finance and Development. 36, 46–49.
Dolinsek, S., & J. Rupnik. (1999). Realizing the European higher education area.
Communiqué of the Conference of Ministers responsible for Higher
Education in Berlin. 19 September 2003.
Duke, C. (1992). The Learning University: Towards a New Paradigm. Buckingham and
Bristol: The Society for Research into Higher Education and Open
University Press.
El-Khawas, E. (2001). Who’s in charge of quality? The governance issues in quality
assurance. Tertiary Education and Management, 7, 111-119.
Fabrice H. & Soleine L.R. (2008). The path to quality teaching in higher education.
Unpublished working document OECD.
162
Farrugia, C. (1996). A continuing professional development model for quality assurance
in higher education. Journal of quality assurance in education. 4(2), 28-
34.
Fielden, J. (1998). Higher education staff development: a continuing mission. Paper
presented at the world conference of teachers. Paris.
Gabko, P., Osanna, P.H., & Reichl, F. (2000). Quality Management and Total Quality at
Universities. Workshop Proceedings. Dept. Interchangeable
Manufacturing and Industrial Metrology – Austauschbau und
Messtechnik, ISBN 3-901888-15-2.
Gertruida, M. B. (2004). Programme review guidelines for quality assurance in higher
education; A South African perspective. International Journal of
Sustainability in Higher Education, 5, 372-383.
Gordon, G. (2002). The roles of leadership and ownership in building an effective quality
culture. Quality in Higher Education’, 8(1), 97-106.
Griffiths, S. (1993). Staff Development and Quality Assurance. In R. Ellis. Quality
Assurance for University Teaching. Buckingham and Bristol: The Society
for Research into Higher Education and Open University Press.

163
Harvey L. & Green, D. (1993) “Defining quality”, Assessment and Evaluation in Higher
Education, Vol.18, pp.8-35
Harvey, L., Burrows, A. & Green, D. (1992), “Criteria of quality in Higher Education report
of the QHE Project”, The University of Central England, Birmingham.
Harvey, L. (2001). Evaluation for what?. Quality in Higher Education, 7(3), 245-263.
Harvey, L. (2002). The end of quality. Quality in higher education, 8(1), 5-22.Hayward,
F. M. (2006). Quality Assurance and Accreditation of Higher Education in
Africa. Conference on Higher Education Reform in Francophone Africa:
Understanding the Keys of Success. Ouagadougou, Burkina Faso.
Hoyle, D. (1995). ISO 9000 Quality Systems Handbook. Oxford: Butterworth-
Heinemann Ltd, 415.
Huba, M., & Freed, J. (2000). Learner-centred assessment on college campuses. Boston:
Allyn and Bacon.
Kauto-Koivula, K. (1997). Degree-Oriented Adult Education in the Work Environment:
A Case Study of the Main Determinants in the Management of Long Term

164
Technology Education Process. Unpublished Ph.D. Dissertation,
University of Tampere.
Kenya National Bureau of Statistics (2009). Economic Survey 2009. Retrieved May 20,
2010, from http:// www.knbs.or.ke . Nairobi: Kenya.
Knight, P., & P. Trowler (2000). Department-level cultures and the improvement of
learning and teaching. Studies in higher education, 25(1), 69-83.
Knight, J. (2004). Cross-Border Education in a Trade Environment: Complexities and
Policy Implications: A Background Report for Discussion at the African
Association of Universities Workshop on Implications of WTO/GATS for
Higher Education in Africa. Proceedings of Workshop on GATS, 27–29
April. Accra, Ghana.
Kothari, C.R. (2009). Research Methodology: Methods and Techniques. New Delhi. New
Age International Publishers.
Magagula, C.M. (2005). The Benefits and Challenges of Cross-Border Higher Education
in Developing Countries. JHEA/RESA. 3(1), 29–49.

165
Macintyre, S. (2004). Universities and the idea of quality: Carmichael, R.(ed.) Quality in
a time of change. Proceedings of the Australian Universities quality
forum. Melbourne, AUQA.
Mathooko, J. M., Mathooko, F.M., & Mathooko, P.M. (2007). Academic proposal
writing. A guide to preparing proposals for academic research. Nakuru:
Amu press.
Maviiri, J.C. (2007). Trading or Sharing – Emerging opportunities and challenges for
Cross Border Higher Education in East Africa. Retrieved May 20,
2009, from http:// www.iau.iau.net.conferences . Nairobi: Kenya.
Menges, R. J. (1997). Fostering Faculty Motivation to Teach: Approaches to Faculty
Development. In James L. Bess (Eds). Teaching Well and Liking It:
Motivation Faculty to Teach Effectively. Baltimore and London: The John
Hopkins University.
Ministry of Education Science & Technology (2006). Kenya Education Sector
Support Programme. Delivering quality education and training to
all Kenyans. Nairobi.
Mugenda, O.M., & Mugenda, A.G.(1999). Research methods; quantitative and
166
Qualitative approaches. Nairobi: African Centre for Technology Studies.
Nafukho, F. M. (2004). The Market Model of Financing State Universities. African
Universities in the Twenty-First Century, 1, 126–39. Dakar: CODESRIA.
Newton, J. (1999). An evaluation of the impact of external quality monitoring on a higher
education college. Assessment and Evaluation in Higher Education, 24(2),
215-235.
Newton, J. (2000). Feeding the beast or improving quality. Academics perceptions of
quality assurance and quality monitoring. Quality in Higher Education,
6(2), 153-163.
Newton, J. (2002). Views from below: academics coping with quality. Quality in Higher
Education, 8(1), 39-61.
Ngware, M. W., & Ndirangu, M. (2005). An improvement in instructional
quality: can evaluation of teaching effectiveness make a difference.
Quality Assurance in Education. 13(3), 183 – 201. ISSN: 0968-4883
Norusis, M. J. (1990). SPSS Introductory Statistics Students Guide, SPSS
International BV. The Netherlands. 321-341.

167
Oldroyd, D. (1995). Integrated Staff development in the Self-Developing School. In K.
Hamalainen, D. Oldroyd, & E. Haapanen (Eds.), Making School
Improvement Happen. Department of Teacher Education, Vantaa Institute
of Continuing Education. University of Helsinki.
Ramsden, P. (1992). Learning to teach in higher education: A review. New York,
London: Routledge.
Ramsden, P. (2003). Learning to teach in higher education. Journal of Pediatric
Gastroenterology & Nutrition: 36 (4), 511-512.
Redelinghuys, H. (2005). Colonialism Reborn: An Onslaught on our Autonomy, Cross
Border Provision and the Future of Higher Education in Africa.
Association of African Universities, Eleventh General Conference, 12–25
February, Capetown.
Rice, R. E., & Austin, A. E. (1993). Organizational Impact of Faculty Moral and
Motivation to Teach. In P. Seldin (Eds), How Administrators Can improve
Teaching. San Francisco and Oxford: Jossey-Bass Publishers.

168
Sabaya, W. (2004). Quality Assurance, Accreditation and Recognition of Qualifications in
Africa: Tanzania’s Experience and the Arusha Convention. Implications
of WTO/GATS for Higher Education in Africa. Proceedings of Workshop
on GATS, 27–29 April, Accra, 175–82.
Scott, P. (2000). Globalization and the University: Challenges for the Twenty- First
Century. Centre for Higher Education Transformation.
Scott, G., & Hawke, I. (2003). Using an external quality audit as a lever for institutional
change. Assessment and evaluation in higher education, 28(3).
Sifuna, D. N. (1998) . The governance of Kenyan public universities. Research in Post-
secondary Education, 3(2).
Schiffman L.G., & Kanuk L.L. (1997). Consumer Behaviour, 6th ed. Prentice Hall, New
York.
Tettey. J. W. (2006). Staff Retention in Africa Universities: Elements of Sustainable
Strategy. Washington, DC: World Bank.
The Universities Act, Cap 201B (1985). Special Issue of the Kenya Gazette Supplement
No. 65 of 15th October, 2004 (Legislative Supplement No. 41).

169
Legal Notice No. 112. Retrieved November 15, 2009, from http://
www.che.or.ke.
Tzafrir, S. S. , & Gur, A. B. A. (2007). HRM Practices and Perceived Quality: The Role
of Trust as a Mediator. Research and Practice in Human Resource
Management, 15(2), 1-20.
Tracey, W. R. (1991). The Human Resource Glossary. New York: American
Management Association (AMACO).
Vidovich, L. (2001). That chameleon ‘quality’: The multiple and contradictory
discourses of ‘quality’ policy in Australian higher education. Discourse:
studies in the cultural policies of education, 22(2), 249-261.
Vroeijenstijn, T. (2001) ‘How to assure quality in higher education’, in Baijnath, N.
Maimela, S.and Singh, P. (Eds): Quality Assurance in Open and
Distance Learning, Unisa and Technikon SA, Johannesburg, 65–80.
World Bank (1988). Education in Sub-Saharan Africa: Policies for Adjustment,
Revitalisation and Expansion. Washington, DC: World Bank.
World Bank (2000). Higher Education in Developing Countries: Peril or Promise.
Task Force on Higher Education and Society. Washington DC: World
Bank.

170
World Bank (2002). Constructing Knowledge Societies. New Challenges for
Tertiary Education. Washington, DC: World Bank.
Yizengaw,T.(2003). Transformations in Higher Education: Expansion in Ethiopian
Higher Education System. Regional Training Conference on Financials,
23–25 September, Accra, Ghana.

171
APPENDICES
APPENDIX 1
RESEARCH QUESTIONNAIRE
My name is Mr. Joseph Obwogi, a PhD Student at Jomo Kenyatta University of
Agriculture and Technology. I am conducting a research on the factors that affect quality
(service delivery) of teaching staff at universities in Kenya. This has been facilitated by
the fact that with dynamic industrial and market needs, quality at Kenyan universities
must be well balanced and benchmarked with successful and excellent global institutions
so as to assure customer satisfaction. As a teaching staff of the university, you are
requested to participate in this study by kindly answering the following questions. The
information you provide shall be treated with utmost confidence. Please provide
responses to the following questions.
PART ONE
University (please tick as appropriate)
(a) University of Nairobi (b) Kenyatta University
(c) USIU (d) KCA University.
(e) Egerton University (f) Narok University College
(g) Kabarak University (h) JKUAT
Age (please tick as appropriate)
(a) 18-24 (b) 25-30 (c) 31-36 (d) 37-42 (e) 43-48 (f) 49-54 (g) Over 55
Gender
(a) Male (b) Female
Designation ………………………………
Department……………………………..

172
PART TWO
1.0 Role of Government and Commission for Higher Education (CHE) in
promoting quality at universities in Kenya
1.1: Indicate the degree to which you agree with each statement relating to role of
Government/CHE in promoting quality of teaching staff by using the following scale:
strongly disagree (1), disagree (2), agree (3), strongly agree (4)
Statement 4 3 2 1
A1 Universities in Kenya are semi- autonomous
A2 Though semi-autonomous, the universities are accountable to the
Government
A3 The Government, through the Ministry of Higher Education has a
direct hand in the day to day running of universities
A4 The Government is involved in the attraction and retention of senior
managers in public universities
A5 The hiring of managers in public universities is competitively handled
by the Government
A6 Salary scales and other benefits for managers are competitive
A7 The Kenyan Government supports key projects in public universities
A8 Disbursement of financial resources is prompt to universities
A9 The Governments supports student learning in public universities
A10 The Governments supports student learning in private universities
A11 Through performance based contracts, the Government is able to
monitor performance of key managers of universities
A12 The Government monitors curriculum development, implementation
and evaluation
A13 Universities provide quarterly /annual returns/reports to Government
on performance
A14 The Government is adequately represented in major decisions of
universities

173
A15 The Government encourages staff development at universities
A16 Through the commission for higher education, the Government is
able to regulate both private and public universities
A17 The commission accredits all programmes offered at universities in
Kenya based on resource capacities declared
A18 The commission is directly involved in quality improvement of
university programmes
A19 The commission for higher education facilitates external quality
assurance of all university programmes
A20 The commission issues from time to time guidelines on quality and
quality assurance of human and teaching facilities of universities
1.2: List other roles of Government and Commission for Higher Education (CHE) in
promoting quality of service at universities in Kenya
------------------------------------------------------------------------------------------------------------
------------------------------------------------------------------------------------------------------------
------------------------------------------------------------------------------------------------------------
------------------------------------------------------------------------------------------------------------
------------------------------------------------------------------------------------------------------------
------------------------------------------------------------------------------------------------------------
------------------------------------------------------------------------------------------------------------

174
2.0 Human Resource Management (HRM) practices and Quality
2.1: In a scale of 1 (strongly disagree) to 4 (strongly agree), tick your degree of
agreement to the following statements relating to human resource management practices
on improving quality at universities:
Statement 4 3 2 1
B1 The university managers clearly understand university goals
and objectives
B2 The university managers are responsive to employees’
B3 University managers provide employees with the information on
quality
B4 The university leaders enhance the quality of service given by
employees
B5 The managers care for career development for employees
B6 Promotions are based on merit at the university
B7 Only qualified and competent staff are hired
B8 The university invests in professional development for staff
B9 Training needs assessment is clear and unbiased
B10 Compensation is attractive compared to other training institutions
B11 Compensation is performance based
B12 Compensation is equitable and fair
B13 Employees are regularly appraised/evaluated
B14 Employees receive feedback on their performance
B15 Feedback is prompt
B16 There is recognition/reward for high performers
B17 Low performers are recommended for training/couching

175
2.2 List other HRM tools used for improving quality at your institution
------------------------------------------------------------------------------------------------------------
---------------------------------------------------------------------------------------------------------------
---------------------------------------------------------------------------------------------------------------
---------------------------------------------------------------------------------------------------------------
---------------------------------------------------------------------------------------------------------------
---------------------------------------------------------------------------------------------------------------
---------------------------------------------------------------------------------------------------------------
---------------------------------------------------------------------------------------------------------------
---------------------------------------------------------------------------------------------------------------
---------------------------------------------------------------------------------------------------------------
---------------------------------------------------------------------------------------------------------------
---------------------------------------------------------------------------------------------------------------

176
3.0 The effect of continuing professional development (staff development) on
quality at universities in Kenya
3.1: In a scale of 1 (strongly disagree) to 4 (Strongly agree), indicate your degree of
agreement to the following statements on continuing professional development of staff
and their involvement in social and other related activities.
Statements 4 3 2 1
C1 There exists a policy for staff development
C2 The university provides for continuous growth for lecturers
C3 Lecturer are involved in curriculum/programme
development
C4 Lecturer participate in departmental and faculty policies
C5 Lecturer participate in formulation of national curricula and
examinations
C6 Lecturer participation in the selection of syllabuses and
teaching methods
C7 The teaching and working environment is good
C8 lecturers’ conditions of work are reasonable
C9 Remuneration is reasonable and commensurate with
qualifications
C10 The degree of dialogue of staff with the institution’s
administration is cordial
C The degree of collective decision making and peer-group
selection is good
C11 Lecturers contribution to the community’s welfare
C12 The degree of self-control and regulation is high
C13 Level of appreciation of lecturers work by the community
is modest

177
3.2 List other key continuing professional development issues at your institution
------------------------------------------------------------------------------------------------------------
------------------------------------------------------------------------------------------------------------
------------------------------------------------------------------------------------------------------------
------------------------------------------------------------------------------------------------------------
------------------------------------------------------------------------------------------------------------
------------------------------------------------------------------------------------------------------------
------------------------------------------------------------------------------------------------------------
------------------------------------------------------------------------------------------------------------
------------------------------------------------------------------------------------------------------------
------------------------------------------------------------------------------------------------------------
------------------------------------------------------------------------------------------------------------
------------------------------------------------------------------------------------------------------------
--------------------------------------------------------------------------------------------------------

178
4.0 Effect of teaching facilities on quality of service at universities in Kenya.
4.1: Kindly rate your level of agreement to the following statements
Statement 4 3 2 1
D1 E-learning is an important resource for knowledge dissemination
D2 Existence of internet teaching facilities provide opportunities for
greater service delivery
D3 Use of computers and computer accessories facilitate service
delivery
D4 The large class sizes affect effective teaching
D5 The inadequate teaching and learning teaching facilities affect
effective teaching
D6 Delays in procurement of teaching materials affect the teaching
process
D7 The use of sub-standard teaching materials affect quality
D8 Mismatch of services with financial compensation affects quality
D9 The limited Government support to universities has affected
quality
D10 The physical teaching facilities are visually appealing
D11 The Faculty/School has up to date equipments
4.2: In your opinion, what are the teaching facilities that affect quality of teaching and
learning?
------------------------------------------------------------------------------------------------------------
------------------------------------------------------------------------------------------------------------
------------------------------------------------------------------------------------------------------------
------------------------------------------------------------------------------------------------------------
------------------------------------------------------------------------------------------------------------
------------------------------------------------------------------------------------------------------------

179
5.0 Challenges in maintaining quality
5.1: In a scale of 1(Strongly disagree) to 4(strongly agree), please tick your feelings on
the following challenges about quality of teaching staff at universities in Kenya.
Challenges 4 3 2 1
E1 Financial constraints have strained the development of human
capital at universities in Kenya
E2 Professional expertise on maintenance of quality human
resource is missing in most universities
E3 Ineffective communication channels affect human resource
quality
E4 There is a lot of political interference on appointment of senior
staff at universities
E5 The level of independence of senior managers is low
E6 There lacks a harmonized/standard model of reference for
human capital development
E7 cross border higher education affects quality of university
human capital
E8 Mushrooming of many universities in Kenya has affected
quality of teaching staff at universities
E9 The inequity , economic disparities and social tensions within
East African region affects quality of teaching staff at
universities
E10 Staff quality at universities is affected by lack of logistic
policies for quality assurance
E11 Brain drain in Kenya has affected quality of staff at universities
E12 The introduction of transnational education(i.e. universities
from other countries opening branches in Kenya) has
negatively impacted on quality of staff
E13 The opening up of regional constituent colleges across the

180
country has diluted quality learning at higher education
E14 The self-interest and profit motives of some universities affect
quality of academic resources
E15 The cultural diversity in Kenya and across the region affects
quality
E16 Lack of a single human resource model for quality assurance
affects quality
E17 The diversity in education systems within the East African
region affects quality
E18 The accreditation and quality monitoring systems in Kenya and
within the region is not harmonized
E19 The admission criteria in Kenya and within the region is not
harmonized
5.2: What are the other challenges associated with maintenance of quality at universities
in Kenya
------------------------------------------------------------------------------------------------------------
------------------------------------------------------------------------------------------------------------
------------------------------------------------------------------------------------------------------------
------------------------------------------------------------------------------------------------------------
------------------------------------------------------------------------------------------------------------
6.0 kindly give your comments on factors affecting quality (service delivery) of
teaching staff at universities in Kenya
------------------------------------------------------------------------------------------------------------
------------------------------------------------------------------------------------------------------------
------------------------------------------------------------------------------------------------------------
------------------------------------------------------------------------------------------------------------
Thanks for your responses

181
APPENDIX 2
DESCRIPTIVE ANALYSIS TABLES
1. Reliability tests Case Processing Summary
N %
Cases Valid 64 62.7
Exclud
ed(a) 38 37.3
Total 102 100.0
a Listwise deletion based on all variables in the procedure.
Reliability Statistics
Cronbach's Alpha N of Items
.831 20
Reliability
Case Processing Summary
N %
Cases Valid 86 84.3
Excluded(a) 16 15.7
Total 102 100.0
a Listwise deletion based on all variables in the procedure.
Reliability Statistics
Cronbach's Alpha N of Items
.918 17

182
Reliability
Case Processing Summary
N %
Cases Valid 85 83.3
Exclud
ed(a) 17 16.7
Total 102 100.0
a Listwise deletion based on all variables in the procedure.
Reliability Statistics
Cronbach's
Alpha
N of
Items
.858 14
Reliability
Case Processing Summary
N %
Cases Valid 91 89.2
Exclud
ed(a) 11 10.8
Total 102 100.0
a Listwise deletion based on all variables in the procedure.
Reliability Statistics
Cronbach's
Alpha
N of
Items
.739 11

183
Reliability
Case Processing Summary
N %
Cases Valid 68 66.7
Exclud
ed(a) 34 33.3
Total 102 100.0
a Listwise deletion based on all variables in the procedure.
Reliability Statistics
Cronbach's
Alpha
N of
Items
.856 19

184
2. Descriptive and correlations
Correlations
** Correlation is significant at the 0.01 level (2-tailed).
* Correlation is significant at the 0.05 level (2-tailed).
Government
and CHE HRM
Staff
developmen
t Facilities
Challenge
s
Government and
CHE
Pearson
Correlation 1 .489(**) .444(**) .200(*) .010
Sig. (2-tailed) .000 .000 .044 .924
N 102 102 102 102 102
HRM Pearson
Correlation .489(**) 1 .751(**) .227(*) -.120
Sig. (2-tailed) .000 .000 .022 .231
N 102 102 102 102 102
Staff development Pearson
Correlation .444(**) .751(**) 1 .334(**) -.090
Sig. (2-tailed) .000 .000 .001 .366
N 102 102 102 102 102
Facilities Pearson
Correlation .200(*) .227(*) .334(**) 1 .048
Sig. (2-tailed) .044 .022 .001 .629
N 102 102 102 102 102
Challenges Pearson
Correlation .010 -.120 -.090 .048 1
Sig. (2-tailed) .924 .231 .366 .629
N 102 102 102 102 102

185
Descriptive Statistics
N
Minimu
m
Maximu
m Mean
Std.
Deviation
Facilities 102 32.73 80.00 66.9430 7.97347
Challenges 102 40.00 80.00 60.3305 9.21648
Government and
CHE 102 33.00 67.00 53.4880 7.16415
Staff development 102 27.14 77.14 53.1457 8.86646
HRM 102 22.35 74.12 47.2265 9.85727

186
Correlations
Gender Government and CHE HRM
Staff development Facilities Challenges
Male Government and CHE
Pearson Correlation 1 .502(**) .434(**) .258(*) .020
Sig. (2-tailed) .000 .000 .028 .866 N 72 72 72 72 72 HRM Pearson
Correlation .502(**) 1 .782(**) .249(*) -.211
Sig. (2-tailed) .000 .000 .035 .075 N 72 72 72 72 72 Staff
development Pearson Correlation .434(**) .782(**) 1 .363(**) -.211
Sig. (2-tailed) .000 .000 .002 .075 N 72 72 72 72 72 Facilities Pearson
Correlation .258(*) .249(*) .363(**) 1 -.033
Sig. (2-tailed) .028 .035 .002 .784 N 72 72 72 72 72 Challenges Pearson
Correlation .020 -.211 -.211 -.033 1
Sig. (2-tailed) .866 .075 .075 .784 N 72 72 72 72 72 Female Government and
CHE Pearson Correlation 1 .441(*) .472(**) -.003 -.055
Sig. (2-tailed) .015 .008 .988 .772 N 30 30 30 30 30 HRM Pearson
Correlation .441(*) 1 .640(**) .141 .068
Sig. (2-tailed) .015 .000 .456 .720 N 30 30 30 30 30 Staff
development Pearson Correlation .472(**) .640(**) 1 .229 .200
Sig. (2-tailed) .008 .000 .224 .290 N 30 30 30 30 30 Facilities Pearson
Correlation -.003 .141 .229 1 .237
Sig. (2-tailed) .988 .456 .224 .208 N 30 30 30 30 30 Challenges Pearson
Correlation -.055 .068 .200 .237 1
Sig. (2-tailed) .772 .720 .290 .208 N 30 30 30 30 30
** Correlation is significant at the 0.01 level (2-tailed).
* Correlation is significant at the 0.05 level (2-tailed).

187
Descriptives
Gender = Male
Descriptive Statistics (a)
N Minimum Maximum Mean
Std.
Deviation
Facilities 72 32.73 80.00 66.6919 8.36245
Challenges 72 40.00 80.00 59.1843 8.88594
Government and
CHE 72 33.00 66.00 53.2437 7.44137
Staff development 72 27.14 77.14 52.9389 9.30382
HRM 72 22.35 74.12 46.8158 10.33279
Valid N (listwise) 72
a Gender = Male
Gender = Female
Descriptive Statistics (a)
N Minimum Maximum Mean
Std.
Deviation
Facilities 30 54.55 80.00 67.5455 7.04838
Challenges 30 40.00 80.00 63.0813 9.56203
Government and
CHE 30 44.21 67.00 54.0745 6.53283
Staff development 30 35.71 68.57 53.6422 7.84267
HRM 30 30.59 62.35 48.2124 8.69407
Valid N (listwise) 30
a Gender = Female

188
DESCRIPTIVES
University of Nairobi
Descriptive Statistics (a)
N Minimum Maximum Mean Std. Deviation
Facilities 12 65.45 74.55 68.6818 3.11862 Staff development 12 60.00 67.69 61.9830 2.08767 Challenges 12 51.25 66.32 60.5396 4.63904 Government and CHE 12 49.00 64.44 58.6520 5.06270
HRM 12 45.00 62.35 57.7827 5.35874 Valid N (listwise) 12
Kenyatta University
Descriptive Statistics (a)
N Minimum Maximum Mean Std. Deviation
Facilities 18 58.18 76.36 66.2626 5.44463 Challenges 18 49.47 78.89 62.6650 8.51296 Government and CHE 18 36.00 64.00 53.3216 8.23136
Staff development 18 41.43 68.57 52.8095 8.69891 HRM 18 30.59 58.82 42.5893 8.24932 Valid N (listwise) 18
Jomo Kenyatta University of Agriculture and Techonology
Descriptive Statistics(a)
N Minimum
Maximum Mean
Std. Deviation
Facilities 19 32.73 76.36 67.9330 9.86543 Challenges 19 47.37 76.67 59.6008 9.99884 Staff development 19 32.86 68.57 52.3511 10.78487 Government and CHE 19 41.05 66.00 51.2715 6.85025
HRM 19 22.35 64.71 43.8431 12.14564 Valid N (listwise) 19

189
United states International University
Descriptive Statistics (a)
N
Minimu
m
Maximu
m Mean
Std.
Deviation
Facilities 4 78.18 80.00 79.5455 .90909
Challenges 4 44.71 80.00 61.7320 19.22091
Staff development 4 45.71 67.69 57.6374 9.03708
HRM 4 45.88 56.47 52.0588 5.29412
Government and
CHE 4 45.00 54.00 48.8947 4.60459
Valid N (listwise) 4
KCA University
Descriptive Statistics (a)
N
Minimu
m
Maximu
m Mean
Std.
Deviation
Facilities 11 58.18 80.00 65.2893 6.26967
Challenges 11 42.35 70.53 56.0354 8.23419
Staff development 11 27.14 77.14 52.5108 12.45780
Government and
CHE 11 44.00 64.71 51.6862 6.31214
HRM 11 26.00 74.12 49.1529 12.14501
Valid N (listwise) 11

190
Egerton University
Descriptive Statistics (a)
N Minimum
Maximum Mean
Std. Deviation
Facilities 18 42.00 76.36 64.0101 9.37222 Challenges 18 40.00 80.00 61.5218 11.55720 Government and CHE 18 33.00 65.00 53.3384 8.19622
Staff development 18 40.00 64.29 52.2423 5.33783 HRM 18 40.00 64.29 49.1809 6.82612 Valid N (listwise) 18
Narok University College
Descriptive Statistics (a)
N Minimum
Maximum Mean
Std. Deviation
Facilities 13 54.55 80.00 66.8531 7.27855 Challenges 13 45.56 64.21 56.8376 5.78211 Government and CHE 13 43.00 67.00 54.4453 5.17218
Staff development 13 35.71 62.86 47.1851 7.54830 HRM 13 34.12 62.35 43.7104 7.05631 Valid N (listwise) 13
Kabarak University
Descriptive Statistics (a)
N Minimum
Maximum Mean
Std. Deviation
Facilities 7 54.55 76.00 66.1299 10.37358 Challenges 7 57.89 70.53 65.3216 5.39630 Government and CHE 7 47.00 66.00 55.1429 8.31522
Staff development 7 50.77 56.92 52.8414 2.35981 HRM 7 38.82 63.53 45.9544 8.36848 Valid N (listwise) 7

191
Descriptives
Age = 18-24
Descriptive Statistics (a)
N
Minimu
m
Maximu
m Mean
Std.
Deviation
Facilities 2 68.00 69.09 68.5455 .77139
Government and
CHE 2 50.00 60.00 55.0000 7.07107
Challenges 2 47.37 62.35 54.8607 10.59566
Staff development 2 47.14 61.82 54.4805 10.37702
HRM 2 31.76 61.33 46.5490 20.90818
Valid N (listwise) 2
Age = 25-30
Descriptive Statistics (a)
N
Minimu
m
Maximu
m Mean
Std.
Deviation
Facilities 19 54.55 80.00 66.0766 6.91050
Challenges 19 44.21 78.89 63.0233 9.49320
Government and
CHE 19 36.00 64.44 50.2256 8.02416
Staff development 19 35.71 77.14 49.0064 11.05104
HRM 19 22.35 74.12 43.5547 12.91401
Valid N (listwise) 19

192
Age = 31-36
Descriptive Statistics (a)
N
Minimu
m
Maximu
m Mean
Std.
Deviation
Facilities 29 54.55 80.00 67.7868 7.47970
Challenges 29 40.00 75.79 55.8164 9.58058
Government and
CHE 29 33.00 67.00 55.0110 8.05739
Staff development 29 27.14 68.57 54.4087 9.11736
HRM 29 26.00 64.29 48.7959 9.68901
Valid N (listwise) 29
Age = 37-42
Descriptive Statistics (a)
N
Minimu
m
Maximu
m Mean
Std.
Deviation
Facilities 22 60.00 78.18 66.8678 5.62950
Challenges 22 49.47 80.00 61.2695 7.60368
Staff development 22 32.86 67.69 52.8605 9.51023
Government and
CHE 22 41.05 62.00 51.7751 5.35120
HRM 22 32.94 61.18 47.0624 7.81397
Valid N (listwise) 22
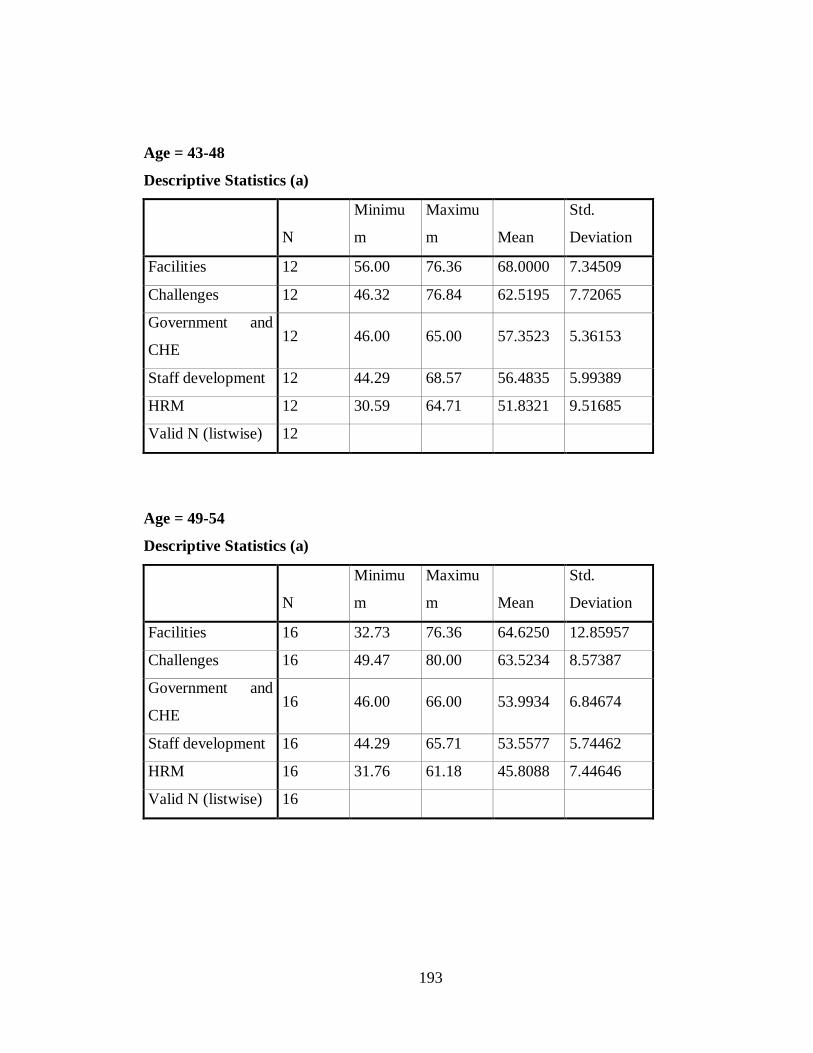
193
Age = 43-48
Descriptive Statistics (a)
N
Minimu
m
Maximu
m Mean
Std.
Deviation
Facilities 12 56.00 76.36 68.0000 7.34509
Challenges 12 46.32 76.84 62.5195 7.72065
Government and
CHE 12 46.00 65.00 57.3523 5.36153
Staff development 12 44.29 68.57 56.4835 5.99389
HRM 12 30.59 64.71 51.8321 9.51685
Valid N (listwise) 12
Age = 49-54
Descriptive Statistics (a)
N
Minimu
m
Maximu
m Mean
Std.
Deviation
Facilities 16 32.73 76.36 64.6250 12.85957
Challenges 16 49.47 80.00 63.5234 8.57387
Government and
CHE 16 46.00 66.00 53.9934 6.84674
Staff development 16 44.29 65.71 53.5577 5.74462
HRM 16 31.76 61.18 45.8088 7.44646
Valid N (listwise) 16

194
Age = Over 55
Descriptive Statistics (a)
N Minimum
Maximum Mean
Std. Deviation
Facilities 2 72.73 76.00 74.3636 2.31417 Challenges 2 45.56 67.78 56.6667 15.71348 Staff development 2 51.43 53.85 52.6374 1.70949 Government and CHE 2 50.00 55.00 52.5000 3.53553
HRM 2 42.86 48.24 45.5462 3.80293 Valid N (listwise) 2
Descriptives
Designation = Assistant lecturer
N Minimum Maximum Mean Std. Deviation Facilities 31 54.55 76.36 63.4663 6.44398 Challenges 31 40.00 76.67 57.4980 8.39413 Government and CHE 31 36.00 66.00 53.4865 6.80602 Staff development 31 35.71 68.57 50.3145 8.80963 HRM 31 22.35 60.00 43.7979 8.95294 Valid N (listwise) 31
Designation = Graduate assistant
Descriptive Statistics(a)
N Minimum Maximum Mean Std. Deviation
Challenges 3 62.35 78.89 72.6362 8.97458
Facilities 3 68.00 70.91 69.3333 1.46962
Government and CHE 3 47.00 60.00 55.6667 7.50555
Staff development 3 35.71 61.82 49.8442 13.18481
HRM 3 22.35 61.33 45.5145 20.50131
Valid N (listwise) 3

195
Designation = Lecturer
Descriptive Statistics (a)
N Minimum Maximum Mean Std. Deviation
Facilities 56 32.73 80.00 67.5714 8.59944
Challenges 56 42.35 80.00 61.1276 9.10991
Staff development 56 27.14 77.14 53.7953 8.82331
Government and CHE 56 33.00 67.00 53.4589 7.87209
HRM 56 26.00 74.12 48.1794 9.94766
Valid N (listwise) 56
Designation = Professor
Descriptive Statistics(a)
N Minimum Maximum Mean
Std.
Deviation
Facilities 5 63.64 80.00 72.0000 8.19191
Challenges 5 44.71 71.58 60.0172 13.73990
Staff development 5 51.43 58.57 54.2857 3.91230
HRM 5 47.06 56.47 52.0000 4.73520
Government and CHE 5 45.00 54.00 49.2000 3.19374
Valid N (listwise) 5
Designation = Senior lecturer
Descriptive Statistics (a)
N Minimum Maximum Mean Std. Deviation Facilities 7 67.27 76.36 72.6753 3.25537 Challenges 7 52.94 69.47 61.4477 6.28411 Staff development 7 51.43 68.57 61.0884 5.29346 Government and CHE 7 49.00 62.00 55.8571 3.80476 HRM 7 44.71 64.71 52.1120 7.42919 Valid N (listwise) 7
Test

196
T-Test
Paired Samples Statistics
Mean N
Std.
Deviation
Std. Error
Mean
Pair 1 Government and CHE 53.4880 102 7.16415 .70936
HRM 47.2265 102 9.85727 .97602
Pair 2 Government and CHE 53.4880 102 7.16415 .70936
Staff development 53.1457 102 8.86646 .87791
Pair 3 Government and CHE 53.4880 102 7.16415 .70936
Facilities 66.9430 102 7.97347 .78949
Pair 4 Government and CHE 53.4880 102 7.16415 .70936
Challenges 60.3305 102 9.21648 .91257
Pair 5 HRM 47.2265 102 9.85727 .97602
Staff development 53.1457 102 8.86646 .87791
Pair 6 HRM 47.2265 102 9.85727 .97602
Facilities 66.9430 102 7.97347 .78949
Pair 7 HRM 47.2265 102 9.85727 .97602
Challenges 60.3305 102 9.21648 .91257
Pair 8 Staff development 53.1457 102 8.86646 .87791
Facilities 66.9430 102 7.97347 .78949
Pair 9 Staff development 53.1457 102 8.86646 .87791
Challenges 60.3305 102 9.21648 .91257
Pair 10 Facilities 66.9430 102 7.97347 .78949
Challenges 60.3305 102 9.21648 .91257

197
Paired Samples Correlations
N Correlation Sig.
Pair 1 Government and CHE & HRM 102 .489 .000
Pair 2 Government and CHE & Staff
development 102 .444 .000
Pair 3 Government and CHE & Facilities 102 .200 .044
Pair 4 Government and CHE &
Challenges 102 .010 .924
Pair 5 HRM & Staff development 102 .751 .000
Pair 6 HRM & Facilities 102 .227 .022
Pair 7 HRM & Challenges 102 -.120 .231
Pair 8 Staff development & Facilities 102 .334 .001
Pair 9 Staff development & Challenges 102 -.090 .366
Pair 10 Teaching facilities& Challenges 102 .048 .629

198
Paired Samples Test
Paired Differences t df
Sig. (2-tailed)
Mean Std. Deviation
Std. Error Mean
95% Confidence Interval of the Difference
Lower Upper Pair 1
Government and CHE - HRM
6.26149 8.91025 .88225 4.51135 8.01163 7.097 101 .000
Pair 2
Government and CHE - Staff development
.34230 8.57812 .84936 -1.34260 2.02720 .403 101 .688
Pair 3
Government and CHE - Facilities
-13.45492 9.59548 .95009 -
15.33965 -11.57019
-14.162 101 .000
Pair 4
Government and CHE - Challenges
-6.84246 11.61954 1.15051 -9.12475 -4.56016 -5.947 101 .000
Pair 5
HRM - Staff development -5.91919 6.67491 .66091 -7.23027 -4.60811 -8.956 101 .000
Pair 6
HRM - Facilities
-19.71641 11.18379 1.10736 -
21.91312 -17.51971
-17.805 101 .000
Pair 7
HRM - Challenges
-13.10395 14.27764 1.41370 -
15.90834 -10.29955 -9.269 101 .000
Pair 8
Staff development - Facilities
-13.79722 9.74393 .96479 -
15.71111 -11.88333
-14.301 101 .000
Pair 9
Staff development - Challenges
-7.18476 13.35465 1.32231 -9.80786 -4.56165 -5.433 101 .000
Pair 10
Teaching facilities- Challenges
6.61247 11.89157 1.17744 4.27674 8.94819 5.616 101 .000

199
Independent Samples Test
Levene's Test for Equality of Variances t-test for Equality of Means
F Sig. t df
Sig. (2-tailed)
Mean Difference
Std. Error Difference
95% Confidence Interval of the Difference
L Upper Government and CHE
Equal variances assumed
.430 .514 -.532 100 .596 -.83077 1.56238 2.26894
Equal variances not assumed
-.561 61.491 .577 -.83077 1.48043 -3.79060 2.12906
HRM Equal variances assumed
.545 .462 -.650 100 .517 -1.39665 2.14820 -5.65862 2.86532
Equal variances not assumed
-.698 64.110 .488 -1.39665 2.00061 -5.39319 2.59989
Staff development
Equal variances assumed
.914 .341 -.363 100 .717 -.70339 1.93507 -4.54252 3.13574
Equal variances not assumed
-.390 63.994 .698 -.70339 1.80346 -4.30623 2.89945
Facilities Equal variances assumed
.130 .720 -.491 100 .625 -.85354 1.73924 -4.30414 2.59706
Equal variances not assumed
-.527 64.001 .600 -.85354 1.62088 -4.09161 2.38454
Challenges
Equal variances assumed
.196 .659 -1.973 100 .051 -3.89702 1.97471 -7.81478 .02074
Equal variances not assumed
-1.914 50.931 .061 -3.89702 2.03578 -7.98416 .19012

200
One-way Anova
Descriptives
N Mean Std. Deviation Std. Error
95% Confidence Interval for Mean Minimum
Maximum
Lower Bound
Upper Bound
Government and CHE
25-30 19 50.2256 8.02416 1.84087 46.3581 54.0931 36.00 64.44
31-36 29 55.0110 8.05739 1.49622 51.9461 58.0758 33.00 67.00 37-42 22 51.7751 5.35120 1.14088 49.4025 54.1477 41.05 62.00 43-48 12 57.3523 5.36153 1.54774 53.9458 60.7589 46.00 65.00 49-54 16 53.9934 6.84674 1.71169 50.3450 57.6418 46.00 66.00 Total 98 53.4773 7.26153 .73353 52.0215 54.9332 33.00 67.00 HRM 25-30 19 43.5547 12.91401 2.96268 37.3303 49.7790 22.35 74.12 31-36 29 48.7959 9.68901 1.79920 45.1104 52.4814 26.00 64.29 37-42 22 47.0624 7.81397 1.66594 43.5979 50.5269 32.94 61.18 43-48 12 51.8321 9.51685 2.74728 45.7854 57.8788 30.59 64.71 49-54 16 45.8088 7.44646 1.86162 41.8409 49.7768 31.76 61.18 Total 98 47.2747 9.82073 .99204 45.3057 49.2436 22.35 74.12 Staff development
25-30 19 49.0064 11.05104 2.53528 43.6799 54.3328 35.71 77.14
31-36 29 54.4087 9.11736 1.69305 50.9407 57.8768 27.14 68.57 37-42 22 52.8605 9.51023 2.02759 48.6439 57.0771 32.86 67.69 43-48 12 56.4835 5.99389 1.73029 52.6752 60.2919 44.29 68.57 49-54 16 53.5577 5.74462 1.43615 50.4966 56.6188 44.29 65.71 Total 98 53.1289 8.98183 .90730 51.3281 54.9296 27.14 77.14 Facilities 25-30 19 66.0766 6.91050 1.58538 62.7458 69.4073 54.55 80.00 31-36 29 67.7868 7.47970 1.38894 64.9417 70.6320 54.55 80.00 37-42 22 66.8678 5.62950 1.20021 64.3718 69.3637 60.00 78.18 43-48 12 68.0000 7.34509 2.12035 63.3331 72.6669 56.00 76.36 49-54 16 64.6250 12.85957 3.21489 57.7726 71.4774 32.73 76.36 Total 98 66.7588 8.05693 .81387 65.1435 68.3741 32.73 80.00 Challenges
25-30 19 63.0233 9.49320 2.17789 58.4477 67.5988 44.21 78.89
31-36 29 55.8164 9.58058 1.77907 52.1722 59.4607 40.00 75.79 37-42 22 61.2695 7.60368 1.62111 57.8982 64.6408 49.47 80.00 43-48 12 62.5195 7.72065 2.22876 57.6140 67.4250 46.32 76.84 49-54 16 63.5234 8.57387 2.14347 58.9547 68.0921 49.47 80.00 Total 98 60.5169 9.15504 .92480 58.6814 62.3524 40.00 80.00

201
ANOVA
Sum of
squ. df
Mean
square F Sig.
Government and CHE Between Groups 517.304 4 129.326 2.616 .040
Within Groups 4597.488 93 49.435
Total 5114.792 97
HRM Between Groups 614.651 4 153.663 1.635 .172
Within Groups 8740.686 93 93.986
Total 9355.337 97
Staff development Between Groups 509.980 4 127.495 1.621 .176
Within Groups 7315.332 93 78.659
Total 7825.311 97
Facilities Between Groups 131.090 4 32.773 .494 .740
Within Groups 6165.573 93 66.296
Total 6296.663 97
Challenges Between Groups 965.303 4 241.326 3.132 .018
Within Groups 7164.720 93 77.040
Total 8130.023 97

202
APPENDIX 3
FACTOR ANALYSIS KMO and Bartlett's Test
Kaiser-Meyer-Olkin Measure of Sampling Adequacy. .677
Bartlett's Test of Sphericity Approx. Chi-square 499.167
df 190
Sig. .000
Communalities
Initial Extraction
A1 1.000 .557
A2 1.000 .655
A3 1.000 .437
A4 1.000 .594
A5 1.000 .737
A6 1.000 .576
A7 1.000 .673
A8 1.000 .788
A9 1.000 .828
A10 1.000 .618
A11 1.000 .848
A12 1.000 .717
A13 1.000 .608
A14 1.000 .628
A15 1.000 .763
A16 1.000 .710
A17 1.000 .644
A18 1.000 .697
A19 1.000 .660
A20 1.000 .730

203
Extraction Method: Principal Component Analysis.
Total Variance Explained
Com
pone
nt Initial Eigen values
Extraction Sums of squared
Loadings
Rotation Sums of squared
Loadings
Total
% of
Variance
Cumul.
% Total
% of
Variance
Cumul.
% Total
% of
Variance
Cumul
%
1 5.116 25.582 25.582 5.116 25.582 25.582 2.842 14.211 14.211
2 2.296 11.480 37.062 2.296 11.480 37.062 2.679 13.393 27.604
3 2.012 10.058 47.120 2.012 10.058 47.120 2.643 13.217 40.821
4 1.421 7.104 54.223 1.421 7.104 54.223 1.934 9.669 50.489
5 1.352 6.759 60.983 1.352 6.759 60.983 1.737 8.683 59.172
6 1.272 6.359 67.341 1.272 6.359 67.341 1.634 8.169 67.341
7 .987 4.933 72.275
8 .926 4.628 76.903
9 .865 4.326 81.228
10 .622 3.109 84.337
11 .502 2.512 86.849
12 .461 2.306 89.155
13 .374 1.872 91.027
14 .369 1.847 92.874
15 .321 1.607 94.482
16 .288 1.442 95.923
17 .281 1.407 97.331
18 .216 1.081 98.412
19 .191 .953 99.365
20 .127 .635
100.00
0
Extraction Method: Principal Component Analysis.

204
Component Matrix (a)
Component
1 2 3 4 5 6
A18 .681
A20 .665
A15 .649
A19 .615
A12 .614 -.428
A14 .605
A5 .585 .544
A17 .580 .450
A10 .552
A4 .535 -.438
A13 .527
A7 .644
A3 -.552
A1 -.540
A6 .428 .536
A11 .720
A2 .495
A8 .713
A16 .476 .617
A9 .458 .552
Extraction Method: Principal Component Analysis.
a 6 components extracted.

205
Rotated Component Matrix (a)
Component Transformation Matrix
Component 1 2 3 4 5 6
1 .583 .581 .502 .131 .230 .014
2 .024 -.231 .190 -.682 .466 .477
3 -.570 -.143 .685 .390 .081 .165
4 -.020 .284 -.253 .223 -.296 .847
5 -.510 .591 -.319 -.029 .524 -.115
6 .271 -.399 -.278 .562 .601 .120
Extraction Method: Principal Component Analysis. Rotation Method: Varimax with
Kaiser Normalization.
Factor Analysis
KMO and Bartlett's Test
Kaiser-Meyer-Olkin Measure of Sampling
Adequacy. .841
Bartlett's Test of
Sphericity
Approx.Chi-square 865.754
df 136
Sig. .000
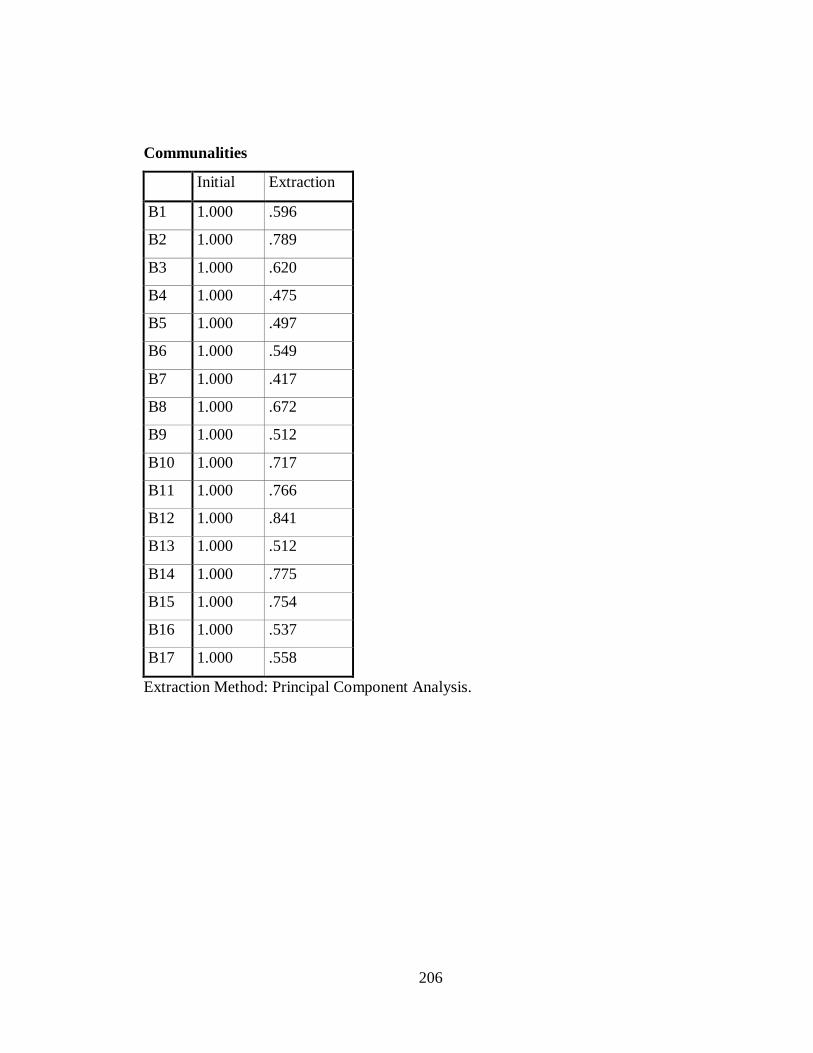
206
Communalities
Initial Extraction
B1 1.000 .596
B2 1.000 .789
B3 1.000 .620
B4 1.000 .475
B5 1.000 .497
B6 1.000 .549
B7 1.000 .417
B8 1.000 .672
B9 1.000 .512
B10 1.000 .717
B11 1.000 .766
B12 1.000 .841
B13 1.000 .512
B14 1.000 .775
B15 1.000 .754
B16 1.000 .537
B17 1.000 .558
Extraction Method: Principal Component Analysis.

207
Total Variance Explained
Compon
ent Initial Eigen values
Extraction Sums of squared
Loadings
Rotation Sums of squared
Loadings
Total
% of
Variance
Cumul
% Total
% of
Variance
Cumul.
% Total
% of
Variance
Cumul.
%
1 7.556 44.444 44.444 7.556 44.444 44.444 4.220 24.822 24.822
2 1.893 11.138 55.582 1.893 11.138 55.582 3.393 19.958 44.780
3 1.138 6.695 62.278 1.138 6.695 62.278 2.975 17.498 62.278
4 .997 5.863 68.141
5 .870 5.119 73.261
6 .750 4.413 77.674
7 .673 3.959 81.633
8 .614 3.611 85.244
9 .544 3.197 88.441
10 .415 2.444 90.885
11 .344 2.024 92.909
12 .283 1.664 94.572
13 .256 1.504 96.077
14 .220 1.293 97.370
15 .194 1.142 98.511
16 .150 .882 99.394
17 .103 .606 100.000
Extraction Method: Principal Component Analysis.

208
Component Matrix (a)
Component
1 2 3
B8 .818
B11 .814
B14 .797
B3 .778
B12 .765 -.485
B16 .725
B10 .707 -.464
B6 .688
B15 .676
B5 .672
B17 .652
B7 .612
B13 .584
B4 .529 -.440
B1 .642
B2 .471 .622 .425
B9 .431 .514
Extraction Method: Principal Component Analysis.
a 3 components extracted.

209
Component Transformation Matrix
Component 1 2 3
1 .665 .593 .455
2 -.571 .010 .821
3 .482 -.805 .345
Extraction Method: Principal Component Analysis. Rotation Method: Varimax with
Kaiser Normalization.
Factor Analysis
KMO and Bartlett's Test
Kaiser-Meyer-Olkin Measure of Sampling Adequacy. .766
Bartlett's Test of Sphericity Approx. Chi-Qualityuare 536.857
df 91
Sig. .000
Communalities
Initial Extraction
C1 1.000 .660
C2 1.000 .683
C3 1.000 .711
C4 1.000 .551
C5 1.000 .600
C6 1.000 .615
C7 1.000 .782
C8 1.000 .817
C9 1.000 .758
C10 1.000 .641
C11 1.000 .691
C12 1.000 .746
C13 1.000 .625
C14 1.000 .773
Extraction Method: Principal Component Analysis.

210
Total Variance Explained
Compo
nent Initial Eigen values
Extraction Sums of
Qualityuared Loadings
Rotation Sums of Qualityuared
Loadings
Total
% of
Variance
Cumulati
ve % Total
% of
Variance
Cumulati
ve % Total
% of
Variance
Cumulati
ve %
1 5.083 36.310 36.310 5.083 36.310 36.310 2.980 21.289 21.289
2 2.095 14.963 51.274 2.095 14.963 51.274 2.707 19.339 40.628
3 1.386 9.898 61.171 1.386 9.898 61.171 2.149 15.348 55.976
4 1.090 7.782 68.954 1.090 7.782 68.954 1.817 12.978 68.954
5 .799 5.710 74.663
6 .743 5.310 79.974
7 .596 4.258 84.232
8 .485 3.461 87.693
9 .420 2.999 90.693
10 .365 2.610 93.303
11 .325 2.323 95.626
12 .251 1.794 97.420
13 .221 1.580 99.000
14 .140 1.000 100.000
Extraction Method: Principal Component Analysis.

211
Component Matrix (a)
Component
1 2 3 4
C11 .804
C6 .722
C8 .698 -.520
C7 .697 -.435
C13 .697
C2 .644
C10 .550 -.481
C5 .496 .433
C3 .484 .657
C9 .508 -.642
C4 .556
C14 .587 -.619
C1 .550
C12 .582 .585
Extraction Method: Principal Component Analysis.
a 4 components extracted.
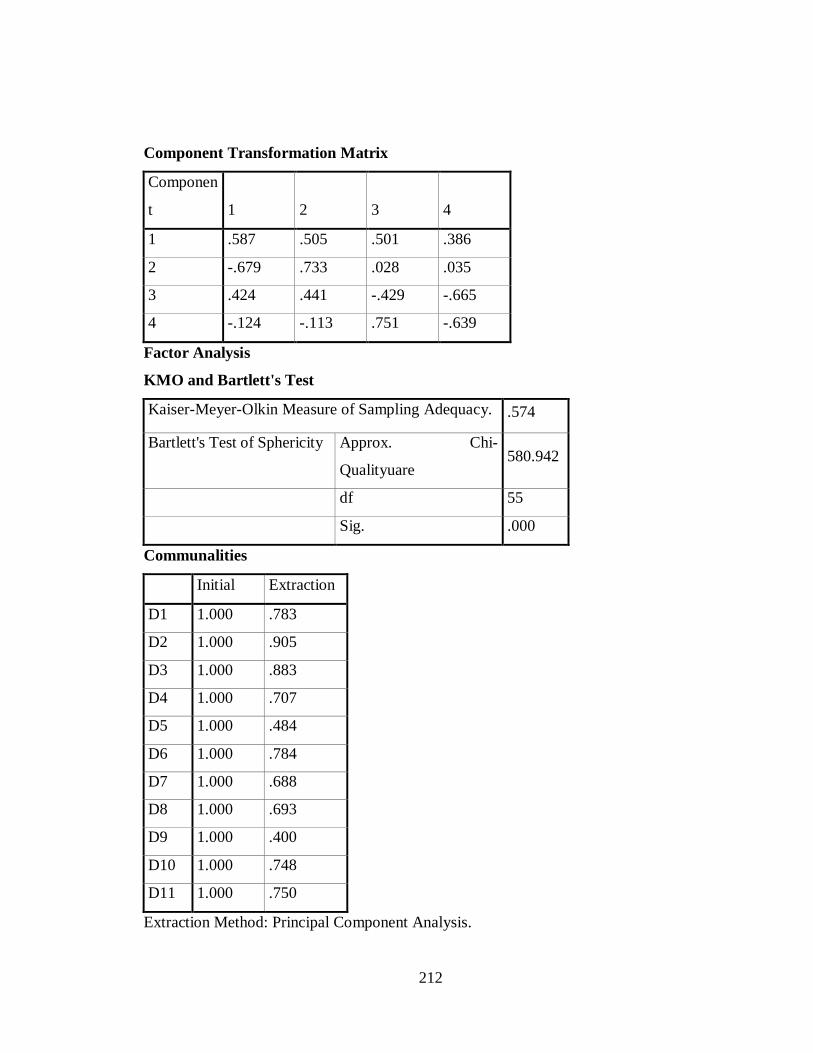
212
Component Transformation Matrix
Componen
t 1 2 3 4
1 .587 .505 .501 .386
2 -.679 .733 .028 .035
3 .424 .441 -.429 -.665
4 -.124 -.113 .751 -.639
Factor Analysis
KMO and Bartlett's Test
Kaiser-Meyer-Olkin Measure of Sampling Adequacy. .574
Bartlett's Test of Sphericity Approx. Chi-
Qualityuare 580.942
df 55
Sig. .000
Communalities
Initial Extraction
D1 1.000 .783
D2 1.000 .905
D3 1.000 .883
D4 1.000 .707
D5 1.000 .484
D6 1.000 .784
D7 1.000 .688
D8 1.000 .693
D9 1.000 .400
D10 1.000 .748
D11 1.000 .750
Extraction Method: Principal Component Analysis.

213
Total Variance Explained
Compon
ent Initial Eigen values
Extraction Sums of squared
Loadings
Rotation Sums of squared
Loadings
Total
% of
Variance
Cumulativ
e % Total
% of
Variance
Cumulativ
e % Total
% of
Variance
Cumulat
ive %
1 3.822 34.749 34.749 3.822 34.749 34.749 3.593 32.665 32.665
2 2.477 22.516 57.265 2.477 22.516 57.265 2.621 23.823 56.488
3 1.527 13.880 71.145 1.527 13.880 71.145 1.612 14.657 71.145
4 .897 8.155 79.300
5 .551 5.012 84.312
6 .514 4.676 88.989
7 .416 3.779 92.768
8 .315 2.860 95.628
9 .268 2.434 98.061
10 .158 1.439 99.501
11 .055 .499 100.000
Extraction Method: Principal Component Analysis.
Component Matrix (a)
Component 1 2 3
D6 .816 D4 .766 D7 .759 D8 .751 D5 .687 D9 .590 D2 .839 D3 .485 .761 D1 .476 .737 D10 .811 D11 .807
Extraction Method: Principal Component Analysis. a 3 components extracted.

214
Component Transformation Matrix
Componen
t 1 2 3
1 .915 .403 .017
2 -.389 .871 .299
3 .106 -.280 .954
Extraction Method: Principal Component Analysis. Rotation Method: Varimax with
Kaiser Normalization.
Factor Analysis
KMO and Bartlett's Test
Kaiser-Meyer-Olkin Measure of Sampling Adequacy. .580
Bartlett's Test of Sphericity Approx. Chi-square 565.038
df 171
Sig. .000
Communalities
Initial Extraction E1 1.000 .733 E2 1.000 .505 E3 1.000 .649 E4 1.000 .750 E5 1.000 .619 E6 1.000 .698 E7 1.000 .579 E8 1.000 .755 E9 1.000 .761 E10 1.000 .657 E11 1.000 .497 E12 1.000 .556 E13 1.000 .669 E14 1.000 .711 E15 1.000 .705 E16 1.000 .761 E17 1.000 .756 E18 1.000 .733 E19 1.000 .839

215
Total Variance Explained
Compone
nt Initial Eigen values
Extraction Sums of squared
Loadings
Rotation Sums of squared
Loadings
Total
% of
Variance
Cumulati
ve % Total
% of
Variance
Cumulat
ive % Total
% of
Variance
Cumulati
ve %
1 5.619 29.575 29.575 5.619 29.575 29.575 2.609 13.733 13.733
2 1.817 9.563 39.137 1.817 9.563 39.137 2.555 13.446 27.179
3 1.723 9.067 48.205 1.723 9.067 48.205 2.501 13.165 40.344
4 1.476 7.769 55.974 1.476 7.769 55.974 1.928 10.145 50.490
5 1.257 6.614 62.588 1.257 6.614 62.588 1.740 9.159 59.648
6 1.043 5.488 68.077 1.043 5.488 68.077 1.601 8.428 68.077
7 .951 5.004 73.081
8 .873 4.596 77.677
9 .740 3.895 81.572
10 .711 3.743 85.315
11 .579 3.050 88.365
12 .485 2.551 90.916
13 .447 2.352 93.268
14 .356 1.875 95.143
15 .288 1.516 96.658
16 .278 1.464 98.122
17 .167 .877 98.999
18 .106 .556 99.555
19 .084 .445 100.000
Extraction Method: Principal Component Analysis.

216
Component Matrix (a)
Component
1 2 3 4 5 6
E16 .798
E9 .723
E8 .694 .445
E7 .692
E14 .596
E13 .580
E11 .552
E17 .542 -.482 -.426
E2 .515 .452
E12 .504 .491
E5 .461
E6 .459
E15 .483 -.594
E10 .535 .591
E3 .486 .559
E19 .729
E18 .456 .687
E4 .579
E1 .560
Extraction Method: Principal Component Analysis.
a 6 components extracted.

217
Component Transformation Matrix
Component 1 2 3 4 5 6
1 .553 .497 .470 .396 .128 .230
2 -.113 -.638 .699 .233 .019 -.193
3 -.245 -.014 .062 -.176 .906 .291
4 -.124 -.020 .328 -.482 -.377 .709
5 .718 -.563 -.300 -.111 .110 .231
6 -.301 -.172 -.298 .717 -.092 .519
Extraction Method: Principal Component Analysis. Rotation Method: Varimax with
Kaiser Normalization.

218
APPENDIX 4
DESCRIPTIVES STATISTICS FOR FACTOR ANALYSIS Descriptive Statistics
N Minimum
Maximum Mean
Std. Deviation
Low performers are recommended for training/couching 98 1 4 1.98 .746
There is recognition/reward for high performers 102 1 4 2.23 .782
Feedback is prompt 101 1 3 1.99 .714 Employees receive feedback on their performance(either formal or informal) 98 1 4 2.34 .930
Employees are regularly appraised/evaluated 100 1 4 2.49 .732 The university leaders enhance the quality of service given by employees 99 1 4 2.70 .706
Valid N (listwise) 91 Descriptives Descriptive Statistics
N Minimum
Maximum Mean
Std. Deviation
Compensation is equitable and fair 99 1 4 2.16 .696 Compensation is attractive compared to other training institutions 98 1 4 2.35 .826
Only qualified and competent staff are hired 101 1 4 2.28 .885 Valid N (listwise) 95

219
Descriptive Statistics
N Minimum
Maximum Mean
Std. Deviation
Promotions are based on merit at the university 102 1 4 2.24 .835
The university managers are responsive to employees' questions and concerns 98 1 4 2.52 .776
The university managers clearly understand university goals and objectives 95 1 4 3.07 .703
Valid N (listwise) 93 Descriptives Descriptive Statistics
N Minimum
Maximum Mean
Std. Deviation
Through the commission for higher education, the Government is able to regulate both private and public universities 101 1 4 3.05 .684
The commission issues from time to time guidelines on quality and quality assurance of human and teaching facilities of universities 91 1 4 2.67 .746
The commission for higher education facilitates external quality assurance of all university programmes 98 1 4 2.55 .761
The Government is involved in the attraction and retention of senior managers in public universities 98 1 4 2.51 .900
Valid N (listwise) 84

220
Descriptive Statistics
N Minimum
Maximum Mean
Std. Deviation
The Government encourages staff development at institutions of higher learning
100 1 4 2.61 .803
The hiring of managers in public universities is competitively handled by the Government
100 1 4 2.11 .695
The Government is adequately represented in major decisions of universities
92 1 4 2.52 .858
Valid N (listwise) 89 Descriptives Descriptive Statistics
N Minimum
Maximum Mean
Std. Deviation
The Government monitors curriculum development, implementation and evaluation
101 1 4 2.36 .795
Through performance based contracts, the Government is able to monitor performance of key managers of universities 99 1 4 2.59 .756
The Governments supports student learning in private universities 100 1 4 2.58 .741
Valid N (listwise) 96
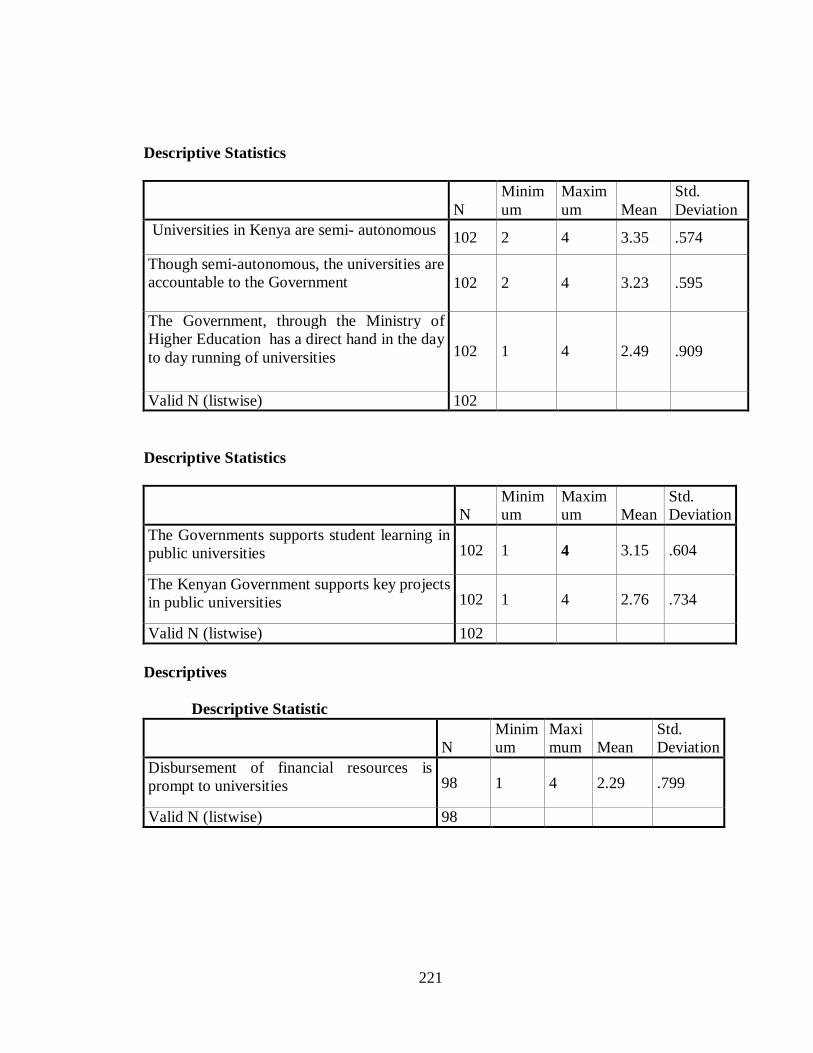
221
Descriptive Statistics
N Minimum
Maximum Mean
Std. Deviation
Universities in Kenya are semi- autonomous 102 2 4 3.35 .574
Though semi-autonomous, the universities are accountable to the Government 102 2 4 3.23 .595
The Government, through the Ministry of Higher Education has a direct hand in the day to day running of universities 102 1 4 2.49 .909
Valid N (listwise) 102 Descriptive Statistics
N Minimum
Maximum Mean
Std. Deviation
The Governments supports student learning in public universities 102 1 4 3.15 .604
The Kenyan Government supports key projects in public universities 102 1 4 2.76 .734
Valid N (listwise) 102 Descriptives Descriptive Statistic
N Minimum
Maximum Mean
Std. Deviation
Disbursement of financial resources is prompt to universities 98 1 4 2.29 .799
Valid N (listwise) 98

222
Descriptive Statistics
N Minimum
Maximum Mean
Std. Deviation
The self-interest and profit motives of some universities affect quality of academic resources
101 1 4 3.25 .830
Mushrooming of many universities in Kenya has affected quality of teaching staff at universities
102 1 4 3.03 .938
The introduction of transnational education(i.e. universities from other countries opening branches in Kenya) has negatively impacted on quality of staff 100 1 4 2.56 1.057
cross border higher education affects quality of university human capital 96 1 4 3.02 .846
Brain drain in Kenya has affected quality of staff at universities 102 1 4 3.20 .821
Valid N (listwise) 94 Descriptives Descriptive Statistics
N Minimum
Maximum Mean
Std. Deviation
The cultural diversity in Kenya and across the region affects quality 96 1 4 2.39 .956
The diversity in education systems within the East African region affects quality 99 1 4 2.56 .917
The opening up of regional constituent colleges across the country has diluted quality learning at higher education 98 1 4 2.89 .860
Valid N (listwise) 90

223
Descriptives Descriptive Statistics
N Minimum
Maximum Mean
Std. Deviation
Ineffective communication channels affect human resource quality 102 2 4 3.48 .593
Staff quality at universities is affected by lack of logistic policies for quality assurance 101 1 4 2.96 .761
There lacks a harmonized/standard model of reference for human capital development
97 1 4 3.08 .640
The level of independence of senior managers is low 95 1 4 2.95 .705
Valid N (listwise) 92 Descriptive Statistics
N Minimum
Maximum Mean
Std. Deviation
Financial constraints have strained the development of human capital at universities in Kenya
98 1 4 3.60 .638
The inequity , economic disparities and social tensions within east African region affects quality of teaching staff at universities
99 1 4 3.10 .814
Valid N (listwise) 95
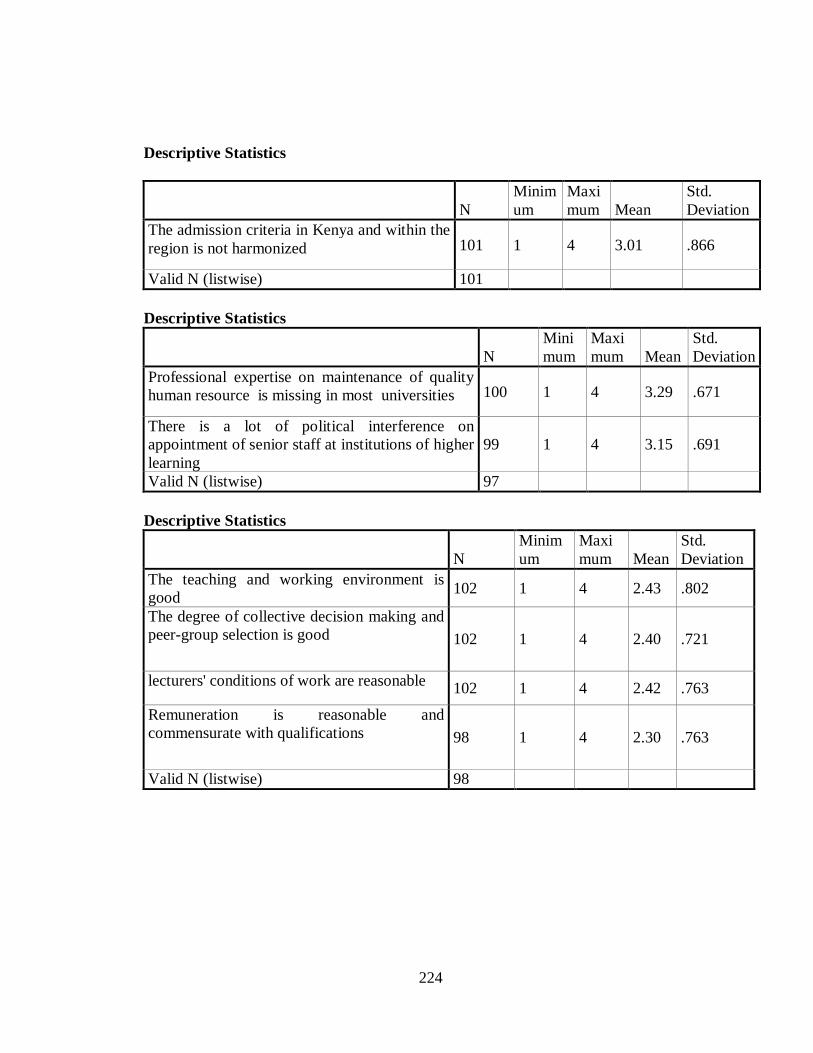
224
Descriptive Statistics
N Minimum
Maximum Mean
Std. Deviation
The admission criteria in Kenya and within the region is not harmonized 101 1 4 3.01 .866
Valid N (listwise) 101 Descriptive Statistics
N Minimum
Maximum Mean
Std. Deviation
Professional expertise on maintenance of quality human resource is missing in most universities 100 1 4 3.29 .671
There is a lot of political interference on appointment of senior staff at institutions of higher learning
99 1 4 3.15 .691
Valid N (listwise) 97 Descriptive Statistics
N Minimum
Maximum Mean
Std. Deviation
The teaching and working environment is good 102 1 4 2.43 .802
The degree of collective decision making and peer-group selection is good 102 1 4 2.40 .721
lecturers' conditions of work are reasonable 102 1 4 2.42 .763
Remuneration is reasonable and commensurate with qualifications 98 1 4 2.30 .763
Valid N (listwise) 98

225
Descriptive Statistics
N Minimum
Maximum Mean
Std. Deviation
There exists a policy for staff development 100 1 4 2.76 .740 The university provides for continuous growth for lecturers 102 1 4 2.74 .807
Lecturer are involved in curriculum/programme development 102 1 4 3.09 .676
Lecturer participate in departmental and faculty policies 102 1 4 3.23 .730
Valid N (listwise) 100 Descriptive Statistics
N Minimum
Maximum Mean
Std. Deviation
Lecturer participate in formulation of national curricula and examinations 99 1 4 2.85 .873
Lecturers contribution to the community's welfare 95 1 4 2.58 .708 The degree of self-control and regulation is high 98 1 4 2.60 .783 Valid N (listwise) 91
Descriptive Statistics
N Minimum
Maximum Mean
Std. Deviation
The degree of dialogue of staff with the institution's administration is cordial 98 1 4 2.46 .691
Level of appreciation of lecturers work by the community is modest 97 1 4 2.52 .805
Valid N (listwise) 95

226
APPENDIX 5 BUDGET FOR RESEARCH
Activities Items Cost Total Cost
1:Research
instruments
Development of data
collection(research) instruments
10,000
10,000
2: Data collection Application of the research
instruments
Field costs
miscellaneous
20,000
50,000
5,000
75,000
3: Data analysis
Coding of data
Data editing and cleaning
Data validation and checking
10,000
10,000
10,000
30,000
4: Report writing
Presenting data using statistical
tools, generation of Tables and
graphs
Descriptive report writing
10,000
10,000
20,000
5:Thesis
compilation
Thesis edit
Miscellaneous
5,000
10,000
15,000
6. Transport Travel costs to all universities
listed in the sampling frame
91,000
7. Other Stationery, telephone costs 10,000
Grand total 251,000
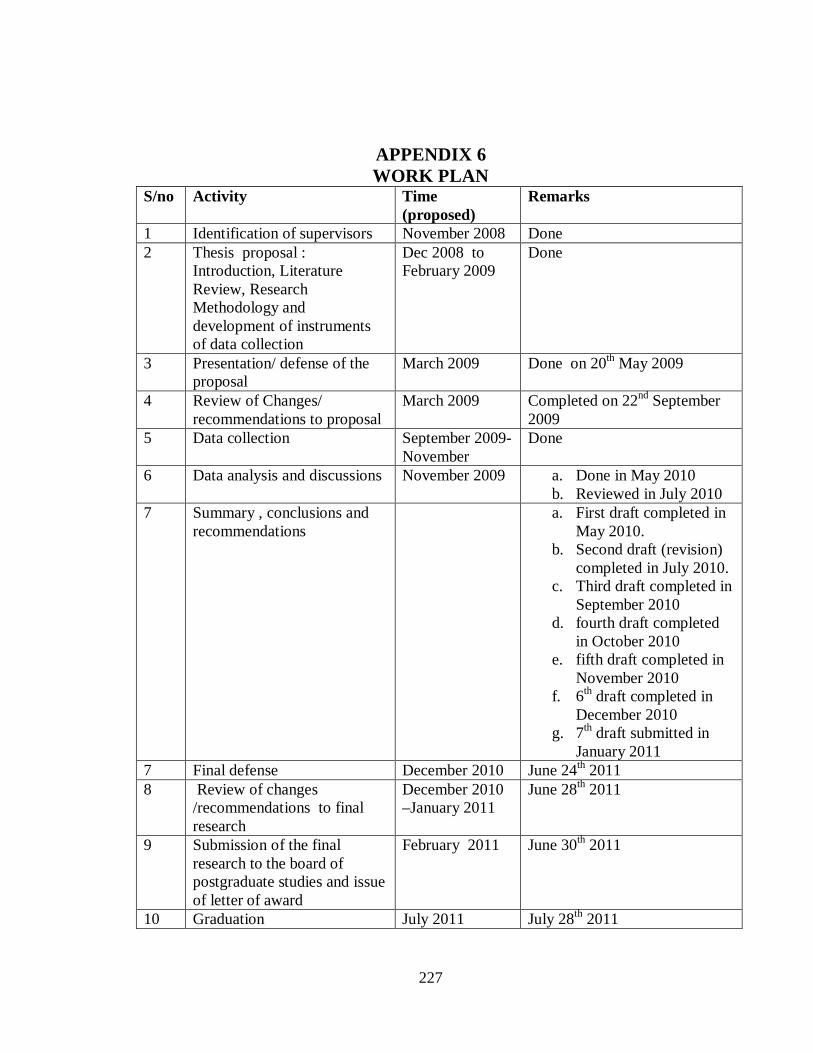
227
APPENDIX 6 WORK PLAN
S/no Activity Time (proposed)
Remarks
1 Identification of supervisors November 2008 Done 2 Thesis proposal :
Introduction, Literature Review, Research Methodology and development of instruments of data collection
Dec 2008 to February 2009
Done
3 Presentation/ defense of the proposal
March 2009 Done on 20th May 2009
4 Review of Changes/ recommendations to proposal
March 2009 Completed on 22nd September 2009
5 Data collection September 2009-November
Done
6 Data analysis and discussions November 2009 a. Done in May 2010 b. Reviewed in July 2010
7 Summary , conclusions and recommendations
a. First draft completed in May 2010.
b. Second draft (revision) completed in July 2010.
c. Third draft completed in September 2010
d. fourth draft completed in October 2010
e. fifth draft completed in November 2010
f. 6th draft completed in December 2010
g. 7th draft submitted in January 2011
7 Final defense December 2010 June 24th 2011 8 Review of changes
/recommendations to final research
December 2010 –January 2011
June 28th 2011
9 Submission of the final research to the board of postgraduate studies and issue of letter of award
February 2011 June 30th 2011
10 Graduation July 2011 July 28th 2011