factors related to the eating behavior and dietary
TRANSCRIPT

Retrospective Theses and Dissertations Iowa State University Capstones, Theses andDissertations
1962
Factors related to the eating behavior and dietaryadequacy of girls 12 to 14 years of ageMaxine Armstrong HintonIowa State University
Follow this and additional works at: https://lib.dr.iastate.edu/rtd
Part of the Home Economics Commons
This Dissertation is brought to you for free and open access by the Iowa State University Capstones, Theses and Dissertations at Iowa State UniversityDigital Repository. It has been accepted for inclusion in Retrospective Theses and Dissertations by an authorized administrator of Iowa State UniversityDigital Repository. For more information, please contact [email protected].
Recommended CitationHinton, Maxine Armstrong, "Factors related to the eating behavior and dietary adequacy of girls 12 to 14 years of age " (1962).Retrospective Theses and Dissertations. 2088.https://lib.dr.iastate.edu/rtd/2088

This dissertation has been 02-6496 microfilmed cxactly as received
11INTON, Maxine Armstrong, 1919— FACTORS RELATED TO THE EATING BEHAVIOR AND DIETARY ADEQUACY OF GIRLS 12 TO 14 ' YEARS OF AGE.
Iowa State University of Science and Technology Ph.D., 1962 Home Economics
University Microfilms, Inc., Ann Arbor, Michigan

FACTORS RELATED TO THE EATIKG BEHAVIOR AMD
DIETARY ADEQUACY OF GIRLS TO 14 YEARS OF AGS
r .pxine Arn.s t ronp Hir . ton
- Dissertation 5ucrr . i t tea to the
C-radurte Facul ty in Partial Fulf i l l : . .ent o
The Requirements l 'or the Degree of
DOCTC^ OF PHILOSOPHY
i.pjor Subjects; Food ?r.a Lutr i t ior-j •*> . v -s - 4 A
T i n "*• n V' • UUiC ...CuiiUiiJlO C «uuC; UxJii.
Approved:
In Charge of i-.plotf ;;or£.
Heads of r.a jor Departments
Dey of Grad ate College
lovva State University Of Science end Technology
Aa.es, Iowa
166 g:
Signature was redacted for privacy.
Signature was redacted for privacy.
Signature was redacted for privacy.
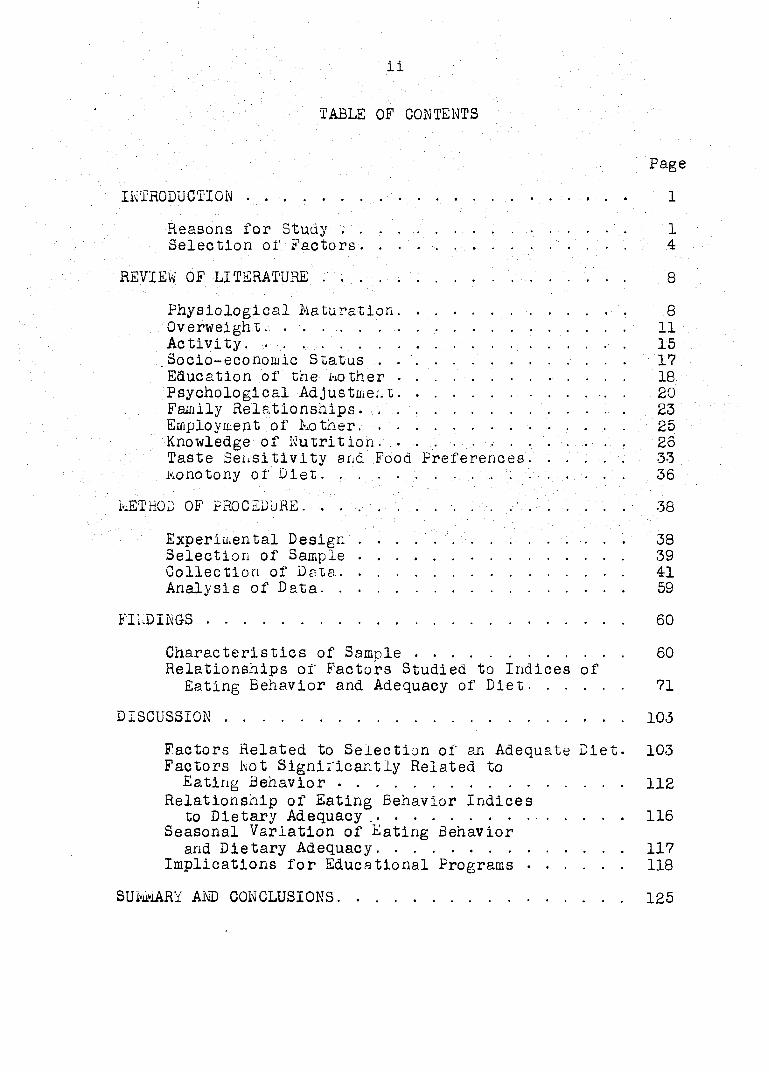
TABLE OF CONTENTS
Page
INTRODUCTION • . . 1
Reasons for Study . . . . ..... . . . . ... 1 Selection of Factors. . . . . ... . . . . .... . 4
REVIEW OF LITERATURE . ................ 8
Physiological Saturation 8 Ov e r w e i g h t . . . . . . . . 11 Activi ty . . 15 _Socio-economic Status . 17 Education of the iother . . . 18 Psychological Adjustment. . . 20 Family Relationships. . . . . . . 23 Employment of Mother. 25 Knowledge of Nutrition. . . ... . . . . . . . . 25 Taste Sensitivity and Food Preferences. . .'. . . 33 ko no tony of Diet. ................ 36
kETHOD OF PROCEDURE. . . . . . . . . . . . . . . . . . 38
Experimental Design . . . ... . ... . . . . . . . 38 Selection of Sample 39 Collection of Data. 41 Analysis of Data 59
FINDINGS 60
Characteristics of Sample 60 Relationships of Factors Studied to Indices of
Eating Behavior and Adequacy of Diet 71
DISCUSSION 103
Factors Related to Selection of an Adequate Diet. 103 Factors Not Significantly Related to
Eating Behavior 112 Relationship of Eating Behavior Indices
to Dietary Adequacy 116 Seasonal Variation of Eating Behavior
and Dietary Adequacy 117 Implications for Educational Programs 118
SUtasdARY AND CONCLUSIONS 125

ill
Page
LITERATURE CITED . . . . . . . . . . . . ..... . . 133
ACKNOWLEDGMENTS. 140
APPENDIX A . . . . ... . . . . ... .... . . . . 141
Social Status Classification. . . . . . . . • . . 141
APPENDIX S . . ..... , . . . . . . . 143
Questionnaire 143
APPENDIX C 149
Checc. List of Foods 149 Food Enjoyment Scale I. 151 Food Enjoyment Scale II 151 Food Experience Scale • . . . . . 152
APPENDIX D . . . . . . ... ." . . . . . . . . . ... 153
Taste Test Record Form. . . ... . . . . . . . . 153 Concentrations of Solutions for Taste Tests . . . 154
APPENDIA E: VALUES INVENTORY. . . ... . . . . . . . 155
APPENDIX F - 170
Food Intake Records 170 Scoring of Food Intake Records 177
APPENDIX G ]/79
Sex-role Identification Scales 179
APPENDIX H 181
Test of Nutrition Knowledge 181
APPENDIX I 189
Physical Activity Record Form 189
APPENDIX J: CORRELATION MATRICES 191

iv
LA:: LIZ 3
;Fr,
. € ci'ô -L • •"!/-• »-i n î — ' t" •' * ' " J. - D v' 1 1 L .L v • • — c •' ' * i~i n f 1 r> ' ' <-» •*" • • fi r . . ' r« m,i •*» ••• < v . u v. k.» ; .v. •_ i « • L v - _ v . r- 1 C- 7" T T 1 1 "• 4k
L. ... X V ' : C « ^ V '. . - • . • • • •
. P 'J i u n'.V) .-J • • . p »; o -• r T — v_/ • V' i • Vy » •-> i w - J v» t v, .T.. _'C :• u- ucc;rrl a,?.. 5
4. i- 1 0 U C _ ' /. U ) i . -j - 0 J. ; u r CCC . , I'"' ^ 6 ."4
' L 1 c . ctiv *:: 1 or-' . . . • . ? ;r
" - - •
• ... * . I-; ..., ; r .. 1
•C -ic' : ;/ v,' t • :
u,„f • <-Ï . ,.•>• •>• * -,-i ' , '
y ov.' u. ' c.." ne j iv r • -. v i ;;•> , • C r 1 • t r "r
' s eve.. .. -yr n. ,c .
. eer.rry, l.-.ol. • .
du j . Ac ui. i'; 'V i.;: of ir. diet r- r y rele :: u ? c y scores i or I . . °/;,huu-.-v ' -. • * v * vn ^ vi ' ' i c IV _ A . _ . 1 K' X . A \ • > « . • • •
po
O U .L (J 1L • uioi.c..ipr v L J — V, V . L t. • V. L' < V' V
I in. :_ch'vior ir.rices, 70
r l i c 1-. • v • 7-1 •-» —,-vn - " r- i" -*t ; <"» r* ^ -• 1 w y . t. V* — U X •«/«.« ' •' 4 « « . V.L i O L/ k) 0 ± ••'* U —. dietary -'c.c.-urcy. .
* . - % , -i *' •' * •• • - ' '* r» 1" n viC
i.. uehrvi _r ":.n 73
r ùi t: -Li** • Inturrelr tionshi:. r -, r, • * •- - il h ' r\' • 1 •-.> V f
•-no. i..ui. . . .cVS;;l o !.. o • f :.lz' u 1 j:.r
r oie I s. .lei" Lioi.S'.V: of ;..o; r ; ir, or^rn
responsicility ;;r t ' «""• 1 ; • , 1 C
.. : • n ! e:..pl-::yr.iOi'.t rnô Iz étions «o r;e : iris i'or
rule 14. Relationship of ;..o ...e;..c : rship in o :> r-n st' tus, î'ooo enjoy;:, ertiny behavior pr.c. of the (-.iris. • • .
hors1 e:i.ployr:.cnt mci izptions to r,_e, go ci r 1 er.t, I'c-ol experience, Cietrr; -c.equ?cy
20
V
Pege
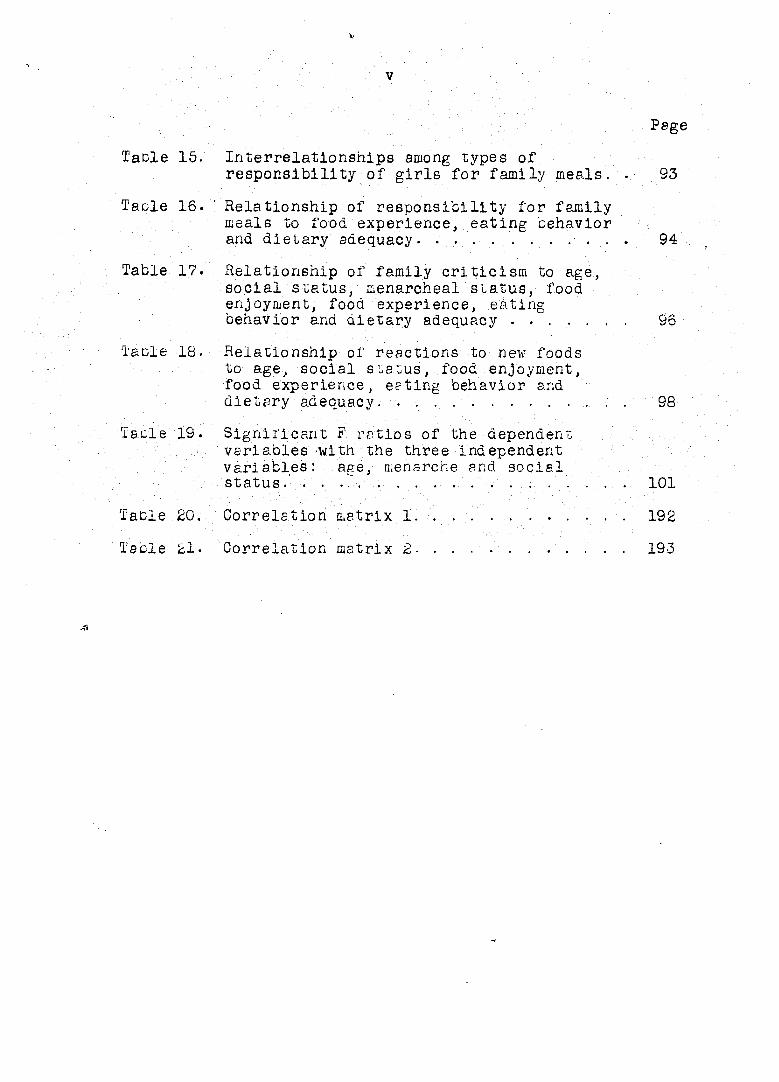
Tacle 15. Interrelationships among types of responsibility of girls for family meals. . 93
T'aole 16. ' Relationship of responsibility for family meals to food experience, eating behavior and dietary adequacy. 94
Table 17. Relationship of family criticism to age, social status, menarcheal status, food enjoyment, food experience, eating behavior and dietary adequacy . 96
Tacle 18. Relationship of reactions to new foods to age, social status,. .food enjoyment, food experience, eeting behavior and dietary adequacy. . 98
Tacle 19. Significant F ratios of the dependent variables -with the three independent variables : age, menarche and social status. . . . . . . . . « . ... . . . . . . 101
Tacle 20. Correlation matrix 1. . . . 192
Tacle 21. Correlation matrix 2 193
.41

vi
ur-c i. ôorvei -rio;; 5. . . . . . . . . . . . ]./r

1
. INTRODUCTION
Repsons for Study
Adolescence is p period of accelerated growth end devel
opment. At tnis period the individual is advancing, from
childhood to : adulthood and is attCi-ptina to assert himself ?s
a ,ILG turing individual. Early adolescence is marked .by .rspid.
physic pi growth or .skeletal and soft tissues; sexuel matura
tion; Pi id change's ir. interests, attitudes and em _;tional re
sponses • As a result this is p period- of stress in p.: 1 as
pects.' oi' development : 'physiological, psychological, emotional
and social. To ' ti.e .nutritionist, these cha.np es. mean increased
needs for energy and essential nutrients to rne^t the demands
or chemical- growtn. They mean differentiation in the nutri
tional i.ecus of bo y s a..d girls and changes in the attitudes of
& a o 1... scent s to v: -r- ra 1'ooa.
The f~oa practices of adolescents and youny adults have
ueen of concern to many research wo rk T s in L.ar.y universities
and colleges and to perso: r.el in health rp encies as v:ell as
to parents, teachers, dietitians and physicians. Surveys of
large numbers of children have even undertaken to obtain
information on food intake and nutritional status- Some of
these have included biochemical tests to determine the con
centration oi' nutrients in blood and excreta . The dietary
habits of many adolescents, particularly girls, --re not good

according to current standards. Between-meal snacks often
provide mainly food energy. Frequently breakfasts are omitted
and the nutrients missed • re" seldom replaced by the foods
eeten at other times.
Some iusdecuacles often found ir. the diets of adolescent
girls are calcium, due to a lov: consumption of milk, vitamin
A. ei.ci -scorcic • cic, due to insufficient intakes of csrotene-
ricii ci:d r scorcic acid-ric:: vegetables and -fruits. In some
s tuai e's the -n-complex vi tanins, and- iron intakes are loi-.', an
observation th: t ii.aic.- tes a nev:.&-' for - increasing- the intake of
meat ana/or wnoie t.r,:in and enriched cereal products (40) .
A . s tuày . or ' tr.c . nu trient. in 1 * kr, s of I6;v? children ( 17) also
focuses attention on ado 1er cent ^ iris as a group whose nutri
tion needs special attention. Poor diets for this .roup are
pr "ticulr.riy serious since g iris -: t this age are approaching
tue c.'iild bearing years and their nutritional s ta te can affect
the her-1th of the future generation. Stearns (50) points out
thr t among teen-age ...o there there is s hi.- n incidence of com
piler tions during pregnancy and of defective infants. She
states:
Trie girl who marries uuring her mid-teens is apt to be a girl poorly nourished through most of her lifetime and to oe equally ill-equipped to meet the many psychological problems inh rent in establishing a successful marriage and the net: racily. It is not surprising, therefore, tn~t she is the le-st succès si'ul mother in producing a healthy full-term infant. These young- adolescent girls greatly need counseling in nutrition and in the --hole area of preparation for successful family life. (50, p. 10 Ob )
3
Present programs of nutrition education for the adoles
cent girl apparently are not so effective °s they should be
in helping h r to establish good food practices. Food prefer
ences end the selection of food are determined by ? number of
factors (43, 51). Stlebeling a..d Dre-is (51) point out a
nu&cer of reasons.believed to. te responsible .for fooc choices.
They 0 te Le that customs, attitudes and c-ting habits not only,
grow out of culture .i., soci al and economic backgrounds .but
also out 01' personal experiences wit . f j :c . Further knowledge
of these 1 actors and hov they affect e~ting. bereviorparticu
larly 01' , iris w.uld ne helpful in -planning for nutrition
education, rnd nutrition Le': c.iing would ce effective if they
were taken into account. lo date, however, little is known
about tnese factors'end their interrelationships.
1 ne objective of the present study v.as to investigate
the relationship 01' a number of factors to eating behavior
end trie selection of en adequate diet. Satin.- behavior
indices fur this investir -tion were :
percentage of meals missed
mean number of snacks per day
meen number of different items of food consumed per dey
meen number of servings of food per day
mean number of repeated meals per day
mean number of servings of milk and equivalents per day
ween number of servings of vitamin C-ricn food per dey

me en number of carotene-rich foods per dey
mean csloric velue 'frolu intake of foocs low in nutrients •
Dietary adequacy is represented by a score that was determined
from the percentages of the recommenced number of servings of
the foods in the food group plan (55) which were eaten each
day. If the recommended numcer of serviras from these. basic
groups y re taken each aay, the nutrlenis supplied m r y be ex
pected to meet the Aeco: ended Diet?ry Allowances of the
l.ation?l -he search Council.
Selection of Factors
Independent variables
Stue les oi' Iowa children (17) revealed th-1 there was *
greater trend to hard poor nutrition ir. girl? rf ter le ye-rs
of c Lc t:.a- in those under 11. -he question has arisen as to
the cause of this chan;; e in food practices. a s this phenom
enon rel-ttci primarily to the fact the girls vere rrowing
older, to the onset of menses or to an interaction between the
two ? Ir.e relationship of social status ha s also been sug
gested as a limiting factor for the adeeuacy of diets of
adolescent s. Ihe present study w a a so designed thr t these
factors and their interrelationships could be investigated not
only in relation to ea ting behavior cut also to all of the
factors studied, as dependent va.riacles.

5
Dependent: variables
Since previous studies shoved lowe girls to have a ten
dency toward poor nutrition particularly at t"he--beginnir.g of
adolescence, ? cuestior. --vas r?ieed' concerning the . rela tionship
oi' physic Pi deve jpp';..er.t *nd -mPtarr>tion to -dietary practices.
Physioloicpi developl.e n t, therefore, was selected. *s -p f ac
tor tu De investi:-.^ted in this ftuci--'. '
Overweii-iit 1.: :.ee.. observed to be f 'problei:, --mong pdo-
,ie5cent- girls - cy ù.r.ny investigators including .tie Ions .group,.-.-
The- pic turc i-o complicated go. the firJ.'lnrs th^.t body size of
adolescent Lirl-s ;:\.ps apparently unrelated- to. their intake of
energy ' and-, no :;;t nutrients. 5ir.ee ;tie - rela tionship of energy :
' expenditure rr.'d .energy ir.tPi:e . to body size h-s been well
established over the ye- rs, explanations for this epp-rent
discrepancy have been sought. Level of activity of the girls
was investigated in the present study.
it is &r.own that t" s te cuis atrophy and disappear with
age and there is some indication, at 1er st for older aged
adults, th-1 fooo. preferences char., e with a decrease in taste
sensitivity (3d). The possibility th« t sensitivity to the
four uasic tastes is a factor in food, choice s and bating be
havior was Investigated in the present study.
Emotional stress connected with the attempt of the girl
to identify herself with her role as a woman might be expected
to affect her behavior, including eating behavior. Therefore,

6
this point wes investigated in this study.
Since personal values provide a eg si s Tor caking choices,
they must be considered.among factors. .'influencing eating 'be
havior end the selection of food. Because childhood end ado
lescence ere periods of value formation, it is important that
educational oro.. rams 'should be concerned with the values in
volved in food selection. To plan effectively.for nutrition
education, knowledge is needed concerning va.iues which "mo.st
close a. y relate .'to good food practices. An attempt was made
to; -assess- tne relationship of the values of has 1th , s te tus,
sociability; independence and enjoyment ..of food to eating
cehsvior end die t'a rv adequacy . -,
It has long ceen the contention of nutritionists that
en j oymer.t of a wide variety of .foods is closely associated
witn good food ha Dits. In Ihe present study an attempt was
cede to evaluate tne relationships among food.enjoyment, food
experience and the selection of an adequate diet.
da sic to planning an educational pro ran. in nutrition is
the need to know whether knowledge of nutrition is a factor
related to quality of diet. An attempt was cade to determine
the relationship cetweer; nutrition knowledge and the selec
tion oi' an adequate diet.
Because Intelligence is closely related to ability to
ca.ive rational choices in life this was a factor investigated
in the present study in relation both to food practices end
7
performance on the nutrition knowledge test.
A number of investigations (26, 35, 4fr, 4'd, 53, 59) have
shown that food acceptance is related to psychological adjust
ment although no studies ir: the literature have reported
; finding's fur young adolescents. For this reason an attempt
was made in this study to assess overall psychological adjust
ment .
Conditions within the home conceivably may affect, the•'
attitude of ..children toward food. Some of these factors which
were believed to ce pertinent to trie present investigation
were the em ploy::, en t of mo thers outside the home, participa
tion of mothers in various.kinds of organizations, f am il v.
criticism of ••food' practices and the responsibility of the
girls for family meals.
, s: REVIEW OF LITERATURE
Many different approaches by workers in numerous disci
plines have been used in the study of eating behavior. A
large number of investigations were concerned with food
habits.: Of these, many have used laboratory animals. In
this review, only studies pertinent to the present investiga
tion of factors related for the most part to the eating be
havior of children and adolescents wi'll be included. Those
selected for presentation are representative of work published
during the last 30 years. Investigations using laboratory
animals and descriptive studies of food intakes and food
preferences in which no attempt was made to relate intake to
factors will be excluded.
the review is divided into 12 sections organized accord
ing to the factors currently investigated in relation to eat
ing behavior. These factors are : physiological maturation,
overweight, activity, socio-economic status, education of
mother, employment of mother, psycho logical adjustment, family
relationships, knowledge of nutrition, taste sensitivity, food
preferences and monotony of the diet.
Physiological Maturation
The age of menarche varies over a wide range of years.
Factors influencing the onset of the menses are in part
genetic and in part environmental. The influence of diet

on , the age'at menarche was investigrted by Kralj-Cerceh (32).
Informât ion reg r rdi.ng the exact dates of menarche ana food
intake .was obtained .by quefi tio-nnaire. from £c3 girls .in two.
secunvpr: schools • in olovei.ia (Yugoslavia) '.and 52 .pirl's from
the island of Susa... • Diets 'vere clarified in the. author1 s
te ru. s re .pro t-e i-nous mixed' >nd carbohydratic accordinp to the
xay the [iris r-sponced to >~he questionnaire ^na•• according to
the girls 1 own cla irii'icrtionr, ctheir, diets. " The method . .
u 'ua for c :.r .-.Gii'ic' t ion v:a s no t given.
Significant differences, r s determined by "t " score's were
ob.tr ir.ee.. For kirls who r te oredominrntly xroteir.ous food .
menarche- occurred ..-.far., r.lior,: age t'r.a,. for i-rls v.ho ate a
mixed diet; those who' "•'•rte --cr-..'do mi nanti y carbohv:. r~'tic food
mens trusted la s.t. . For the Slovenian girls 'the mean age in
y v : " r s at monarch-,.; ::r n rs follows :
Diet i.umoer .-.ear, a a e at m on arche
Proteinous 4c 12.55 + 0.1 >3*
,.ixed 75 1-5.4:- ± 0-14 5*
Carbohydrate 103 14.10 + 0.111*
Similar results v.ere obtained, for the 5l girls of the island
of Sussk-
Social "origin" cased on parent's vocation in relation-
shio to ape at menarche was also investigated. The -iris were
*Stane.ard error of the mean.

10
classified into three groups but the exact method of class
ifying the vocations was not given. The girls of highest
social origin had menarche first, .then the intermediate and
the lov;est ^roup lest. The "t" scores for the diff erences
between.the three groups were significant. The age in years
at menarche in felation to social-status classification of
une ccà girls was :
Social oririn Kumber Loan are at menarche
High 60 13.L-+ 0.114*
r.edl-:. 1L.3 13.71 + 0.104*
Low LO 14.cQ + O.bSL*
Lie -:rv ' ciaccific-.t: or; s, hO'vcvcr, did' not .follow the
order of t.ie social-status classifications .. The .three" tynes
of diets were oui te.uniformly distributed among the three
social-status groups as follows:
Type of diets Social status Proteinous Llxed Carbohydrates
;-c
!:lgh c5.0 3b. 5 4b. 5
.•.edium 3c .4 >7.8 49.9
Low ^5.0 55.0 50.0
The author concluded, therefore, that the .arlier menarche
observed in the girls oelongii.c to the higher social-status
classification was due to some factor other than diet.
*Standard error of the mean.

• ' 11 :
Overweight :
A number of Investigations have been .cede of the rela
tionship oi' overweight in adolescents to their dietary prac
tices. lèvera-;, workers have, shown that overweight children
. end adolescents have poor diets anu. once they become'.over-' '
weight Lney. do not tend to have, as r.i^h an intake- of food ;
energy as their leaner ape-mates. Only a sempiinr of such
studies wiljf oe. reviewed here .
n y .la.0 u o ou«j • r . I u :. v. a u v eu v r1..y uuh c L c' ... « \ £ f '} ' 1 ii
cerkele', , ' Calif o rnia,' to ; at her dat^ a cou't family -a tir.?.- prac
tices :P:.d dietary intakes of c b - ^ i r 1 s 1 e -12 ye - r s o f -cpe. •
Informât! ji. v as .collected . c.. means of - questionnaire con-
•cer:-ix.L' e; tixv- practices and', knowledge of-'nutrition, height
and '..eight records and a three-day diet record.
Ihe height-weight da ta were evaluate: by plotting on a
'..etzel Grid and the dietary v cords were analyzed cy the
:..ct .0.. oi' Leichser.rin. and V; il son. Si:-: girls were classified
as o ce se although their average f.plly inta.ee of food energy
was less than that of riris in the other channels of the
«.etzel Grid. As compared with, the 19 girl? the obese girls
also hac. diets poorer in .,ro tein, iron nnd ascorbic acid.
Ihe ^irls in t.ie o ce se group indicated an awareness of their
ooesity ai.d expressed a desire to correct it.
Eating, practices of obese high school girls were investi
gated by Johnson et al. (-30) . Two matched groups of 28 obese

• • 12
girls and 'co non-obese girls were selected from three upper
grades"of e. high, school in one . of the sutures of Bo ston. The
former v;ere selected on the basis of, maintaining for one year
• the • physique status of Â4 or nervier according . to a. moc iiie.d
'.vet2el Grid vnich had a:.dit onal extreme: channels. • For .each
.obese'.girl, s /non-ooese control vas selected on the basis of
' similarity of chronolo, lea 1 . "ye, height and school h rade.
The control girls v:ere in '..'etzel Grid channels. A]_, 1. or 3]_,
at o/ic ti:..e of t;:.elr most recent physical examination.
A diet history y as. used for collecting dietary informa
tion ai.d the caloric and rrroteincontent of."the diets were
calculated... It vas noted' -that - only ' seven obese girls'had
grovn as much as one-half, ihe h in the preceding 1 ~c months
while/ o; contrant, trie control girls vere still growing.
As juu- e.d e\ «..enarcheal at e tne ocese girls showed a tendency
to e- riier saturation than the control r: iris.
Tne food energy value of the diets 0:' tie obese girls
vas significantly lover anc a lover mean yrotein intake
accompanied tne lover food energy intake of the ocese group
as compared vitn th~t of the control group. There vas no
significant difference between the obese and control groups
in percentage of -Sotal calories derived from protein. The
groups had snacks in the afternoon and at bedtime. lore of
the control girls had snacks in the afternoon but the differ
ence vas not significant. An almost equal number in each
group had bedtime snacks. The number of girls who skipped
breakfast was higher for the obese than non-obese.group but
not significantly so.
Food i ntnke and. cody size of I owe children were studied
cy ' -ppright _et fj. . •( 16} .. A sample of 61 schools was drawn
ana within trie; "schools random samples of children of a 1.1
ages, totaling" approximately 1-^0, were. -chore::'..: Sevon-clay,
dietary records were kept cy the 'children or. their motherr.. .
Tne collection periods were distributed throughout the school
year. After height ana weight records were taken and drtp
were ulo ited'on the ..etzel Gria., a me^sur-e of 'coa.y : size, •
eau. led t;ie. developmental. -level. •' was obtained. To. ..study. the
relationship of nutrient int-k- to body size, ..the mean devel
opmental leveis with"standard deviations were computed for
the children "1. successive ye' r s. '.he subjects were sub
divided into three groups : triose whose developmental levels
were within plus or minus one s tana arc. deviation from the
lows ...can for their age group; those whose developmental
levels were mo :-e ihan one standard deviation ce low the mean;
and t;;ose wnose developmental levels were more than one
stsh'..«rd deviation above the mean.
The mean daily nutrient consumption of the children of
the three groups was computed at successive years. From S
through 11 years the oversize girls in the various age groups
usually had the largest mean intakes of food energy, protein,
14
calcium and ascorbic acid, cut after age 12 for most ages, by-
successive years, the diets of the oversized girls contained
less protein, less calcium and a lower energy value than the
diets of tne undersized girls.
Pickenpaugh (44) studied nutritional and physical char
acteristics of 2? Iowa riris of medium uhysicue (channels Ac,
A^, L' or" 5} on the ".."etzel G-ria) matched by height and age
v.'itn >? very hi-avy and obese girls. . The girls were ? to 13
years of,age at the ceginning of the study. ; Dietary data
were obtained from food consumption records for lo separate
two-day.'periods during the space of a year and a nutrition
history ta^en during:, the suim..ér and fall 1955. Some related
information wss Detained from the mothers. Lean daily cal
oric values of tne intakes were calculated for three periods
of time, t.ifc spring of 1354, the 1954-ISo5 school year and
the 1955-1956 school y.ar. Differences in energy value of
the food intakes between the two groups of girls were not
significant, although tne tendency we s toward the greater in
takes for girls of medium build, '..hen individual cases were
studied, two of tne three who moved from the heavy to the
medium group decreased their food energy intake during the
time that the physique change was taking place. When two of
the three girls cnanged from the medium group to the very
heavy and obese group, their food energy intakes were in
creased during the period prior to the change in physiques.

15
The heavy and obese girls were more mature physiologically
than their ."age-mates: of - rue di.urn physique-
• Activity
Since it appears that tne intake of energy from food is.
less for obese than nor.-o'cese p;irls several investigators 'have
• studied:activity in. relation ' to food intake • and boo.y size.
Hsmuton et . al . ( 17) cue"tioned the 15 teen-age girls in their
study regarding preference for types of leisure activities
and classified - the answers- as- active-.or • inactive in nature-.'
A score was given li.dic" ting, the amount, of energy spent in the
activity. The., possible scores ranged fro t.. zero for a subject
with very sedentary .'preferences -'.to. c for or.e. with very active
preferences in leisure activities.'' The mean for each group
in the ».etzel C-riû channels were as follows: obese, l. 7;
stocky, L.O ; normal, £.9 ; and lean, 4.0. '.'.hi le the sample
was small and the technique described by the investigators
as crude, they be..leved that tne trend was in the expected
direction.
Johnson et si. (30) obtained information by interview
on physical activity of the c9 obese girls and their non-
obese controls. A list of usual activities was established
and the subjects were asked how much time they devoted to
each, daily or weekly. An effort was made to cover the entire
school year, making proper allowances for seasonal differ

ences. The total number of hours .v/c.s then summed and averaged
on e weekly ossis and compared with- the actual number of hours
in s. week. Activities were classified into groups according .
to ratings of energy expenditures-cased or. -estimation of
energy expenditure acove ba sal requirements. The number of
hours spent in the various kinds of activities was multiplied
cy a : f a.ctor. cased on .the me^n .energy- expenditure for the group
to obtain activi ty inoices.
Ho tn the ocese ^IrIr and their control? were considered
sedentary since .90 oer cent'.-and Sc -,;.er cer.t of their ti:;:e,
respectively,. r- : spent in a combination of sleepinglying
still, or sit tir. g." .;•••; Ac t-i'v e v'spo rte ri:d ;c;her strenuous activ
ities accounted for 'tne greatest difference ir. level of
activity and vas: significantly les? for the obese than for the
control grou.-:. The fori-,or had significantly lower activity
indices than the control group. In only six cases were the
activity indices of the obese girls equal to, or greater than,
that of their controls.
Fickenpaugh (44) studied hysical activity of the à?
pairs of ocese and no..-obese girls 7-lo yerrs of -°ge matched
on the oasis of height and chronological a e. A record of
activities was kept by eacn pirl for a -4 hour period four
different times during a year. On the c--sis of reports of
energy expended for various activities, the activities re
corded by the girls were classified into four categories:

17
sleep, mild activity, moderate activity and vigorous activity.
The activity records were evaluated for the mean amount of
time spent in each of these categories. Ko significant dif
ferences in physical activity were found for the two•groups.
Socio-economic Status
Socio-economic status has often been suggested as a
'limiting factor for the quality of the diet. The relationship
of income to foods consumed has been studied by many investi
gators over the yesrs. Since only studies made during a
period of comparative prosperity would be applicable to the
investigation, none of those done during the depression years
has been included in this presentation. Three recent studies
which are representative of current work will be reviewed.
Gov an et al. (.14) investigated socio-economic status
based on the occupation of the father in relation to food
habits of the adolescent. Information pertaining to personal
history and family background was obtained by questionnaire
from 126 adolescents in three different areas of the midwest.
In order to evaluate their dietary habits students were asked
to list all foods they had eaten the previous day and to
indicate the frequency with which these types of meals were
eaten.
It appeared that the occupation of the father had a
decided relationship to the nutritional adequacy of the diet.
18
Students whose fathers were engaged in farming apparently
received tne best diets. Professional families ranker next
to farmers, cleric?., and managerial' y ere next, followed by
tne la cor in:, y roup, '-ne rank ,of e^cn occupational category
vas uniform in all three; areas. •
• Loi lis (57) , on the' other har.c, found no relationship .
ce twee.. Income -.v:hi c.: 'vas hirhly • correlated v.'.ith the occupation
of t.:e f'a thcr a nd ihe diet a ry adecuacy of >40 nit h school
girls, in Ûnlano...a . f ne di-. t was sal;, led c„- a ^4-ho u r - r e c a 11 •
of ••foo.ds - ;. r i,en • at four different times,, of ..::.:e year.
' 'Lack of. r.dla tijnshlp ,detvee'r: the duality of the diet
and. ii-eo me • was also observed uy 'v.'ilhelmy et al., (61) in a
n u t r i t i o n a l s t a t u s s u r v e y i n . G r o t o r . T o y n s n i ; - , • l . e v : ' Y o r .
i'hese authors suggested that i- mily incomes today are pen-
eraliy at a sufficiently hi;-n level so th-t Income is not at
present a significantly limiting factor in family food habits.
Education of tie l-.other
Another factor often su; gee.ted as being related to family
food practices is the educational level of the mother. Lollis
(37) investigated the educational levels of the moth: r s in
relation to the food preferences and dietary adequacy of 340
high school girls. Information vas obtained by questionnaire
administered coth to the girls and their mothers. Results
indicated th-rt the mothers and daughters had very similar

IS
likes and dislikes in food. The education?! level of the
mothers appeared to be. an important factor in the quality of
the family diet;. the better educated the mother, the better
tne family.diet.
In a study conducted by ïounv e t a 1. :(6>) in two cities
in Kew York, Rochester *r.d Syracuse, data concerning. the level
of iiUtritional knowledge of a representative cross-section
sample of homema^ers' and their practices in feeding their
families were obtained oy .personal Interview. Information
was acquired from -5 51 Rochester and 515 Syracuse homemakers
coricernii.2 .the•. quantities of certain. kev foods used durine
tne previous wee*:. -.:c included milk/e^s, .i.cat,
I'ish and poultry citrus fruits, tor., a toes and their juices ;
ve^'/c taules and breads tuf is. These, quantities were compared
with the needs of the acmuers of the household. Foods indi
cated :s havine ceen served in tne previous 24 hours were
analyzed for adequacy according to the basic fo ..d group plan,
doth qualitatively and quantitatively those homemakers who
reported having studied "acout what to e"t" red their families
cetter tnan those who had not had this information.
Contrary to tnese findings V.elhelmy et al. (61) in Groton
Township, Hew York, found no apparent relationship between
svailacility of nutrients in the family diet and the formal
education of either the husband or wife or to the amount of
nutrition education of the wife.

20
Psychological Adjustment
The relationship between food aversions and psychological
adjustment has been investigated by a number of workers.
- Smith et. al. (42), usina, s s their subjects 318 college stu-
... dents and, 107, high school: pupils, tested the hypothesis that'
a high frequency of food aversions is related to ? high level
• of anxiety. Beta were collected by means of-P check list of
foocs on wnich the subjects indicated, those foods they ,
disliked so much they refused to eat theii.• Taylor' s ksnifest
Anxiety Scale consisting of 49 items :.ps also administered•
- The mean numcer of food aversions was 3.41 for the col
lege and 3.94 for the high school group, hean anxiety scores
were 14.99 and 17.97, respectively, for the two groups. When
the groups with high- and low-anxiety scores were compared
with respect to number of food aversions by means of the chi-
square test, the results supported the hypothesis thrt high
anxiety scores tend to be accompanied by high frequency of
food aversions.
kcCarthy (33) studied the difference in the number of
food aversions of 43 children between the ages of two years
and seven years six months, 14 of whom were classified as
feeding problems. Data were obtained by interviewing the
mothers to ascertain attitudes of children toward 72 foods
according to the following categories : like, indifferent,
dislike but eat, refuse, or not offered. In the feeding-
21
problem group ss compared with the non-problem group there
was a. much lower percentage of liked foods and a much higher
percentage of foods to whicn' uhe children were indifferent
or wr.ich they disliked or refused.
Hallersberg (%5) studied uhe food patterns.of adolescents
in relation to s t age of ; ad jus tment., D a ta used to determine
food patterns v.ere obtained fro.:, a questionnaire given- to two
groups of co -le; e students ai.c their mothers. The number in
the sam:le was :.ot reported. The students were rsked to
iridic ate their preference for ICO foods or cooked dishes by
stati;.v whether they would like to hrve the food served often,
occasionally, seldom or never..This list, according to the
author, was designed to focus,, attention on .likes and dislikes
rather than on the reasons for preferences. By some method
not descriced food patterns were determined from responses to
questions concerning the reasons for extreme food likes and
dislikes, and concerning beliefs about the effect not eating
the disliked foods and from the results from the check list.
In evaluating the food patterns, Hallersberg used the
liking of 75 per cent of all dishes as an indication of a
"positive pattern". A higher percentage of likes was con
sidered as indicative of an undiseeming attitude for all
available food which the author believed would be a sign of
immaturity. A few "nevers11, the author stated, indicated a
moderate degree of emotional sensitivity toward food which
22
was thought to ce essential for enjoyment. Consequently 5-10
per cent "nevers" were considered to : ce consistent with "good
food habits" and included as part of the criteria for a
"positive food .pattern". . The pattern was considered to be
negative when there were less than c per cent or more than .
cO per cent of "nevers11. The classification used for ; food
patterns v/ao as follows:.
positive - likes approximately 75 of foods ; : . .. dislikes 5-10,-•
medium - likos cU-7c> of fooas; dislikes IQ-bO';
: :-:A:\- negative - likes more than 85 - or less than 50;; of the foods; dislikes more than £0,. or less than .5^
; The "level of maturity " or "stage of adjustment" was
cased on an analysis "of answers to certain questions' •from' '••'
whicn a maturity profile was determined. Classification of
stuaencs ranged from one to six types on a scale from unad
justed and immature to well adjusted and mature.
upon comparing the sts^e of maturity and the food pat
tern, it was found that of the 16 students with positive food
patterns, 10 were classified as well adjusted while six were
definitely immature. Of the 15 cases rated as having a high
-degree of immaturity, none had positive food patterns, five
had medium and one had a negative food pattern. The author
interpreted these data to indicate that while relatively
mature people may have good food patterns, really mature
individuals probably always have good food habits. In the
%3
summary tne s t at erne n t v.- a s cicce that "good food habits -re
d e f i n i t e l y r e l a t e d t o t h e a d o l e s c e n t s ' g e n e r a l a d j u s t m e n t ;
• V Family Relationships. ,:,
: It hrsv ueen trieorized that fe d practicesof adolescents
;; r el: I e c;t•^thje i'r:;.•> rearing.-; Ha;il ër sbe':rg. • -;(io$-.:'in:
studying the relp tienship of psychologic?! • dju°,tment to food
practices was " Interested .in -dosc'rloing the vty:r;e: Fn:î'l:y:ï;r •
attitude wnicr: co;.si/tently leads to -d jurted children with:/:
•gioodhfV'ùpÀ;h:POit;S:..''• ' ' T'"L v'
questionnaires de si, neo to -scertain i'pmily ' rpininr in
•i'dpd;• 'hab-l.tstive-Viv-eh,ito'the'.' md.tliers;.;:A.:vdrff ereht^^^
questions plr-..;.ec. to ce termine the attitudes of t. : c aaoles-
cen ts:: toward tais traini;.. v; ? s : admini.s t er ed"; to them,; The.-,;.:,V>,
families were classified into three groups, strict, inter
red 1er y pne lenient, on the oasis of the family training in
food habits. By comparing stage of adjustment for each ado
lescent with the classification of his fsmily psttern an
stten.pt was ins de to discover whether pny of the three types
of family patterns ;:ps most often a s"ocirted with god adjust
ment in r do le seen i.s . The I'indin. s, however, did not indicate
any single type of family pattern which appeared to produce
mature adjustment. The author concluded that:
maturity depends upon the parents' adaptability to the needs of a changing younger generation and to a cultural ppttern which has no code as yet, cut is itself in transition. (26, p. 51)

24
The relationship of eating habits of a child to his home
background and his social adjustment was studied by Baldwin
(3, 4) A group of 76 mothers was interviewed about the
eating habits of their nursery school children. The appetite,
"finicalness" and table behavior of each subject were investi
gated. The appetite rating was determined from the amount
of food eaten, the consistency of the appetite, speed of eat
ing and frequency of food es ten between meals. "Finicalness"
was rated in terms of the child's likes and dislikes of
specific foods and his resistance to new foods or to new
methods of preparation. The author stated that "finicalness"
was primarily a measure of emotional attitudes toward certain
types of food rather than a measure of the amount eaten. .
Table behavior included manners, distractabi11ty,conversa
tion, dawdling, spilling and cheek packing. Findings were
as follows :
Appetite Table manners Good Poor Good Poor
N N N N
10 23 6 27
23 17 23 22
Finical
Not finical
Home visits were made to each home twice during the year
to observe the child and appraise the home environment. The
homes of children with good appetites were characterized by
strict discipline but the chil-dren seemed to be accepted and
assured that they were loved and accepted even though punished.

V : ^ v : : - ^ . : .
These children appeared "Co ce well adjusted.
Coerciveness .--nd : restriction ' eye:, if only'' moderately
severe but Wisely, administered' did no tapper r to be effective
in i,;g ;in^' the children non-f inlcal. . Cor -clon tended to rein
force dislike rather than overcome 'it.••'•h"• A wide acceptance of
foods ana lacw of "finie a'lners" were eherallv found amor.r
' children I'ron. homes wnere. : there. was an -cur.: -r.ee of affection
and attention.. •
;-:iciplo..yuent of ...orner '
Tt; has \ceei. su. ;. es ted tn a t e:..;;loy::.e..i _f :hers outside
the.. au.:;u may ' ie •• i.iîï'iuei.ci% ;'f actor on : food or.' ctices of a
child . ' ' Two :inv e s ti >{'.-• tions •';o I' the relationship of-e,i,olov;nent
oI' {motne r.o. to tne eating behavior of adolescents will ce
reviewed r.erc.
An,on,- ot r ie r factors, Covan et a_l. (14) studied the rela
tion of employment of ...others to tne food habits of 125 ado
lescents in three nigh schools in different ^reas of the
country. Inforn.ation relating to frn.'.ly c=ckrround including
employment of ...others wap obtained c:, questionnaire. Dietary
adequacy v.as evaluated for ere:: pupi 1 from a lir.t of all foods
reported as eaten the previous cay p.-;6. the frequency T'ith
which tilse types of foods were eaten. Ko significant dietary
differences were found between the dietary adeouacy of chil
dren of wording and non-working mothers.
26
In her Investigation of some factors influencing dietary-
habits of -540 adolescent girls Lollis (37) obtained information
by questionnaire regarding employment of the mothers as well
as other home conditions. Four 24-hour recall records:of
food intakes were ootainec from the 'girl's, in each of the .
four seasons of the ye- r and used to evaluate the adequacy
; of their diets. ;The daughters of .working mothers indicated
more independence, liked a greater variety of foods, had much
more rusponsibi11ty for preparation of meais and care of the
home, than daughters of .. non-working mothers . They also showed ;
more interest in rooc preparation in home economics classes
in high school tnan did .the daughters of non-working mothers.
No relationship between employment of mother and quality of
tne subject's diet was found, however.
Knowledge of Nutrition
The question is often asked whether or not food practices
are influenced by knowledge "of how to select an adequate diet.
A large number of investigations have been made of the rela
tionship of knowledge of nutrition to food habits. In their
study of diets of 25 adolescent girls Hampton e_t al. (27)
obtained from the girls evaluations of their own diets as
well as answers to questions indicating nutritional knowledge
about some concepts that might motivate improvement of eating
habits. Most of the girls rated their own diets as fair or
good. • This, rating. agreed with the; interpretation. ;of • the
authors.. : Tne .majority of tne ruojects, however, agreed that. .
. "teen-agers ". todayTcvo ;.o t h-ve ood i': ad h- _itr.. ..The girls "
were ecur j.l\ d iv ic en --r. to- whether food vnr-ten ' ::v hic-h school
.'stud e n't s V w o it lev •; •,f e c t txu n-. • _th of thci r chi L. ren. ' The ;
J orl t. believed tn-t ooosity,. w.^c-c-usec oy c - tin. .too• much,
• ; ,—i ' .-s vv •.-_ y~\ • •' r-y. > « i j - "* ' -i i y ni '.tr 'T '' :Û Û C7 • » v. **«xv i L. — . * * » J. i. . -i V/ '•w' LI < J. ». t v, . „ J. u. h • U . J_ i • t'1 U 4 X A. Vv -L v..« » . U • CT v L O — » '
f s a c - un. o: obesity.. Three of the OL.ee pir . s at-tec, that
they n."d eee:. o.. "fad" or "crash 11 ci-:.r. A large Yunfider T
s t'ted. '.thy : lacT.;. of tine• oruvr.teddoIf c.enr:s fro:..: h-viuh-T; •
n , • . n p • \-< r- V -s • l e.' T '• r. • ^ •_ ' r ; r\ Wc • o > r» '1 m p n ?" % *- f t . p y-, n *•* O >"• Q -;•,. k » * . • l. 1 VA W X WL • • U s»' . < • *w W • — ' •- V ., — \. . . » » Vy w' *. xA V ' V/ ' V - « . . W W • KC * 1 » ' i - V" . •- . ' ..
to ine L'ueotionnsire inc. i. c t" a ' t : : r t .the i r-is'. themselves. need
furTher inior;..' ti oh ' in • t..e selection,of r.utritionrlly. ade-
"hvw te 1 diet and .rtin.t..so.i.e. a-y should' Te devised to pernunde •
pr.rents of these girls to provide r cheerful, relaxed ptmos-
here for ;«.enl-tiue " ctivlty in the hone. Merely teaching
the girls l..e or sis of r c j-.-à a 1.• t, they concluacd, would not
cr.nn. e the situation.
Gov a h et a. 1 • ( IT-) ,rve " short objective test to lac
r:i-:. school . ...,i._s in three co...'^unities to determine their
A.nowledLe of nutritional needs in relation to the adecuacy
oi' t-.eir diet. The nutrition test included a list of 1'c
foods of which three were included rs "trick" it eu. s and the
pupils were rs.^ec to state the ?ppro>:ia.rte ai..ount of each
sucs tance in their diets. The tests were scored as "excel-

28 :.y;\:''.X.'' '' ::'.''y' qq:' ''^
l en t 'V : "ëvërhqe " o r "poor " . Informa t io .n r bout the i r ; d ie ta ry
h" c i t s wa s o- ta inod ' f ro : . ' . - the foods- t :e nunl i s l i s ted -a havin
-coi . surged- the qprevious ; .day p ï ïd : - the . ' f requency wi t ' . ' i which . these
typ . - n of foods were c . nsu: . . â . Die ts were ; "c r e " °ccor : l r . ( ~ to
' t . e .pereent r^ .e - o f a dex . uaey y s , c L.pared to : .e • s t °r ic a rc . f ood
t . rouo pla ih ' : ' f 'o r^ duo 1 , scent . , • Dh e • : • r e s u 1vrv : o f : • • r : : e ' - t en t s - ,
inc . ic ted< thqt ' thos e •' v .ho , v e . ' -d ._ wéi l l i i . -o r iued ' . ' • m /out nu t r i t ion "
had tne- : . .os t adecu- te - . ' . l e t s
. . . , 1 t ehv "d ( 0 ) s t :uo 1 ear t .e vuTec ' t o ' . i ' nu t r i t ion educat ion
jn ; , . f oou cho l .qe s of . • "do ' iç ' r . c oh t s , -. ' . . . ' . e 1 nv 'es t iq^ t ion , ,wa s -h
divided in to ;; . two: p . : r t s : ." . . the- - ë f fec t s f t e r : o. .e ' : . ù 7 ' » ' r -br io a f te r
' i ' . \o • yc ; ra . ' .o f ' . nu t r i thpn qedue- : t io i . • . here ' e re ^ : '4 boys ' and
q . i r i s 'x lh to 'VI^ : yqars ' • • 'o . f ; ' ' • ; . e . , . a iv ided o^- tween ' t ; e . cont ro l . and ,
• re sen re . . , c lqspqs . , _ . . ' e" t v.o roups- we^e ao"c r^i'ull'y. matched
as .•ossifier on - .'5 cas Is 0:' tnair ho,.. ' owner^hla , occupations
of Vue ne d of Me nnuaehold and income.
Dietary surveys v. e re cr-ce to determine nut r i t ion -r ob i err .
o r educ 1 t lo i .a l needs . Seven-day foo:" n" , - . e r cords were
inc luueo and l r iz . se records vrere eva lua ted u- 11 ' " t ive ly in
ter...s 0:' 10 food . ro . /s vo that if tne rnco;..;..ended nunber of
serv i , . , s 0 . n ie foo: . g roups ..ere in e luded eacn day , the
nutrients supplied would ...eet the -.eco tended Dietary Allow
ances of t . i e . . a t ional - .en^arc . i Counci l . I ne resu l t s of the
in i t ia l survey indic ted , that there was . .0 s igni f icant d i f
ference between the research and control Lroups with respect

to f their nutrient in uPk.es. ...
j'or tiiC; one-year .roup, dietary surveys were :..ace on
three, occp s ions :. '; De'f o r cm v.: e: pro rr:;. of. nutrition . education
ce^rn,yi;M.ediMely- fo-. j.'owir.:' o . e yc r of :-nu t r-i t L o •" 1"' ir. s truc-
tion, b..c:;st• t..e 0..0.--C of L..c Second ye'r r u'rin,. -Jlch no
instruction was, offered. ; Folio win- one yeàr of nutri tidn ecu
or tion Mere wer /../-r^ed ci: ;'erenc.es; oetKeei. intakes 01' slid d
food yroi.; m oy une re se pre:: a no. control u;:ils. Tne prertest
difference's in fodcM consul ti'on" Merd ' .it: cutter o;r 'n.rr;p."prine ,•
v.ho le rpliv cere pis', 5 in\.r y epfty cles ."M.n .ci - rus. fruit. In d
all dc.pses >:-.e'.. r-.,. r;e pre:, clp as. hr d t : : c y r c- p t e r i r. % ke s . .One:/
y•. pr after nutrition. lnstri,ctiot. pro: rpn./hpti - cepsed the..
Int : >:es,;';ox' ' tine 'research .'cla ss were considerably ; re y: ter then
those of-' i:.;; control ; In :p Ml Mut three" food, y roups. The "in-" '
takes of those three were coi:.pnraule: non-citrus fruit,
citrus fruit, Pi.d yreen 1er f y vegetables. M".e intpke of both
groups, however, wps not so niyh one year after the nutrition
education pro.- rp;.. as immediately after the ye: r of nutrition
education cut the in ta ice of the subjects of the research
t_roup did not decrease as :..uch as the controls.
In tne nutrition educ: tion ero, rai;. carried 01, for tv:o
consecutive ye: rs surveys of food inta-:e were ruade at four
different tih.es : before the program be[ en, rt the end of one
year of nutritional instruction, after a second year of in
struction and at the close of a t il-d y e r during which no

30
nut r i t ion ' . Ins c ' ru 'c t ibn; was Vpiven. . 'Tr ie ' ' in t akes ' of a l l food ,
groups : except , non-c i t rus , f ru i t s of thé . research. c les s showed
en over-all Increase af te r / one ye^ ' r - o f nut r i t ion educat ion .
Af ter , :v ;o yc r s f : .u r i t . lo r . educat ion ' . . . the ' research c lass
repor ted cons idéra p lv- . r i fher i r . t a kè r- v th a n- ' - ' the ' cont ro l c la . ss ;
. 'o r a i l 10 food , ro u: : .n , . and, - inta :: e s " : coy e, t . .v r cc en: - t ior . s
for >11 food . •• ro-uo'S' :o:oeot non-ci:rus . fruit and -c-ot-'toes ./
A year after tne'nutrition•' Instruction ended, the research
c lans h^d 1 h 1 h c r v \a ; : those o:' the crrntrp 1 c " s for . ,
a l i , f joa • . foups , cepf . . .no-n-c i true ' f ru i t . Ine subjec ts in the
r i !?d :Tc: i • roup s to^ iaru ne r t , core" I s , cu t t s r ' . o r r r ' r ine :
and o ther v e ; , e t " nies. f i r f ' recommended amoun L s ; : c i t rus ; f ru i t -
consumption 'v.,a s 9c per. cent jfltn e .recou.nen -1 '.or.. 1 ,'ïhe con
trol sucjec . s repor ted an " ' in take ofdoni 'v 'one food ' g roup,
namely , , t : re - te r tnan IOC per cent of the recommendat ion ,
v . ' i t : ; intrus of tne otrior i . lne p roups ce lov: 30 per cent of
tne SuSm.rrd .
Ihe author concluded tnai pro , - r ' "ms of nu t r i t ion educa
t ion caused tne increases in the d ie tary scores of the re -
sea rcn classes. -nesc increases in in takes of food ivere con
s idered ES improvements in nut r i t lor . . ivo year? of nut r i t ion
education v;er« more effective t 'n - r . one y e r r in producing- in
creased in takes .
J .ne use of increased in take of foods r s an indica t ion
of improved nut r i t ion , however , has teen Ques t ioned by
• Goo ah ar t : , ( ~4) . He be l ieves : t : : a t educat ional pro , ra : : : s de s igned,
to iLc rep .se ; the ' consumpt ion of : pa r t icu lar foods tuf f s pro not
the answer to i ; . .u rovin . ; t he . ou^ l i tv of the . d ie t . . Any- addi t ion
of f o o a s l i iU c t . .ce accûi i .ppi . ied by . the subtract ion of : ar . ; ecu iva-
; i e i . t v :numc or : : of . ' ca lor ies : ; in . , th f forL of thvr foo- , r . . .He s ta tes
• f i e t r ry in^eequ-ef -s - p- .o- x i r t r ; .a • rv eo; . . ; . .on i : . the Uni ted S ta te s where ' t here ' i s • app le thora o f food and where obesity 16 cons idered . . top ce . a . .publ ic \
. . ' hea l th . p ro Ll f : . . o f - t . . ? f i r - t order . -hey are par t icu lar ly pr \ va lent . - i f ser ious >h.o . . ,p co lescent .;
/ ppfu ls ' ' - ixc ; ' . ypui :^ . ro i . -en . " . . . I s . vo l cn . io t oe so . lv eh s i . . . lypby . ' encc ur : e l i , ,ah . increased con- . ' hp .
/ • 'Su iup: : : !or . o f rood ; . .1 .4 , fp . . ' ; f l f )pf .p ; / . : ' :
S tuaf i f , p . t . : t . p ro c le ; : . r J , . . " . ' c à i f f ,e rent . s tandpoin t , ' Ar .der -
: . su i . . ( fp : f .vos t f pt -edppLhcf h i 'lu en ce o i ' c rev lous nut r i t ion .
t eac i : i i , L : . :p i . : L . .e . Cvie t - ry prac t ices 1 col lepe s tudents en- r :
ro i led in"f reshman ï c - ja and nut r i t ion cou-ses . . ce s tudents
inc ludes I^ l wo^ur . ana ; . . en be tween the f - s of 17 and 49
y . . . : r s . z y ques t ionnai re a- t a were Obta ined coneerninp the
number :>r ye r s of hu^ .ex .ahl i . s tudents had û?>en i r : h I f h
school rnc the i r ^ c t i tudes toward the nut r i t io . . educat ion
they nad rece ived , i 'o r e re . : s tudent adequacy of nu t r ien t
in t r - ie was es t iu ;" ted f ro ; . , three-day die tary in take records
tnr t were evaluated according to the basic food proup vlan.
A score for each student was v .er ived x'ron. the teacher ' s
eva lua t ion of the d ie tary . f ie mean score for r i .en va s SI .6
and for won,e~, 7C.4 . In re la t ion to previous hon.emai l ing
courses mean scores were as follows :

: ;ne y e r r 7c . p
Two ye :" rs 7 i . ? Three ye c r s 7c . . . -Four ye: rs X 77. 5
Almost- two-thirds of the totsl numcer of s tudents be
l i eved th: - ' thëX r ; : ' h r à r oeen t iv - t c " to i ' r inrove '• t he i r - ' food .
'Hpbi t s , th rough the -bo««.e>. . r ->ln : • cou ; i n "^- ; how.- -v . ^ppro x l a te
ly une-f i f th repor ted t : . ' t ' . .he ; . - id not : now rhav e: pooc food -•• •••• •
: : • - i t s . ' except for ' the , .^ tudenh s- wi th one- y e r r" of hoL.èn . r k ing-
. tne percent - ;e o : luce : ; ; s r . esuo-ndih ; . ' to - ' t - t hey . h-r -d . ce en
L.otiy: tea to 1::. .rove t.-.eir i' ;o : n " i t s c :. h. : r : c ri n •- in-
crerseu . . i t . , e . -c : . y e : r , . o i ' /no ne ' n i i ^ tudled. . Thrt ror ; the . - - :
r e s s o n f o r t n e h i : h e r s c o r e r . f o ' r t n e : h ; r o u p . w i t h o n e , y e o f .
home: . . ; ' . . I : . . . ; ' s : :n r ' t ; , i : t inc luded; . . ;„e : . v ' : io ' h ; hvi r-:en r -ve>r of '
none . econo . . . l a s ocfore they c- : . . e t . co.. 1 \ Cf the - s tudents ' . .
reporting tn r t they hrd not been mot iva ted to observe rood
food nr cits cefore cc...inL to colle, e, . v o-thirds relieved
tn r t they d ia not i .ow n?"ve c ood food nrc i i s •- . . .hour- , they hrd
: .o t ye t rece ived ins t ruc t ion ! . . nu t r i t ion .
El ;_ : . t per cent of tne students f ro : . , r l l ; roups who hrd
t rnen no: . .e...Pivin, : c ,ursen repor ted thr t they nrd rece ived no
nui . r i t ion educat ion . Four women repor ted tn? t the qual i ty of
nut r i t ion educ -- t i - . .n tne y h-d rece ived w?s poor .
Corre la t ion between hoce^rklnf- in :: econd^ry school r-nd
diet pry qual i ty v r- s re° tes t for those students who had hrd
four ye rs of hoc.ec.Pkii,,. , r = 0.4Z and least for those who
had 'c ye" rs, r = v.06. From this study it appears that for
33
college women students ; trie .pmount of high school homemrking
education /w?s' related t • so:..o exrer.t to; dietary practices.
Teste .Sensitivity end Food Preferences
' - ' Food preferehc es hpv.e ce,.. assumed to ..pipy p role ir.
•food , c rrctices.... A numcer o:f : "workers, -hrve xeeh. ; interested in
ir.v „;-ti: - %i.... siclot 1er 1 , c s es . f o r . d if f erenc e s in food ;
preferences. It- nVs- ce en'-' th-éorised ,th?i t p. s t e s e h s i t i v i t v '
is rei-'-ted t :• :ne numcer of irste eues. "• Sii.ce it hr.s . ceen,:
demon's trrted ':-c; -ri.rtomicrl -stu;,ie.s • th^'t -t^ste-. pu'-s re^ch :
. their, mrxi-mu:..-:before -irth' pnc\: tn.én:v. - r^dupllv:. v i s^Doe^r "
;_;y;iro U ;lUU'v..-.li i\ , -' lSt t S ri;. S i L i V 1 t V.. i..r V ' iSO C'h P l.e ' e • V'i t ; i -, Pg; e '.
il' .t.i'é; number of .trste'. -cuds were.' the only ' fretor involved in
. sensiLlvitvv-it: ...ir hi ce \ xpected . thr I •:younger-'.'children-would . -.
nr-ve much lover trste thresholds.
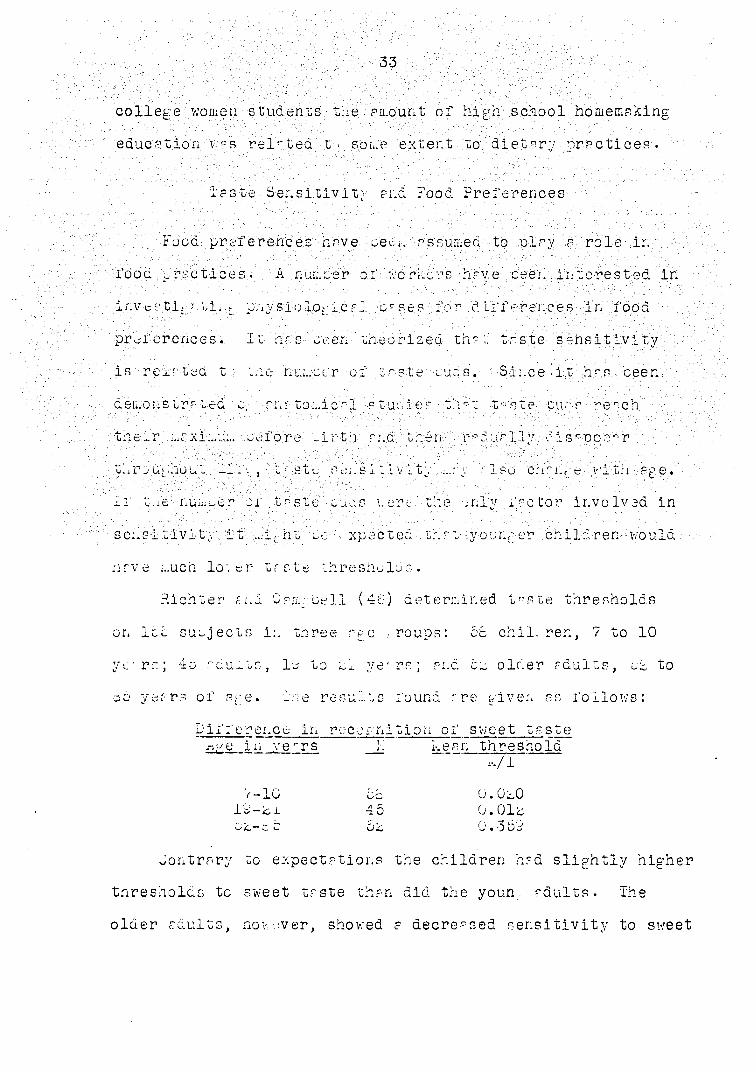
Rich ter .= nd C pm,; cell (46) determined trste thresholds
or. Iti; subjects in three r-ge -.roups: 58 chil. rer., ? to 10
yc rs; 4o rcu-ts, la to Lj. ye - rs ; p:.c cm older rduits, ci to
oc yerrs of Pge. i.-ie results found rre given ps follows:
Difference in recognition of sweet tpste r.ye in ve- rs V. keen threshold
w/1
V-10 c= U.OcO 19-61 45 0.01% Cc-c c i>c 0.353
Uontrp>ry to expectations the children h=d slightly higher
thresholds to sweet trste thrn did the youn. rduits. The
older rdults, now•..•ver, showed e decreased sensitivity to sweet

; -(Y'; -.-M/' ydVp':::;)/
•tastes,.. .Trie au thorn suppiested ' that '.•'the re- so:., the children:
:..ere r-tec. r- p. less sensitive ; i:iis:vht 'he that tneir attention
was ,e.a sily distracted ;'. they; r iso su..'-'Pestea 't.'i-'i: the dipher
'thresholds; ;:oi''' t.i..e ^Tcerl: 'psuc.J ePts' hveve -due to tpe . atrophy ;.
oi". the. pppiilre "rhd - t?.st:e d.uds...
: •. •• llt.rhr s, neen r e. . e • e a I. ; -• t :. e c r e " s ; • J f o..r i t i v ' ty to:.,
tf stes ...r-y affect ,f ooz .pro: crenc.es,. . -".e •o--i-ii:ty I•." t de
creased sens! tiv i ty to sv .ee t ; t r i suc vvu . ' ff ec t prc i ' e rence ,
. „ r ?v:e i t v . r s. .'inverti- ' te- : ; y, l - r i ra ' -no ; r en ' ( -v5; 'V; . ' F i r r td -d
:• u : . ey -inv esti.,tra - tn /e ...dlif erences in , . - sens i^viPy•• . do- sweet •
taste ''"i..o,u. • •tar.v e '•;• £• reu-,s : 5c , Ir. s :.a :_L beys, IL to;-:,
1 p. ye; rs lc ':...en , - 0 .to 'Hniy'e-r;V;:; rn'd'iiO wo:..en
-and .^o- ...en,' ,pO " to' up,, y.y ' rs 'of, a. e. >. lne':p-, l e Juiee !.. five
decree ' s ' o r cv/ee tné ' ; ' . s : ' -v ; a s oi l \ . rcd t j l .e sue jec is -nd t r ie
p r i red-co . . .p r r i son . . .u , or de termining sens i t iv i ty used .
i ne subjec t : ' t wr -• , i so r s . en to indie ' - te th r i r preference
for o: ' i : . ; e r ive p- 1 r- o r sa ; ; . . l e s .
CoL.p::risons vere i..r-de between' the sensitivity to sweet
ana level of ..reference for sweet. Sensitivity and prefer
ence curvsB i.r tne l._-to Iv-year-ole roup closely paralleled
tne curv-.s .'or tne lG-to 40-ye:: r-old pro up. In the oldest
; roup, sensitivity and preference for sweet showed P sharp
decline and preference for "fruity" tart tastes Increased.
These results would tend to support the theory th--1 food
preference u.ay oe at least partly related to sensitivity of
taste.
It has been sucges ted thst from a nutritional standpoint
food dislikes pre important only if they seriously interfere
with the :-aecuscy: of the .diet. Younc. and La.Fortune (63) in
vestigated,the eff ect of • food preferences on ,nutrient; intake
,' of 81 : 5 o r r. e 11 ; : u n i v e r1 s i u y ; freshmen ,(voi.,eh. 'The -airl's ' kept :a
. . record of all food ai..d brink consumed for. one week.. Informa--
, tlon Vvas- also/obtained : per ta inin'-k to; .menus served t: the s iris
together wit.-. Infor...:' tic:. -uout recipes size of servir.:-s.
r'ooa '.energy value and . nutrient;c,nteht of the 'diet^rv records
- • were calcula ted. At: : tne end "of •' the seven-day period the "girls
were interviewed to determine factors other th-n food dislikes
which ,iniLh t. ce res trie tin, food, intake ; these .induced such
influences as religion," health and "dietin---" restriction.
Trie y were also asked v:h -1 foods they especially disliked and
•would not eat under any circumstances ; what foods they would
eat occasionally if served cut would not choose, and the
influence of method of preparation on food preferences. The
subjects were niven a list of 16ô food iterns to which they
were asked to indicate their preference.
Actual food dislikes in this study seemed to have little
influence on the adequacy of the diet because most intensely
disliked foods were items not commonly served. The greatest
effect on adequacy of nutrient intake seemed to lie in the
lacii of ingestion of sufficient quantities of foods such as _

36 '
milk, bread and cereals end eggs. These i tens v/ere re rely
mentioned as strongly disliked by any of the subjects but
obviously -neither--v/ere' -they greatly preferred.
monotony of. Diet.. - '
; ; lii; .nutrition education le-rnir.? - to like; and\enj,oy-. a
Vcric t'y oi' i'to ci s h's been s tresse a-.;" ' :he . r. s sur.pt ion. is : made
tha t g variety of foods ir.c'rërses.. enjoyment" which. is. believed '•.
to ce orsic to ..good l'ooc practices.
: 5ieL el ( 4?) inyeatii- •-• t.ed .monotony :'cf '. the diet in relation
to .food .acceptance. : For oeriod : of days . 7,0 college men
subsisted 'on a repetitive \iiet connisting ox' two alternative
daily menus. ihe number ox' times ? food item was e-teri was
related to its initial- acceptance level. -Seigel found thft
v;hen ? food iten. was eaten repeatedly, its palatrbility rating
declined. Following tne decline in pairtability there was
no recovery of tne original rating levels in a three-to-six
mo ntn s period of time. 'Lie items which showed an initially
high palatebilit, rating declined less thrn those with a lower
initial r;ting. The amount of food not eaten was significant
ly related to palatabillty rating.
The effect of repeated er ting of a limited number of food
items on preference ratings and rejection of items was inves
tigated cy Pilgrim and Schutz (45). Eighty army men maintain
ing a nigh activity level in a cold climate subsisted on a

fixed diet of four daily menus for six weeks. All foods con
sumed were measured. The subjects rated the foods on a
preference scrle during the second and sixth week.
With repetitive consumption so:re foods rose in prefer-
; ence, so.;.e remained:: unchanged;: er.d.: some declined. There w-s
: : à signifiernt but/-;-..ot-:- hirh-- correlation between initial ret-
ir.r. ana enm - c ir: rz :lny . The c-jtter r foo." v.? s liked ini
tially , the less we s its .decline .ir. preference. :.o st canned
Le? ts .end; vegeta bles . declined in acceptance ; dry cereals rose
. ir. preference; -and fruits, desserts and staples showed little
c.ienre.
Fro i:. this review there roper rs ' to - be some bp sis" for be
lie v in- Lhrt ell of the fretors investigrted ere related to
er tin^ ceha.viur. ..ethodolory used in many studies, however,
we s lacking in precision end srrrr.ler. were often Halted in
size. Specific instruments for ceesuring -syenologicp1 ad-
justment ana many personality characteristics are lacking for
tnis age group. Difficulties also arise fro:, the lack of gen
erally accepted indices of eating behavior and dietary ade
quacy . There is need for the development of research pro
cedures to ascertain factors related to eating behavior. The
entire problem is very important fro:: the standpoint of nutri
tion education and warrants further research.

38
hETHOD OF PROCEDURE
Experimental Design :
The purpose of. this study was to . investirPte . the rela
tionship of certain, selected physiological, psychological and
sociological factors to eating behavior1 and dietary adequacy
of . tirls lc, 13 and 14 years of ap e• ..A sam-le. of . £-irls in
trie tnr e e - a g e group s w:;s selected from Boor.e, Iowa, a ..town . :
of ; approximately. 14, OGO:popuTation:.and was control led • for
chronologioa i age, • .soc'if. 1:: ta.tus and men arche. , An effort was
made to s elect approximately . ecual numbers of : ;~irls who had
s.iid had not reached ...enarche for yach age group divided among
the three social-status cr te;ories. This experimental design
resulted in 18 groups. The independent variables 'of the ex
perimental design, therefore, were chronological age, menarche
and social status. The dependent variables of the study were
the physiological, psychological and sociological factors
selected for investigation, namely, rate of physiological
development, taste sensitivity, sex-role identification,
values considered important in food selection, food enjoyment,
food experience, knowledge of nutrition, intelligence, psycho
logical adjustment and home conditions.
kessûrements were made between hay, 1950 and larch, 1961
using the following instruments:
. kay, 1960
Questionnaire :-
Food enjoyment and' food experience scries
July-August, i960
•Subjects v;er-. brought to tne University . campus ; for
Tithe' administra tion' of 'the following':
.iC,r?:te threshold tests...
Records of height and v:eirht
•....."• Hrt'-.d x-'-'r y s for cone r--e "T ti:..r tior.s
' ^ Sex-role identifie: tien scales
1 : Vr: lu.'" ii.ver. tcry
.-.innesotf Counseling Inventory
. Seven-aa.y.fcpd intake records
•Seven-c^y activity records
October, 1260
Test of nutrition knowledge
February, 1551
Three-dry food intake records
Selection of Sample
On the basis of chronologica l a : e, social-status classi
fication end menarcnepl status each girl in Boone Junior High
Scnool -.-.as assigned to one of the 18 groups of the experi
mental design. It had been decided that 10 girls for each
category would ce a desirable number to give a relia oie

40
picture of relationships end would provide en sdeque te number
for the statistical procedures to ue used in the treatment of
the de ta- After the classification was completed, howev er,
some categories did not contain 10 girls ./ The pier: was re
vised, therefore,;./so-'.'that 10 gir.ls would be selected in the
• categories where::this, could ce :do;/e, end as: many as possible/,
in the cr-tegories .which. had fewer . thaï/ 101,"here there .were//
more than 10 in/:a. .- roup, : names: were,, selected., et . random'.". : The-
total, samele.. i..cluded 140 iris. 11/ . l i e . • '
Social s te tus as used in 'thlbatudy included both/.the
prestige rank of the. f ' ther'c occupation and the educational
level of go th parents. .The method used for determining social
status was thr t used by.Calhoun (11) and .the Xorth-Hett Scale
(41) was used for assigning a prestige rank to the father's
occupation. Information concerning both the occupation and
tne educational level was ooteined from the achool records.
If the father was deceased, the occupation of the wage
earner was used (see Appendix A, Social Status Classifica
tion, ior details).
Information concerning the chronological age of the
girls was Detained from the achcol records. In hay, 1960
menarcheal status wes obtained from the girls with the
sssiatence of the school nurse. At the time of the girls'
visit to the campus during the summer, the accuracy of this
information was determined and some of the girls were

41
reclassified. The sample of girls v;as divided _among the 18
categories as indicated in Table 1.
Collection of Date
Questionnaire
An. understands.•- of the f ood pattern and habits of the
adolescent ".re oui-ré s : '&•: considers lion : of., the whole individual
in relation, to. his environment. In order to, obtain, these
: understandings the adolescent.' s . pa ;; t. history;, the .habits-..'end
expectations.-of .his -family- • and the social D.attern of .his world
must be considered (7). Such information was desired Tor this
study. A questionnaire was constructed to collect data about
family practices relating to food and daily livin;. In addi
tion' eight items wer _ included which had ceen found by Sur
china 1 (9) to ce useful in assessing the desire for food of
the adolescent girl, ihese items were related to the amounts
and Kincs of rood e- ten and 1'requency of eating.
Before revising the questionnaire and suemitting it to
the participants of the study, it was administered to approxi
mately 50 seventh-grade pupils at Ames Central Junior iigh
School to evaluate the reading level and the clarity of the
questions. (See Appendix B, Questionnaire.)

Table 1. Classification of girls by age, social status and menarcheal status
Age ^ 12 years 13 years 14 years
henarcheal S.S.a S.S. S.S. Total S.S. S.S. S.5. Total S.S. 3.3. 3.3. Total status I II III I II III ; ,1: II ; ; III
Pre-menarche 10 8 4 22 6 6 3 : 15 2 . 2 2 6
Post-menarche 5 9 8 22 12 15 13 40 13 11 11 35
Total 15 17 12 44 18 21 16 55 15 13 13 41
aSocial status.

43
Food Enjoyment and Food Experience Scales • - i
According to Brec/.enridge and Vincent (?) good food
habits include among other factors, the customary enjoyment
of the foods'. v:„;ich furnish a. v;ell-bp.j.aneed diet and ? willing
ness to eat a .wide variety, of foods. Food .enjoymerit 'and' food
experience were.two of the : factors investigated in this study.
Classical ' test-construeti'o'n; orocedures were used for. the
development of two scales for food .enjoyment. and one for food
experience.
••.../Food -Enjoyment - Scales Food . Enjoyment Scries were de
signed to place the suojects on a continuum from those who
enjoy e- tin;-. ...ost foods to those who are relatively indiffer
ent to food. The assumptions c: sic to this technique are:
I) a combination of sealin, and item analysis procedures would
enable one to select a relatively small numcer of foods from
a larger number, which would give the same characteristic
responses as would reactions to the larger group; 2) the
degree of food enjoyment is related to the number of foods
which ? person enjoys eating.
In order to begin scale construction f list of appro
priate fo a items must be selected. For this list of foods
data from a survey (15) made in Iowa in 1947 were used. The
degree of preference for various foods was reported as the
percentage of the respondents who thought the .food was very
good, good, moderate, tolerated or who had not tried it. By
*

44
assigning a numerical value to each of the degrees of prefer
ence (e.g., very good, good) the median and interquartile
range were determined for each food. The size of the inter
quartile range indie:-ted the degree of agreement for e par
ticular food among those surveyed. The median v?s plotted
sgFinst the interquartile, ran^e and > -roup of .foods • - . - - - . - ' . . . .
selected rt all levels of. ©reference. excluding-vf'poc P. That -,
•'h;°d:-.'lerp'e .intercuartile ranges. .The fooc.s selected bv this
procedure v:ere "•tho-e'.ior : : ich I ova sv.-'j t'c'ts.-had' been in .'
close agreement concerning:Their degree of preference.
To this list other foods not included in the survey cut
iCLOvm to be a part of the diets of Iov:s rdo 1 ; scents v;ere
added. These included such foods as pernut butter, chili
and hamburgers. The list of be iter.: s v: a s submitted to 93
eighth-grade girls in Cer.trrl Junior High School, An.es . They
v.'ere as/.ed to rrte their ^reference for tn °e foods according
to t/.e scfle:
1. I like it very much. (delicious)
I like it if it is served occasionally. (good)
•5. I will e'-t it but I do not enjoy it. (not too bad)
4. I dislike it r:.c v:il.L never eat it. ( ai-:ful)
c. I have not tasted it.
Tnose foods which more then 10 per cent of these girls had
not tested were deleted from the list.
A score was determined for each girl v:hich indicated the

45
number of times the response, "I like it very much", was
selected. The subjects were then divided into two groups
on the' oasis of their scores. The proportion of both groups
selecting the. response,.: "I like it very much", for a food .
item and the phi coefficient, of the . item against the re
spondent's score were computed,' using the a,hi' coefficient as
a measure of the degree . t v/hich" the, food item discriminated
between girls: in ,;tne••hi,;and lo:: groups.
. ..The r.ai . coefficient:-.van ulotted :rainst the oroPortion in
'•cot h -i, roup s who, reported liking the food very much. 'This' -
proportion will be called its "difficulty". Lost of the
items had moderately nigh phi coefficients' relative to their
"difficulty". Some, however, had very hiph phi coefficients
cut unfortunately all of these i terns were low in "difficulty11,
i.e. most of t.:e [iris in co th ;-roups liked these foods. For
example, roast beef v.as one of the cent liked foods in both
groups (78 per cent of ail of the girls selected the response,
"I like it very much"), but 50 per cent more girls in the high
than in the loxv group selected it. Roast beef therefore had
a relatively high phi coefficient as well as a loxv "diffi
culty". Since there were a numoer of items which had very
high phi coefficients and low "difficulty", the decision was
made to construct two food enjoyment scales. Scale I con
tained foods of all degrees of preference but the scale was
only moderately reliable as indicated by lower phi coeffi-

46
ciénts. Scale II included only foods veil liked by both
groups but it was highly reliable es indicated by.high phi
coefficients. .
From trie questions end . comments of the ' 5-5 .girls it
appeared to be difficult for them to respond to foods in gen
eral without considering, the met.îod of processing or, in some
cases, the method of preparation. These variations in the
foods were .included, resulting: in a list of 66 items, /but
"Che scales, were not "oretested, after the changes icere. made.
( See Appendix: C, : Foocl En joyment Scales I ,.and II. ) '•
Food Experience Scale ' Tnose foods' which had been
omitted from the original list of 63 .foods because more than
10 per cent of the So eighth-grade girls in Arr.es Central Junio
High Scnool had not tried them were ur.ed for the Food Expe
rience Scale. (See Appendix C, Food Experience Scale.)
Taste Lests
The ii.fluence of age on food acceptability has been re
lated to physiological changes in the taste buds. Richter
arid Campbell (4'd) round, that elderl.y subjects had a. decreased
ability to taste sucrose and suggested that the atrophy of
the taste cuds which occurred with age might be the explana
tion for their findings. The decreased preference of elderly
patients for sweets noted by Laird and Breen ( 5-3) was be
lieved by these authors to be due, °t least in part, to de-
47
creased taste sensitivity. Since children hsve more teste
buds than eduiûs they may be mo re sensitive to food-taste..
The question has been raised regarding the teste sensitivity
of adolescents end whether it zay be a rector in their food
preferences. Information, .therefore,, concerning teste thres
holds for the four basic testes wes obtained for the girls in
tuls study.
The teste tests were administered, in the mo rni rig a g proxi
es te!y':two .ho.ur a rftor the subject^ had eaten breakfast. The
testing, was done in a room ' Ir. which the • huiLidity was con
trolled end tne ten.uerature L.aintained rt 70°F .. There were
four series of test solutions consisting of chemically pure
sodiua; chloride, tartaric acid, caffeine rnd sucrose dissolved
in distilled water in differ.nt concentrationo. In each
series there were 10 solutions except caffeine for which
there were eight. The first in each series was distilled
water. Beginning with the second each solution in a series
was twice the concentration of the oreceding. (See Appendix
Û, Concentrations of Solutions for Teste Tests.')
For each series approximately 15 milliliters of each
solution were placed in one ounce medicine glasses numbered
in order of increasing concentration. A glass of distilled
water was provided each participant to rinse her mouth be
tween testes. Explanations end instructions were given
verbalxy prior to the testing. The subjects were told that
43
they were being given four series of solutions of substances
which were sweet, sour, bitter end salty and that for each
series the solutions were arranged in order of increasing
concentrations. They were not tola the order in which the
four series would -Le offered. The girls were asked to indi
cate the intensity of the teste of each numbered solution in
t:,e, series according to the following scr,.e : .
•„y./- 0 Ho' taste'.,
-I Very faint
fplnt
3 Zaslly noticeable ' -
4 Strong
5 v e r y s t r o n g
They v ere siso asked to identify the t^ste and to record the
number or the solution in wnlch the trste was first recog
nized. (See Appendix B, Taste Test Record Forn;. )
Information, therefore, was obtained concerning the
ability to identify each of the tastes correctly, the concen
tration of the solution at which the identification was made
and, if not identified correctly, the taste with which each
was confused.
Values inventory
Since one's values are believed to determine to a great
extent one's choices in life, information w a s desired con-

49
cerning the vglues which would influence the subjects' food
choices. Coburn1s Inventory (13 ) developed to assess values
that influence food selection of twelfth-grade girls was
modified to . conforn. to the activities of the ape group in
the près.nt study. Because of age differences some of the
situations described in Coburn1 s Inventory were not appli
cable ; hence three situations were del/ted and others modified.
Coburn1 s''Inventory- woo. designed to measure, six values, but
since this investigation was not concerned with money as a
value, abatements relating to monev. were." omitted. The. values / • ' V_ V •
included were'sociacility, independence, health, enjoyment
and status. To increase reliability of"'the instrument more
statements for each v-^lue were added so th-1 each value was
involved 22 times; 11 statements indicate an acceptance of
the value and 11 statements a rejection of the value. The
respondents were asked to indie:te the decision the girl in
eac:i situation should make. Using a five-point scale they
were to decide how much each statement should influence her
decision.
The revised Inventory was administered to ten 15-year-old
girls to determine clarity of directions a,.d situations.
Some changes were made end the decision was reached to use
veroal in addition to the written directions because the
girls found it difficult to analyze the reasons for their
decisions. (See Appendix E, Values Inventory.)
50
A separate score for each value was obtained by assigning
numerical weights for each of the five responses. For those
statements indicating acceptance of the value, the v.*eights
assigned to the degree of influence were :
Very greatly \5
Greetly 4
' • Uncertain. • 3'
' Little ,• • £
. Lot at all. 1 .
' For those' statements rejacting the value the Leights were 'Lv
reversed. Scorin; Leys were mr.de for cach value.
-Reliability of the instrument was determined cy dividing
tne statements into two roups. A split-half correlation
coefficient v;as outlined and the Spearman- - ro wn formula w a s
applied to correct for length. Tne reliability coefficients
for tne values are as follows :
Health . 2 2
Independence .80
Status .66
Enjoyment .60
Sociability .SO
Intelligence tests
Intelligence quotients for the subjects were octsined
from the school records. All of the pupils who were in the
51
eighth ^rade had been given the Otis Quick Scoring kental
Ability Test. : or approximat ely one-third of the girls who
were not yet in the eighth grode, scores were used from the
ivuhlmann-Anderso.n Intelligence. Test given in the fifth grade.
Food intake records
In : order; to assess eating .behavior inibrmrtion was needed
concerning. tne kinus and aa^ounLs of food e-ten by the subjects
ana when i u was eaten . * -ha.'.most widely used method in. the
collection yf. data for dietary studies has be: n the dietary
record wnich consists of a lifting of all foods, weighed or
measured, consumed uy an individual over a given period.
There in consideracle uncertainty pcuut the minimum number of
days for which suc';; a record needs to be kept to yield infor
mation which typifies the food habits. Chalmers et al. (12)
studied tnis pro clem and concluded that the number of days
the record should be kept depends on the precision or repro
ducibility of a result required. In general, the greater
the number of days of intake, the more precise the estimate
of intake. v.'omen were found to be more precise than men in
reporting their food intake. According to the findings of
these authors food intake records for a 10-day period would
give a true estimate of the mean intake + 16 per cent for
calories, protein, calcium, phosphorus, iron, thiamine,
riboflavin and niacin. Because of the extreme fluctuations

52
in intake of vitamin A and ascorbic sold a. longer period of
intake would be necessary to obtain an estimate of the true
intake of these vitamins with the same degree of precision as
the other nutrients. V.'hile it is important to have the
dietary record cover a .sufficient period to furnish a. true
picture of food intake it is also necessary to avoid pro
longing tne period of record-keeping to ' the point where the
interest and cooperation. of the subj ects. -re lost . I-,any re
search wo rivers - believe that me tended period of record
keeping also decreases the subject's accuracy in reporting
food intake. This mi.'ht be especially true cf the present
age group.
The decision vas made to ask the subjects to record
their food intake for never, days curing the summer and three
days the following Fecruary to give a picture of seasonal
variation. It was believed th*t the time of record keeping
would not ce so long as to decrease interest and accuracy end
would give a fairly accurate estimate of dietary habits.
Tne dietary record was begun the day of the visit to
the University campus. A demonstration of the use of standard
measuring equipment and of the method of recording food was
given by the author. The girls recorded under supervision
the lunch they ate at the University. They were instructed
to record all food eaten both at and between meals for the
next seven days. (See Appendix F, Food Intake Record Forms-)
53
Sight days later the records were collected at their homes.
From the information obtained from the food intake
records eating cehavior was assessed according to the follow
ing indices :
Percentage of.meals missed
'-i-.eeh number of. snacks per day
..umcer 01' meals repeated
. l-.ean number of servings ci' food per day . y
r.een.number pf. different, items of rood .included each day
y keen 'number of servings per dry of mil.;, and equivalents
i-.ean number of servings pc.r day of vitamin -C-ri'ch- foods
keen number of servings per day of caro te no id-rich fruits and vegetables
r.ean -daily energy intake from foods with few nutrients such a s CPkes and c and y•
Dietary adequacy was estimated also from the food intake
records. The method of Thomas et al. (56) was used in assign
ing numerical scores for nutritional adequacy of the dietaries.
Excluding food energy and niacin the score approximates the
mean percentage of the nutrients as given by the Recommended
Dietary Allowances of tne National Research Council, which
were attained in e given diet. (See Appendix F, Scoring of
Food Intake Records.)
In deriving the score, such foods as desserts or sweets
which contributed little beside food energy were excluded.
An estimate of the mean daily caloric intake from these foods

54
was made, however. Lean caloric values for a serving of
foods su.ch as cake, pie, candy, soft drinks were estimated. .
The numcer of servings of each type of food w g s tallied for
each subject for the period and mean daily caloric intake was
computed.
Height and weight records
During- their visit to the University, the subjects were
weighed and measured. The measurements were taken at mid-
morning. ; Tne girls iwor.e light s urn... er clothing but removed
their shoes. A meter stick listened permanently at right
angles to a platform was used to assess height. Each girl
was directed to stand straight with the heels, hips, shoulders
anc. ceck of the head touching the board and with the arms
hanging loosely at her sides. By the use of a right-angle
head piece the height was located on the scales. Using the
Physical Growth Record for Girls prepared by the National
Education Association e%d American kedicel Association the
girls were classified according to their height-age relation
ship.
A Howe platform balance was used to obtain the weights
which were recorded to the nearest hundredth of a kilogram.
A weight classification according to age was made using the
Physical Growth Record of the National Education Association
and American kedical Association.

55
Hand x-rays
X-rays of both hands of each girl were made and bone age
was estimated by e radiologist. A ratio of bone-age to
chronological-age was calculated.
Minnesota Counseling Inventory
Since there is some. evidence that; emotional adjustment
(26, 35) and personality trait's (4l) p.:ay', be related to food
preferences, .mer sures of personality .factors and psychological
adjustment were, derired for this investigation. A suitable
instrument to measure these factors for this age group was
not available. The Minnesota Counseling Inventory (5) pro
vides a measure of the desired factors but requires at least
an eighth-grade reading ability. After conferring with one
of the authors of the Inventory, it was decided to use the
Inventory witn a glossary which ;e provided. Every girl was
instructed to decide whether each of the 355 statements was
true or false as it applied to her.
Nine scores can be obtained from the Inventory. A
question score (?) indicates the number of items omitted.
If more than %5 items were not answered, the responses were
not scored. Tne validity score (V) is used to identify punils
who are overanxious to display socially acceptable character
istics. If the V score was eight or higher, the scores were
invalidated. Three of the nine scores were used in the
56
present study to identify areas in which these pupils were
making satisfactory or unsatisfactory adjustments : family
relationships (FR), social relationships (SR) and emotional
stability (ES) . Four scores - .rovitie information about the
means students, .were .using 'in making adjustments; conformity
( G ), adjustment to reality (?.), mood (L) and leadership (L) .
In all oi'ythe-..area's" better adjustment -is indie-ted by a lower
score.
Sex- r o 1 e identil lc;• tlon r- cales ;
In an attempt to determine the extent of each -irl's
identification with the female sex-role, two sex-role identi
fication scales developed by Surchir.al ( 6) were administered.
The one, consisting of 10 items, me--sures the extent to which
girls are ceginning to use appearance symbols generally asso
ciated with female sexual attractiveness and the other, con
sisting of nine items, measures the extent to which girls
are beginning to become interested in boys. (See Appendix
C-, Sex Role Identification Scales. ) The participants re
sponded to questions about the use of symbols and interest in
boys according to a five-point scale. Both sets of responses,
those which indicated the use of the symbols and those which
related to an interest in boys, were weighted as follows:

57
Always or a great deal 5
Often or much 4
Sometimes or some 3
Seldom or a little £
Nevor or. none at all 1
For the two items which were phrased to indicate p. 'lack of
interest in coys the numerical weights "were reversed.
-Reliability for the two scales was determined for each
of the thr je age ••••roups by- correlating the odd end even items
ana applying the Spearman-Brown formula to correct for length.
The reliability coefficients were as follows :
1 'c- ye aold girls .56
1'5-yoar-old girls .90
14-yerr-old girls .91
Test of nutrition knowledge
To determine t.:e relation of knowledge of nutrition to
eating behavior a nutrition test was developed. The test was
designed to measure the ability of pupils to:
recognize nutritionally adequate meals
make substitutions within food groups
evaluate fallacies about food practices .
plan good reducing or weight-gaining diets
identify nutrient content of basic foods
select best buys in foods.

The test was given to approximately 100 eighth-grede
girls in Central Junior High School, Ames, to determine clar
ity, level of difficulty of the items end the time needed for
administration. The test 'appeared to be too long and two
items were oalt ted. When administered to the girls in the
study the test consisted of -50 items with a possible score of
60. (See Appendix i, Tent of Nutrition knowledge.).
Reliability was determined for each of the three age
group's "by scoring the bed and ever: /items separately, corre
lating the s cor es'.; end epplyin.' the 3po'T rman-Srown formule to
correct for Ten,- tn. 'for the three age "groups the reliability
coefficients were foui.v to be:
lc-yerr-olcl girls .74
15-year-old girls .65
14-year-old girls .'62
Records of 'physical activity
The girls kept a record of their activities for seven
days during the summer of I960. (See Appendix I, Physical
Activity Record form.) On the oasis of the energy expended
the activities were classified into four categories : sleep,
mi lu activity, ...oderate activity and vigorous activity. The
method used was that employed by lickenpaugh (44).
The number of minutes spent in each category of activity
was determined end these figures were converted to hours.

Using the method of Pickenpaugh an activity index was deter
mined. The energy expenditure for sleep was set at one. The
energy spent for other activities vas considered in relation
to the energy spent for sleep and p. r = t.io v? s obtained for
each category of activity: sleep, 1: CO ; r:.ild activity, 1:61;
moderate activity,'&14C; and vigorous activity,'5:66. These
ratio s v: ere then multiplied by"-the houra spent in that c-te-
gory. of activity soch day and the products were summed to
octain- tne .activity '.index, or a subject. -
. . Analysis of Data
Analysis of variance a..d correlations y ere 'used for the
analysis of z.rzc collected in this investigation.

60
FINDINGS.
In the present investigation àr. attempt was r::ade to ascer
tain the factors that may be related to eating behavior and
the selection of a/, adequate diet for the sample studied. No
attempt v;e.s made to select a sample which would be representa
tive of 1~-, 13.andv 14-year-old girls in Iowa ., , In the first .
section or tne findings, therefore, the ch r a c t eri sties of
the s eu., le of L iris will be described in. terms of '.family, back
ground w-iich 'ma,. ' ce related to food practices, frequency of
attendance at social occasions where food is served, weight-
for-age 3ta Lus, level of activity, frequency of e- tina be
tween mer Is, e~tirȣ behavior and adequacy of diet.
The interrelationships of selected physiological, psycho
logical and sociological factors to e--ting behavior and the
selection or an adequate diet, as well rs to the independent
variables of age, social status and menarche, will be pre
sented in the second part of the findings. These relation
ships were investigated using both intercorrelations and
analysis of variance.
Characteristics of Sample
Family background
All or tne girls in this investigation lived in Boone,
Iowa, and were members of relatively stable families.

61
Eighty-one per cent hr-à Uvea in this community for five years
or longer and 71 per cent for ,;:ore than nine years. Approxi
mately cb per cent had lived in their present hone for et
le,-st five y.e-rs.' Alr..ofit all ci' their fathere, 95.4. per cent,,
and of • their, mothers, 97.9, were living . Xoft of their
parents were living together, 20.7 per cent. Of the 32.2
per cent of . mo uh^raa employed outside the home/ 7.9 per ,cent
•fier-;'working part-time .and L.4.3 per cent full time.
The .sunjectr, c-...e from families yho had .lived in the ..
Tr.it...d Ztatea Tor at^ least, ti.'o. generations. At lest 76 per
cent of tne grandparents had bo?n oorn in the United States.
The true percentage is probably higher then this cecause in
10 par cent or -.ore of the cases the subject? did not know
where their grandparent? were corn.
In response to questions concerning special occasion
meals the family ate together, nearly 95 per cent of the girls
indicated tnrt their families did not follow this practice.
Approximately four per cent said they had such meals at the
following times: Sunday dinners ; birthdays ; national holidays
such as Thanksgiving and Hew Years ; Church holidays ; and other
days such as Halloween end Valentine1 s Day.
During the school year most of the 13-and 14-year olds
ate their lunch at school since they were allowed only half
an hour for lunch. nost of the 12-year-old girls' were in
grade school and many of them : ent home for lunch. Responses

62
to questions about persons v;ith whom meals were usually eaten
pre g-lven. in Teble, .£• Breakfast was the. nef 1 most often eaten
alone by zhe 15- and 14-year-old girls and lunch by the 12-
year olds, ioh.t oi' uh.e girls had breakfast and the evening
cerl v:ith their families.
labié b. ': rersons v:ith•i/hom 'meals' 'v,:ere ' e* ten
f arsons: r.eais . . Family..members.. ; .Friends ' Alone
Br es: kf act 14 year olds 2 5.7 2.7 13.6 13 r<
CD
o lâs 9 5.7 0.0; S .,3 12 year o Id c u7.3 C. 7 0.0
noon meal 14 ye:r olds lc.c 89.6 o.o 13 y err olds 7.5 30.3 1.9 lL y er r olds 55.0 40.0 5.0
Evening m-eel 14 year 0 Id S 9 C1.0 2. £ 13 year Olds 0.0 3.8 lL year olo.s 9i.3 7.7 0.0
Social activltles
He s pons,; s to questions about frequency of attending
parties at which food, vjps served **re given in Table 3. Nearly
72 per cent of the girls reported that they had parties in
their homes a.t least once a week and 6 5 per cent attended
parties at the homes of friends equally as often. About 79

63
Table -3. Frequency of attendance at social occasions
Freouencv Social occasions
Once p. Twice a Once a Once a ko re one year year month week often
Own home 13.4 0.0 0.7 11.4 3S.6 32.9
Homes of friends '3.S 0.7 3 47.1 15.7
School 1 0 . 0 : 0 . 0 0 .7:: ; 10 . 7 10.0
>.eetinfe s with friend;s at .. . -publia £• r tir.;.-places - - lc.2 Lc.O L/ .3 17.1 10.7 10.0
per cent of t.:e subjects also attended school parties once a
week. It aope'rs th-t these girls had parties rt homes much
more frequently than the: met friends °t public eating places.
At thene parties the foods most frequently served to all
three age y ru up s were soft drinks, potato chips, cake and ice
cream. Punch and cookies appeared to ce most frequently
served as refreshments at school parties. At public eating
places most girls of all three age groups ordered soft drinks
and sandwiches, especially hamburgers.
..eiwht status
The subjects were classified according to weight for age
into seven groups using the Physical Growth Record for Girls
prepared by the Joint Committee on Health Problems in Educa

64
tion of the National Education Association end the American
kedical Association. The percentage distribution by ege among
the seven groups is given in Table 4.
A larger percentage of the 12-ye^r-old girls were above
average in weight-for-age classes then were the girls of the
other two age groups. Of the 140 subjects 13.6 per cent were
heavy or very heavy, Ô.4 per cent were in the very light and
light weight-ror-age classes end 37.1 per cent were average in
weight for age.
Table 4. Distribution of weight according to age
y.'ei ph t- f o r-age cla s sif ic a tion Under- kod. kod. Very
Age N weight Light light Average heavy Heavy heavy
14 41 4.9 4.9 12.2 43.9 24.4 7 .3 2.4
13 55 c
o
7 .3 20.0 31.0 16.3 20.0 5.4
It 44
o
o c .3
l—1 i—1
3S.6 29.5 9.1 9.1
Activity
An activity index, indicting comparative energy expendi
ture, was determined for each girl from continuous records of
activity kept by i:he subject for seven consecutive days during
the summer of 1960. The mean and range of the activity indices
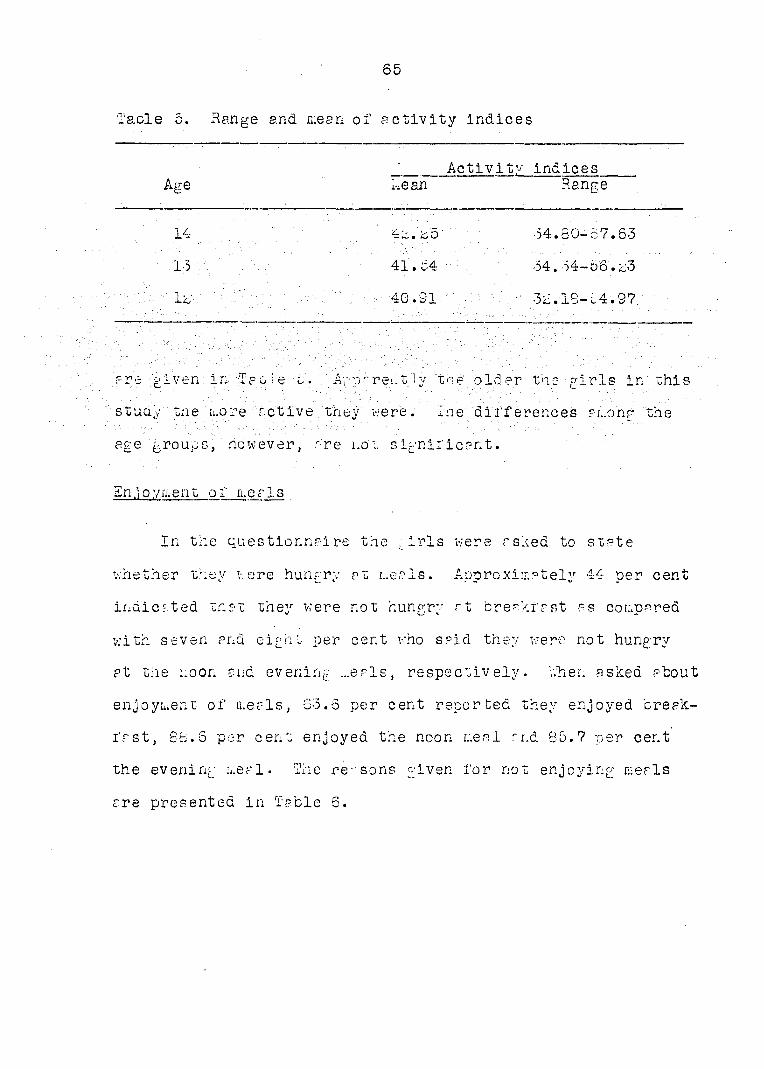
65
ïacle 5. Range and mean of activity indices
Activity indices Age Lean Range
14
.1-5
• . lb
are given ; in/Tec 1 e l . Agp-rei-t ly the' older the girls in this
s tua,y tne more active they were. Tne differences çLohp "the
age groups, " however,' are''not significant.
Enjoyment of n.eris
In the questionnaire the .iris were asked to state
whether they were hungry at meals. Approximately 44 per cent
indicated tnat they were not hungry rt breakfast as compared
with seven and eignl per cent who said they were not hungry
at the noon and evening meals, respectively. V.her. asked about
enjoyment of meals, 63.5 per cent reported they enjoyed break
fast, 88.G per cent enjoyed the noon meal and 65.7 per cent
the evening meal. The re sons given for not enjoying meals
are presented in Table 6.
4b.b5 54.80-67.63
41.54 -54. 54-56.%3
40.31 . / 3%.19-14.97

Table 6. Frequency of reasons given for not enjoying meals
Noon Evening Reasons Breakfast meal meal
1.4 1 .4 0.0
0.0 0.0 0.0 0.7
ZctlLK oez\-:eei: me.-is
Frequency of e - t i r ; c on. -eks v. -as a l so investigated a t the
t ime tne questionnaire v s filled out in v . ay , 1950, ^nd the
results rre presented in facie 7. 5 necks v;ere consumed most
of ton in the afternoon and evenln,. Approximately th ree-
four ths of the i r i s seldom or never a ce snacks in the
Taule 7. Frequency of er tirh cetvveei; meals
Time hever Seldom Sometimes Often
corning
Afternoor
Evening
.Snack too close to mealtime 0.0 0.7 Seldom hungry 11.4 1.4 Do not like -foods• usually served L .2 2.1 generally ii. too much or s hurry
to enjoy vh v lng - • 1 o.O Are too t i red to ' en joy to t ing - 3 .S / / . 0 .0 Scolded too much - ; t meal t ime. • u . 0 . 0.0 Famil v .. yrgues too much a t meal t ime- - - ' - . - . . ' 0 .7 . . . C .0
50 .7 ï c . l
6.6 6.6
10.0 15 .0
17 .1 6 .4
50.0 28.6
4 c .1 £7.9

67
morning.
Foods consumed most frequently ?.s snacks in descending
frequency were csndy, soft drinks, pot.-to chips rnd cookies
by the 14-year olas ; soft : rinks, ice cream, fruit and milk
by the 13-year olds; rnd ice ere cm, cookies, cake, candy end
soft drinks by une li-ye-r olds.
Sating xehc'vior and dietary '.adequacy :
Indices of eating•behavior used in the present investiga
tion include, merIs missed, the use of sn-cks, intake of dif
ferent items of food, r.umcer of servir:; s 'of rood per day,
intake of mil^ and equivalents, intake of crrotenold- and
vitamin G-rich foods end food energy intake from foods of low
nutritive value. Dietary adequacy was estimated from the per
centage intake of tue foods given in the basic food group plan
for girls in this ?ge group. (See Ap v.endix F, Scoring of
Food Intake Records.) The score obtained represents the mean
of the percentages met of the Recommended Dietary Allowances
of the National Research Council. Intake of food was recorded
for seven consecutive days in the summer, 1950, and for three
consecutive days during the fc1lowing February. Findings for
the two perioas r-re given in Table S.
The diets of this group of girls were similar to those
observed in previous studies of Iowa girls (17). The intakes
of milk, carotenoid- and vitamin C-rich foods were low. The
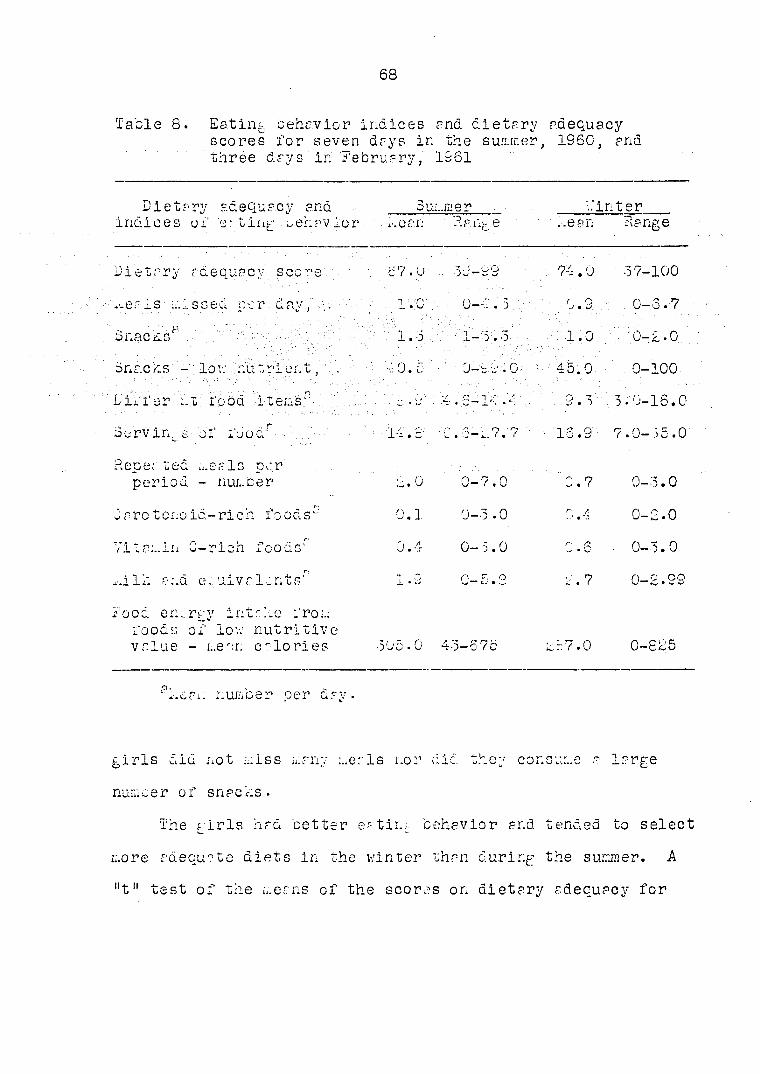
68
Table 8. Eat int. behavior indices end dietary adequacy scores for seven days in the sun.mer, 1960, and three days in 'February, 1951
Diet? ry adequacy and 5ul .mer inter indices of eating uehavior • i.O ai: • Ranee ..e an Range
Dietary adequacy score 67 . u . . 39-99. . 74
.0 37-100
i'.6.-iS a.* ssed per . day ,' > • .]_ .0 0-4.5/. • 0 .2 0-3.7
- • a snacks : 1 . 5 • ; 1-5.0 . : '1 .0 . 0-2.0
Snacks - ; lov: . nutrient, : . e 4 0 • O-b-.O ^ 45 .0 . . .0-100
Differ n t rood items:\ : -
4,. S-1X - 9 . 5 3.0-16.0
SurvinLe of food! ; 14 • -' ' ' C.S-L7.? "15 .9 7.0-55.0
Repe; ted period
meals per - number .0 0-7.0 Q .7 0-3.0
Jarotenoid-rich foods" 0 .1 0-3.0 0-2.0
Vit a;., in C-rich foods' 0 0-5.0 .6 0-3.0
r.ilk and equivalents' 1 . 5 0-5.3 .7 0-2.99
Food en., foods value
rry intrke from of lov; nutritive - i..ear. calories 50c .0 43-67c 257 .0 0-825
pl-.eai. number per day.
girls did not miss a any meals nor die. they consume a large
nu ni cer of snacks.
The pirls had better eating behavior and tended to select
more adequate diets in the winter than during the summer. A
"t" test of the means of the scores on dietary adequacy for
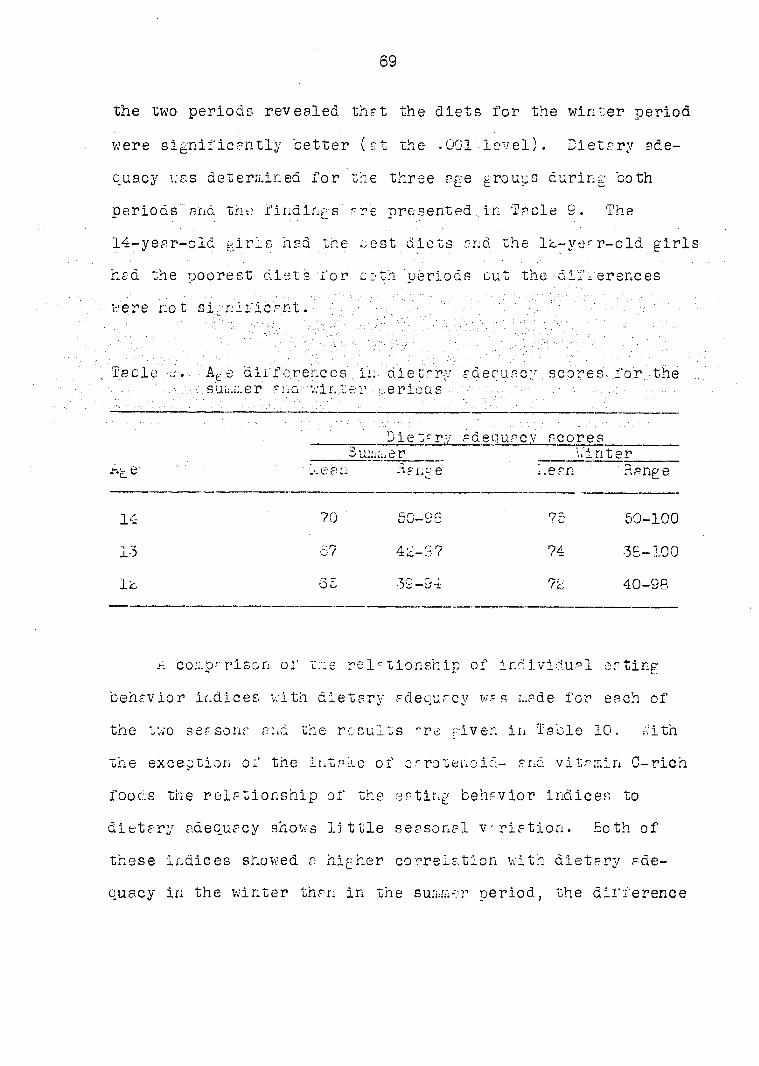
69
the two periods revealed that the diets for the winter period
were • significantly better 1st the .001 level). Dietary ade
quacy t;es determined for the three age groups during both
periods and the findings ^re presented.in Tacle 9. The
14-year-old•girls-had the cost diets end the lb-yerr-old girl
had the poorest diets l'or coth periods out the differences
were not significant.''
Table Age differences . in, dietary adequacy . scores", for. the su:..mer ?na;.v;ir.;ter ericas
Jiet-r.y adequacy scores bummer '..inter
• .-.ean --ipng e ..ean ' nenge
14 70 50-9G 75 50-100
13 67 4^_S7 74 35-100
lc Gc 39-94 72 40-96
comparison of trie relationship of individual eating
behavior indices with dietary adequacy was made for each of
the two sec sons and the results -re given in Table 10. With
the exception of the intake of carotenoid- and vitamin C-rich
foods the relationship of the eating behavior indices to
dietary adequacy shows little seasonal v riation. Both of
these indices showed a higher correlation with dietary ade
quacy in the winter than in the summer period, the difference

70
Table 10. Relationships of eating behavior indices to dietary adequacy
Dietary adequacy and eating behavior indices
Correlation of Correlations dietary adequacy between the scores with indices indices for of eating behavior summer and Summer Winter winter
Dietary adequacy - score
r
.59**
Ideals missed, -.59** -.60** .50**
Snacksa •17* . .16* .35**
Snacks - low nutrient, v
i—i .
o i . 02 • 15
...p •. Different items of food' .71** .70** .60**
Servings of food0 .77** .85** .60**
kilk and equivalents6 .60** . 63** . 68**
Carotenoid-rich foods6 . 21** .44** • 11
Vitamin C-rich foods® .35** .49** . 50**
Food energy intake from low nutritive foods -mean calories .24** ,23** .17*
akean number per day.
••Significant at the .01 level.
•Significant at the .05 level.
was even greater for the csrotenoid-rich foods. In other
words this means that it is more necessary to the adequacy of
the diet that a carotenoid-rich fruit or vegetable be included
in the winter than in the summer*
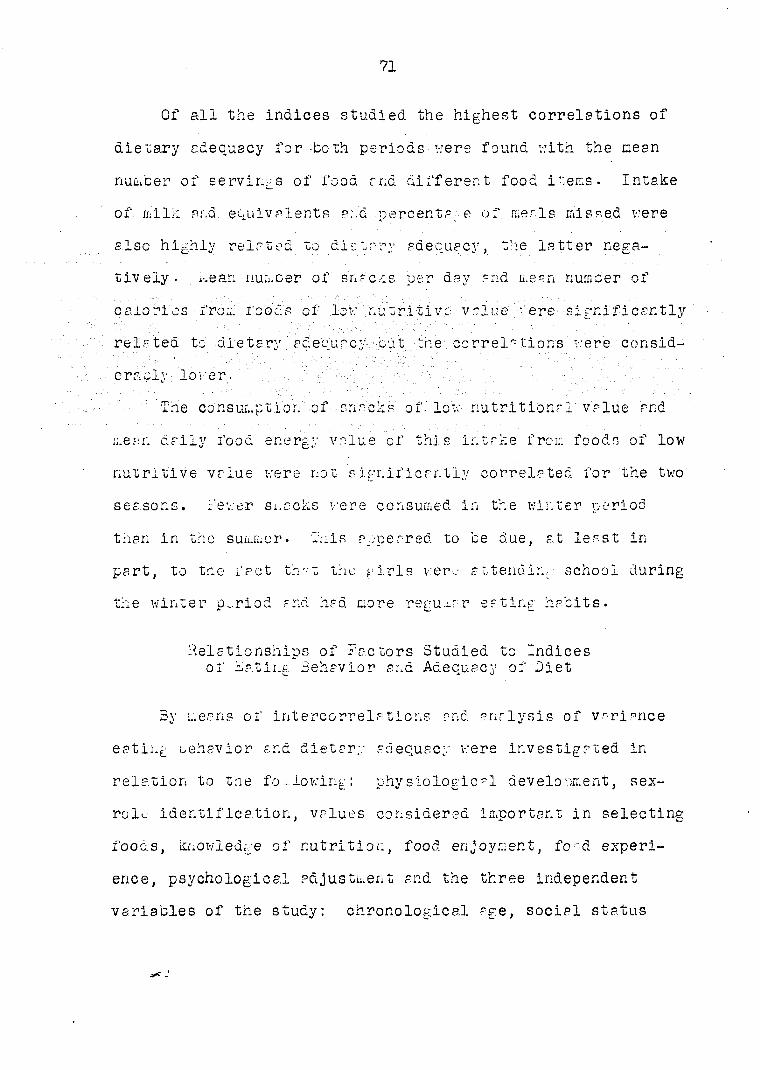
Of all the indices studied the highest correlations of
die vary adequacy for both periods were found with the mean
number of serviras of food and different food i';ems. Intake
of il ilk and. equivalents and percentage of mer. Is missed .were.
also highly related to dlsirrv adecuecv. the letter neea-° v ^ •" < ^ .
tively. kean riumcer of snac.-cs per day and ix.ean number of
'calorics fro:, foods of low 'nutritive:' value vere significantly
re le ted to dietary ..'.adequacy: but the correl" tions were consid-
cracly lower.
The consumption of: snacks of.' lov: ' nutritional "value rnd
mean daily food energy value of this intake from foods of low
nutritive value were not significantly correlated for the two
seasons. : ewer si.acks were consumed in the winter period
than in the summer. In is appeared to be due, at least in
part, to tne fact th^t the ^iris were attendin, school during
the winter period and had more regular eating hacits.
Relationships of Factors Studied to Indices of bating Behavior and Adequacy of Diet
By means of intercorrelations and analysis of variance
eating behavior and dietary adequacy were investigated in
relation to tne following : physiological development, sex-
role identification, values considered important in selecting
foods, knowledge of nutrition, food enjoyment, food experi
ence, psychological adjustment and the three independent
variables of the study : chronological age, social status

72
and menarche. Data for analysis were obtained by question
naire , food' in lake records, activity records, physiological
measurements, teste threshold tests, food enjoyment end expe
rience scales ai.a inventories of valuer end psychological
adjustment.
I n't ercorre options a mo i.g a- selected number of these fac
tors and '.indices of -eating cehrvior : and dietary, adequacy are
t.iven in Teole 11. ihe findings frum the analyses of variance
are pIven' in Taole-.l^ •, " ( For1""rëpù-1'ts ./of- all of tre relation
ships investit?- ted see Appendix J, Figure 1, Correlation:
matrix d•)
A correlation of .17 is significant at tne .Oi level
and .bi, at the .01 level- Correlations of .17, though not
high, indicate tir t cetween the two factors under considera
tion there is procably a true relationship th?t is worth con
sideration . l;ie size of the correlation, however, ns well as
its level of statistical significance must be ta,.en into con
sideration in tne interpretation of results.
Two measures of eating behavior, percentage of meals
missed sx.d mean number or snac/.s per day, were selected for
comparison. -he other indices of e-ting behavior were either
used.in determining dietary adequacy or were so highly cor
related wit.-, dietary adequacy that correlations of the various
factors with these indices were not warranted.

73
Table 11. Intercorrelations among certain factors and indices of eating be]
Factors and indices 1 2 3 h 5 6 7
Percentage of meals missed 1
Mean no. snacks per day- 2 -.11 Dietary adequacy 3 - .55** .07 Social status h -.22** .12 - .32*-^ Chronological age 5 - .06 -.07 .15 -.06
%3W Menarche 6 •17* -.05 .oo ... -.07 %3W Bone age 7 . 2U»-* -.12 .il .02 ; .-.15 .35*:-Height-age class 8 -.15 .12 .20 .19-.- .00 .13 .15 Weight-age class •9 .17* .05 -.22** -.15 -.11' .39-Sex-role identification 10 •05 : .16 • .03 .03 .l2*-x- .17* -.07 Health as a value 11 -. 21** .Hi .Id. .17* -.ou -.28** -.33^ Sociability as a value 12 .oy .20* -. 22"""* -.10 -.11 -.02 .08 Independence as a value 13 .08 - .Où -.15 -.30** .12 .15 .10 Status as a value Ik .07 .17* -.18-"- -.17* -.16 .13 .12 Enjoyment as a value 15 .16* -.07 -.20* -.25->* - «Oit -.0!: -.05 Food enjoyment 16 .16 -.06 . 21** .27** -.03 -.11 -.09 Food experience 17 .09 .05 -.13 -.03 -.11 .05 .12 Knowledge of nutrition 18 -. 25"i;~" .06 .32** .12 . 3ù':w;- .00 -.00 Intelligence 19 -.Id* .12 .19* • 33** -.15 -.17* .09 Desire-for-food cluster 20 -.01 .22** .05 .15 .19* .00 .13 Concern-about-overweight cluster 21 • 21** .13 -.30** -.19* .02 .22** .29*-:
Interpersonal-and-peer-relations cluster 22 -.20* -.15 .1U .20* .07 -.06 -.06
Personal-adjustment-and-family-relations cluster 23 - .19* -.10 .23** .ijl** -.ou -.16 .06
•^Significant at the .05 level.
^Significant at the .01 level.
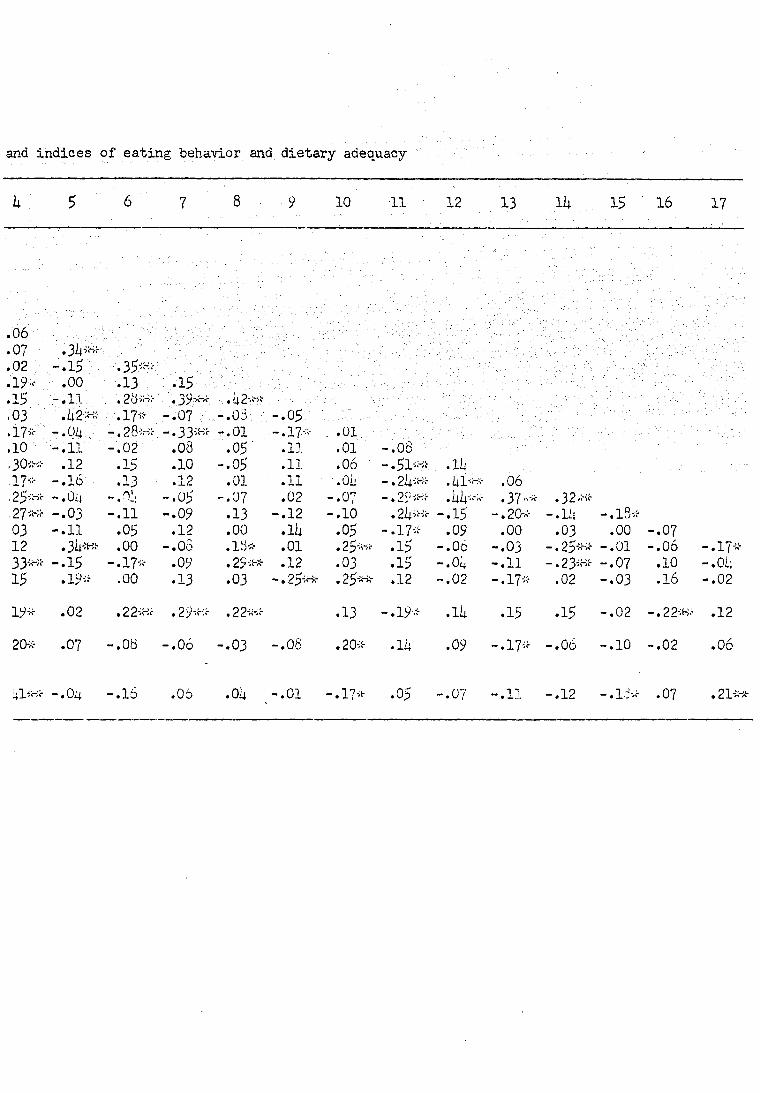
and indices of eating behavior and dietary adequacy
k 5 6 7 8 9 10 11 12 13 lit 15 16 17
.06% :
.07 : :.3W . ; .02 -.15 .35*' . .19»- . .00 .13 : .15 .15 -.11 .2^:-x- .39-^ ,.u2**.' .03 ".b2** •• .17* -.07 . ,-.03. -.05 .17* -.Oii -.28** -.33** -.01 -.17* „ .01 .10 -.11 -.02 .08 .05 .11 .01 -.08 ,30** .12 .15 .10 -.05 .11 .06 - .5I-"-"-,17* -.16 .13 .12 .01 • .11 .01- -. 2I4*»- .06 ,25** - .Oit -.05 -.07 .02 -.07 -.29*-^ .37-* .32/-* 2 7 -.03 -.11 -.09 .13 -.12 -.10 . 2I4-»-* -.15 -.20* - .11; -.IB* 03 -.11 .05 .12 .00 .11 .05 -.17* .09 .00 .03 .00 -.07 12 . 3U-:B;- .00 -.05 .18* .01 .25** .15 -.06 -.03 -.25** -.01 -.06 -.17-33** -.15 -.17* .09 . 29** .12 .03 .15 ~ 4 0l4 -.11 -.23** -.07 .10 -.01, 15 .19* .00 .13 .03 -.25** . 25** .12 -.02 -.17* .02 -.03 .16 -.02
19* .02 • 22** .29** .22-»-»- .13 -.19* .Ik .15 •15 -.02 -.22** .12
20* .07 -.08 -.06
O I
CO O 1 .20* .lit .09 -.17* -.06 -. 10 - .02 .06
m** -.04 -.16 .06 .OÙ -.01 -.17* .05 -.07 -.11 -.12 -.Id* .07 .21**

Vl
ï
. « i— iu u iu u H1 O O O O C O VJ vn. VJ in. VT. O --3 j-™ O I—' H
^ x ?;
o Vl H xc
I I I I HHHHrororovno WUlV\-s] vO fTH CD
o —-3 s
I I I I o o o o h c - j r h fO -P - a . V3 Vr\ jr- H -C"
I H
I t I I H H H O O W ù) b V! —j t—• vj o o —j a>
I H K) o
O VJT.
o rv>
o M
o VJ
W W O HU) VJ VI VJ 4- K> ? $ t I I o b b h —J H O C.D
o o rv
ro IV X
I I h h b o cr. o o—J
rv O o\
I I I O O H K) f— —1
O ro H H
I—' VJ vn vn
£ no O 3 O CO
3 O ro
i H V>
& o

74
Percentage of aegis missed
The data in Table 11 indicate that, as compared with
girls who missed fev:er meals, [iris who missed many me?Is hpd
poorer diets and' tended to ce in the lower social-staîus
classification. The correlations vit'i menarche and cone age
snow/that these */ iris» were" ' Lnc lined-.to ce more nhy s 1 o 1 o pi c a 1 ly
advanced for' 'their" a ge ' than' the , iris\who :mi'ssed fewer meals.
Th ev also ' tended to' „ e in the •uox^r-weipht-for-'Pf.e • classifica
tions "out no t 'V-'llor.' i'or their: age "than, the cth^r. / iris . To
these L Tr--o enjoyment rather than health .ap/eared to be an
important value in food selection. kissing.mer.Is w^s related
significantly to poor scores .n the t st of knowledge of
nutrition. Girls who missed me*Is indicated a greater con
cern ab;ut overweight and tended to score lover on personal
adjustment and family vdatiui.ships thai, the others.
i-.ean numoer of snacks per day
Apparently girls who consumed ? large number of snacks
per day tended to place a higher value on sociability and
status in selecting foods than did girls who consumed fewer
snacks. They also indicated a greater desire for food than
the other girls. There was no relationship between frequency
of snaciis and the adequacy of the diet, however.
75
Selection of en adequate diet
None of the correlations for the two indices of eating
oehevior, percentage of men Is missed and mean r.unber of snacks
per day, t.'ith the factors studied-are high except for their
correlation with dietary adequacy.
, Adequacy of diet appeared .to be significantly and posi
tively related to social status.' Girls with more adequate
diets, a Is;; .tenc. ed to ce Waller and -lighter for their age than
aid the eirls with less 'adequate diets. As compared with the
other sucjects the. girls with Lore adequate diets were in
clined to , lace a higher value on health in choosing food and
tu pay less attention to the other four values. Girls with
more adequate diets tended to enjoy food' Kore than the other-
girls and also scored higher in knowledge of nutrition. These
girls seemed to be les; concerned about overweight and tended
to have cet ter personal adjustment and family relationships.
Social status
Girls who belonged to the upper social-status class in
the co...muni:y represented in this study missed fewer meals and
had more adequate diets than did the girls of the lower social-
status class. These girls appeared to be taller but not
heavier for their age group. In selection of food they placed
a higher value on health than on the other four values in
vestigated, especially independence and enjoyment of food.

76
As compared with the others these girls appeared to be better
adjusted and more intelligent. They did not. tend to express
a concern about overweight and they seemed to relate better
.to their peers and rrve better family'relationships than did
the i'irls from the lower social-status class.
ChronolQxAcP!._a&e
A.,.onc these le-, 15- "..d 14-y~"r-ol:; ;irlr more of the
ola.er than tne younger, .girls had'reached. i:.enarche and 'Identi
fied positively . with their sex : role . Although . the-.,older
virls ki.ev. Lore about nutrition, they did not consistently
select significantly better diets but there w-s a tendency
in this direction (r - .lu). They did, however, express a
greater desire for food than the younger girls.
^•.en arche
Girls who had reached menprche tended to miss more meals
than did those who had not. They tended to be older and more
advanced physiologically, as determined by bone-age estima
tions, and to identify positively with their sex. They also
were inclined to ce in tne upper weight-for-sge categories
and were concerned about overweight. In tne indication of
values which they thought importent in food selection they
did not appear to consider health as important as did the
other girls.

77
Bone-age
Girls who were more advanced physiologically, as shown
by bone-age, missed more meals than the other girls. Lore
oi' tnem had reached, menarc.ie and more tended to be heavier
tor their age than the less physiologically advanced girls.
As comoared with the others .these twirls "olaceo a lower value
oil health ir. selection:of food and expressed a concern about
overweight.
'Helght-es'-e
As compared with shorter «--iris in the pro up the girls who
were taller for their ape tended to have better diets and to
be in the upper social-status class, -hey were also inclined
to ce heavier for their a; e than the others. As compared
with the girls who were shorter for their age, they tended
to score higher on the nutrition test and to be more intelli
gent .
weight-age
Girls who were heavier for their age as a. group missed
more me a. Is and had poorer diets than the girls who weighed
less. They also tended to be more advanced physiologically,
to have reached menarche and to be taller for their age than
the .others. As compared with the lighter weight girls, in
the selection of foods these heavier-for-their-age girls were
78
inclined to place a lover value on health and to express less
desire for food.
Sex-role identification
As determined by *>n inventory to indicate the use of
feminine symbols and interest in boys, identification with
sex-role any erred to ce related more cloaej y to chronological
than .tu .physiological • age although;-.It did correlate signifi
cantly cut to a lov: degree with r;.enarche. V.'ith the greater
tenoency toward identification with sex-role osn.e higher
scores on the test of nutrition knowledge, but not in intelli
gence tests ana also higher scores or. The desire for food
items. As compared with the othur gi'-ls, the girls who scored
high on sex-role identification tended to have fairly good
relations.ips with their peers, but not with their families,
i-lo significant relationships were found for sex-role identi
fication and eating oehavior or adequacy of diet.
Taste threshold tests
"when sensitivity to the four basic tastes was measured
in this study, no significant relationships of sensitivity
to eating behavior and selection of an adequate diet were
found except for sensitivity to bitter. (See Appendix J,
Figure 1, Correlation matrix -3.) This correlated significant
ly with dietary adequacy and social status. The girls there

fore, who had lower teste threshold for bitter tended to have
better diets. They were also more inclined to ce in the
upper social-status class than were those who had a higher
threshold for bitter taste. Sensitivity to sweet teste cor
related significantly with the Dean number of snacks per day.
Activity indices :
. An .activity index was' computed for each girl from the
record of activity ^ept for a week du.ring the summer of 1950.
(See • Ap ..enùix J , Figure 1, Correlation matrix 3.) The range
for the sample was 3c.13 to 57.63 and the mean w^a 41.55.
For the girls classified a s acove-the-av -rage weight for their
age, the range of activity indices was 54.60 to 54.SO, and
the mean was 39.31• Although the girls who were overweight
for their age tended to ce less active than the others, the
difference wan not significant.
Ko significant relationships were found between activity
indices and adequacy of diet. Girls who were more active,
however, appeared to consume more milk and mil,-; equivalents
and more vitamin C-rich foocs than the girls who were less
active.
Values important in the selection of food
By means of an inventory, scores were obtained to repre
sent the importance attached to the values of health,
80
sociability, independence, status and enjoyment in the selec
tion of food.
Health When health wes considered important in selec
tion of food, the girls tended to miss fewer meals, - to select
more adequate diets, to enjoy food more and to be less con
cerned about overweight than when health w?s not considered
important. As compared with those who valued health less,
they were less physiologically mature, were in the- lower
•>eight-for-age class and expressed less concern about over
weight. Ihv.-se girls also belonged to the higher social-status
class, and did not, in choosing food, consider the values of
sociability, independence, status and enjoyment as important.
They also appeared to understand that nutrition wa? related
to health. (See Appendix J, Figure 1, Correlation matrix 3.)
Sociacilit.v Girls who placed a high value on sociabil
ity in selection of food tended also to value status and en
joyment highly. They were inclined to have more snacks per
day end had poorer diets then did girls who did not consider
sociacility as an important value in selecting food.
Independence The subjects who indicated that they
valued independence highly in the selection of food tended
also to regard enjoyment but not health as important when
they selected food. These girls were inclined to come from
the lowest social-status group. As compared with the others
they seemed to enjoy food less and to score lower in the

81
desire-for-foood Items. They also showed a tendency to have
poorer personal adjustment and family relations than the girls
who did not value independence so highly in food selection.
Status Status as used here refers to social standing
within peer groups. Girls who placed a high value on status
tended to have more snacks per day, to have poorer diets and
to belong to the lower social-status class than the other
girls. They also appeared to be influenced less by considera
tions for health and more by the other values than girls who
placed less value on status in their food selection. These
girls scored lower on the test of nutrition knowledge and had
lower intelligence quotients.
Enjoyment as a value When the girls felt enjoyment
of food was of primary importance in the selection of food,
they tended to miss more meals, have poorer diets and belong
to the lowest social-status class. They also tended to value
health less and the other values more in food selection than
those who did not place a high value on enjoyment. These
girls, however, did not indicate a high degree of enjoyment
of food on the Food Enjoyment Scales. There was a tendency
for them to have poorer personal adjustment and family rela
tions than girls who did not place a high value on enjoyment
of food.

82
Estimate of food enjoyment
Enjoyment of food rs measured by the Scries denotes
relish for food whereas enjoyment as a value indie-"tes that
enjoyment or rood is an important consideration in selecting '
food. Scores on the Food Enjoyment Scale I related signifi
cantly to a.number of the factors and correlated .70 with Food
Enjoyment Scale II.. r-o significant correlations were found
for Scale II with any other factors except"social status-
Sir.ce the factors, with which Scale I.:. correlated significantly
we're "tabse' to which"food enjoyment would logically be related,
Scale I appears, to ue a better measure or I'loo enjoyment .then
Scale II. The nig.: i n t Ù r C O r r e 1 a ti O n between the two Scales,
however, would indicate thr t both were measuring some of the
sa:..e facets of rood enjoyment.
As indicated by the correlations with scores for Food
Enjoyment ,-:cale I, girls with the greater enjoyment of food
had better diets, tended to value health but not independence
in the selection of food and were less concerned about over
weight. These girls were more often than the others from the
highest social-s ta tus class.
Food experience
Food experience was determined from a list of foods
available in this area but not tasted by 10 per cent or more
of the girls in Ames. Ko significant relationships were found

between food experience end eeting behavior or dietary ade
quacy. Girls who had the most experience with a variety of
foods were inclined to be influenced less by concern for
health in the selection of food, and to score lower on the
test of knowledge of nutrition than the other girls. They
tended, however, to he.ve better personal adjustment and
family relations.
Knowledge of nutrition
. Knowledge of nutrition, as determined by a test measuring
ability to apply information in selecting meals, was signifi
cant ly related to dietary adequacy. The girls who scored
higher on this test also tended to m .is s fewer meals than the
others. They were inclined to -e older, taller for their
age and to identify more with their sex-role than those who
scored lower. Girls who knew more about nutrition had higher
intelligence quotients and had better interpersonal and peer-
group relations than the others.
Intelligence
Girls who scored higher on a test of mental ability
missed fewer meals, had better diets and knew more about
nutrition than girls who scored lower. These girls were found
more often to be classified in the upper social-status class
and to be teller for their age. A low but significant nega
tive correlation of intelligence scores with menarche indi
84
cated a tendency for girls who scored high on intelligence
tests to be average or late rather then errly in their matura
tion . They tended to piece little value on status in the
selection of food and to have good interpersonal and peer-
group relations.
Clusters of interrelated factors
Since some items proved to ce highly intercorrelated and
individually to correlate similarily. with other factors, they
were grouped and treated as clusters. Of the four clusters,
tv.'j v.-ere :,.ade fro;., the I-.i..nesota Counseling Inventory. The
four clusters are: desire-for-food ; conccrr.-rbout-overweight ;
int erpcr so n a1-and-po e r-group-relation s ; and perso nal-adjust-
n i e n t-and-f am i1y-re1a ti o i. s. These clusters were correlated
with the two indices of eating behavior, percentage of meals
aissed and mean number of snacks per da y, and dietary ade
quacy as well as the other factors investigated.
Desire-for-food cluster This cluster consisted of
four items fro..: the questionnaire. (See items 1, !c, 3 and 5
of Correlation matrix 3, Figure 1, Appendix J.) Vhen girls
scored hign in t.iis cluster they tended to report more snacks
than the other girls. They also were as a group older,
lighter in weight for their age and tended to identify more
positively with their sex-role than the other girls. In the
selection of food these girls tended to place a lower value

85
on independence than the others.
Coneern-gbout-overweip'ht cluster This cluster in
cluded information related to overeating ?nd concern about
overweight together witn weight-for-ege classification. (See
items 4, S, 7 and k.6 of Correlation matrix 3, Figure 1,
Appendix J.) Thirty-six of the 140 girls expressed p concern
about overweight axe of those, three-fourths were above aver
age in weight for their ;>ge and only c.5 per cent - were - below
average weight for their, age. Of those that >;ere classified
as above average in weight, 45.5 per cent expressed concern
about their weight. . ..hen' the girls were classified as heavy
or ver; heavy for their age 55.4 per cent were concerned
about overweight". The higher thè weight -for-age classification
of the girls, the more they indicated concern about overweight.
Girls who scored hig.i in this cluster were more advanced
physiologically, as determined by bone-age and menarche, end
taller for their age than those who scored lower. They were
inclined, nowever, zo have poorer diets, to miss more meals,
to enjoy food less and in the selection of food to value
health less than the other girls. These girls were more fre
quently from the lowest social-status class.
Interpersonsl-and-peer-group relations cluster This
cluster consists of the scores for social relations, mood and
leadership of the Minnesota Counseling Inventory. (See items
14, 18 end 19 of Correlation matrix 3, Figure 1, Appendix J.)
86
No significant relationship was observed among the inter-
personal-and-peer-group relations and the eating behavior
indices and dietary adequacy except that the higher the
score in this cluster the fewer the meals missed. Girls who
scored high in the cluster were more frequently from the
higher social-status class, tended to identify positively
with their sex-role and in food selection to value indepen
dence less than the other girls. These girls also tended to
score higher on the nutrition test and to have higher scores
on the mental ability test.
Personal-ad.1 ustment-and-family-relations cluster From
the Minnesota Counseling Inventory the scores for adjustment
to reality, emotional stability, family relations and con
formity were used to make up this cluster. (See items 13,
15, 16 and 17 of Correlation matrix 3, Figure 1, Appendix J.)
Girls who scored high in this cluster tended to miss fewer
meals, to have better diets and to be from the highest social-
status class than the others. They were inclined to identify
less with their sex-role, to value enjoyment less in food
selection and to have more experience with a variety of foods
than girls who had lower scores on personal adjustment and
family relations. As compared with the others, those with
higher family relations scores tended also to have better
péer-group relations scores.

87
Home conditions
Information v;as obtained by questionnaire concerning
certain home conditions which might be related to food prac
tices. These dr.ta were intercorrelated and correlated with
measures of enjoyment of food, experience with a variety of
foods, eating behavior indices, dietary adequacy scores and
the independent variables of the study: are, social status
and men arche. Those relationships which were found, to: be
statistically significant are presented in Tables 12 to. 18.
(For all of the relationships investigated see Appendix J,
Tacle Correlation matrix 2.)
Indices cf eating behavior used for the correlations
include percentage of meals missed, mean number of snacks
per coy, mean number of different items of food and mean
number of serving s of food per day, number of meals repeated
during the period and mean energy intake from foods of low
nutritive value. The mean energy intake from foods of low
nutritive value correlated significantly only with criticism
for poor table manners (r = -.17;. This measure of eating
behavior, therefore, was omitted from the findings presented
in the tables.
Employment and membership of mothers in organizations
It has been suggested that when the mother spends much time
outside the home either in employment or participating in
organizations the food practices of the fsmily may be
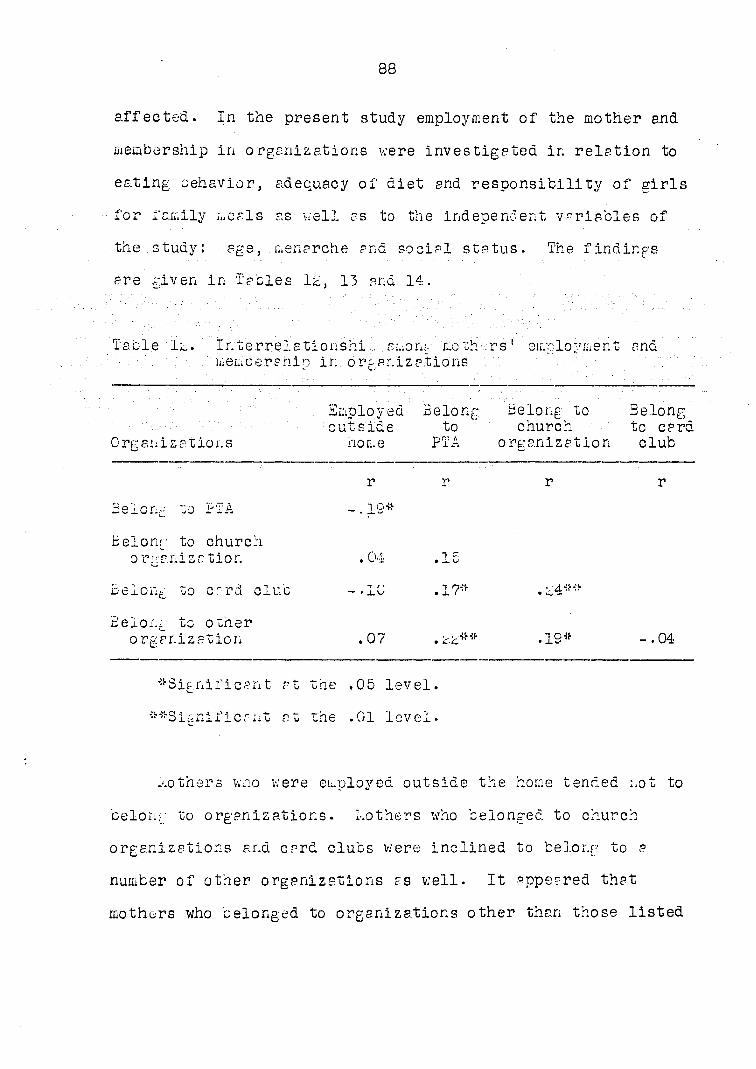
88
affected. In the present study employment of the mother and
membership in organizations were investigated in relation to
eating cehavior, adequacy of diet and responsibility of girls
for family meals as well as to the independent variables of
the study: age, ..menarche and social status. The findings
are given in Tables 12, 13 and 14.
Ta oie 11. Interrelationshiamong mothers' employment and . membership in organizations
Organizations
Employed outside
home
Belong to
PTA
Belong to church
organization
Belong to card club
Belong to PTA
r
-. 19*
r r r
Belong to church organization . 04 .15
Belong to card cluc - • lu .17*
Belong to other organization .07 . L** .19* -.04
•^Significant at the .05 level.
^Significant at the .01 level.
Mothers xvno were employed outside the home tended not to
belong to organizations. Mothers who belonged to church
organizations and card clubs were inclined to belong to a
number of other organizations as well. It appeared that
mothers who belonged to organizations other than those listed

Table 13. Relationship of responsibllity
mothers of the g
1 employment and iris for family
memcersh mer is
i^; in orga nidations to
Occupation of mothers Plan meals
c Buy food
'répare SO 17; 6 fo od
Prepare family meals
Prepare ov;n meals
Set table
6ash. dishes
r r r r r r r
Employed outside home .16 -.Go .16 , .14 -. 04 .00
Belong to Pi'A — . 04 .07 . 06 -.16 : 6 OS .15 .14
Belong to church organizations .10 .10* .16 . Lf *'"' ; ; ,1 : .01 -.05
Belong to card club -.13* -.09 -.17* - . 0 5 6 - : = - . 0 2 ; -.17* -.01
Beloi. g to other organizations .14 .04 -. 03 .-.00 . : ; .04-- .11 .11
^Significant rt tue .05 level.
w^SiyAficant at the .01 level.
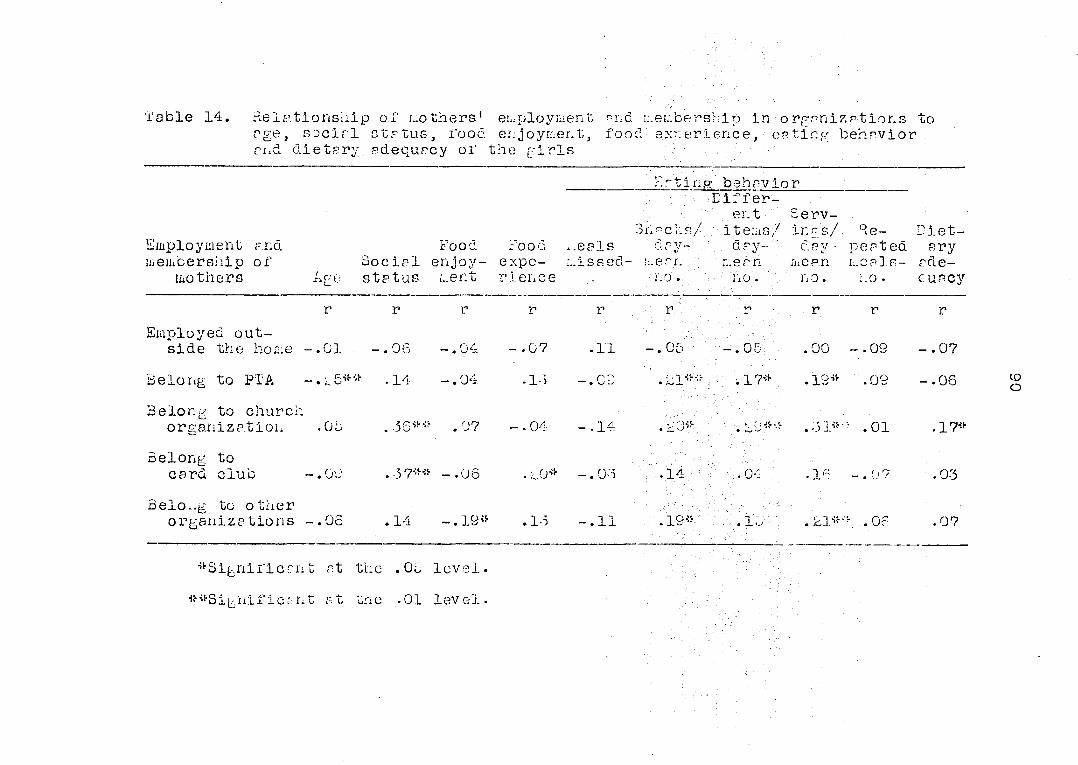
Table 14. Relationship of (..others' employment nnd membership in o rppn i z p-11 o r. s to rge, social g tp tus, food enjoyment, -food-' experience,•• en tin*/ behavior, and dietary, edequncy of the firIs
Ratln r behavior Eiffer-
er. t ServSnacks/ -• items/ ings/ Re Diet
Employment arid Food Food .eels : ôay- day- peated ary membership of Social enjoy expe :..lsseti- n.ean mern mep.n meals- ade-
mothers Age status ment rience no. : llO . no. 2.0 . cuacy
r r r r r r . r r r r
Employed outside the home -.01 -.06 -.04 - .07 .11 -.05: -.05 .00 -.09 - .07
Belong to PTA * . 14 -.04 . 13 -.09 / .17* .19* .09 -.06
Belong to church organization .Ob .36*' * .07 -.04 -.14 . 10* .31* '• .01 .17*
Belong to card club -.Ov .37*-* -.06 . LO* -. 05 ' .14 - 4.04 . 16 -.0 7 .03
BelOi.g to other organizations -.06 .14 -.19* .1-5 -.11 . .19*: .io .21*' \ .06 .07
*Significant at the
»*Significant at tne
.Ou level.
.01 level.

91
were inclined plso to belong to PTA end church organizations
as v:ell. but not to crrd clubs.
Girls who s e mothers were emrloyed outside the home or
belonged to.churcn organizations had mo re resoonsibili ty for
preparation of family n.eals than the other girls. On the
other hand girls whose Loth ere belonged to crrd clubs took
less res... on èlcili t y' for 1 s ':..an the ; iris, whose mothers
did no t bêlons to crrd clubs. heithcr the memcvrshir. of
mothers ' in. Pi A . nor; in ork ani zatio^.s'o ther than those listed ,
:/as '• signifie rati;-: ."rela t ed'.; to my' responsibilities ; stud] ed.
-he relationship of the employment of moth. rs sno their
...em cor snip in organizations to uheir- daughters' eating behav
ior, diet -ry adequacy, age and social s tc tus "re given in
facie 14. hone of the correlations with the variables in
vestigated was signifiernt in relation to ^.enarche so these
correlations were omitted.
Employment of mothers was not significantly related to
any of tne eating ceh-°vio:'S, to dietary adequacy or to the
indepen lent variables studied. Girls whose mothers belonged
to f-A wer- younger than those wnose mothers were not mem-
cers. Ihcse girls also tended to have more snacks, a greater
numcer of different items of food and more servings of food
per day but not better diets than the other girls. Member
ship of mothers in church organizations was significantly
related to social status. Girls whose mothers belonged to

church organizations termed to have more snacks, more differ
ent items per day, core - servings of food per day end more fde
que te diets than [iris whose mothers oid not belong to church
organizations, .-.others who belonged to card clubs tended to
be in the highest.social-status classification and provide
more experience rit.: e greater variety of foods for their
daughters,'i;.an did ...others who did no t ybelong to c^rd clubs.
Girls.whose mothvrs belonged to organizations Mother than those
listed ao-e.-red to enjoy f :od less, have core ..snacks and have
;;.ore servings of food per day than the other girls.
Responsibility for family ceals Information concern
ing the types of responsibilities the girls had for family
ceals and tneir Interrelationships was obtained and the find
ings are presented in facie 15. The relationship of the kind
and amount of responsibility of tne gir ,.s for family meals to
eating, behavior, to dietary adequacy and to the three inde
pendent variables was investigated. To significant correla
tions were found for age, mer:arche or social status so they
.-re omitted from the tacle. The other results are given in
Table 16.
Girls who had responsibility for planning meals usually
had responsibility also for buying foo and preparing meals
but less often for setting the tacle or washing the dishes.
On the other hand girls who set the tacle were more likely to
wash dishes and less likely to plan meals, buy food or prepare
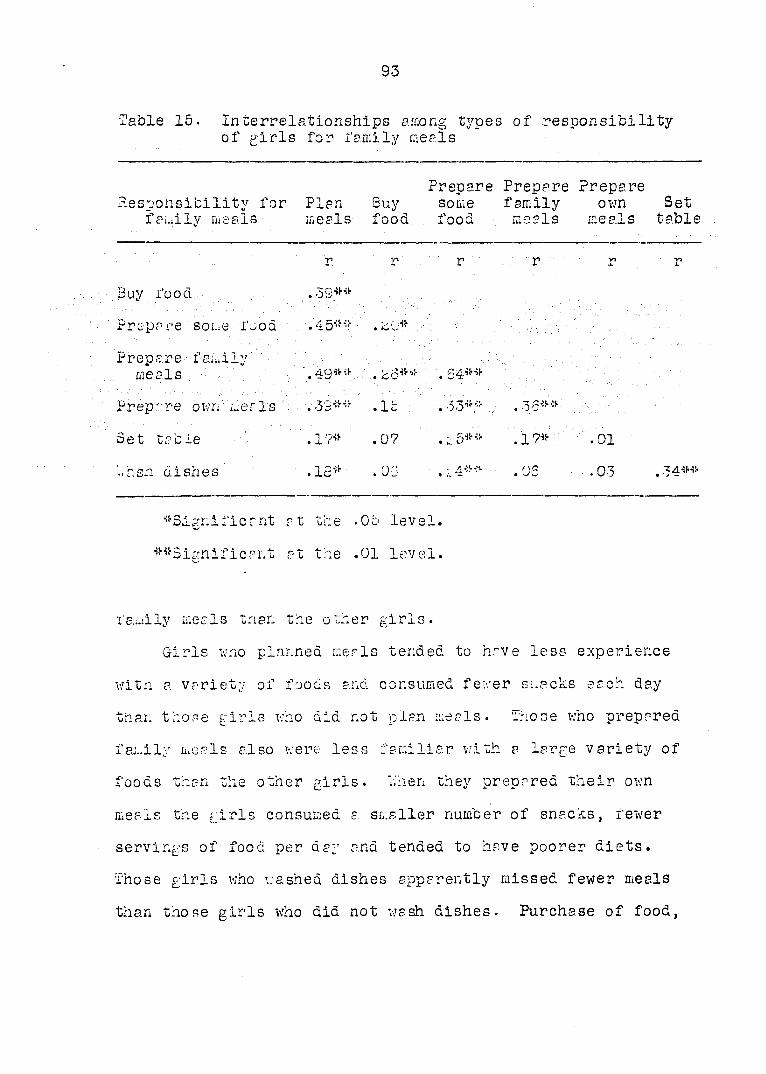
93
Table 15. Interrel of girls
ationships among type for family meals
s of responsibility
Responsibility for family meals
Plan meals
Buy food
Prepare some food
Prepare family meals
Prepare own meals
Set table
r. r r r V» r
Buy food . 39**
Prepare some food '-.45** .%0*
Prepare family meals . .49** .%o* * .54**
Prepare own meals .3S** ' .15 . .53** . .35**
Set table .1?* .0? . 1:5** .17* .01
'..ash dishes . 13* . 00 .i4** .06 .03 .34**
*Significant Ft the .05 level.
"^Significant at the .01 level.
racily meals trier: the o "cher girls.
Girls who planned merIs tended to have less experience
witn a variety of foods and consumed fewer snacks each day
tnan those girls who did not plan meals. Those who prepared
family meals also were less familiar with a large variety of
foods then the other girls, "."hen they prepared their own
meals the girls consumed a smaller number of snacks, fewer
servings of food per day and tended to have poorer diets.
Those girls who washed dishes apparently missed fewer meals
than those girls who did not wash dishes. Purchase of food,
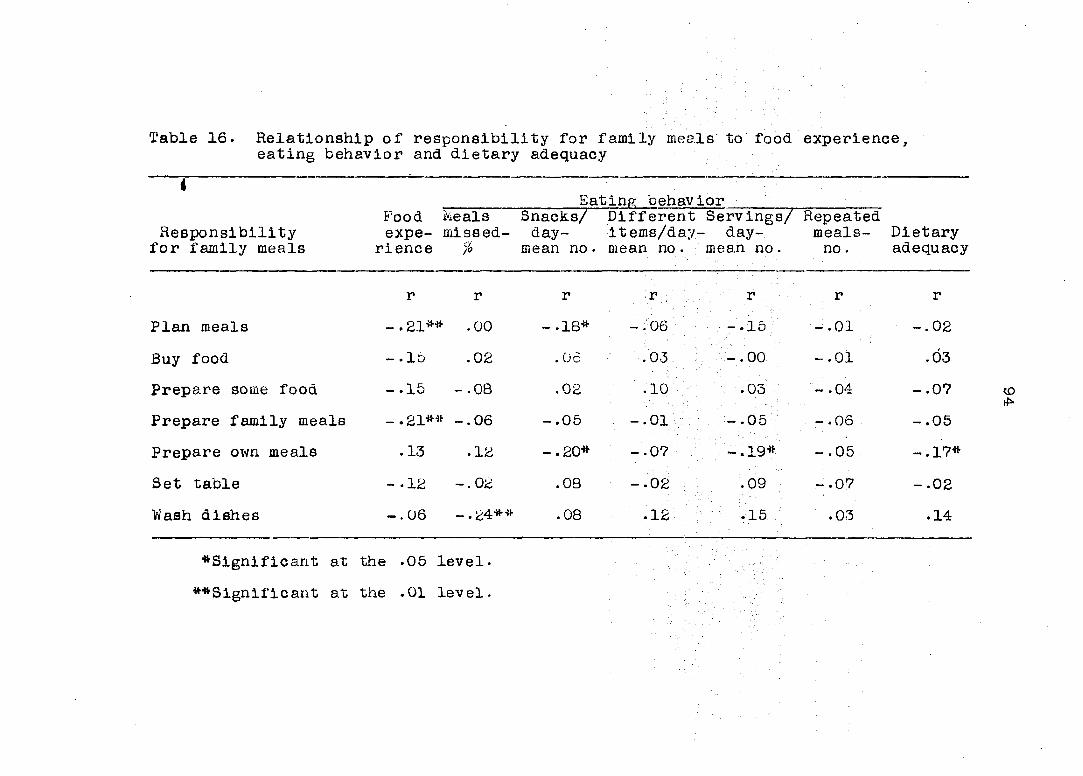
Table 16. Relationship of responsibility for family meals to food experience, eating behavior and dietary adequacy
4 Eating behavior
Food Heals Snacks/ Different Servings/ Repeated Responsibility expe- missed- day- items/day- day- meals- Dietary
for family meals rience % mean no. mean no. mean no. no. adequacy
r r r r ; ; r ••• r r
Plan meals -.21** .00 -.18* -.06 -.15 -.01 -.02
Buy food - . lb .02 .06 .03 -.00 - .01 .03
Prepare some food -.15 - .08 .02 • 10 .03 - .04 - .07
Prepare family meals -.21** -.06 -.05 -.01 - .05 -.06 -.05
Prepare own meals .13 .12 -.20* -.07 -.19* - .05 -.17*
Set table - .12 —. 02 .08 -.02 .09 -.07 -.02
Wash dishes -.06 -. 24** .08 .12 • -15 .03 .14
•Significant at the .05 level•
••Significant at the .01 level.
preparation of some food, or setting the table do not appear
to be related to food experience, eating behavior or dietary
adequacy. The average number of different items of food con
sumed per day end the number or meals repeated in the seven
day period were not related te any of the kinds of responsi
bilities for family meals.
Family criticism. The. possible..relationship of family
criticism about eating habits to eating behavior, adequacy of
diet and the: indeoencer.t variables was studied-. V.c signifi
cant relationships wer-: found for social status with any of
the factors measured so it is omi ,:ted from the table. The
other findings are given in Table 17.
Girls who were criticized for not eating the right foods
tended to have poorer diets and to enjoy foods less than girls
not so criticized. Girls who were criticized for eating too
much tended to be those who were advanced physiologically as
evidenced by their menarcheal status. These girls also en
joyed food less, missed more meals, had fewer servings of
foods ami poorer diets than the girls who were not criticized
for eating too much. They did tend, however-y to have more
experience with a variety of foods than the other girls. Ko
significant relationships were f,,und between criticism for
eating too little and any of the indices of eating behavior
or adequacy of diet. Contrary to what might be expected girls
who were criticized for eating too often did not have more

Table 17. Relationship of f pjnily criticism to age,.social status, menercheal status, food enjoyment, food experience,:erting behavior and dietary adequacy
Catlnp behavior Differ-
Family criticism Age i.enarche
rood enjoyment r
Food e:-:pc-ience
i.eals missed-
Snacks/ v>y-
r>. . no.
ent items/ day-mean •no .
Servings/ day-mean no .
-repeated meals-no .
Dieu— cry ade
quacy
r r r r r r . r r r r
Kot eating right, foods -• OL - .1.5 -.L3** .01 .05 - .13 -. 1 i - .12 - .04 -.21**
Eating too much .06 .20* -.17* . 17* • 20* - • 0 - ; : - .0% - .2'c* ** -.01 -.27**
Eating too little .02 -.10 - .07 -.06 . 01 .09 •0;: .10 .01 .09
Eating too often • Go .11 .02 .00 .19* - .09 - . 09 -.15 .10 - . 19*
Eating too f as t — . 22** .Ob • 14 .15 — . OL : .09 : . .OU .13 : -.07 .01
Eating too slowly .07 - . 03 - .15 . OL .17* .07 .07 -.09 -. 09 - . 18*
Poor table manners • <:3** -.01 .12 -.1L — • 0 L -.09 - .09 .01 . 07 .00
Other criticises .19* -.11 • 15 - . 15 -.14 -.04.. . ; - . 04 -.04 .03 .03
*Significa
**Significa
nt at
nt at
the .
the .
05 level.
01 level.

97
snacks per day. They missed more meals end had poorer diets
than the other girls. Girls criticized for eating too slowly
also missed more mefis end had poorer diets than other girls.
'The younger [iris in the study appeared to ce those who were
criticized for er tir.g too. fast and for' having yoor table
manners
'Some- .significant' relationships were found, for various
types of family criticism;rnd responsibility of the.[iris for
family mesls ; : Criticism for -tin? -'-too'- -often correlated -.15
witn -co-ta- planr.it.:- ' meal's and the buyin^ of food by the girls,
while criticism for citing too much correlated .21 with prep
aration of some food. (See Appendix J, -able 21, Correlation
matrix %.) Apparently girls who ;lrnned meals end bought
food tended not to be criticized for c-ting t,o often while
those that prepared some food were more often criticized for
eatilng too much.
Reactions to new foods Information was obtained con
cerning the relationship .T the reaction of the girls to new
foods rnd their erting behavior, dietary adequacy, the three
independent variables. i'o significant correlations for
menarche, age, mean number of snacks per dry or food expe
rience were found with the other variables so they are
omitted from the table• The other results are given in Table
18.
Girls who refused to taste new foods were inclined to

Table 18. Relationship of reactions to new foods to ec'e, social status, food enjoyment, food experience, u'"tine- behavior and dietary adequacy
Er-tir.p' behavior
Reactions to new foods
Social status
Food enjoyment
i-.eals i.iissed-
Different it ems/day-mean no.-.
Servings/ da.y-
n.ean no.
Repeated mepls-no .
Dietary adequacy
r r r r ' : r r r
Refuse to teste — • 02 - .06 . 26** -.17* -.17* -.05 -.19*
Taste for curiosity - .19* .01 -.Ob - .09 —. 02. .20* -.01
Required to taste - .0% -.10 .03 -.17* — .15. .16 .01
Taste for experience . 21** . 18* - .02 .25** : .17* -.28** .08
CO CD
•Significant at the .05 level.
••Significant at the .01 level.
99
miss more meals, to eat fewer different items of food, to eat
more servings of food each day and to have poorer diets than
girls who did not refuse to taste new foods. When the girls
indicated that they tasted new foods because they were curious
about the taste, they tended to come from the lowest social-
;status class and have more monotonous diets (more repeated
meals) than the other girls. Those girls who tasted new foods
because they were required to do so ate fewer different items
of food each day. On the other hand girls who tasted new
foods for the experience tended to be in the highest social-
status class, to enjoy food more, to eat more different items
and servings of food each day and to have fewer meals re
peated during the period of food intake than the other girls.
Some of the reactions to new foods correlated signifi
cantly with criticism for poor diets. Girls who were criti
cized for not eating the right foods tended to refuse to taste
new foods (r = .20) and to lack curiosity about new foods
(r = -.17).
Interrelationships of factors and Independent variables
Group differences and interactions among the three inde
pendent variables of the study and the factors investigated
for relationship to eating behavior as well as the indices of
eating behavior and dietary adequacy were determined by
analysis of variance. The variables for which significant F
100
ratios were found are given in Table 19. The relationships
for age, menarche and social status to the factors investi
gated are the same as those found by correlations and will
not be discussed again. Only the significant interactions
will be mentioned.
Dietary adequacy and eating behavior Significant F
ratios were found for age and menarche interaction with diet
ary adequacy and eating behavior indices. By plotting the
data it was found that the younger post-menarcheal and older
pre-menarcheal girls or in other words, the earlier- and
later-maturing girls, missed the most meals, had the smallest
number of different food items and servings of food each day
and selected the poorest diets.
Family relationships A very significant interaction
between age, menarche and social status was observed for
family relationships. When the younger post-menarcheal and
older pre-menarcheal girls were of the lowest social-status
class, they had significantly poorer family relations than
other girls.
Adjustment to reality The earlier- and later-maturing
girls were also least well adjusted to reality. Social status,
however, did not enter,into the interaction. *
Sex-role identification A very significant inter
action of menarche and social status was found. The pre-
menarcheal girls of the lowest social-status class and the
post-menarcheal girls of the highest social-status class
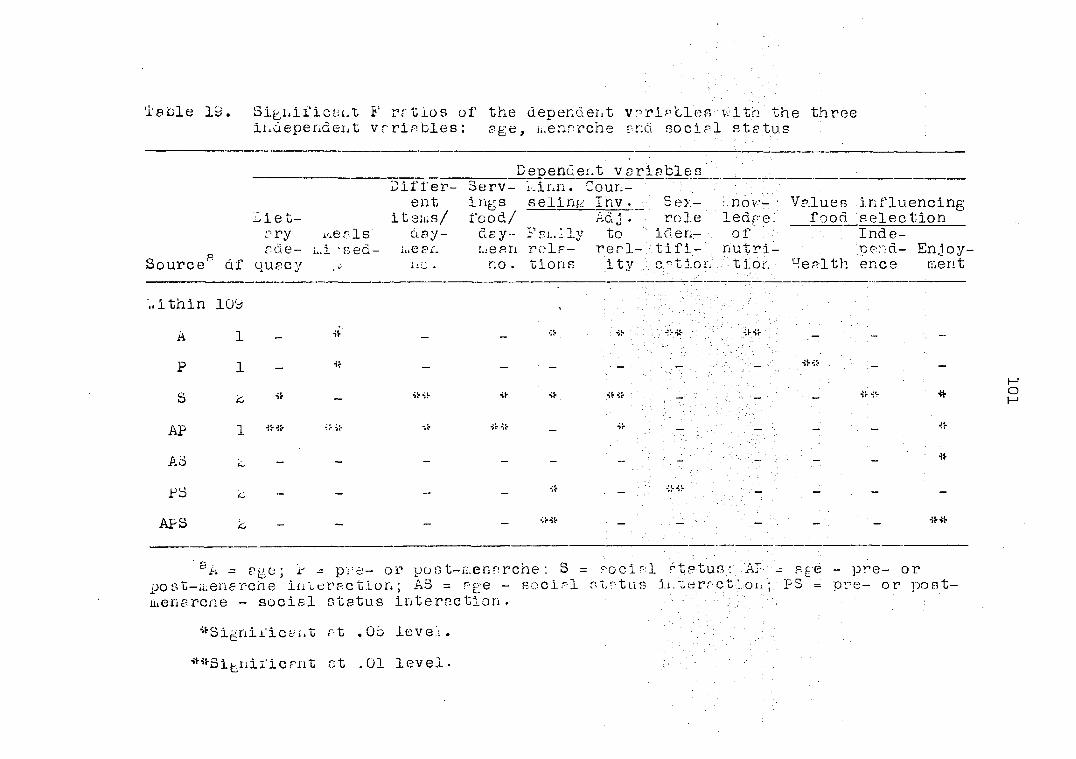
Table 1 Signific^n independen
t F t vr
rat ios ria bles
of the dependent v : age, menarche ?
ari^tles nd social
vlth the three . status
Dependent va riables
Die t-
Different
items/
3erv- I-.inn. Courting s se link' Inv . food/ Ad j.
_ Sex-role
no v- Values ledge: food
influencing selection
Source5 Qf
c ry i-.e a pce- mi - s
quacy
1s ed-
day-mean IiC .
day- Family to Lie art rela- real no. tions ity
iden-- tifi-
cation
of : nutrition Health
Inde-nend- Enjoy-en ce merit
"..i thin 10W •
A 1 •iV -
•* - — —
P 1 _ -if - — — — - —
•••_ si--::-— —
S c •it - •Ir-ii- -ir. ->Hr : . — —
-x *
AP 1 •îHi- -if •ir -ir _ ir *
Ad — — - — — — *
PS /C — — - — —
APS — — -_ -;HS- _
- — — •SH'r
8 A = age; i- = pre- or yost-mennrche : S = roclnl status : AP - age - pre- or post-menerche interaction ; A3 = age - social Rictus interaction ;/ PS •= pre- or postmen arche - social status interaction .
*Signii'icent at .05 lev e t.
"""^Significant at .01 level.
102
Identified most positively 'with their sex-role.
Enjoyment rs a velue in selection of food Those girls
who pieced s. very high value on enjoyment in the selection of
food were primrriiy the older pre-acnarcher; girls from the
upper social-status. CIP.SS . There were snip 11 differences •
s mon g the younger ^ iris but the yo un.; er post-menarcheal girls
au., e :: rea to ce inclined to vr lue enjoyment 1:. the selection "'of
food more, than' the younger pre-u.enarcher-1 girls ..
App- er.tly •:r.•: -r rller- ?..15 er-~turip ri" is were
similar -in their ting cehrvior, adequacy of diet end family
relationships.

103
DISCUSSION
Factors Related to Selection of an Adequate Diet
Phy siolo c-1 c al m aturatidn
saturation appeared to ce highly related to the food
practices ..of . the girls in this .study. Both earlier- and
later-meturing . iris wer.- conspicuous for their poorer eating
cehavior. . For tne earlier-maturine firls the rjicture was
further complicated by the ; tendency tovara s overweight. On
the. other hand the later-maturir.g girls although similar to
the early-maturing girls in their food practices were not
overweight for their age group.
A num.: er of investigators have observed the tendency for
ma turction to occur earlier in , iris who were overweight (10,
zk,j c-3) . G-arn and .-las.iell ( l -i) observed that children who
were overweight at 3.L- to 9.c years of age reached menarche
and tidal union earlier than children of average weight for
their age. The authors stated that the ex tent to which these
children were advanced physiologically and therefore heavier
I'or their chronological age (or were overfat) is not known.
u-arn ( jc) states that weight is an excessively complicated
body measurement. There are fat underweight children and'
lean overweight children. Fatness instead of weight should
be measured in order to determine how many of these children
are really fat or obese.
104
Overweight
Stuart (54) states that overweight of adolescence can be
looked upon as an exaggeration of s normal tendency, possibly
complicated by the particular emotional factors, food habits
or - lack of activity usual at This In the present study
no significant, relationships., were noted between v;eight-for
age classification and, psychological adjustment as measured
by the Minnesota Counseling Inventory (5) .
About half ..of .the girls .'classified, as overweight for
their age expressed concern "bout overeating, and overweight.
The greater the degree of overweight the larger the proportion
of girls who expressed concern. According to the findings of
Frazier and Lisonbee (%1) some children have difficulty
accenting tie physical changes th-t occur at adolescence.
They may be average or litht in v:ei,ht for their age and yet
ce concern:d about overweight. In the study of these investi
gators b5 per cent of the adolescents expressed concern scout
becoming overweight while only 30 per cent described them
selves as ceir.g overweight. In the present investigation,
however, tne ,iris who were concerned about overweight usually
were overweight. Only 5.5 per cent of those expressing con
cern about overweight were light in weight for their »ge.
Girls who were overweight had poor siting behavior and
poor diets. This finding is in accord with the observations
of Eppright and Roderuck (17), Eppright et al. (16) and

105
Hampton et al. (27). Eppright et el. (16) observed that diets
were not poor because of the excess intake of energy foods.
Heavy teen-age girls had lower food energy intake than had
the medium weight girls at breakfast by eight per cent, at
lunch by 10 ....er cent end in snacks by c3 per cent. The
present observations are in accord with the findings that the
overweight adolescent girls consumed diets, which furnished
• lesr, food energy than did girls of normal weight.
Tne activity indices of the overweight girls indicated
a slightly lower mean-energy-expenditure for them than for
the other girls but the difference vas not significant. This
is in contrast to tne observations of Johnson r_t al. (30)
who i'ounc. significantly less participation in active sports
and other strenuous activities by the obese girls than by
their controls.
It would sppe-r th*û within the limitations of the
measurements used in this ntudy overweight among the young
adolescent girls was not associated with emotional problems,
with excessive energy intake from food or with significantly
lover energy expenditure in activities. These findings are
contrary to what would be expected. A possible explanation
may be that curing childhood these girls consumed diets exces
sive in energy value and became overweight as suggested by
Pickenpeugn (44). Upon reaching or ne^ring adolescence and
becoming aware of relation of size to social acceptance, these

106
girls may have been following fed or self-imposed starvation
diets in an attempt to ce more like their leaner peers. This
could account for their diets being low both in nutrients and
energy value during the. study. Possibly dieting was followed
by periods of gorging which would result in a higher food
energy intake over a period of time than wruld be indicated
from the records of food intake Curing the sample, period.
Research with .adolescents ( b ) °-iu-p:ests that some obese
children may have •an "inborn" error which impair? the ability
of the cod y to mobilize stored body u. -his may explain
wny some overweight adolescent girls continue to be heavy
even though the present energy intake from food is low.
whatever the cause of overweight in adolescent girls it
appears to ce related adversely to the quality of the diet.
Psychological adjustment and family relations
Emotional stability, conformity, good adjustment to
reality and good family relationships appeared to be charac
teristics oi' Lirls with tne better food habits. These find-
in,-s are in accord with observations of several investigators:
Hellerscerg (%6), Baldwin (3, 4) end McCarthy (36).
Hallerscerg (c6) found that the type and degree of
maturity of the adolescents were expressed in their attitude
toward family and food. Baldwin (3) also observed that
children who had good appetites, good growth patterns and
107
were well-adjusted tended to come from democratic homes;
those In which there was en accepting attitude towards the
children and where children were assured of the love of their
parents, even if punished. It was assumed that this type of
home would foster good parent-child relationships. A sig
nificant relationship between emotional adjustment of the
adolescents and the kind, of relationships within the family
was found b; Landis. (54).
Conformity as measured in the present study relrtes to.
a.willin^ne-s to accept guidance and is another aspect of
psychological adjustment. In accord with the present find
ings, Baldwin (3) end Chis (4c) observed that conformity is
related to the quality of the diet. Apparently a girl who
tends to accept guidance in other aspects of behavior is
lively to accept it also in relation to e-ting behavior.
A number of investigations have shown that poor psycho
logical adjustment is related to poor food practices, fallen
(58, 59), Go ugh (k,b) and 3 mi th et al. ( 46, 49) found that
subjects who had a large number of food aversions had marked
neurotic tendencies. Smith et el. (49) suggested that re
jecting foods may be a socially acceptable vgy of expressing
fear a no. anxiety. The high relationship between degree of
emotional adjustment and food aversion scores led ..'alien (59)
to suggest that such scores could be used as a screening
device for emotional adjustment.

108
Since adolescence is a period in which girls end boys
need to make many adjustments to changes in their physical,
emotional and social lire, the dynamic relationships between
physical and emotional development are intensiried (39) . It
is understandable that children who deviate greatly in physi
cal maturity may find adolescence a very emotionally disturb
ing period and o.,e. in which psychological problems often .
crise. . - .y''
In accord ;v;ith the present findings Jones and kussen (31)
observed that girls whose m a tu rational status was at one ex
treme or the other had feelings of inadequacy and isolation.
These authors relieved thai, early maturation created a hazard
to the girl's social adjustment while late maturation was
characterized by less adequate self-concepts and slightly
poorer parent-child relationships. Xoore (39) reports similar
findings. He states that rate of maturing is an important
factor in determining behavior and psychological security dur
ing the adolescent years.
A possicle explanation of the relationship between eating
behavior and maturation is based on the assumption that eating
is only one aspect of behavior and it, like all behavior, is
affected by emotional adjustment. Since deviation in ?ge of
maturation may be accompanied by emotional problems, this
deviation may in turn be related to poor eating behavior.

109
Social status
The girls with the better diets tended to come from the
highest of the three social-status classifications. Con
versely, girls with the poorer diets tended to come from the
lowest social-status class. As measured in this study,
social-status classification includes two components : the
prestige rating of the father1 s occupation, which is related
to income, and the educational level of both parents. A num
ber of investigations have shown a relationship between family
income and adequacy of the diet: Wilhelmy et al. (61), Covan
et al. (14) and Boe& (ô). It is only when the income is very
inadequate, however, that it has its greatest detrimental
effect on the quality of the diet. Wilhelmy e_t al. (61) found
no relationship between family income and quality of diet in
their survey of nutritional status made in Groton Township,
New York. These authors suggested that family income was at
a sufficiently high level so that it was not a limiting fac
tor. Lollis (37) also found no relationship between family
income and the quality of diets of adolescent girls. Since
the girls in the present study largely came from middle class
families, income would not seem to be an important factor in
limiting the quality of the diet. It would appear, therefore,
that the second component, namely, educational level of
parents, may be more closely related than income to the ade
quacy of the diets. This suggestion would agree with the

110
findings of Lollis (37) that the quality of the diet provided
for the family was significantly related to the education of
the mother.
Values considered important in the selection or food .
Values function psychologically in directing behavior or
.... they provide a. casis for making choices ( =uG) . Since better
diets -were .-found' among.. Liris who indicated that health was
an impor tant value in directing their selection of food. it
appears tnat. selection of. diet may have a: rational basis, at
least to some degree, '.«hen health wr-s recognized as related
to food chosen, a. course of action v: a s adopted which helped
to influence choice. If this theory is sound, the girls would
need to understand that nutrition is related to health and
also have enough knowledge of nutrition to selv.ct an adequate
_ diet. Since a signifient correlation v.?s found between the
consideration of health as c value and the understanding that
nutrition is important to good health and the correlation of
the value of health with knowledge of nutrition approached
significance, there appeared to ue a tendency for girls who
valued health in food selection also to know more about nutri
tion.
Knowledge or nutrition
The finding that knowledge of nutrition, as measured by
a test of ability to apply nutrition principles in selecting

Ill
an adequate diet, was positively related to good food prac
tices is in accord with the findings of Stone (.53) and Gov an
et al. (14) . ihe letter found that: adolescents with excellent
information about nutritional needs ate the most adequate
diets. Stor.e noted that when there we s improvement in know
ledge of nutrition there was also improvement in food habits.
Ohls, (4kJ, however, found no relationship between knowledge
of nutrition ana quality of. ciet in an investigation of fac
tors related to ' diets of collty e freshmen women . The. differ
ence in finding's might have been due to a difference in type
of H.i.owledge tested. In the' present study the knowledge test
assessed mainly the ability to select an a:,equate diet while
the test used in the OhIs study required more technical know
ledge.
Food enjoyment
Enjoyment of food, as measured by scales designed to
assess degree of liking of food, appeared to characterize
girls who tended to select better diets. Although there was
no significant relationship found between the enjoyment of
food and psychological adjustment as measured by the Minnesota
Counseling Inventory (5), a numcer of other investigations
have shown that more food aversions are found among persons
with neurotic tendencies when among the well adjusted (25,
48, 49, 58, 59). In studying food likes end dislikes of young
children McCarthy (33) found that children classified as

112
feeding problems liked fewer foods and refused to eat more
foods then did the non-pro bien- group.
There pre many facets of food enjoyment which are as yet
poorly understood. . It is known that g"od appetites sccompany
good health in growing children end adolescents. On this
oasis children with fewer worries and anxieties would be
expected to enjoy food more than those with'neurotic ten
dencies. On the other hand' case's have been reported - in 'the
literature where individuals, have , used food. as a means of
relieving' .tension's and- frustrations. It is possicle, however,
that the satisfaction these tense or frustrated individuals
receive is not enjoyment. Psychological adjustment may not
be an important i actor involved in the enjoyment of food.
Factors hot Significantly Related to Sating Behavior
Employment of mother
Employment of mothers outside the home has been suggested
as an important cause for the poor eating behavior and inade
quate diets of children. The findings of this study, however,
indicate that at least for this sample of girls employment of
mothers was not significantly related to eating behavior or
to the selection of an adequate diet.

113
Responsibility for family meals
In nutrition education?! programs ?n assumption is some
times made that girls who prepare meals become more interested
in food and tend to enjoy it more. It is believed also that
this enjoyment would accompany t-.ood f.oc habits. In the
present study the -girls :who had the most responsibility, for
family meals did not indicate a greater enjoyment or food as
measured by -the Food Enjoyment Scales, nor .did they have better
• eyting behavior or tend to select an , adec.u'te diet .. .
Taste sensitivity
Teste sensitivity has been suggested as being related to
the enjoyment and selection of food. For the girls in this
investigation it was not a significant factor in their selec
tion of an adequate diet. Sensitivity to bitter taste, how
ever, was positively related to good eating behavior and the
quality of the diet. This finding may be characteristic just
of this sample.
'•.then the taste solutions were identified incorrectly,
they v;er: confused most often with bitter. It appeared,
therefore, to take more discrimination to identify bitter
taste tha.n sweet, salty or sour taste. Possibly correct
identification of bitter taste is a function of intelligence
as acuity of other senses such as hearing has been shown to
be. Intelligence which was found to be related to social

114
status and quality of diet correlated .12 with identification
of bitter teste. . while a correlation coefficient of .12 is
below the 5 per cent level of significance, the finding sug
gests that there is p tendency towards such a relationship.
A significant relationship was found between sensitivity
to sweet taste and the mean number of snacks per day. A cor
relation of .15 was found c .'tween sensitivity to sweet t^ste
ana percentage of snacks l'urnishinr little nutrition besides
energy .. '.'..hile'" t .is correlation is oelow the 5 per cent. level
of significance,. it may indie'.te ' a tender.cy toward the con- .
suu.ption of high energy foods, many'of which are concentrated
sweets. These findings suggest that a sensitivity- to sweet
teste may account for the predilection of people to sweet
foods as snacks.
Food experience
Although the mean number of different items included in
the diet per day was highly correlated with the adequacy of
diet, food experience as measured by scale designed to
indicate degree of familiar!ty with a variety of food, was
not significantly related to the quality of the diet. Appar
ently the foods included in the Food Experience Scale were
not widely known in this community. These items, therefore,
did not differentiate between families whose diets were varied
and those who had monotonous diets.
115
Activity
Activity es measured in this study res not significantly
related to selection of en adequate diet (r = .13) but did
show a significant relationship to intake of .milk equivalents
and vitamin. C-rich.' foods. The finding? .may su f est that the
more active children were somewhat more inclined to select a
more adequate diet but not significantly so...
Sex-role identification: :
. Contrary .to . the. findings of ..Stone, end. ...Barker ( 5£) and
FrantL et al. (%0) that the more physiologically mature girls,
as determined by menarcheel status, had more heterosexual
interests end icentifled more with the feminine role, the
findings of the prer.ent study indie-ted that identification
with sex-role for this samule of girls wes more closely re
lated to chronological rge than to physiological development.
Perhaps peer-,roup pressure, a chronoloLica1-age related
factor, played a more important role then physiological
development in heterosexual interests of these girls.
In accord with the observations of Frank et £l. (cO)
girls from the lowest sociel-steTus cle^s identified with
the feminine role earlier in their physiological development
than did girls in the middle and highest social-status
classes. These authors suggested that their findings may be
due to tne continual pressures of ambitious or intelligent
116
parents for their daughters to achieve intellectually which
the authors believed had a tendency to block acceptance of
the I'eininine role.
Sex-role identification in the present study did not
appear to be related to eating behavior.
Relationship of Sating Behavior .Indices, to D.iet-ry Adequacy :
The amount • of food, -e^ten,' numcer of, serving? per :lay;
variety ir; : the diet, number of . different 'items of food con
sumed per day; and the percentape of meals miased were sig- .
nificantly related to the quality of the diet but consumption
of s ne c/is had no relationship to diets ry adequacy. As many
girla with 'good diets as with poor diets had snacks. The
consumption of high-energy low-nutritive-value foods was sig
nificantly related to adequacy of diet. Apparently girls
who consumed t.ie most rood tended to have the best diets and
the quality of the snacks did not relate' adversely to the
diet.
Or t.ie three kinds of foods studied as eating behavior
indices, only the intake of milk and milk equivalents corre
lated higher than .50 with the adequacy of the diet for both
seasons. As compared witn the correlation of dietary ade
quacy with milk consumption, correlations with intakes of
csrotenoid-rich and vitamin C-rich foods were much lower,
though still highly significant. The intake of vitamin C-

117
rich foods, however, was more highly correlrted with the
selection of an.edequate diet then we s the intake of caro-
teno id-rich foods. These findings are in accord, with those
of the earlier .study, of Iowa children . ( 15) in which it was
found that the greatest differences between diets that met
or exceeded the Recommended Dietary Allowances of the Nations!
nese-rch Council for -iris and those considered Inadequate V
I.ere in. the- use; of &ilk, ascorbic acid-rich and cr^rotenoid-
rich fruits and vegetables. The very highly consistent rele-
tionsni of milk .intake:: to diet pry .adequacy in the two sam'oles
subtests t.:at tha intake of mi Ik c.ay be a fairly reliable
index of t.ie adequacy of diet for tnis "re /roup. This • is
of practical importance because information -bout milk intake
may be more easily and reliably obtained thai. i;.formation on
the diet as a. whole.
Seasonal Variation of Eating Behavior and Dietary Adequacy
Food practices were studied during the summer when school
was not in session and trie following Fecru.rry during the school
week. Diets were significantly more nutritious in February
than during the summer; as compared with the summer all of
the indices of eating behavior improved during the winter.
The mean numcer of different items and servings of food per
day were higher; the intake of carotenoid-rich foods increased
from 0.1 to 0.4 serving per day; the intake of vitamin C-rich
us
foods increased from 0.4 to 0.5 serving per day; end milk
servings from 1.9 to £.7 per day. Correlations of the mean
number of servir^ s of vitamin C-rlch and crotenoid-rich
fruits end vegetpules with dietary adequacy • were higher in
the winter trien in the summer. The intakes of these foods,
therefore, were more .important to the quality of the diet in
the winter. A; pa rei.tly fvods otner t .an tno're hign in
ascorcic- acid and carotene ma h e more of " contribution to the
adequacy of t:_e c.iet in th?. su:..mer tha:\. in the winter.
In vxh.r Lucy of l?C!children from four to 15 years of
a^e Youn, el si. ' ( o-i; found no significant differences between
intake of nutrients in the fall and sprir.?. In tne present
st. cy it is questionable whether the finding of better diets
in the winter is due to a true rep sons1 difference or a dif
ference brought acout by char.; es in habits cf living and per
haps participation in the school lunch . to gram. The girls
tended to e- t mo re regular morning and evening meals with
their i a mi 11%: s during the school year than curing the summer.
Only half an hour was allowed for lunch --1 school and nearly
all of tne girls 'te the school lunch.
Implications for Educational Programs
From the present inverti^-tion it would appear that eat
ing practices of girls *re interrelated with their maturation,
knowledge, values, social status, personal adjustment and
119
family relations. To be effective nutrition education must
consider these complex interrelationships.
Knowledge of nutrition
Scores on knowledge of nutrition test were found to ce
favorably related to the selection of en Adequate diet by the
girls, in .this, study . -. The finding suggests th^t eating behevio
may heve, e' t ' 1er st in prrt,.e . tionel'basis .'•• It should be
possible, therefore,, to improve ertir.g behrvlor of girls this
oge through' nutrition education. Information is needed, 'how
ever, concerning tne type of rn eductionrl progrrm which
will be effective in bringing' ebout good food he cits'. Some
resesren lies Cv.cn done ir, t.:is rree but more is needed (35).
Health es en importent vglue in selection of food
In the present studv her1th >s e velue in the selection
of food eppe;' red to eccomprny a more edecuete ci^t while the
values of status, sociability, independence er.d enjoyment in
fooc. selection were related to poorer food hefcits. Fersonsl
values provide r cesls for meking choicer end, therefore, they
should not be overlooked in en educational progrem in nutri
tion. Since childhood end edolescence ere very importent,
periods of value formation, it is importent during these
formetive ye^rs thet emphesis be given to the velue of heelth
in nutrition education.

120
Once values have been adopted, they are difficult cut
not impossible to change. According- to Turner ( 57) major
changes in values are Lore difficult to make unless the indi
vidual is convinced thru such changes Kill contribute to his
state oi' v:ell-ceir;L. „• This author found that under such cir
cuits tances individuals made a conscious charge in their values
even w/:e:. opposition stooc. in their v.ay.
• It'appears, therefore, th"t educational prop ra:;/s.,. should - '
be planned to convince, children thr.t -health, is important to
their; well-béinj-thai-' nutrition . affects health °nc , there-'
fore, health - should c;- considered in selection of food. Lore
information than is now available is heeded to the kinds
of leari.i..c experiences which will result in health being
held as an important value.
Overweight and concern about overwe 11<ht
Adolescent girls appear to ce very conscious of their
weight. T:;is is a period of development in which there is
so... e tendency to gain weight that may be KO re evident in early
maturing girls than others and may cause them undue concern.
3-irls who rre overweight for their are may be more acutely
aware of their size during adolescence when they are becoming
more interested in heterosexual experiences.
Schools and family physicians should be encouraged to use
better methods of determining obesity than the use of scales
121
alone. Perhaps the possibility of having skinfold measure
ments taken by a trained technician should be investigated
for inclusion in rchool health programs. The girl may be
physiologically advanced end, therefore, her.weight should be
compared with girls of her physiological rather than her
chronological age in .determining, whether she is overweight.
Girls ;;ho are overweight ne eh to have information on good
nutrition and sound..Méthode, of weight reduction, kore in
formation is needed about ' the. "effect of tile ver": low intake
of energy necessar; . for reducing: the weight of :adolescents:
if it proves that tne overweight can be traced to a metabolic
defect.
For successful v eight reduction there is reason to be
lieve t'rr-t considerable emotional support and understanding
oi' the nrob _em is needed by the overweight -c rson. By making
weight a moral issue end by impossible expectations of weight
loss, psychological :roclems can be precipitated. Successful
wei-::t loss may also be related to emotional adjustment.
Su~mersld.il and Darling (55), finding that emotional adjust
ment was related to dieting -;„e r:>.::r.ce, suggested the use of
a, psychosomatic inventory to determine those persons emotion
ally able to participate in rigorous dieting. Those elimin
ated by such an inventory may need psychiatric therapy before
or during dieting in order to lose weight successfully.
Overweight is a complex condition and all facets of the
122
problem must be taken into consideration in planning for its
correction. Teachers end counselors.may need some assistance
from specialists in guiding overweight adolescents, especially
the earlier-maturing girls. Even though overweight is a com
plicated problem, consideration needs to be given to it in
plannii.v a successful educational program in nutrition for
adolescents.
Physiological maturation -
Since considerable deviation from, the average ir. age of.
maturation is accompanied by poor nutritional practice, an
effective educ-r tional program in nutrition must give consider
ation to maturation. Adolescents need to understand the
process of rowth and development, the meaning of variation
from the average and the part played by nutrition in attain
ing' their genetic potential. Possibly girls whose maturation
differs markedly from the average should ce observed care
fully and given counseling as needed by an adequately trained
counselor.
P sy cho .LP;/leal a d.1 ustment
Poor psychological adjustment adversely affects all be
havior, including rating behavior. Helping children to under
stand and accept themselves and to make a satisfactory adjust
ment to society is a very important aspect of any educational

123
program in a democratic setting. Teachers and parents can
help children learn to respect themselves as individuals and
to assess their own worth. This would require capable
teachers who. themselves could accept children as they Pre
without trying to impose their own standards of behavior on
them and who are sensitive to the opportunities to help
children,: 'Trained guidance;counselors sight work with both
teachers end pupils in the free of psychological adjustment.
Family relationships
Since good family relationships are related to good food
a&bits, a ;.to, rsui for nutrition education should consider the
home environment of the adolescents. Some means of reaching
the parents should ue devised to help them understand the
problems of adolescents and to provide a more relaxed whole
some and healthy home environment. Programs of education for
adults should also include information on menu planning to
meet nutritional needs of family members and on weight control.
Social status
The fact that social status was found to be positively
related to good food habits has implications for nutrition
education. I,hi le the objectives of an educational program
may not be to upgrade the social status of the children, it
can provide knowledge end guidance for making better food
124
selections within the limitation of 'family income. To what
degree the adolescents will be able to apply their knowledge
of nutrition will depend somewhat on their relationships
'with' their mo chers and the amount of responsibility the girls
have for planning family meals.

125
SULMHÏ AND CONCLUSIONS
A sample of 140 girls 12 to 14 years of age was selected
from Boone, Iowa, .X'„or a study of physiological, psychological
and sociological factors, which may be related to eating be
havior and selection of an adequate diet. The sample was
controlled for chronological age, social status and menarche.
Ah effort was made to select approximately equal numbers of
girls who had and had not reached menarcr.é for erch age group
divided among three social-ntatus categories. This experi
ment s.l-: design resulted in 16 -roups. Social-status classi
fication vas determined from the rather1s occupation and the
educational level of both parents.
Information vas obtained by means of questionnaire, food
intake records taken in summer and winter, activity records,
certain physiological measurements, taste threshold tests,
food enjoyment scales, a test of nutrition knowledge and
inventories of values and psychological adjustment. Analyses
of variance and intercorrelations were employed in the treat
ment or the date.
The girls in the study came from relatively stable,
largely middle-class families. All lived in a town of
approximately 14,U00 and the majority had lived there most
of their lives. About one-third of the mothers were employed
outside the home, cut only approximately eight per cent were
employed full time.
126
The subjects were classified according to their weight
and age into seven groups using the Physical Growth Record
for Girls, namely : very light, light, moderately light,
average, moderately hervy, heavy and very heavy. Of the 140
subjects 18.6 per cent were heavy or v-ry heavy and 6.4 per
cent were light or very light.
Each girl kept "s record of her ' activity', for a' week' 'durin
the summer I'rom' which an activity index was computed. The
14-year-old.girls tended to ce more active than the younger
ones, cut not significantly so.
Eating behavior indices used in the study include per
center e or meals missed, snacks, intake of different items of
food, number of servings of food per day, repetition of meals
intake of fruits and vegetables rich in carotene and vitamin
0 and of milk and equivalents and the caloric value of the
nutrient-poor foods. Dietary adequacy was given as a score
which represents the percentage of the recommended number of
servings of foods in the basic food group plan which were
eaten each day representing the average of the percentages
of the nutrients of the Recommended Dietary Allowances of the
National Research Council which were being met.
Intake of food was recorded for seven consecutive days
in the sui.rn.er of I960 and for three consecutive days during
the following February. The intake of milk, carotene- and
citamin-C-rich fruits and vegetables was low. The group

127
neither tended to miss a large number of meals nor to consume
a large number of snacks. The diets end eating behavior were
significantly better during the winter than during the summer
period
Relationships were investigated of eating behavior and
dietary adequacy to /hysiological development and rate of
maturation, sex-role identification, values considered impor
tant in selecting foods, knowledge of nutrition, fooc. enjoy
ment , .food experience, psychological adjustment and the three
independent variables of the study: age, social status and
menarche.
PhysiologicPl maturity was estimated from bone-age-to-
chronological-age ratios and menarcheal status. As compared
with the less mature, the mere mature girls were inclined to
be heavier for their age group, to be more concerned about
overweight, to miss more meals and to place a lower value on
health in selection of food • Girls who were teller for their
age tended to have better diets than those who were shorter-
They also performed better on the nutrition knowledge test.
On the other hand, when girls were heavier for their age they
tended to miss more meals and to hrve poorer di->:ts than the
lighter girls.
Thresholds were determined for the detection of the four
basic tastes : sweet, sour, bitter and salty. No relation
ships of teste sensitivity to eating behavior and dietsry
128
adequacy were observed except that sensitivity to sweet teste
was significantly related to the mean number of snacks per
day.
Ko. significant relationships were noted between activity
indices and eating behavior or adequacy of diet.
By Leans of an inventory, scores were obtained to repre
sent , the importance attached to the values of health, sociabil
ity, independence, status and enjoyment in selection of food.
Girls who placed a high value on health in selecting food
tended to have better diets, to 'mios fewer meals, to enjoy
food and to be less concerned about overweight than the
others. Ihey belonged to the higher social-status groups,
and, in choosing food, considered less important than health
the values of sociability, independence, status and enjoyment.
On the other hand those who scored high on the four values
of sociability, independence, status and enjoyment tended
to select poorer diets. These values were found more often
among the girls of the lower social-status class then among
the hi,_her.
As compared with girls who r--ted low on the Food Enjoy
ment Scales, girls who enjoyed food more tended to have better
diets, to be less concerned about overweight, to be in the
lower or medium weight-for-ege classifications and to be in
the highest of the three social-status classes in this commu
nity.
129
Knowledge of nutrition, as determined by a test measuring
ability to apply information In selecting meals, v.-a.s signifi
cantly related to dietary adequacy. The girls who scored
higher on this "knowledge" test also tended to miss fewer
meals.
In the analyses some measures proved to be highly inter-
•'correlrted.. and individually correlated similarly with others.
Such measures were -grouped and.treated statistically as clus
ters. These clusters were correlated'with dietary adequacy
and such indices of:eating behavior as number of meals missed
and number of snacks per day.
One cluster included d^ta indicating overeating and con
cern reçut overweight together with welght-for-ege classifica
tion . Ir. this sample, the girls who were concerned about
overweight tended to ce in the upper weight-for-age classi
fication and were more advanced physiologically than those
who did not score high in this cluster. They were inclined
to have poorer diets, to miss more meals, to enjoy food less
and to value health in food selection less than the other
girls .
Two clusters for psychological adjustment were made from
the seven scales of the Minnesota Counseling Inventory. One
cluster consisted of the scales for Social Relation-. Kood
and Leadership and was designated 'as Interpersonsl-snd-Peer-
G-roup Relations. The other contained the scales for Adjust
ment to Reality, Emotional Stability, Family Relations and

130
Conformity end was called Personal-Adjustment-and-Family-
Relations. Ko significant, relationships were found between
the cluster for peer-group relations and dietary adequacy or
eating behavior indices except that the higher the score in
this cluster the fewer the meals missed. In contrast those
girls who had better personal adjustment and family relations
had. cetter aiet"./ missed, fewv:r meals, had more experience
with a variety of foods than those who did not score high in
this cluster, family relations and emotional stability,
therefore, àppetrred to: ce more closely associated with eating
behavior then leadership end peer-group relations.
Daughters of employed mothers tended to h=ve mo re re
sponsibility for family meals than daughters of mothers who
were not employed. I.either employment of mothers nor the
responsibility of KirIs for meals was significantly related
to eating behavior, enjoyment of foods and dietary adequacy.
A significant interaction was found between age and
menarche for dietary adequacy end all indices of eating be
havior. The young post-men a r che a1 or the early-maturing
girl, and the older pre-menarcheal or late-maturing girl,
had poorer diets than the others. These girls also had. a
poorer adjustment to reality and valued enjoyment very highly
when selecting; food, '..hen these groups, the early-maturing
and late-maturing girls, were in the lowest social-status
class they had the poorest family relationships. Apparently
131
the early-maturing and late-maturing girls in this study were
somewhat alike in their eating behavior as well as in some of
their other behavior patterns.
.From the findings of this study it appears that the young
adolescent girl with a good diet can be characterized a s one
who is average in physical development and weight, h?s good
.personal adjustment and family relations, values health in
food selection, has some knowledge of nutrition end comes from
the highest of the three social-status classes.
Some of the observed significant relationships th°t seem
especially pertinent for consideration in nutrition education
•c re as follows :
1. Knowledge of nutrition rs indicted by a test de
signed to ascertain ability to apply principles to
selection of an adequate diet was favorably related
to nutrition practices .
When health was considered an important value in
selecting food, diets tended to be adequate but
wnen status, sociability, independence and enjoy
ment r: ted hiÊh in food selection poor food prac
tices resulted.
3. Overweight and concern about overweight were found
concurrently with poor eating behavior and inade
quate diets.

132
4. Early maturation v;es positively related to poor
eating behavior and -overweight; late saturation was
also positively related to poor eating behavior but
not to overweight.
5. Good family relations and personal adjustment seemed
to accompany good eating behavior and selection of
: .an'- adequate '• diet;.
6 : "Social .suatua v.-fs positively rel:-ted to good eating
: behavior. .. .
' The ..findln.- s of. this atudy indicate that the eating prac
tices of iris are interrelated -with their maturation, know
ledge, values, social status, personal adjustment and family
relations. To be effective nutrition education must consider
these ccmulox interrelationships.
133
LITERATURE CITED
1. American kedical Association. Joint Committee on Health Problems in Education. Physical growth record for girls. Chicago, Illinois, Author. 1949.
£. Anderson, Elizabeth Daley. The influence of previous nutrition education on the dietary of selected college students. Unpublished k.S. Thesis. Luc-cock, Texas, Library, Texas Technological College.
1S69- : :
3. Baldwin, Alfred L.; An analysis of children's eating habits. Journal of Pediatrics. £5:74-78. 1944.
4. Baldwin, Alfred L. An analysis o':' some aspects of feed-• :.ing behavior. Journal of Genetic Psychology. :
66:kcl-23£. 1945.
"5. fîerdie, ?.. ?. arid Valeur L. Lay ton. kinnesota Counseling Inventory, hot: York, The Psychological Corporation. 19 57.
6. Book, J can k. Dietary intake and social characteristics. American Journal of Clinical nutrition. 4;%39-c45. 1S56.
7. Breckenrid^e, i-.arian E. and Eh Lee Vincent. Child development. 4th ed. Philadelphia, "v. 2 . Saunders Co • 1960.
8. Burchinai, Lee. Sex-role identification scales. (kimeographed) Ames, loi-;a, Department of Sociology, Iowa State University of Science and Technology, circa IS58.
5. Burchinal, Lee . Desire for food scale. (kimeo-grapned) Ames, Iowa, Department of Sociology, Iowa State University of Science and Technology. circa 1953.
10. Sruck, Hilde. Ocesity in childhood. IV. Energy ex-pentidure of ocese children. American Journal of Diseases of Children. 50:1082-1100. 1940.
11. Calhoun, Deasy Leila. Socio-economic status and par- • ticipation in poliomyelitis vaccine trial. American Sociological Review. 21:185-191. 19 56.

134
Chalmers, Faith Y;., kary k. Clayton, Lrraine 0. Gates, Ruth E. Tucker, Anne YJ. v/ertz, Charlotte K. Young, and V,'alter B. Foster. The dietary record - hoi»; many and which d^ys? Journal of the American Dietetic Association. 28:711-717. 1952.
Coburn,-Jessie Ardelle. Adaptation of an inventory to determine values used by twelfth-grade girls in selecting food. Unpublished k.S. Thesis. Ames, Iowa, Library,-lows State University of Science and Technology. IS 51.
Govan. Suri, Francise a Go, Richard Konicek, and Richard Runee. Study or adolescent food habits in rural, suourcan and urean communities. Progressive Edu-c'tlon: 31:244-245.. 1954.
Epp right,'; Ere el S. ; Food habits and preferences; a study of Iowa oeo'ole of two age grouos. Iowa Agr. Expt. 3ta. 3ul. 375. 1950..
Eppright, Ere el S., Irma Coons, ri:d Emi 1 Jece. Very heavy and oeese school children in Iowa. Journal of Home Economics. 48:158-172. 1955.
Eppright, Ercel 3. and Charlotte Roderuck. Diet and nutritional status of Iowa school children. American Journal of Public Health. 45:454-471. 19c5.
Eppright, Ercel 3., Virginia Sidweil, and Emi1 Jebe. Food intake and body size of Iowa children. In Y,eic ht control : a collection of papers presented at the '.eight Control Colloqium. pp. 119-131. Ames, love, The Iowa State College Press. cl955.
Eppright, Ercel 3. and Pearl P. Swansor.. Distribution of calories in diets of Iowa school children. Journal of the American Dietetic Association. 31:14.-148. 1955.
Frank, Lawrence L., Ross Harrison, Elizabeth Hellers-berg, £<ren kechover, and kete Steiner. Personality development in adolescent girls, kono graph of the Society for Research in Child Development. 15: 1-316 • 19 53.
135
Frazier, Alexander and Lorenzo K. Lisonbee. Adolescent concern with physique. In Seidman, Jerome, ed. The adolescent ; p book of readings. Rev. ed. P'O. 140-150. Hew York, Holt, Rinehart and Winston, Inc. I960.
Gam, Stanley k. Growth and development.. In Ginsberg, Eli, ed. The .nation1 s children. Vol. £. p;;. £4-4£. New York, Columbia University Press. 1960.
Garn, Stanley k. and Joan A. Haskell. Fat thickness and developmental status in childhood and adolescence.
. Jouri.pl o'f "Diseases of - Children. 90: 745-751. 19 SO.
Go o ah ? r t, Rocert- 3.' So u. e coents on the American diet .end household consumption data. . 'Journal of Clinical T.uLri Lio:.. 7: cuz-cl 5. 1969.
Go ugh, . H. G. An additional study of food aversions. 'Journal of Abnormal and Social Psychology. 41: 25-E8. 1945.
Hsllerscerv, E. F. Food habits of adolescents in relation to family training .and present adjustment. American Journrl of Orthopsychiatry. 15: -34-51. 1948.
Hampton, .-.rry 3., Leon? R. Shapiro, and Ruth L. Huene-mcnn. Helping teen-age girls improve their diets. Journal of Home Economics. 53:355-839. 1951.
Harding, Lowry The value-type proclemmaire• Journal oi' Social Psychology. 19:115-144. 1944 .
Heal:-, Felix. Obesity and physical fitness. nutrition Education Conference Proc. To be published circa 196%.
Johnson, kary Louise, Bertha 5. Bsrke, and J. kayer. Relative importance of inactivity and overeating in the energy balance of obese high school girls. American Journal of Clinical i'.utrition. 4:-37-43. 1956.
Jon_s, x-.ary Cover and raul Henry kussen. Self-conceptions, motivations, and interpersonal attitudes of early- and late-maturing rirls. Child Development. £9 : 491-501• 1958.

136
32. Kralj-Cercek, Lia. The influence of food, body build, and social origin on the age at menerche. Huma# Biology. 28:393-406. 1956.
33. Laird, D. A. and . J. Breen. Sex and age alterations in "caste preferences. Journal of the American Dietetic Association. 15:545-550. 1939.
34. Landis, Paul H. The families that produce adjusted . adolescents. The Clearing.House. 29: 537-540.
1955.
35. Lewin, . Kur't. Forces behind: food habits and methods of changes. National Research Council Bui. 108. 194 5.
Lev;in, Kurt". The relative effectiveness of a lecutre , method a nr. n method of groun decision for changing food h s cits.' ( kimeographed) '..'ashing ton, D.C., Committee on Food Habits, National Research Council. June, 194%.
Lollis, -mily Shirley. Some factors influencing the dietary hacits of adolescent girls• Unpublished k.S. Thesis. Norman, Oklahoma, Library, University of Oklahoma. 1960.
36.
37.
38. kcCarthy, Dorothea. Children's feeding: problems in relation to Food aversions in the family. Child Development. 5:277-^84. 19 35.
39. koore, Douglas k. Developmental concordance and discordance during puberty and early adolescence, konograph of the Society for Research in Child Development. 13, No. 1:1-122. 1955.
40. korgen, Agnes F. Nutritional status, U.S.A. Calif. (Berkeley) Agr. Expt. Sta. Bui. 769. 1959.
41. North, Cecil C. and Paul Matt. Joes and occupations: a po'oular evaluation. Opinion News. 9, No. 4: 3-13*. 1947.
4%. OhIs, Gunnel I. Factors related to diet of freshmen women at 1 ov;a State University. Unpublished k.S. Thesis. Ames, Iowa, Library, Iowa State University of Science and Technology. I960.
137
43. Peryam, David B., Bernice VI. Polemis, Joseph i»i. Kemen, J ail Eindhoven, and Francis J. Pilgrim. Food preferences of man in the U.S. Armed Forces. Chicago, 111., Quartermaster Food and Container Institute for the Armed Forces. 1960.
44. Pickenpsugh, kelba 5. Nutrlture of school girls of very heavy and of medium physiques. Unpublished k.S . Thesis. Ames, Iov;a, Library, Iowa State University of Science and Technology. 1257.
.45. Pilgrim,. E. J,, and H. J. Schutz. Monotony in food acceptance. American Psychologist. 10:503. 1955.
46. Richter, C. p. and K. H. 'Campbel.,. Sucrose taste thresholds of rats and humans. American Journal of
.physiology. 129:291-297. 1939.
47. Siegel, Paul 3. The repetitive element in the diet. American Journal of Clinical Nutrition. 5:162-164. 1957.
48. Smith, '..end ell I., Elizabeth %. Povell, and Sherman Ross. Food aversions: some additional personality correlates. Journal or Consulting Psychology. IS:14C-149. 1355.
49. Smith, Wendell I., Elizabeth i:. Powell, and Sherman Ross. Manifest anxiety and food aversions. Journal of Abnormal and Social Psychology• 50:101-104. 1955.
50. Stearns, Genevieve. Nutritional state of the mother prior to conception. Journal of the American Ledi-cal Association. 163:1655-1659. 1958.
51. Stiebeling, Hazel K. and The lia s A. Breis. Habit - and more. United States Department of Agriculture. Yearbook 1959: 6-31-535. 19 59 .
b'c- Stone, Calvin P. and Roger C-. Barker. The attitudes and interests of premenarcheal and post menarcheal girls. Journal of Genetic Psychology. 54:27-71. 1939.
53. Stone, William. Nutrition instruction and food habits. The Clearing House. 25:387-391. 1951.

138
54. Stuart, Harold C. Normal growth and development during adolescence. In Seidman, Jerome, ed. The adolescent ; s book of readings. Rev. ed. pp. £5-115. New Yor,., Holt, Rinehart and Winston, Inc. 1950.
55. Summerskill, John and Douglas Darling. Emotional adjustment and dietary -performance. Journal of Consulting Psychology. 13:151-15-5. 12-3 5.
55. Thomas, Ruth Uhler, Hazel ketz Fox, Harriet J. Nelly, Sloise E. kayer, and Icie C-. i-.acy. Rapid method .for cur-litative appraisal of fooc intakes of groups.' Journal of the American Dietetic Asrocia-tio:.. 30:8o5-b?l. 1954.
57. Turner, Ralph H. The experience of vertical mobility . and personal values. Research Studies', State Col-
. .lege of Washington.. 19:89-92. .1951.
55 . './aller., Richard." Food aversions in:'.behavior disorders. Journal of Consulting Psychology. 12:310-312. 1948.,
59. ..'alien, Richard. Food aversions of normal and neurotic males. Journal of Abi.orm*! and Social Psychology. 40:77-21. 1945.
50. whitehead, Floy Eugenia. How nutrition education can affect adolescents1 food choices. I. With and without one year's nutrition instruction; II. With and without two year's nutrition instruction. Journal of the American Dietetic Association. 37: -348-355. 1960.
61. Wilhelmy, Odin, Charlotte, k. Young, and Helen L. ?il-cher. Nutrient status survey, Groton Township, New York. III. Nutrient usage as related to certain social and economic factors. Journal of the America;. Dietetic Association. 25: 858-87-3. 1950 .
6c. Young, Charlotte k., Nathleen Barresford, and Betty G. Wsldner. What the homemsker knows about nutrition. III. Relation of knowledge to practice• Journal of the American Dietetic Association. 32:321-327. 1956.
63. Young, Charlotte k. and There se D. LaFortur.e. Effect of food preference on nutrient intake. Journal of the American Dietetic Association. 33:98-103. 1957.

139
Young, Charlotte k., Vivian Llghtbody, and Betty F. Steele. Fell and spring diets of school children in Keiv York State. Journal of the American Dietetic Association. 27:222-292. IS51.

140
ACKNOWLEDGMENTS
Sincere appreciation is expressed to Dr. Ercel S.
Eppright end Dr. Hester Chsdderdor. for their inspiration
and helpful guidance throughout the present investigation
and in the preparation or this manuscript ; to Dr. Leroy
Wo 11ns- for his. assis tance in, planning the study and in
analyzing the da ta;'.;; to -1rs'., Thelma Leonard and the students
: of Central Junior High School, Ames, love, who assisted in
the pretesting of the various tests and measurements used in
this Investigation; to ..r: Glen koore, Principal of Boone
Junior and Senior High School, Boone, I ox-: a, for his splendid
cooperation and assistance; and to the girls in Boone, Iowa,
who participated in the study.

141
APPENDIX A
Social Status Classification
The Morth-Hatt Scale which was developed to give a rank
order of the prestige of SO occupations was expanded by
sociologists at the State University of Iowa and was used to
assign a.numerical value to the occupations of the girls'
f'atners. . These, values ranged from 40 to 95. The occupations
ranked between these numbers were divided into 11 approxi
mately ecual groups and assigned a numeric;"! value from 1-11.
The educational level of"each parent was ascribed a value
as follows :
1. Elementary school through the ninth grade-1. Tenth-eleventh grade. 3- High school graduate. 4. Some college eudcation or advanced acacemic training
such as business. o. College graduate. 6- Some post college education.
A score for each girl was obtained by the following
formula:
Social Status = £X + Y + Z X = numerical value of father's occupation Y = numerical value of father's educational level Z = numerical value of mother's educational level
The scores ranged from 4 to -30. On the basis of their rank in
the group the girls were separated into three approximately
equal groups. The scores of the lowest social-status group
ranged from 4 to 14, the middle group from 15 to 18 and the

142
highest group from IS to -30. There were 71, 73 and 71 girls,
respectively, in the three categories.
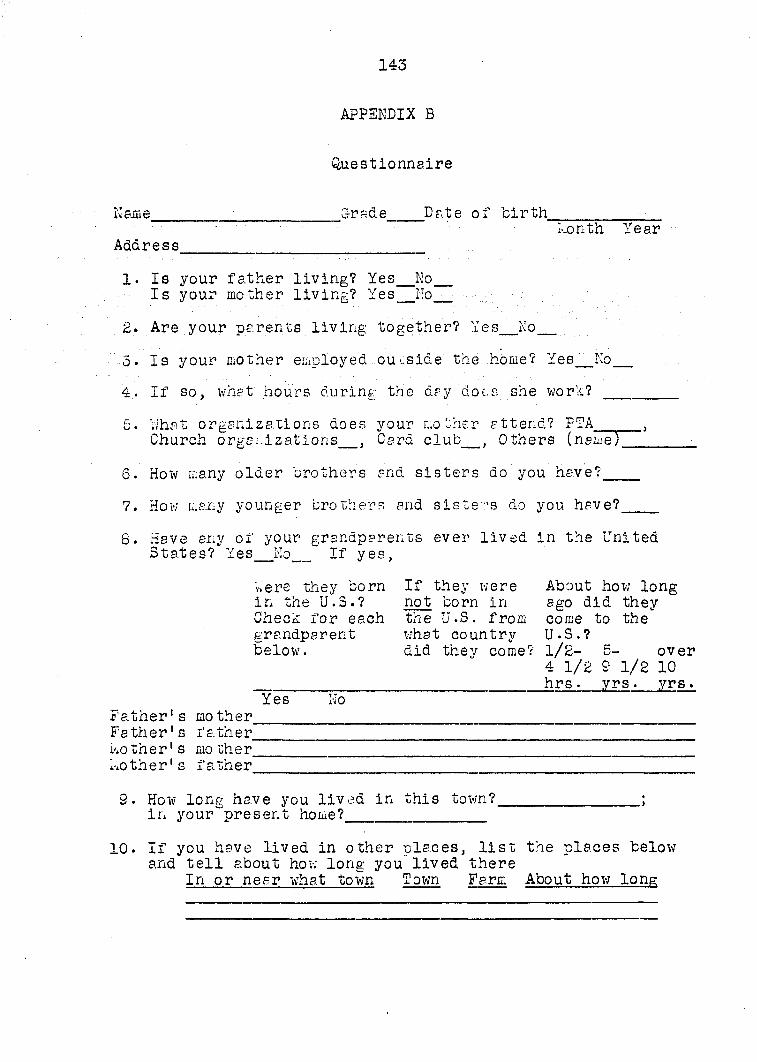
143
APPENDIX B
Questionnaire
Name Grade Date of birth konth Year
Address
1. Is your father living? Yes No Is your mother living? Yes No
2. Are your parents living together? Yes No
3. Is your mother employed .ou uside the home? Yes_No
4. If so, whet hours during the day doc .n she work?
5. VJhat organizations does your mother attend? FTA Church organizations , Card club , Others (name).
6. How many older brothers and sisters do you have?
7. How many younger brothers and sisters do you have?.
8. Have any of your grandparents ever lived in the United States? Yes No If yes,
»ere they born If they were About how long in the U.S.? not born in ago did they Check for each the U.S. from come to the grandparent what country U.S.? below. did they come? 1/2- 5- over
4 1/2 9 1/2 10 hrs. yrs. yrs.
Yes No Father's mother Father's father Mother's mother Mother's father
9. How long have you lived in this town? ; in your"present home?
10. If you have lived in other places, list the places below and tell about how long you lived there
In or near what town Town Farm About how long
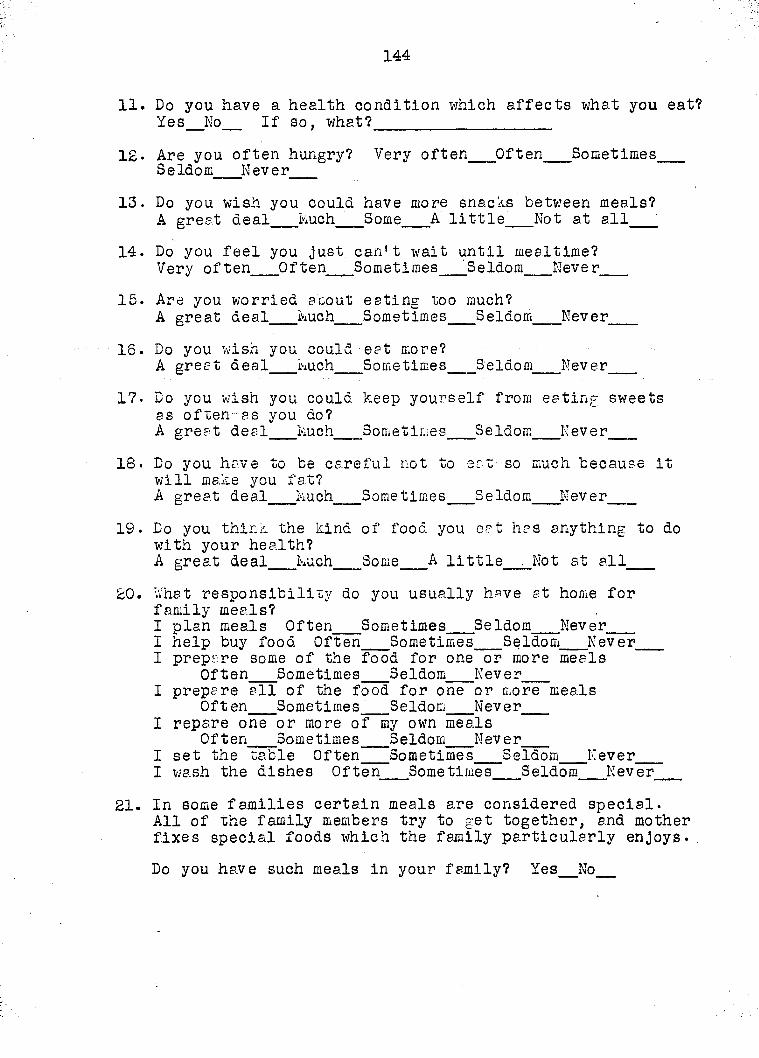
144
11. Do you have a health condition which affects what you eat? Yes Ko If so, what?
12. Are you often hungry? Very often Often Sometimes Seldom Never
13. Do you wish you could have more snacks between meals? A great deal kuch Some A little. Not at all
14. Do you feel you just can't wait until mealtime? Very often Often Sometimes _Seldom Never
15. Are you worried acout eating too much? A great deal kuch Sometimes Seldom Never
16. Do you wish you could eat more? A great deal kuch Sometimes Seldom Never
17. Do you wish you could keep yourself from eating sweets as of ten- as you do? A great deal kuch Sometimes Seldom Never
18. Do you have to be careful not to eat so much because it will make you fat? A great deal kuch Sometimes Seldom Never
19. Do you thir;/. the kind of food you eat has anything to do with your health? A great deal kuch Some A little ,_Not at all
20. What responsibility do you usually have at home for family meals? I plan meals Often Sometimes Seldom Never I help buy food Often Sometimes Seldom Never I prepare some of the food for one or more meals
Often Sometimes Seldom Never I prepare all of the food for one or more meals
Often Sometimes^ Seldom Never I repsre one or more of my own meals
Often Sometimes Seldom Never I set the table Often Sometimes Seldom Never I wash the dishes Often Sometimes Seldom Never
21. In some families certain meals are considered special. All of the family members try to get together, and mother fixes special foods which the family particularly enjoys.
Do you have such meals in your family? Yes No
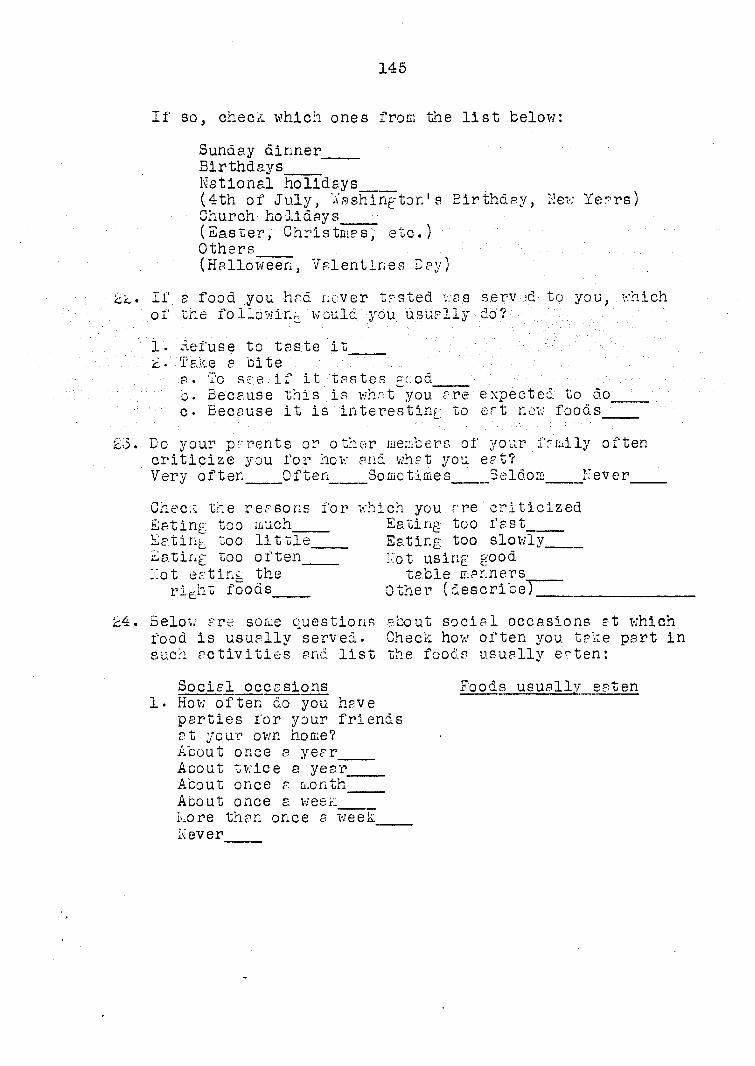
145
If so, check which ones from the list below:
Sunday dinner Birthdays National holidays (4th of July, Washington's Birthday, New Years) Church holidays (Easter, Christmas, etc.) Others (Halloween, Valentines Ley)
If a food .you. had never tasted was served to you, .which o f thé fo lIowir.:: "w ou Id. ; you usually do ?
1. Refuse to taste it id. Take s bite
a. To see. if it tastes p-cod c. Because this is what you are expected to do_ c• Because it is interesting to eat new foods_
Do your parents - or other members of your fredly often criticize you for how and what you eat? Very often 0 f ten Sometime s Seldo m N ever
Chec.i the reasons for which you are ' criticized Sating too much Eating too fast Eating zoo little Eating too slowly Eating too often Not using good Not eating the table manners
right foods Other (describe)
Below are some questions about social occasions at which food is usually served. Check how often you take part in such activities and list the foods usually eaten :
Social occasions Foods usually eaten 1. How often do you have
parties for your friends at your own home? About once a year Acout twice a year About once a month About once a wee-K kore than once a week Never

146
Social occasions Foods usually eaten 2. How often do you go to
parties in the home of your friends? About once a year About twice a year About once a month About once 3 week kore then once a week I. ever
•3. How often do..you attend scnool parties? About; once e y e r r '
• Acout twice a. yer r_ • Acout once a month - ;
. About once a week ... ... • ko re tarn once a week -• k ever
4. Do you get together with your friends after school in puclic eating places? About once a year About twice a year About once s month Acout once a week ko re often th?i. once a wet-: i'.ever
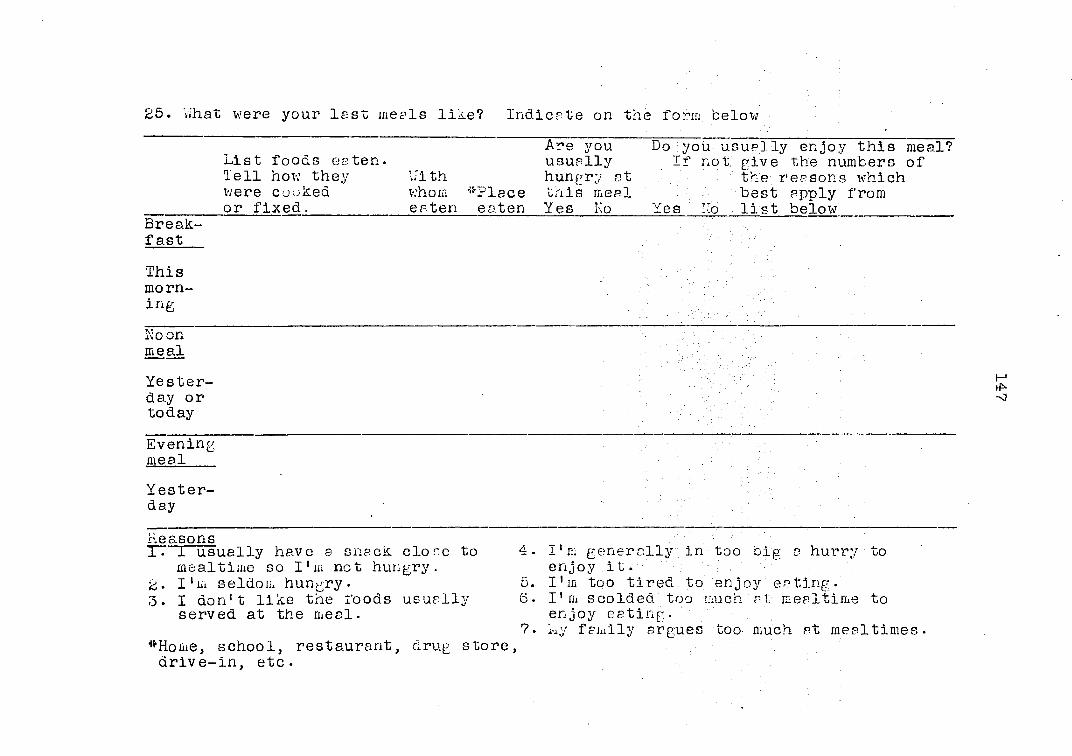
25. vïhat were your lest; mepls like? Indicate on the form below
Breakfast
List foods eeten. Tell how they were cooked or fixed.
Vith whom ':i"?lsce esten eaten
Are you usually hungry at this meal Yes Ko
Do you usually enjoy this meal? If not give the numbers of
the reasons which best apply from
Yes Mo list below
îhi s morning
Ko on meal
Yesterday or today
Evening meal
Yesterday
Reasons 1. 1 usually have s snack clore to 4.
mealtime so I'm not hungry. 2. I'm seldom hungry. 5. 3. I don't like the foods usually 6.
served at the meal. ? .
*Home, school, restaurant, drug store, drive-in, etc.
I'm generally in too big e hurry to enjoy it. I'm too tired.to enjoy eating. I'm scolded too much rt mealtime to enjoy eating. i-iy family argues too much et mealtimes.
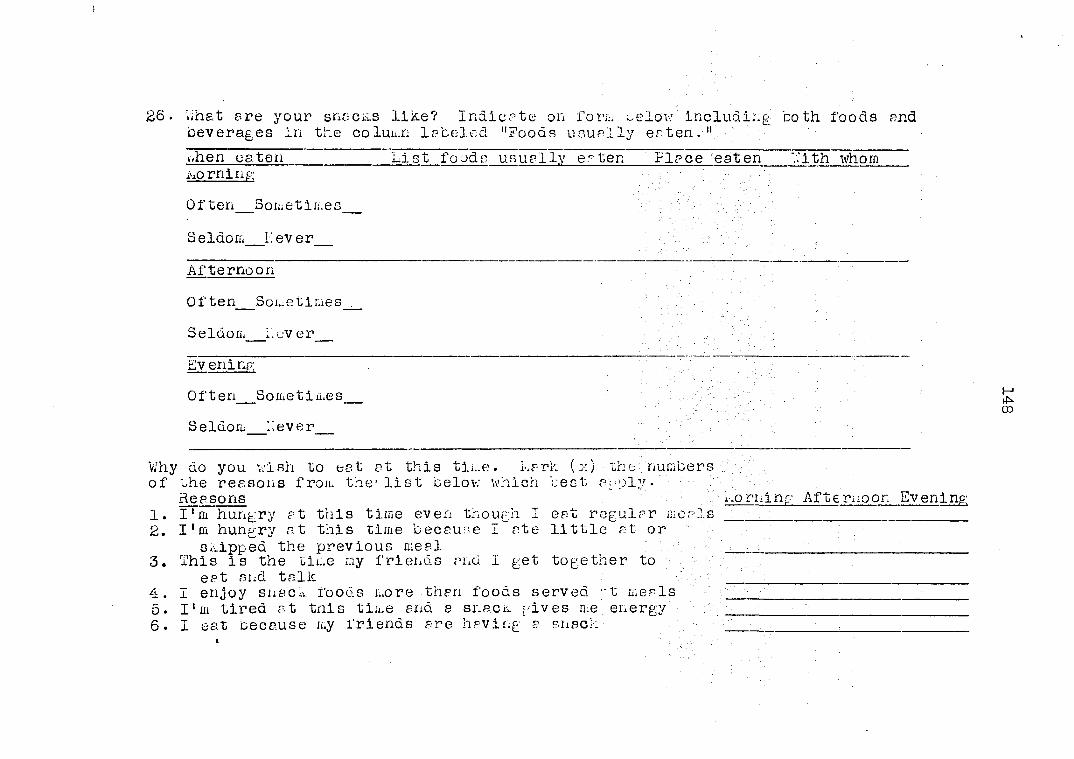
26. What are your sneers like? Indicate on fort, uelow' including both foods and beverages in the column labeled "Foods usually er ten. "
when eaten List foods usually eaten Place eaten "..'ith whom jjiO rninc;
Often Sometin.es
Seldom K ever
Afternoon
Often Sometimes .
Seldom i'.cv er
£v ernnp:
Often 3oL.etia.es ^ oo
Seldom Lever
V/hy do you v,*ish to eat at this time. l-.ark ( :•:) the-' numbers of the reasons f roiu the* list belov; which best apply.
Reasons Lornlnp- Afternoon Evening; 1. I'm hungry at this time even though I eat regular meals 2. I'm hungry at this time because I ate little at or
shipped the previous meal - . 3. This is the time my friends and I get together to
eat and talk 4. I enjoy snack foods more than foods served ; t meals __ 5. I'm tired at tnis time and a sr.acii gives me energy - : : 6. I eat because my friends are having s snack•
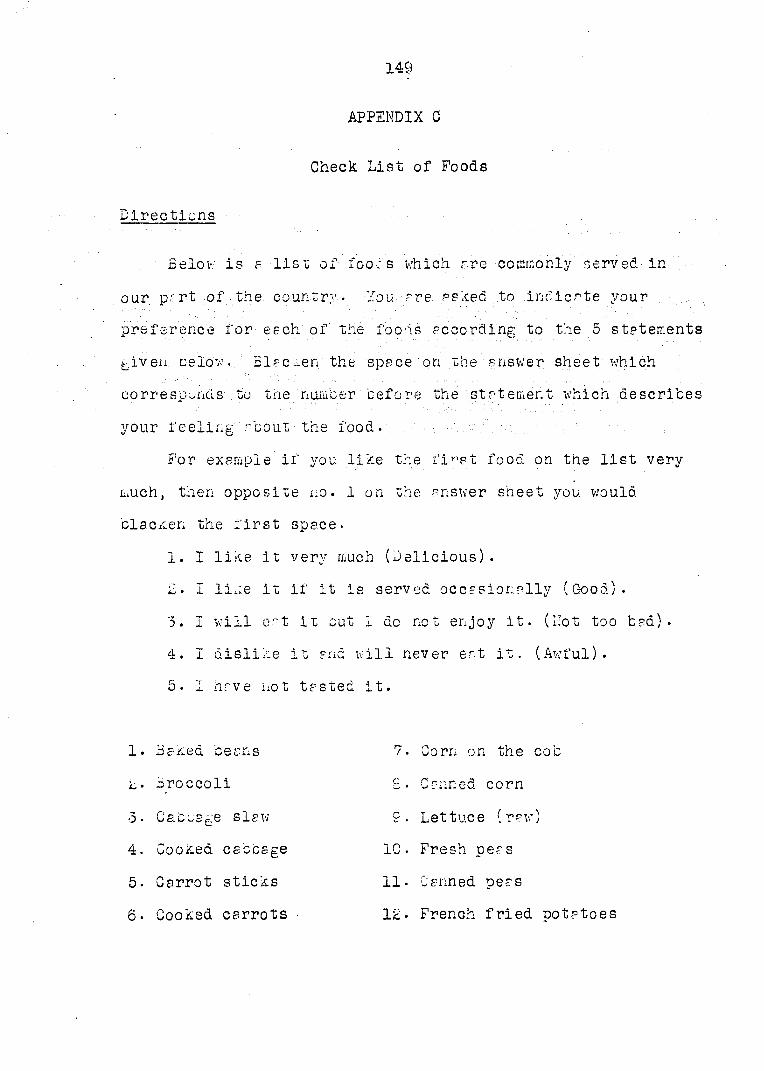
149
APPENDIX C
Check List of Foods
Directions
Below is a lis b of foods which are commonly served in
our part of the country. You are p&'&eô to indicate your
preference for each of the foods according to the 5 statements
jk.iven ce low. Blacken; the space on the answer sheet which
corresounds to the number before the statement which describes
your feeling about the food.
For example if you like the first food, on the list very
much, then opposite no. 1 on the answer sheet you would
blacker; the first space.
1. I like it very much (Delicious).
£. I like it if it is served occasionally (Good).
3. I will eat it but 1 do not enjoy it. (Hot too bad).
4. I dislike it and will never eat it. (Awful).
5. I have not tasted it.
1. Baked beans 7. Corn on the cob
l. Broccoli £. Canned corn
3. Cabbage slaw 9. Lettuce (raw)
4. Cooked cabbage 10. Fresh peas
5. Carrot sticks 11. Canned peas
6. Cooked carrots • 12 • French fried potatoes

150
13.
14 .
15.
16.
17.
16 .
lb? •
Baked potatoes
k p. shed potatoes
Baked yello1.-: squash
Summer squash
Fresh ton.'- toes
3uev.ec toot toes
Tomato, j ui c e •
cO.
Ll.
cic •
c3 •
ic4 .
LD •
-urnlps
-°.PV: apple .
Ayir:le ' sauce ' • '
AVO CFQO
zar.anas
Oren e.=
> i:. Fresh peaches
c? • Gf-nnea perches
. Fresh strawcerries
^9 . Co mere ad
30. Vhite cread
31. Soô.a crac/iers
3c. Co m fir .es
33. ruffed rice
34. Spaghetti
oo. hia'.ea eus tara
36. Ice creem
37. Puddings
38.
32 •
40.
41.
4;...
4 3.
47.
51,
c :)
57
50.
61,
68,
Pie
Cake
Cookies
G and;/ cars
.-.ilk
.Chocolate milk'
.'•Buttermilk'
Cottage cheese
•Yellov,' cheese 'Amer
Scrambled e,-g9
Fried ergs
H"ra boiled eggs
Soft boiled eggs
Poached eggs
Peanut butter
Hamcurger
Beef steak
Beef roast
Lame chops
Lame roast
For'., chops
For.: roast
Fried fresh fish
Oyster stew
Canned sslmon
ic^n)

151
So. Fried chicken
54. Rop'st chicken
55. Vege1p cle soup
55. Chili
Food Enjoyment Scple I
Score w e s determined i'r.on the totrl .nunioer .of - these fol
lowing items or. the Criée-: Lie t of Foocs for which the response,
"1 like it very muc:;" whs given.
Items 1
V
1c 15 14 17 12
a
l.5
31 ,3->3 34 35
• 4-3 - 45 4 7
• 49 50 58 54 53 50
rood Lnjoyt..ent 3cpie II
Score v- rs determined from the tot»l number of the fol
lowing items où the Chec,.. List of Fooas for i-hicn the response,
'1 11 tie it very much
Items Ov, •37 36 •39
•1 " T.* v;rs riven -
41 53 54
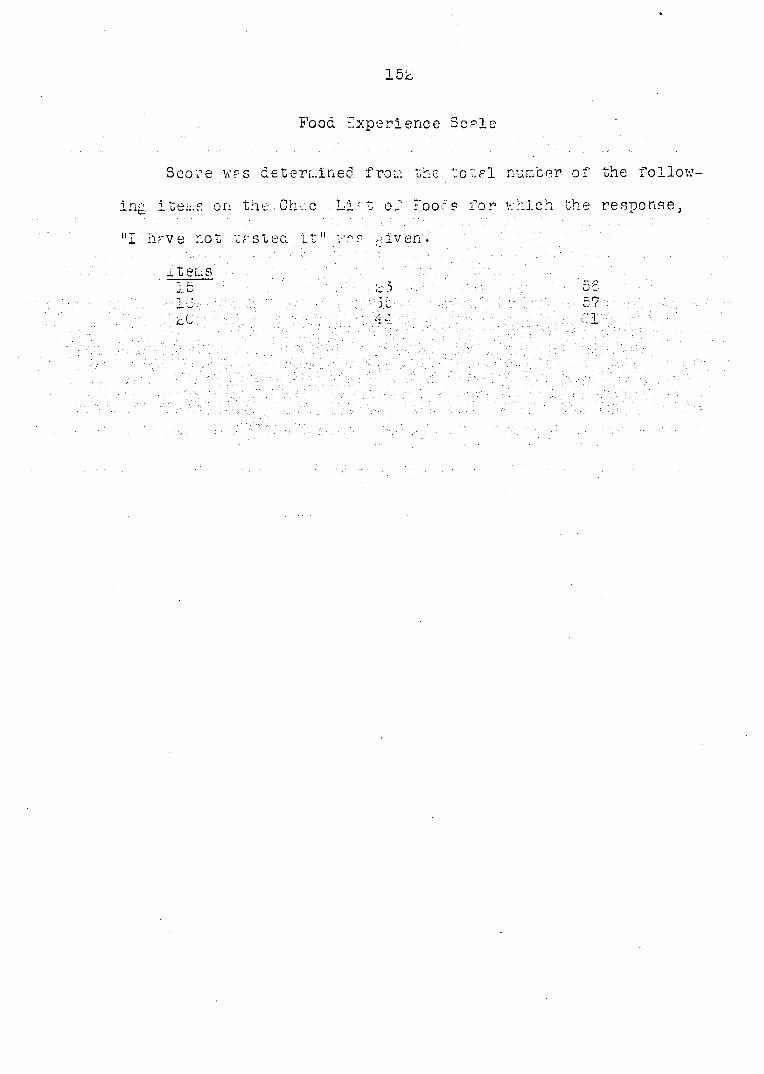
15%
Food Experience ScPle
Score wps determined from the totpl number of the folio
ing items on the Ghee Lirt of Poor's for which the response,
"I hrve not ersteo. it" wrs >-iven.
11 ems 15 - : : k-3 e/' . '5S

153
APPENDIX D
Tes te Te st Record Por&
Kenie of Jud p;e Lets -- Time
Substance
Procedure : Rinse the *1, out h thoroughly -.vith distilled v:r ter, disc Pv.ii. t he v.r f r. '.Teste Solution' : c . 1.
• 3v:ish tno s. 0.1 u ti.oj. r-round-.so. thet it reaches the decii pert 0 f • t :ie"toi^ue... "L.iscerd". ... record s core. Rinse the Li out Kit-: dis tilled >:e ter. egmin.... belt one ixiriut S n "teste Solution '.o . c - Conti nue 1". ' nf c. &Y* '• ûiO i.. i 1', ' ' . 1' - i r*. r? r. n P v»r*) f. p il r» o .
Insert number de ni ; r.- ' t inr the intensity of teste of the rxuiiiG--rcd ' so lutionc u sin;- th' follovir.;- Ley:
0 — : o teste i
— Very feint-k, - Feint 3 - ïïesily noticeable 4 — Strong
— .cry strong
Solution .o • — L 3 4 5 6 7 2 0 10
Int'. nsity
'..hfit vfs une teste?
,u:.,cer or solution at t.r.ich teste first identified

154
Concentrations of Solutions for isste Tests
Solution number Sodium chloride Sucrose
k/L gn;/L k/L gm/L . . . ! - 0 0 0 0
C .000313 • 0183 .OOOÔLÔ .21-38 0 .0005^5 .0356 .00125 .4279 4 ' •UUlcb .07,1 .00250 .3 558 0 .00c50 • .1453 .00500 1.712
.00500 • L.9^5 . . : .01000 3.424 -.01000 : ,.5650 .02000 . -3.848 .0^000 .' 1.170 . .04000 13.696 .
S .0400 L.S40 .02000 c7.392 10 .1,600 " 4.GS0 . isooo ; 54.724
olutlon numcer "I'srtrrlc held Caffeine
/ r./ i-i c •''•/!- I,/L gm/L 1 0 0 0 0 c .0000163 .0037 .000035 . .0126 3 .0000325 .0047 .000130 .0252 4 .001:0550 .0094 .000250 .0486 5 .0001300 .016% .000500 .0971 6 .000:. 50 .0375 .001000 .1942 ? .OOOoOO .0750 .002000 .3884 6 .OOIO'.O .1501 .004000 .7738 9 .OOLOOC .5002 10 .004000 .6004

155
AFHZDIX Z: VALU13 I::V-:i;TORY

156
Name Date of birth
This is not an examination because all answers are right answers.
In the following situations you are asked to decide what you think
it would be best for junior high school girls to do. Try to imagine
what you would do if you had such a decision to make.
After deciding what each girl should do, check each statement according
to how much you feel it should influence her decision.
When you have checked each statement on the page, go on to the
page until you have finished all of the situations.
next
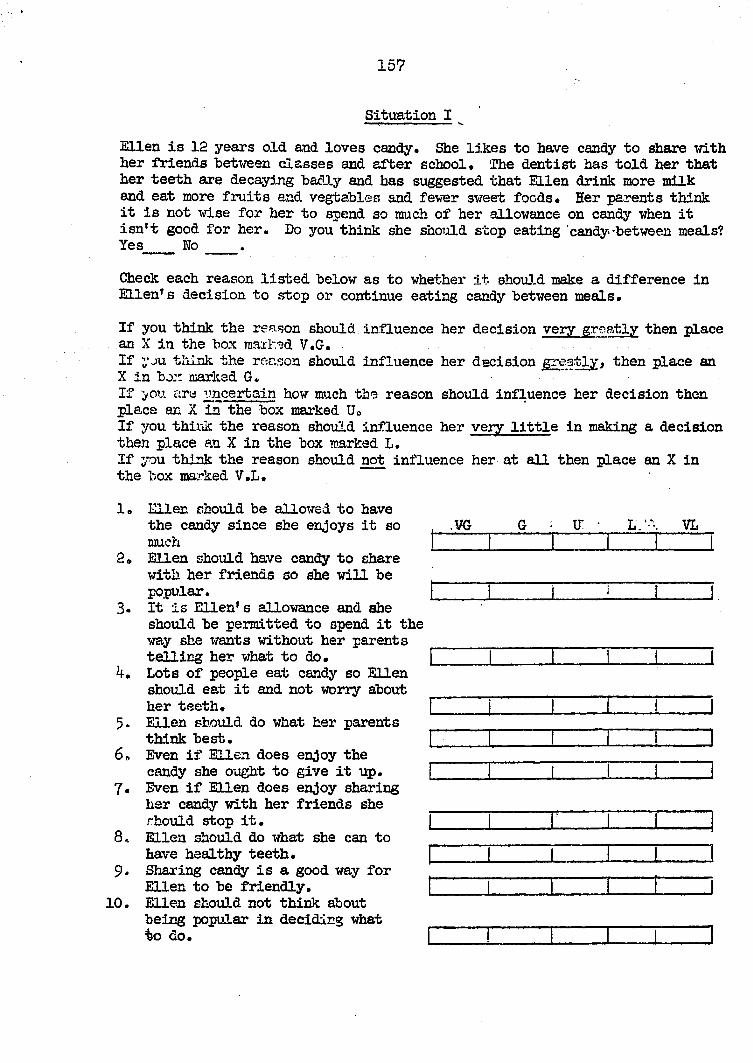
157
Situation I
Ellen is 12 years old and loves candy. She likes to have candy to share with her friends "between classes and after school» The dentist has told her that her teeth are decaying badly and has suggested that Ellen drink more milk and eat more fruits and vegtables and fewer sweet foods. Her parents think it is not wise for her to spend so much of her allowance on candy when it isn't good for her. Do you think she should stop eating candy.-between meals? Yes Wo
Check each reason listed below as to whether it should make a difference in Ellen's decision to stop or continue eating candy between meals.
If you think the reason should influence her decision very greatly then place an X in the box mailed V.G. If you think the rer.scn should influence her decision greatly, then place an X in bo:: marked G. If you ara uncertain how much the reason should influence her decision then place an X in the box marked U0 If you think the reason should influence her very little in making a decision then place an X in the box marked L. If you think the reason should not influence her at all then place an X in the box marked V.L.
1. Ellen should be allowed to have the candy since she enjoys it so much
2. Ellen should have candy to share with her friends so she will be popular.
3. It is Ellen's allowance and she should be permitted to spend it the way she wants without her parents telling her what to do.
4. Lots of people eat candy so Ellen should eat it and not worry about her teeth.
5. Ellen should do what her parents think best.
6» Even if Ellen does enjoy the candy she ought to give it up.
7. Even if Ellen does enjoy sharing her candy with her friends she rkould stop it.
8< Ellen should do what she can to have healthy teeth.
9. Sharing candy is a good way for Ellen to be friendly.
10. Ellen should not think about being popular in deciding what to do.
.VG IT LV VL

L. 158 -2-
Situation 2
Ruth is fourteen. Her friends like to go to a restaurant on their way home from school for a snack of candy or a sweet roll and "bottled drink. They meet other "boys and girls there and have lots of fun. Ruth likes to be with the crowd, but she thinks it is a waste of time and money to go there everyday. Then., too, when the evening meal comes she is not hungry for the meat and vegetables which she needs for good health. Her parents tell her she should go with the others because they feel she spends too much time by herself. Do you think she should go with the crowd? Yes No
Check each reason listed below as to whether it should make a difference in Ruth's decision to go or not go with the crowd.
If you think the reason should influence her decision very greatly then place and X in the box marked V.G. If you think the reason should influence her decision greatly, then place an X in the box marked G. If you axe uncertain how much the reason should influence her decision then place, an X in the box marked U. If you think the reason should influence her very little in making a . decision then place an X in the box marked L. If you think the reason should not influence her at all then place an X in the box marked V.L.
11. Ruth should go with others so she will be popular with the crowdc
12. Peiug friendly is not important m deciding whether she yuculd
. ; stop at the restaurant. 13. Ruth should be the one to decide
whether she should go with the girls, not her parents.
l4c Ruth should be trying to eat the foods she needs for good health.
15. If her parents want her to go with the others she should go.
16. Ruth should not worry about her health.
17. Because eating together makes people feel friendly, Ruth should go with the crowd.
18. Ruth should not think about being popular.
VG G U VL
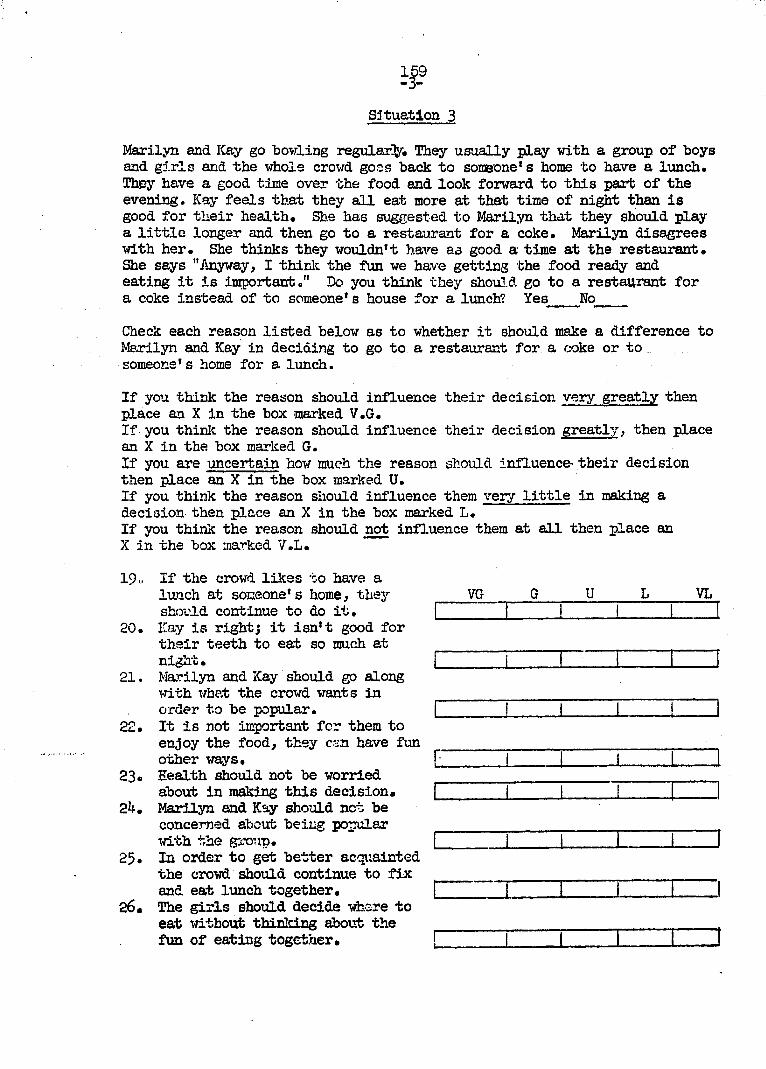
Situation 3
Marilyn and ICay go bowling regularly. They usually play with a group of boys and girls and the whole crowd goes back to someone*s home to have a lunch. Thpy have a good time over the food and look forward to this part of the evening. Kay feels that they all eat more at that time of night than is good for their health. She has suggested to Marilyn that they should play a little longer and then go to a restaurant for a coke. Marilyn disagrees with her. She thinks they wouldn't have as good a time at the restaurant. She says "Anyway, I think the fun we have getting the food ready and eating it is important." Do you think they should go to a restaurant for a coke instead of to someone' s house for a lunch? Yes No
Check each reason listed below as to whether it should make a difference to Marilyn and Kay in deciding to go to a restaurant for a coke or to someone's home for a. lunch.
If you think the reason should influence their decision very greatly then place an X in the box marked V.G. If you think the reason should influence their decision greatly, then place an X in the box marked G. If you are uncertain how much the reason should influence their decision then place an X in the box marked U. If you think the reason should influence them very little in making a decision then place an X in the box marked L. If you think the reason should not influence them at all then place an X in the box marked V.L.
19» If the crowd likes to have a lunch at someone's home, they VG G U L VL should continue to do it. | till
20. Kay is right; it isn't good for their teeth to eat so much at night. I I II I
21. Marilyn and Kay should go along with what the crowd wants in order to be popular. I II I |
22. It is not important for them to enjoy the food, they c%n have fun other ways. [ [ | | |
23® Health should not be worried about in making this decision. | III
24. Marilyn and Kay should not be concerned about being popular with the group. I II II
25. In order to get better acquainted the crowd should continue to fix and eat lunch together. 1 I I I I I
26. The girls should decide where to eat without thinking about the fun of eating together. I I I I I
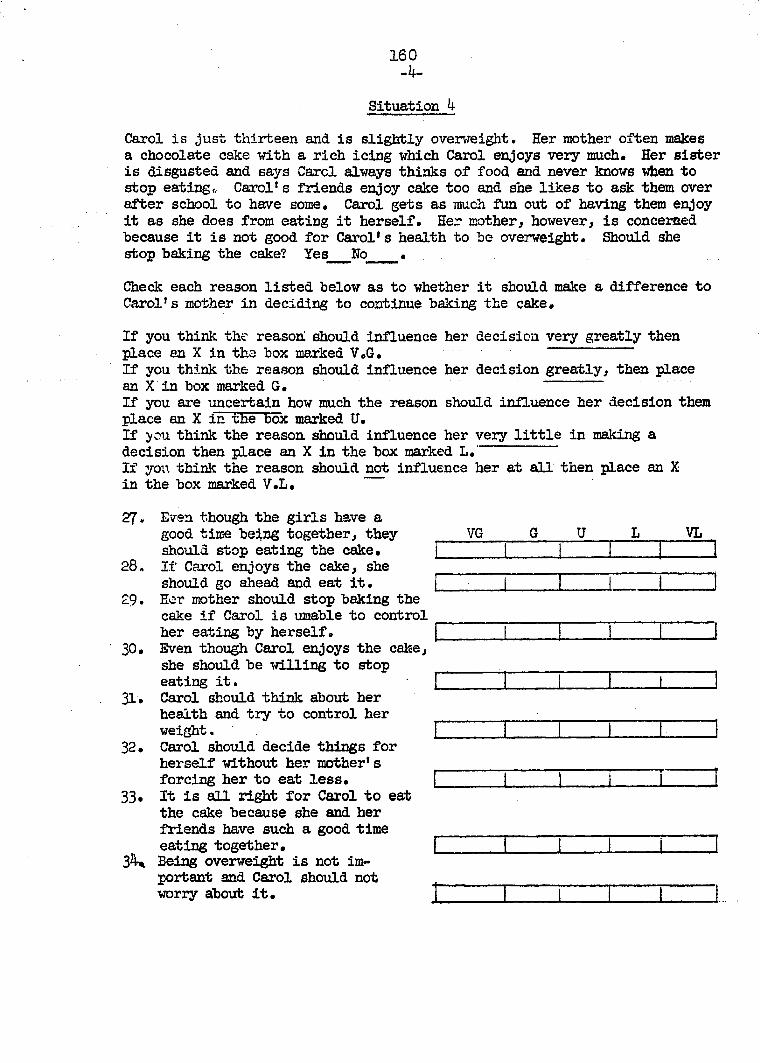
160 -k~
Situation 4
Carol is just thirteen and is slightly overweight. Her mother often makes a chocolate cake with a rich icing which Carol enjoys very much# Her sister is disgusted and says Carol always thinks of food and never knows when to stop eatingc Carol1s friends enjoy cake too and she likes to ask them over after school to have some. Carol gets as much fun out of having them enjoy it as she does from eating it herself. Her mother, however, is concerned because it is not good for Carol's health to be overweight. Should she stop baking the cake? Yes No •
Check each reason listed below as to whether it should make a difference to Carol's mother in deciding to continue baking the cake.
If you think the reason should influence her decision very greatly then place an X in the box marked V.G. If you think the reason should influence her decision greatly, then place an X in box marked G. If you are uncertain how much the reason should influence her decision them place an X in the box marked U. If you think the reason should influence her very little in making a decision then place an X in the box marked L. If you think the reason should not influence her at all then place an X in the box marked V.L.
27. Even though the girls have a good time being together, they should stop eating the cake,
28. If Carol enjoys the cake, she should go ahead and eat it.
£9. Ear mother should stop baking the cake if Carol is unable to control her eating by herself.
30. Even though Carol enjoys the cake, she should be willing to stop eating it.
31. Carol should think about her health and try to control her weight.
32. Carol should decide things for herself without her mother's forcing her to eat less.
33. It is all right for Carol to est the cake because she and her friends have such a good time eating together,
34* Being overweight is not important and Carol should not worry about it.
VG G U L VL
1 1 1 1 1
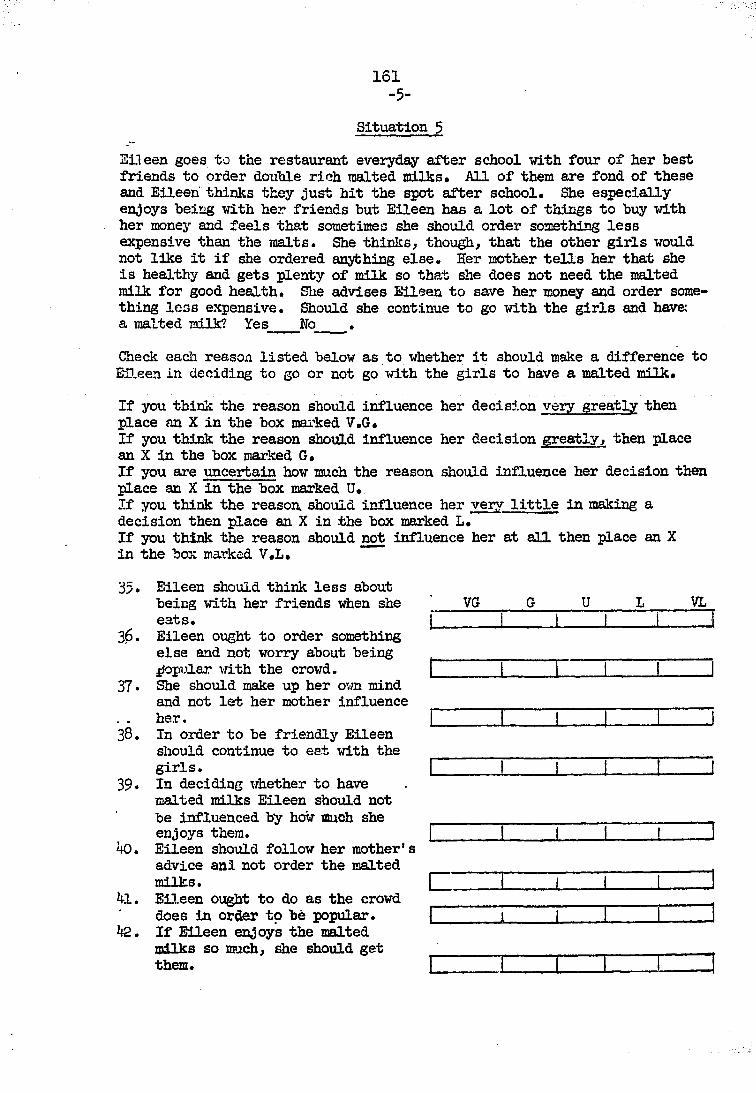
161
-5-
Situation 5
Eileen goes to the restaurant everyday after school with four of her best friends to order double rich malted milks. All of them are fond of these and Eileen thinks they just hit the spot after school. She especially enjoys being with her friends but Eileen has a lot of things to buy with her money and feels that sometimes she should order something less expensive than the malts. She thinks, though, that the other girls would not like it if she ordered anything else. Her mother tells her that she is healthy and gets plenty of milk so that she does not need the malted milk for good health. She advises Eileen to save her money and order something less expensive. Should she continue to go with the girls and have; a malted milk? Yes No .
Check each reason listed below as to whether it should make a difference to Eileen in deciding to go or not go with the girls to have a malted milk.
If you think the reason should influence her decision very greatly then place an X in the box marked V.G. If you think the reason should influence her decision greatly, then place an X in the box marked G. If you are uncertain how much the reason should influence her decision then place an X in the box marked U. If you think the reason, should influence her very little in making a decision then place an X in. the box marked L. If you think the reason should not influence her at all then place an X in the box marked V.L.
35» Eileen should think less about being with her friends when she eats.
36. Eileen ought to order something else and not worry about being popular with the crowd.
37. She should make up her own mind and not let her mother influence her.
38. In order to be friendly Eileen should continue to est with the girls.
39• In deciding whether to have malted milks Eileen should not be influenced by how much she enjoys them.
40. Eileen should follow her mother's advice anl not order the malted milks.
41. Eileen ought to do as the crowd does in order to be popular.
te. If Eileen enjoys the malted milks so much, she should get them.

162 -6-
Sltuation 6
Pat loves to skate and she goes as often as she can in the winter time. She skates with a group of boys and girls and afterwards they usually go to the home of one of the girls for a lunch. They all go out to the kitchen and make their own sandwiches and have a marvelous time, Pa± likes this crowd and wants to be included in the good timese However, she is becoming overweight which isn't healthy and it is interfering with her ability to do figure skating. She is trying to decide whether she should stop going with the crowd for the lunches. Her older sister thinks she should have a good time with the crowd at the rink but should not go with them to eat. Pat thinks they have fun eating together amd Dates to miss being with the group but she cannot keep from eating too much if she gees. Do you think she ought to keep on going with the crowd for lunch? Yes No .
Check each reason listed below as to whether it should make a difference to Pat in deciding to go or not go with the crowd for lunch.
If you think the reason should influence her decision very greatly then place an X in the box marked V.G. If you think the reason should influence her decision greatly, then place an X in the box marked G. If you are uncertain how much the reason should influence her decision then place an X in the box marked U. If you think the reason should influence her very little in making a decision then place an X in the box marked L. If you think the reason should not influence her at all then place an X in the box marked V.L. ~~
43# Being friendly is not important in deciding whether she should go with the crowd to eat.
44. Pat should have the lunches without worrying about her health.
45. Enjoyment of food should not be important in Pat's decision.
46. Pat ought to go with ther crowd because eating with a group helps everyone feel more friendly.
47. Pat should make up her own mind and not let her older sister tell her what to do.
48. In making this decision Pat should think of her health.
49. Pat should not worry about being popular in deciding if she should with the crowd.
50. Pat should listen to her older sister's advice because she is older and knows better what is good for her to do.
51. If Pat enjoys the sandwiches, she should have them.
52. Pat should go along with the crowd so she will bo popular.
U VL

163 -7-
Sitnation 7
Kathy is trying to gain weight so she can try out for the basketball team. Most of Kathy' s friends play basketball and several of her group are sure to be chosen for the team» The girls on the team have a lot of fun together and Kathy wants to be included in the fun. Kathy1 s mother knowing that she' needs to gain weight because of her health, goes to a lot of trouble to have sandwiches and cocoa for her and insists she should have them even when they have company. Kathy hates to be fussed over, so she sometimes refuses the extra food. Should she eat the food when she doesn't want it? Y e s No .
Check each reason listed below as to whether it should make a difference to Kathy in deciding to eat or not eat the food.
If you think the reason should influence her decision very greatly then place an X in the box marked V.G. If you think the reason should influence her decision greatly, then place an X in the box marked G. If you are uncertain how much the reason should influence her decision then place an X in the box marked U. If you think the reason should influence her very little in making a decision then place an X in the box marked L. If you think the reason should not influence her at all then place an X in the box marked V.L,
53• If her mother tells her to eat the food, Kathy should do it.
5^« If she does not enjoy the food, she should not eat it.
55. Kithy should not try to get on the team just so others will like her.
56. Because it is not healthy to be under weight, Kathy should try to eat more to gain weight.
57' Kathy should make up her own mind about eating the extra food no matter what her mother says.
58. Whether Kathy enjoys the food is not important in making a decision in this situation.
59. Kathy should make an effort to get on the team so she will be popular with her school friends.
60. Kathy does not need to think about her health in deciding whether to eat the extra food.
VG U J£L_
J
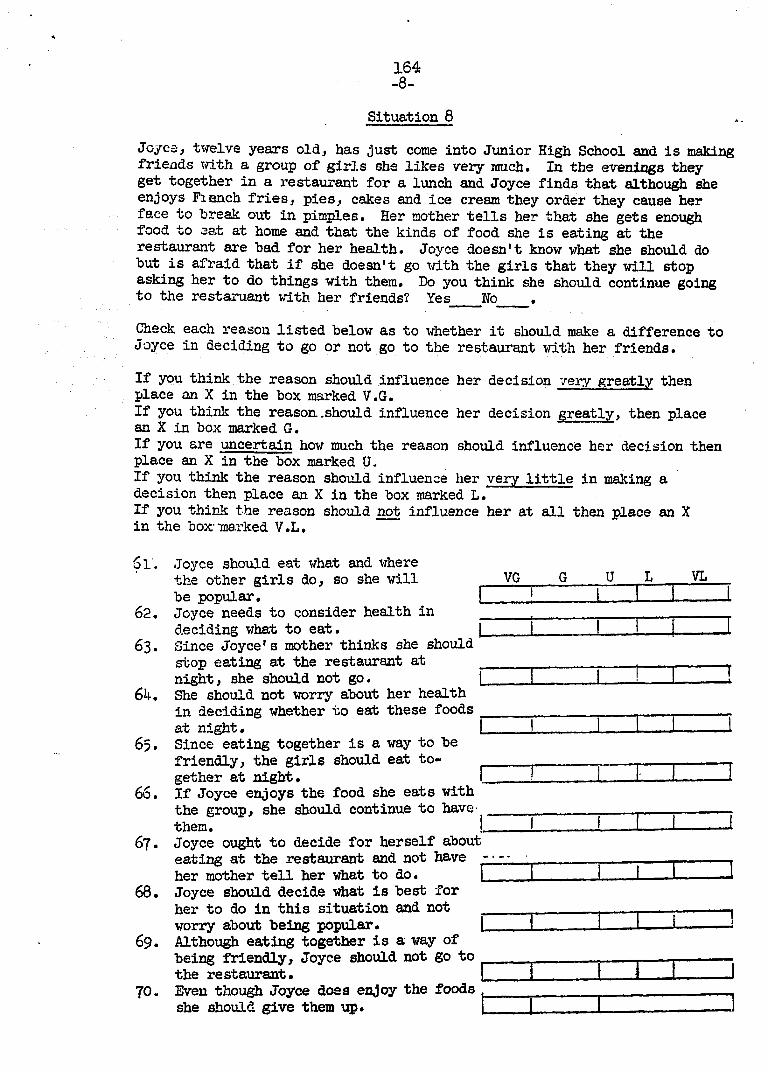
164 -8-
Situation 8
Joyce, twelve years old, has just come into Junior High School and is mak-ing friends with a group of girls she likes very much. In the evenings they get together in a restaurant for a lunch and Joyce finds that although she enjoys Fianch fries, pies, cakes and ice cream they order they cause her face to break out in pimples. Her mother tells her that she gets enough food to aat at home and that the kinds of food she is eating at the restaurant are bad for her health. Joyce doesn't know what she should do but is afraid that if she doesn't go with the girls that they will stop asking her to do things with them. Do you think she should continue going to the rest amant with her friends? Yes No
Check each reason listed below as to whether it should make a difference to Joyce in deciding to go or not go to the restaurant with her friends.
If you think the reason should influence her decision very greatly then place an X in the box marked V.G. If you think the reason .should influence her decision greatly, then place an X in box marked G. If you are uncertain how much the reason should influence her decision then place an X in the box marked U. If you think the reason should influence her very little in making a decision then place an X in the box marked L. If you think the reason should not influence her at all then place an X in the box'marked V.L.
6l.
62.
63-
64.
65.
66.
67.
68.
69.
70-
Joyce should eat what and where the other girls do, so she will be popular. Joyce needs to consider health in deciding what to eat. Since Joyce's mother thinks she should stop eating at the restaurant at night, she should not go. She should not worry about her health in deciding whether to eat these foods at night. Since eating together is a way to be friendly, the girls should eat together at night. If Joyce enjoys the food she eats with the group, she should continue to have then. ! Joyce ought to decide for herself about eating at the restaurant and not have her mother tell her what to do. Joyce should decide what is best for her to do in this situation and not worry about being popular. Although eating together is a way of being friendly, Joyce should not go to the restaurant. Even though Joyce does enjoy the foods she should give them up.
VG U VL
•
m

165 -9-
Sltuation 9
Pauline is at a girls' summer camp at the lake and is making friends with the girls in her cabin. The camp is in a section where fruits and veg-t able s are hard to get. and often the only-vegetables are carrots, cabbage or canned peas. They have oranges twice a week and the rest of the time prunes or apricots. Pauline doesn't like cabbage or carrots very well and won't eat prunes or apricots. She does not eat very much at meals and is often hungry. She complains about the food and the other girls often tell her to quit griping and not to be so finicky. The camp nurse tells her she needs to eat more to gain weight. Do you think Pauline should eat the fruits and vegetables even though she doesn't like them? Yes No .
Check each reason listed below as to whether it should make a difference to Pauline in deciding to eat or not eat the fruits and vegetables.
If you think the reason should influence her decision very greatly then plaça an X in the box marked V.G. If you think the reason should influence her decision greatly, then place an X in the box marked G. If you are uncertain how much the reason should influence her decision then place an X in the box marked U. If you think the reason should influence her very little in making a decision then place an X in the box marked L. If you think the reason should not influence her at all then place an X in the box marked V,L.
71. Pauline should eat what the others so without complaining so she will be popular.
72. Pauline ought to eat the vegetables and fruits so she will be healthy.
73» Whether Pauline enjoys the food or not, she should try to eat it.
74. Being sociable is not important in deciding whether to eat the fruits and vegetables.
75- What the group thinks of Pauline is not important in deciding what to eat.
76. It is all right for Pauline to complain about the food because enjoying food should be part of the fun of camp.
77» Health is not important in making this decision.
78. It is much more friendly and considerate of her fellow campers for Pauline to eat the foods served and not "gripe".
VG G U VL
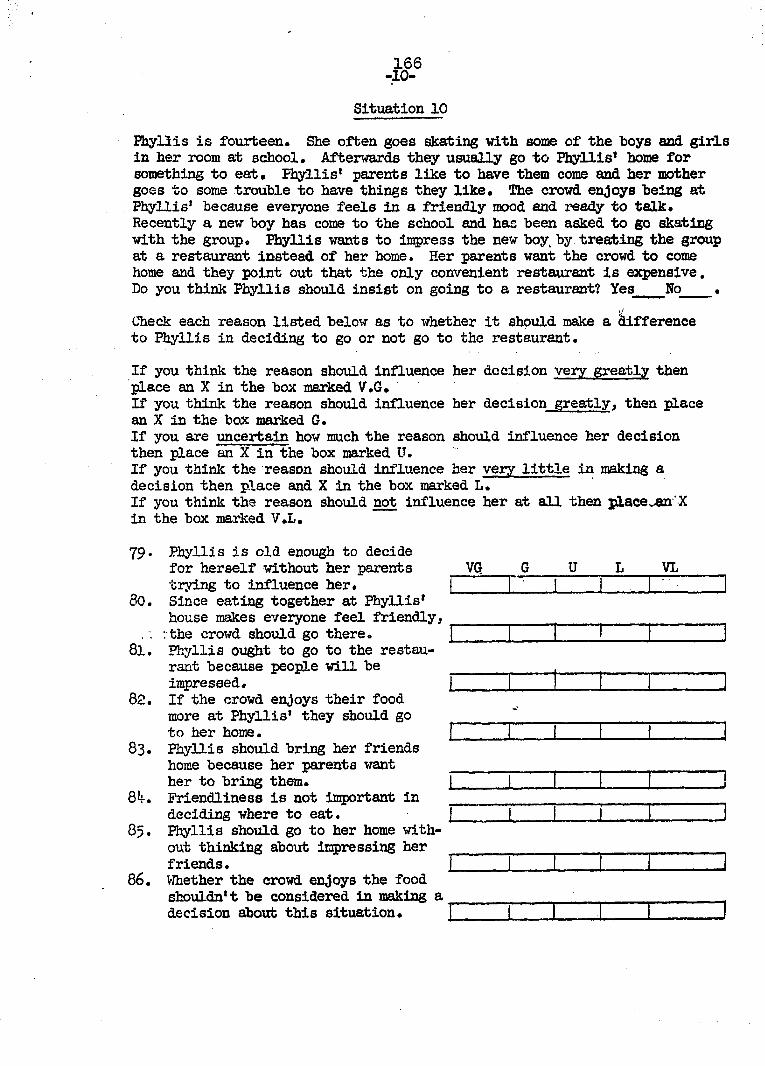
#6
Situation 10
Phyllis is fourteen. She often goes skating vith some of the boys and girls in her room at school. Afterwards they usually go to Phyllis* home for something to eat. Phyllis' parents like to have them come and her mother goes to some trouble to have things they like. The crowd enjoys being at Phyllis' because everyone feels in a friendly mood and ready to talk. Recently a new boy has come to the school and has been asked to go skating with the group. Phyllis wants to impress the new boy, by treating the group at a restaurant instead of her home. Her parents want the crowd to come home and they point out that the only convenient restaurant is expensive. Do you think Phyllis should insist on going to a restaurant? Yes No .
Check each reason listed below as to whether it should make a difference to Phyllis in deciding to go or not go to the restaurant.
If you think the reason should influence her décision very greatly then place an X in the box marked V.G. If you think the reason should influence her decision greatly, then place an X in the box marked G. If you are uncertain how much the reason should influence her decision then place an X in the box marked U. If you think the reason should influence her very little in making a decision then place and X in the box marked L. If you think the reason should not influence her at all then place,-an"X in the box marked V.L.
19'
80.
81.
82.
83.
8k.
85.
86.
Phyllis is old enough to decide for herself without her parents VQ trying to influence her. j Since eating together at Phyllis' house makes everyone feel friendly, : the crowd should go there. 1 Phyllis ought to go to the restaurant because people will be impressed. j If the crowd enjoys their food more at Phyllis' they should go to her home. Phyllis should bring her friends home because her parents want her to bring them. J Friendliness is not important in deciding where to eat. j Phyllis should go to her home without thinking about impressing her friends. I Whether the crowd enjoys the food shouldn't be considered in making a decision about this situation.
G U VL

167 -11-
Situation 11
Mildred and Norma with two of their best friends go to a restaurant everyday for cokes or ice cream after school. They live too far from each other to get together very often in the evenings and they enjoy talking while having their cokes, Norma doesn't have very much of an allowance and she tells Mildred that she can't afford to have cokes or ice cream every day, Mildred says that they have so much fun talking that Norma could have just milk or ice cream instead of the regular meal at the school lunch and then spend the- money: she. saves, on cokes and ice cream with the girls. Her parents want Norma to have a good lunch so they give her money each week to pay for her lunches at school. Do you think Norma should not eat the regular lunch at school and spend her money on cokes and ice cream with her friends? Yes Nc .
Check each reason listed below as to whether it should make a difference to Norma in deciding to eat or not eat the regular lunch at school.
If you think the reason should influence her decision very greatly then place an X in the box marked V.G. If you think the reason should influence her decision greatly, then place an X in the box marked G. If you are uncertain how much the reason should influence her decision then place an X in the box marked U. If you think the reason should influence her very little in making a decision then place an X in the box marked L, If you think the reason should not influence her at all in making a decision place an X in the box marked V.L.
87. Norma needs the meat and vegetables served at the school lunch in VG G U L VL order to be healthy. I . 1
88. Eating and drinking cokes with friends makes everyone feel friendly so Norma should eat with the girls. f II [ 1
89. Mildred should forget about what her ^ | |
friend will think. | | | 1 90. Norma's parents want her to use the
money to buy lunch at school so she should do it. j | | | j
91. Norma should do as the other girls do ___ so they will like her. | | | |
92. Qta girls can have a good time without eating together. | | 1 | |
93» Skipping her noon meal won't affect Norma's health. | | | | |
94. Norma should decide what is best for her without her parents telling her what to do.

168 -12-
Sltuatlon 12
Amelia is five feet, two inches tall and weighs 115 pounds. She is trying to lose weight before the school dance, which is two months away. The girls in her crowd encourage her to lose weight because most of them are trying to lose weight, too, and Amelia wants to be like them. Amelia enjoys food so much that she finds it very difficult to cut down on her eating, and her parents are anxious because she eats so little meat and whole grain ceral that she is losing pep. Do you think Amelia should continue trying to lose weight? Yes Ho .
Check each reason listed below as to whether it should make a difference to Amelia in deciding to stop or continue trying to lose weight.
If you think the reason should influence her decision very greatly then place an X in the box marked V.G. If you think the reason should influence her decision greatly, then place an X in the box marked G. If you are uncertain how much the reason should influence her decision then place an X in the box marked U. If you think the reason should influence her very little in making a decision then place an X in the box marked L. If you think the reason should not influence her at all then place an X in the box marked V.L.
95. Enjoying food is not important if you are trying to lose weight.
96. Amelia1 s health needs to be considered in her decision.
97. Amelia should do as the others do in order to be popular.
98. Because Amelia's parents are concerned about her, she should do as they suggest.
99. Amelia should forget about how the dieting would affect her health.
100. Amelia should choose foods without her parents' deciding for her.
101. Following the crowd is unnecessary if there is a reason for doing something different.
102. Amelia should eat the foods she enjoys and forget about dieting.
VG U VL
4-

169 -13-
Sltuation 13
Mary is in the eighth - grade. She is underweight and doesn't have much pep. Mary dislikes a great many foods especially vegetables and many kinds of meat. She does not like the foods served at the school lunch and often skips her noon meal. On her way home from school she usually stops at a restaurant for a sweet roll and pop. At dinner time she eats very little unless her mother has fixed fried chicken or chocolate cake which she likes very much. Mary's mother tells her she should eat more vegetables and meats. Do you feel Mary should learn to eat more foods? Yes No .
Check each reason listed below as to whether it should make a difference to Mary in deciding to learn or not learn to eat more foods.
If you think the reason should influence her decision very greatly then place an X in the box marked V.G, If you think the reason should influence her decision greatly, then place an X in the box marked G. If you are uncertain how much the reason should influence her decision then place an X in the box marked U. If you think the reason should influence her very little in. making a decision then place an X in the box marked L. If you think the reason should not influence her at all then place an X in the box marked V.L.
103. Mary should eat more meat and vegetables so she will be healthy.
104. Because Mary's mother knows more about what is best, she should do as her mother tells her.
105» Mary should eat with the others at school lunch because eating together is a way of being friendly.
106. If Mary does not enjoy the foods she should not have to eàt them.
107. Instead of letting her mother decide for her, Mary should make up her own mind.
108. It is not important for Mary to enjoy the food; she should eat it. anyway„
109. Mary should eat the foods she wants without worrying about her health.
110. It is not important to eat with the others at the school lunch? Mary can be friendly at other times.
VG U VL

170
APPENDIX F
Food Intake Records
1 Let as you do ordinarily. Don't chrrige your food habits.
k;. Write down everything you c-t -end drink. •
3 • Be sure to write, the kind of food you eat - like this:
; .. .Soups creen, of tomato ,; navy beans, split pep, . vegetecle
; 2-.ert - roart. beef, por^. chops, . hamburger ' . Splads - apple, celery rnd nut ; tuna and celery ;
. CFuCFp'e (if known, toll the kind: of .s~l?d ; dressing used)
..Desserts. - chocolate cske, . ep-;.le pie, vrnille pudding, je'lio witn canane slices
4. ..hen you c a t two or i ore foods combined write down each food included such es :
Cheese senuwlch: breaa - white l slices American cheese 1 slice Lettuce 1 leaf i-.eyo..nrlse 2 teesp. ons
i
b. "hen you t other combination foods such as casserole dishes, sou.,s and stews write down what is contained in the recipe, such as :
Beef stew - carrots 1/4 cup potatoes 1/4 cup beef cubes ic ounces
6• Tell how une food is cooked under "method of preparation" r'or example,
Potato - Lashed, baked, creamed Egg - fried, scrambled
If the food is not cooked but eaten raw, write "RAW" after it.

171
Write down the exact amount you eat of each food - use standard measuring cup, level teaspoon and tablespoon and a ruler to mersure your food.
Potatoes, mashed - 1 cup Bread, white - c slices Orange - 1 kilk - 1 cup Cp-.e - chocolate > " x 2" x 1 1/l"
If . you ...iss a mea l ,rite "Kothin;-11.
Be sure, and write/.dowh .what you ert between meals.
Ii" yuu any.vitamin . or mineral pills rt :io...e, tell ;w:iat 'kind you . v :;e, and. how of ten; you ta he - them.

172
This is s sample of how the record will look when it is proper Iv completed:
BREAKFAST
APPROX, FOOD KIND ' LSTHOD•OF PREPARATION MEASURE
2.p.;çi' • Fried 1
Bread. White Topsted 1 slice
Butter On topst. .: 1/c tSTD.
Orpn .V'e- juice .Frozen ' 1/2 CUD
Cocos. ^ " (3 T.'T ' ' i 1 1 '' 1 eus
BET.ZSi. 3REAKFA3T A.D i.OOF: .-JAL
r.nc.y err vhocolpte v it:; plconds

173
BREAKFAST FOOD RECORD
KAkE GRADE_
SCHOOL BATE
.-tEHKD'ERS1. « I
1. If you had bread or torst, under "..ind" did you put dov/n white, whole wheat, etc.?
£. If you hrd mrrgrri;.e or cutter or jelly, did you record it? •5. If you h sc. cereal, did you 'ell -the kind?:'- If you bed milk
or cresn. or su:-rr with the cereal die you tell how r;.uch? 4-.. If, you h^d rruit juice,, v r s it orange, grapefruit, grcpe,
etc.? ..ps it crnned, fresh or frozen? 5. If yuu didi.1 t hsve the n.e^l,. did you write-"down '"1'o-thir.g "?•
APPROX. FOOD ..IKD .,:.T iOD OF Px'PARATIÔK MASURE
3EÏV/EZ 3REAI.FA3T A1-:D l\OOI\ kZAL
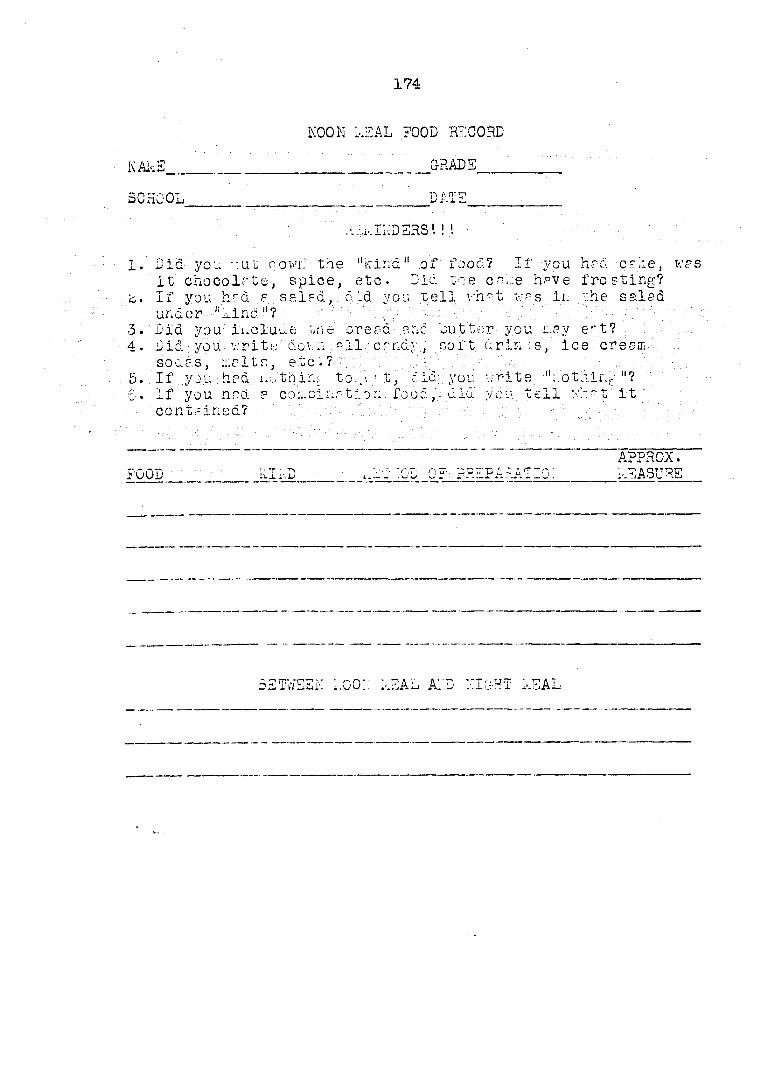
174
KOOK LEAL FOOD RECORD
KAkE _ __ &RADE
SCHOOL
Ess; ! t
1. Did you -:uû' oowr: 'the "Kind " of food? If you he à cr'.ie, ves i t chocol r te , sp ice , e tc . Did t ' i e cn . - : . e h?ve f ro s t ing?
b. If you hrà s ssifd, did you tell vh t v;f?s it. v.he ss.led under "kind"?
3. ' Did you inc luue t r ie c re rd ? .nd ou t t e r you e - ' t ? 4 . Did ; you.- v. - r i t e ' down- , p11 / c rndy . . , , so f t c r in : s , i ce creem
S0c.cS, : . . r 1 u r , , e t c .? % 5 . 1 f . y o u - h p d n o t h i n g t o , . ; : / t , d i d ; y o u w r i t e - " n o t h i n g 5 . I f you t in à ? co : , .o i i .n t io r : food; , d id ' you t e l l K: - t i t
' con ta ined?
APPROX. FOOD ilILD ..ETiOD OF PREPA^ATIO: kEASURE
BETWEEN l.oo:: 1-.EAL A::D HIOHT kSAL

175
XIGHT LEAL FOOD RECORD
KAkE • __ GRALE • _
SCHOOL ; '..ATE
REr.IKDERc ! V
1. Did you, put dow:. the . "r:ind " of fcoc? If you h- c. cp>e, we s it ciiocoi t., spice, ctc. Did tr.v crK-e h^ve fronting?
•c 'If you h?d P coLiCii.rtion food, did you tell v;N?t. it con opined.
3. If you hf'd; f spied, aid you tell r.r t • -n in; the splfd under "kind"? •
4. Did you ' include ti:e ore^d pnd .butter you n.py c^t? o. Bid you :;,ri ùl- ,'owi: rll. ;c" :.d; ,. soft. rir.lni .r;.,. ice crepn.. . .. ,
soars, ...Pits, etc.? • .0. 11', you h-d nothihr' :o. ert, %lid you "rite, "nothing"? •
- ' ÂïfRÔX" FOOD. . KIKB . r.E'1 =:0D 0 F P "FA RATI CI : ICASURS
Sl.r.O. D AFTER LIGHT i-.SAL

Breakfast
Between brea&fest end noon me el
ixo on meal
176
KAi'iE DAY DATE
FOODS AMOUNT METHOD OF PREPARATION
Between no o n ana evening meal
Sveninr meal
After evening meal
Vitamin supplement

177
Scoring of Food Intake Records
k numerical score \-;ss determined for e?ch subject by usin,_ the following velues for servings of foods.
Value • ..pxin.ur:; velues • l-.p xi muni 'values per sllo'xed for allowed for
Food fe.roup serving; 7 drys 3 dsvs
bilk, ana equivalents 1 22 12
3, ./
LeEUir.CS / v ^
^eef, veal, fowl, . ICL'C, i'lsh";,: . . -,:L - --v. ', -'3.
Por.:* Y ' 2 ' '
Liver" • 1 • 4 • 2
Hic:! Vit. 0 foods*" 1 7 3
.1^: V i t . A foods*"* 1 7 3
Other fr.lts 1 14 3
Other cooked veret' -les ' ]. ? 5
Raw vccet-_les 17 3
i.hi v,e pot - toes 1 7 3
. pr. a.d enriched crero. gi.d cercrls 1 cS 12
Butter fnd L.ar£-srine 1 4 _2
135 60
*k servih, = b ounces.
**0 ont rins Ft le.'-'St 4C n:p. of vit. C per serving.
**-"Jontr ins rt le-st 2500 I • V. of vit. A per serving.

178
Substitutions
1. Extra servings of &ert cm be substituted for eggs end legumes.
•c. Sxtrf serving.s of nigh 'vitrL-i'r. A rnd G fri its pii vege-tebles crn be substituted for other fruits rr.d other cooked vegetables.
•5. ' Sxtrp servicer of pot': tb<:n cm ce substituted for breed end :cereals'. -
Inis 'nccre, '.converted' into ; the: percentrg ev of- t'.e :..rxin.ur;. .
score:, is desi^.n^ted s t.'.o nutritional ?dc.u" cy score.
The. ..iPxi;;.Ui.. rllov/rnce : Is brs.,d on.'the number of /-orvii.fs of
foods i'roi;. t: .e v : rious i' ..rovpr. needed t: :..eet the ?.ecor:.-
u.ondcd di; „rry A_lov:mces of the d.r.tlon'1 Rvse^rch council
i'or r girl lc to 14 y- - rs of rge.

179
APPEISIX G
Sex-role Identification Scales
KAr.E
Age Jirth cVte_ -["month j " CyearT
Belov; rre listed some questions ebout how you take cere of your looks . After each question pre,-listed . some. answers. Put a check rfter the Answer thrt is ne?rest the truth, for you. 'There are no.. right or ..wrong >.nsv;'ers,' .just; check . whatever, seems right for you. .'.Unless' 'the••question., sp'ys" otherwise, think of these rs if you we're- hot"-on '.summer vacation :r-c tool. •
1. Bo you werr lips tic., to school? Always often • ' sv'...3times seldom never .
c. Do you vecr lipstick w.xon yo<-. •' re . all Pressed up . to go somewhere? Air ay s o ft en sometimes seldom neve.r_
•3. Do you finder r.ril polish when you f-re dressed up to go somewh ere? A Iw e y s o l't on_ ? o m eti m e s s eldo m n - v e r
4. ho w; often do y ci; crush or comb your hp ir p -day? Just once severrl times often manv times
Do you wear nigh heels when you rre -11 dressed up to go somewhere? Al-.pys often sometimes seldom never
6. Do you often look in e mirror during the day? V e r y of te n o rte n s o M etime s s e 1 G O m n ev e r
7. Do you werr perfume to school? Always often s o m e 11m e s s eldo m n ev e r
3. ''..'hen you pre ell dressed up do you wear perfume? Always o f ten sometimes seldom never
9. Do you we r r fp.ee powder or other make-up to school? Alw ays o Î ten sometimes s eldo m n v e r
10. Do you wear face powder or other m axe-up when you are all dressed up to go somewhere? Always often seldom never . .

180
Listed below are questions about your feelings about boys. After each question are five answers. Put a check after the answer which you think is right for you. There are no right or wrong answers. Answer each one as truthfully as you can.
1. Do you think boys like you? A great deal much some a little_ none at all
Do you like to t a lie with the other y iris about boys? A greet deal much some a little none at all
3.. Do,you liiie tc have. boys pay attention to you? A great deal much some e little_ none at all
4. Do you and. your, best girl friends talk rbou-t. .boys much? A great deal much some a little none at all
5. Do you like to go to parties where there are boys? A great deal much nome_ a little none at all
6. Do you like being kidded or teased by boys? A &rert deal much some a little none at all
7. Do you often wish there were no boys in your classes at school? Very often often sometimes seldom never_
8. Are some games more fun when boys are also taking part? kuch more more the same less much less
9. Do you think boys : re rough necks? All the time most of the time sometimes seldom not at all

181
APPENDIX H
Test; of Nutrition Knowledge
Naue_ Grade Age
Directions. 5 lee Lei,: the spree or sprees on thr. answer sheet . ..which correspond s : to- the i.u&cer; before the, : -statei-enys, you .tnin,v ,-re., correct./ There s,ay
. ce Lore % .one ri.- ht answer' to 8 /question
1. Jon:., uù 11 , c. b c s ;. ' t . li Le ' ::iIL v ; ryywel l ' cu t knows she . \ ..heedshi't for' _ pod. health. ' ' '.L-'ici 'one or ; on-s: 'of the y
•following' f'jô s coui' : she.' sucstitute' f or ' part: of her. Lille?
L':ï.;Luttur ^ - 4. L^.s L. Ice creru. e. 0ran, es 3. Solid yellow, cheese d. . .est
•c. r.rry he s ce en to le cy her doctor not to e - t oranyes since they ...me her sLin ore P.-: out cut she cm have all other Lines of fruit. Llien one or ones of these fruits may ce substituted f:.r oranyes ma provice similar nutrients?
1. Linerpyle 4 . Prunes k. Auyles 5. Bananas 5. Grapefruit Apricots
•5. i.'nich one or one? of the fol iowinr could ce classified as ci-rus fruits?
1. Apr lev. 4. 1er ch e s c- Oran es 5. Grapefruit 5. ?1 un.s 2. Apricots
4. '..Lie: one or ones of these five foods could ce tee best substitutes for the iucr t in the zeal?
1. Lacaroni salad Roast beef c. French fried potatoes Broccoli with cheese sauce •3• Ba^ed cear.s Tossed ere .n salad 4. Poached eggs Gmned peaches Cooky 5. Noodles in cream LiIL
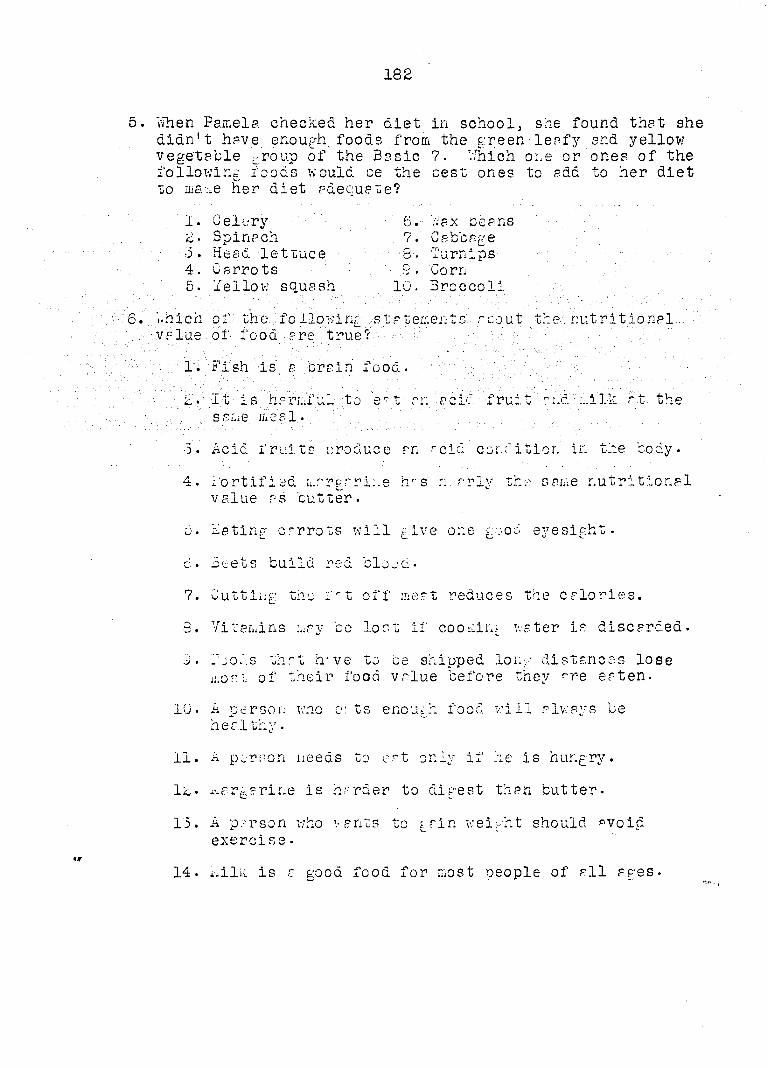
182
Vvhen Pamela checked her diet in school, she found that she didn't have enough foods from the green-leafy and yellow vegetable Lroup of the Basic ?. Which one or ones of the following foods would ce the best ones to add to her diet to ma:.e her diet adequate?
1. Celery 6. ..'ax ce ans 2- Spinach ?. Cabbage . 3. Head lettuce 8. Turnips 4. Carrots 5. Corn 5. Yellow squash 10. Broccoli
which of the following statements acout.•the:..nutritional.... . value of food pre true?
. '1. Fish is a .brain food.
L. 1 u is harmful to ect a n • e c id: :frui t ' r nd mi Ik • > t the ,seme meal.
•3. Acid fruits produce an - cid condition in the body.
4. Fortified margarine h"s nearly the same nutritional value as cutter.
ù. iiating crrrots will give one good eyesight.
c. Beets build red blood-
7. Cutting: the ft off meat reduces the calories.
3. Vitamins may be lost if cooking water is discarded.
C. Foods that h've to be shipped Ion;-- distances lose 1-.OSL of their food value before they <-re eaten.
10. A o e r s o i . who e: t s enough food w i l l a l w a y s be nealthy.
11. A person needs t o ert only if he is hungry.
1l. margarine is harder to digest than butter.
13. A person who wants to gain weight should avoid exercise.
14. i.ilii is c good food for most people of all ages.

183
Which member of this family should have the largest serving.: of meat?
1. The f-ther does hrrd work and needs mors meet because of his activity.
: -k,. -he tiioiher needs mors meat to replace the looses due to menstruation.
5. the 15-year-old boy needs more me" L to maintain his nearly '"duIt body and provide for -growth.
4.The 4-year-old girl is, growin g 'so ragid,ly rhe needs . the greatest share oi'; meat
use 'rood es effi-y.o.unger so she needs
Pat is thirteen years old and wants to lose some v:eight before tne school dance which is nerrly a month away. Indicate..which if any of the following reducing plans would help h;:.r lose weight and not affect her health.
1. _lan a diet which is adequate in all nutrients but low in foods which -re mainly sweet, starchy, or fatty .
b. Go on r citrus fruit diet.
3 • JO oi. a licuiti. diet.
cien.u. an ov
•y :"•£ •rsizi
did when she w ?rving of meat.
4. follow the diet r-: commended by a movie a tar.
fc. :-at everything she is now eating, cut take smaller servings.
Jane is IL y e •: r s old a nd had the following two meals at home :
breeKfast Ivenlnp: meal Toma to juice Por - chops Oatmeal with Baked potato - butter 1/b cup milk Apple - celery salad
Enriched toast - £ slices V;hole whe°t roll - butter kilk - glass (1) Vanilla ice cream
Iced tea

184
E'hlch one of the taree school lunches would, give her the foods she needs unie h pre lec.tlw in the other txvo ueels?
School lunches
. . . . :1- .. . . . - - 3-. - . - -Crernea potatoes . .-.rsrrpnl ••.r;,;!. ... .loaf.- sandwich
and pees cheese--' ( • -rk bread) ; ; Pineapple rinr.k .' Creus e epIfq- " "• / Buttered cabbage
s";lrd , Carrot -sticks- - Deviled eg; s-^lrd ..'ho le v;her t ' creed En rie hed bread - - Baked a le .. cutter .. butt.cr- ; . : . ,.llk ' .-.11.- .,... .-.ba ed cud c-uf-'trrc -;
^-Tcyr..,.:, -nil ., chv/ere-.'
..nic.. :o. l ikllovi.., rb ;- r jhs dercri ,c vny ? v t'iln-i " h e
,.4 . iivo r i. It lor. -xl ervlnr r xf or *: ri:c rltute -ro n.-;:dec .
c . c mo shoul h'-Vj ;.-ur cups m' ;..ll or : ; v-lont each : ay.
v.o rervln s of vholc r-- in or enriched cereals or crercs - re neeôed.
7. ^Iner-.plc 1? r . -.. o.. s-,u"ce ul' cirr fruit.
b. A ur. ei. or - c-llo\ v o -, .. ' e should ce included often.
KJ • Eleanor, 14 ye^-rs old, ' Lc not co..nec t her food intake v;ith her heait:;. S.:e chore ;..o-ls slL.il; r to x.o iollovini erch day.
E re .-if r r. t Dinner
( l) I-ruc^it-s (:.ade vi t:: Fork chop enricned flour) Bak.d pot- o-s ;.it'i cutter
cutter and sirup Br m n.u.'fln - butter S.-uDr^e or tty Che coir tt- pun: ina one :-1rs? of ...Hi Cnt 1 ~s of ndlk
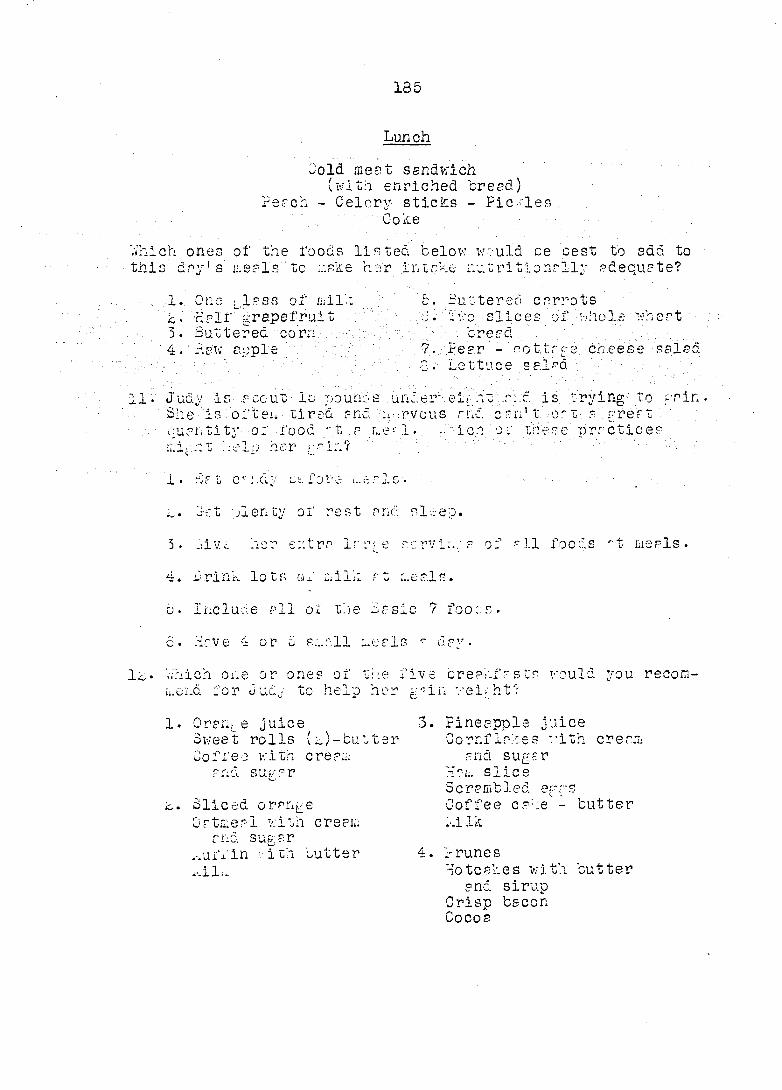
185
Lunch
Cold meet ssndwich (with enriched creed)
Peec'n - Celery sticks - Fic.-les . Coke
Vihi c h ones of the roods 11 s tec. belov: would ce pest to sdd to this dry1s meels to ;:.Rke h s r intrke r.utri tionrlly edecuete?
1. One l,1pss of milk. •c. Heir grapefruit 3. Buttered corn 4. hew apple
5. 3u*:tereô cerrots 6. Two -slices • of'-whole- whert '
. breed ?.. Peer - rot tree cheese se led 0. Lettuce sal^d
11. Judy is ecout lo pounds' under--, eight r;.c. is .trying-' -to grin. p. pre et She is often tired end n-rvous end- cen't
ouer.tity o:' foodyt r 1. .. :-lch or these prectices micht help her rein?
1. £e t csh.cïy et- fore i.. eric.
L. Cet plenty of rest end sleep.
3 . Give her e::trr lrr^e r.c-rvi:..- s of - 11 foods r-t Lie els.
4. Jjrink lots of milk et zeals.
à. Include ell of the Sesic ? fooos.
c. Hrve 4 or 5 s ...ell -..eels - dey.
1'c Which one or ones of the five creeei'r s te would you recommend for Ûudy to help her gcin weight?
1. OrenL e juice Sweet rolls (e)- but te] Coffee with ereem
end suger
c. Sliced orenge Oetmeel with creem
end sugsr muffin vïth Cutter ,.ii:_
3. Pineapple juice Cornflakes with ere em
end suger Hem slice Scrambled eggs Coffee ceee - butter v.i Ik
4. Prunes Hotceke s with butter
end sirup Crisp bscon Coco B
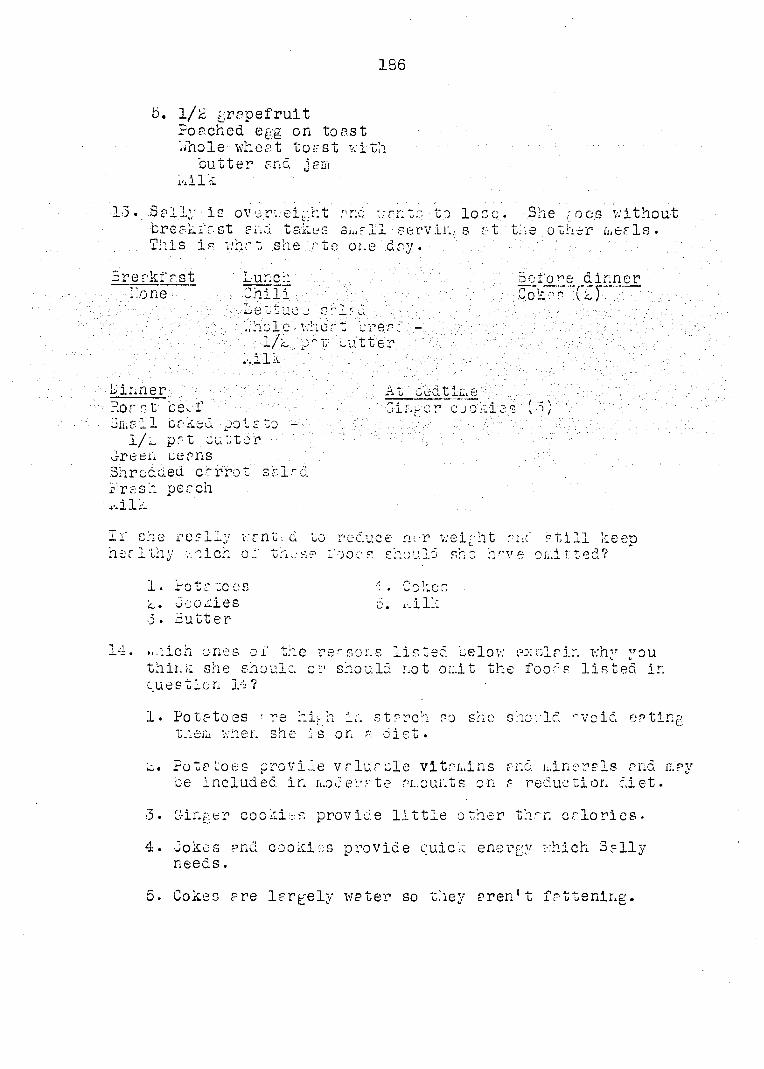
186
5. 1/& grapefruit Poached egg on toast './hole wheat toast with '
butter and janï kilk
She ; o c.s without e other n-eals .
Breakfast Lunch none . . Chili: .-
,;,Lettuco:h^lad..:.d holev wheat urea 1/k,, p-r Lutter
' -ilk .
A1 cedtiiite ;; "dr..- cr C'joklûs (3 )
13. Sally is overweight arid wants to lone., breakfast and takes s^all serviras at th This is what.she 'ate one dav.
Before dinner Co
Dinner ' ?.or nt bscf ;
dn.e.11 baked potato -1/l pat cutter
Green ceans Shredded carrot salad /rash peach r.ilrL
If che really healthy which
-. ant. a o.:' the :
reduce ncr 'ooo a ehoul:
weight i s h o. h »
till i 11 e d ?
keen
1. rota ":oes 1 . Coke L. Goodies 5. .-.ilk •3. Butter
14. »..:ich ones of the reasons listed below explain why you think she should or should not oir.it the foods listed in question 14 ?
I. Potatoes • re his h in starch so she s ho v Id "void eating tneru wner. she is on ? diet.
c. Potatoes provide valuable vitamins and udnerels and n.a be included in n.ocerate amounts on a reduction diet.
3. G-inger cookies provide little other than calories.
4. Jokes and cookies provide quick energy which Sally needs.
5. Cokes are largely water so they aren't fattening.

18?
5. The only nutrient cokes contain is sugar.
7. A sn.?; 11 amount of w; t is desirable in a reducing diet.
8• Butter adds many unnecessary calories.
2. Li 11: provides so many important, food m- te rial s it should net be oiuitted-
10. The cresiu .In- u.ilk .e;J 1L- ,?•. Lr ttei.in- f go:"
,11.-T at included .in r reducing di et / should ee rie.: in d V i L r fil.L ii •'**. •
The,. Jones family : has; to ..e very careful when choosing: food at the grocery store because tneir inco;..e is; lov: ann • they vpnt-' to '"/cuy foods that • re the mo s t dnutri ti.o ; -s, dThichdone of: the . pairs of foo'-s should they choose to get the most food value for their : w.oney . . . Select "one. of .ccch pair v/hich is the better buy. In questions 16, Id, iu, g>, and l4, you 'are asked to Indicate which of the reasons listed at the ri; ht explain your cnoice. mere :e i.:o re
15. 1. head lettuce c. cscbage
16. Vvhlch of the reasons at the rlkht explain your choice in
•r. one reason.
1- Food is low in cost and you get .wore (quantity) for the money.
i0 • le? (one wore /
17. 1. cornflakes L. oatmeal
18. ,,hion of tne reasons listed at tne right explain your choice in no. 17": (one or wore)
19. 1. round stea.. l. namourger
k,0. V.hich of the reasons Hated at the ri/.ht explain your choice in no. 1^ (one or more)
There is little waste ( bo n e a nd f a z ) p. n d therefore you get more edible food for the money•
iooc. gives more nutrients for the money soent.

188
£1 • 1. Frssh peas (ir. the pod) Carrots
V.;ich of the reasons listed at tne right explein your choice in no. £1? (one or L.ore)
£5. 1. Potatoes £. macaroni '
£4. '..".:icn of tne re a so i.s '.lis ted ' r t e.'t .e ri;nt expiai:. ' your "choice. .in ; no . 5? ( one ; or ...e re)
3elect, f.rdii. the .lis t' at tne "riphf the.:.nuirien.tr which '"the l'ollov.-i.^_. f • furnish. in l;..por tant, . ai:.ee;nt -.v : ."here :,.ay; be. Lore tea;, one nufrLent 1er eace food v ..
bô. zeef ' 1/UIAIZKI5 '
1-JLlk 1.. 71 r :,in A •
L?. Oran, os
>6. Carrets
^2. Jut ter
•30. £;->.s
Vitrei:. C
5. Iron
•1. Protein
c. Calcium

189
AFPEKDIX I
Phvsice 1 Activitv Record Form
i.ame _&ge_ ilrt-i dote (month) (;
Lnte
t. ut up r 'clock'
to £:..rne mi..u tee : t; --et ,cre°sed.
te the ;..ornli.b mer 1 ' t o ' clo c '':.
t.. toO A. II. C _____ ...l..uter te -t.
Ai'ter I rte, mic le v::.- 1 ci 1 : : :.I;r i 't:: e ' L.O r R.i i . r
. .: .r t .
..hr t_
..ilP U_
..h r t_
.,hrt_
..hvt
_ :0% Ion.
_-'ov: Ion:-
_ lonp;
lon: _
_Hov lonp;
_Hov; lonf-.
Ion;
_ .:i= 12 : .rl I aie. "t no or. :
I did not v -1 lunch • I 'te lunch "t o'clock.
I rte pu home • mpr.y minutes •
I rte s :me o ih or place. HOVJ n^ny minutes •
I rode my cicycle I rode in r c?r I v-Plked there
(Check one) How î'er? clocks. How many minutes
190
This is -.-.-hat I did in the afternoon:
v.hp t ' :ov; long
v.hr-t Hov: long
.,:i: L : •• Ho:' lor.;;
..hat, .. . ' ' lonp-
..ha.t_ : Ions'
-h-'t . , -O'V Ion
. T.- : h r ' t _ _ _ _ _ _ _ _ _ _ _ _ _ _ _ _ _ _ i o n ;
' r", T • - - • T_7 1 o • >• • J. \.J 1 . -
:1 -te L..ù' , ve;.inIv.ft, Jsl.L'-" o 1 ciocn •.
It L'J-' ;..e r.u v.e.r
-v:l '• .ir - i.-.hr t I c u • - rter .. • tin • -:'o re d. ent to
..h^"L ' "0v.' lon-:
..hat lor.fV •ii.
—— — rio V. j.0 n?
: ent zc bad ft o 1 cloc v..

191
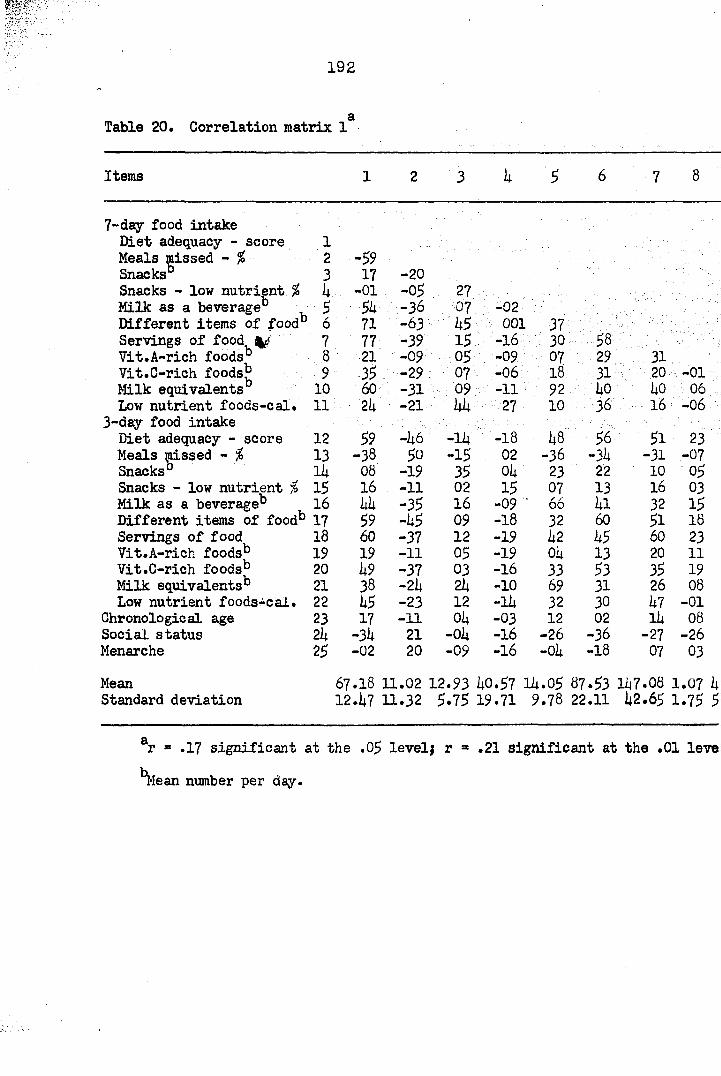
192
a Table 20. Correlation matrix 1
Items
7-day food intake Diet adequacy - score Meals missed - % Snacks Snacks - low nutrient % Milk as a beverage" , Different items of food" Servings of food Vit.A-rich foods" Vit.C-rich foods** Milk equivalents Low nutrient foods-cal.
3-day food intake Diet adequacy - score Meals missed - % Snacks° Snacks - low nutrient % Milk as a beverage*3
Different items of food*3
Servings of food Vit.A-rich foods*5
Vit.C-rich foods*' Milk equivalents*1 Low nutrient foods-cal.
Chronological age Social status Menarche
Mean Standard deviation
1 2 -59 3 17 -20 1* -01 -05 27 5 5k -36 07 -02 6 71 -63 1*5 001 37 7 77 -39 15 -16 30 . 58 8 21 -09 05 -09 07 : 29 31 9 35 -29 07 -06 18 31 20 -01
10 60 -31 09 -11 92 1*0 1*0 : 06 11 2l* -21 1*1* 27 10 36 16 -06
12 59 -1*6 -lit -18 1*8 56 51 23 13 -38 50 -15 02 -36 -3lt -31 -07 11* 08 -19 35 01* 23 22 10 05 15 16 -11 02 15 07 13 16 03 16 a -35 16 -09 66 1*1 32 15 17 59 -1*5 09 -18 32 60 51 18 18 60 -37 12 -19 1*2 1*5 60 23 19 19 -11 05 -19 01* 13 20 11 20 1*9 -37 03 -16 33 53 35 19 21 38 -21* 21* -10 69 31 26 08 22 1*5 -23 12 -11* 32 30 1*7 -01 23 17 -11 Olt -03 12 02 11* 08 21* -3k 21 -01* -16 -26 -36 -27 -26 25 -02 20 -09 -16 -01* -18 07 03
67.16 11.02 12.93 10.57 lit.05 87.53 147.08 1.07 k 12.1*7 11.32 5.75 19.71 9.78 22.11 1*2.65 1.75 5
a r = .17 significant at the .05 level; r = .21 significant at the .01 leve
^Mean number per day.

h 5 6 7 8 9 10 11 12 13 Hi 15 16 17 18 19 20 2
-02
001 37 -16 30 58 -09 07 29 31 -06 18 31 : 20 -01 -11 92 ko ko : 06 . 2k
27 10 36 16 —06 22 11
-18 k8 56 51 23 23 k9 08 02 -36 -3k -31 -07 -07 -38 -06 -60 ok 23 22 10 05 17 23 15 16 -25 15 07 13 16 03 02 07 03 02 -15 13 -09 66 kl 32 15 17 67 Ok 6k -53 -2k -06 -18 32 60 51 18 36 38 16 70 -kB 18 07 k5 -19 k2 k5 60 23 20 kB 11 85 -53 07 01 56 59 -19 Ok 13 20 11 09 11 -07 kk -25 001 -17 23 37 kk -16 33 53 35 19 50 35 01 k9 -28 17 -k9 23 56 kl 19 -10 69 31 26 08 07 68 07 63 -k5 25 -12 - 83 31 61 18 16 -lit 32 30 k7 -01 18 39 17 28 -23 32 31 23 39 29 01 22 1 -03 12 02 lk 08 21 11 05 07 06 06 -ok 09 09 -001 06 12 0 -16 -26 -36 -27 -26 -30 -25 -02 -20 09 -08 -ok -12 -20 -18 10 -30 -1 -lo -ok -18 07 03 12 -02 -16 -lk 11 05 -05 -11 -21 -15 13 02 -1
t0.57 Ik.05 87.53 lk7.08 1.07 k.26 18.78 306.99 73.U7 0.8k 0.97 kk-93 1.99 9.39 17.05 0.35 0.55 2.7 -9.71 9.78 22.11 k2.65 1.75 5.29 11.56 133.O0 lk.82 o.lk 0.58 36.23 0.92 2.60 5.2k O.kk 0.65 l.k
21 significant at the .01 level. Decimal points have been omitted in matrix.
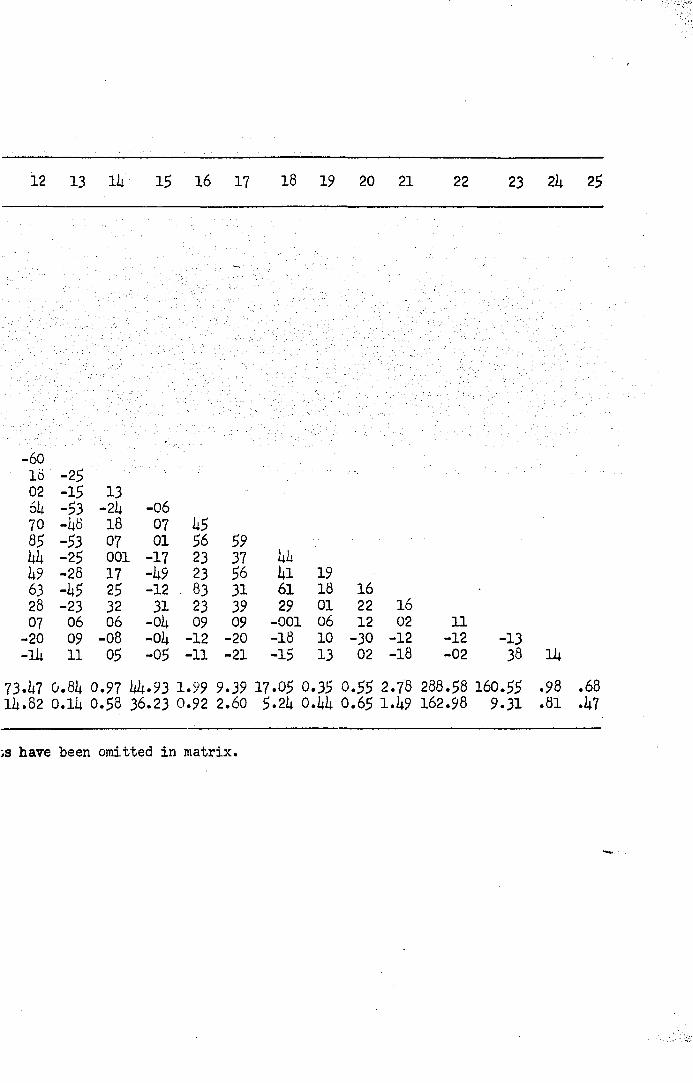
12 13 Hi 15 16 17 18 19 20 21 22 23 2l+ 25
-60 lo -25 02 -15 13 ôk -53 —21+ -06 70 -2+8 18 07 1+5 85 -53 07 01 56 59 1+1+ -25 001 -17 23 37 kk 1+9 -28 17 -1+9 23 56 1+1 19 63 -1+5 25 -12 . 83 31 61 18 16 28 -23 32 31 23 39 29 01 22 16 07 06 06 -01+ 09 09 -001 06 12 02 11
-20 09 -08 -01+ -12 -20 -18 10 -30 -12 -12 -13 -11+ 11 05 -05 -11 -21 -15 13 02 -18 -02 38 11+
73.1+7 0.81+ 0.97 a.93 1.99 9.39 17.05 0.35 0.55 2.76 288.58 160.55 . 98 . 68 11+.82 0.11+ 0.58 36.23 0.92 2.60 5.21+ 0.1+1+ 0.65 1.1+9 162.98 9.31 .81 .1+7
s have been omitted in matrix.

193
"Table 21. Correlation matrix 2e
Items 10 11 12 13 lit
-19 Ok 10 07 16 05 16 22 111
No. employed 1 No. member PTA" 2 No. member ch.org.^ 3 No. member card club", 4 No. member other org. 5 Plan meals 6 Buy food 7 Prepare some food 8 Prepare meals 9 Prepare own meals 10 Set table 11 -04 Wash dishes 12 00 Refuse new food 13 02 Taste for flavor lit 10 Taste-compulsory 15 00 Taste for experience 16 -15 Family criticism 17 22 Eating too much 18 23 Eating too little 19 02 Eating too often 20 00 Not eating right food 21 -09 Eating too fast 22 -06 Eating too slowly 23 07 Poor manners 2k 22 Other reasons 25 00 Food Enj. Scale I 26 -04 Food Enj. Scale II 27 -14 Food Exp. Scale 28 -07 Chronological age 29 -01 Social status 30 06 Menarche 31 04 Diet adequacy - score 32 -07 Meals missed 33 11 Snacks0 3k -05 Different items of food0 35 -05 Servings of food0 36 00 Repeated meals - no. 37 -09 Low nutritive food-cal.° 38 -15
Mean .61 Standard deviation .86
15 17 2k 22 19 -Olt
-Oli 16 -18 07 19 -09 08 15 -17 -11 21 -03 -06 11-09 16 01 -17 lit -05 -01 02 -02-02 -01 -12 -lit -12 11 03 09 17 13 0k 03 08 01 -10 -09 -17 -Olt -05 00 16 10 32 -01 -04 10 -05 03 17 -10 -02 -11 -06 -10
-Olt 07 -06 10 02 01 13 -0k 20 -25 05 -09 -lit -36 -37 -12 -08 -14 -06 17 03 —09 -14 -03 21 20 14 17 29 04 19 31 16 09 01 -07 15 -02 lit
14 04 -03 -06 04 11 11
39 45 49 39
16
03 10 10
06 -16 02 24 08 08 01 -01 - 05 -01 03 14 03 -17 -19 15 -04
-08 -06 -02 -12
-04 02 -12 -02 -19 03 -13 05 13 -21
-06 00 -14 02 -03 03 07 -02 -11 00 19 -18 15 -06 21 -15 06 -01 09 -09
20 26 .64 15 33 : 36 07 25 17 06 24 06
-17 -17-04 04 • 21 00 0? -11 -03 12 06 10
-13 12 05 -06 21 16 -05 -02 -02 -19 -06 -05 02 -02 -07 16 03 -12
-10 -03 03 -12 08 03 12 -04 08 14 -05 -10 09 -05 -08
-15 -15 -21 -07 -03 -04 -12 08 00 -11 01 -08
03 -07 -05 02 -08 -06 06 02 -05 03 10 -01 00 03 -05
-01 -04 -06 -01 -05 -08
01 03 34 -04 03 08 05
-02
04 -16 -13
09 02 07 -14 -06 01 -15 -09 14 11
-17 17 -37 02 0b -16 -21 -01 14
-08 -01
07 05
06 10 04 04
-04 -03 -21 -02
09 -19
10 01 17 20 02 15
-14 -05 -12 08 -13 -12 00 -13 -04 05 -08 -08 -17 -02 12 -02
-20 08 -07 -02
-19 09 -05 -07 -06 05
-01 -02
07 -07 -02 -06 05 -08
-06 06 00 04 -03 02 -12 01 lit -19
-24 26 08 03 12 -17 15 -17 03 -05 07 13
-20
-39 -C -05 1 02 1 03 -C -05 -0 -17 0 -01 -0
-11 0
25 -0 -01 1 01 -1 02 -0
1 0 0 0 0: 0
-02
-04 19 05 -01 -05 -10 -0, -09 -1' -02 -l1
20 li -07 -01
.48 .53 .19 .25 1.67 1.87 2.73 1.46 2.02 2.70 2.58 .10 .62 .1!
.50 .50 .40 .43 .85 .91 .74 .95 .78 .53 .64 .30 .49 .3<
ar = .17 at the .05 level; r • .21 at the .01 level. Decimal points have been omitted.
^Mother.
cMean number per day.

10 11 12 13 lit 15 16 17 18 19 20 21 22 23 2k 25 26 27 28 29 30
01 03 . 3k . Où 03 -17 08' ,0k. .17' -37 - -05 -16 02 . Ob -20 '../v.;..:.y::/-02 .-13. -16 -21 -39 -05 09 02 -01 lk -05 13 -07 07 -lk -Ok 10 02 13 -03 37 06 01 -03 01 03 -01 00 01 -23 15 -09 -21 17 -05 -01 -11 29 32 -19 lk 11 -02 20 -17 06 -13 33 03 02 17 38 06 09 02 -01 -02 03 02 02 -1~ -05 -02 31 10 -19 15 -11 00 -01 lu 02 00 03 12 -23 37 ok -01 -02 25 -09 -17 06 01 -17 -Ok -16 05 03 35 ok 07 -07 -oi 15 -08 -oi oo -12 -06 01 -lk -07 -10 Lk -05 -02 -06 01 -10 18 -06 -J. 7 -07 02 -23 lk -15 12 15 12 08 05 -08 02 -ok 09 -07 -18 -08 -11 -11 20 -l6 08 10 • 70 L3 -12 -06 06 -02 13 08 Ok 17 -06 00 01 15 02 -12 -13 -10 -11 30 -13 00 ok -ok 05 -05 -lk 06 -02 06 -02 -22 -07 -23 19 01 -07 -09 )k 05 -03 02 19 02 -21 -Ok 13 10 -01 -09 -06 05 -03 -09 -29 -20 Ok -08 )8 -08 -12 01 05 06 -03 -05 20 -10 11 -13 05 -03 -01 -11 -08 -12 07 35 07 17 -02 lk -19 -01 01 08 -23 -27 09 -19 -21 01 -18 00 03 22 05 -lk 15 -29 12 -02 -2k 26 -05 03 -02 18 20 01 19 05 -02 17 -02 -lk -lk 03 12 -12 17 >0 08 08 03 -10 -ok 16 12 02 08 05 00 15 -lk -20 -07 -08 -03 09 -05 -11 -)7 -02 12 -17 -09 -17 25 -02 -08 09 -09 -13 09 07 -09 -Ok 31 20 -07 -02 -29 -19 09 15 -17 -02 -15 17 -10 -26 10 -15 -12 13 -09 01 -Ok 23 09 -11 -Ok -39 -)5 -07 03 -05 20 16 -28 -03 -01 01 10 -Oli -07 -09 07 03 -02 -07 -02 09 17 )6 05 07 13 -07 -Ok -09 -07 -06 10 09 08 05 -05 -17 -10 -10 -06 04 01 00 -
>2 2.70 2.58 .10 .62 .15 .39 1.83 .21 .23 .3k .38 .30 .11 .19 .Ok 18.23 7.97 3-35 160.58 1.96 . '8 .53 .6k .30 .k9 .36 .k9 1.01 .kl .k2 .k8 .k9 -k6 .31 .kO .20 5.93 2.1+5 2.13 9.28 .80 .
ive been omitted.

23 2b 25 26 27 28 29 30 31 32 33 3U 35 36 37
03 -07 -10
-15 12 15 -16 08 10 - 70 02 -12 -13 -10 -11 -07 -23 19 01 -07 -09 05 -03 -09 -29 -20 Oit -08 -03 -01 -11 -08 -12 07 35 07 -18 00 03 22 05 -lit 15 -29 00 17 -02 -lit -lit 03 12 -12 17 18 -56
-lit -20 -07 -08 -03 09 -05 -11 -02 10 -11 07 -09 -Oit 31 20 -07 -02 -29 -lit It 8 -38 39 -09 01 -Oit 23 09 -11 -Oit -39 -12 65 -60 46 75 -09 07 03 -02 -07 -02 09 17 10 05 -25 -05 -16 -Olt -05 -17 -10 -10 -06 Olt 01 00 -08 18 -13 43 23 27 -07
.11 .19 .Olt 18.23 7.97 3-35 160.58 1.96 .66 66.95 l-°3 1.29 3.23 8,91 2.00
.31 .i|0 .20 5.93 2.45 2.13 9.28 .80 .48 12.01 1,11 0.61 0.63 2.19 1-57
Figure 1. Correlation metrix 3
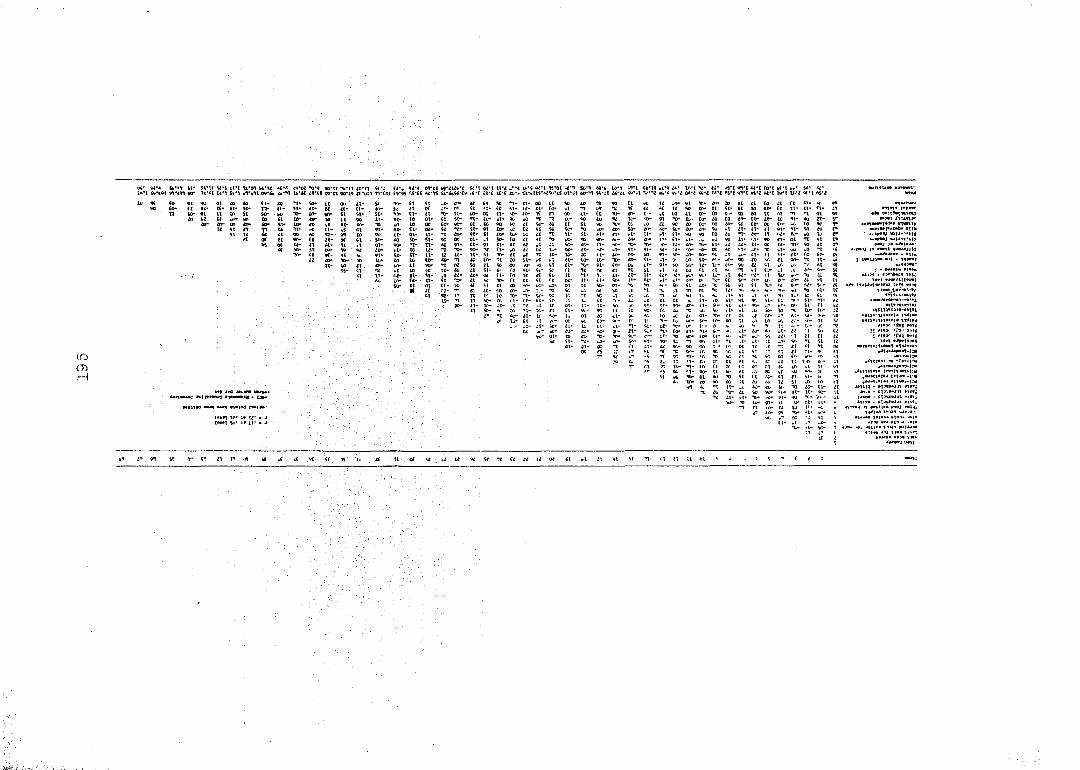
«•* ifc'fl sv SVV ti'S tvc ll'M H'M orot w9*<wa aS*I «VI *ft fO't t<*t i **wt rrm eo* 1***1 c*i $»• .Twit o»-<» «•n u*« irii W01 90*A« 0*011 Trent 1res f.S'tS WIS SA*i4S<*t9 ,(*( srfciis**«sr.«AS orst wi »•; 9VZ C*"< «'< IP't «*•! nS'i
It (0 91 9U oi <o MO Co- It «• t(- <1- li
tl Kr 01 It ti) so SI st* 51- 91* «*• ta ui U ti~ 90 Aunt»
91- «O- nl^WPt*)*' >1»tU rt rr il- A$ tt* miwpilib fit* u u (ft » . 11- • 1U rf or St* u«Wj WIJ'T'tlf
K "•
»*•; j» lAifM' 0O- «! « ;» »•'>
«- It- - ItU ttr V-- zo j i»ui« »n - «e*i?
SS- - ptit|a •!»•» SS-1T- r-Z- <t- mix ' t^iiktc* >>v:
St «•«1 • £ »v •it !»#• eum £ « ir If *£•
ii <nie«q.^.ts/
ueneiUHi»!» <t«* «4*1 peij
11 TUi a»>< : »l»r" •(•»!
»MI i^»»nnn uen»3tmeeet rt
Wt**1 -n •fp'-i'w
Vmimf t«m .•unt't»'
utiu - ni'i *•» 4*4 JKH •>:l - H».«wn »»•*!
IJXMM; ».|pn»>9 »ww |HM - «»r*j tti'i • «tw«i4i
m«t« ufii ne ft'm H P»>j »JtH. i*M»* iue^i r
ll»«H H«l. Ml» *t m »•* »!»•» J«t»
>• ». p«vu»
unj