factors influencing the organizational adoption of cloud ... influencing the organizational adoption...
TRANSCRIPT
ISSN (print):2182-7796, ISSN (online):2182-7788, ISSN (cd-rom):2182-780X
Available online at www.sciencesphere.org/ijispm
International Journal of Information Systems and Project Management, Vol. 6, No. 1, 2018, 5-23
◄ 5 ►
Factors influencing the organizational adoption of cloud
computing: a survey among cloud workers
Mark Stieninger
University of Applied Sciences Upper Austria
Wehrgrabengasse 1-3, 4400 Steyr, Austria
www.shortbio.net/[email protected]
Dietmar Nedbal
University of Applied Sciences Upper Austria
Wehrgrabengasse 1-3, 4400 Steyr, Austria
www.shortbio.net/[email protected]
Werner Wetzlinger
University of Applied Sciences Upper Austria
Wehrgrabengasse 1-3, 4400 Steyr, Austria
www.shortbio.net/[email protected]
Gerold Wagner
University of Applied Sciences Upper Austria
Wehrgrabengasse 1-3, 4400 Steyr, Austria
www.shortbio.net/[email protected]
Michael A. Erskine
Middle Tennessee State University
1301 E Main St, Murfreesboro, TN 37132, USA
www.shortbio.net/[email protected]
Abstract:
Cloud computing presents an opportunity for organizations to leverage affordable, scalable, and agile technologies.
However, even with the demonstrated value of cloud computing, organizations have been hesitant to adopt such
technologies. Based on a multi-theoretical research model, this paper provides an empirical study targeted to better
understand the adoption of cloud services. An online survey addressing the factors derived from literature for three
specific popular cloud application types (cloud storage, cloud mail and cloud office) was undertaken. The research
model was analyzed by using variance-based structural equation modelling. Results show that the factors of
compatibility, relative advantage, security & trust, as well as, a lower level of complexity lead to a more positive
attitude towards cloud adoption. Complexity, compatibility, image and security & trust have direct and indirect effects
on relative advantage. These factors further explain a large part of the attitude towards cloud adoption but not of its
usage.
Keywords: Cloud Computing; Cloud Adoption; Cloud Services; Diffusion of Innovations; Technology Acceptance Model;
Structural Equation Modelling.
DOI: 10.12821/ijispm060101
Manuscript received: 15 May 2017
Manuscript accepted: 13 December 2017
Copyr ight © 2018, SciKA. General permission to republish in p r int or electronic forms, but not for profit , a ll or part of this mater ial is granted, provided that the
Internat ional Journal o f Informat ion Systems and Pro ject Management copyr ight notice is given and that reference made to the publicat ion, to its date o f issue, and to
the fact that reprint ing pr ivileges were granted by permiss ion o f SciKA - Associat ion for Promotion and Disseminat ion o f Scient ific Knowledge.
Factors influencing the organizational adoption of cloud computing: a survey among cloud workers
International Journal of Information Systems and Project Management, Vol. 6, No. 1, 2018, 5-23
◄ 6 ►
1. Introduction
Cloud computing is a beneficial way of delivering information technology (IT) services to individuals and organizations
[1–5]. Even though cloud computing offers ways to improve their IT performance, the attitude towards cloud
computing is influenced by significant concerns toward this innovation [6, 7].
Being an important area for IT innovation and business investment [4], the adoption of cloud computing has received
increasing attention in both practice and research [8]. Although recent studies have provided information on the current
state of the adoption of cloud computing, there is still a need to study both the attitude towards adoption and the actual
usage of certain cloud application types across organizations of different sizes, industries and locations. Therefore, this
paper develops an explorative multi-theoretical model to examine important factors affecting cloud adoption among
organizations.
The goal of this paper is to verify a multi-theoretical research model recombined by factors originating from Davis'
Technology Acceptance Model (TAM) and Rogers' Diffusion of Innovation (DoI). While the factors are theoretically
based, this paper examines their practical relevance within the context of cloud computing. The remainder of this paper
is arranged as follows: Section 2 frames the background and motivates the necessity to derive factors relevant for the
intended purpose. In Section 3, the research model is presented, included factors are described and the proposed
hypotheses are deduced. Section 4 summarizes the operationalization of the influencing factors. Section 5 provides the
empirical results using variance-based structural equation modelling (PLS-SEM). Finally, conclusions and future work
are provided in Section 6.
2. Literature review: background and factor exploration in the context of cloud computing
As research on the diffusion of innovations dates back to the 1940s [9], various explorations of the drivers for
innovation adoption are found in the literature. Of primary interest for this research are empirical studies based on
widely accepted theories that are related to the topic of cloud computing. Furthermore, it is important to distinguish
between the adoption of innovations by individuals and adoption within organizations, as the adoption processes may be
quite different [10]. Several sources of recent topic-related literature show empirical evidence indicating that certain
factors influence the adoption decision regarding cloud services [2, 4, 6–8, 11–17].
To form a rigorous understanding of innovation, it is necessary to consider several factors of innovation simultaneously
and to evaluate their relationships [10]. For example, Holland and Light identified several critical success factors from a
larger list of potential factors found in relevant research [18]. The innovation factors that have the most consistently
significant relationships with innovation adoption are compatibility, relative advantage and complexity [10]. These three
factors originate from Rogers’ Diffusion of Innovation (DoI) theory, which suggested that diffusion is “the process by
which an innovation is communicated through certain channels over time among the members of a social system” [9],
whereas an innovation is “an idea, practice or object that is perceived as new by an individual or other unit of adoption”
[9]. Compatibility, relative advantage and complexity are perceived attributes of innovations that help to explain the
adoption of innovative technologies and therefore are considered to be relevant in the context of this research. In
addition to the factors stated by Rogers’ DoI, Moore and Benbasat considered image an important factor within their
development of an instrument to measure the perceptions of adopting an information technology innovation. Some
authors include image within the factor of relative advantage (e.g. 9). This has been criticised, as the effect of image is
rather different from the effect of relative advantage. Therefore, image should be specified as independent factor [10,
19, 20].
To examine the adoption of complex, new and interactive technology, it is beneficial to take factors from more than one
theoretical model into account in order to appropriately express the multi-faceted nature of such an adoption
phenomenon [4]. For this purpose, Davis’ Technology Acceptance Model (TAM) is also included in this study [21].
Davis suggested TAM to explore reasons for users to accept or reject information technology and to explain the impact
Factors influencing the organizational adoption of cloud computing: a survey among cloud workers
International Journal of Information Systems and Project Management, Vol. 6, No. 1, 2018, 5-23
◄ 7 ►
of design features of a system on user acceptance. Specifically, causal relations between external stimulus, cognitive
response, affective response and behavioural response are investigated. The factors perceived usefulness and perceived
ease-of-use determine the cognitive responses to system design features. However, even with the similarity of perceived
usefulness to relative advantage of perceived ease-of-use to complexity [19], these factors have been included as they
are of particular interest in the context of cloud computing research. Davis’ TAM primarily aims at influences on the
behaviour of individuals whereas this research focuses on the organizational perspective. However, Benamati and
Rajkumar stated that many IT decisions, such as that of outsourcing, are made by single individuals at the executive
levels of an organization [22]. Thus the application of TAM, which is designed to elicit responses of an individual, is
appropriate to evaluate acceptance of certain organization-wide technology decisions. However, TAM and its modified
versions are criticized for failing to address certain issues such as security & trust [2].
Furthermore, an examination of the adoption of innovations should focus on both the attitude towards adoption and
actual usage as the dependent variables [10]. Davis’ TAM also suggests distinguishing between those two variables. In
a recent study on Software-as-a-Service (SaaS) adoption, based on the theory of planned behaviour [23], Benlian, Hess,
and Buxmann found that the attitude toward the behaviour to adopt influences the actual SaaS adoption as well [11].
Based on these considerations, existing literature on influencing factors of technological innovations were compared
and categorized into the factors compatibility (CPT), relative advantage (REL), complexity (CPX), image (IMG) and
security & trust (SEC) which are widely accepted and verified in IS research. Stieninger et al. provide a comprehensive
examination of these factors [24]. This overview includes mainly empirical surveys that analyse different factors based
on well-established models and frameworks, as well as conceptual papers that aggregate these factors. All of the
empirical surveys [2, 4, 7, 12–17, 25–29] focus on only some of the aforementioned factors. Therefore, there is a lack of
studies that consider these factors simultaneously and evaluate their relationships.
3. Research Model
In this section, we describe the research model developed to explore the adoption of cloud computing. The model
consists of the factors derived from literature and hypotheses concerning relationships between these factors and
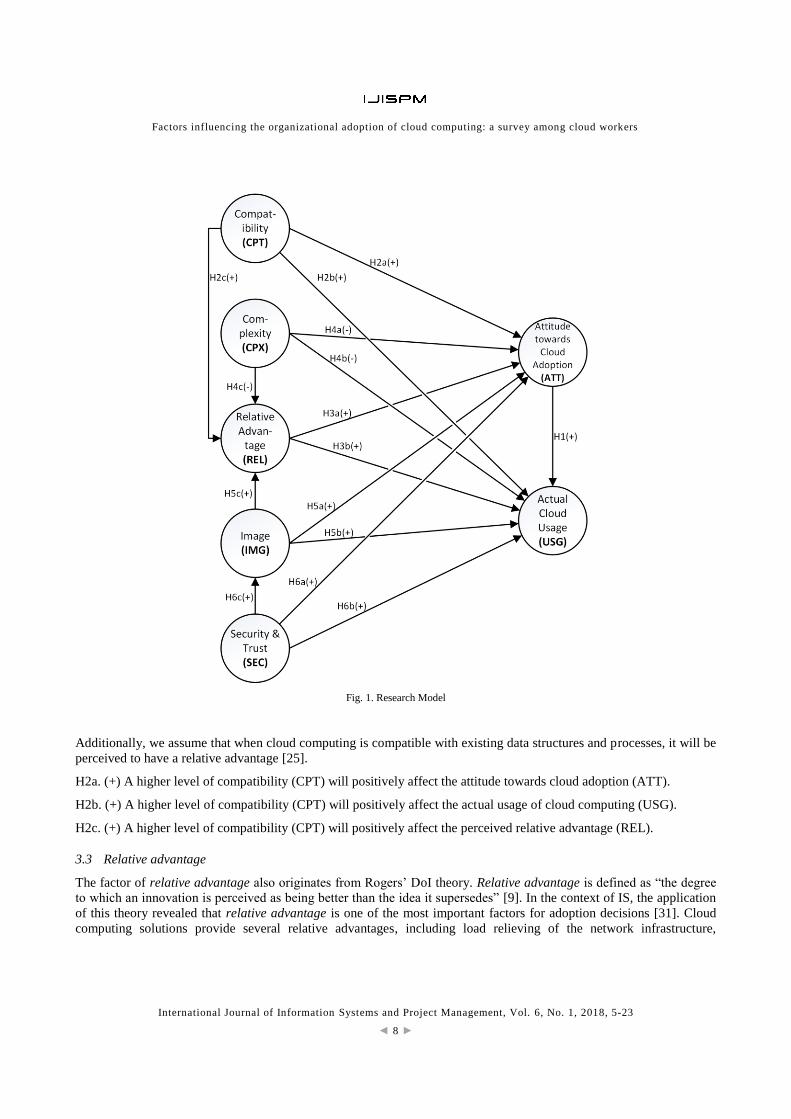
towards the constructs of attitude towards cloud adoption and actual cloud usage. Figure 1 (in next page) provides an
overview of the research model. The following subsections define and briefly discuss the factors and hypotheses
derived.
3.1 Attitude towards cloud adoption and actual cloud usage
Research studies on innovation characteristics should focus on both planned adoption and actual implementation as
dependent variables [10]. As mentioned earlier, Davis’ TAM suggests distinguishing between these two variables.
Additionally, in a recent study on SaaS adoption, based on the theory of planned behaviour [23], Benlian, Hess, and
Buxmann found that the attitude toward the adoption influences the actual SaaS adoption as well [11]. Therefore, we
hypothesize:
H1. (+) The attitude towards cloud adoption (ATT) positively affects the actual usage of cloud computing (USG).
3.2 Compatibility
The factor of compatibility is derived from Rogers’ DoI theory. “Compatibility is the degree to which an innovation is
perceived as consistent with the existing values, past experiences and needs of potential adopters” [9]. Tornatzky et al.
define compatibility in a more operational way as “congruence with the existing practices of the adopters” [10]. In
addition, there is a need to distinguish between technical compatibility and organizational compatibility [30].
Consequently, the proposed hypotheses are based on the assumption that increased compatibility influences the
adoption intention and the actual adoption of cloud computing in a positive way [4, 10, 16, 20].
Factors influencing the organizational adoption of cloud computing: a survey among cloud workers
International Journal of Information Systems and Project Management, Vol. 6, No. 1, 2018, 5-23
◄ 8 ►
Fig. 1. Research Model
Additionally, we assume that when cloud computing is compatible with existing data structures and processes, it will be
perceived to have a relative advantage [25].
H2a. (+) A higher level of compatibility (CPT) will positively affect the attitude towards cloud adoption (ATT).
H2b. (+) A higher level of compatibility (CPT) will positively affect the actual usage of cloud computing (USG).
H2c. (+) A higher level of compatibility (CPT) will positively affect the perceived relative advantage (REL).
3.3 Relative advantage
The factor of relative advantage also originates from Rogers’ DoI theory. Relative advantage is defined as “the degree
to which an innovation is perceived as being better than the idea it supersedes” [9]. In the context of IS, the application
of this theory revealed that relative advantage is one of the most important factors for adoption decisions [31]. Cloud
computing solutions provide several relative advantages, including load relieving of the network infrastructure,
Factors influencing the organizational adoption of cloud computing: a survey among cloud workers
International Journal of Information Systems and Project Management, Vol. 6, No. 1, 2018, 5-23
◄ 9 ►
reduction of hardware maintenance and infrastructure operation, flexibility, simple administration, collaboration
opportunities, potential cost savings and increased automation [6]. Consequently, the corresponding hypotheses are:
H3a. (+) A higher level of perceived relative advantage (REL) will positively affect the attitude towards cloud adoption
(ATT).
H3b. (+) A higher level of perceived relative advantage (REL) will positively affect the actual usage of cloud
computing (USG).
3.4 Complexity
Complexity has been extensively studied in the IS literature [25]. Rogers defines complexity as “the degree to which an
innovation is perceived as relatively difficult to understand and use” [9]. The longer it takes to understand and to
implement an innovation, the more likely it is that complexity turns into a barrier for adoption of a new technology. This
is why complexity usually negatively affects adoption of technologies [4, 16, 30]. However, a study among small and
medium enterprises (SMEs) revealed that experts do not consider cloud computing as a very complex technology to
implement due to simple administration tools, high usability, as well as a high degree of automation [6]. In TAM, Davis
describes complexity from a positive point of view and uses the term ease-of-use. He defines it as “the degree to which
an individual believes that using a particular system would be free of physical and mental effort” [21]. Even though
there are general differences between Rogers’ DoI theory and Davis’ TAM (i.e., Rogers focuses on the organizational
and Davis on the individual perspective, concerning complexity and ease-of-use), they are both discussing the
perception of individuals. Several studies suggest that individuals will see greater relative advantage in innovations that
are perceived as easy to use (e.g., [7, 25, 27]). Hence, increased complexity probably inhibits the adoption of
technological innovations. For that purpose, the factors are negatively correlated in the proposed hypotheses [4, 16].
H4a. (-) A higher level of complexity (CPX) will negatively affect the attitude towards cloud adoption (ATT).
H4b. (-) A higher level of complexity (CPX) will negatively affect the actual usage of cloud computing (USG).
H4c. (-) A higher level of complexity (CPX) will negatively affect the perceived relative advantage of cloud computing
(REL).
3.5 Image
Moore and Benbasat define image as “the degree to which use of an innovation is perceived to enhance one's image or
status in one's social system” [19]. Existing research suggests that image can be seen as the reputation of the service
provider [26], the reputation of the company adopting the solution [32], and the innovativeness of the solution itself
[26]. In the context of cloud computing, the factor image is of high importance, because attitudes towards the adopted
technology might also be transferred to the company and thereby influence its image [6]. Previous studies also found
that the influence of image is partially mediated by relative advantage [25]. Therefore, we hypothesize:
H5a. (+) A better image (IMG) will positively affect the attitude towards cloud adoption (ATT).
H5b. (+) A better image (IMG) will positively affect the actual usage of cloud computing (USG).
H5c. (+) A better image (IMG) will positively affect the perceived relative advantage of cloud computing (REL).
3.6 Security & trust
As a literature overview by Gefen et al. found, there is a multitude of differing approaches for the conceptualization of
trust [33]. For the scope of this paper, the factor is considered as the ability of the involved actors to convey the
perception of trustfulness [6]. Trust is characterized as a critical quality of service (QoS) parameter to be considered for
service requests within the context of cloud computing [34]. This factor is especially crucial regarding scenarios
involving public cloud [35]. Following Wu, perceived security and safety were applied as an element of trust and thus
Factors influencing the organizational adoption of cloud computing: a survey among cloud workers
International Journal of Information Systems and Project Management, Vol. 6, No. 1, 2018, 5-23
◄ 10 ►
security and trust were combined to a single factor [2]. Issues in security & trust are also likely to affect the image of
cloud computing [32]. Accordingly, the following hypotheses are proposed:
H6a. (+) A higher level of security and trust (SEC) will positively affect the attitude towards cloud adoption (ATT).
H6b. (+) A higher level of security and trust (SEC) will positively affect the actual usage of cloud computing (USG).
H6c. (+) A higher level of security and trust (SEC) will positively affect the perceived image of cloud computing
(IMG).
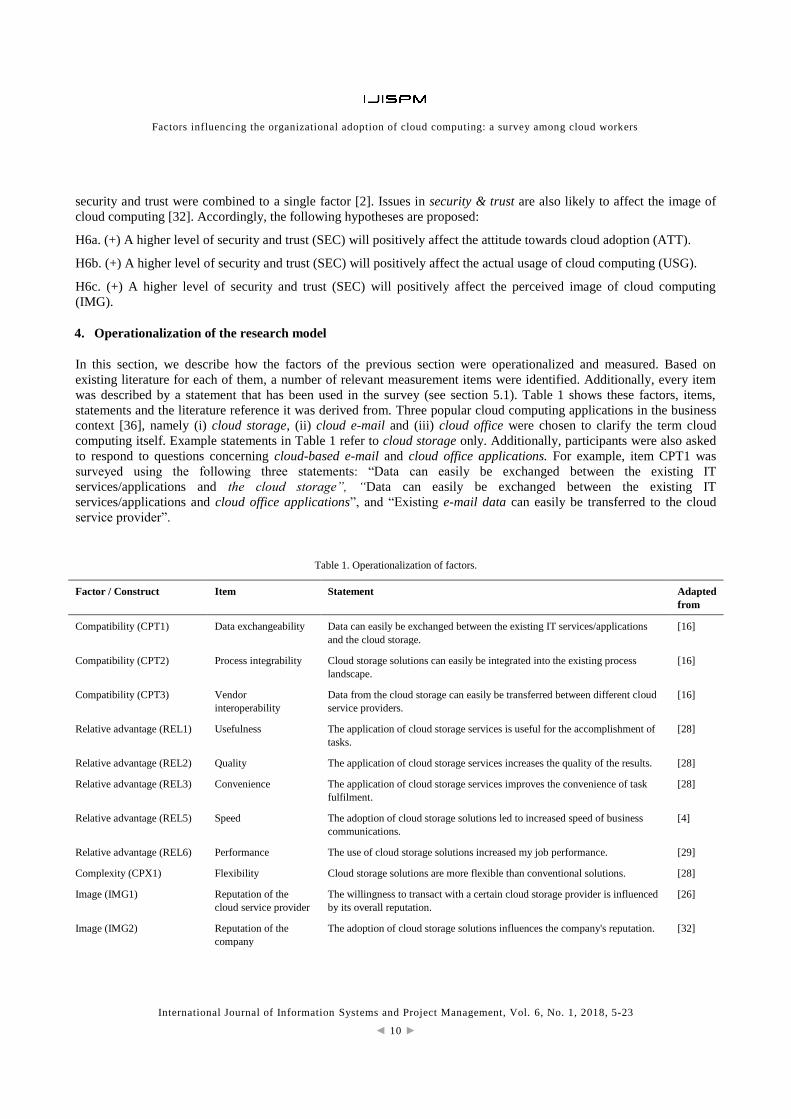
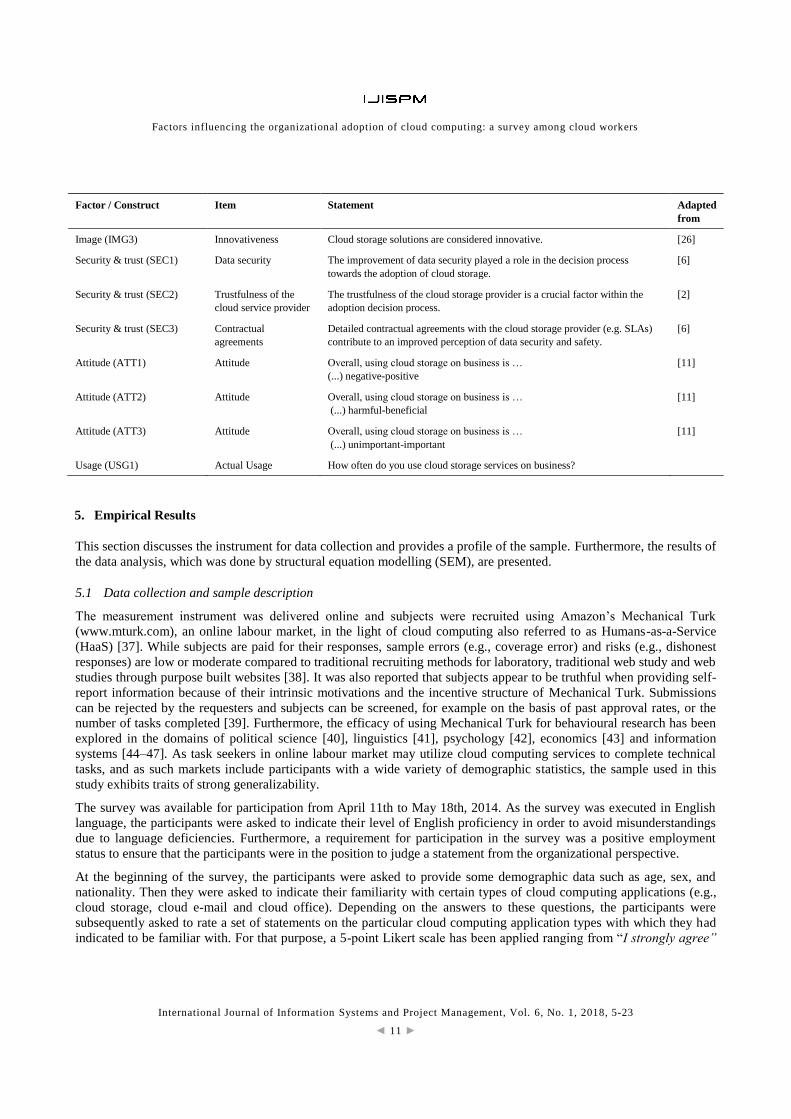
4. Operationalization of the research model
In this section, we describe how the factors of the previous section were operationalized and measured. Based on
existing literature for each of them, a number of relevant measurement items were identified. Additionally, every item
was described by a statement that has been used in the survey (see section 5.1). Table 1 shows these factors, items,
statements and the literature reference it was derived from. Three popular cloud computing applications in the business
context [36], namely (i) cloud storage, (ii) cloud e-mail and (iii) cloud office were chosen to clarify the term cloud
computing itself. Example statements in Table 1 refer to cloud storage only. Additionally, participants were also asked
to respond to questions concerning cloud-based e-mail and cloud office applications. For example, item CPT1 was
surveyed using the following three statements: “Data can easily be exchanged between the existing IT
services/applications and the cloud storage”, “Data can easily be exchanged between the existing IT
services/applications and cloud office applications”, and “Existing e-mail data can easily be transferred to the cloud
service provider”.
Table 1. Operationalization of factors.
Factor / Construct Item Statement Adapted
from
Compatibility (CPT1) Data exchangeability Data can easily be exchanged between the existing IT services/applications
and the cloud storage.
[16]
Compatibility (CPT2) Process integrability Cloud storage solutions can easily be integrated into the existing process
landscape.
[16]
Compatibility (CPT3) Vendor
interoperability
Data from the cloud storage can easily be transferred between different cloud
service providers.
[16]
Relative advantage (REL1) Usefulness The application of cloud storage services is useful for the accomplishment of
tasks.
[28]
Relative advantage (REL2) Quality The application of cloud storage services increases the quality of the results. [28]
Relative advantage (REL3) Convenience The application of cloud storage services improves the convenience of task
fulfilment.
[28]
Relative advantage (REL5) Speed The adoption of cloud storage solutions led to increased speed of business
communications.
[4]
Relative advantage (REL6) Performance The use of cloud storage solutions increased my job performance. [29]
Complexity (CPX1) Flexibility Cloud storage solutions are more flexible than conventional solutions. [28]
Image (IMG1) Reputation of the
cloud service provider
The willingness to transact with a certain cloud storage provider is influenced
by its overall reputation.
[26]
Image (IMG2) Reputation of the
company
The adoption of cloud storage solutions influences the company's reputation. [32]
Factors influencing the organizational adoption of cloud computing: a survey among cloud workers
International Journal of Information Systems and Project Management, Vol. 6, No. 1, 2018, 5-23
◄ 11 ►
Factor / Construct Item Statement Adapted
from
Image (IMG3) Innovativeness Cloud storage solutions are considered innovative. [26]
Security & trust (SEC1) Data security The improvement of data security played a role in the decision process
towards the adoption of cloud storage.
[6]
Security & trust (SEC2) Trustfulness of the
cloud service provider
The trustfulness of the cloud storage provider is a crucial factor within the
adoption decision process.
[2]
Security & trust (SEC3) Contractual
agreements
Detailed contractual agreements with the cloud storage provider (e.g. SLAs)
contribute to an improved perception of data security and safety.
[6]
Attitude (ATT1) Attitude Overall, using cloud storage on business is …
(...) negative-positive
[11]
Attitude (ATT2) Attitude Overall, using cloud storage on business is …
(...) harmful-beneficial
[11]
Attitude (ATT3) Attitude Overall, using cloud storage on business is …
(...) unimportant-important
[11]
Usage (USG1) Actual Usage How often do you use cloud storage services on business?
5. Empirical Results
This section discusses the instrument for data collection and provides a profile of the sample. Furthermore, the results of
the data analysis, which was done by structural equation modelling (SEM), are presented.
5.1 Data collection and sample description
The measurement instrument was delivered online and subjects were recruited using Amazon’s Mechanical Turk
(www.mturk.com), an online labour market, in the light of cloud computing also referred to as Humans-as-a-Service
(HaaS) [37]. While subjects are paid for their responses, sample errors (e.g., coverage error) and risks (e.g., dishonest
responses) are low or moderate compared to traditional recruiting methods for laboratory, traditional web study and web
studies through purpose built websites [38]. It was also reported that subjects appear to be truthful when providing self-
report information because of their intrinsic motivations and the incentive structure of Mechanical Turk. Submissions
can be rejected by the requesters and subjects can be screened, for example on the basis of past approval rates, or the
number of tasks completed [39]. Furthermore, the efficacy of using Mechanical Turk for behavioural research has been
explored in the domains of political science [40], linguistics [41], psychology [42], economics [43] and information
systems [44–47]. As task seekers in online labour market may utilize cloud computing services to complete technical
tasks, and as such markets include participants with a wide variety of demographic statistics, the sample used in this
study exhibits traits of strong generalizability.
The survey was available for participation from April 11th to May 18th, 2014. As the survey was executed in English
language, the participants were asked to indicate their level of English proficiency in order to avoid misunderstandings
due to language deficiencies. Furthermore, a requirement for participation in the survey was a positive employment
status to ensure that the participants were in the position to judge a statement from the organizational perspective.
At the beginning of the survey, the participants were asked to provide some demographic data such as age, sex, and
nationality. Then they were asked to indicate their familiarity with certain types of cloud computing applications (e.g.,
cloud storage, cloud e-mail and cloud office). Depending on the answers to these questions, the participants were
subsequently asked to rate a set of statements on the particular cloud computing application types with which they had
indicated to be familiar with. For that purpose, a 5-point Likert scale has been applied ranging from “I strongly agree”
Factors influencing the organizational adoption of cloud computing: a survey among cloud workers
International Journal of Information Systems and Project Management, Vol. 6, No. 1, 2018, 5-23
◄ 12 ►
to “I strongly disagree” (e.g., [2, 12]). The attitude towards the particular type of cloud computing application was
queried through the semantic differential approach and the use of three bipolar dimensions (negative-positive, harmful-
beneficial, and unimportant-important), likewise on a 5-point Likert scale [11, 48] (cf. Table 1).
We included several mechanisms to assess the seriousness of the responses:
The survey was only available to workers who demonstrated consistent accuracy. Specifically, the survey was
only available to subjects with an approval rate of at least 97% and who previously completed at least 500
approved tasks.
The participants were not told about the initial requirements to be included in the sample. Instead, a short
survey with the possibility to take part in an extended survey was launched. The resulting sample only includes
participants with a professional English proficiency level and an employment status either “employed” or
“self-employed” (i.e., participants with limited English skills, as well as unemployed people, students, or
pensioners were excluded).
To prevent repeated submissions by an individual participant, the unique identifiers assigned to each user by
Amazon’s Mechanical Turk (“Worker ID”) was verified to be unique prior to the data analysis. The participants were asked to reflect on the accurateness of their responses in a final question (“What
describes best what you have just done?”), remarking that their answer would not have any influence on the
reward. Only respondents answering with “I focused on each question and answered them to the best
knowledge and belief” were included in the sample.
Only completed surveys were included. As additional indicator of the accuracy of the task, a 10-digit code
titled “response id” was displayed within the text at the last page. Respondents were required to provide this
code to the Mechanical Turk system. Only responses with a valid code were included in the sample.
The overall time needed to fill out the survey was also monitored, as response time may serve as additional
indicator of the seriousness of the answers [47]. Instead of removing the fastest responses, a minimum of two
minutes for answering the questions on each cloud application type was used as reference time for inclusion in
the sample.
Overall, the final sample includes responses from 203 individuals, with more men (63%) than women (37%)
participating. 60% of the participants were younger than 35 years. The geographical distribution shows that the majority
of them were located in North America (41.87%), Asia (33.50%) and Europe (18.72%). Participation in other continents
(Africa, Australia, South America) was lower (combined 5.91%). Since each participant filled out one set of questions
for each cloud application type (e.g., cloud storage, cloud e-mail, cloud office) he/she had indicated to be familiar with,
the dataset includes 518 complete responses (182 for cloud e-mail, 174 for cloud storage and 162 for cloud office).
Regardless of how many application types they filled out due to the familiarity, each participant received 2 USD for the
completion of the full survey via their Amazon Mechanical Turk account. Consequently, the sample can be considered
heterogeneous. While participation in online labour markets, such as Amazon Mechanical Turk are popular in Asia, this
study was able to generate a sample with a good mix in respect to sex, age and location.
5.2 Evaluation of the research model
Due to the complexity of the relationships between the factors, structural equation modelling (SEM) was used to
evaluate the research model [49–51]. This statistical multivariate technique combines factor analysis and regressions. It
enables the examination of relationships among measured variables and latent variables. Latent variables are abstract,
complex and not directly measurable. In the context of this study, the factors of the theoretical research model are latent
variables (see Figure 1).
There are two forms of structural equation modelling (SEM): variance-based structural equation modelling (PLS-SEM)
and covariance-based structural equation modelling (CB-SEM). For this study, we applied PLS-SEM (Partial Least
Squares Structural Equation Modelling) as (i) it has no requirements as to the normality of the latent values in the
Factors influencing the organizational adoption of cloud computing: a survey among cloud workers
International Journal of Information Systems and Project Management, Vol. 6, No. 1, 2018, 5-23
◄ 13 ►
population, (ii) it is used in exploratory research for predictive applications, and (iii) it is designed to explain variance in
dependent variables [50, 51].
During the analysis, five indicators (CPX1, CPX3, REL4, SEC4 and USG2) were eliminated as they did not meet the
required criteria. Thus, henceforth, the eliminated indicators are no longer mentioned within this paper. As all items are
manifestations of the latent variables, the investigated model is considered reflective.
To evaluate the model using PLS-SEM a two-step approach was conducted, consisting of (i) the evaluation of the
measurement model followed by (ii) the evaluation of the structural model [50].
5.3 Measurement model evaluation
Evaluating the measurement model involved four steps including an examination of (i) t-values of item loadings, (ii)
internal consistency reliability, (iii) convergent validity, and (iv) discriminant validity.
T-values of item loadings. The bootstrap draws a large number of sub-samples from the original data with replacements
to approximate the sampling distribution and derive the standard error and standard deviation of the estimated
coefficients to calculate their t-values. For the tested model, all items can be considered reliable and valid, as the t-
values of the loadings of each of them are greater than 25.
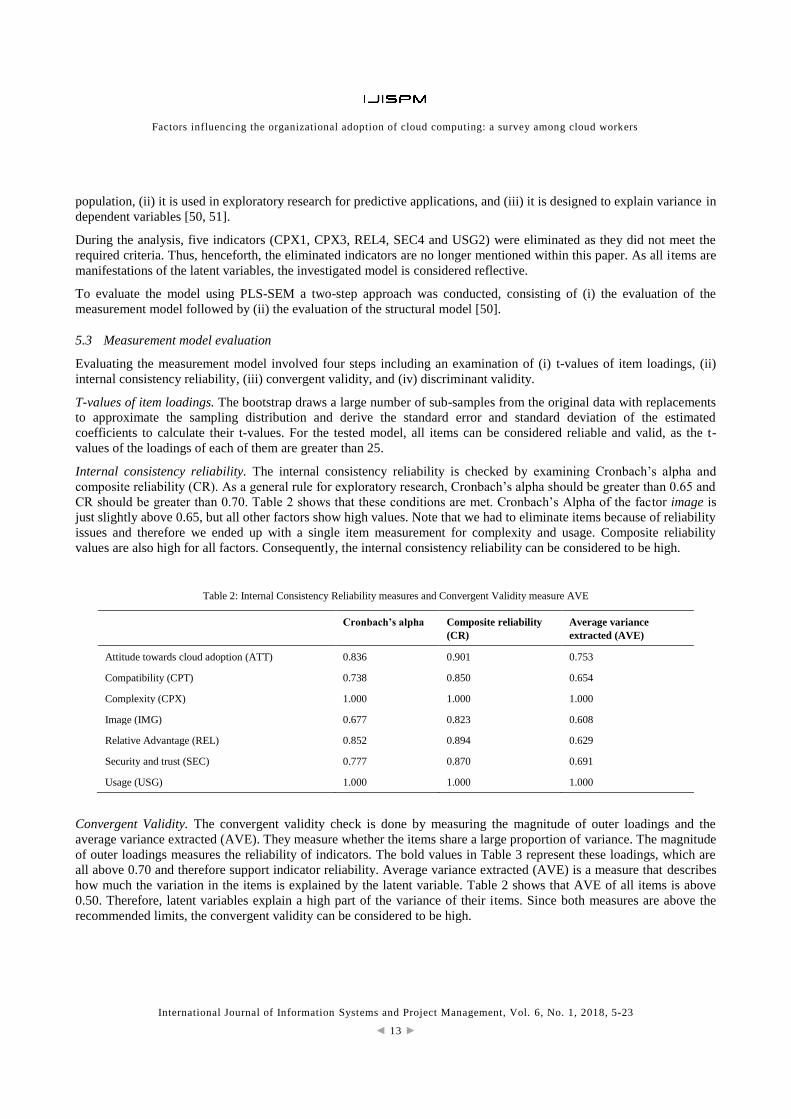
Internal consistency reliability. The internal consistency reliability is checked by examining Cronbach’s alpha and
composite reliability (CR). As a general rule for exploratory research, Cronbach’s alpha should be greater than 0.65 and
CR should be greater than 0.70. Table 2 shows that these conditions are met. Cronbach’s Alpha of the factor image is
just slightly above 0.65, but all other factors show high values. Note that we had to eliminate items because of reliability
issues and therefore we ended up with a single item measurement for complexity and usage. Composite reliability
values are also high for all factors. Consequently, the internal consistency reliability can be considered to be high.
Table 2: Internal Consistency Reliability measures and Convergent Validity measure AVE
Cronbach’s alpha Composite reliability
(CR)
Average variance
extracted (AVE)
Attitude towards cloud adoption (ATT) 0.836 0.901 0.753
Compatibility (CPT) 0.738 0.850 0.654
Complexity (CPX) 1.000 1.000 1.000
Image (IMG) 0.677 0.823 0.608
Relative Advantage (REL) 0.852 0.894 0.629
Security and trust (SEC) 0.777 0.870 0.691
Usage (USG) 1.000 1.000 1.000
Convergent Validity. The convergent validity check is done by measuring the magnitude of outer loadings and the
average variance extracted (AVE). They measure whether the items share a large proportion of variance. The magnitude
of outer loadings measures the reliability of indicators. The bold values in Table 3 represent these loadings, which are
all above 0.70 and therefore support indicator reliability. Average variance extracted (AVE) is a measure that describes
how much the variation in the items is explained by the latent variable. Table 2 shows that AVE of all items is above
0.50. Therefore, latent variables explain a high part of the variance of their items. Since both measures are above the
recommended limits, the convergent validity can be considered to be high.
Factors influencing the organizational adoption of cloud computing: a survey among cloud workers
International Journal of Information Systems and Project Management, Vol. 6, No. 1, 2018, 5-23
◄ 14 ►
Discriminant validity. The discriminant validity describes whether each latent variable is distinctly different from the
others. This can be measured using (i) the item cross-loadings and (ii) the Fornell-Larcker criterion.
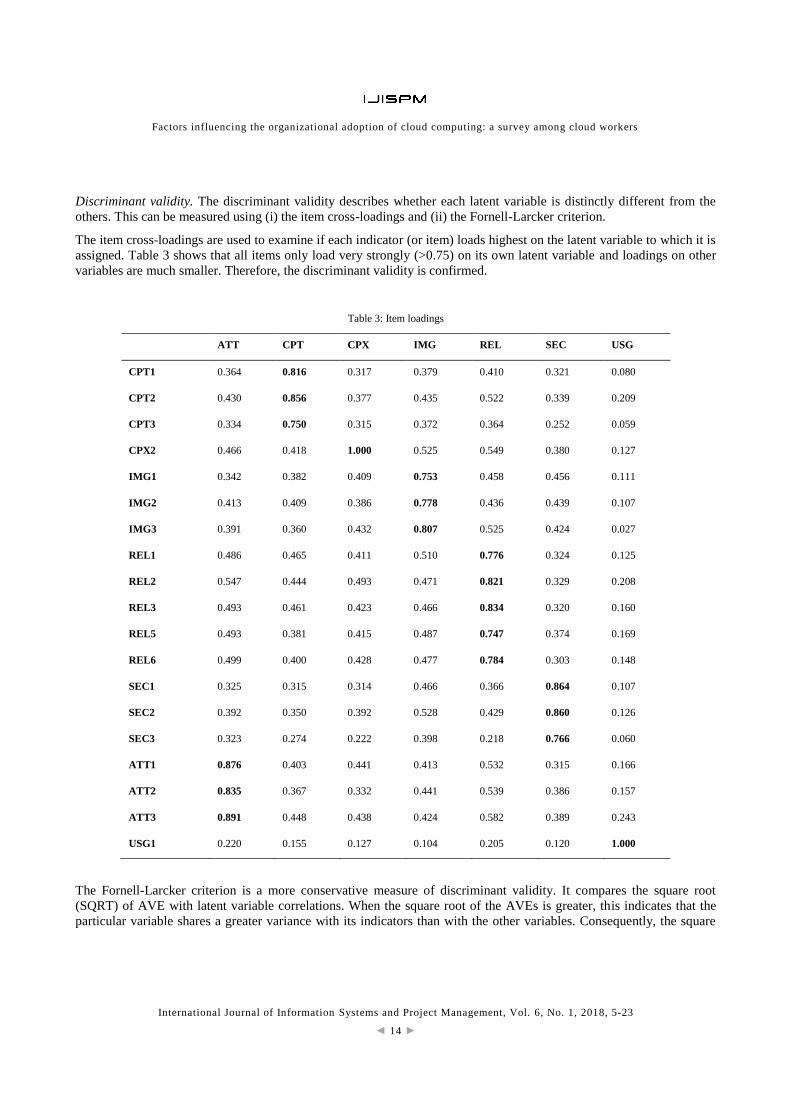
The item cross-loadings are used to examine if each indicator (or item) loads highest on the latent variable to which it is
assigned. Table 3 shows that all items only load very strongly (>0.75) on its own latent variable and loadings on other
variables are much smaller. Therefore, the discriminant validity is confirmed.
Table 3: Item loadings
ATT CPT CPX IMG REL SEC USG
CPT1 0.364 0.816 0.317 0.379 0.410 0.321 0.080
CPT2 0.430 0.856 0.377 0.435 0.522 0.339 0.209
CPT3 0.334 0.750 0.315 0.372 0.364 0.252 0.059
CPX2 0.466 0.418 1.000 0.525 0.549 0.380 0.127
IMG1 0.342 0.382 0.409 0.753 0.458 0.456 0.111
IMG2 0.413 0.409 0.386 0.778 0.436 0.439 0.107
IMG3 0.391 0.360 0.432 0.807 0.525 0.424 0.027
REL1 0.486 0.465 0.411 0.510 0.776 0.324 0.125
REL2 0.547 0.444 0.493 0.471 0.821 0.329 0.208
REL3 0.493 0.461 0.423 0.466 0.834 0.320 0.160
REL5 0.493 0.381 0.415 0.487 0.747 0.374 0.169
REL6 0.499 0.400 0.428 0.477 0.784 0.303 0.148
SEC1 0.325 0.315 0.314 0.466 0.366 0.864 0.107
SEC2 0.392 0.350 0.392 0.528 0.429 0.860 0.126
SEC3 0.323 0.274 0.222 0.398 0.218 0.766 0.060
ATT1 0.876 0.403 0.441 0.413 0.532 0.315 0.166
ATT2 0.835 0.367 0.332 0.441 0.539 0.386 0.157
ATT3 0.891 0.448 0.438 0.424 0.582 0.389 0.243
USG1 0.220 0.155 0.127 0.104 0.205 0.120 1.000
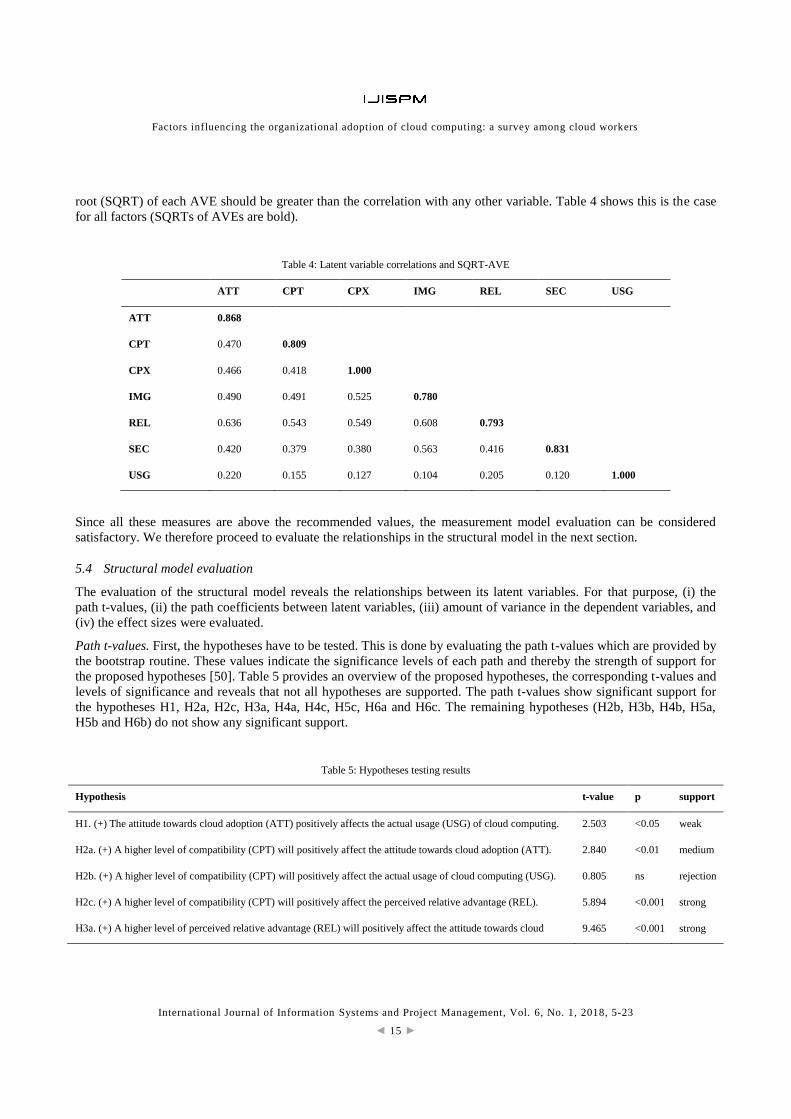
The Fornell-Larcker criterion is a more conservative measure of discriminant validity. It compares the square root
(SQRT) of AVE with latent variable correlations. When the square root of the AVEs is greater, this indicates that the
particular variable shares a greater variance with its indicators than with the other variables. Consequently, the square
Factors influencing the organizational adoption of cloud computing: a survey among cloud workers
International Journal of Information Systems and Project Management, Vol. 6, No. 1, 2018, 5-23
◄ 15 ►
root (SQRT) of each AVE should be greater than the correlation with any other variable. Table 4 shows this is the case
for all factors (SQRTs of AVEs are bold).
Table 4: Latent variable correlations and SQRT-AVE
ATT CPT CPX IMG REL SEC USG
ATT 0.868
CPT 0.470 0.809
CPX 0.466 0.418 1.000
IMG 0.490 0.491 0.525 0.780
REL 0.636 0.543 0.549 0.608 0.793
SEC 0.420 0.379 0.380 0.563 0.416 0.831
USG 0.220 0.155 0.127 0.104 0.205 0.120 1.000
Since all these measures are above the recommended values, the measurement model evaluation can be considered
satisfactory. We therefore proceed to evaluate the relationships in the structural model in the next section.
5.4 Structural model evaluation
The evaluation of the structural model reveals the relationships between its latent variables. For that purpose, (i) the
path t-values, (ii) the path coefficients between latent variables, (iii) amount of variance in the dependent variables, and
(iv) the effect sizes were evaluated.
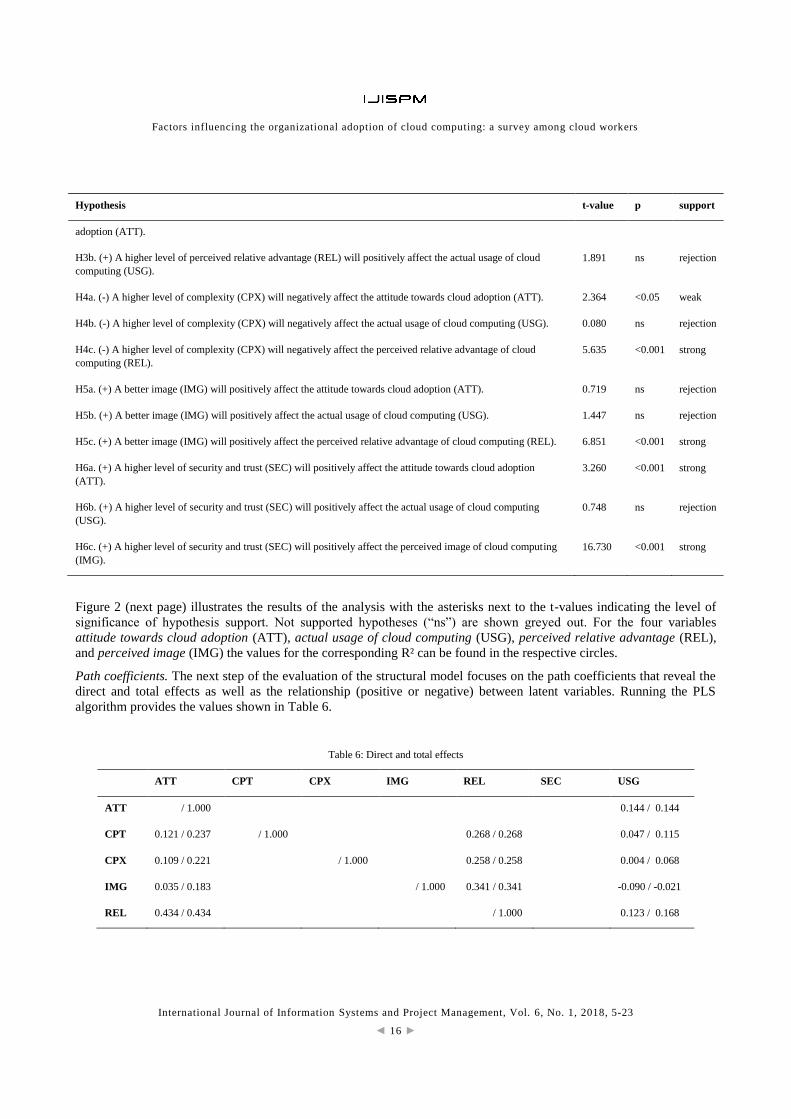
Path t-values. First, the hypotheses have to be tested. This is done by evaluating the path t-values which are provided by
the bootstrap routine. These values indicate the significance levels of each path and thereby the strength of support for
the proposed hypotheses [50]. Table 5 provides an overview of the proposed hypotheses, the corresponding t-values and
levels of significance and reveals that not all hypotheses are supported. The path t-values show significant support for
the hypotheses H1, H2a, H2c, H3a, H4a, H4c, H5c, H6a and H6c. The remaining hypotheses (H2b, H3b, H4b, H5a,
H5b and H6b) do not show any significant support.
Table 5: Hypotheses testing results
Hypothesis t-value p support
H1. (+) The attitude towards cloud adoption (ATT) positively affects the actual usage (USG) of cloud computing. 2.503 <0.05 weak
H2a. (+) A higher level of compatibility (CPT) will positively affect the attitude towards cloud adoption (ATT). 2.840 <0.01 medium
H2b. (+) A higher level of compatibility (CPT) will positively affect the actual usage of cloud computing (USG). 0.805 ns rejection
H2c. (+) A higher level of compatibility (CPT) will positively affect the perceived relative advantage (REL). 5.894 <0.001 strong
H3a. (+) A higher level of perceived relative advantage (REL) will positively affect the attitude towards cloud 9.465 <0.001 strong
Factors influencing the organizational adoption of cloud computing: a survey among cloud workers
International Journal of Information Systems and Project Management, Vol. 6, No. 1, 2018, 5-23
◄ 16 ►
Hypothesis t-value p support
adoption (ATT).
H3b. (+) A higher level of perceived relative advantage (REL) will positively affect the actual usage of cloud
computing (USG).
1.891 ns rejection
H4a. (-) A higher level of complexity (CPX) will negatively affect the attitude towards cloud adoption (ATT). 2.364 <0.05 weak
H4b. (-) A higher level of complexity (CPX) will negatively affect the actual usage of cloud computing (USG). 0.080 ns rejection
H4c. (-) A higher level of complexity (CPX) will negatively affect the perceived relative advantage of cloud
computing (REL).
5.635 <0.001 strong
H5a. (+) A better image (IMG) will positively affect the attitude towards cloud adoption (ATT). 0.719 ns rejection
H5b. (+) A better image (IMG) will positively affect the actual usage of cloud computing (USG). 1.447 ns rejection
H5c. (+) A better image (IMG) will positively affect the perceived relative advantage of cloud computing (REL). 6.851 <0.001 strong
H6a. (+) A higher level of security and trust (SEC) will positively affect the attitude towards cloud adoption
(ATT).
3.260 <0.001 strong
H6b. (+) A higher level of security and trust (SEC) will positively affect the actual usage of cloud computing
(USG).
0.748 ns rejection
H6c. (+) A higher level of security and trust (SEC) will positively affect the perceived image of cloud computing
(IMG).
16.730 <0.001 strong
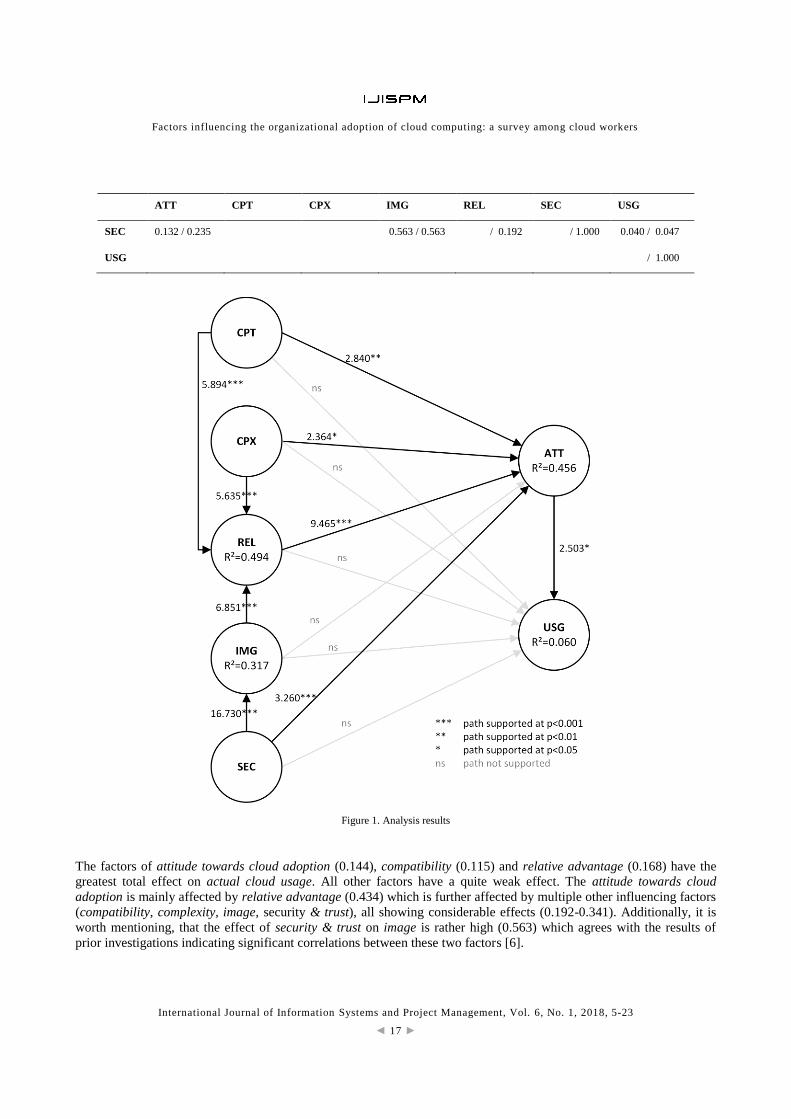
Figure 2 (next page) illustrates the results of the analysis with the asterisks next to the t-values indicating the level of
significance of hypothesis support. Not supported hypotheses (“ns”) are shown greyed out. For the four variables
attitude towards cloud adoption (ATT), actual usage of cloud computing (USG), perceived relative advantage (REL),
and perceived image (IMG) the values for the corresponding R² can be found in the respective circles.
Path coefficients. The next step of the evaluation of the structural model focuses on the path coefficients that reveal the
direct and total effects as well as the relationship (positive or negative) between latent variables. Running the PLS
algorithm provides the values shown in Table 6.
Table 6: Direct and total effects
ATT CPT CPX IMG REL SEC USG
ATT / 1.000 0.144 / 0.144
CPT 0.121 / 0.237 / 1.000 0.268 / 0.268 0.047 / 0.115
CPX 0.109 / 0.221 / 1.000 0.258 / 0.258 0.004 / 0.068
IMG 0.035 / 0.183 / 1.000 0.341 / 0.341 -0.090 / -0.021
REL 0.434 / 0.434 / 1.000 0.123 / 0.168
Factors influencing the organizational adoption of cloud computing: a survey among cloud workers
International Journal of Information Systems and Project Management, Vol. 6, No. 1, 2018, 5-23
◄ 17 ►
ATT CPT CPX IMG REL SEC USG
SEC 0.132 / 0.235 0.563 / 0.563 / 0.192 / 1.000 0.040 / 0.047
USG / 1.000
Figure 1. Analysis results
The factors of attitude towards cloud adoption (0.144), compatibility (0.115) and relative advantage (0.168) have the
greatest total effect on actual cloud usage. All other factors have a quite weak effect. The attitude towards cloud
adoption is mainly affected by relative advantage (0.434) which is further affected by multiple other influencing factors
(compatibility, complexity, image, security & trust), all showing considerable effects (0.192-0.341). Additionally, it is
worth mentioning, that the effect of security & trust on image is rather high (0.563) which agrees with the results of
prior investigations indicating significant correlations between these two factors [6].
Factors influencing the organizational adoption of cloud computing: a survey among cloud workers
International Journal of Information Systems and Project Management, Vol. 6, No. 1, 2018, 5-23
◄ 18 ►
Amount of variance in the dependent variables. The coefficient of determination, or R Square (R²), is a measure of the
model’s predictive ability. It represents the combined effects of the independent variables on a dependent variable by
the amount of variance in the dependent variable that is explained by all the independent variables connected to it. It
ranges from 0 to 1 [50]. Figure 2 presents the R² values in the circle of the factors. The analysis shows that R² of
attitude towards cloud adoption has a value of 0.456, which means 45.6% of the variance of this dependent variable is
explained by the independent variables compatibility, complexity, relative advantage, image and security & trust. This
is a high value that indicates that the above-named factors influence a large proportion of the users’ attitude towards
cloud adoption. Conversely, R² of the factor actual cloud usage has a value of 0.06, which is very low. This implies that
only 6% of the variance is explained by all the other variables of the model. Therefore, actual cloud usage is mainly
influenced by factors that are not included in the theoretical research model. This is already indicated by Table 5 and
Figure 2, which illustrate that the path t-values of four factors show no significant support on actual cloud usage.
Furthermore, the R² values of relative advantage and image are also high. Security & trust accounts for 31.7% of the
variance of image. 49.4% of the variance in relative advantage is explained by compatibility, complexity, image, and
security & trust. Consequently, the predictive ability of the model regarding these factors is satisfying.
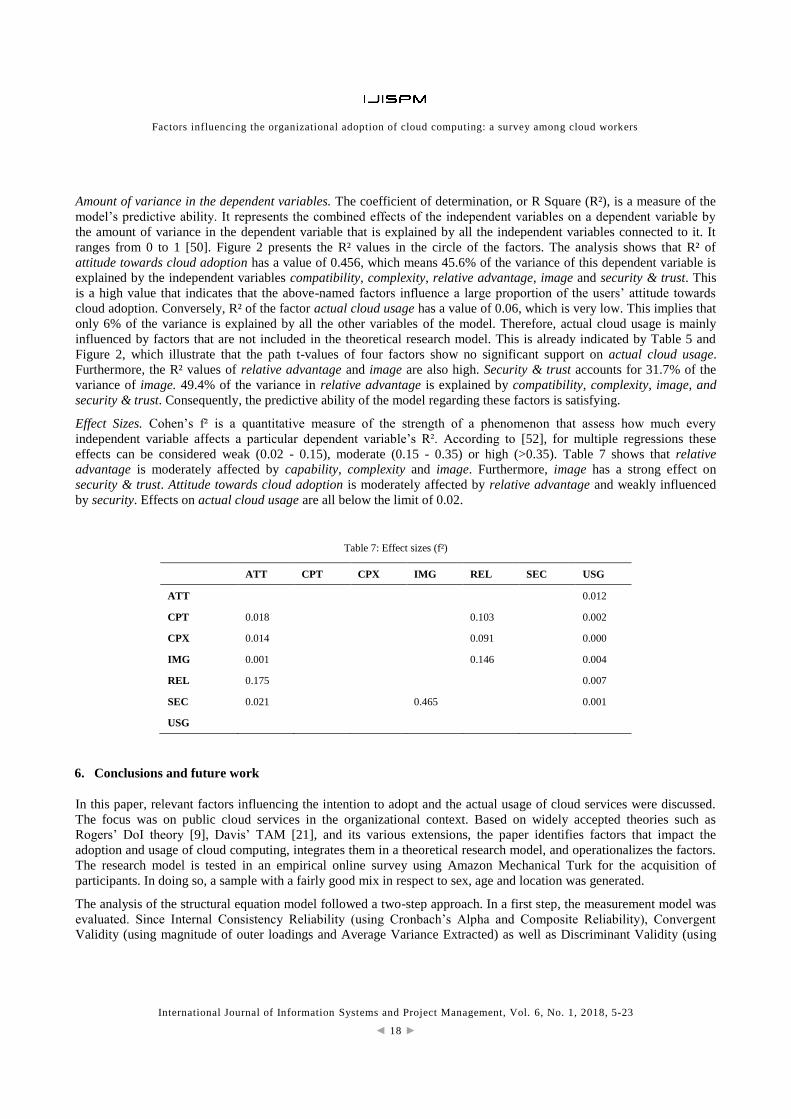
Effect Sizes. Cohen’s f² is a quantitative measure of the strength of a phenomenon that assess how much every
independent variable affects a particular dependent variable’s R². According to [52], for multiple regressions these
effects can be considered weak (0.02 - 0.15), moderate (0.15 - 0.35) or high (>0.35). Table 7 shows that relative
advantage is moderately affected by capability, complexity and image. Furthermore, image has a strong effect on
security & trust. Attitude towards cloud adoption is moderately affected by relative advantage and weakly influenced
by security. Effects on actual cloud usage are all below the limit of 0.02.
Table 7: Effect sizes (f²)
ATT CPT CPX IMG REL SEC USG
ATT 0.012
CPT 0.018 0.103 0.002
CPX 0.014 0.091 0.000
IMG 0.001 0.146 0.004
REL 0.175 0.007
SEC 0.021 0.465 0.001
USG
6. Conclusions and future work
In this paper, relevant factors influencing the intention to adopt and the actual usage of cloud services were discussed.
The focus was on public cloud services in the organizational context. Based on widely accepted theories such as
Rogers’ DoI theory [9], Davis’ TAM [21], and its various extensions, the paper identifies factors that impact the
adoption and usage of cloud computing, integrates them in a theoretical research model, and operationalizes the factors.
The research model is tested in an empirical online survey using Amazon Mechanical Turk for the acquisition of
participants. In doing so, a sample with a fairly good mix in respect to sex, age and location was generated.
The analysis of the structural equation model followed a two-step approach. In a first step, the measurement model was
evaluated. Since Internal Consistency Reliability (using Cronbach’s Alpha and Composite Reliability), Convergent
Validity (using magnitude of outer loadings and Average Variance Extracted) as well as Discriminant Validity (using

Factors influencing the organizational adoption of cloud computing: a survey among cloud workers
International Journal of Information Systems and Project Management, Vol. 6, No. 1, 2018, 5-23
◄ 19 ►
item cross-loadings and Fornell-Larcker criterion) could be confirmed, the measurement model evaluation was
considered satisfactory. Consequently, the structural model evaluation revealed that the attitude towards cloud adoption
(ATT) positively affects the actual usage of cloud computing (USG). All other hypotheses regarding the direct
influence of certain factors on the actual usage of cloud services were rejected. However, the effect of the attitude
towards cloud adoption (ATT) on the actual cloud usage (USG) is also low. Therefore, there are other factors, which
were not considered in our model, that affect the actual cloud usage. A better image (IMG) seems to neither positively
affect the attitude towards cloud adoption (ATT) nor the actual cloud usage (USG). All other factors influence the
attitude towards cloud adoption (ATT). A higher level of compatibility (CPT), relative advantage (REL) and security &
trust (SEC) as well as a lower level of complexity (CPX) lead to a more positive attitude towards cloud adoption (ATT).
Limitations of this study include the data collection and sample composition using Mechanical Turk. In an experiment,
using data collected from a large Midwestern U.S. university, an Internet board and Mechanical Turk, Paolacci and
Chandler found that the response error was significantly lower in Mechanical Turk than in the Internet board [38].
Although it was noted to be more diverse than usual college samples, respondents using Internet technology are not a
representative sample either [39], leading to the suggestions that research should be transparent in the recruiting and
excluding of participants. As stated, this study included several mechanisms to assess the validity of the results based on
several technical possibilities in combination with a self-assessment of the cloud workers. While efforts were
undertaken to ensure that subjects had experience using cloud computing, their degree of knowledge concerning cloud
computing may be quite varied. In addition, due to the diverse applications of cloud computing, the application types
cloud storage, cloud e-mail, and cloud office were queried separately. While these are commonly used, individuals may
actively use other cloud computing applications not included, such as cloud based customer relationship management or
enterprise resource planning systems. However, inquiring each item for up to three cloud computing application types,
entailed a multiplication of questions to be answered by the participants. For that reason, the number of items was kept
low to avoid loss of data quality due to participants increasing frustration through a cavalcade of questions. This again
led to ending up with only one item left for complexity (CPX) and actual usage of cloud computing (USG) after the
evaluation of the research model. Concerning this matter, other possible approaches could be either to focus on fewer
factors, or to ask questions on cloud services in general and not on multiple specific cloud application types.
Furthermore, the results show that the model’s predictive ability on actual cloud usage (USG) is low. Consequently,
there seem to be other factors that influence USG. While many factors that explain the motivations and barriers toward
broad organizational adoption of cloud computing services are explored in this research, some additional factors may
have inadvertently been omitted. This may be due to the scope of the reviewed studies, as some focus on cloud
computing in a general context while others focus on very specific cloud services. In future research we intend to
identify additional factors and conduct further empirical studies.
References
[1] S. Marston, Z. Li, S. Bandyopadhyay, and A. Ghalsasi, “Cloud Computing - The Business Perspective,” in
Proceedings of the HICSS, 2011.
[2] W.-W. Wu, “Developing an explorative model for SaaS adoption,” Expert Systems with Applications, vol. 38, no.
12, pp. 15057–15064, 2011.
[3] N. Opitz, T. F. Langkau, N. H. Schmidt, and L. M. Kolbe, “Technology Acceptance of Cloud Computing: Empirical
Evidence from German IT Departments,” in Proceedings of the HICSS, 2012, pp. 1593–1602.
[4] C. Low, Y. Chen, and M. Wu, “Understanding the determinants of cloud computing adoption,” Industrial
Management & Data Systems, vol. 111, no. 7, pp. 1006–1023, 2011.
[5] I. Yevseyeva, J. Turland, C. Morisset, L. Coventry, T. Groß, C. Laing, and A. van Moorsel, “Addressing
consumerization of IT risks with nudging,” International Journal of Information Systems and Project Management, vol.
3, no. 3, pp. 5–22, 2015.
Factors influencing the organizational adoption of cloud computing: a survey among cloud workers
International Journal of Information Systems and Project Management, Vol. 6, No. 1, 2018, 5-23
◄ 20 ►
[6] M. Stieninger and D. Nedbal, “Diffusion and Acceptance of Cloud Computing in SMEs: Towards a Valence Model
of Relevant Factors,” in Proceedings of the 47th Hawaii International Conference on System Sciences, 2014, pp. 3307–
3316.
[7] Y. Li and K.-c. Chang, “A Study on User Acceptance of Cloud Computing: A Multi-Theoretical Perspective,” in
Proceedings of the AMCIS, 2012.
[8] S. C. Park and S. Y. Ryoo, “An empirical investigation of end-users’ switching toward cloud computing: A two
factor theory perspective,” Computers in Human Behavior, vol. 29, no. 1, pp. 160–170, 2013.
[9] E. M. Rogers, Diffusion of innovations, 5th ed. New York: Free Press, 2003.
[10] L. G. Tornatzky and K. J. Klein, “Innovation characteristics and innovation adoption-implementation: A meta-
analysis of findings,” IEEE Transactions on engineering management, vol. 29, no. 1, pp. 28–45, 1982.
[11] A. Benlian, T. Hess, and P. Buxmann, “Drivers of SaaS-Adoption – An Empirical Study of Different Application
Types,” Business & Information Systems Engineering, vol. 1, no. 5, pp. 357–369, 2009.
[12] T. S. Behrend, E. N. Wiebe, J. E. London, and E. C. Johnson, “Cloud computing adoption and usage in community
colleges,” Behaviour & Information Technology, pp. 231–240, 2011.
[13] F. Altaf and D. Schuff, “Taking a flexible approach to ASPs,” Commun. ACM, vol. 53, no. 2, p. 139, 2010.
[14] X. Tan and Y. Kim, “Cloud Computing for Education: A Case of Using Google Docs in MBA Group Projects,” in
2011 International Conference on Business Computing and Global Informatization, 2011, pp. 641–644.
[15] M. Lawkobkit and M. Speece, “Integrating Focal Determinants of Service Fairness into Post-Acceptance Model of
IS Continuance in Cloud Computing,” in 2012 IEEE/ACIS 11th International Conference on Computer and Information
Science, 2012, pp. 49–55.
[16] H. P. Borgman, B. Bahli, H. Heier, and F. Schewski, “Cloudrise: Exploring Cloud Computing Adoption and
Governance with the TOE Framework,” in 46th Hawaii International Conference on System Sciences (HICSS), Wailea,
HI, USA, 2013, pp. 4425–4435.
[17] R. Tjikongo and W. Uys, “The viability of Cloud Computing Adoption in SMME’s in Namibia,” in IST-Africa
2013 Conference Proceedings, 2013, pp. 1–11.
[18] C. P. Holland and B. Light, “A Critical Success Factors Model For ERP Implementation,” IEEE Software, vol. 16,
no. 3, pp. 30–36, http://dx.doi.org/10.1109/52.765784, 1999.
[19] G. C. Moore and I. Benbasat, “Development of an Instrument to Measure the Perceptions of Adopting an
Information Technology Innovation,” Information Systems Research, pp. 192–222, 1991.
[20] L. Carter and F. Belanger, “The Influence of Perceived Characteristics of Innovating on e-Government Adoption,”
Electronic Journal of e-Government, no. 2, pp. 11–20, 2004.
[21] F. Davis, “User Acceptance of Information Systems: The Technology Acceptance Model (TAM),” Michigan,
1987.
[22] J. Benamati and T. M. Rajkumar, “An Outsourcing Acceptance Model: An Application of TAM to Application
Development Outsourcing Decisions,” Information Resources Management Journal (IRMJ), no. 21, pp. 80–102, 2008.
[23] I. Ajzen, “The theory of planned behavior,” Organizational Behavior & Human Decision Processes, vol. 50, no. 3,
pp. 179–211, 1991.
[24] M. Stieninger, D. Nedbal, W. Wetzlinger, G. Wagner, and M. A. Erskine, “Impacts on the organizational adoption
of cloud computing: A reconceptualization of influencing factors,” in Procedia Technology, Troía, Portugal, 2014.
Factors influencing the organizational adoption of cloud computing: a survey among cloud workers
International Journal of Information Systems and Project Management, Vol. 6, No. 1, 2018, 5-23
◄ 21 ►
[25] D. R. Compeau, D. B. Meister, and C. A. Higgins, “From Prediction to Explanation: Reconceptualizing and
Extending the Perceived Characteristics of Innovating,” Journal of the Association for Information Systems, no. 8, pp.
409–439, 2007.
[26] D. G. Gregg and S. Walczak, “Dressing Your Online Auction Business for Success: An Experiment Comparing
Two eBay Businesses,” MIS Quarterly, no. 32, pp. 653–670, 2008.
[27] E. Karahanna, R. Agarwal, and C. M. Angst, “Reconceptualizing compatibility beliefs in technology acceptance
research,” MIS Quarterly, no. Vol. 30 No. 4, pp. 781–804, 2006.
[28] D. H. Sonnenwald, K. L. Maglaughlin, and M. C. Whitton, Eds., Using innovation diffusion theory to guide
collaboration technology evaluation: work in progress. Enabling Technologies: Infrastructure for Collaborative
Enterprises, 2001. WET ICE 2001. Proceedings. Tenth IEEE International Workshops on, 2001.
[29] V. Venkatesh, M. G. Morris, G. B. Davis, and F. D. Davis, “User Acceptance of Information Technology: Toward
a Unified View,” MIS Quarterly Executive, no. 27, pp. 425–478, 2003.
[30] G. Premkumar, K. Ramamurthy, and S. Nilakanta, “Implementation of Electronic Data Interchange: An Innovation
Diffusion Perspective,” Journal of Management Information Systems, no. 11, pp. 157–186, 1994.
[31] S. Strahringer, “Nutzung interorganisationaler Informationssysteme in der Lieferkette – Einflussfaktoren und
Kausalmodell,” Wissenschaftliche Zeitschrift der Technischen Universität Dresden, vol. 58, no. 1 - 2, pp. 97–102, 2009.
[32] T. Dillon, C. Wu, and E. Chang, “Cloud Computing: Issues and Challenges,” in Advanced Information Networking
and Applications (AINA), 2010 24th IEEE International Conference on, 2010, pp. 27–33.
[33] D. Gefen, E. Karahanna, and D. W. Straub, “Trust and TAM in Online Shopping: An Integrated Model,” MIS
Quarterly, no. 27, pp. 51–90, 2003.
[34] R. Buyya, C. S. Yeo, and S. Venugopal, “Market-Oriented Cloud Computing: Vision, Hype, and Reality for
Delivering IT Services as Computing Utilities,” in 10th IEEE International Conference on High Performance
Computing and Communications (HPCC’08): IEEE, 2008, pp. 5–13.
[35] M. Walterbusch and F. Teuteberg, “Vertrauen im Cloud Computing,” HMD - Praxis der Wirtschaftsinformatik, no.
288, pp. 50–59, 2012.
[36] P. K. Wamuyu, “Use of cloud computing services in micro and small enterprises: a fit perspective,” International
Journal of Information Systems and Project Management, vol. 5, no. 2, pp. 59–81, 2017.
[37] L. Irani, “The cultural work of microwork,” New Media & Society, vol. 17, no. 5, pp. 720–739, 2015.
[38] G. Paolacci, J. Chandler, and P. G. Ipeirotis, “Running Experiments on Amazon Mechanical Turk,” Judgment and
Decision making, vol. 5, no. 5, pp. 411–419, 2010.
[39] G. Paolacci and J. Chandler, “Inside the Turk: Understanding Mechanical Turk as a Participant Pool,” Current
Directions in Psychological Science, vol. 23, no. 3, pp. 184–188, https://doi.org/10.1177/0963721414531598, 2014.
[40] A. J. Berinsky, G. A. Huber, and G. S. Lenz, “Evaluating Online Labor Markets for Experimental Research:
Amazon.com’s Mechanical Turk,” Political Analysis, vol. 20, no. 3, pp. 351–368, 2012.
[41] J. Sprouse, “A validation of Amazon Mechanical Turk for the collection of acceptability judgments in linguistic
theory,” (English), Behav Res, vol. 43, no. 1, pp. 155–167, http://dx.doi.org/10.3758/s13428-010-0039-7, 2011.
[42] M. Buhrmester, T. Kwang, and S. D. Gosling, “Amazon’s Mechanical Turk: A New Source of Inexpensive, Yet
High-Quality, Data?,” Perspectives on Psychological Science, vol. 6, no. 1, pp. 3–5, 2011.
[43] J. J. Horton, D. G. Rand, and R. J. Zeckhauser, “The Online Laboratory: Conducting Experiments in a Real Labor
Market,” Experimental Economics, vol. forthcoming, http://ssrn.com/abstract=1591202, 2010.
Factors influencing the organizational adoption of cloud computing: a survey among cloud workers
International Journal of Information Systems and Project Management, Vol. 6, No. 1, 2018, 5-23
◄ 22 ►
[44] B. Hachey, W. Radford, J. Nothman, M. Honnibal, and J. R. Curran, “Evaluating Entity Linking with Wikipedia,”
Artificial Intelligence, vol. 194, pp. 130–150, 2013.
[45] D. Milne and I. H. Witten, “Learning to Link with Wikipedia,” in Proceedings of the 17th ACM Conference on
Information and Knowledge Management, 2008, pp. 509–518.
[46] L. Ratinov, D. Roth, D. Downey, and M. Anderson, “Local and Global Algorithms for Disambiguation to
Wikipedia,” in Proceedings of the 49th Annual Meeting of the Association for Computational Linguistics: Human
Language Technologies – Vol. 1, 2011, pp. 1375–1384.
[47] H. van der Heijden, “A new look at user commitment towards information systems: evidence from Amazon’s
Mechanical Turk,” in ECIS 2012 Proceedings, 2012.
[48] I. Ajzen and M. Fishbein, Understanding attitudes and predicting social behavior. Englewood Cliffs, N.J.: Prentice-
Hall, 1980.
[49] S. Farag, T. Schwanen, M. Dijst, and J. Faber, “Shopping online and/or in-store? A structural equation model of
the relationships between e-shopping and in-store shopping,” The Interaction Between ICT and Human Activity-Travel
Behavior, vol. 41, no. 2, pp. 125–141, http://www.sciencedirect.com/science/article/pii/S0965856406000267, 2007.
[50] J. F. Hair, A primer on partial least squares structural equations modeling (PLS-SEM). Los Angeles: Sage, 2014.
[51] J. F. Hair, M. Sarstedt, L. Hopkins, and V. G. Kuppelwieser, “Partial least squares structural equation modeling
(PLS-SEM): An emerging tool in business research,” European Business Review, vol. 26, no. 2, pp. 106–121,
http://dx.doi.org/10.1108/EBR-10-2013-0128, 2014.
[52] J. Cohen, Statistical power analysis for the behavioral sciences, 2nd ed. Hillsdale, N.J: L. Erlbaum Associates,
1988.
Factors influencing the organizational adoption of cloud computing: a survey among cloud workers
International Journal of Information Systems and Project Management, Vol. 6, No. 1, 2018, 5-23
◄ 23 ►
Biographical notes
Mark Stieninger
After several professional positions in Account Management and IT Administration Mark Stieninger
earned his Bachelor’s and Master’s degree in Electronic Business and Digital Business Management
at the University of Applied Sciences Upper Austria and Johannes Kepler University Linz in 2013.
Since 2013 he is working as a researcher and lecturer at the University of Applied Sciences Upper
Austria. His research areas are digital retail and cloud computing.
www.shortbio.net/[email protected]
Dietmar Nedbal
Dietmar Nedbal is a full time Professor for Information Systems at the department of Digital
Business at the University of Applied Sciences Upper Austria. He earned his doctor's degree from
the Johannes Kepler University (Linz, Austria) in 2013. He started his professional career after
completing his master’s degree in 2000 as a software engineer and was head of software
development from 2003 to 2007. Dietmar is co-author of several publications at international
journals and conference proceedings. His main research areas are enterprise social software,
semantic web, b2b integration, green is, and cloud computing.
www.shortbio.net/[email protected]
Werner Wetzlinger
Werner Wetzlinger is a research project manager at the University of Applied Sciences Upper
Austria. His main research areas are information management, digital business, human computer
interaction and digital retail. He has participated in and managed multiple national and international
research projects and published papers in high-ranking conferences and journals.
www.shortbio.net/[email protected]
Gerold Wagner
Gerold Wagner has been a full time professor at the University of Applied Sciences Upper Austria
since 2002. Previously, he worked as a researcher at the Johannes Kepler University of Linz and as
an authorised office and research manager at a well-known local Internet company. His research
focuses on B2B communications, supply chain management and digital economy.
www.shortbio.net/[email protected]
Michael A. Erskine
Michael A. Erskine is an Assistant Professor at the Jones College of Business at Middle Tennessee
State University. Previously, he served as the Director of the Educational Technology Center at
Metropolitan State University of Denver. Michael received his Ph.D. in Computer Science and
Information Systems from the University of Colorado Denver. His research interests include disaster
management, geographic information systems, educational technology and spatial DSS.
www.shortbio.net/[email protected]