factors influencing perception of … influencing perception of development in rural kenya: a...
TRANSCRIPT

European Journal of Research in Social Sciences Vol. 2 No. 4, 2014 ISSN 2056-5429
Progressive Academic Publishing, UK Page 21 www.idpublications.org
FACTORS INFLUENCING PERCEPTION OF DEVELOPMENT IN RURAL
KENYA: A STRUCTURAL EQUATION MODELING APPROACH
Hildah Essendi
Social Statistics & Demography,
University of Southampton
UNITED KINGDOM
Nyovani Madise
Social Statistics & Demography,
University of Southampton
UNITED KINGDOM
ABSTRACT
Data from 275 individuals, collected at the individual and household levels were analyzed
using structural equation modeling techniques to examine relationships between perception of
development and observed socio-economic, demographic and wellbeing variables. Perception
of development was computed using 6 development-progressive statements administered in a
survey, most of which relate to the future development of the respondent’s community and on
satisfaction with participation in development activities. The relationship between perception
of development and other perceived factors such as perceived importance of electricity in
development, perceived household wellbeing and perceived health were examined, after
controlling for demographic and socio-economic factors such as age, gender, education,
household wealth, parity and health risk factors including alcohol use and smoking.
Significant relationships were found between perception of development and gender, age,
perceived household wellbeing and health risk factors (alcohol use and cigarette smoking).
Women and younger people had more positive perceptions of development than men and
older people respectively. Perceived household wellbeing, alcohol use and smoking were also
positively associated with positive perceptions of development. These results indicate that
even within the same community, people’s perceptions will vary depending on their age,
gender, perceived household wellbeing and health risk factors including alcohol use and
having ever smoked tobacco products. The study, conducted in an ethnically, culturally and
economically homogenous rural poor community however did not find significant effects
between perception of development and objective household wealth, level of education,
parity and perceived health. Further studies need to be conducted that can study perceived
development separately for males and females and also in a community that shows some
economic, cultural and social variations. This would help tease out the differences in
perceptions of development, which could not be adequately established in this study.
Keywords: Development, Perceptions, Structural Equation Modeling, Rural poor, sub-
Saharan Africa, Kenya.
INTRODUCTION
Importance of Perceptions and Participatory Development
While the involvement of local communities in their development is widely recognized as a
key step in sustainable and equitable development (Chambers R, 1983; Sen A, 1999), very
few rural development projects in sub-Saharan Africa and in Kenya use this approach.
Recognized as a potentially beneficial approach to meeting the needs of beneficiary
communities because of the ability to help prioritize community felt needs, participatory
development has either been partially used or not used at all (Claude Saha, 2008; Essendi H,
Madise N, & Matthews Z, 2014). Yet, participatory development continues to be hailed as a
European Journal of Research in Social Sciences Vol. 2 No. 4, 2014 ISSN 2056-5429
Progressive Academic Publishing, UK Page 22 www.idpublications.org
potentially beneficial approach in ensuring sustainable development, whose prerequisite is
seeking to understand people’s views regarding development and the determinants of these
perceptions. This approach has potential in helping determine the best way to engage with
them in implementing development projects that can best benefit them and at the same time
be sustainable. Most importantly, understanding these views/perceptions and the factors
influencing them can help inform the design of development projects that would not only
fully involve community members but also design approaches targeted at particular groups
based on their perceptions of development or of participation in development initiatives.
Perceptions and Development Participatory Approach In Kenya
Despite increased emphasis on the need to shift the development efforts towards more
community-engaged approaches (Chambers R, 1983; Sen A, 1999), this approach has rarely
been used in development projects in Kenya. Even fewer initiatives have incorporated this
approach in development projects targeting the rural poor in the country, where most of the
Kenyan population resides and where in many instances, health and development outcomes
fare far worse than urban Kenya’s (KNBS & ICF Macro, 2010). Yet, employing
decentralized approaches in the country, more specifically participatory development has
potential to drive equitable and sustainable development. The climatic, cultural, economic
and infrastructural diversity within and between the regions of the country point to the need
to employ a development approach that has potential to approach each group/region of the
country as a separate entity in development efforts (KNBS & ICF Macro, 2010). Makueni
County where the present study is located, for instance faces some of the poorest
infrastructural, wellbeing and health outcomes, reinforcing the importance of approaching
development in each region/County of the country as a separate entity where people’s views
about these efforts are also sought (CBS, World Bank, SIDA, & SID, 2005).
Amartya Sen’s Capability Approach
This study employs the Capability Approach to development as posited by Amartya Sen
(1999), where he defines development as a process of expanding the real freedoms that
people enjoy (Sen A, 1999). Using this approach, Sen views poverty, this is the flip-side of
development, as more than a lack of material resources. He emphasizes that although material
resources are recognised as being necessary, they are nonetheless not sufficient to escape
poverty and therefore enhance development and that poverty (and development) must be seen
as the deprivation of basic capability rather merely as income based measure. In order to
address sustainable development therefore, the Capability Approach has two main tenets;
Capability and Functioning whereby Functioning relates to the things that a person may value
being and doing and these vary from very simple ones for instance, having proper
nourishment, being free from preventable disease and premature mortality to complex ones
like being able to participate in community activities (Sen A, 1999). Capability on the other
hand refers to the factors that enhance people’s freedoms. Capability and Function concepts
are therefore used to emphasize the need to expand the real freedoms that people enjoy,
including; political freedoms, economic facilities; social opportunities; transparency
guarantees and protective security. Sen further argues heavily against looking at development
as just the rise of fall in incomes. Rather, income should be considered to be valuable only in
so far as it can increase the capabilities of individuals and thereby enable people’s
functionings in society (Sen A, 1999).

European Journal of Research in Social Sciences Vol. 2 No. 4, 2014 ISSN 2056-5429
Progressive Academic Publishing, UK Page 23 www.idpublications.org
In addition to understanding these two main principles of development (Capability and
Functioning), Sen (1999 p. 19) also talks about the role of an agent in development-bringing
about a change in society. He talks of an agent ‘…as someone who acts and brings about
change, and whose achievements can be judged in terms of her own values and objectives,
whether or not we assess them in terms of some external criteria as well.’ He further stresses
that the role of an agent can be through an individual or member of society and as a
participant in economic, social and political actions (Sen A, 1999). This perspective points to
the importance of community participation in development. His contribution to the debate on
community participation in development emphasizes the importance of empowerment of
beneficiary communities (Sen A, 1999).
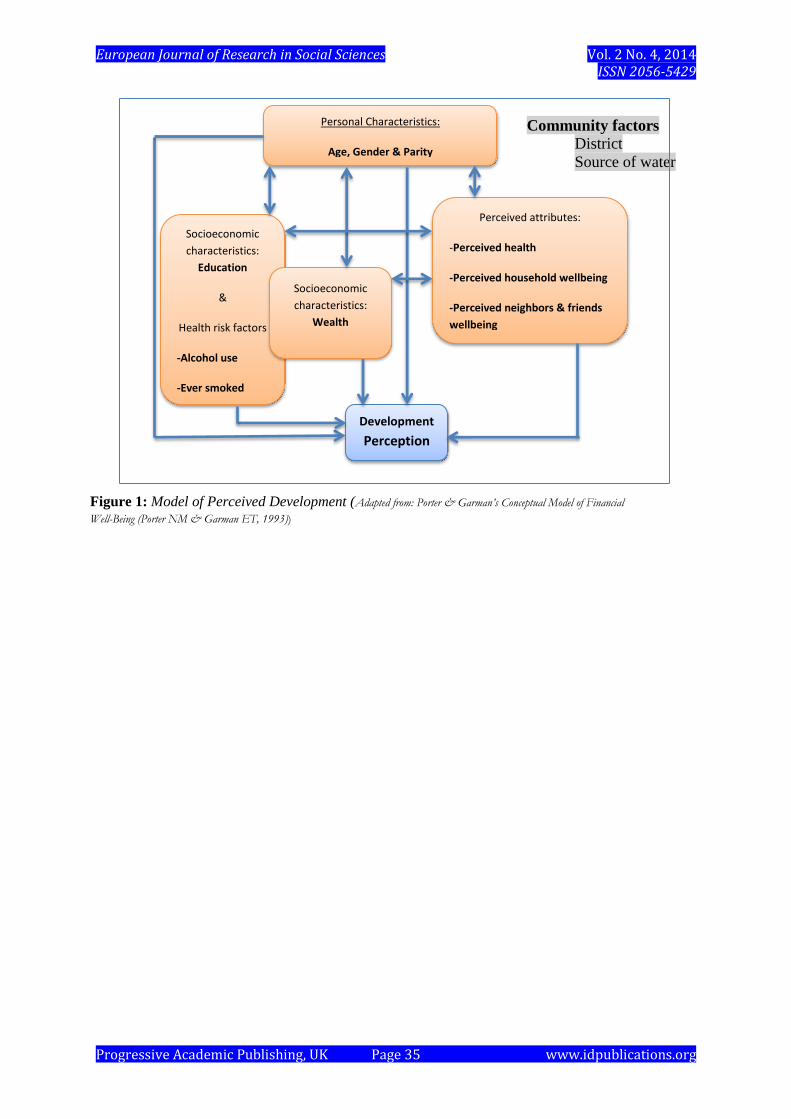
CONCEPTUAL FRAMEWORK
The background and theoretical approach reinforce the need to revisit the issue of
participatory development approach that includes understanding of people’s perceptions of
development and the factors influencing these perceptions, both issues that have potential to
enhance participatory development approaches. To address this research area, this paper
seeks to assess the factors influencing perceptions of development using a Structural
Equation Modeling approach. This paper fits a model adapted from Porter & Garman’s
Conceptual Model of Financial Well-Being (Porter NM & Garman ET, 1993). We adapt this
model, after reviewing literature by these and other researchers on the factors influencing
well-being. Although no single approach exists focusing on the factors influencing the
perceptions of development, there has been extensive research into the factors influencing the
perceptions of well-being, ranging from objective factors such as demographic characteristics
to socio-economic characteristics and subjective (perceived) factors (Hayhoe CR, 1990;
Leach LJ, Hayhoe CR, & Turner PR, 1999). Factors influencing perceptions of wellbeing are
adopted in this study because although perceptions of wellbeing and development are
different concepts, they nevertheless are close enough and are both perceived concepts of
improved livelihoods.
Gender: Among the demographic characteristics argued to have an influence of perceptions
of well-being, is gender, argued to have a big influence on perception of economic well-being
as this relates to the engendered roles that individuals are socialised in, hence the need to seek
the views of both gender in wellbeing studies and efforts (Hayhoe CR & Wilhelm MS, 1998).
Other researchers have also found gender to have a big impact on perceptions of wellbeing
(Leach LJ et al., 1999). Findings of these studies argue therefore that, in order to clearly
understand the perceptions of well-being, researchers need to put into consideration the role
that gender plays, as these views are quite engendered.
Age: Age of participant has also been found to be a significant factor in the perceptions of
one’s economic well-being. It has therefore been used as a background factor in studies
investigating perceptions of well-being (Leach LJ et al., 1999).
Other objective factors: While Hayhoe & Wilhelm focus on the variations in perceptions of
well-being by men and women at the family setting, they also include other objective
variables, that they argue, can potentially contribute to these perceptions (Hayhoe CR &
Wilhelm MS, 1998). These factors are given both at the individual and household level. They
include various factors included in the model besides gender and age. Education and health of
participant at the individual level and household income and size at the household level are
some of the factors found to influence perceptions and therefore included in this model.

European Journal of Research in Social Sciences Vol. 2 No. 4, 2014 ISSN 2056-5429
Progressive Academic Publishing, UK Page 24 www.idpublications.org
This present study groups the factors that are likely to influence the perception of
development into three blocks; personal characteristics, represented by age, gender and
parity; socio-economic characteristics focusing on household wealth status and respondent’s
education level and perceived attributes focusing on perceived health-risk factors, perceived
household economic wellbeing and perceived measure of development (this study uses the
perceived importance of electricity in development) as subjective variables (Figure 2). The
study incorporates the importance of electricity as a proxy for perceived development, based
on the reported importance of electricity in socio-economic development (Kanagawa M &
Nakata T, 2008) through such means as creating opportunities for growth. Two community
variables (place of residence-district and source of water) are also considered in the
descriptive analysis of this paper, although they are not included in the model as these
variables do not show variations for the respondents. Place of residence is used to give a
context-background to the interpretation of the results. Source of water at the household on
the other hand, is used to show the level of socio-economic status of the community. As
postulated by Porter &Garman (1993), perceived factors are used as mediating factors on the
effects of the personal and socio-economic characteristics on perception of development
(Porter NM & Garman ET, 1993). Other studies have used mediating factors in assessing the
effects of these primary factors on the outcome variable. Leach et all (1999) used two
mediating variables (comparison of Economic Outcomes and Level of Financial Strain) as
mediating factors on the effects of individual, socioeconomic and other study-specific
variables on the outcome variable (Leach LJ et al., 1999).
While seeking to understand beneficiary communities’ views regarding development,
incorporating the factors that influence these views can greatly help the Kenyan government,
county governments and development practitioners to apply focused approaches in
understanding beneficiary communities’ felt needs and their perceptions and development
priorities thereby designing sustainable strategies that meet the needs of rural communities.
The research presented in this paper seeks to understand factors influencing perceptions of
development among members of Kitonyoni sub-location of Makueni County. This study
hypothesises that individual personal and demographic characteristics as well as health risk
factors and perceived attributes influence their perception of development in their context.
Based on the model of perceived development (Figure 1), this paper seeks to assess:
1. Whether the hypothesised model fits the data
2. Whether there is there a significant relationship between the personal characteristics,
socio-economic characteristics, heath risk factors and perceived attributes and
Perception of Development. It also seeks to assess whether the variance between these
factors in the model are significant (see figure 1).
METHODOLOGY
Study Setting
The study was conducted in Kitonyoni sub location of Kathonzweni district in Makueni
County in October 2012. The sub-location, an area covering 27.1 sq km and Density of 96
has a total population of 2,500; 1,284 males and 1,306 females (KNBS, 2010). Makueni
county is a semi-arid area where residents traditionally depend on farming as the primary
means of livelihood, although now shifting to other means of livelihood, specifically,
migrant labour to the towns and cities as a result of increased poverty in the district (Nzioka
C, 2000).
European Journal of Research in Social Sciences Vol. 2 No. 4, 2014 ISSN 2056-5429
Progressive Academic Publishing, UK Page 25 www.idpublications.org
Data
The study uses individual and house-level data collected from a sample of 275 of the 487
households in the sub-location. Within the sampled households, a male and female of
reproductive age (18 and 49 years for women and 18 and 54 years for men) were selected and
interviewed in each household alternately. Questions were asked on household economic
status, respondent’s education level, parity, perceived health, perceived household wellbeing
and perceived importance of electricity in development. Their health risk was also assessed
by collecting data on their smoking and alcohol consumption habits.
Dependent Variable
The outcome variable is perception of development (PerDvlpt), using variables generated by
asking 5-point scale questions. Respondents were asked a set of questions that reflect their
perceptions of future development, their participation in development activities and
custodianship of development. These questions/statements include:
1. Community development in this area is a responsibility of government
2. International community has a responsibility to help in development e.g. climate
3. How satisfied are you with the level of your personal involvement in development?
4. How satisfied are you with the level of your community’s involvement in
development?
5. How do you feel about being asked to participate in development activities?
6. How much do you think that development in your community will improve?
Methods
This paper uses structural equation modelling (SEM) using the IBM SPSS Amos 20 package
(Byrne BM, 2010) to assess the relationship between perception of development and the
selected predictor variables . SEM is used in this paper because of the latent nature of the
perception of development variable, being a complex and multi-faceted variable that cannot
be adequately captured by the use of one variable, hence is computed using 6 variables
(Figure 2 and Table 1). Using SEM’s two main assumptions, that the causal processes under
investigation are presented by a series of structural (regression) equations; and that these
structural relations can be modelled pictorially to enable a clearer conceptualization of the
theory under investigation, this paper models the personal, socio-economic and wellbeing
factors hypothesised to influence perceived development (Byrne BM, 2010). The process
statistically tests the hypothesised model in a simultaneous analysis of all the variables in the
hypothesis to determine the extent to which it is consistent with the data (Byrne BM, 2010).
Running SEM
This was done using a two stage approach. The first model run was Confirmatory Factor
Analysis (CFA). This was run to test the measurement model and was run first before
proceeding with the structural equation model. Running CFA was done in the first stage in
order to test whether the relationships specified between the latent variable (perception of
development) and the observed variables give a good fit. Once this was done, Latent Variable
Path Analysis (LVPA) which incorporates the relationships between the observed variables
and latent variable and the error/residuals, was done (see figure 2)

European Journal of Research in Social Sciences Vol. 2 No. 4, 2014 ISSN 2056-5429
Progressive Academic Publishing, UK Page 26 www.idpublications.org
Variables In The Model
Variables in the model are grouped into 4 as outlined in Table 2. These groups are:
1. Observed, endogenous variables
2. Observed, exogenous variables
3. Unobserved, endogenous variables
4. Unobserved, exogenous variables
The paper incorporates some community factors which were not incorporated in running the
model because there are no variations in the sample regarding this (Figures 1 & 3 and Table
3). The two community variables are place of residence (district) and source of drinking
water at household (see table 3).
Perceived Health (Hgeneral): Perceived health was computed using one perceived health
indicator that reflected the respondent’s perceived general health.
Perceived Family Wellbeing (HHWB): Perceived family wellbeing was constructed using one
scale variable reflecting perceived family position on a 10-point wellbeing ladder.
Perceived Development Factor (DvlptElec): This endogenous variable refers to whether the
community perceives electricity to be important in the development of their community.
Perceived Development (PerDvlpt): The six indicators of perceived development (Table 1)
focus on the respondents’ satisfaction with engagement in development projects and future
development prospects. All the variables contribute factor loadings to the latent variable
(PerDvlpt). The statements used to compute this variable all represent a positive attitude
towards the community’s involvement in development and on the future prospects of the
community’s development. They capture the respondent’s level of satisfaction in regards to
involvement of self and community in development projects as well as the anticipated
prospects of development in the community.
Dependent Variable
The dependent variable in this paper, perception of development (PerDvlpt) was computed
using 6 observed/endogenous variables. These are P2, P3, P4, P5, P6 and P7 (Table 1).
These were administered to the respondents in form of statements/questions in a
questionnaire.
RESULTS
(see table 2)
Assessment of model fit
Assessing how best a structural equation model fits the data is one of the most important
steps in structural equation modeling. In this study several tests were done to assess how the
model fits the data, based on the recommendations of several researchers (Bentler PM &
Bonnett DG, 1980; Joreskog KG, 1993). Chi-square test is one of the recommended goodness
of fit tests. The chi-square value in this paper, at 138.075 (df=44) with p=0.000, indicates that
the mode is not a good fit. However, it is also recommended not to only rely on chi-square as
the measure of a good fitting model, rather to include other measures such as the Root Mean
Squared Error of Approximation (RMSEA), Incremental Fit Index (IFI) and Comparative Fit
Index (CFI) (Byrne BM, 2010). This is because chi-square tests tend to depend on sample
sizes while RMSEA takes into account this approximation error (Byrne BM, 2010). These

European Journal of Research in Social Sciences Vol. 2 No. 4, 2014 ISSN 2056-5429
Progressive Academic Publishing, UK Page 27 www.idpublications.org
other goodness of fit tests indicate that the model is a good fit for the data. The (RMSEA)
value was 0.055 [0.040, 0.069] indicating that the model is an acceptable fitting model. The
RMSEA value less than .05 is considered an indicator of a good model fit while a value
between 0.05 and 0.08 is considered an acceptable fit (Bentler PM & Bonnett DG, 1980). The
goodness of the assessment of fit was also supported by the high Incremental Fit Index (IFI =
0.927) and Comparative Fit Index (CFI = 0.922) as proposed by Bentler and Bonnett (Bentler
PM & Bonnett DG, 1980). The CFI and IFI values normally range from 0 to 1 with 0
indicating the absence of model fit and 1 indicating perfect model fit. A CFI/IFI value of
approximately .9 can be interpreted as a good model fit. These approaches have previously
been used to test model fit in structural equation models.
(See table 3 & 4)
Measurement Model
The estimated unstandardized coefficients and their associated p values for the measurement
variables on the various latent variables and on perceived development are reported in Tables
3 and 4.
Default Model
Perceived household wellbeing (HHWB) had a significant effect on perceived development.
This effect however indicated a negative direction, where the total effect of household
wellbeing on Perception of Development was -0.080 implying that when household
wellbeing (HHWB) goes up by 1 measurement scale value, Perception of Development
reduces by 0.08 scale values (this is on a scale of 1 to 10). Perceived health (Hgeneral)
household wealth and perceived importance of electricity in development on the other hand
did not have a significant effect on perceived development. The various effects are: perceived
health (0.043), wealth (0.074) and perceived importance of electricity (0.044). These
variables do not have such big effects on Perception of development; as perceived health
(Hgeneral) and perceived importance of electricity on development (DvlptElec) go up by 1
measurement scale value on a 5-point measurement scale; perception of development
(PerDvlpt) goes up by 0.043 scale values and 0.044 measurement scale values respectively.
Effects of Observed, Exogenous Variables
Gender, age, and health risk factors (alcohol use and smoking) were the only exogenous
personal and socio-economic characteristics variables that had significant effects on
perception of development (PerDvlpt) with gender having highly significant effect on
perceived development. The direct effect of gender on perceived development was -0.321,
indicating that women had higher perceptions of development compared to men. This effect
(combined direct and indirect effect) however slightly reduced to -0.391 when mediated with
household wellbeing (HHWB), perceived health, and perceived importance of electricity in
development. The direct effect of alcohol consumption on perceived development on the
other hand was 0.260 which increased slightly to 0.262 when mediated with perceived health.
Cigarette smoking’s effect on perceived development was 0.212 but increased slightly (for
the total effects) when mediated with perceived health.
The effect of age on perception of development was borderline significant, where its direct
effect on perceived development was in the negative direction, at -0.006. This effect (factor

European Journal of Research in Social Sciences Vol. 2 No. 4, 2014 ISSN 2056-5429
Progressive Academic Publishing, UK Page 28 www.idpublications.org
value) did not change when mediated with perceived importance of electricity on
development. In addition, the effect of age on perception of development is on a small scale,
such that 1 year’s increase in age reduces the measurement scale value of perception of
development by 0.006 scale values. Younger respondents were therefore likely to report
higher perceptions of development regardless of gender, level of education, perceived
household wellbeing, perceived health and health risk factors, including cigarette smoking
and alcohol consumption.
Education and parity did not have significant effects on perceived development with values
of -0.064 and 0.026 respectively, implying that level of education and number of children did
not influence one’s perception of development.
Revised Model of Perceived Development
After fitting the model for perceived development with personal, socio-economic and
perceived factors, the results were analysed and amendments made to the model. One of the
main reasons for these amendments was arrived at after assessing how well the model fits the
data. To do this, the source of misfits in the model had to be identified as proposed by Byrne
(2010) where she proposes that a focus is made on the adequacy of the parameter estimates
and the model as a whole (Byrne BM, 2010). Variables that had correlations of >1.00 and
those with negative variances and covariance were dropped from the hypothesised model,
and a new one (Figure 3) before it was re-run.
(See figure 3)
In this section please present the results including tables, figures, numbers and graphs (if
any). Font Size 12, Times New Roman, single spaced. All the subheadings in this section
should be in font size 12 Bold, Times New Roman, single spaced. The first letter of each
word in subheading should be capital. For tables please use font size 10. Tables/graphs or
figures should be named as Table 1/ Figure 1/ Graph 1 and be given in center of the page.
DISCUSSION
This study found gender to be highly significant in its association with perceived
development; women were found to have higher (more positive) perceptions of development
compared to men. This emphasizes the importance of gender as found in other studies,
especially those investigating factors influencing perception of economic wellbeing (Leach
LJ et al., 1999). All these studies highlight the importance of gender as they argue that
socialization engenders the viewpoints that men and women have and would therefore
influence how they perceived their economic situations. In some of these studies, these
analyses are even conducted separately, which differs from the analysis in the present study
which had very few data to run the model once the data was split by gender. The issue of
considering gender in development initiatives has also been emphasized by other
development studies (Lilja & Dixon, 2008).
Although household wealth status in this study did not have a significant effect on perception
of development, the same variable, objective economic wellbeing, measured using household
income or wealth status has been found to have an impact elsewhere (Bookwalter JT &
Dalenberg D, 2004). A recently published paper from this study also found that people’s
circumstances will influence how they perceive their circumstances (Essendi H et al., 2014).

European Journal of Research in Social Sciences Vol. 2 No. 4, 2014 ISSN 2056-5429
Progressive Academic Publishing, UK Page 29 www.idpublications.org
Another study looking at the impact of household factor on subjective well-being in South
Africa found that different factors were important among groups based on socio-economic
status (Bookwalter JT & Dalenberg D, 2004). Although the theme of this paper was not
directly related to the present study (perceived development), it nevertheless points to the
importance of economic wellbeing. This current study finds the average perceived family
position on a 10-step development ladder to be 2.32 with a standard deviation of 0.04 and
median of 2, indicating a very low perception of one’s wellbeing. In addition, other socio-
economic characteristics including access to water, household income, housing material and
education status (Table 3) point to a poor community. Consequently, these results may
influence one’s perception of development. Other studies, although focusing on perceptions
of one’s economic wellbeing have found perceived financial situation, in comparison to
friends or neighbours to have a significant effect on one’s perceived economic wellbeing
(Hayhoe CR, 1990; Porter NM & Garman ET, 1993).
There is need to conduct further research on the wellbeing factors affecting perception of
development in a more culturally and economically diverse community in order to adequately
assess the impact of these factors on perceived development. This is because some of the
studies investigating the factors influencing perceived economic wellbeing do find culture,
social class, and ethnicity as important factors in how one perceives their situation because
the personal values they hold often lead to differences in these perceptions (Hayhoe CR,
1990; Leach LJ et al., 1999). Further investigation therefore is needed to develop greater
understanding on this important aspect of perceived economic well-being in a culturally,
ethnically and economically diverse environment. In addition, further studies putting gender
into consideration are needed. This is because since women do report a higher likelihood of
economic adversity, it is important to determine what factors contribute to this gender
difference. It also is important to study economic adversity’s role in affecting perceived
economic well-being and to determine if economic adversity, rather than differences in
gender values, is the underlying factor affecting perceptions of economic well-being.
CONCLUSIONS
This study adds to the voice advocating for increased community participation in
development, by understanding individuals’ perceptions of development in their context. The
study contributes to the study of development through the revised model (Figure 3) by
indicating factors found to be important in the way the rural poor in a developing country
context perceive development. The study adds to development studies through its analytical
approach by advancing the methods that could be applied when analysing such latent factors
as perception of development. This study also highlights the importance of personal, socio-
economic and other factors in how the rural poor perceive participation in development,
anticipated development outcomes and custodianship of development. It is clear from the
results of this study that progress in the community (development) is perceived differently by
men and women. This is an important finding for development researchers and students,
development planners and implementers as well as policy makers who design projects to
benefit communities. The study does not only emphasize the importance of employing
participatory approaches in understanding poverty and development among poor
communities of developing countries, but also the consideration of the various personal and
socio-economic factors of the beneficiaries. Understanding the influences of perceptions of
development that are unique to men and women has potential in informing approaches and
development plans that can cater for the needs of both gender separately. This is likely to
enhance efficiency in design of approaches for these groups when encouraging participation

European Journal of Research in Social Sciences Vol. 2 No. 4, 2014 ISSN 2056-5429
Progressive Academic Publishing, UK Page 30 www.idpublications.org
in development activities. This would help improve success outcomes of development
strategies and development projects implemented in rural poor communities.
This study also has potential to inform development planners, practitioners and policy makers
of development on the importance of age in perceptions of personal and community
participation in development, future development prospects and custodianship of
development. This understanding would help incorporate the views of people of various ages
in development projects that have potential to have a great and quick impact on the lives of
everyone in a community, regardless of age.
In addition, since one’s perceptions of household economic wellbeing also have an influence
on their perceptions of community development/progress, this result point to the need to
design development initiatives in a way that all members of the community, their wealth
status or perceived wealth status notwithstanding, are able to participate in these initiatives.
This is because sometimes, even where participatory development may be applied, the very
poor may be excluded from decisions and initiatives.
These findings therefore emphasize that development plans are prioritised based on
communities’ felt needs, but most importantly findings of this study offer focus in
understanding the factors influencing how the rural poor perceive development. Development
efforts would therefore benefit from findings of this study by incorporating these findings in
their plans. This study therefore emphasizes the multidimensionality of development as
perceived by the study’s respondents, supporting the view that development goes beyond
monetary and quantitative values, even in a community where there is less economic, cultural
and social variation, like the case of the community where this study was conducted, based
on the wealth status, average household incomes and other measures of wellbeing including
source of water. Further, the study emphasises that development is a complex concept,
requiring the need to use non-specific and contextual measures to understand and plan
policies focused on communities’ perceptions, needs and anticipated development outcomes
based on their other individual and socio-economic characteristics.
In conclusion, this study could be applied to other more culturally diverse contexts and on a
larger population where the analysis can be done for men and women separately in order to
improve the understanding of the factors influencing development perceptions on gender
lines. The same analysis could also incorporate the views of other younger (15-17 years) and
older (above 49 years for women and above 54 years for men) persons since age was a factor
influencing these perceptions.
ACKNOWLEDGEMENTS
The authors thank Dr. Fiifi Amoako Johnson and Dr. Gloria Langat both from the University
of Southampton for reviewing earlier versions of the manuscript. They acknowledge the
financial support from the Social Statistics Department of the University of Southampton and
the Energy 4 Development Project (E4D) that enabled the collection of the data used in this
study. The authors would also like to thank the Kitonyoni community for their participation
in this research.
Notes On Contributors
Hildah Essendi and Nyovani Madise are researchers based at the Centre for Global Health,
Population, Poverty & Policy (GHP3) at the University of Southampton. Hildah is a Research
European Journal of Research in Social Sciences Vol. 2 No. 4, 2014 ISSN 2056-5429
Progressive Academic Publishing, UK Page 31 www.idpublications.org
student and a senior research assistant whose research interests include maternal and child
health, fertility, family planning, barriers to access, health systems and development &
wellbeing in developing countries. This paper is derived from her PhD research titled “Public
perceptions of development, participation in development and relationship with wellbeing:
the case of Makueni County in Kenya”. Nyovani is a Professor of Demography and Social
Statistics and Associate Dean (Research and Enterprise) at the Faculty of Social and Human
Sciences. Her research interests are in child and maternal health and nutritional health in the
developing world.
REFERENCES
Bentler PM, & Bonnett DG. (1980). Significance Tests and Goodness of Fit in the Analysis
of Covariance Structures. Psychological Bulletin, 88(3), 588-606.
Bookwalter JT, & Dalenberg D. (2004). Subjective well-being and household factors in
South Africa. Social Indicators Research, 65(3), 333-353.
Byrne BM. (2010). Structural Equation Modeling with AMOS: basic concepts, applications
and programming (2nd ed.). New York: Routledge Taylor & Francis Group.
CBS, World Bank, SIDA, & SID. (2005). Geographic Dimensions of Well-being in Kenya:
Who and Where are the Poor? A Constituency Level Profile. Nairobi: Government
Printer.
Chambers R. (1983). Rural development: Putting the Last First. Essex: Longman.
Claude Saha, J. (2008). Reducing poverty in sub-Saharan Africa: the need for participatory
governance. Development in Practice, 18(2), 267-272. doi:
10.1080/09614520801899192
Essendi H, Madise N, & Matthews Z. (2014). Perceptions of development by residents of a
rural community in Kenya: A capability issue. Journal of African Studies and
Development, 6(4), 67-77.
Hayhoe CR. (1990). Perceived economic well-being and active participation in financial
decision making. Paper presented at the Annual conference of the association for
financial counselling and planning education, Columbia, MD.
Hayhoe CR, & Wilhelm MS. (1998). Modeling Perceived Economic Well-Being In A Family
Setting: A Gender Perspective Financial Counselling and Planning, 9(1).
Joreskog KG (Ed.). (1993). Testing Structural Equation Models in Testing Structural
Equation Models, KA Bollen and JS Long, eds., pp.294-316. Newbury Park CA: Sage.
Kanagawa M, & Nakata T. (2008). Assessment of access to electricity and the socio-
economic impacts in rural areas of developing countries. Energy Policy, 36, 2016-
2029.
KNBS. (2010). 2009 Kenya Population and Housing Census. Nairobi: Government Printer.
KNBS, & ICF Macro. (2010). Kenya Demographic and Health Survey 2008-09. Calverton,
Maryland: KNBS and ICF Macro.
Leach LJ, Hayhoe CR, & Turner PR. (1999). Factors Affecting Perceived Economic Well-
being Of College Students: A Gender perspective. Financial Counselling and
Planning, 10(2).
Lilja, N., & Dixon, J. (2008). Operationalising participatory research and gender analysis:
new research and assessment approaches. Development in Practice, 18(4-5), 467-478.
doi: 10.1080/09614520802181202
Nzioka C. (2000). Makueni district profile: Human resource management, 1989-1998.
Drylands Research Working Paper 9. Retrieved from
Porter NM, & Garman ET. (1993). Testing a Conceptual Model of Financial Well-Being.
Financial Counseling and Planning, 4.

European Journal of Research in Social Sciences Vol. 2 No. 4, 2014 ISSN 2056-5429
Progressive Academic Publishing, UK Page 32 www.idpublications.org
Sen A. (1999). Development as Freedom. Oxford: Oxford University Press.
Table 1 Acronym definitions of variables in the model Variable Description/interview question Mean
(SD)/%1
Median
Observed, endogenous variables (Scale-level data)
1. P2
2. P3
3. P4
4. P5
5. P6
6. P7
7. Hgeneral
8. HHWB
9.
10. Wealth
11. Income
12. DvlptElec
Community development in this area is a responsibility of government
(1.Strongly agreed 2. Agree 3. Neutral 4. Disagree 5. Strongly Disagree)
International community has a responsibility to help in dvlpt e.g. climate
(1. Strongly agreed 2. Agree 3. Neutral 4. Disagree 5. Strongly Disagree)
How satisfied are you with the level of your personal involvement in dvlpt?
(1.Very satisfied 2. Satisfied 3. Neutral 4. Dissatisfied 5. Very dissatisfied)
How satisfied are you with the level of your community’s involvement in dvlpt?
(1.Very satisfied 2. Satisfied 3. Neutral 4. Dissatisfied 5. Very dissatisfied)
How do you feel about being asked to participate in development activities?
(1.Very happy 2. Happy 3. Neutral 4. Unhappy 5. Very unhappy)
How much do you think that development in your community will improve?
(1.Very much 2. Quite a lot 3. Neutral 4. Not much 5. Not at all)
How is your health in general? Would you say it is…?
(1. Very good 2. Good 3. Fair 4. Bad 5. Very bad)
Position of respondent’s household on a 10-step ladder where the least-developed
are on step 1 while most developed on the 10th
step.
If respondent’s household is wealthy (2 upper wealth quintiles)
Average household income in Ksh @Ksh.85=1$
Whether supply of electricity would constitute development
1.96 (0.72)
2.95 (1.01)
1.70 (0.70)
1.71 (0.74)
1.52 (0.56)
1.73 (0.77)
2.20 (0.29)
2.32 (0.04)
40.4%
5,935.82
(5,392.25)
68.7%
2
3
2
2
1
2
2
2
4,000
Observed, exogenous variables
13. Gender
14. Age
15. Parity
16. Education
17. Alcohol
18. Smoking
Respondent’s gender (Male)
Respondent’s age (continuous variable)
Number of children (If has 1 or 2 children)
If respondent had secondary or higher education
If respondent uses alcohol
If respondent had ever smoked
49.1%
31.17 (9.08)
15.6%
26.1%
9.8%
17.1%
30
Unobserved, endogenous variables
19. PerDvlpt Latent (Outcome variable) computed using P2 to P7 observed variables
Unobserved, exogenous variables
Eί
Where ί corresponds to variable 1-19
1 The figures in bold are percentage values of the corresponding variables

European Journal of Research in Social Sciences Vol. 2 No. 4, 2014 ISSN 2056-5429
Progressive Academic Publishing, UK Page 33 www.idpublications.org
Table 2 Demographic and household socio-economic characteristics of sample
N=276
Characteristic n %
Gender (Sgen)
Male
Female
Educational status
Pre-primary/Primary
Secondary+
Age
18-24 years
25-29 years
30-34 years
35-39 years
40-44 years
45-49 years
Parity (number of children)
None
1-2
3+
Religion
Christian
Other
Employment status
None
Self
Other
Household income (Kes)- Mean(SD)
Educational status
Pre-primary
Primary complete
Secondary+
Missing
Housing material (floor)
Natural
Finished
Source of water at household
Well (protected)
Unprotected (eg surface, unprotected well)
Other
135
140
201
71
74
57
44
37
33
30
60
43
172
272
3
228
22
25
5,935.82 (5392.25)
201
67
4
3
183
92
71
202
2
49.1
50.9
73.1
26.1
26.9
20.7
16.0
13.5
12.0
10.9
21.8
15.6
62.5
98.9
1.1
82.9
8.0
9.1
73.1
24.6
1.5
1.1
66.5
33.5
25.8
73.5
0.7

European Journal of Research in Social Sciences Vol. 2 No. 4, 2014 ISSN 2056-5429
Progressive Academic Publishing, UK Page 34 www.idpublications.org
Table 3 Parameter Estimates of perceived development and independent characteristics
Parameter Estimate P
Wealth
DvlptElec
Perceived household wellbeing
Perceived health
Age
Gender
Education
Parity
Alcohol use
Smoking (ever smoked)
0.074 (0.064)
0.044 (0.067)
-0.080 (0.042)
0.043 (0.064)
-0.006 (0.004)
-0.321 (0.076)
0.064 (0.073)
0.009 (0.088)
0.262 (0.116)
0.212 (0.093)
**
*
***
**
**
*p<.10 **p<.05 ***p<.001
Table 4: Total (Direct & Indirect) Effects of Independent variables on perception of
development
Variable Total Effects
Age
Parity
Education
Gender
Wealth
Hgeneral
HHWB
DvlptElec
Alcohol use
Smoking
-0.006
0.007
0.074
-0.319
0.074
0.043
-0.080
0.044
0.262
0.216
European Journal of Research in Social Sciences Vol. 2 No. 4, 2014 ISSN 2056-5429
Progressive Academic Publishing, UK Page 35 www.idpublications.org
Community factors
District
Source of water
Personal Characteristics:
Age, Gender & Parity
Socioeconomic
characteristics:
Education
&
Health risk factors
-Alcohol use
-Ever smoked
Perceived attributes:
-Perceived health
-Perceived household wellbeing
-Perceived neighbors & friends
wellbeing
Development
Perception
Socioeconomic
characteristics:
Wealth
Figure 1: Model of Perceived Development (Adapted from: Porter & Garman’s Conceptual Model of Financial
Well-Being (Porter NM & Garman ET, 1993))

European Journal of Research in Social Sciences Vol. 2 No. 4, 2014 ISSN 2056-5429
Progressive Academic Publishing, UK Page 36 www.idpublications.org
Figure 2: Model of perceived development and factors influencing perception of development
Community factors
District
Source of water
Personal Characteristics:
Age, Gender & Parity
Socioeconomic characteristics:
Education &
Health risk factors -Alcohol use
-Ever smoked
Perceived attributes:
-Perceived health
-Perceived household wellbeing
-Perceived measure of
Development
Perception
Socioeconomic
characteristics:
Wealth
Figure 3: Revised Model of perceived development (Adapted from: Porter & Garman’s Conceptual
Model of Financial Well-Being (Porter NM & Garman ET, 1993)