factors influencing customer’s return hui hue yeow ... · secondly, we would like to acknowledge...
TRANSCRIPT

FACTORS INFLUENCING CUSTOMER’S RETURN PATRONAGE TO CAFÉ IN KLANG VALLEY
HUI HUE YEOWLAU HENG KIT
NG YI-YEN
BACHELOR OF INTERNATIONAL BUSINESS (HONS)
UNIVERSITI TUNKU ABDUL RAHMAN
FACULTY OF ACCOUNTANCY AND MANAGEMENT DEPARTMENT OF INTERNATIONAL BUSINESS
NOVEMBER 2014
FACTORS INFLUENCING CUSTOMER’S RETURN PATRONAGE TO CAFÉ IN KLANG VALLEY
BY
HUI HUE YEOWLAU HENG KIT
NG YI-YEN
A research project submitted in partial fulfillment of the requirement for the degree of
BACHELOR OF INTERNATIONAL BUSINESS (HONS)
UNIVERSITI TUNKU ABDUL RAHMAN
FACULTY OF ACCOUNTANCY AND MANAGEMENTDEPARTMENT OF INTERNATIONAL BUSINESS
NOVEMBER 2014

Factors of Influencing Customer’s Return Patronage to Café in Klang Valley
i

Factors of Influencing Customer’s Return Patronage to Café in Klang Valley
ii
Copyright @ 2014
ALL RIGHTS RESERVED. No part of this paper may be reproduced, stored in a retrieval system, or transmitted in any form or by any means, graphic, electronic, mechanical, photocopying, recording, scanning, or otherwise, without the prior consent of the authors.
Factors of Influencing Customer’s Return Patronage to Café in Klang Valley
iii
DECLARATION
We hereby declare that:
(1) This undergraduate research project is the end result of our own work and that due acknowledgement has been given in the references to ALL sources of information be they printed, electronic, or personal.
(2) No portion of this research project has been submitted in support of any application for any other degree or qualification of this or any other university, or other institutes of learning.
(3) Equal contribution has been made by each group member in completing the research project.
(4) The word count of this research report is 19,876.
Name of Student: Student ID: Signature:
1. Hui Hue Yeow 11UKB05075 __________________
2. Lau Heng Kit 11UKB05252 __________________
3. Ng Yi-yen 11UKB02821 __________________
Date: 25th November 2014
Factors of Influencing Customer’s Return Patronage to Café in Klang Valley
iv
ACKNOWLEDGEMENT
In this section, we would like to take this opportunity to express our sincere gratitude and
appreciation to those who have lent us their helping hands in assisting us throughout the entire
journey of the research project.
First and foremost, we would like to express our deepest appreciation to our supervisor, Ms.
Farah Waheeda binti Jalaludin for her strict supervision, valuable motivation and professional
guidance. Without her dedication in guiding us from the beginning till the completion of this
research, we would not be able to complete the research project in such timely and professional
manner. Her professionalism and enthusiasm for this research project have been one of the most
influencing factors that have motivated us to complete this research project.
Secondly, we would like to acknowledge Universiti Tunku Abdul Rahman (UTAR) for giving us
this opportunity to be involved in this research project and to push our limits to a new level. It is
crucial as we have acquired valuable knowledge that will be advantageous to our future. Also,
we would like to deliver our sincere appreciation to the housemates of Cypress C-5-2-2, for
allowing us to use the living room and providing us the comfort while conducting this research
project. Without your kind favor, this research would not be completed smoothly.
Apart from this, our appreciations go to the participants in our survey questionnaire for their
willingness to spend their time to complete the questionnaire. Meanwhile, we would like to
extend our earnest gratitude to our parents who have given us their full support. Also, we would
like to thank them for granting us the freedom to stay out late for this research.
Last but not least, earnest appreciation is expressed towards each of the member of this research
group, for each of us has given the last bit of effort and time in completing this research project
as the best we could. This research project would not be completed and work well without
cooperation and coordination from each of the member. Thank you.

Factors of Influencing Customer’s Return Patronage to Café in Klang Valley
v
DEDICATION
We would like to dedicate this research project to our supervisor, Ms. Farah Waheeda binti
Jalaludin who has given us her word of encouragement and made the entire journey of research
project an enjoyable one. We are thankful for her guidance and advice that motivate us in
completing the research project.
Also, the research project is dedicated to our parents, who always support us and motivate us to
give our very best in the research project.
Factors of Influencing Customer’s Return Patronage to Café in Klang Valley
vi
TABLE OF CONTENTS
Page
Copyright Page ……………………………………………………………………........ ii
Declaration ………………………………………………………………………….. .. iii
Acknowledgement ……………………………………………………………………. iv Dedication ……………………………………………………………………………... v
Table of Contents …………………………………………………………………….. vi
List of Tables ………………………………………………………………………... xii
List of Figures ……………………………………………………………………..... xiii
List of Abbreviations ………………………………………………………………... xiv
List of Appendices…………………………………………………………………… xv
Preface ……………………………………………………………………………… xvi
Abstract ……………………………………………………………………………..xvii
CHAPTER 1 RESEARCH OVERVIEW………………………………………. 1
1.0 Introduction…………………………………………..………….. 1
1.1 Research background……………………………………………. 1
1.1.1 Food Service Industry in Malaysia……………………….. 1
1.1.2 Café………………………………………………………... 3
1.1.3 Customer Demographic, Lifestyle and Needs…………….. 5
1.2 Problem Statement………………………………………………. 7
1.3 Research Objectives…………………………………………….. 9
1.3.1 General Objectives………………………………………… 9
1.3.2 Specific Objectives………………………………………... 9

Factors of Influencing Customer’s Return Patronage to Café in Klang Valley
vii
1.4 Research Questions……………………………………………… 10
1.5 Hypotheses of the Study………………………………………… 11
1.6 Significance of the Study………………………………………... 12
1.7 Chapter Layout………………………………………………….. 12
1.8 Conclusion………………………………………………………. 14
CHAPTER 2 REVIEW OF LITERATURE …………………………………... 15
2.0 Introduction…………………………………………………....... 15
2.1 Literature Review……………………………………………….. 15
2.1.1 Service Quality ………………………………………..... 15
2.1.2 Word of Mouth (WOM)..……………………………….. 18
2.1.3 Value for Money (Price) ………………………………... 20
2.1.4 Food Quality…………………………………………….. 22
2.1.4.1 Appearance……………………………………… 24
2.1.4.2 Color…………………………………………….. 24
2.1.4.3 Freshness………………………………………... 25
2.1.5 Environment…………………………………………… . 26
2.1.5.1 Ambient Conditions…………………………….. 27
2.1.5.2 Space/Function…………………………………. 28
2.1.6 Return Patronage…………………………………………. 29
2.2 Review of Relevant Theoretical Model………………………… 33
2.3 Proposed Conceptual Framework………………………………. 37
2.4 Hypotheses Development………………………………………. 39
2.4.1 The Relationship between Service Quality and
Factors of Influencing Customer’s Return Patronage to Café in Klang Valley
viii
Customer’s Return Patronage…………………………… 39
2.4.2 The Relationship between Word of Mouth and Customer’s Return Patronage…………………………… 40
2.4.3 The Relationship between Value for Money (Price) and Customer’s Return Patronage…………………………… 41
2.4.4 The Relationship between Food Quality and Customer’s Return Patronage………………………………………... 43
2.4.5 The Relationship between Environment and Customer’s Return Patronage………………………………………... 44
2.5 Conclusion………………………………………………………. 46
CHAPTER 3 RESEARCH METHODOLOGY……………………………….. 47
3.0 Introduction…………………………………………………....... 47
3.1 Research Design………………………………………………… 47
3.2 Data Collection Methods……………………………………….. 48
3.2.1 Primary Data……………………………………………. 48
3.2.2 Secondary Data…………………………………………. 49
3.3 Sampling Design………………………………………………... 49
3.3.1 Target Population………………………………………. 50
3.3.2 Sampling Frame and Sampling Location………………. 50
3.3.3 Sampling Elements…………………………………….. 50
3.3.4 Sampling Technique…………………………………… 51
3.3.5 Sampling Size………………………………………….. 52
3.4 Research Instrument…………………………………………… 52
3.4.1 Questionnaire Design………………………………….. 53
3.4.2 Pilot Test………………………………………………. 54

Factors of Influencing Customer’s Return Patronage to Café in Klang Valley
ix
3.5 Constructs Management………………………………………. 55
3.5.1 Origins of Construct…………………………………… 55
3.5.2 Scale of Measurement…………………………………. 57
3.6 Data Processing………………………………………………... 58
3.6.1 Checking………………………………………………. 58
3.6.2 Editing………………………………………………… 59
3.6.3 Coding………………………………………………… 59
3.6.4 Transcribing…………………………………………... 59
3.7 Data Analysis…………………………………………………. 60
3.7.1 Descriptive Analysis………………………………….. 60
3.7.2 Scale Measurement…………………………………… 60
3.7.3 Inferential Analysis…………………………………… 61
3.7.3.1 Pearson’s Correlation Analysis………………. 61
3.7.3.2 Multiple Regression Analysis………………… 62
3.8 Conclusion……………………………………………………. 63
CHAPTER 4 DATA ANALYSIS…………………………………………... 64
4.0 Introduction…………………………………………………... 64
4.1 Descriptive Analysis………………………………………….. 64
4.1.1 Respondent Demographic Profile…………………….. 64
4.1.1.1 Gender………………………………………… 65
4.1.1.2 Age Group…………………………………….. 66
4.1.1.3 Race…………………………………………… 67
4.1.1.4 Marital Status…………………...…………….. 69
Factors of Influencing Customer’s Return Patronage to Café in Klang Valley
x
4.1.1.5 Income Level…………………………………... 70
4.1.1.6 Number of Visit………………………………... 71
4.1.2 Descriptive Statistic……………………………………. 73
4.2 Scale Measurement…………………………………………….. 74
4.2.1 Internal Reliability Test………………………………… 74
4.3 Inferential Analysis…………………………………………….. 75
4.3.1 Pearson Correlation Analysis…………………………... 75
4.3.2 Multiple Regression Analysis………………………….. 76
4.3.3 Hypotheses Testing……………………………………... 78
4.4 Conclusion……………………………………………………… 80
CHAPTER 5 DISCUSSION, CONCLUSION AND IMPLICATIONS……… 81
5.0 Introduction…………………………………………………….. 81
5.1 Summary of Statistical Analyses………………………………. 81
5.1.1 Descriptive Analyses…………………………………... 81
5.1.2 Inferential Analyses……………………………………. 82
5.1.2.1 Pearson Correlation……………………………. 82
5.1.2.2 Multiple Regression Analysis………………….. 82
5.2 Discussion of Major Findings………………………………….. 84
5.2.1 Service Quality…………………………………………. 85
5.2.2 Word of Mouth……………………………………….... 86
5.2.3 Value for Money (Price)……………………………….. 87
5.2.4 Food Quality…………………………………………… 88
5.2.5 Environment………………………………………….... 90
Factors of Influencing Customer’s Return Patronage to Café in Klang Valley
xi
5.3 Implications of the Study…………………………………….... 91
5.3.1 Managerial Implications………………………………. 91
5.3.1.1 Service Quality………………………………… 91
5.3.1.2 Word of Mouth………………………………… 92
5.3.1.3 Value for Money (Price)………………………. 92
5.3.1.4 Food Quality…………………………………… 93
5.3.1.5 Environment…………………………………… 94
5.4 Limitations of the Study……………………………………….. 95
5.5 Recommendations for Future Research……………………...... 97
5.6 Conclusion……………………………………………………... 98
References ………………………………………………………………………… 99
Appendices ………………………………………………………………………. 126
Factors of Influencing Customer’s Return Patronage to Café in Klang Valley
xii
LIST OF TABLES
Page
Table 1.1: Consumer Expenditure on Food in Malaysia 2
Table 1.2: Mean Monthly Household Income and Average Annual Growth Rateby States from 2009-2012 6
Table 2.1: Components of Environmental Dimensions 27
Table 3.1: Origins of Constructs 55
Table 3.2: Sample Items of Constructs 56
Table 3.3: Rule of Thumb for Strength of Association for Correlation Coefficient 62
Table 4.1: Gender 65
Table 4.2: Age Group 66
Table 4.3: Race 67
Table 4.4: Marital Status 69
Table 4.5: Income Level 70
Table 4.6: Number of Visit 71
Table 4.7: Descriptive Statistics on Variables 73
Table 4.8: Reliability Test 74
Table 4.9: Model Summary 76
Table 4.10: ANOVA a 76
Table 4.11: Coefficientsa 77
Table 5.1: Summary of Major Findings 84
Factors of Influencing Customer’s Return Patronage to Café in Klang Valley
xiii
LIST OF FIGURES
Page
Figure 1.1: Food Service Subsectors in Malaysia in 2012 2
Figure 2.1: Evaluation of Factors Affecting Customer Loyalty in Restaurant Industry 33
Figure 2.2: The Construct and Influence of Word of Mouth: Receiver Perspective 35
Figure 2.3: Service Quality and Customer Satisfaction: Antecedents of Customer’s Repatronage Intention 36
Figure 2.4: Factors Influencing Customer’s Return Patronage to Café in Klang Valley 37
Figure 4.1: Gender 65
Figure 4.2: Age Group 66
Figure 4.3: Race Percentage 68
Figure 4.4: Marital Status 69
Figure 4.5: Income Level 70
Figure 4.6: Number of Visit 72

Factors of Influencing Customer’s Return Patronage to Café in Klang Valley
xiv
LIST OF ABBREVIATIONS
ANOVA Analysis of Variance
DV Dependent Variable
E Environment
FQ Food Quality
IV Independent Variable
Sig Significance
SPSS Statistical Package for Social Science
SQ Service Quality
TTDI Taman Tun Dr Ismail
UTAR Universiti Tunku Abdul Rahman
VFM Value for Money
WOM Word of Mouth

Factors of Influencing Customer’s Return Patronage to Café in Klang Valley
xv
LIST OF APPENDICES
Page
Appendix A: Previous Research Showing Research Gap 126
Appendix B: Questionnaire 127
Appendix C: SPSS Output: Pilot Test 136
Appendix D: SPSS Output: Descriptive Statistics 139
Appendix E: SPSS Output: Reliability Test 141
Appendix F: SPSS Output: Pearson Correlation Analysis 144
Appendix G: SPSS Output: Multiple Regression Analysis 145
Factors of Influencing Customer’s Return Patronage to Café in Klang Valley
xvi
PREFACE
The current research study is done as a part of the fulfillment of the requirement of course of
Bachelor of International Business under Faculty of Accountancy and Management in Universiti
Tunku Abdul Rahman.
The emerging wave of customers visiting a café is noticeable in the Malaysia society. The
reasons have also been acknowledged by researchers as more than merely coffee-drinking habit.
In the marketing world, the changing consumer needs is also a focus in which marketers are
trying to provide a solution for customer in relation with the changing needs. Thus, the factors
have been extracted and adapted from literature review so that they can be tested against
customer’s return patronage to café in Klang Valley.
Relevant research method and processes have been used and conducted. To increase the
reliability and accuracy, face-to-face method has been used to collect data as well. Relevant data
analysis tool has been used to analyze data. Hopefully, the research contributes to the insight of
the café service provider as well as adds updated information to the body of knowledge.

Factors of Influencing Customer’s Return Patronage to Café in Klang Valley
xvii
ABSTRACT
The purpose of conducting this research project is to study the factors of service quality, word of
mouth, value for money, food quality as well as environment that influence the customer’s return
patronage to cafés in Klang Valley. To acquire the objectives of this research project, research
questions and five hypotheses are developed as well as tested. Moreover, each hypothesis is
measured accordingly and results acquired are subsequently explained in detail. Furthermore,
literature reviews are included in this research project as to provide a clearer understanding
towards the influential factors on customer’s return patronage, as well as to provide justification
towards the research questions and research problems. Primary data were collected through
survey questionnaires for this research purposes, and 200 questionnaires were distributed to the
targeted respondents which are people who have visited any café selected for this research in
Klang Valley at least once. Through the use of Statistical Package for Social Science (SPSS),
data collected through survey questionnaires are able to be measured and analyzed. The results
acquired from the SPSS test are discussed in the form of tables and charts. Also, the major
findings of this research project were discussed in order to understand the relationship between
service quality, word of mouth, value for money, food quality and environment towards
customer’s return patronage to café. We acknowledge that some factors are significant in
affecting customer’s return patronage to café after conducting this research, while some are not.
Last but not least, the managerial implications have been discussed to provide insights and useful
information to the café industry. Also, the limitations faced in this research will be noted and
recommendations will be established to assist future researchers in managing these limitations.

Factors of Influencing Customer’s Return Patronage in Café in Klang Valley
Page 1 of 145
CHAPTER 1: RESEARCH OVERVIEW
1.0 Introduction
The chapter will provide an overall description of the research project.
The research seeks to understand various factors that influence
customer’s return patronage to café. It begins with research
background, narrowing the broad field of study to the focus of research
problem. It is then followed by problem statement which specifies the
boundary of research, research objectives which address purpose of the
study, research questions, hypotheses which are developed from
literature review and significance of study which states the
contribution of the study. Towards the end of the chapter, each
chapter’s outline and conclusion will be presented.
1.1 Research Background
1.1.1 Food Service Industry in Malaysia
Food, being a necessity, contributes to the country GDP. Table
1.1 shows the pattern of Malaysians expenditure on food
denoted in USD million which is increasing year by year from
2010 to 2014. Nevertheless, food service industry is part of the
contribution of food as a whole. According to The Malaysian
Food Industry (2012), the food service sector in Malaysia grew
at an average rate of 6.5% years beforehand, and it is expected
to undergo 7-10% growth rate in the following three to five
Factors of Influencing Customer’s Return Patronage in Café in Klang Valley
Page 2 of 145
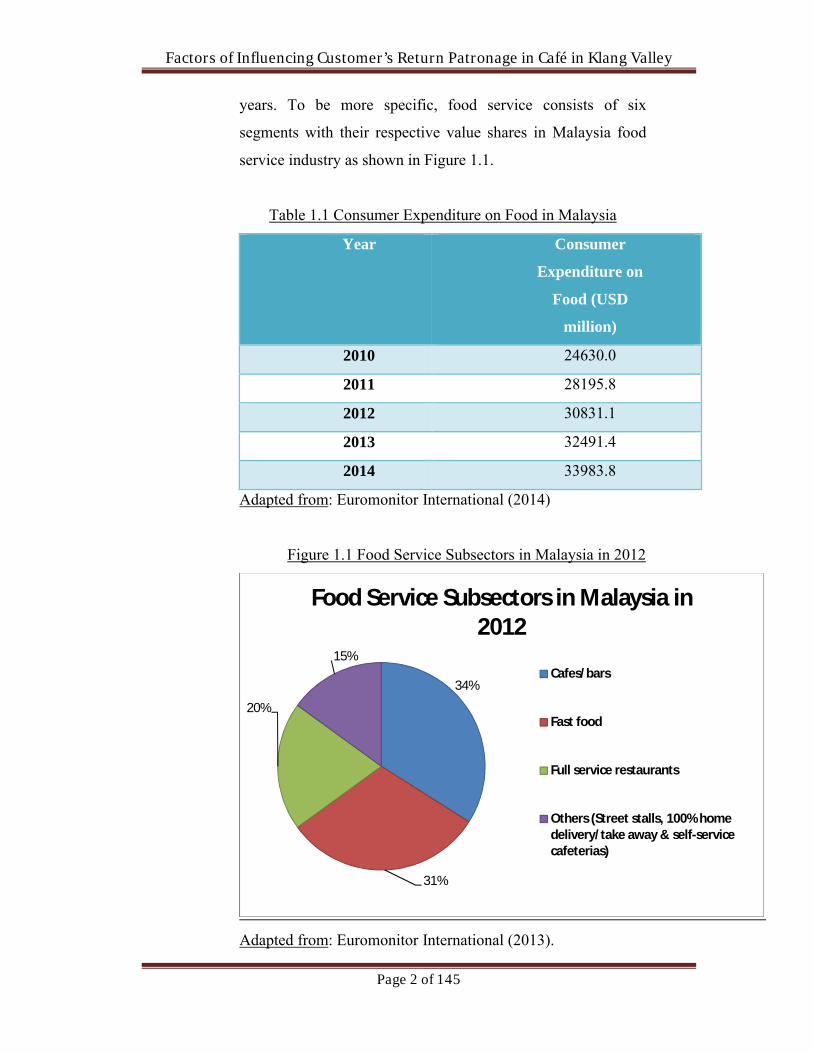
years. To be more specific, food service consists of six
segments with their respective value shares in Malaysia food
service industry as shown in Figure 1.1.
Table 1.1 Consumer Expenditure on Food in Malaysia
Year Consumer
Expenditure on
Food (USD
million)
2010 24630.0
2011 28195.8
2012 30831.1
2013 32491.4
2014 33983.8
Adapted from: Euromonitor International (2014)
Figure 1.1 Food Service Subsectors in Malaysia in 2012
Adapted from: Euromonitor International (2013).
34%
31%
20%
15%
Food Service Subsectors in Malaysia in 2012
Cafes/bars
Fast food
Full service restaurants
Others (Street stalls, 100% home delivery/take away & self-service cafeterias)

Factors of Influencing Customer’s Return Patronage in Café in Klang Valley
Page 3 of 145
Urbanization and city development leads to increasing number
of shopping malls which opens up opportunity for food service
outlets expansion (Euromonitor International, 2013). This can
be exemplified by operators like Coffee Bean & Tea Leaf,
Italiannies and Starbucks which opened new outlets in the new
shopping mall, Paradigm Mall in 2012. It stimulates demand
for the food service players as shoppers tend to dine out during
their shopping trips. To match customer needs, food service
provider adds features into its offerings such as increased
convenience, home delivery options and perceived health
benefits. Moreover, food service operators smartly utilize
online or mobile channels to offer deals or communicate with
customers, given the fact that as of 2013, 67% of Malaysians
have access to the Internet according to Internet World Stats
(2014).
1.1.2 Café
Café industry growth has been significant years ago especially
in developed countries. According to Holmes (2004), coffee
houses or cafés show a positive surge in the United States, with
10% growth per year from 2000 to 2004. Concurrent growth in
fast food industry is much slower, with only 2% growth
annually. In 2012, it is reported that cafés/bars players held the
biggest value shares of 34% in the entire food service industry
in Malaysia (Euromonitor International, 2013). Cafés continue
to popularize and have significant level of demands in the
country due to higher purchasing power, increased social
Factors of Influencing Customer’s Return Patronage in Café in Klang Valley
Page 4 of 145
activities engaged as well as strong coffee-drinking culture
(Euromonitor International, 2013).
As a matter of fact, coffee houses or cafes have transformed
and undergone some changes to better suit the modern
environment. According to Woldoff, Lozzi and Dilks (2013),
traditional cafes experienced fading while the existing or new
cafes are serving as a non-public area for leisure and work
purpose with the patron’s portable electronic devices in
addition to merely allowing socialization activity among
customers. Various amenities are used to supplement the café’s
offerings, for instance, games, music, newspaper, special
seating arrangement and Wi-Fi (Woldoff et al., 2013).
Precisely, the transformation of the coffee houses is in terms of
the way patrons use them and the culture in them. Bazelon
(2009) concluded that the time frame with which patrons use to
socialize in this modern age has gradually shortened and the
customers tend to have their productivity-related tasks done in
cafes. Blank & Van Vooren (2007) labelled some patrons as
“campers” as they are in the café for a minimum of three hours.
The rationales behind these “campers” include the need for a
temporary escape from the hectic city life (Blank & Van
Vooren, 2007) and the preference for a stress-free atmosphere
over the choice of library (Waxman, 2006). With regards to
culture changes, Bryman (2004) noted that the retail or private-
regulated settings in modern world discourage or restrict
sociality but encourage the connected culture via information
technology device. According to Manzo (2014), café’s menu
has been extended to non-coffee food and beverages.
Sophisticated equipment becomes a differential emphasis and a
Factors of Influencing Customer’s Return Patronage in Café in Klang Valley
Page 5 of 145
basis in facilitating communication among baristas and patrons.
The context of this research study revolves around this stand-
alone, rather modern type of cafés which find it becoming the
social trend among patrons who enjoy café-hopping.
1.1.3 Customers Demographic, Lifestyle and Needs
In recent years, there is an emerging wave of customers
visiting coffee houses or cafés. The phenomenon stems from
changing customers descriptor variables such as demographic
and behavioral variables. The changes have led to shift in
consumer buying behavior and consumption patterns (Pandey
& Pandey, 2013). It is vital to understand these changes
because the retention of existing customers is much more
effective for marketers than acquisition of new customers
(Anderson & Narus, 2004). It is similar as any other industry
in which new opportunity arises due to shift in customer needs.
Apparently, cafes become an attractive opportunity in today’s
era. Patrons of dining place nowadays do not only consider
food and beverages as the benefits offered by the dining place.
Instead, there are various criteria involved in this decision such
as services because of the increasing educational level and
sophisticated need. Shamsudin, Mohamed, Abdullah & Radam
(2011) also noted that food service in Malaysia continues
growing as a result of increasing income and rapid
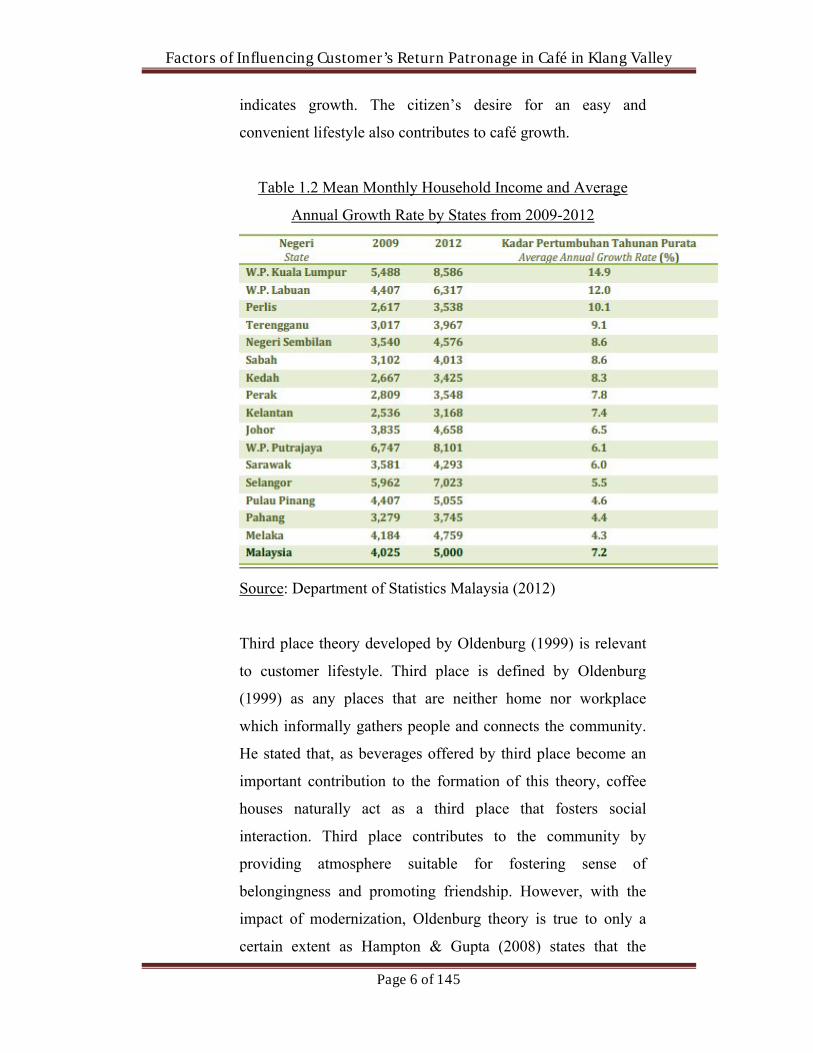
urbanization. Table 1.2 illustrated the average household
income by states and their respective yearly growth rate from
2009 to 2012. Noting that Klang Valley comprises Kuala
Lumpur and joins with areas in Selangor, Kuala Lumpur
continues to register the highest rate, while Selangor also
Factors of Influencing Customer’s Return Patronage in Café in Klang Valley
Page 6 of 145
indicates growth. The citizen’s desire for an easy and
convenient lifestyle also contributes to café growth.
Table 1.2 Mean Monthly Household Income and Average
Annual Growth Rate by States from 2009-2012
Source: Department of Statistics Malaysia (2012)
Third place theory developed by Oldenburg (1999) is relevant
to customer lifestyle. Third place is defined by Oldenburg
(1999) as any places that are neither home nor workplace
which informally gathers people and connects the community.
He stated that, as beverages offered by third place become an
important contribution to the formation of this theory, coffee
houses naturally act as a third place that fosters social
interaction. Third place contributes to the community by
providing atmosphere suitable for fostering sense of
belongingness and promoting friendship. However, with the
impact of modernization, Oldenburg theory is true to only a
certain extent as Hampton & Gupta (2008) states that the

Factors of Influencing Customer’s Return Patronage in Café in Klang Valley
Page 7 of 145
existence of Wi-Fi has shielded the interaction between
customers with electronic devices in place. Nevertheless, the
welcoming atmosphere of cafés and the café’s nature of
stimulating friendship formation still exist, but to the fact that it
is slowly and partly replaced by new technology.
Waxman (2006) has also discussed place attachment, which
results from the interaction between people and the places. The
emotional component of place attachment tightly links people
to the place. Low and Altman (1992) explained the
inseparability of the people with the place due to blend-in
experience as well as the place attachment’s ability to predict
one’s daily routine and to be a place for relaxation. Waxman
(2006) added that a third place designer has to incorporate the
social traits to enhance bonding among customers besides mere
comfort. Besides that, social need portrayed that the desire to
be socially approved by others and to connect with others urge
one to follow to the place where others visit to. Similarly,
social influence such as family and reference group will affect
one’s product preference.
1.2 Problem Statement
Today marketing world revolves around customer-oriented strategy
and emphasis rather than the traditional marketing or sales orientation.
This statement highlights the importance of understanding target
customers. However, there is an insufficiency in the numbers of
studies done precisely on the reasons that cause customers to revisit
the same café. Research studies on revisit intention are numerous, but
mostly focus on restaurants (Tan & Yeap, 2012) or fast food (Sefian,

Factors of Influencing Customer’s Return Patronage in Café in Klang Valley
Page 8 of 145
Jaini, Sharudin & Abdullah, 2013; Azila, Suraya & Siti Zamanira,
2014) due to its high availability and wide spread.
Lack of local research studies also pose a problem. Coffee houses were
symbolic starting around early 17th century in London, Boston,
Ottoman Empire and some European countries. Research studies in
Malaysia on coffee houses-related topics are lacking due to the fact
that cafes culture is relatively new in Malaysia. It is not applicable to
adopt foreign research studies in Malaysia context, taking into
consideration of distinctive norms and demographic. Table 1.3 shows
the previous research that posts a research gap that calls for the current
research. (See Appendix A)
In addition, considerable time period that has elapsed after related
research studies also leave a research gap. The acceptance of café
culture rather than merely coffee-drinking habit is a new wave in
recent years in Malaysia as compared to Western countries as
exemplified by research like Woldoff et al. (2013). Therefore, up-to-
date and latest trend is yet to be covered in any studies. By collecting
information from the current target respondents, relatively accurate
and precise factors that are meaningful in today’s café world can be
derived. With that, a more thorough and applicable framework can be
developed from more available journals.
Knowing the fact that entering a café industry involves a huge sum of
costs ranging from entry costs, fixed and variable costs as well as
opportunity costs, more precise factors have to be investigated with
regards to patron’s revisit intention. It includes service quality, word of
mouth, value for money (price), food quality and environment.
Exemplifying service quality, the SERVQUAL model may be long
applied in restaurant industry (Shaikh & Khan, 2011) and fast food
Factors of Influencing Customer’s Return Patronage in Café in Klang Valley
Page 9 of 145
industry. The proposed theoretical framework shows that factors
identified in the current study are the antecedents for customer
satisfaction and loyalty (Haghighi, Dorosti, Rahnama & Hoseinpour,
2012), which leads to customer’s revisit intention. In this study, no
specific generation will be the target respondents, instead, second time
visitors for the same café will be targeted for better and more accurate
collection of data.
1.3 Research Objectives
1.3.1 General Objectives
(i) To determine the factors that influence customer’s return
patronage to café in Klang Valley.
(ii) To understand the relationship between various factors
identified that influence customer’s return patronage to café in
Klang Valley.
1.3.2 Specific Objectives
The specific objectives are addressed as below:
(i) To examine the relationship between service quality and
customer’s return patronage to café in Klang Valley.
(ii) To examine the relationship between word of mouth and
customer’s return patronage to café in Klang Valley.
Factors of Influencing Customer’s Return Patronage in Café in Klang Valley
Page 10 of 145
(iii) To examine the relationship between value for money
(price) and customer’s return patronage to café in Klang
Valley.
(iv) To examine the relationship between food quality and
customer’s return patronage to café in Klang Valley.
(v) To examine the relationship between environment and
customer’s return patronage to café in Klang Valley.
1.4 Research Questions
The research study attempts to answer the following questions:
(i) Does service quality affect customer’s return patronage to café in
Klang Valley?
(ii) Does word of mouth affect customer’s return patronage to café in
Klang Valley?
(iii) Does value for money (price) affect customer’s return patronage
to café in Klang Valley?
(iv) Does food quality affect customer’s return patronage to café in
Klang Valley?
(v) Does environment affect customer’s return patronage to café in
Klang Valley?

Factors of Influencing Customer’s Return Patronage in Café in Klang Valley
Page 11 of 145
1.5 Hypotheses of the Study
Hypotheses that are developed according to the research objectives
and questions are as follow:
H0: There is no significant relationship between service quality and
customer’s return patronage to café in Klang Valley.
H1: There is a significant relationship between service quality and
customer’s return patronage to café in Klang Valley.
H0: There is no significant relationship between word of mouth and
customer’s return patronage to café in Klang Valley.
H2: There is a significant relationship between word of mouth and
customer’s return patronage to café in Klang Valley.
H0: There is no significant relationship between value for money
(price) and customer’s return patronage to café in Klang Valley.
H3: There is a significant relationship between value for money (price)
and customer’s return patronage to café in Klang Valley.
H0: There is no significant relationship between food quality and
customer’s return patronage to café in Klang Valley.
H4: There is a significant relationship between food quality and
customer’s return patronage to café in Klang Valley.
Factors of Influencing Customer’s Return Patronage in Café in Klang Valley
Page 12 of 145
H0: There is no significant relationship between environment and
customer’s return patronage to café in Klang Valley.
H5: There is a significant relationship between environment and
customer’s return patronage to café in Klang Valley.
1.6 Significance of the Study
The core of the study is to understand the factors that lead to
customer’s return patronage to café in Klang Valley. In fact, the
noticeable phenomenon of café industry undergoing rapid growth
urges the need for such study. Marketers of the surging number of
cafés may find it difficult to retain customers as they lack of the
knowledge as to the reasons customers decide to return to café again.
Thus, the study contributes to marketer’s customer-oriented
understanding and serves as a basis for café’s marketing plan and
strategy. Any of the factors can serve as a reference when the café is
deciding its differential advantage. As a result, it increases likelihood
of customer’s return patronage. This better enables the café to gain an
advantageous position in the competitive dynamic of the industry.
1.7 Chapter Layout
Chapter 1: Introduction
To start off the research study, chapter 1 specifies the study context
and provides description regarding the research study. The explanation
provided starts with the research background, problem statement,

Factors of Influencing Customer’s Return Patronage in Café in Klang Valley
Page 13 of 145
research objectives, research questions, hypotheses of the study and
ends with significance of study. Chapter layout and conclusion are
included.
Chapter 2: Literature Review
This chapter documents the review of related literature in the field of
study. Various variables are identified and critical reviews are done
with regards to the variables. Sources of literature include journals,
articles and other secondary sources. Then, foundation of study will be
formed by developing theoretical frameworks from previous related
study. Clearer and more precise problem statement can then be formed
in order to improve the current findings.
Chapter 3: Methodology
Chapter 3 explains the process and ways that the research will be
carried out. It is expressed in terms of research design, data collection
methods, sampling design, research instruments, constructs
measurement, data processing, data analysis and conclusion.
Chapter 4: Data Analysis
Chapter 4 presents the analysis of results that are obtained from the
data collection methods. Patterns of results will be shown. Software
will be in used to analyze the descriptive analysis will include
demographic profiles of respondents. It is followed by scale
measurement which provides the results of reliability analysis.

Factors of Influencing Customer’s Return Patronage in Café in Klang Valley
Page 14 of 145
Inferential analysis concludes the characteristics of population based
on the sample data. The chapter ends with conclusion.
Chapter 5: Discussion, Conclusion and Implications
This chapter is inclusive of summary of statistical analysis, discussion
of findings to validate the stated objectives and hypotheses as well as
implications for policymakers and practitioners. It ends with
limitations and recommendations for potential future study. Finally,
conclusion of the entire research study is presented.
1.8 Conclusion
This introductory chapter gives a brief outline of the research study of
factors influencing customer’s return patronage to café in Klang
Valley as a whole. The overview is defined as expressed in research
background, problem statement, research objectives, research
questions, hypotheses of study, significance of study and lastly,
chapter layout. Chapter 2 will further enhance the information needed
for study by including literature review and development of theoretical
framework.

Factors of Influencing Customer’s Return Patronage in Café in Klang Valley
Page 15 of 145
CHAPTER 2: REVIEW OF LITERATURE
2.0 Introduction
To continue with the preceding chapter, the review of the literature will look further
into the details of the factors influencing customer’s return patronage to café. Factors
to be included are service quality, word of mouth, value for money (pricing), food
quality and store environment. Then, it is followed by theoretical framework
conceptualization and hypotheses development. Lastly, conclusion will be drawn to
close this chapter.
2.1 Literature Review
2.1.1 Service Quality
For the past three to four decades, service quality has been a frequently
researched construct by many scholars and they have contributed in different
viewpoints as well as empirical findings (Lehtinen & Lehtinen, 1982;
Gronroos, 1990; Parasuraman, Zeithaml, & Berry, 1994). Haghighi, Dorosti,
Rahnama, and Hoseinpour (2012) proved that service quality contributes to
customer satisfaction. As a result, service quality also leads to customer
loyalty and long term retention (Imrie, Durden, & Cadogan, 2000). However,
this construct is very abstract due to its intangibility, inseparability,
perishability and heterogeneity (Moeller, 2010). The most often adopted
definition of service quality is that it is the result of comparison that is made
between customer’s expectation from the service provider and his/her
perception of the service firm (Lehtinen & Lehtinen, 1982; Lewis & Booms,
Factors of Influencing Customer’s Return Patronage in Café in Klang Valley
Page 16 of 145
1983; Gronroos, 1984; Parasuraman et al., 1994). Customer is the key as
service quality is evaluated and assessed by them comparing the expectation
and perception instead of the firm (Berry, Parasuraman, & Zeithaml, 2001).
One common ground that most of these researchers have is the fact that
service quality is not one-dimensional. As one of the pioneering landmark
researcher, Gronroos (1988) 2-dimensional approach has incorporated
“technical” and “functional” quality. The functional aspect is literally the
process, in which service is evaluated while it is performed; while, technical
aspect is the outcome of the service (Gronroos, 1982). Not to be omitted is
organization image as customers will have previous experience and
perceptions towards a firm attached in their subsequent visit (Gronroos, 1982).
Reputable image serves as an asset for a firm (Kang & James, 2004). In
addition, Lehtinen and Lehtinen (1982) proposed a three-dimensional view of
service quality, comprising “interaction”, “physical” and “corporate” quality.
Tangible aspects of the service are attributable to “physical” quality,
interaction activities between service providers and customers are
characterized under “interaction” quality and lastly, service provider image is
associated with “corporate” quality. Viewing from dimensional perspective,
different researchers share the common structure in forming the definition of
service quality.
One widely and predominantly adopted framework in assessing service
quality is the 22-item SERVQUAL instrument introduced by Parasuraman,
Zeithaml, and Berry (1985). The instrument depicts that customer
expectations include five dimensions: tangibles which represent the outlook of
the physical facilities, equipment, personnel; reliability which tells a firm’s
ability to deliver services on promises; responsiveness which shows firm’s
willingness to offer help and provide immediate service; assurance which
includes employees knowledge and courtesy as well as their abilities to
portray trust and confidence; empathy which covers values like caring,
understanding and giving personalized attention to customer. Adoption of the
Factors of Influencing Customer’s Return Patronage in Café in Klang Valley
Page 17 of 145
instrument indifferent industries over time has however, brought the
researchers to various deficiencies and inconsistencies, thus, some changes.
According to Carman (1990), performance aspect suffices in evaluating
service quality. Cronin and Taylor (1994), Forbes, Tse, and Taylor (1986) as
well as Tse and Wilton (1988) also questioned the usefulness of the
expectation aspects, followed by increasing number of research as proof in
support of the omission of expectations (Dabholkar, Shepherd, & Thorpe,
2000). Parasuraman et al. (1994) has then put in effort to reconceptualize the
expectation aspect to differentiate desired and minimum expectations.
Suggestion has also been made by Parasuraman et al. (1994) to merge the
three human performance-related factors, responsiveness, assurance and
empathy into one factor, resulting in a total of three dimensions instead of
five. Similarly in Gronroos approach context, criticism comes in the sense that
SERVQUAL instrument only accounts for the “functional” quality, which as
mentioned before, means the process and ignores the outcome “technical”
quality (Mangold & Babakus, 1991; Hossain, 2014). Another outcome of the
extension adoption is the suggestion of the use of SERVPERF due to the fact
that performance perception shows more significant relationship and suffices
in service quality assessment (Cronin & Taylor, 1992). Apart from
SERVQUAL and SERVPERF measures of service quality, there are also
other proposed means such as five factors of service quality by
Sureshchander, Rajesndran, and Kamalanabhan (2001) which includes core
service product, human aspect of service delivery, delivery systemization,
tangibility and social responsibility. Lack of validity adds to its criticisms as
well. The model has been used in different settings, contexts and geographical
areas. For instance, it has been tested in hospital (Babakus & Mangold, 1992),
hospitality industry (Ting, Boo, & Othman, 2011), restaurant business (Fu,
Cho, & Parks, 2000), international fast food (Kaur, 2013), tourism industry
(Riemer & Reichel, 2000), banking (Mukherjee & Nath, 2005), real estate
(Dabholkar & Overby, 2005) and more. The widespread adaptation and
Factors of Influencing Customer’s Return Patronage in Café in Klang Valley
Page 18 of 145
adoption of the model has no doubt proven some success case but has also
raised questionable concerns regarding its validity.
SERVQUAL instrument will be the basis for the present study with the five
dimensions tangible, responsiveness, reliable, assurance and empathy being
tested.
2.1.2 Word of Mouth (WOM)
As one of the early stage researchers working on WOM, Arndt (1967) defined
WOM as informal, person-to-person form of communication about a product
or service, brand which is done orally between people who have no
commercial relationship with the brand or marketer. Anderson (1998) shared
similar view as Arndt, stating that WOM happens when private parties are
having informal communication while evaluating the goods and services.
Bone (1992) adds to the point of Arndt that WOM is a group phenomenon
with parties exchanging thoughts and comments about a product or service.
WOM is said to differ from marketing advertising in term of its nature to be
face-to-face, mutually active, spontaneous and exclusive of features such as
jingles (Stern, 1994). However, Buttle (1998) argued on some aspects of the
definition by noting that WOM can be communicated electronically. In
addition, certain researchers opined that WOM is a form of recommendation
given by consumers instead of solely comments or thoughts (Gremler &
Brown, 1996; Hartline & Jones, 1996). Arndt’s (1967), Anderson’s (1998)
definition will be the basis in the present study. Buttle (1998) statement of
including electronically generated communication will also be used as the
Internet calls for revision of past WOM definitions.
To ensure more informed and right decisions are made, consumers tend to
look for opinions from other parties who happened to be the previous

Factors of Influencing Customer’s Return Patronage in Café in Klang Valley
Page 19 of 145
consumers. This is attributed to the perceived risk entailed in consumer’s
purchase, be it functional, social, financial, time or psychological risk (Ha,
2002). Service is especially of concern as it is inherently tagged along with
intangible, inseparable, perishable and heterogeneous characteristics (Moeller,
2010). Murray (1991) opined that consumer’s likelihood to search for
information increases parallel with his or her perceived risk and the preferred
means is WOM. On the flipped side, customers who have tried the product or
service will then relate their satisfaction level to others. Positive WOM
includes satisfactory experience while negative one comprises annoyed and
unpleasant experience, in which both are vivid and novel (Anderson, 1998). It
can be concluded that negative WOM has more significant impact relative to
positive ones (Assael, 2004).
Source credibility or expertise serves as an important factor in WOM. It is
explained by Wathen and Burkell (2002) as an important criterion in helping a
consumer in information judgment, especially online information. Due to
WOM source’s independency, WOM recipient will less likely perceive WOM
to be manipulative, in comparison with spokesperson or marketers who have
commercial linkage with the product or service (Bansal & Voyer, 2000).
Typically, WOM source consists of those who exceptionally own influencing
power over the rest, being known as opinion leader, be it face to face or
through Internet (Jin, Bloch, & Cameron, 2002). Within a social network,
these influential people initiate information flow regarding a new product or
idea, making WOM available to members within the network (Park & Suh,
2013).
Marketing wise, WOM plays vital role in altering and shaping consumer’s
attitudes and behavior (Delgadillo & Escalas, 2004). Given its low or no cost
incurred, WOM is viewed as an effective and efficient promotional alternative
particularly in acquiring new customer (McConnell & Huba, 2007). Apart
from that, high credibility of WOM also contributes to its effectiveness in

Factors of Influencing Customer’s Return Patronage in Café in Klang Valley
Page 20 of 145
marketing communication’s point of view (Trusov, Bucklin, & Pauwels,
2009). Also, WOM assists in reinforcing WOM giver’s satisfaction, which in
turn contributes to marketing variables like customer loyalty and attitude
towards brand (Ryu & Feick, 2007).
2.1.3 Value for money (Price)
According to Yuksel and Yuksel (2002), they mentioned that customers also
visit to restaurants because of the price that they are paying is value for money
instead of only good service, environment, quality service and food. They
continued that value may have independent interpretation to different person
such as consumers gets for the price in exchange of quality, any value-added
consumers demands in goods or services, low price and/or value that
represents consumers obtain for what they have sacrificed. In the past decade,
Zeithaml (1988) defined customer value that is an overall assessment of
customer towards the product performance in terms of what is received and
what is given perceptions. Whereby, Dodds, Monroe, and Grewal (1991)
defined the perception value is influencing the willingness to purchase
indirectly. These two are supported by Butcher, Sparks, and O’Callaghan
(2002) and Sweeney (1994), they mentioned that value for money as in terms
of monetary exchange concept, it is a cognitive opportunity cost between the
perceived quality and sacrifice (e.g. monetary, psychological, time, etc)
(Grace & O’Cass, 2005). Similarly, customer value is also described as
opportunity cost between the quality (benefit) of the product perceived by
consumers in relation to the what consumers perceived of the sacrifice (cost,
price) for the product (Bolton & Drew, 1991; Monroe, 1990). Grace and
O’Cass (2005) stated that customer satisfaction model does not take the
sacrifice into account that connects with the benefits exchange, but perceived
value does. Continually, Grace and O’Cass (2005) also argue that even if
customers are satisfied with perceived product performance, it is not

Factors of Influencing Customer’s Return Patronage in Café in Klang Valley
Page 21 of 145
necessarily that represents overall satisfaction due to the greater monetary
sacrifice. Furthermore, McDougall and Levesque (2000) and Zeithaml (1988)
suggested that customers are more satisfied, who perceive they have received
value for money, than those do not. In previous evidence done by Grace and
O’Cass (2005), they claimed that customers’ decision to repatronize back to a
particular store may due to the perceptions of perceived value for money,
which they have satisfaction previously.
Past studies have considered price impact on retail patronage behavior through
different concepts (Moore & Carpenter, 2006): consumer value (Sweeney &
Soutar, 2001), pure monetary cost (Fox, Montgomery, & Lodish, 2004) and
store image as broader terms element (Finn & Louviere, 1996). In addition,
Moore and Carpenter (2006) found out that there is significant relationship
between price and patronage behavior and supported by Yavas (2003). Dodds
et al. (1991) found that higher price will be reducing the customers’
willingness to purchase. Alternatively, Pan and Zinkhan (2006) mentioned
that low price may generate sales increases and store traffic which resulted
either from price promotions or general price levels. Whereby, Tellis and
Gaeth (1990) mentioned that consumers seek for a brand that is highest price
of all in order to maximize the expectation of quality, which is known as
“price-seeking”. This posits that there is a positive relationship between the
price and quality of goods and services (Dodds et al., 1991; Grace and
O’Cass, 2005; Kerin, Jain, & Howard, 1992; Rao & Monroe, 1989). For
example, high price represents a good product quality. However, Varki and
Colgate (2001) argue that customer will be switching due to high price and
may generate negative physiological response to information. Dodds et al.
(1991) mentioned that even though there is positive effect of price on
perceived product quality, but it impact perceived value and willingness of
purchase negatively. This is agreed by the study done by Schiffman and
Kanuk (2004), they said that if perceived price is unfair, it may stimulate
value perception of customers and their willingness to buy. Based on research
Factors of Influencing Customer’s Return Patronage in Café in Klang Valley
Page 22 of 145
conducted by Jiang and Rosenbloom (2005), they found that perceived price
acts as fundamental role in determining post-purchase satisfaction. Thus,
perceived price is referred as the degree of which a customer perceives the
product price as high or low (Chaiyasoothorn & Suksa-ngiam, 2011). In short,
according to Ramly, Ahmad, and Ahmadin (2003), they mentioned that
perceived price is related to the concept of value for money.
In conclusion, value is argued as the main purchase motivation among the
customers (Berry & Yadav, 1996) and there is positive linkage in repurchase
intention and perceived value (Oh, 1999), thus value for money (price) will be
using as the independent variable (IV) in this study as price is playing
important role for customer for deciding a restaurant (Ramly, Ahmad, &
Ahmadin, 2003; Pedraja & Yague, 2001). The researchers will adopt the
definition from Butcher et al. (2002) in this research: value of money is a
cognitive opportunity cost between the perceived quality and sacrifices in
terms of monetary exchange concept. This is consistent with the definition and
conceptualization in marketing (value for money) by Patterson and Spreng
(1997), which is the tradeoff in product performance (food quality) and the
monetary exchange (price).
2.1.4 Food Quality
Based on Peri (2006), food quality is a critically essential circumstance in
satisfying the needs and expectations of consumers. The product will not be
able to accomplish its primary function.
This statement was supported by Pettijohn, Pettijohn, & Luke (1997), food
quality was positioned as one of the most crucial determinants in measuring
customers’ satisfaction which the customer satisfaction will eventually lead to
the decision on re-patronage to a particular café.

Factors of Influencing Customer’s Return Patronage in Café in Klang Valley
Page 23 of 145
According to Ha and Jang (2012) and Ryu et al. (2012), quality food can be
defined as food that is well-presented, fresh and tasty. This is in line with the
finding done by Hansen, Jensen, and Gustaffson (2005), whom discovered
that the ‘taste of food’ as the most commonly mentioned element of the core
product in the surveys aimed at researching the reasons that formed
consumers’ meal experiences.
McWilliams (1993) revealed that food quality is the quality characteristics of
food that is acceptable to customer. This includes external factors such as
appearance, taste, smell and texture of the food (Imram, 1999). The same
researcher added, appearance, flavor and texture are important quality
attributes which differentiate raw food materials and processed products. Ha
and Jang (2012) further opine that food and service quality are essential in
determining customer satisfaction as well as customers’ future behavior
towards the restaurant. If the customers are satisfied with the food and service
quality they receive at the restaurant, they will be more likely to communicate
positively about the restaurant, revisit the restaurant and subsequently
contribute to the profitability of the restaurant (Kaura, Datta & Vyas 2012;
Kim, Ng, & Kim 2009)
In short, quality plays a significant role in determining and influencing
customer satisfaction. Food quality and acceptability is complex and
interdisciplinary, encompassing scientific disciplines including food science
and technology, nutrition, psychology, physiology, marketing and hospitality
(Imram, 1999).

Factors of Influencing Customer’s Return Patronage in Café in Klang Valley
Page 24 of 145
2.1.4.1 Appearance
Appearance of food was also found to influence consumers’ pleasantness in
eating out. The appearance of food could be influenced by how a meal was
decorated and presented. According to Hansen et al. (2005), the visual effect
of the core product (food) was a factor that many respondents perceived to be
important in their meal experience. It is probably because, appearance of food
affected consumer liking of the food.
From their research, Namkung and Jang (2008) identify food presentation
(appearance) and taste as the most influential food quality factors, whereas Ha
and Jang (2012) identify food variety as the most important contributor.
According to Jangga, Sahari, and Basir (2012), however, restaurants should
also consider additional factors such a pricing, presentation, taste, portioning,
and value for money when addressing food quality issues.
Presentation is defined as how attractively food is presented and decorated as
a tangible cue for customer perception of quality. Kivela, Imbakaran, and
Reece (1999) pointed out that the presentation of food is a key food attribute
in modeling dining satisfaction. Raajpoot (2002) also described food
presentation as one of the product/ service factors in the tangible quality scale.
2.1.4.2 Color
Of all the visual aspects, the effect of color is the most obvious and well-
studied (Imran, 1999). Extensive research has confirmed the importance of
color in taste recognition and intensity in flavor detection and recognition
(Johnson & Clydesdale, 1982), in food preference (DuBose, Cardelo, &
Maller, 1980; Christensen, 1983) and food acceptability (Johnson and
Clydesdale, 1982). Imran (1999) concluded that appearance encompasses
several basic sensory attributes such as color, opacity, glosses, visual

Factors of Influencing Customer’s Return Patronage in Café in Klang Valley
Page 25 of 145
structure, visual texture and perceived flavor. Colors of the food often trigger
the mind to expect particular flavor such as pink is related with strawberry
flavor (McWilliams, 1993). It has been well established that color and
appearance can have a halo effect which modifies subsequent flavor
perception and food acceptability (Hutchings, 1994). Consumer perception of
an acceptable color has been shown to be associated with other quality
attributes; flavor, nutrition and level of satisfaction (Christensen, 1983).
2.1.4.3 Freshness
Freshness of the ingredient was among the important aspect of product
quality, particularly in quick service restaurant found in the study by Reich,
McCleary, Tepanon, and Weave (2005). Reich et al. (2005) also stated that the
reason why consumers felt ‘freshness’ and ‘taste of food’ are important was
because of the increasing awareness of obesity problem. Taste is a key
attribute in food that influences restaurant customer satisfaction and future
behavior intentions (Kivela et al., 1999).
In addition, freshness of food is important because it affects consumer’ overall
satisfaction (Bernhardt, Donthu, & Kennett, 2000) and intention to purchase
(Boer, 2004). Studies done by Meyer and Conklin (1998); Woo, Ng, & Kim,
(2008) and Deshpande, Basil, and Basil, (2009) revealed that, taste of food,
cost, nutrition and convenience are some of the factors predicted for food
selection among adults.
Healthy options refer to nutritious and healthy food offerings. According to
Johns and Tyas (1996), healthy food could have a significant effect on the
customers’ perceived evaluation of the café experience. The notable thing is
that many restaurant customers are interested in their health, so the availability
Factors of Influencing Customer’s Return Patronage in Café in Klang Valley
Page 26 of 145
of nutritious food items has become increasingly important as one of the core
properties of dining satisfaction (Sulek & Hensley, 2004).
2.1.5 Environment
Bitner (1992) has stated that the term ‘servicescape’ is to emphasize the
impact of a physical setting in which a marketplace exchange takes place
within a service organization (Zeithaml et al., 2009) According to Dittmer
(2002), restaurants are defined as a source that satisfies the human’s social
and biological needs; and they can be split into two forms, those which serves
the human’s social needs (the dining market) and those which serves the
human’s biological needs (the eating market). Guests usually evaluate their
personal experiences towards the service quality of the restaurants they had
dined in by using the food selections, physical surroundings and employee
attitudes as the crucial elements (Chow, Lau, Lo, Sha & Yun, 2007; Namkung
and Jang, 2008). The customer revisit intention and a restaurant’s brand
reputation can be significantly influenced by elements of a physical settings,
such as facility aesthetics, ambience, lighting, table arrangements, layouts and
service staffs (Gagić, Tešanović, & Jovičić, 2013).
Based on Finkelstein (1989). restaurant’s features are supposely to be
perceived and evaluated within the context in which they are experienced by
the customers, as their dining needs are often connected to the restaurant’s
features. The physical setting has became a significantly important tool in
transmissing the quality of service setting, as physical settings can either
intensify or subdue the emotions of customers who are involved in patronizing
the hospitality service institutions. On the side note, Bitner (1992) has
developed a servicescape framework that possesses physical, social and
natural stimuli. This framework includes the physical aspect that can be

Factors of Influencing Customer’s Return Patronage in Café in Klang Valley
Page 27 of 145
further divided into ambient conditions; space and signs, symbols and
artifacts.
Table 2.1: Components of Environmental Dimensions
Category FeaturesAmbient Conditions Temperature
Air Quality
Noise
Music
Odor
Space / Function Layout
Equipment
Furnishings
Signs, Symbols and
Artifacts
Signage
Artifacts
Style of décor
Source: Bitner (1992) Servicescapes: The impact of physical surroundings on
customers and employees. Journal of Marketing, 56(2), 57-71.
2.1.5.1 Ambient Conditions
Ambient conditions include background environmental stimuli that affect the
human sensations (Grayson and McNeil, 2009; Kotler, 1973; Turley and
Milliman, 2000). According to Dijkstra, Pieterse, and Pruyn (2008), the visual
stimuli comprises of lighting, colors, brightness and shapes; Mattila and Wirtz
(2001) stated that the aesthetic cleanliness stimuli includes the scent, air
quality and fragrance. Reimer and Kuehn (2005) shows that temperature is
listed under the ambient stimuli; and based on Morin, Dube, & Chebat (2007),
as well as Oakes and North (2008), the auditory stimuli includes of music and
noise elements. Based on Aubert-Gatmet and Cova (1999), the ambience

Factors of Influencing Customer’s Return Patronage in Café in Klang Valley
Page 28 of 145
conditions are considered to be significant elements in customer assessment
on the quality level of the service they received from, eventually affecting the
customer satisfaction. Furthermore, the ambience conditions may affect the
customers’ emotional state; thus they may have significant effects on
customers’ behavioral responses and rate of patronage. According to
Holbrook and Hirschman (1982), customers that are dining in cafés would be
affected by hearing, smelling, visual and sensory information from the
environment. Also, these non-verbal inputs of information would further
trigger consumptions. Furthermore, arousing surroundings are those that are
complex, providing intensified amount of information to all the human senses
simultaneously (Mehrabian and Russell, 1974). In addition, Baker et al.
(2002) states that customers would reduce the psychological cost, time spent,
and wished to further increase their patronage when they prefer the consumer
environment they are at. On the other hand, North and Hargreaves (1996)
discovered that the ‘liked’ music has positive relationship with patrons’
willingness to return to a dining area. Also, it is more likely to enhance the
effects of pleasure when the environment is comprised with arousal-evoking
qualities. This finding is supported by Kim and Moon (2009), which states
that customers’ pleasure feeling emotions are positively related to their return
patronage intentions.
The researchers in this research will adopt the definition of ambient condition
stated by North and Hargreaves (1998), that different musical conditions
influenced subjects' perceptions about the cafeteria.
2.1.5.2 Space / Function
Space refers to the manner in which furnishings and their arrangements, also
includes the lesser observable furnishings of comfort, layout and accessibility
(Bloch, 1995; Wakefield and Blodgett, 1996); and these space elements

Factors of Influencing Customer’s Return Patronage in Café in Klang Valley
Page 29 of 145
influence customers’ approach/ avoidance decisions. Hence, this indirectly
influences customers’ return patronage. Features such as layout, interior
design and decoration, lighting, background music, scent and hygiene are
listed as the physical environment (Wakefield and Baker, 1998). According to
Bitner (1992), physical settings has weighted heavily in forming expectations,
distinguishing service firms, facilitating customers and employee-customer
goals; and further influencing the nature of customer experience. Also, Bitner
(1992) stated that the physical environment of service firms can be
manipulated through moving things, distancing things, increasing or
demolishing the environment and physical environment. The degree of arousal
or anticipation experienced by the customers during their consumption of
leisure services may be a significant determinant of their upcoming pleasure
or satisfaction with the service experience, thus affecting the return patronage
rate (Mano and Oliver, 1993; Russell and Pratt, 1980).
The researchers will adopt from the definition from Belk (1975) in this
research, where as it is stated that the physical environment is consisting of
observable features of the situation such as geographical location, setting,
sound, odor, light and temperature.
2.1.6 Return Patronage
Starting from the basic form of customer patronizing, Chetthamrongchai and
Davies (2000) mentioned that patronage is whether the respondents did visit
or shop at a particular store or spend money at/in the store, or another
situation where respondents did not visit or spend money. In addition, Baker,
Parasuraman, Grewal, and Voss (2002) included patronage intentions like
willingness to recommend, or buy, and shopping methods. Generally,
according to Srivastava and Natu (2014), they stated that store patronage does
not have a solid definition despite it has been research for many times.
Factors of Influencing Customer’s Return Patronage in Café in Klang Valley
Page 30 of 145
However, in this study only focuses on return patronage which is different
from patronage.
Blodgett (1994) defined the return patronage as willingness of consumers to
visit, shop, and patron to the specific retail store in future time. Hellier,
Geursen, Carr, and Rickard (2003) supported it by defining repurchase
intention as the individual’s decision on repeat purchasing a particular service
from the same organization or company with condition of considering his/her
current situation and likely circumstances. Other than that, Hume, Mort, and
Winzar (2007) said that repatronge is the decision of the customer to engage
with service provider in future continually. Alternatively, repatronage
intention defined as the business relationship to be maintained between the
current goods and services providers and consumer with his/her own
willingness or intention (Jariyagodchakorn, Panichpathom, Ngarmyam,
Sriboonjit, & Metapirak, 2013). Whereas, Li, An, and Yang (2008) mentioned
that consumer repurchase behavior can be indicated by the repatronage
intention. Furthermore, there are other research that links behavioral
intentions and re-patronage intentions. Using the Mehrabian-Russell’s
framework, there are previous studies done by Baker et al. (2002); Hightower,
Brady and Baker (2002); Macintosh and Lockshin (1997) has integrated
behavioral intention like willingness to recommend, repurchase, purchase
more in future. While Evanschitzky, Iyer, Plassmann, Niessing, and Meffert
(2006) claimed that repurchase intention become a significant part of
behavioral or attitudinal constructs, then Ryu, Han & Jang (2010) described
that behavioral intention is the willingness conveyed to commit into repeat
patronage to preferred restaurant and provide good comments regarding the
restaurant to social influence, like family or friends in future. Moreover, from
the studies in Han and Ryu (2006); Han and Kim (2009); Jani and Han (2011),
re-patronage/repatronage intention is referred many times in literature as an
important behavioral intention.
Factors of Influencing Customer’s Return Patronage in Café in Klang Valley
Page 31 of 145
However, there are positive relationship between customer satisfaction and
repatronage intention. Kivela et al. (1999) mentioned that the return patronage
or repeat purchase is the result of a customer satisfaction which may lead to
customer to make decision on returning to store/brand/restaurant. According
to Liao and Liaw (2002), they mentioned that customer satisfaction still yet
lack of all agreed-upon definition. However, customer satisfaction is defined
as an individual’s positive or negative feelings are consequence from the
comparison between the product performance and his/her expectation (Kotler,
2003). While Ryu and Han (2010) found out that customer satisfaction is a
significant factor for behavioral intention which may generate repeat sales,
repeat purchase or return patronage. Han and Ryu (2006), in previous study in
upscale restaurant, they found out that in order to increase customer
repatronage and generate recommendation intention (word-of-mouth), it is
essential to increase customer satisfaction. Additionally, Namkung and Jang
(2007) studied on mid-to-upscale restaurant, as consistent with Han and Ryu
(2006), they found that there is positive relationship between the customer
satisfaction and behavioral intention.
In addition, other researchers mentioned that there is positive linkage between
customer loyalty and return patronize. Marinkovic, Senic, Ivkov, Dimitrovski,
& Bjelic (2013) mentioned that repatronage intention is one of the key factors
of loyalty. Oliver (1999) defined loyalty as a strong commitment to
repurchase or repatronize/re-patronize a favored goods or services in the
future time in spite of there is situation changes and marketing efforts. This is
supported by East, Gendall, Hammond, and Lomax (2005), they mentioned
that the repeat patronage or re-patronage/ repatronage lengthens the concept of
patronage that predicts loyalty outcomes; and loyalty and favorite attitude will
be developed due to the constant return patronage or repurchase in a
store/brand (Han & Ryu, 2009). Whereby, Chaudhuri, and Holbrook (2001)
stated that more purchase and attitudinal loyalty will be elicited by a brand
that making consumers “happy”, “joyful” or “affectionate”.

Factors of Influencing Customer’s Return Patronage in Café in Klang Valley
Page 32 of 145
In conclusion, in this study, the researchers would adopt the definition from
Ryu et al. (2010) that more likely related to the study, which is the willingness
conveyed to commit into repeat patronage to preferred restaurant and provide
good comments regarding the restaurant to social influence, like family or
friends in future. The return patronage, which also known as repatronage/ re-
patronage or repeat patronage, is a behavioral intention and set as the
dependent variable (DV) in this whole study. It is set as an important variable
because organization, company or restaurants able to understand more about
what indicators influence and how they influence on customers satisfaction
that eventually lead to customers’ repatronage intention. However, the
customer experience may be different each time they repatronize to the
particular restaurant which eventually it may affects the customer repatronage
intentions (Yap & Kew, 2007). Thus, organization, company or restaurants
have to maintain the goods’ or services’ quality on above average in order to
influence on customers’ decision on repatronage. Subsequently, due to strong
intention of repeating patronization, recommending, spending more,
repurchasing, customer loyalty is more likely to be formed (Getty &
Thompson, 1994). Customers who revisit or repatronize to the restaurant are
representing the significant source of making continuing profitability
(Chaudhry, 2007; Marinkovic et al., 2014; Ribbink, Van Riel, Liljander, &
Streukens, 2004).
Factors of Influencing Customer’s Return Patronage in Café in Klang Valley
Page 33 of 145
2.2 Review of Relevant Theoretical Model
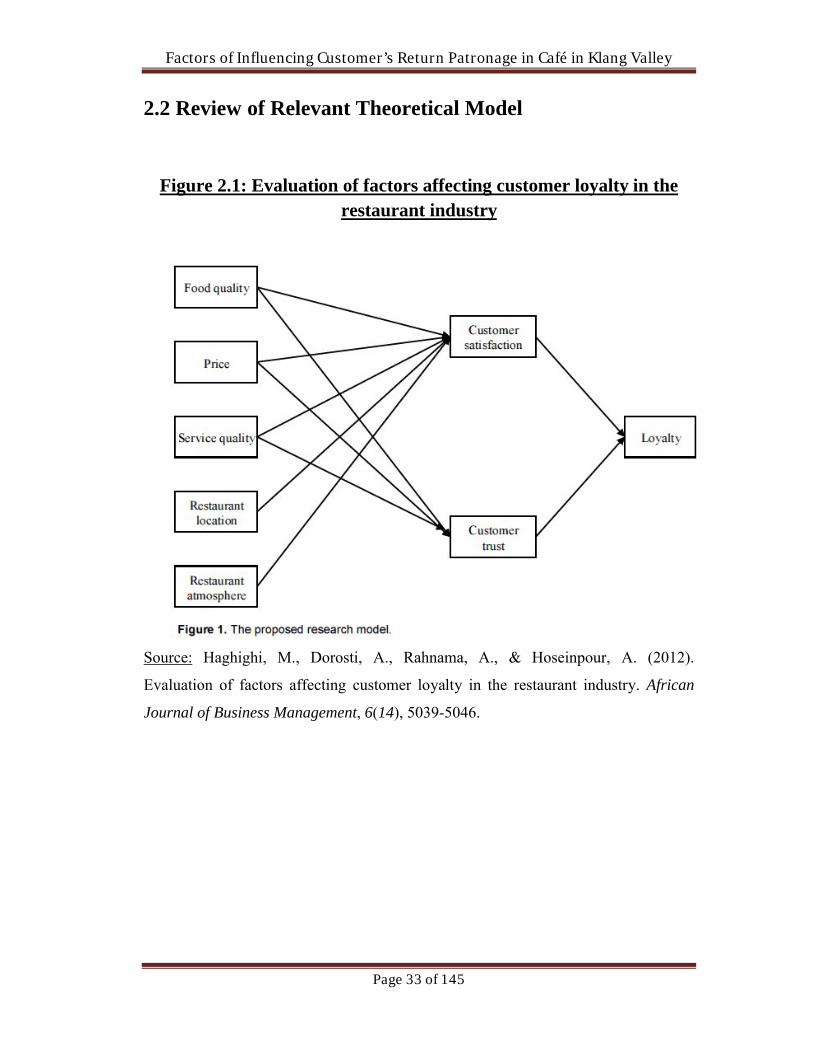
Figure 2.1: Evaluation of factors affecting customer loyalty in the restaurant industry
Source: Haghighi, M., Dorosti, A., Rahnama, A., & Hoseinpour, A. (2012).
Evaluation of factors affecting customer loyalty in the restaurant industry. African
Journal of Business Management, 6(14), 5039-5046.

Factors of Influencing Customer’s Return Patronage in Café in Klang Valley
Page 34 of 145
Figure 2.1 is the framework model proposed by Haghighi, Dorosti, Rahnama and
Hoseinpour (2012) for their study which included the factors of food quality, price,
service quality restaurant location and restaurant atmosphere as their independent
variables (IVs). There are intermediary variables included in their study such as
customer satisfaction and customer trust whereby the loyalty is worked as the
dependent variable (DV). They found out there are positive relationships between the
independent variables (food quality, price, service quality, restaurant location and
restaurant atmosphere) and two intermediary variables (customer satisfaction and
customer trust). By looking at the result from the two intermediary variables, they
discovered there is positive relationship between the customer satisfaction and
loyalty. However, they found that there is negative relationship between customer
trust and loyalty.
Factors of Influencing Customer’s Return Patronage in Café in Klang Valley
Page 35 of 145
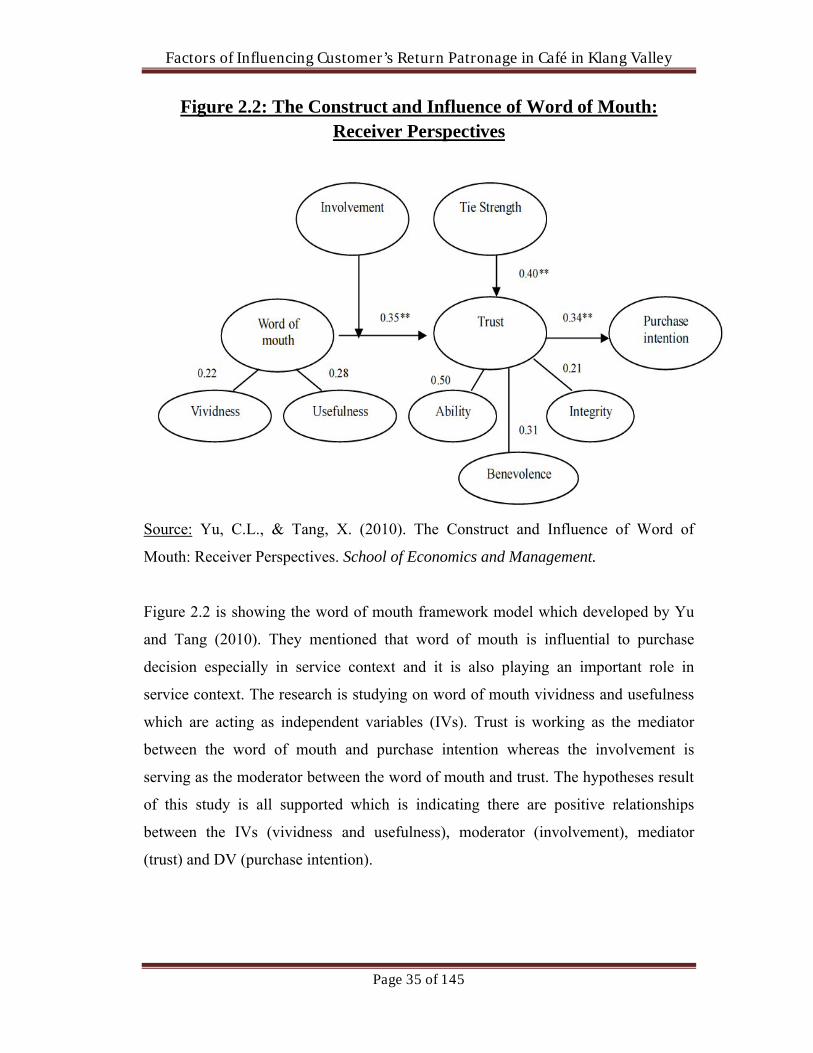
Figure 2.2: The Construct and Influence of Word of Mouth: Receiver Perspectives
Source: Yu, C.L., & Tang, X. (2010). The Construct and Influence of Word of
Mouth: Receiver Perspectives. School of Economics and Management.
Figure 2.2 is showing the word of mouth framework model which developed by Yu
and Tang (2010). They mentioned that word of mouth is influential to purchase
decision especially in service context and it is also playing an important role in
service context. The research is studying on word of mouth vividness and usefulness
which are acting as independent variables (IVs). Trust is working as the mediator
between the word of mouth and purchase intention whereas the involvement is
serving as the moderator between the word of mouth and trust. The hypotheses result
of this study is all supported which is indicating there are positive relationships
between the IVs (vividness and usefulness), moderator (involvement), mediator
(trust) and DV (purchase intention).

Factors of Influencing Customer’s Return Patronage in Café in Klang Valley
Page 36 of 145
Figure 2.3: Service Quality and Customer Satisfaction: Antecedents
of Customer’s Repatronage Intention
Source: Yap, S. F., & Kew, M. L. (2007). Service quality and customer satisfaction:
antecedents of customer’s re-patronage intentions. Sunway Academic Journal, 4, 59-
73.
Figure 2.3 is the visualization of the theoretical framework that studies on antecedents
of customer’s re-patronage intentions which included service quality and customer
satisfaction in the context of restaurant industry in Malaysia. The research found out
that there are positive relationships between both service quality (H1) and customer
satisfaction (H2) towards the re-patronage intentions. Moreover, they also did
comparison between customer satisfaction and service quality on which is the
stronger predictor. The result is customer satisfaction is much stronger as a predictor
compared to service quality towards re-patronage intentions by using Multiple Linear
Regression analysis. This framework is helpful in terms of supporting restaurant’s
marketing strategies to retain customers by improving their service quality and
increasing customers’ satisfaction. Thus, restaurant may affect customer’s decision on
re-patronage intention to revisit the restaurant again which ultimately bring more
profits to restaurant.
Service Quality
Customer Satisfaction
Re-patronage Intentions
H1
H2
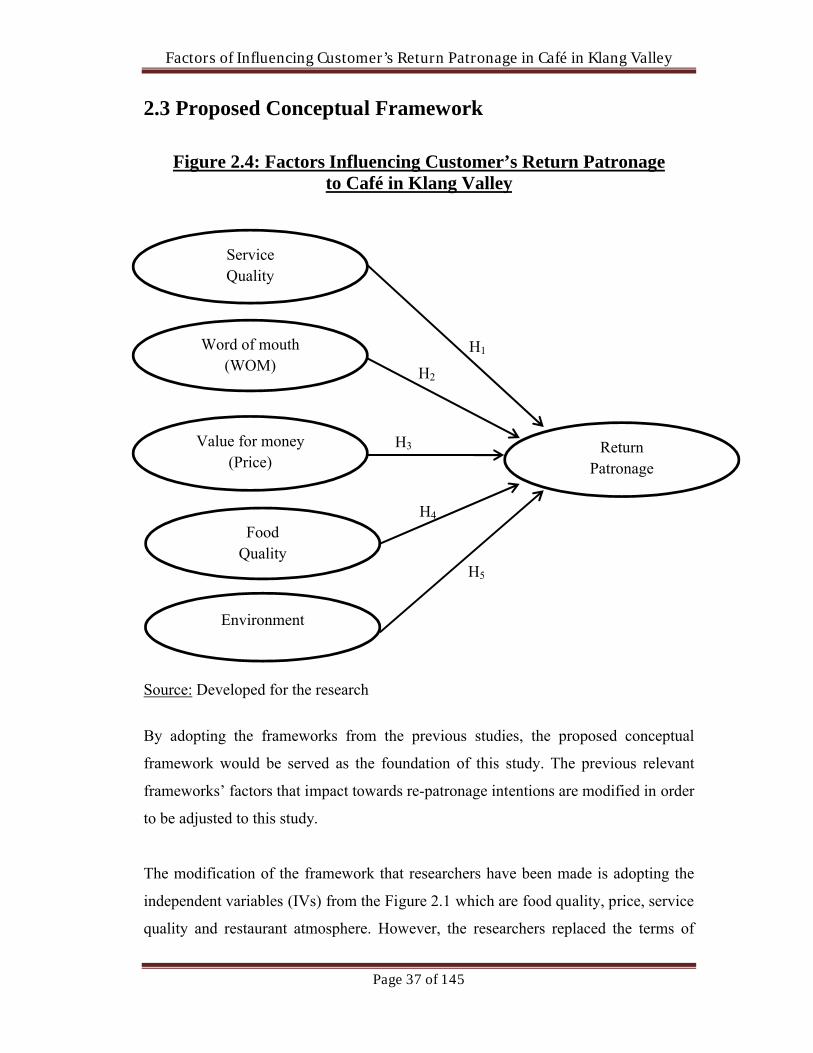
Factors of Influencing Customer’s Return Patronage in Café in Klang Valley
Page 37 of 145
2.3 Proposed Conceptual Framework
Figure 2.4: Factors Influencing Customer’s Return Patronage to Café in Klang Valley
Source: Developed for the research
By adopting the frameworks from the previous studies, the proposed conceptual
framework would be served as the foundation of this study. The previous relevant
frameworks’ factors that impact towards re-patronage intentions are modified in order
to be adjusted to this study.
The modification of the framework that researchers have been made is adopting the
independent variables (IVs) from the Figure 2.1 which are food quality, price, service
quality and restaurant atmosphere. However, the researchers replaced the terms of
Service Quality
Word of mouth (WOM)
Value for money (Price)
FoodQuality
Environment
ReturnPatronage
H1
H2
H3
H4
H5

Factors of Influencing Customer’s Return Patronage in Café in Klang Valley
Page 38 of 145
price and restaurant atmosphere as value for money and environment respectively.
The restaurant location is not adopted because of the context is different in Malaysia
compared to the study which is conducted in Tehran, Iran. Hence, it is not suitable to
be used as independent variable in this study, whereas it replaced by word of mouth
as it has great impact to purchase decision in service context. The Figure 2.2 is the
framework model that researchers adopted for word of mouth. Lastly, Figure 2.3 is
the adopted framework model that included re-patronage intention as the dependent
variables. Therefore, the researchers proposed the framework model as Figure 2.4
which included all the independent variables (IVs) like service quality, word of
mouth, value for money (price), food quality and environment that influence on the
dependent variable (DV), return patronage.
The aim of this study is to examining the relationships between the five (5) of the IVs
(service quality, word of mouth, value for money, food quality, and store
environment) with the DV (return patronage). Through this study, the researchers are
also able to find out which is the most and least important variable among all the
independent variables that ultimately influence the return patronage.
In this proposed framework, there are five (5) hypotheses proposed to test the
relationships between those variables in next section, Hypotheses Development.
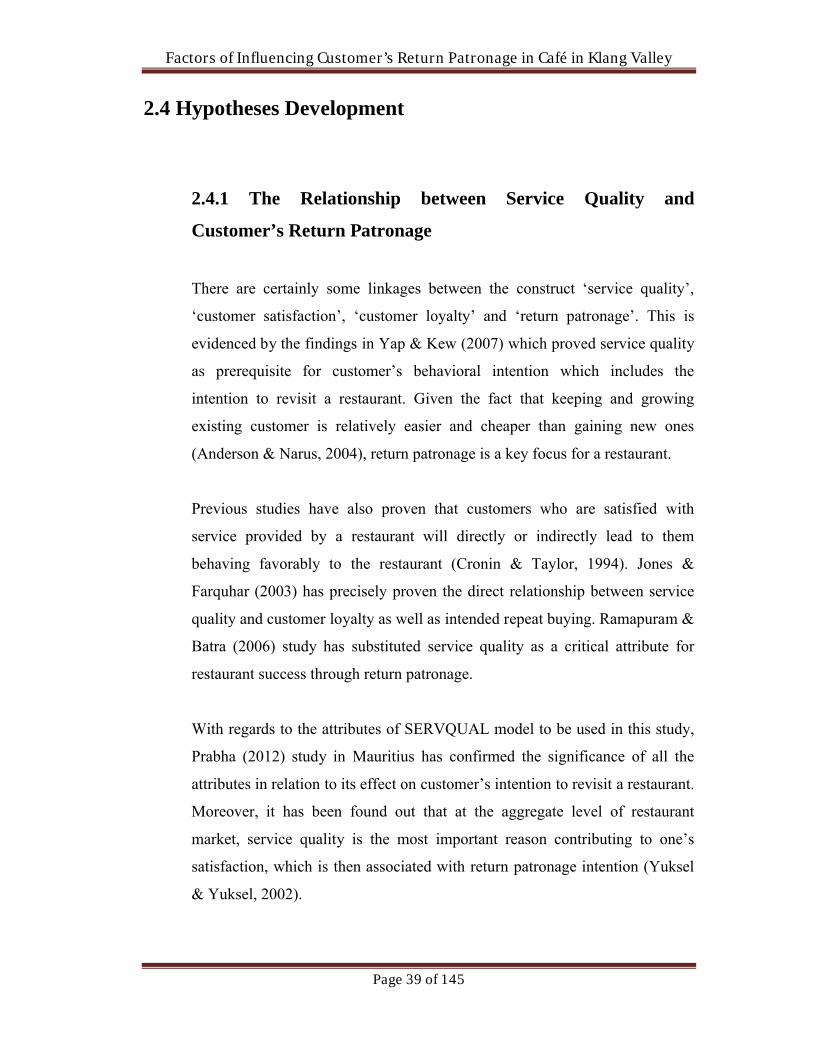
Factors of Influencing Customer’s Return Patronage in Café in Klang Valley
Page 39 of 145
2.4 Hypotheses Development
2.4.1 The Relationship between Service Quality and
Customer’s Return Patronage
There are certainly some linkages between the construct ‘service quality’,
‘customer satisfaction’, ‘customer loyalty’ and ‘return patronage’. This is
evidenced by the findings in Yap & Kew (2007) which proved service quality
as prerequisite for customer’s behavioral intention which includes the
intention to revisit a restaurant. Given the fact that keeping and growing
existing customer is relatively easier and cheaper than gaining new ones
(Anderson & Narus, 2004), return patronage is a key focus for a restaurant.
Previous studies have also proven that customers who are satisfied with
service provided by a restaurant will directly or indirectly lead to them
behaving favorably to the restaurant (Cronin & Taylor, 1994). Jones &
Farquhar (2003) has precisely proven the direct relationship between service
quality and customer loyalty as well as intended repeat buying. Ramapuram &
Batra (2006) study has substituted service quality as a critical attribute for
restaurant success through return patronage.
With regards to the attributes of SERVQUAL model to be used in this study,
Prabha (2012) study in Mauritius has confirmed the significance of all the
attributes in relation to its effect on customer’s intention to revisit a restaurant.
Moreover, it has been found out that at the aggregate level of restaurant
market, service quality is the most important reason contributing to one’s
satisfaction, which is then associated with return patronage intention (Yuksel
& Yuksel, 2002).
Factors of Influencing Customer’s Return Patronage in Café in Klang Valley
Page 40 of 145
On the contrary, past research studies have also proven that there are
possibilities where the relationship between service quality and customer
satisfaction is not significant. Gagic, Tesanovic & Jovicic (2013) termed the
relationship between perceived service quality and behavioral intention which
is subsequent visit as insignificant. Based on research work of Ismail,
Ridzuan, Rose, Abdullah, Rahman & Francis (2013), other than
responsiveness and assurance dimension of SERVQUAL model, all the three
dimensions including tangibility, reliability and empathy implies insignificant
results.
Hence, the hypotheses can be developed as follow:
H0: There is no significant relationship between service quality and
customer’s return patronage to café in Klang Valley.
H1: There is a significant relationship between service quality and customer’s
return patronage to café in Klang Valley.
2.4.2 The Relationship between Word of Mouth and
Customer’s Return Patronage
The relationship between word of mouth and return patronage is well
established in the consumer behavior context. Loyal customers who are repeat
customers have the tendency to spread positive word of mouth about the
restaurant (Lewis & McCann, 2004), while on the other hand, receiving word
of mouth recommendation or comments encourage the behavior of return
patronage. It is also proven that word of mouth is an effective marketing tool
in assisting the boosting of marketing variables including customer’s attitude
towards company, brand loyalty and subsequent return patronage behavior
(Ryu & Feick, 2007).

Factors of Influencing Customer’s Return Patronage in Café in Klang Valley
Page 41 of 145
Susskind & Viccari (2011) stated that customer’s commitment with the
business entity can be affective commitment, which is important in securing
return patronage. As word of mouth is transmitted interpersonally with
emotional expression (Arndt, 1967), it becomes the building block for
affective commitment that causes return patronage.
In contrast of the majority studies which show a significant linkage between
word of mouth and marketing variables such as customer’s satisfaction, brand
loyalty as well as return patronage intention, there are also instances where the
relationship is insignificant (Castaneda, Frias & Rodriguez, 2007). In addition,
there are studies showing negative relationship between the two variables
(Kuo, Hu & Yang, 2013).
Hence, the hypotheses can be developed as follow:
H0: There is no significant relationship between word of mouth and
customer’s return patronage to café in Klang Valley.
H2: There is a significant relationship between word of mouth and customer’s
return patronage to café in Klang Valley.
2.4.3 The Relationship between Value for money (Price) and
Customer’s Return Patronage.
In the past research, Yuksel and Yuksel (2002) claimed that price is one of the
influencers which impact on customers to visit the restaurants excluding the
good service, environment, quality service and food. In addition, Dodds et al.
(1991) defined the value of perception can be indirect influencer to customer’s
willingness to buy. This is showing that price is an important attribute that
affects towards customer’s return patronage as the value can be different
interpretation and meaning to different individuals (Yuksel & Yuksel, 2002).
Besides, Grace and O’Cass (2005) said that customer’s perceptions of
Factors of Influencing Customer’s Return Patronage in Café in Klang Valley
Page 42 of 145
perceived value for money that they have high satisfaction in previous
experience may lead their decision to repatronize to particular store.
Based on the study’s findings by Sweeney, Soutar, and Johnson (1997), they
found out that there is a significant relationship between the value for money
and customer’s willingness to buy an electrical appliance in the retail setting.
Furthermore, Yang and Chang (2011) found out there is positive effect of
value for money to customer satisfaction which acts as the mediation variable
towards the repatronage intentions. It concluded that value for money is
playing an important character in producing repatronage intentions for the
hypermarket in the study. Based on the previous study by Oh (1999), he found
out that perceived value has direct effect on repurchase intentions although
perceived price has negative influence on perceived value. Grace and O’Cass
(2005) remarked that value perceptions are also good predictors of purchase
intention. In their study, they discovered there is significant positive effect of
perceived value of money on repatronage intentions which is supported the
hypothesis.
However, there are some previous studies shown that value for money has
weak, moderate or no significant relationship with return patronage. The
previous study done by Yuksel and Yuksel (2002) found that there is
moderate relationship between value for money and dining satisfaction in
terms of atmosphere and service seekers. In addition, they found out that the
value for money of other clusters like adventurous food and healthy food
seekers do not have significant relationship with dining satisfaction. Butcher
et al. (2002) also stated that value for money should not be viewed as an
important criterion equally in different industry or services. They found out
that value for money does not have any positive effect on repurchase intention
for naturopathic. This is indicating there is no relationship between value for
money and repurchase intention in condition of naturopathic clinic.
Factors of Influencing Customer’s Return Patronage in Café in Klang Valley
Page 43 of 145
Hence, the hypotheses can be developed as follow:
H0: There is no significant relationship between value for money (price) and
customer’s return patronage to café in Klang Valley.
H3: There is significant relationship between value for money (price) and
customer’s return patronage to café in Klang Valley.
2.4.4 The Relationship between Food Quality and Customer’s
Return Patronage.
Food quality appeared to be the most important forecaster of customer
satisfaction by comparing to physical setting and service quality in restaurants
(Sulek & Hensley, 2004) According to Ha and Jang (2010), there has a
positive relationship exists between food quality and customers’ satisfaction.
This is supported by Bitner and Hubbert (1994); Churchill & Surprenant
(1982) (as cited in Lim, 2010), a review of the marketing literature expresses
that customer satisfaction and customer perceptions on food quality are
correlated. Therefore, food quality is one of the important core attributes that
influence restaurant customer satisfaction (Fornell, Johnson, Anderson, Cha,
& Bryant, 1996f). In fact, these have proved that the food quality has
significant relationship between food quality and customer satisfaction.
Furthermore, Shaharudin, Hassan, Mansor, Elias, Harun, and Aziz (2010)
found that freshness has become one significant determinant towards the
customer purchase intention because customers nowadays are always looking
for food that is served in a fresh manner which they believe is good for their
health, thus, the food must be served in a timely manner to ensure freshness. If
the customers have a good experience and satisfied with the restaurant, they
will continuously spread good and positive word of mouth to other potential
customers in order to stimulate their intention to revisit the fast food
restaurants. According to Kivela et al. (1999), food presentation is essential
Factors of Influencing Customer’s Return Patronage in Café in Klang Valley
Page 44 of 145
food attribute that modelling customer dining satisfaction. In fact, when the
food is well presented, this may make the customers having a good feelings
and moods to consume the foods in the particular fast food restaurant they
visit. Consequently, this will help to create the good relationship and
emotional attachment between customers and the fast food server. Besides
that, based on the research done by Namkung and Jang (2007), food
presentation has significant relationship with the customer’s satisfaction.
On the contrary, the food quality at café might not be significantly affecting
customer’s return patronage to café. This statement was supported by a
research by Boo (2011), stated that food quality is less important and not
significant (at 0.05 level) at influencing the customer’s loyalty.
Hence, the hypotheses can be developed as follow:
H0: There is no significant relationship between food quality and customer’s
return patronage to café in Klang Valley.
H4: There is a significant relationship between food quality and customer’s
return patronage to café in Klang Valley.
2.4.5 The Relationship between Environment and Customer’s
Return Patronage.
Restaurant environment can create image and influence customer level of
satisfaction especially in restaurant industry (Hui, Dube, & Chebat, 1997;
Raajpoot, 2002; Robson, 1999). Although food and service quality are
important, pleasing restaurant environment will also determine to a high
degree of overall customer satisfaction in restaurant industry (Ryu et al.,
2010). Many empirical studies have shown how environment influence
customer satisfaction and predicts repurchase behavior (Hui et al., 1997;
Knutson & Patton, 1993; Mattila et al., 2001; Wakefield & Blodgett, 1994).

Factors of Influencing Customer’s Return Patronage in Café in Klang Valley
Page 45 of 145
Additionally, Brady and Cronin (2001) stated that environment can have a
significant impact on perception of overall quality, which turn to affect
customer satisfaction towards a particular restaurant. Another studies by Han
et al. (2009) found that environment of a particular restaurant will influence
customer satisfaction and loyalty.
In fast food industry, a pleasing atmosphere will even contribute a higher level
of overall customer satisfaction (Lim, 2010). Besides, there are also other
research suggest that there is a direct link between environment and customer
satisfaction in fast food restaurant (Chang, 2000; Chebat and Michon, 2003).
For example, Wakefield et al. (1996) study shows that facility aesthetics,
seating comfort and cleanliness of a restaurant significantly affect a
customer’s satisfaction. In addition, Chang (2000) also mentioned
environment of a fast food restaurant is a direct indicator of a customer’s
satisfaction. Furthermore, there are a lot of studies found that cleanliness is a
significant factor in customer evaluation of restaurant ambience, and it will
affect the customer satisfaction (Barber & Scarcelli, 2009; Liu & Jang, 2009;
Threevitaya, 2003; Aksoydan, 2007). Besides, Mattila et al. (2001) study
shows that increasing ambience by scent can improve evaluations of a store
and create higher satisfaction levels.
However, café environment might not be significantly influencing customer’s
return patronage to café. This was supported by a research conducted by John,
Adiele, and Nkoro, (2013), stated that signs, symbols are not useful for
employee skills coordination in terms of patronage; thus, this association is
not significant for customer’s return patronage.
Hence, the hypotheses can be developed as follow:
H0: There is no significant relationship between environment and customer’s
return patronage to café in Klang Valley.
Factors of Influencing Customer’s Return Patronage in Café in Klang Valley
Page 46 of 145
H5: There is a significant relationship between environment and customer’s
return patronage to café in Klang Valley.
2.5 Conclusion
In conclusion, this chapter has explained in detailed how each of the variables being
formed by using the relevant and past researches. The literature reviews have covered
on all IVs (service quality, word of mouth, value for money, food quality and store
environment) that influences on the DV, return patronage of customer.
In this study, the relevant theoretical models are being used as the foundation for
constructing this research’s proposed conceptual framework. The proposed
conceptual framework and five (5) research hypotheses that carried out in this
particular chapter will be preceded in Chapter 3. The following chapter is explaining
the methodology of this research, such as research design, data collection, sampling
design, research instrument, measurement scales and data analysis.

Factors of Influencing Customer’s Return Patronage in Café in Klang Valley
Page 47 of 145
CHAPTER 3: RESEARCH METHODOLOGY
3.0 Introduction
Chapter 3 specifies and describes the entire method and process used
in systematically collecting data as input for the research study. It
begins with explaining the chosen research design, followed by data
collection method used, sampling design which covers all the elements
used in sampling. Next, research instruments and constructs
management will be included in detail. Lastly, the chapter states the
data processing and analysis before closing the chapter with a chapter
conclusion.
3.1 Research Design
In essence, research design is the master plan that covers the steps
from collecting, measuring and analyzing data (Zikmund, Babin &
Carr, 2010). As Hussey and Hussey (1997) stated, it is the key for the
entire research process, beginning from the development of theoretical
foundation, to the data collection and analysis. Besides, Saunders,
Lewis and Thornhill (2009) describes the functions of the research
design as helping researchers to make reliable decision regarding the
research methodology, to better carry out the research in the face of
limitations and constraints, as well as to identify the most appropriate
research method for the respective study.
In the current study, quantitative research is used. Quantitative
research focuses on acquiring numerical data and is able to minimize
human influences (Hussey & Hussey, 1997). According to Zikmund et

Factors of Influencing Customer’s Return Patronage in Café in Klang Valley
Page 48 of 145
al. (2010), it will quantify the frequency or response occurrence. The
quantitative data will be analyzed statistically to form relationships
between the variables (Saunders et. al, 2009).
The chosen research design is descriptive design. According to
Zikmund et al. (2010), it portrays a description about the
characteristics of certain phenomenon, be it people, object,
organization or environment. Prior to that, understanding of the
phenomenon nature is needed. The results of a descriptive study can be
workable in managerial context (Zikmund et al., 2010). Given the fact
that survey permits larger amount of data collected and tends to ask
descriptive questions, it is common in facilitating a descriptive
research (Saunders et al., 2009). In this current study, it will portray a
profile regarding the factors that cause customer’s return patronage in
café in Klang Valley.
3.2 Data Collection Methods
This section describes the approaches used in collection of data from
the target population. It aims to provide answers for the stated research
hypotheses and questions. The methods identified will ensure high
validity of the research studies. Two types of data are being used as
below.
3.2.1 Primary Data
Collection of primary data can be done by survey
questionnaires, observations, interview and experiments.
Questionnaire methods include self-administered in which

Factors of Influencing Customer’s Return Patronage in Café in Klang Valley
Page 49 of 145
respondents complete questionnaires themselves and
interviewer-administered questionnaires in which interviewer
records the responses (Saunders et al., 2009). Self-administered
questionnaires are used to collect primary data in the study.
Under self-administered approach, Internet and Intranet-
mediated questionnaires as well as delivery and collection
questionnaires will both be used to facilitate effective and
quicker data collection. Survey questionnaires will only be
directed to café patrons who have revisited a particular café.
3.2.2 Secondary Data
Zikmund et al. (2010) states that secondary data are data
collected and analyzed by previous researchers. Sources of
secondary data include journals and articles which can be
accessed via databases as well as topic-related or research-
related textbooks. Common databases that provide valid
materials include Emerald, Sage and more. Acquiring
secondary data is relatively easy, cheaper and quicker than
getting primary data, however, it may pose drawbacks
including affected accuracy, timing inappropriateness and data
inconsistency (Zikmund et al., 2010).
3.3 Sampling Design
According to Saunders et al. (2009), only data collected from subgroup
of the entire population will be considered and it is representative of
all the elements. Zikmund et al. (2010) mentioned that information
obtained from sampling can be reasonably accurate and even possibly
Factors of Influencing Customer’s Return Patronage in Café in Klang Valley
Page 50 of 145
more accurate than investigating all the elements in the total
population.
3.3.1 Target Population
Target respondents for the survey questionnaires include males
and females who have visited the same café at least once. The
target population consists of different races. They will be
approached in the cafes in Klang Valley or via online
distributed questionnaires after confirmation that they have
revisited the same café.
3.3.2 Sampling Frame and Sampling Location
Zikmund et al. (2010) defined sampling frame as a list of
elements from which a sample may be drawn. Besides using
online method, target population of 200 respondents will be
reached in cafes in Klang Valley. Lists of cafes include Coffee
Stain by Joseph, Feeka, Pickle & Fig, The Grumpy Cyclist,
Fahrenheit600 and many more. The cafes are selected based on
the crowd in the café and the location’s ease availability as
convenience sampling technique is used. The sampling location
is restricted to Klang Valley cafes. Questionnaires will be
distributed randomly to the sizable population.
3.3.3 Sampling Elements
The respondents are patrons of selected cafés in Klang Valley
who have at least visited the same café once. The rationale is

Factors of Influencing Customer’s Return Patronage in Café in Klang Valley
Page 51 of 145
that they are the most qualified individuals for the current study
as after the first visit, there are definitely some reasons that will
drive their decision to revisit the same café. Therefore, their
evaluation and responses are the closest to be representative of
the total population.
3.3.4 Sampling Technique
There are two sampling techniques, which are probability or
representative sampling and non-probability or judgemental
sampling (Saunders et al., 2009). According to Zikmund et al.
(2010), for probability sampling, every member of the
population has known probability of being selected, while for
non-probability sampling, sample will be selected based on
personal judgment or convenience.
Non-probability sampling is used in the current study. There
are four types of non-probability sampling methods, which
include convenience, judgment, snowball and quota (Zikmund
et al., 2010). Convenience sampling is chosen and is defined by
Zikmund et al. (2010) as getting respondents who are most
conveniently and readily available. The questionnaires will be
given to individuals who are qualified for the survey once they
are met. The sample is selected until it reaches the required
sample size. It is used widely as it saves time and budget
(Saunders et al., 2009).

Factors of Influencing Customer’s Return Patronage in Café in Klang Valley
Page 52 of 145
3.3.5 Sampling Size
As it is statistically proven that sample size of 30 or more can
lead to distribution mean that is close to normal distribution
(Saunders et al., 2009), rule of thumb in deciding the sample
size will be ranging from 30 to 500. Reasons being include
assurance of benefiting from central limit theorem and sample
error with low standard deviation. Thus, in the current study,
taking into consideration the available time, a total of 200
questionnaires are being distributed, in which 134 of them via
online and 66 of them via face-to face method to at least
maximize the research validity. 193 questionnaires were then
collected, with 186 of them valid.
3.4 Research Instrument
Self-administered questionnaire is employed in the research study
which eliminates the use of interviewers which is usually more costly.
The process is done in the form of Internet-mediated questionnaire,
where respondents answer electronically and delivery and collection
method, where it is delivered face to face and collected afterwards
(Saunders et al., 2009). The chances for biasness, such as respondents’
tendency to please the interviewer or researcher are reduced in this
method.
Factors of Influencing Customer’s Return Patronage in Café in Klang Valley
Page 53 of 145
3.4.1 Questionnaire Design
Questions are being adapted from various journals and English
is the chosen medium so that more respondents can be reached.
Questionnaires are being designed with fixed-alternative
questions, which is the opposite of open-ended questions.
Standing from a respondent’s perspective, it is easier and less
time-consuming (Zikmund et al., 2010). Viewing from
interviewer’s viewpoint, it allows comparison of responses and
only minimal interviewer skill is needed.
As of layout, there are a total of three sections covered in the
questionnaire. (See Appendix B) Section A, the demographic
profile covers demographic profile of respondents, which
personal information such as age, gender, race, marital status
and monthly income will be asked. It also seeks to understand
information about respondent in the research context, which is
the number of visit to a café. Section A involves simple-
dichotomy, determinant-choice and frequency-determination
questions.
Section B covers all the independent variables and Section C
covers dependent variable to get respondent’s degree of
agreement and perceived importance on each variable,
including service quality, word of mouth, value for money
(price), food quality and return patronage. Likert scale is used
as it is very suitable in measuring attitude (Zikmund et al.,
2010).
Likert scale is applied in the questionnaire because it is useful
in measuring attitude (Zikmund et al., 2010), simple and

Factors of Influencing Customer’s Return Patronage in Café in Klang Valley
Page 54 of 145
versatile (Johns, 2010). Five-point Likert scale, being the most
common Likert scale number of point is chosen to be used in
the questionnaire. The rationale behind the choice is its ability
in balancing the goal of providing enough option and making
the questions manageable for respondents (Johns, 2010). It is
undeniable that respondents will find it difficult to differentiate
the scales if nine-point or eleven-point is being used. Also, data
will lack accuracy if the scale is any lesser than five.
3.4.2 Pilot Test
In order to administer the questionnaire to the respondents, it
should be pilot tested beforehand. It is done for questionnaire
refinement to ensure that it is clear and understandable as well
as for assessment on its validity and reliability (Saunders et al.,
2009). Duration used for the respondent to finish the
questionnaire, ambiguity concern, instruction clarity and
comments should all be taken into account during pilot test. A
total of 20 questionnaires were pilot tested with its reliability
tested with Cronbach’s alpha test. Questionnaire is given to
target respondents physically or via online, and it takes 3 days.
Using SPSS, any value that is larger than 0.6 shows that it is
acceptable in term of reliability.

Factors of Influencing Customer’s Return Patronage in Café in Klang Valley
Page 55 of 145
3.5 Constructs Management
3.5.1 Origins of Construct
The questionnaire items are adapted from numerous journals as
shown in Table 3.1.
Table 3.1 Origins of Constructs
Construct Source
Service Quality Tan, Oriade & Fallon (2014)
Word of Mouth Bansal & Voyer (2000)
Chang, Lee & Huang (2009)
Lin, Wu & Chen (2013)
Tag-Eldeen (2012)
Khalid, Ahmed & Ahmad (2013)
Value for Money
(Price)
Butcher, Sparks & O’Callaghan (2002)
Food Quality Canny (2013)
Hwang (2010)
Environment Kivela, John Reece & Inbakaran (1999)
Othman & Goodarzirah (2013)
Wilson (2003)
Return Patronage Ryu, Han & Jang (2012)
Ryu, Lee & Kim (2012)
Source: Developed for the research
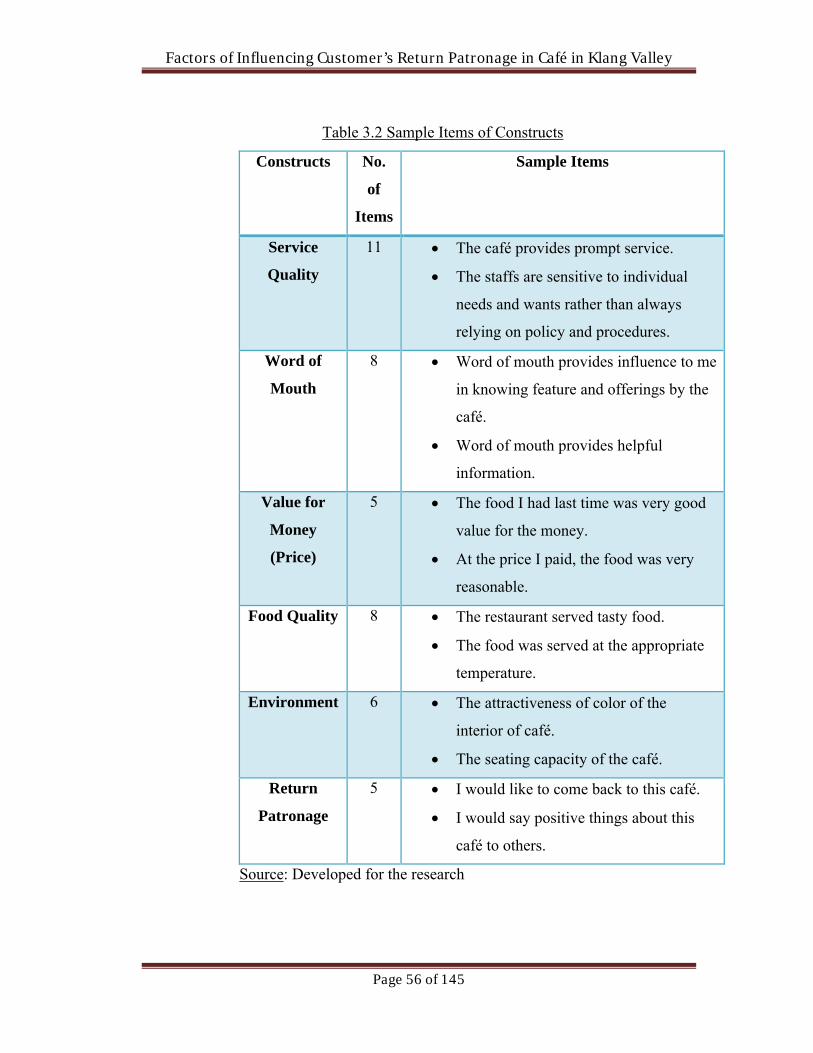
Factors of Influencing Customer’s Return Patronage in Café in Klang Valley
Page 56 of 145
Table 3.2 Sample Items of Constructs
Constructs No.
of
Items
Sample Items
Service
Quality
11 The café provides prompt service.
The staffs are sensitive to individual
needs and wants rather than always
relying on policy and procedures.
Word of
Mouth
8 Word of mouth provides influence to me
in knowing feature and offerings by the
café.
Word of mouth provides helpful
information.
Value for
Money
(Price)
5 The food I had last time was very good
value for the money.
At the price I paid, the food was very
reasonable.
Food Quality 8 The restaurant served tasty food.
The food was served at the appropriate
temperature.
Environment 6 The attractiveness of color of the
interior of café.
The seating capacity of the café.
Return
Patronage
5 I would like to come back to this café.
I would say positive things about this
café to others.
Source: Developed for the research
Factors of Influencing Customer’s Return Patronage in Café in Klang Valley
Page 57 of 145
3.5.2 Scale of Measurement
In the research context, there are four levels of scale of
measurement involved, which includes nominal, ordinal,
interval and ratio, in which the former two are categorized
under categorical data while the latter two are numerical data.
In the current study, nominal, ordinal and interval scales are
being employed in the questionnaire.
Hair et al. (2002) defined nominal scale as being used in
question which respondents will provide basic descriptor as
response. Being the most fundamental of measurement scales,
it serves as a means to identify or classify a response with the
value assigned by the respondent (Zikmund et al., 2010). For
instance, the gender question asking race of the respondent as
Malay, Chinese, Indian or others is using a nominal scale.
For ordinal scale, relative magnitude between options for the
answer can be measured (Hair et al., 2002). Comparing it with
nominal scale, it provides more precise information for the
researcher (Saunders et al., 2009). The scales are also known as
ranked data with ranking scales given. Monthly income asked
in the questionnaire well expresses the use of ordinal scale,
with the option of ‘less than RM800’, ‘RM801-RM1300’,
‘RM1301-RM1800’, ‘RM1801-RM2300’, ‘RM2301-
RM2800’, ‘RM2801-RM3300’ and ‘more than RM3300’.
Interval scale is said to incorporate the scale properties of
assignment, order and distance (Hair et al., 2002). It seeks to
capture information of the variation of concept in a

Factors of Influencing Customer’s Return Patronage in Café in Klang Valley
Page 58 of 145
respondent’s mind with its distance property. The section in
questionnaires that have employed 5-point Likert scale, ranging
from ‘Strongly Disagree’, ‘Agree’, ‘Neutral’, ‘Disagree’ to
‘Strongly Disagree’ is an interval scale to understand the extent
to which the respondent agrees with the items asked.
3.6 Data Processing
After collecting primary data, certain procedures have to be performed
before reaching the data analysis steps (Hair et al., 2002). The
processing procedure is also known as data preparation, which means
putting the raw data from questionnaires into valuable and meaningful
form that can be read by the computer software (Hair et al., 2002).
3.6.1 Checking
Malhotra (2008) stated that questionnaire checking is necessary
to confirm its completeness. The unprocessed data obtained are
also checked so that any detected mistake done by the
interviewer or the respondent will be edited in the subsequent
step in data editing (Hair et al., 2002). Data checking seeks to
discover illegible, incomplete, ambiguous and inconsistent
response so that unacceptable questionnaires will be removed
(Malhotra, 2008).

Factors of Influencing Customer’s Return Patronage in Café in Klang Valley
Page 59 of 145
3.6.2 Editing
The purpose of data editing is to correct any responses that are
unsatisfying discovered in the questionnaire checking section.
There are three ways to treat these identified responses: first,
the questionnaires can be returned back to the respondents for
more accurate or complete results; second, if it is impractical or
impossible, the researchers may fill up the unsatisfactory result
with missing values; and finally, the questionnaires may be
discarded (Malhotra, 2008).
3.6.3 Coding
Numerical codes will be assigned for all the data collected to
allow quicker and easier data entry with minimized error
(Saunders et al., 2009). The typical numbers used will be from
0 to 9 as it eases the input process to computer (Hair et al.,
2002). By doing so, it prevents unnecessary confusion which
may lead to mistake while keying data into the SPSS software.
This ensures accuracy and reliability of data entry.
3.6.4 Transcribing
Transcribing is the process to transfer coded data into computer
system (Malhotra, 2008). SPSS software will be applied in
transferring the coded and tabulated data to document that data
in database form. Transcribed data is ready for future analysis.

Factors of Influencing Customer’s Return Patronage in Café in Klang Valley
Page 60 of 145
3.7 Data Analysis
3.7.1 Descriptive Analysis
Data can be transformed into frequency distribution while it is
analyzed. When the information acquired is too much to
develop frequency distribution tables, the measures of central
tendency including mean, mode and median are in place to aid
the descriptive analysis task (Hair et al., 2002). These measures
state the location of the information which is in the center of
the distribution. Besides that, the measures of dispersion will
be another method which covers range and standard deviation.
According to Hair et al. (2002), it intends to calculate the
extent to which all the values differ from the measures of
central tendency. Other than that, skewness and kurtosis
indicate the shape of the distribution (Saunders et al., 2009). As
for the designed questionnaires, the general information and
demographic sections will be analyzed using frequency
distribution as they consist of nominal and ordinal scales. On
the other hand, measures of central tendency and measures of
dispersion are applied for the variables section.
3.7.2 Scale Measurement
According to Hair et al. (2002), reliability of scale shows the
extent to which same results can be produced repeatedly in
different conditions or time. In short, it measures consistency.

Factors of Influencing Customer’s Return Patronage in Café in Klang Valley
Page 61 of 145
In order to assess reliability, different methods can be adopted.
Test-retest is a technique that requires the same respondent to
answer the same questionnaires for the second time, however,
taking into consideration that it is not easy to be done, it is only
recommended as a supplementary approach (Saunders et al.,
2009).
Another method is to use internal consistency, which is the
approach to be used in this study for reliability test. To assess
whether the multi-item scales are internally consistent, the
widely used Cronbach’s alpha will average the possible split-
half coefficient (Hair et al., 2002). With possible outcomes
ranging from 0 to 1, coefficient value smaller than 0.6 indicates
low internal consistency. Thus, with the Cronbach’s alpha’s
rule of thumb in place, it is necessary for the alpha to exceed
0.6 to be at least satisfactory.
3.7.3 Inferential Analysis
3.7.3.1 Pearson’s Correlation Analysis
The correlation coefficient, denoted as r, is an indicator of the
strength of linear relationship between two variables. The
underlying meaning of the correlation coefficient is that, the
more correlated it is, the more likely a change in one variable
will be followed by changes in another variable (Saunders et
al., 2009). The two extreme values for correlation coefficient,
which are +1 and -1 indicate perfect positive relationship and
perfect negative relationship respectively. Value of 0 is an
indicator of perfect independence among two variables, as

Factors of Influencing Customer’s Return Patronage in Café in Klang Valley
Page 62 of 145
stated in Saunders et al. (2009). Rule of thumb for the strength
of relationship for this analysis is shown in Table 3.3. The
Pearson’s method shows strength, magnitude and direction of
the relationship simultaneously, giving meaning of the
relationship to enhance researcher’s findings. These results
serve as the reasons that Pearson’s Correlation Analysis is
used.
Table 3.3 Rule of Thumb for Strength of Association for
Correlation Coefficient
Coefficient Range Strength of Association
±0.91 to ±1.00 Very Strong
±0.71 to ±0.90 High
±0.41 to ±0.70 Moderate
±0.21 to ±0.40 Small but definite relationship
±0.00 to ±0.20 Slight, almost negligible
Adapted from: Hair, Jr., J. F., Money, A. H., Samouel, P., &
Page, M. (2007). Research methods for business. Chichester,
West Sussex: John Wiley & Sons Ltd.
3.7.3.2 Multiple Regression Analysis
The multiple linear regression involves quantifying a
coefficient of the equation which involves both independent
and dependent variables (Saunders et al., 2009). The
coefficient enables the researcher to understand the strength of
relationship between the dependent variable and two or more
independent variables which are both numerical. The value
obtained indicates the extent to which the variation of
dependent variable can be statistically explained by the
Factors of Influencing Customer’s Return Patronage in Café in Klang Valley
Page 63 of 145
independent ones (Saunders et al., 2009). The underlying
assumption for this analysis is the relationship between
dependent variable and independent variables is linear. The
general equation for multiple regression analysis is as follow:
Y = a + bX1 + bX2 + … + bXn
Where Y = dependent variable
X = independent variable
a = regression constant
b = beta coefficients
The equation for the current study will be substituted by
dependent variable which is customer’s return patronage to
café and dependent variables which are service quality, word of
mouth, food quality, price and environment. Using multiple
regression analysis is important as it enables researcher to
understand the most significant independent variable that
causes customer’s return patronage to café in Klang Valley.
3.8 Conclusion
The chapter has given an overview on the methodology in which
research design is determined, data collection methods are introduced
and sampling components are explained. It includes the questionnaire
development, distribution, collection, checking, editing, coding and
transcribing. Then, research instrument and construct management is
listed which indicates the sources where questionnaires are adopted as
well as adapted. Numerous analysis and tests that are used to ensure
research study reliability, accuracy and validity are explained. Overall,
SPSS is a vital tool in facilitating the data analysis process.
Factors of Influencing Customer’s Return Patronage in Café in Klang Valley
Page 64 of 145
CHAPTER 4: DATA ANALYSIS
4.0 Introduction
In this chapter, the result of the survey questionnaires collected from the
respective respondents will be analyzed. Data collected from a total of 200
respondents were analyzed using the Statistical Package for Society Science
(SPSS) version 20.0 program. The elements covered in this chapter also
include descriptive analysis, descriptive statistic, scale measurement and
inferential analysis. The inferential analysis consists of Pearson Correlation,
Multiple Regression and Linear Regression. To provide a clearer picture of
the result, the results obtained will be presented in charts and table forms.
Lastly, this chapter is concluded with a summary on the hypothesis findings.
4.1 Descriptive Analysis
4.1.1 Respondent Demographic Profile
In this study, 6 questions were asked under respondent demographic
section such as: gender, age group, race, marital status, income level
and frequency of visit to café.

Factors of Influencing Customer’s Return Patronage in Café in Klang Valley
4.1.1.1 Gender
Gender
Male
Female
Total
Source: Developed f
Source: Developed for
The gender distribution of respondents in this research is shown in
Table 4.1 and Figure 4.1. Female has taken the
that consist of 73
respondents consist of male respondents with a total percenta
26.90% or 50
Factors of Influencing Customer’s Return Patronage in Café in Klang Valley
Page 65 of 145
4.1.1.1 Gender
Table 4.1: Gender
Frequency Percentage
50
136
186
Developed for the research
Figure 4.1: Gender
: Developed for the research
The gender distribution of respondents in this research is shown in
Table 4.1 and Figure 4.1. Female has taken the majority respondents
that consist of 73.10% or 136 respondents, while the minority
respondents consist of male respondents with a total percenta
26.90% or 50 respondents.
26.90%
Gender
73.10%
Factors of Influencing Customer’s Return Patronage in Café in Klang Valley
Percentage (%)
26.9
73.1
100
The gender distribution of respondents in this research is shown in
majority respondents
respondents, while the minority
respondents consist of male respondents with a total percentage of
Male
Female

Factors of Influencing Customer’s Return Patronage in Café in Klang Valley
Page 66 of 145
4.1.1.2 Age Group
Table 4.2 Age Group
Age Group Frequency Percentage (%)
Less than 21 years old 49 26.3
21 - 30 years old 123 66.1
31 - 40 years old 11 5.9
41 – 50 years old 3 1.6
Total 186 100
Source: Developed for the research
Figure 4.2:Age Group
Source: Developed for the research
26.30%
66.10%
5.70%1.60%
Age Group
Less than 21 y.o
21-30 y.o
31-40 y.o
41-50 y.o

Factors of Influencing Customer’s Return Patronage in Café in Klang Valley
Page 67 of 145
Based on Table 4.2 and Figure 4.2, there are 4 age groups provided in
the questionnaire. It is shown that respondents that aged between 21
and 30 years old has the highest proportion among 186 respondents,
consisting 66.10% or 123 respondents. Followed up, by the
respondents whom aged lesser than 21 years old with an amount of
26.30% or a total of 49 respondents; then followed by respondents
who aged between 31 and 40 years old, with a total count of 5.90% or
11 respondents. Lastly, there are 1.60% or 3 respondents who aged
between the age of 41 and 50 years old.
4.1.1.3 Race
Table 4.3: Race
Race Frequency Percentage (%)
Malay 11 5.9
Chinese 163 87.6
Indian 2 1.1
Others 10 5.4
Total 186 100
Source: Developed for the research

Factors of Influencing Customer’s Return Patronage in Café in Klang Valley
Source: Developed f
According to Table 4.3 and Figure 4.3, it was stated that Chinese has
the largest proportion among the respondents of the research, with
87.60% or 163 respondents; followed by Malay and other races,
having percentage of 5.90% or 11 respondents and 5.40% or
respondents respectively. Lastly, Indian was the minority group of
respondents, consisting of 1.10% or 2 respondents only.
0.00%
10.00%
20.00%
30.00%
40.00%
50.00%
60.00%
70.00%
80.00%
90.00%
100.00%
Factors of Influencing Customer’s Return Patronage in Café in Klang Valley
Page 68 of 145
Figure 4.3: Race Percentage
: Developed for the research
According to Table 4.3 and Figure 4.3, it was stated that Chinese has
the largest proportion among the respondents of the research, with
87.60% or 163 respondents; followed by Malay and other races,
having percentage of 5.90% or 11 respondents and 5.40% or
respondents respectively. Lastly, Indian was the minority group of
respondents, consisting of 1.10% or 2 respondents only.
5.90%
87.60%
1.10%
5.40%
Malay Chinese Indian Others
Race Percentage
Factors of Influencing Customer’s Return Patronage in Café in Klang Valley
According to Table 4.3 and Figure 4.3, it was stated that Chinese has
the largest proportion among the respondents of the research, with
87.60% or 163 respondents; followed by Malay and other races,
having percentage of 5.90% or 11 respondents and 5.40% or 10
respondents respectively. Lastly, Indian was the minority group of
Percentage

Factors of Influencing Customer’s Return Patronage in Café in Klang Valley
4.1.1.4 Marital Status
Marital Status
Single
Married
Total
Source: Developed for
Source: Developed for
Table 4.4 and Figure 4.4 shown that majority of the respondents have a
marital status of single, consisting of 94.60% or 176 respondents.
While only 5.40% or 10 respondents are married.
Factors of Influencing Customer’s Return Patronage in Café in Klang Valley
Page 69 of 145
4.1.1.4 Marital Status
Table 4.4 Marital Status
Marital Status Frequency Percentage
176 94.6
10
186 100
: Developed for the research
Figure 4.4: Marital Status
: Developed for the research
Table 4.4 and Figure 4.4 shown that majority of the respondents have a
marital status of single, consisting of 94.60% or 176 respondents.
While only 5.40% or 10 respondents are married.
94.60%
5.40%
Marital Status
Factors of Influencing Customer’s Return Patronage in Café in Klang Valley
Percentage (%)
94.6
5.4
100
Table 4.4 and Figure 4.4 shown that majority of the respondents have a
marital status of single, consisting of 94.60% or 176 respondents.
Single
Married

Factors of Influencing Customer’s Return Patronage in Café in Klang Valley
4.1.1.5 Income Level
Income Level
Less than RM
RM 801 –
RM 1301 –
RM 1801 –
RM 2301 –
RM 2801 –
More than RM
Total
Source: Developed f
Source: Developed for
0.00%10.00%20.00%30.00%40.00%50.00%60.00%70.00%
Factors of Influencing Customer’s Return Patronage in Café in Klang Valley
Page 70 of 145
4.1.1.5 Income Level
Table 4.5: Income Level
Income Level Frequency
Less than RM 800 123
RM 1300 12
– RM 1800 6
– RM 2300 8
– RM 2800 4
– RM 3300 3
More than RM 3301 30
186
: Developed for the research
Figure 4.5: Income Level
: Developed for the research
66.10%
6.50%3.20%4.30%2.20%1.60%16.10%
Income Level
Factors of Influencing Customer’s Return Patronage in Café in Klang Valley
Percentage (%)
66.1
6.5
3.2
4.3
2.2
1.6
16.1
100
16.10%
Percentage

Factors of Influencing Customer’s Return Patronage in Café in Klang Valley
Page 71 of 145
According to Table 4.5 and Figure 4.5, the highest population of
respondents consists of 66.10% or 123 respondents hold an income
level of lesser than RM 800; followed up by the population of
respondents that has an income level of more than RM 3301, with
16.10% or 30 respondents. Next, respondents with income level
between RM 801 - RM 1300 took the third position in the research,
with a percentage of 6.50% or 12 respondents. Then, 4.30% or 8
respondents are listed in the income level category of RM 1801 – RM
2300; followed by 3.20% or 6 respondents having income level
between RM 1301 – RM 1800. Lastly, there are 2.20% or 4
respondents having income level between RM 2301 - RM 2800; and
1.60% or 3 respondents with income level between RM 2801 – RM
3300.
4.1.1.6 Number of Visit
Table 4.6: Number of Visit
Number of Visit Frequency Percentage (%)
First Visit 61 32.80
Second Visit 32 17.20
More than Twice 93 50.00
Total 192 100
Source: Developed for the research

Factors of Influencing Customer’s Return Patronage in Café in Klang Valley
Page 72 of 145
Figure 4.6: Number of Visit
Source: Developed for the research
Referring to Table 4.6 and Figure 4.6, it was stated that 50.00% or 93
respondents has visited the respective café more than twice, while
32.80% or 61 of the respondents were visiting the café for the first
time. Also, 17.20% or 32 of the respondents were visiting the café for
the second time.
32.80%
17.20%
50.00%
Number of Visit
First Visit
Second Visit
More Than Twice

Factors of Influencing Customer’s Return Patronage in Café in Klang Valley
Page 73 of 145
4.1.2 Descriptive Statistic
Table 4.7: Descriptive Statistics on Variables
No. Variables N Mean Standard
Deviation
Ranking
1 Service Quality 186 3.7283 .46970 4
2 Word Of Mouth 186 3.8990 .44260 2
3 Value For Price 186 3.3785 .63482 5
4 Food Quality 186 3.8185 .53808 3
5 Environment 186 4.0573 .51639 1
Source: Developed for the research
Table 4.7 indicates the descriptive statistics of service quality, word of
mouth, value for price, food quality and environment. Environment
has the maximum mean of 4.0573, followed by word of mouth with a
mean of 3.8990. Subsequently, it was closely followed by food quality
and service quality, by the means of 3.8185 and 3.7283 respectively.
Lastly, value for price has the minimum mean, which is 3.3785. Table
4.7 has signaled that the environment of a café has highest effect in
influencing customer’s re-patronage to a café; while the value for price
has the least effect on customer’s re-patronage.
Furthermore, standard deviation indicates how dispersed the data is
from the mean. According to Table 4.7, value for price has the highest
standard deviation with 0.63482; followed by food quality and
environment, which are 0.53808 and 0.51639. Next, which is the
service quality with 0.46970 and closely followed by the last standard
deviation, which is word of mouth of only 0.44260. (See Appendix D)
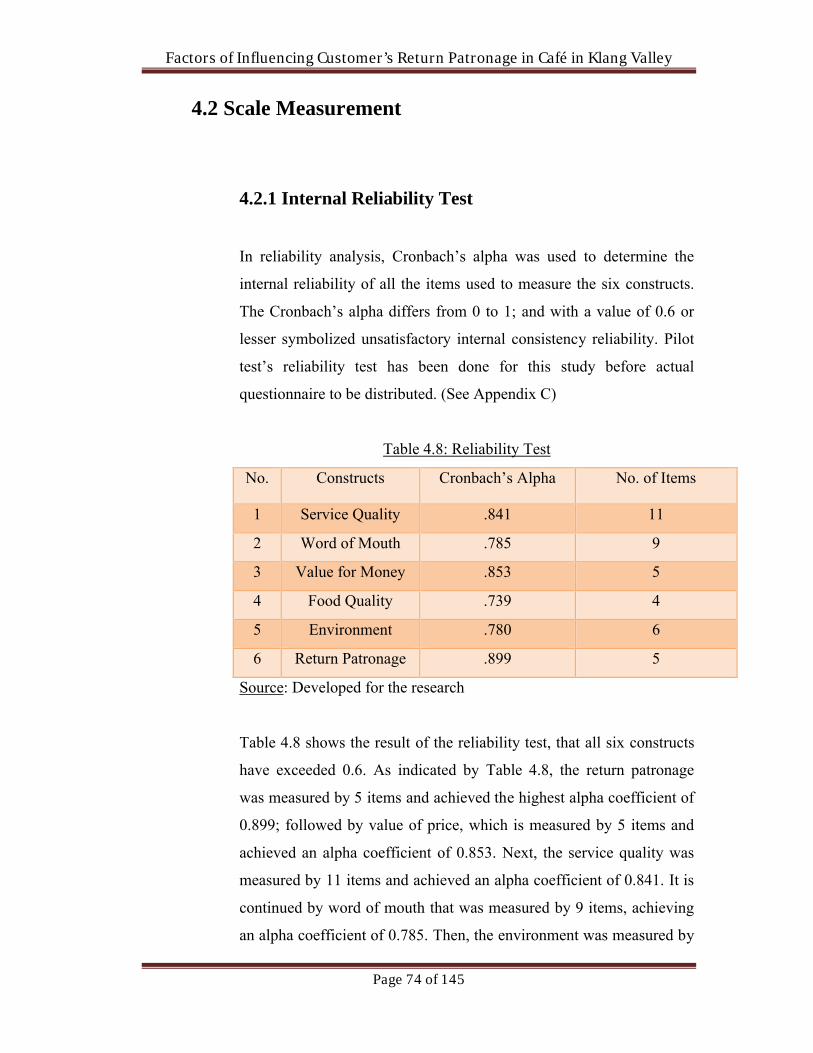
Factors of Influencing Customer’s Return Patronage in Café in Klang Valley
Page 74 of 145
4.2 Scale Measurement
4.2.1 Internal Reliability Test
In reliability analysis, Cronbach’s alpha was used to determine the
internal reliability of all the items used to measure the six constructs.
The Cronbach’s alpha differs from 0 to 1; and with a value of 0.6 or
lesser symbolized unsatisfactory internal consistency reliability. Pilot
test’s reliability test has been done for this study before actual
questionnaire to be distributed. (See Appendix C)
Table 4.8: Reliability Test
No. Constructs Cronbach’s Alpha No. of Items
1 Service Quality .841 11
2 Word of Mouth .785 9
3 Value for Money .853 5
4 Food Quality .739 4
5 Environment .780 6
6 Return Patronage .899 5
Source: Developed for the research
Table 4.8 shows the result of the reliability test, that all six constructs
have exceeded 0.6. As indicated by Table 4.8, the return patronage
was measured by 5 items and achieved the highest alpha coefficient of
0.899; followed by value of price, which is measured by 5 items and
achieved an alpha coefficient of 0.853. Next, the service quality was
measured by 11 items and achieved an alpha coefficient of 0.841. It is
continued by word of mouth that was measured by 9 items, achieving
an alpha coefficient of 0.785. Then, the environment was measured by

Factors of Influencing Customer’s Return Patronage in Café in Klang Valley
Page 75 of 145
6 items, achieving alpha coefficient of 0.780. Lastly, the food quality
was measured by 4 items, achieving an alpha coefficient of 0.739. (See
Appendix E)
4.3 Inferential Analysis
4.3.1 Pearson Correlation Analysis
Based on Appendix F, the correlation of each independent variable
(service quality, word of mouth, value for money, food quality and
environment) is significant at 0.01 levels, two- tailed toward customer
satisfaction. In addition, result also shows that there are the positive
relationship between all independent variables and customer
satisfaction. The value between service quality and return patronage is
0.340, while word of mouth is 0.242 and value of value for money is
0.330. Followed up by the value between food quality and return
patronage is 0.425 and the value between environment and return
patronage is 0.267. The result proved that food quality shows a
strongest positive influence on customer return patronage.
As a result, service quality shown a strongest positive relationship with
return patronage (r = 0.425), followed by the service quality (r =
0.340), then the value for money (0.330) and environment (r = 0.267).
Lastly, word of mouth has the weakest positive relationship with
return patronage, with a result of r = 0.242.

Factors of Influencing Customer’s Return Patronage in Café in Klang Valley
Page 76 of 145
4.3.2 Multiple Regression Analysis
Table 4.9: Model Summary
Model R R Square Adjusted R Square Standard Error of the Estimate
1 .509a .259 .238 .53205
Source: Developed for the research
a. Predictors: (Constant), Environment, Value for Money, Food
Quality, Service Quality, Word of Mouth
Table 4.9 indicates that R Square is 0.259 for regression of customer re
patronage of 0.509. At the same time, 25.90% of variation in the
customer re-patronage was influenced by the five independent
variables (service quality, word of mouth, value for price, environment
and food quality). However, the remaining 74.10% remained
uninfluenced.
Table 4.10: ANOVA
Model Sun of
Squares
df Mean
Square
F Sig.
1 Regression
Residual
Total
17.781
50.954
68.735
5
180
185
3.556
.283
12.563 .00
0 b
Source: Developed for the research
a. Dependent Variable: Return Patronage
b. Predictors: (Constant), Service Quality, Word of Mouth, Value for
Money, Food Quality, Environment
As shown in Table 4.10. F = 12.563; p = 0.000 < 0.01. Thus, the
fitness for the model is confirmed. The overall regression model with
the five predictors (service quality, word of mouth, value for money,

Factors of Influencing Customer’s Return Patronage in Café in Klang Valley
Page 77 of 145
food quality, environment) has worked well in describing the variation
in return patronage.
Table 4.11: Coefficients
Model Unstandardized
Coefficients
Standardized
Coefficients
t Sig.
B Std.
Error
Beta
1 (Constant) .737 .441 1.671 .097
Service Quality .164 .099 .126 1.651 .100
Word of Mouth .065 .106 .047 .610 .543
Value for Money .176 .068 .184 2.600 .010
Food Quality .326 .082 .288 3.971 .000
Environment .095 .089 .081 1.076 .284
Dependent Variable: Return Patronage
Source: Developed for the research
Based on Table 4.11 above, the following linear equation is formed:
Return Patronage = 0.737 + 0.164 (Service Quality) + 0.065
(Word of Mouth) + 0.176 (Value for Money) + 0.326 (Food
Quality) + 0.095 (Environment)
There is significant relationship between service quality, word of
mouth, value for money, food quality environment and return
patronage. According to the equation formed, the regression
coefficient of service quality is 0.164. This shows that the level of
return patronage will increase 0.164 units when service quality
increase 1 unit while others remain constant. Furthermore, the
coefficient of word of mouth is 0.065, which proves that the return
patronage will increase 0.065 units when word of mouth increase 1
unit while others remain constant. In addition, the coefficient of value
Factors of Influencing Customer’s Return Patronage in Café in Klang Valley
Page 78 of 145
for money is showed as 0.176, which means the level of return
patronage will increase 0.176 with every increase in 1 unit of value for
money and others remain constant. Follow up, the coefficient for food
quality is 0.326, which means that the level of return patronage will
increase by 0.326 with every 1 unit increase in food quality while
others remain constant. Lastly, the environment has a coefficient of
0.095, which proves that the level of return patronage will increase
with every increase of 1 unit of environment while others remain
constant. (See Appendix G)
4.3.3 Hypotheses Testing
Hypothesis 1
H₀: There is no significant relationship between service quality and return patronage. H1: There is a significant relationship between service quality and
return patronage.
Reject H0, if p < 0.05
Based on Table 4.12, the significant value of service quality is 0.100,
which is above p-value of 0.05. Hence, H0 is not rejected.
Hypothesis 2
H0: There is no significant relationship between word of mouth and
return patronage.
H1: There is a significant relationship between word of mouth and
return patronage.
Reject H₀, if p < 0.05

Factors of Influencing Customer’s Return Patronage in Café in Klang Valley
Page 79 of 145
Based on Table 4.12, the significant value of word of mouth is 0.543,
which is above p-value of 0.05. Hence, H0 is not rejected.
Hypothesis 3
H0: There is no significant relationship between value for money and
return patronage.
H1: There is a significant relationship between value for money and
return patronage.
Reject H₀, if p < 0.05
Based on Table 4.12, the significant value of value for money is 0.010,
which is below p-value of 0.05. Hence, H0 is rejected, which indicates
that there is a positive relationship between value for money and return
patronage.
Hypothesis 4
H0: There is no significant relationship between food quality and
return patronage.
H1: There is a significant relationship between food quality and return
patronage.
Reject H₀, if p < 0.05
Based on Table 4.12, the significant value of food quality is 0.000,
which is below p-value of 0.05. Hence, H0 is rejected, which indicates
that there is a positive relationship between food quality and return
patronage.

Factors of Influencing Customer’s Return Patronage in Café in Klang Valley
Page 80 of 145
Hypothesis 5
H₀: There is no significant relationship between environment and return patronage. H1: There is a significant relationship between environment and return
patronage.
Reject H0, if p < 0.05
Based on Table 4.12, the significant value of environment is 0.284,
which is above p-value of 0.05. Hence, H0 is not rejected.
4.4 Conclusion
This chapter summed up the respondents’ demographic profiles that were analyzed
using descriptive analysis. Also, the six constructs’ reliability was tested using an
internal reliability test. Meanwhile, inferential analysis was measured through
Multiple Regression Analysis; to verify whether or not the independent variables
have significant impact to the dependent variable. Finally, Pearson Correlation
Analysis was used in examining the association among the six constructs.

Factors of Influencing Customer’s Return Patronage in Café in Klang Valley
Page 81 of 145
CHAPTER 5: DISCUSSION, CONCLUSION AND
IMPLICATIONS
5.0 Introduction
Chapter 5 provides conclusive outcomes and recommendations for
research to be conducted in the near future. It starts off with
summarized statistical analyses covering both descriptive and
inferential analyses. Next, discussion on finding throughout the study
will come into the picture. The implications brought upon by the
research study will be discussed in managerial aspect. It is then
followed by the limitations or constraints in which subsequent
recommendations will be based on. Finally, the entire research project
will be concluded in line with the research objectives stated
previously.
5.1 Summary of Statistical Analyses
5.1.1 Descriptive Analyses
According to the respondents’ demographic information, the personal
details are listed as gender, age, race, marital status and monthly
income. From the result shown, female respondents have taken the
majority position, consisting of 73% of the total sample size. Also,
66.3% of the respondents fell into the age group between 21 to 30
years old, representing the largest age group. Furthermore, the Chinese
respondents are listed as the largest group of respondents, consisting of
87.5% of the total sample size. 95% of the total respondents are having
Factors of Influencing Customer’s Return Patronage in Café in Klang Valley
Page 82 of 145
a marital status of single. On the other hand, 65.6% of the total sample
size has fallen into the group of respondents consisting income of not
more than RM800 monthly.
5.1.2 Inferential Analyses
5.1.2.1 Pearson Correlation
Pearson Correlation is used to measure the relationships among the six
constructs of this research. The result states that all the five
independent variables, which are the service quality, word of mouth,
food quality, environment and value for money, have significant
positive relationship with customers return patronage at a significant
level of 0.01. According to the result shown, the food quality has the
strongest significant relationship with the customers return patronage
(r = 0.340) among the five independent variables. It is then followed
by the service quality and the value for money, with a result of r =
0.340 and r = 0.330 respectively. Then continued by environment (r =
0.267) and word of mouth (r = 0.242). Thus, the result has proven that
there are significant positive relationships between the six constructs.
5.1.2.2 Multiple Regression Analysis
Multiple regression analysis was conducted for the reason of testing
the association among the five independent variables (service quality,
word of mouth, value for money, food quality and environment)
against the customers return patronage. According to the result of
regression shown in Table 4.10, R Square is 0.259 for regression of
customers return patronage of 0.509. At the same time, 25.9% of

Factors of Influencing Customer’s Return Patronage in Café in Klang Valley
Page 83 of 145
variation in the customer re-patronage was influenced by the five
independent variables (service quality, word of mouth, value for price,
environment and food quality). Based on Table 4.12, an equation has
been formed as shown below:
Customer Return Patronage = 0.737 + 0.164 (Service
Quality) + 0.065 (Word of Mouth) + 0.176 (Value for Money) +
0.326 (Food Quality) + 0.095 (Environment)
According to Table 4.12 in the previous chapter, the result shows that
only two independent variables (Food Quality and Value for Money)
have a significant influence on customer return patronage. According
to the equation formed, the regression coefficient of service quality is
0.164. It was then continued by word of mouth and value for money,
with a regression coefficient of 0.065 and 0.176 respectively; then
followed up by food quality and environment, with regression
coefficient of 0.326 and 0.095 respectively. On the other hand, food
quality has a standardized beta of 0.288, which proves that food
quality has the strongest impact on customer return patronage among
all five independent variables. Therefore, food quality is the most
crucial predictor of customer return patronage and followed by value
for money, service quality, environment and word of mouth. All the
five hypotheses have been tested. However, only two were supported
with significant level less than 0.05. As a result, only H3 and H4 were
supported.

Factors of Influencing Customer’s Return Patronage in Café in Klang Valley
Page 84 of 145
5.2 Discussions of Major Findings
Table 5.1 Summary of Major Findings
No. Hypotheses Results (p, r and β) Accepted/Rejected
H1 There is a significant
relationship between service
quality and customer’s return
patronage to café in Klang
Valley.
p = 0.100 (p<0.05)
r = 0.340
β = 0.126
Rejected
H2 There is a significant
relationship between word of
mouth and customer’s return
patronage to café in Klang
Valley.
p = 0.543 (p<0.05)
r = 0.242
β = 0.047
Rejected
H3 There is a significant
relationship between value for
money (price) and customer’s
return patronage to café in
Klang Valley.
p = 0.010 (p<0.05)
r = 0.330
β = 0.184
Accepted
H4 There is a significant
relationship between food
quality and customer’s return
patronage to café in Klang
Valley.
p = 0.000 (p<0.05)
r = 0.425
β = 0.288
Accepted
H5 There is a significant
relationship between
environment and customer’s
return patronage to café in
Klang Valley.
p = 0.284 (p<0.05)
r = 0.267
β = 0.081
Rejected
Source: Developed for the research

Factors of Influencing Customer’s Return Patronage in Café in Klang Valley
Page 85 of 145
5.2.1 Service Quality
Research Objective 1: To examine the relationship between
service quality and customer’s return patronage to café in
Klang Valley.
Research Question 1: Does service quality affect customer’s
return patronage to café in Klang Valley?
H0: There is no significant relationship between service quality
and customer’s return patronage to café.
H1: There is a significant relationship between service quality
and customer’s return patronage to café.
The Pearson’s correlation coefficient, r for service quality is
0.340, which means there is definite positive relationship
between service quality and customer’s return patronage to
café. Based on multiple regression analysis, the value of p is
0.100, which according to the rule of thumb, the relationship
between service quality and customer’s return patronage to
café is insignificant. The beta, β is 0.126, implying that 12.6%
of customer’s return patronage to café is explained by service
quality. Due to the fact that the relationship is not significant,
hypothesis (H1) will be rejected.
Previous studies have shown some insignificant results of
service quality to marketing variable. Particularly some
dimensions of service quality including tangibility, reliability
and empathy failed to show significant linkage to customer
satisfaction (Ismail, Ridzuan, Rose, Abdullah, Rahman &
Francis, 2013). Other than commonly significant results,

Factors of Influencing Customer’s Return Patronage in Café in Klang Valley
Page 86 of 145
certain studies proved that there is no significant linkage
between perceived service quality and revisit intention (Gagic,
Tesanovic & Jovicic, 2013; Ariffin, Abdullah & Bobin, 2012).
The insignificant results discussed above are consistent with
the finding in current study, in which the relationship between
service quality and customer’s return patronage to café is not
significant.
5.2.2 Word of Mouth
Research Objective 2: To examine the relationship between
word of mouth and customer’s return patronage to café in
Klang Valley.
Research Question 2: Does word of mouth affect customer’s
return patronage to café in Klang Valley?
H0: There is no significant relationship between word of mouth
and customer’s return patronage to café.
H2: There is a significant relationship between word of mouth
and customer’s return patronage to café.
The Pearson’s correlation coefficient, r value of 0.242 implies
that word of mouth is correlated with customer’s return
patronage to café. However, under the multiple regression, p-
value of 0.543 shows insignificant relationship between word
of mouth and customer’s return patronage to café. Thus,
hypothesis (H2) is then rejected. Also, the beta value of 0.047
indicates that 4.7% of customer’s return patronage to café is
explained by word of mouth.

Factors of Influencing Customer’s Return Patronage in Café in Klang Valley
Page 87 of 145
Most of the previous studies place word of mouth as dependent
variable. According to Castaneda et al. (2007), electronic word
of mouth’s influence on one’s decision to revisit is
insignificant. Also, there is research showing that the
relationship between positive word of mouth and intention to
repurchase is negative (Kuo, Hu & Yang, 2013).
5.2.3 Value for Money (Price)
Research Objective 3: To examine the relationship between value for
money (price) and customer’s return patronage to café in Klang
Valley.
Research Question 3: Does value for money (price) affect customer’s
return patronage to café in Klang Valley?
H0: There is no significant relationship between value for money
(price) and customer’s return patronage to café in Klang Valley.
H3: There is a significant relationship between value for money (price)
and customer’s return patronage to café in Klang Valley.
Based on the Table 5.1, the figure r = 0.330 is the result of Pearson
Correlation Analysis which indicates that value for money is strongly
correlated with customer’s return patronage. Besides, the research also
conducted the Multiple Regression Analysis. It is showing the figure
(p = 0.010) which means customer’s return patronage is strongly
affected by the value for money and other independent variables. Thus,
the hypothesis (H3) is accepted as there is a significant relationship
between the value for money and customer’s return patronage to café

Factors of Influencing Customer’s Return Patronage in Café in Klang Valley
Page 88 of 145
in Klang Valley. On other hand, the standardized Beta coefficient
value (β) of value for money is 0.184. This is implying that the value
for money has 18.4% influences in customer decision making of return
patronage to café.
According to Yuksel and Yuksel (2003), the price is an important
attribute because of its direct influential towards customers to visit the
restaurants. By comparing the results from previous studies done by
Butcher et al. (2002); Oh (1999); Sweeney et al. (1997); and Yang and
Chang (2011), the result of this study is consistent to and supported by
other previous studies as the value for money is positively related to
customer’s return patronage. Therefore, the value for money can
directly affects customer’s return patronage. This indicates that
customers are very price conscious by comparing the food they
ordered, the sacrifices (monetary) they made, and the value they
received when consuming the food which ultimately affects their
decision making for returning to café. This is supported by Bolton and
Lemon (1999); Han and Ryu (2009); Varki and Colgate (2001) as they
mentioned price is used by customers as a cue for their experiences
with product/services and form their attitude towards the
product/service provider. In addition, they are also categorized as the
value seekers. Based on Yuksel and Yuksel (2003) study, they found
that the value for money is greatly important and attached to value
seekers when they are selecting restaurants and food.
5.2.4 Food Quality
Research Objective 4: To study the relationship between food quality
and customer’s return patronage.

Factors of Influencing Customer’s Return Patronage in Café in Klang Valley
Page 89 of 145
Research Question 4: Is there any relationship between food quality
and customer’s return patronage?
H0: There is no significant relationship between food quality
and customer’s return patronage to café.
H4: There is a significant relationship between food quality and
customer’s return patronage to café.
According to the Pearson Correlation Analysis conducted in this
research, food quality is significantly correlated with customer’s return
patronage (r = 0.425). On the other hand, multiple regression analysis
proves that the food quality is influencing customer’s return patronage
positively (p = 0.000). Therefore, the hypothesis (H4) is accepted as
there is a significant positive relationship between food quality and
customer’s return patronage in café. Also, beta value is 0.288,
implying that 28.8% of customer’s return patronage is explained by
food quality.
Based on research conducted by Peri (2006), food quality is a critically
essential element in satisfying the needs and expectations of
customers. Also, this statement was supported by Pettijohn et al.
(1997), which the research stated that food quality was positioned as
one of the most crucial determinants in measuring customer’s
satisfaction, which eventually leads to the decision on returning to
cafés, proving it to have significantly affecting the customer’s return
patronage to café.
In the current research, the food quality is the most important factor in
comparison with the other four variables (service quality, word of
mouth, value for money and environment) that affects the customer’s
return patronage. Majority of the café goers choose to dine in at cafés

Factors of Influencing Customer’s Return Patronage in Café in Klang Valley
Page 90 of 145
because of the enjoyment of the food provided. Thus, food quality is of
emphasis of their choice of café they chose to dine in.
5.2.5 Environment
Research Objective 5: To study the relationship between environment
and customer’s return patronage.
Research Question 5: Is there any relationship between environment
and customer’s return patronage?
H0: There is no significant relationship between environment
and customer’s return patronage to café.
H5: There is a significant relationship between environment
and customer’s return patronage to café.
According to the Pearson Correlation Analysis conducted in this
research, environment is significantly correlated with customer’s
return patronage (r = 0.267). However, multiple regression analysis
proves that the environment is not influencing customer’s return
patronage positively (p = 0.284). Therefore, the hypothesis (H5) is not
accepted as there is no significant positive relationship between
environment and customer’s return patronage in café. Also, beta value
is 0.081, which shows that 8.1% of customer’s return patronage to café
is explained by environment.
On the contrary, café atmosphere might not be significantly affecting
the customer’s return patronage to café. This was proved by John et al.
(2013) that signs, symbols are of useless for employees’ skills
coordination in terms patronage.

Factors of Influencing Customer’s Return Patronage in Café in Klang Valley
Page 91 of 145
5.3 Implications of the Study
5.3.1 Managerial Implications
5.3.1.1 Service Quality
The analysis has shown that the relationship between service
quality and customer’s return patronage to café is insignificant.
However, it is undeniable that the two variables are correlated
as depicted in Pearson’s correlation coefficient. Therefore,
manager’s emphasis on service quality in a café still remains as
a concern. Each dimension of service quality including
tangibles, reliability, responsiveness, assurance and empathy
can be improved. One of the instances will be to ensure staff in
the café possesses competencies needed so that it results in
favorable serving speed and efficiency (Ramapuram & Batra,
2006). The good job of different aspects of the café also has to
be kept up in order to secure customer’s next visit (Ramapuram
& Batra, 2006). Additionally, when the café is assessing its
service quality, it should incorporate behavioral-intention
questions to understand the dimensions that have to be further
enhanced for the good of customers. This is backed by the fact
that service quality serves as a reason for customer’s
behavioral responses including revisit intention (Yap & Kew,
2007). Training is also necessary to be directed to new and
unskilled staff to fully upgrade the service quality of the café.
Meanwhile, performance evaluation and reward system that
complement training should be implemented hand in hand with
training program.
Factors of Influencing Customer’s Return Patronage in Café in Klang Valley
Page 92 of 145
5.3.1.2 Word of Mouth
The hypothesis of word of mouth having significant
relationship with customer’s return patronage is rejected,
however, the Pearson’s correlation coefficient implies a
positive correlated relationship. In the current era where
customer’s lifetime value to a company is vital, commitment
that is develop affectively is important as it can directly
influences customer’s decision to patron the same café again
(Susskind & Viccari, 2011). Given its relatively low value of
correlation with customer’s return patronage to café,
specifically in Klang Valley context, the café may want to
allocate more resources to other factors such as food quality
and value for money. Despite of the fact, in the current
marketing world where user-generated content is prevalent,
word of mouth can still be invested as a marketing tool. By
doing so, the café is able to win customers in term of the
frequency of their visit and the level of loyalty (Ryu & Feick,
2007).
5.3.1.3 Value for Money (Price)
Based on the research, it is found that the value for money has the
second strongest positive impact on customer’s return patronage to
café in Klang Valley. Albeit it placed second in this research, but value
for money still remain as one of the important impetuses for return
patronage (Yuksel and Yuksel, 2003). Thus, value for money is still
implanted as high priority in the industry as customers make decision
on returning to café based on the experiences or perceived value they
received (Grace and O’Cass, 2005). Ultimately, café managers should
Factors of Influencing Customer’s Return Patronage in Café in Klang Valley
Page 93 of 145
have carefully set the price against the portion they are serving or
quality of food as indicated in this study’s findings too. This approach
will be giving an impression of reasonable pricing to customer’s
perceived value is equivalent to the food they ordered. According to
Han and Ryu (2009), they stated that the price reasonableness in
consumer perception is mainly depending on the pricing on the menu.
This may lead to situation of consumer perceives that the café is
serving expensive food when looking at the menu and form their
attitude and behavior of not revisiting to the café (Bolton and Lemon,
1999; Han and Ryu, 2009; Varki and Colgate, 2001). Additionally, this
is supported by Kim, Lee and Yoo (2006), they mentioned that return
patronage would not be happening as customers are not willing due to
the price is immoderately high. Therefore, it concluded that value for
money is an important attribute and managers of cafés should carefully
revise the menu price.
5.3.1.4 Food Quality
Based on the research conducted, it is proven that the food quality has
the most positive impact on affecting customer’s return patronage to
café.
This was supported by a research conducted by Pettijohn et al. (1997),
which it was stated that food quality was positioned as one of the most
crucial determinants in measuring customer’s satisfaction, which will
further be led to the choice of customer’s return patronage to a
particular café. Therefore, café managers are advised to commit more
effort in making sure of the efficiency of food source supply chain in
exchange for ingredient quality and freshness. Also, the food
preparation process must be observed closely from time to time to

Factors of Influencing Customer’s Return Patronage in Café in Klang Valley
Page 94 of 145
ensure food quality is up to standard and matches customer’s
expectation.
5.3.1.5 Environment
According to multiple regression analysis, the research conclusion
stated that the café environment is not a contributing factor that has the
ability to affect the customer’s return patronage to cafés. However,
based on the result of Pearson correlation analysis, it was stated that
environment is still correlated with the other five constructs.
Therefore, it is concluded that environment is still an important
determinant and café managers are required to make improvements to
better accommodate the customer’s needs for a relaxing and
pleasurable dining environment.
Based on findings by Aubert-Gamet and Cova (1997), the ambience
conditions are considered to be significant elements in customer
assessment on the quality level of the service they received from,
eventually affecting the customer’s satisfaction and return patronage.
Café managers are advised to improve on the environment aspect in
creating a dining place with pleasurable atmosphere, further creating
customer satisfaction and return patronage from customers.

Factors of Influencing Customer’s Return Patronage in Café in Klang Valley
Page 95 of 145
5.4 Limitations of the Study
Several constraints and limitations can be pointed out during the
process in which the research is being carried out. In term of the
geographic coverage, the cafes researched are only a small portion of
all the cafes in Klang Valley. The research was conducted mainly in
areas including TTDI, Pudu and Kuala Lumpur, which did not fulfill
the coverage of Klang Valley which includes both Selangor and Kuala
Lumpur. Therefore, it is less appropriate if the study were meant to
generalize the café patrons’ behavior in the whole Klang Valley since
the small sample size used is not large enough to be representative.
Convenience sampling is the sampling technique used in the current
study. Despite of its upside of saving time and budget, the drawback
includes possible biasness since the respondents are chosen based on
their availability. Part of the research study is done through online
distribution and collection method, which reflects the potential
drawback of such technique. The respondent’s ability to understand
and interpret the questions remains unknown, which may lead to
biased responses and subsequent less accurate results.
The independent variables tested in the research study is only limited
to five, which includes service quality, word of mouth, value for
money (pricing), food quality and store environment. The absence of
other possible independent or mediating variables such as location
may hinder the researcher from getting relatively in-depth results.
Thus, other overlooked factors which may also have an impact on
customer’s return patronage to café serve as a limitation.
The finding under the demographic sections of the respondents has
unfolded another limitation. There is an imbalance in the respondents’
Factors of Influencing Customer’s Return Patronage in Café in Klang Valley
Page 96 of 145
gender whereby more than 70% of them are female. Similar limitation
arises as for respondents’ race in which majority of the respondents are
Chinese. These show that the survey questionnaire was not evenly
distributed to cover respondents of various races and gender fairly.
Such limitation can be attributed to the use of convenience sampling.
In term of journals and articles with regards to previous studies of the
variables, there are limited amount of journals and articles that are
relevant to certain variable. For instance, valid sources for the
independent variable word of mouth is lacking because in most of the
journal articles, word of mouth served as dependent variable instead of
independent variable. This serves as a limitation while relationship
between word of mouth and return patronage has to be justified.
It has to be noted that the limitations are recognized, however, they
will not detract from the significance of the findings. Instead, they
serve merely as platforms for future research study.
Factors of Influencing Customer’s Return Patronage in Café in Klang Valley
Page 97 of 145
5.5 Recommendations for Future Research
To enhance the accuracy and gain diverse perspectives on factors
leading customers to return to a café, it is advised that bigger sample
size can be involved in data collection process. In term of the sampling
location, more cafés should be involved and the geographical coverage
should be expanded so that the research is done evenly throughout the
Klang Valley area.
In term of sampling technique, where resources permit, it is advisable
for future research to use probability sampling, which will largely
reduce the possibility of biasness as each member of the involved
population has known probability to be selected (Zikmund et. al,
2010). Despite of its lack of convenience, it increases the tendency for
the results to be free from bias.
Besides that, by recognizing the possible imbalance of demographic
profile of respondents, researchers of future study ought to consistently
take note of the types of respondents involved. This is to ensure an
even coverage of respondents in term of the demographic variables as
well as to avoid an extreme imbalance of races and genders of
respondents.
Additional variables can be put into test for a more in-depth research.
Extra applicable variables, whether they are independent or mediating
variables can be investigated for more outcomes which can reflect
customer needs more precisely. By doing so, an even more
comprehensive framework regarding reasons of customer’s return
patronage can be developed.
Factors of Influencing Customer’s Return Patronage in Café in Klang Valley
Page 98 of 145
5.6 Conclusion
The research has studied the relationship between service quality,
word of mouth, value for money (price), food quality and environment
with customer return’s patronage to café in Klang Valley. By
reviewing the literature and implementing the data collection process
with pre-set research methodology, the research questions are
answered while the specific research objectives are achieved. The
Pearson Correlation Analysis shows that all the independent variables
are correlated with customer’s decision to revisit a café. On the other
hand, multiple regression analysis shows that only food quality and
value for money (price) have significant relationship with return
patronage intention. The descending order of variables in term of its
degree of significance is food quality, value for money (price), service
quality, environment and word of mouth. This chapter has also
outlined the suggestions for managers to improve each and every
aspect of café to secure customer’s next visit. Besides contributing to
the knowledge of service provider in café industry, the study also
contributes to the body of knowledge.

Factors of Influencing Customer’s Return Patronage in Café in Klang Valley
Page 99 of 145
REFERENCES
Akbar, M. M. (2014). A causal study on the antecedents of retail shoppers’
repatronage intention. European Journal of Business and management, 6(4),
2222-2839.
Aksoydan, E. (2007). Hygiene factors influencing customers’ choice of dining-out
units: Findings from a study of university academic staff. Journal of Food
Safety, 27(3), 300-316.
Anderson, E. W. (1998). Customer satisfaction and word of mouth. Journal of
Service Research, 1(1), 5-17.
Anderson, J. C., & Narus, J. A. (2004). Business market management (2nd ed.). New
Jersey: Prentice Hall.
Ariffin, H. F., Abdullah, R. P. S. R., & Bibon, M. F. (2012). Assessing service
quality: From the perspective of people who perform prayers. Journal of Asian
Behavioural Studies, 2(4), 11-20.
Arndt, J. (1967). Role of product-related conversations in the diffusion of a new
product. Journal of Marketing Research, 4, 291-295.
Assael, H. (2004). Consumer behavior: A strategic approach. Boston, MA: Houghton
Mifflin Company.
Aubert-Gamet, V., & Cova, B. (1997). Servicescapes: From modem non-places to
postmodem common places. Journal of Business Research, 44(1), 37-45.

Factors of Influencing Customer’s Return Patronage in Café in Klang Valley
Page 100 of 145
Azila, J., Suraya, M., & Siti Zamanira, M. Z. (2014). Factors affecting customers’
experience in local fast food restaurant. Paper presented at the second World
Conference on Islamic Thought and Civilization, Perak, Malaysia.
Babakus, E., & Mangold, W. G. (1992). Adapting the SERVQUAL scale to health
care environment: An empirical assessment. Health Service Research,
26(6), 767-786.
Baker, J., Parasuraman, A., Grewal, D., & Voss, G. B. (2002). The influence of
multiple store environment cues on perceived merchandise value and
patronage intentions. Journal of Marketing, 66(2), 120-41.
Bansal, H. S., & Voyer, P. A. (2000). Word-of-mouth processes within a services
purchase decision context. Journal of Service Research, 3(2), 166-177.
Barber, N., & Scarcelli, J. M. (2009). Clean restrooms: How important are they to
restaurant consumers? Journal of Foodservice, 20(6), 309-320.
Bazelon, E. (2009, June 2). The self-employed depression. The New York Times, pp.
MM38.
Belk, R. W. (1975). Situational Variables and Consumer Behaviour. Journal of
Consumer Research, 2(3), 151-164.
Bernhardt, K. L., Donthu, N., & Kennett, P. A. (2000). A longitudinal analysis of
satisfaction and profitability. Journal of Business Research, 47, 161–171.
Berry, L. L., & Yadav, M. S. (1996). Capture and communicate value in the pricing
of services. Sloan Management Review, 37(4), 3–27.

Factors of Influencing Customer’s Return Patronage in Café in Klang Valley
Page 101 of 145
Berry, L. L., Parasuraman, A., & Zeithaml, V. A. (1988). The service-quality puzzle.
Business Horizons, 35-43.
Bitner, M. J. (1992). Servicescapes: The impact of physical surroundings on
customers and employees. Journal of Marketing, 56(2), 57-71.
Blank, G., & Van Vooren, N. (2007). Camping out in the coffee shop world: A
sociological analysis of coffee shop conventions. Paper presented at the
annual meeting of the American Sociological Association, New York, New
York.
Bloch, P. H. (1995). Seeking the ideal form – Product design and consumer
response. Journal of Marketing, 59(3), 16-29.
Blodgett, J. G. (1994). The effects of perceived justice on complainants’ repatronage
intentions and negative word-of-mouth behavior. Journal of Consumer
Satisfaction, Dissatisfaction and Complaining Behavior, 7, 1-14.
Bolton, R. N., & Drew, J. H. (1991). A multistage model of customers’ assessments
of service quality and value. Journal of Consumer Research, 17, 375-378.
Bone, P. F. (1992). Determinants of word-of-mouth communication during product
consumption. Advances in Consumer Research, 19, 579-583.
Boo, H. V. (2011). Service Environment of Restaurants: Findings from the youth
customers. Journal of ASIAN Behavioral Studies, 1(2), 45-56.
Brady, M. K., & Cronin, J. J. (2001). Customer orientation: Effects on customer
service perceptions and outcome behaviors. Journal of Service Research, 3(3),
241-251.

Factors of Influencing Customer’s Return Patronage in Café in Klang Valley
Page 102 of 145
Bryman, A. (2004). Social research methods (2nd ed.). Oxford: Oxford University
Press.
Butcher, K. J., Sparks, B., & O’Callaghan, F. (2002). Effect of social influence on
repurchase intention. Journal of Services Marketing, 16(6), 503-514.
Buttle, F. A. (1998). Word-of-mouth: Understanding and managing referral
marketing. Journal of Strategic Marketing, 6(3), 241-254.
Carman, J. M. (1990). Consumer perceptions of service quality: An assessment of the
SERVQUAL dimensions. Journal of Retailing, 66(1), 33-35.
Castaneda, J. A., Frias, D. M., & Rodriguez, M. A. (2007). The influence of the
Internet on destination satisfaction. Internet Research, 17(4), 402-420.
Chaiyasoonthorn, W., & Suksa-ngiam, W. (2011). Factors influencing store
patronage: a study of modern retailers in Bangkok Thailand. International
Journal of Trade, Economics, and Finance, 2(6), 520-525.
Chang, K. (2000). The impact of perceived physical environments on customers’
satisfaction and return intention. Journal of Professional Services Marketing,
21(2), 75-85.
Chang, L., Lee, Y., & Huang, C. (2009). The influence of e-word-of-mouth on the
consumer’s purchase decision: A case of body care products.
Chaudhry, P. E. (2007). Developing a process to enhance customer relationship
management for small entrepreneurial businesses in the service sector. Journal
of Research in Marketing and Entrepreneurship, 9(1), 4-23.
Factors of Influencing Customer’s Return Patronage in Café in Klang Valley
Page 103 of 145
Chaudhuri, A., & Holbrook, M. B. (2001). The chain of effects from brand trust and
brand affect to brand performance: the role of brand loyalty. Journal of
Marketing, 65(2), 81-93.
Chebat, J., & Michon, R. (2003). Impact of ambient odors on mall shoppers’
emotions, cognition, and spending: A test of competitive causal theories.
Journal of Business Research, 56, 529-539.
Chetthamrongchai, P., & Davies, G. (2000). Segmenting the market for food shoppers
using attitudes to shopping and to time. British Food Journal, 102(2), 81-101.
Christensen, C. M. (1983). Effects of aroma, flavor and texture judgments of foods.
Journal of Food Science, 48, 787-790.
Chow, H. S., Lau, V. P., Lo, W. C., Sha, Z., & Yun, H. (2007). Service quality in
restaurant operations in China: Decision-and experiential-oriented
perspectives. International Journal of Hospitality Management, 26(3), 698-
710.
Clemes, M. D., Gan, C. & Ren, M. (2011). Synthesizing the effects of service quality,
value, and customer satisfaction on behavioral intentions in the motel
industry: an empirical analysis, Journal of Hospitality and Tourism Research,
35(4), 530-568.
Collaco (2011). The ottoman coffeehouse: All the charms and dangers of
commonality in the 16th-17th century. Retrieved October 3, 2014, from
https://www.academia.edu/1123874/The_Ottoman_Coffeehouse_All_the_Cha
rms_and_Dangers_of_Commonality_in_the_16th-17th_Century
Cronin, J. J., & Taylor, S. A. (1992). Measuring service quality: A re-examination
and extension. Journal of Marketing, 56(3), 55-68.

Factors of Influencing Customer’s Return Patronage in Café in Klang Valley
Page 104 of 145
Cronin, J. J., & Taylor, S. A. (1994). SERVPERF vs SERVQUAL: Reconciling
performance-based and perceptions-minus-expectations measurement of
service quality. Journal of Marketing, 58(1), 125-131.
Dabholkar, P. A., & Overby, J. W. (2005). Linking process and outcome to service
quality and customer satisfaction evaluations: An investigation of real estate
agent service. International Journal of Service Industry Management, 16(1),
10-27.
Dabholkar, P. A., Shepherd, C. D. & Thorpe, D. I. (2000). A comprehensive
framework for service quality: An investigation of critical conceptual and
measurement issues through a longitudinal study. Journal of Retailing, 76(2),
139-173.
Delgadillo, Y., & Escalas, J. E. (2004). Narrative word-of-mouth communication:
Exploring memory and attitude effects of consumer storytelling. Advances in
Consumer Research, 31, 186-192.
Department of Statistics Malaysia (2014). Higher household income, lower poverty
rates. Retrieved September 3, 2014 from
http://www.statistics.gov.my/portal/index.php?option=com_content&view=art
icle&id=2230&lang=en&Itemid=187
Deshpande, S., Basil, M. D., & Basil, D. Z. (2009). Factors influencing healthy eating
habits among college students: An application of the health belief model.
Health Marketing Quarterly, 26(2), 145–164.
Dijkstra, K., Pieterse, M. E., & Pruyn, A. Th.H. (2008). Individual differences in
reactions towards color in simulated healthcare environments: The role of
stimulus screening ability. Journal of Environmental Psychology, 28(3), 268-
277.

Factors of Influencing Customer’s Return Patronage in Café in Klang Valley
Page 105 of 145
Dodds, W. B., Monroe K. B., & Grewal, D. (1991). The effects of price, brand, and
store information on buyers’ product evaluations. Journal of Marketing
Research, 28(3), 307-319.
DuBose, C. N., Cardello, A.V., & Maller, O. (1980). Effects of colorants and
enterprises. International Journal of Contemporary Hospitality Management,
11(7), 326-339.
East, R., Gendall, P., Hammond, K. & Lomax, W. (2005). Consumer loyalty:
Singular, additive or interactive?. Australasian Marketing Journal, 13(2), 10-
27.
Euromonitor International (2014). Malaysia country factfile. Retrieved September 1,
2014 from http://www.euromonitor.com/malaysia/country-factfile
Euromonitor International. (2013). Consumer food service by location in Malaysia.
Retrieved September 1, 2014 from http://www.euromonitor.com/consumer-
foodservice-by- location-in-malaysia/report
Finn, A., & Louviere, J. J. (1996). Shopping center image, consideration, and choice:
Anchor store contribution. Journal of Business Research, 35(3), 241-251.
Forbes, J. D., Tse, D. K., & Taylor, S. (1986). Toward a model of consumer post-
choice response behavior. Advances in Consumer Research, 13, 658-61.
Fu, Y. Y., Cho, M. H., & Parks, S. (2000). The impact of fairness and disconfirmation
on restaurant customer’s satisfaction judgements. Proceedings of the Fifth
Annual Graduate Education and Graduate Students Research Conference in
Hospitality & Tourism, 202-204.
Factors of Influencing Customer’s Return Patronage in Café in Klang Valley
Page 106 of 145
Evanschitzky, H., Iyer, G. R., Plassmann, H., Niessing, J., & Meffert, H. (2006). The
relative strength of affective commitment in securing loyalty in service
relationships. Journal of Business Research, 59(12), 1207-1213.
Finkelstein, J. (1989). Dining Out: A Sociology of Modern Manners. Cambridge, MA:
Polity Press.
Fornell, C., Johnson, M. D., Anderson, E. W., Cha, J., & Bryant, B. E. (1996). The
American customer satisfaction index: Nature, purpose, and findings. The
Journal of Marketing, 60(4), 7-18.
Fox, E. J., Montgomery, A. L. & Lodish, L. M. (2004). Consumer shopping and
spending across retail formats. Journal of Business, 77(2), 25-60.
Gagić, S., Tešanović, D., & Jovičić, A. (2013). The vital components of restaurant
quality that affect guest satisfaction. TURIZAM, 17(4), 166-176.
Gaur, S.S., Xu, Y., Quazi, A., & Nandi, S. (2011). Relational impact of service
providers’ interaction behavior in healthcare. Managing Service Quality, 21(1),
67-87.
Getty, J. M., & Thompson, K. N. (1994). The relationship between quality,
satisfaction, and recommending behavior in lodging decision. Journal of
Hospitality & Leisure Marketing, 2(3), 3-22.
Grace, D., & O’Cass, A. (2005). An examination of the antecedents of repatronage
intentions across different retail store formats. Journal of Retailing and
Consumer Service, 12, 227-243.
Factors of Influencing Customer’s Return Patronage in Café in Klang Valley
Page 107 of 145
Grayson, R. A. S., & McNeil, L. S. (2009). Using atmospheric elements in service
retailing: understanding the bar environment. Journal of Services Marketing,
23(7), 517-527.
Gremler, D., & Brown, S. W. (1996). The loyalty ripple effect: Appreciating the full
value of customers. International Journal of Service Industry Management,
10(3), 271-293.
Gronroos, C. (1982). Strategic management and marketing in service sector.
Marketing Science Institute, 83-104.
Gronroos, C. (1984). A service quality model and its marketing implications.
European Journal of Marketing, 18(4), 36-44.
Gronroos, C. (1988). Service quality: The six criteria of good perceived service.
Review of Business, 9(3), 10-13.
Ha, H. (2002). The effects of consumer risk perception on pre-purchase information
in online auctions: Brand, word of mouth, and customized information.
Journal of Computer-Mediated Communication, 8(1).
Ha, J., & Jang, S. (2012). The effects of dining atmospherics on behavioral intentions
through quality perception. Journal of Services Marketing, 26(3), 204– 215.
Haghighi, M., Dorosti, A., Rahnama, A., & Hoseinpour, A. (2012). Evaluation of
factors affecting customer loyalty in the restaurant industry. African Journal of
Business Management, 6(14), 5039-5046.
Hair, J. F., Bush, R. P., & Ortinau, D. J. (2002). Marketing research (2nd ed.). New
York: McGraw-Hill.

Factors of Influencing Customer’s Return Patronage in Café in Klang Valley
Page 108 of 145
Hair, J. F., Money, A. H., Samouel, P., & Page, M. (2007). Research methods for
business. Chichester: John Willey & Sons Ltd.
Hampton, K. N., & Gupta, N. (2008). Community and social interaction in the
wireless city: Wi-fi use in public and semi-public spaces. New Media &
Society, 10(6), 831-850.
Han, H., & Kim, W. (2009). Outcomes of relational benefits: restaurant customers’
perspective. Journal of Travel and Tourism Marketing, 26(2), 820-835.
Han, H., & Ryu, K. (2006). Moderating role of personal characteristics in forming
restaurant customers’ behavioral intentions: an upscale restaurant setting.
Journal of Hospitality & Leisure Marketing, 15(4), 25-54.
Han, H., & Ryu, K. (2009). The roles of the physical environment, price perception,
and customer satisfaction in determining customer loyalty in the restaurant
industry. Journal of Hospitality & Tourism Research, 33(4), 487-510.
Hansen, K. V., Jensen, Q., & Gustafsson, I. G. (2005). The meal experience of a la
carte restaurant customers. Scandinavian Journal Hospitality Tourism, 5(2),
135-151.
Hartline, M. D., & Jones, K. C. (1996). Employee performance cues in a hotel service
environment: Influence on perceived service quality, value and word of mouth
intentions. Journal of Business Research, 35(3), 207-15.
Hellier, P. K., Geursen, G. M., Carr, R. A., & Rickard, J. A. (2003). Customer
repurchase intention: a general structural equation model. European Journal of
Marketing, 37(11), 1762-1800.

Factors of Influencing Customer’s Return Patronage in Café in Klang Valley
Page 109 of 145
Hightower, R., Brady, M. K., & Baker, T. L. (2002). Investigating the role of physical
environment in hedonic service consumption: an exploratory study of sporting
events. Journal of Business Research, 55(4), 697-707.
Holbrook, M. B., & Hirschman, E. C. (1982). The experiential aspects of
consumption: Consumer fantasies, feelings and fun. Journal of Consumer
Research, 9(2), 132-140.
Holmes, H. (2004). Coffee shop. Retrieved September 2, 2014 from
http://www.sbdcnet.org/small-business-research-reports/coffee-shop
Hossain, M. M. (2014). Pervasiveness of SERVQUAL and its potential for the
standards for functional quality of service. International Journal of Services
and Standards, 9(1), 67-83.
Hui, M. K., Dube, L., & Chebat, J. (1997). The impact of music on consumer’s
eaction to waiting for services. Journal of Retailing, 73(1), 87-104.
Hume, M., Mort, G.S., & Winzar, H. (2007). Exploring repurchase intention in a
performing arts context: who comes and why do they come back?.
International Journal of Nonprofit and Voluntary Sector Marketing, 12(2),
135-148.
Hussey, J., & Hussey, R. (1997). Business research: A practical guide for
undergraduate and postgraduate students. London: Macmillan Business.
Hutchings, J. B. (1994). Food Colour and Appearance (2nd ed.). New York: Springer
Publishing Company.
Imram, N. (1999). The role of visual cues in consumer perception and acceptance of a
food product. Nutrition and Food Science, 99(5), 224-228.

Factors of Influencing Customer’s Return Patronage in Café in Klang Valley
Page 110 of 145
Imrie, B. C., Durden, G., & Cadogan, J. W. (2000). Towards a conceptualisation of
service quality in the global market arena. Advances in International
Marketing, 10(1), 143-162.
Internet World Stats. (2014). Malaysia internet usage stats and marketing report.
Retrieved September 2, 2014 from
http://www.internetworldstats.com/asia/my.htm
Ismail, A., Ridzuan, A. A., Rose, N. I. R., Abdullah, M. M. B., Rahman, M. S., &
Francis, S. K. (2013). Examining the relationship between service quality and
customer satisfaction in military peacekeeping missions. Journal of Industrial
Engineering and Management, 6(2), 654-667.
Jang, S. C., & Namkung, Y. (2009). Perceived quality, emotions, and behavioral
intentions: Application of an extended Mehrabian–Russell model to
restaurants. Journal of Business Research, 62, 451-460.
Jangga, R., Sahari, N., & Basir, N. M. (2012). Factors determining the level of
satisfaction experienced by customers who visit family chain restaurants.
Paper presented at the 3rd International Conference on Business and Economic
Research, Bandung, Indonesia.
Jani, D., & Han, H. (2011). Investigating the key factors affecting behavioral
intentions: Evidence from a full-service restaurant setting. International
Journal of Contemporary Hospitality Management, 23(7), 1000-1018.
Jariyagodchakorn, M., Panichpathom, S., Ngarmyarn A., Sriboonjit, J., & Metapirak,
Y. (2013). Factors affecting repatronage intentions of male customers on
entertainment services. European Real Estate Society.
Factors of Influencing Customer’s Return Patronage in Café in Klang Valley
Page 111 of 145
Jiang, P., & Rosenbloom, B. (2005). Customer intention to return online: Price
perception, attribute-level performance, and satisfaction unfolding over time.
European Journal of Marketing, 39(1), 150-174.
Jin, Y., Bloch, P., & Cameron, G. T. (2002). A comparative study: Does the word-of
mouth communications and opinion leadership model fit epinions on the
Internet? Proceedings of the 35th Hawaii International Conference on System
Sciences.
John, A. G., Adiele, K., & Nkoro, F. (2013). Physical settings and patronage of three
star hotels in Nigeria’s Federal Capital Territory Abuja. International Journal
of Business Management & Economic Research. 4(3), 738-744.
Johns, N., & Tyas, P. (1996). Investigating the perceived components of the meal
experience, using perceptual gap methodology. Progress in Tourism and
Hospitality Research, 2(1), 15-26.
Johns, R. (2010). Likert items and scales. Retrieved October 5, 2014 from
http://www.surveynet.ac.uk/sqb/datacollection/likertfactsheet.pdf
Johnson, J., & Clydesdale, F. M. (1982). Perceived sweetness and redness in colored
sucrose solutions. Journal of Food Science, 47(3), 747-752.
Jones, H., & Farquhar, J. D. (2003). Contact management and customer loyalty.
Journal of Financial Services Marketing, 8(1), 71-78.
Kang, G. D., & James, J. (2004). Service quality dimensions: An examination of
Gronroos’s service quality model. Managing service quality, 14(4), 266-277.

Factors of Influencing Customer’s Return Patronage in Café in Klang Valley
Page 112 of 145
Kaur, M. (2013). Service quality in international fast food chains in Chandigarh:
Perceptions of customers. International Journal of Applied Research and
Studies, 2(7), 2278-9480.
Kaura, V., Datta, S. K., & Vyas, V. (2012). Impact of service quality on satisfaction
and loyalty: Case of two public sector banks. Vilakshan: The XIMB Journal of
Management, 9(2), 65–76.
Kerin, R., Jain, A., & Howard, D. J. (1992). Store shopping experience and consumer
price-quality-value perceptions. Journal of Retailing, 68(4), 376-397.
Khalid, S., Ahmed, M. A., & Ahmad, Z. (2013). Word-of-mouth communications: A
powerful contributor to consumers decision-making in healthcare market.
International Journal of Business and Management Invention, 2(5), 55-64.
Kim, W. G., & Moon, Y. J. (2009). Customers’ cognitive, emotional, and actionable
response to the servicescape: A test of the moderating effect of the restaurant
type. International Journal of Hospitality Management, 28, 144-156.
Kim, W. G., Lee, Y., & Yoo, Y. J. (2006). Predictors of relationship quality and
relationship outcomes in luxury restaurants. Journal of Hospitality and
Tourism Research, 30, 143-169.
Kim, W. G., Ng, C. Y. N., & Kim, Y. (2009). Influence of institutional DINESERV
on customer satisfaction, return intention and word-of-mouth. International
Journal of Hospitality Management, 28(1), 10–17.
Kim, Y. K., & Lee, H. R. (2011). Customer satisfaction using low cost carriers.
Tourism Management, 32(2), 235-243.

Factors of Influencing Customer’s Return Patronage in Café in Klang Valley
Page 113 of 145
Kivela, J., Inbakaran, R., & Reece, J. (1999). Consumer research in the restaurant
environment, Part 1: A conceptual model of dining satisfaction and return
patronage. International Journal of Contemporary Hospitality Management,
11(5), 205-222.
Knutson, B. J., & Patton, M. E. (1993). Restaurant can fine gold among silver hair:
Opportunities in the 55+ market. Journal of Hospitality & Leisure. 1(3), 79-91.
Kotler, P. (1973). Atmospherics as a marketing tool. Journal of Retailing, 49(4), 48-
64.
Kotler, P. (2003). Marketing Management (11th ed.). Upper Saddle River, NJ:
Prentice Hall.
Kuo, Y., Hu, T., & Yang, S. (2013). Effect of inertia and satisfaction in female online
shoppers on repurchase intention: The moderating roles of word of mouth and
alternative attention. Managing Service Quality: An International Journal,
23(3), 168-187.
Lehtinen, U., & Lehtinen, J. R. (1982). Service quality: a study of quality dimensions.
Unpublished working paper, Service Management Institute, Helsinki, 439-460.
Lewis, B. R., & McCann, P, (2004). Service failure and recovery: Evidence from the
hotel industry. International Journal of Contemporary Hospitality
Management, 16(1), 6-17.
Lewis, R. C., & Booms, B. (1983). The marketing aspects of service quality.
American Marketing Association Chicago, 99-104.
Factors of Influencing Customer’s Return Patronage in Café in Klang Valley
Page 114 of 145
Li, D., An, S., & Yang, K. (2008). Exploring Chinese consumer repurchasing
intention for services: an empirical investigation. Journal of Consumer
Behavior, 7(6), 448-460.
Liao, Y. Y., & Liaw, F. G. (2005). How cues in the multiple store environment
influence shopping mood and patronage satisfaction. Journal of Retailing.
Lim, H. (2010). Understanding American customer perceptions on Japanese food
and services in the U.S. Unpublished doctoral dissertation, University of
Nevada, Las Vegas.
Lin, C., Wu, Y., & Chen, J. V. (2013). Electronic word-of-mouth: The moderating
roles of product involvement and brand image. Proceedings of 2013
International Conference on Technology Innovation and Industrial
Management, 29-47.
Liu, Y., & Jang, S. C. (2009). Perceptions of Chinese restaurants in the U.S.: What
affects customer satisfaction and behavioral intentions? International Journal
of Hospitality Management, 28(3), 338-348.
Lymperopoulos, C., Chaniotakis, I. E., & Soureli, M. (2013). The role of price
satisfaction in managing customer relationships: the case of financial services.
Marketing Intelligence & Planning, 31(3), 216-228.
Macintosh, G., & Lockshin, L. S. (1997). Retail relationships and store loyalty: A
multi-level perspective. International Journal of Research in Marketing, 14(5),
487-497.
Malhotra, N. (2008). Completion time and response order effects in web surveys.
Public Opinion Quarterly, 72(5), 914-934.

Factors of Influencing Customer’s Return Patronage in Café in Klang Valley
Page 115 of 145
Mangold, W. G., & Babakus, E. (1991). Service quality: The front-stage perspective
vs the back-stage perspective. Journal of Services Marketing, 5(4), 59-70.
Mano, H., & Oliver, R. L. (1993). Assessing the dimensionality and structure of the
consumption experience: Evaluation, feeling, and satisfaction. Journal of
Consumer Research, 20(3), 451-466.
Manzo, J. (2014). Machines, people, and social interaction in “third wave”
coffeehouses. Journal of Arts and Humanities, 3(8).
Marinkovic, V., Senic, V., Ivkov, D., Dimitrovski, D., & Bjelic, M. (2013). The
antecedents of satisfaction and revisit intentions for full-service restaurants.
Marketing Intelligence & Planning, 32(3), 311-327.
Mattila, A. S., & Wirtz, J. (2001). Congruency of scent and music as a driver of in
store evaluations and behavior. Journal of Retailing, 77(2), 273-289.
McConnell, B., & Huba, J. (2007). Citizen marketers: When people are the message.
Chicago, IL: Kaplan Publishers.
McDougall, G., & Levesque, T. (2000). Customer satisfaction with services: Putting
perceived value into the equation. Journal of Services Marketing, 14(4), 392-
410.
McWilliams, M. (1993). Foods: Experimental Perspectives (2nd ed.). New York:
Maxwell Macmillan International.
Mehrabian, A., & Russell, J. A. (1974). An approach to environmental psychology.
Cambridge, MA: The MIT Press.
Factors of Influencing Customer’s Return Patronage in Café in Klang Valley
Page 116 of 145
Meyer, M. K., & Conklin, M. T. (1998). Variables affecting high school students’
perception of school foodservice. Journal of the American Dietetic
Association, 98(12), 1424–1431.
Moeller, S. (2010). Characteristics of services: A new approach uncovers their value.
Journal of Services Marketing, 24(5), 359-368.
Monroe, K. B. (1990). Pricing: Making profitable decisions (2nd ed.). New York:
McGraw-Hill Irwin.
Moore, M., & Carpenter, J. (2006). The effect of price as a marketplace cue. Journal
of Product & Brand Management, 15(4), 265-271.
Morin, S., Dube´, L., & Chebat, J. (2007). The role of pleasant music in
servicescapes: A test of the dual model of environmental perception. Journal
of Retailing, 83(1), 115-130.
Mosavi, S. A., & Ghaedi, M. (2013). Behavioural intention in the luxury fast food
restaurant. African Journal of Business Management, 7(18), 1845-1853.
Mukherjee, A., & Nath, P. (2005). An empirical assessment of comparative
approaches to service quality measurement. Journal of Services Marketing,
19(3), 174-184.
Murray, K. B. (1991). A test of services marketing theory: Consumer information
acquisition activities. Journal of Marketing, 55(1), 10-25.
Namkung, Y., & Jang, S. C. (2007). Does food quality really matter in restaurants? Its
impact on customer satisfaction and behavioral intentions. Journal of
Hospitality and Tourism Research, 31(3), 387–410.

Factors of Influencing Customer’s Return Patronage in Café in Klang Valley
Page 117 of 145
Namkung, Y., & Jang, S. C. (2008). Are highly satisfied restaurant customers really
different? A quality perception perspective. International Journal of
Contemporary Hospitality Management, 20(2), 142–155.
Namkung, Y., & Jang, S. C. (2010). Effects of perceived service fairness on
emotions, and behavioral intentions in restaurants. European Journal of
Marketing, 44(9), 1233-1259.
North, A. C., & Hargreaves, D. J. (1996). The effects of music on responses to a
dining area. Journal of Environmental Psychology, 16(1), 55–64.
North, A. C., & Hargreaves, D. J. (1998). The effect of music on atmosphere and
purchase intentions in a cafeteria. Journal of Applied Psychology, 28(4), 2254–
2273.
Oakes, S., & North, A. C. (2008). Reviewing congruity effects in the service
environment musicscape. International Journal of Service Industry
Management, 19(1), 63-82.
Oh, H. (1999). Service quality, customer satisfaction, and customer value: A holistic
perspective. International Journal of Hospitality Management, 18(1), 67-82.
Oldenburg, R. (1999). The great good place: Café, coffee shops, bookstores, bars,
hair salons, and other hangouts at the heart of a community. New York, NY:
Marlowe.
Pan, Y., & Zinkhan, G. M. (2006). Determinants retail patronage: A meta-analytical
perspective. Journal of Retailing, 82, 229-243.

Factors of Influencing Customer’s Return Patronage in Café in Klang Valley
Page 118 of 145
Pandey, A. C. & Pandey, M. K. (2013). Impact of lifestyle on brand preference of
buyer behavior: A case study of Uttarakhand. International Monthly Refereed
Journal of Research in Management and Technology, 2, 151-165.
Parasuraman, A., Zeithaml, V. A., & Berry, L. L. (1985). A conceptual model of
service quality and implications for future research. Journal of Marketing, 49,
41-50.
Parasuraman, A., Zeithaml, V. A., & Berry, L. L. (1994). Alternative scales for
measuring service quality: A comparative assessment based on psychometric
and diagnostic criteria. Journal of Retailing, 70(3), 201-230.
Park, J. H., & Suh, B. (2013). The impact of opinion leadership on the attitude change
by the direction of word-of-mouth under the online social networking service
environment. Journal of Society for e-Business Studies, 18(2).
Patterson, P. G., & Spreng, R. A. (1997). Modelling the relationship between
perceived value, satisfaction and repurchase intentions in a business-to-
business services context: an empirical examination. International Journal of
Service Industry Management, 8(5), 414–427.
Pedraja, M., & Yague, J. (2001). What information do customers use when choosing
restaurant?. International Journal of Contemporary Hospitality Management,
13(6), 316-318.
Peri, C. (2006). The universe of food quality. Food Quality and Preference, 17(1-2),
3-8.
Factors of Influencing Customer’s Return Patronage in Café in Klang Valley
Page 119 of 145
Pettijohn, L. S., Pettijohn, C. E., & Luke, R. H. (1997). An evaluation of fast food
restaurant satisfaction: Determinants, competitive comparisons and impact on
future patronage. Journal of Restaurant and foodservice Marketing, 2(3), 3-
20.
Prabha, R. (2012). Perceived service quality in restaurant services: Evidence from
Mauritius. International Journal of Management and Marketing Research,
5(3).
Raajpoot, N. A. (2002). TANGSERV: A multiple item scale for measuring tangible
quality in food service industry. Journal of Foodservice Business Research,
5(2), 109-127.
Ramapuram, T. E., & Batra, A. (2006). The effect of restaurant attributes on
customers’ overall perception and return patronage: A case study on Ebony
restaurant, Bangalore, India. International Journal of Tourism and
Hospitality Systems, 1(1), 14-26.
Ramly, A. S. M., Ahmad, R., & Ahmadin, S. N. (2003). Factors influencing
customers patronizing mamak restaurants – a survey in Shah Alam. Paper
presented at the Conference on Second National Educators Conference.
Rao, A. R., & Monroe, K. B. (1989). The effect of price, brand name, and store name
on buyers’ perceptions product quality: an integrative review. Journal of
Marketing Research, 26(3), 351-357.
Reich, A. Z., McCleary, K. W., Tepanon, Y., & Weaver, P. A. (2005). The impact of
product and service quality on brand loyalty: An exploratory investigation of
quick-service restaurants. Journal of Foodservice Business Research, 8(3), 35-
53.

Factors of Influencing Customer’s Return Patronage in Café in Klang Valley
Page 120 of 145
Reimer, A., & Kuehn, R. (2005). The impact of servicescape on quality perception.
European Journal of Marketing, 39(7-8), 785-808.
Ribbink, D., Van Riel, A. C. R., Liljander, V., & Streukens, S. (2004). Comfort your
online customer: Quality, trust and loyalty on the Internet. Managing Service
Quality: An International Journal, 14(6), 446-456.
Riemer, H., & Reichel, A. (2000). Assesing service quality in the Israeli tourism
industry using SERVQUAL. Proceedings of Fifth Annual Graduate
Education and Graduate Students Research Conference in Hospitality &
Tourism, 273-280.
Robson, A. K. (1999). Turning the tables: The psychology of design for high-volume
restaurant. Cornell Hotel and Restaurant Administration Quarterly, 40(3), 56-
63.
Russell, J. A., & Pratt, G. (1980). A description of the affective quality attributed to
environments. Journal of Personality and Social Psychology, 38, 311-322.
Ryu, G., & Feick, L. (2007). A penny for your thoughts: Referral reward programs
and referral likelihood. Journal of Marketing, 71(1), 84-94.
Ryu, K., & Han, H. (2010). Influence of the quality of food, service and physical
environment on customer satisfaction in quick-casual restaurants: moderating
role of perceived price. Journal of Hospitality & Tourism Research, 34(3),
310-329.
Ryu, K., Han, H., & Jang S. (2010). The effect of hedonic and utilitarian values on
customers’ satisfaction and behavioral intention in the fast-casual restaurant
industry. International Journal of Contemporary Hospitality Management,
22(3), 416-432.

Factors of Influencing Customer’s Return Patronage in Café in Klang Valley
Page 121 of 145
Ryu, K., Lee, H. R., & Kim, W. G. (2012). The influence of the quality of the
physical environment, food and service on restaurant image, customer
perceived value, customer satisfaction and behavioral intentions. International
Journal of Contemporary Hospitality Management, 24(2), 200-223.
Saunders, M., Lewis, P. & Thornhill, A. (2009). Research methods for business
students (5th ed.). Harlow: FT Prentice Hall.
Sefian, M.N., Jaini, A., Sharudin, N. N., & Abdullah, M. H. (2013). Determining
factors that influence customers repatronage intention: The case study of
Radix Fried Chicken (RFC), the local homegrown fast food chain restaurant
in Malaysia. Paper presented at the second IBSM, International Conference
on Business and Management, Chiangmai, Bangkok.
Schiffman, L. G., & Kanuk, L. L. (2004). Consumer behavior (8th ed.). Upper Saddle
River, NJ: Pearson Prentice Hall.
Shaharudin, M. R., Hassan, A. A., Mansor, S. W., Elias, S. J., Harun, E. H., Aziz, N.
A. (2010). The relationship between extrinsic attributes of product quality with
brand loyalty on Malaysia national brand motorcycle/scooter. Canadian Social
Science, 6(3): 170-182.
Shaikh, U. A. A., & Khan, N. U. R. (2011). Impact of service quality on customer
satisfaction: Evidences from the restaurant industry in Pakistan. Management
& Marketing, 9(2).
Shamsudin, M. N., Mohamed, Z., Abdullah, A. M., & Radam, A. (2011). Expenditure
patterns on foodservice in Malaysia. Journal of Tourism, Hospitality and
Culinary Arts.

Factors of Influencing Customer’s Return Patronage in Café in Klang Valley
Page 122 of 145
Srivastava, R. K., & Natu, A. (2014). A 7Ps model of retail patronage: A meta-
synthesis of contemporary research. International Journal of Retail
Management and Research, 4(1), 1-22.
Stern, B. (1994). A revised model for advertising: Multiple dimensions of the source,
the message, and the recipient. Journal of Advertising, 23(2), 5-16.
Sulek, J. M., & Hensley, R. L. (2004). The relative importance of food, atmosphere
and fairness of wait. Cornell Hotel and Restaurant Administration Quarterly,
45(3), 235-247.
Sureshchander, G. S., Rajesndran, C., & Kamalanabhan, T. J. (2001). Customer
perceptions of service quality: A critique. Total Quality Management, 12(1),
111-124.
Susskind, A., & Viccari, A. (2011). A look at the relationship between service
failures, guest satisfaction, and repeat-patronage intentions of casual dining
guests [Electronic version]. Cornell Hospitality Quarterly, 52(4), 438-444.
Sweeney, J. C. (1994). An investigation of a theoretical model of consumer
perceptions of value. Unpublished doctoral dissertation, Curtain University of
Technology.
Sweeney, J. C., & Soutar, G. N. (2001). Consumer perceived value: the development
of a multiple item scale. Journal of Retailing, 77, 203–220.
Sweeney, J. C., Soutar, G. N., & Johnson, L. W. (1997). Retail service quality and
perceived value. Journal of Retailing and Consumer Services, 4(1), 39-48.

Factors of Influencing Customer’s Return Patronage in Café in Klang Valley
Page 123 of 145
Tag-Eldeen, A. A. (2012). Assessment of electronic word-of-mouth on customers’
purchasing decisions of hospitality services in Egypt. 2nd Advances in
Hospitality and Tourism Marketing and Management Conference.
Tan, B., & Yeap, P. (2012). What drives green restaurant patronage intention?
International Journal of Business and Management, 7(2).
Tan, Q., Oriade, A., & Fallon, P. (2014). Service quality and customer satisfaction in
Chinese fast food sector: A proposal for CFFRSERV. Advances in Hospitality
and Tourism Research, 2(1), 30-53.
Tellis, G., & Gaeth, G. (1990). Best value, price-seeking, and price aversion: The
impact of information and learning on consumer choices. Journal o
Marketing, 54(2), 34–45.
The Malaysian Food Industry. (2012). Market Watch 2012. Retrieved September 1,
2014 from
http://www.malaysia.ahk.de/fileadmin/ahk_malaysia/Market_reports/The_Ma
laysian_Food_Industry.pdf
Threevitaya, S. (2003). Factors that influenced the decisions of customers to dine at
selected restaurants in Bangkok, Thailand. Unpublished doctoral dissertation,
University of Wisconsin.
Ting, L. H., Boo, H. C., & Othman, M. (2011). Development of service quality
dimensions in Malaysia: The case of a multicultural society. Segi Review, 4(1),
93-108.
Trusov, M., Bucklin, R. E., & Pauwels, K. (2009). Effects of word-of-mouth versus
traditional marketing: Findings from an Internet social networking site. Journal
of Marketing, 73, 90-102.
Factors of Influencing Customer’s Return Patronage in Café in Klang Valley
Page 124 of 145
Tse, D. K., & Wilton, P. C. (1988). Models of consumer satisfaction formation: An
extension. Journal of Marketing Research, 25, 202-212.
Turley, L. W., & Milliman, R. E. (2000). Atmospheric effects on shopping behavior:
a review of the experimental evidence. Journal of Business Research, 49(2),
193-211.
Varki, S., & Colgate, M. (2001). The role of price perceptions in an integrated model
of behavioral intentions. Journal of Service Research, 3(3), 232-240.
Wakefield, K. L., & Blodgett, J. G. (1996). The effect of the servicescape on
customers’ behavioral intentions in leisure service settings. Journal of Services
Marketing, 10(6), 45-61.
Wakefield, K. L., & Baker, J. (1998). Excitement at the mall: Determinants and
effects on shopping response. Journal of Retailing, 74(4), 515-539.
Wathen, C. N., & Burkell, J. (2002). Believe it or not: Factors influencing credibility
on the web. Journal of the American Society for Information Science &
Technology, 53(2), 134-144.
Waxman, L. (2006). The coffee shop: Social and physical factors influencing place
attachment. Journal of Interior Design, 31(3), 35-53.
Woldoff, R. A., Lozzi, D. M., & Dilks, L. M. (2013). The social transformation of
coffee houses: The emergence of chain establishments and the private nature
of usage. International Journal of Social Science Studies, 1(2), 205-218.
Factors of Influencing Customer’s Return Patronage in Café in Klang Valley
Page 125 of 145
Woo, G. K., Ng, C. Y. N., & Kim, Y. S. (2009). Influence of institutional
DINESERV on customer satisfaction, return intention and word-of-mouth.
International Journal of Hospitality Management, 28, 10-17.
Yang, H. W., & Chang, K. F. (2011). A comparison of service experience on
repatronage intention between department stores and hypermarkets in Taiwan.
African Journal of Business Management, 5(19), 7818-7827.
Yap, S. F., & Kew, M. L. (2007). Service quality and customer satisfaction:
Antecedents of customer’s re-patronage intentions. Sunway Academic Journal,
4, 59-73.
Yavas, U. (2003). A multi-attribute approach to understanding shopper segments.
International Journal of Retail & Distribution Management, 31(11), 541-548.
Yuksel, A., & Yuksel, F. (2002). Measurement of tourist satisfaction with restaurant
services: A segment-based approach. Journal of Vacation Marketing, 9(1), 52-
68.
Zeithaml, V. A. (1988). Consumer perceptions of price, quality, and value: A means-
end model and synthesis of evidence. Journal of Marketing, 52(3), 2-22.
Zeithaml, V. A., Bitner, M. J., & Gremler, D. D. (2009). Services Marketing:
Integrating Customer Focus across the Firm (5th ed.). Boston, MA: McGraw-
Hill.
Zikmund, W. G., Babin, B. J., Carr, J. C., & Griffin, M. (2010). Business research
methods (10th ed.). Canada: South-Western, Cengage Learning.
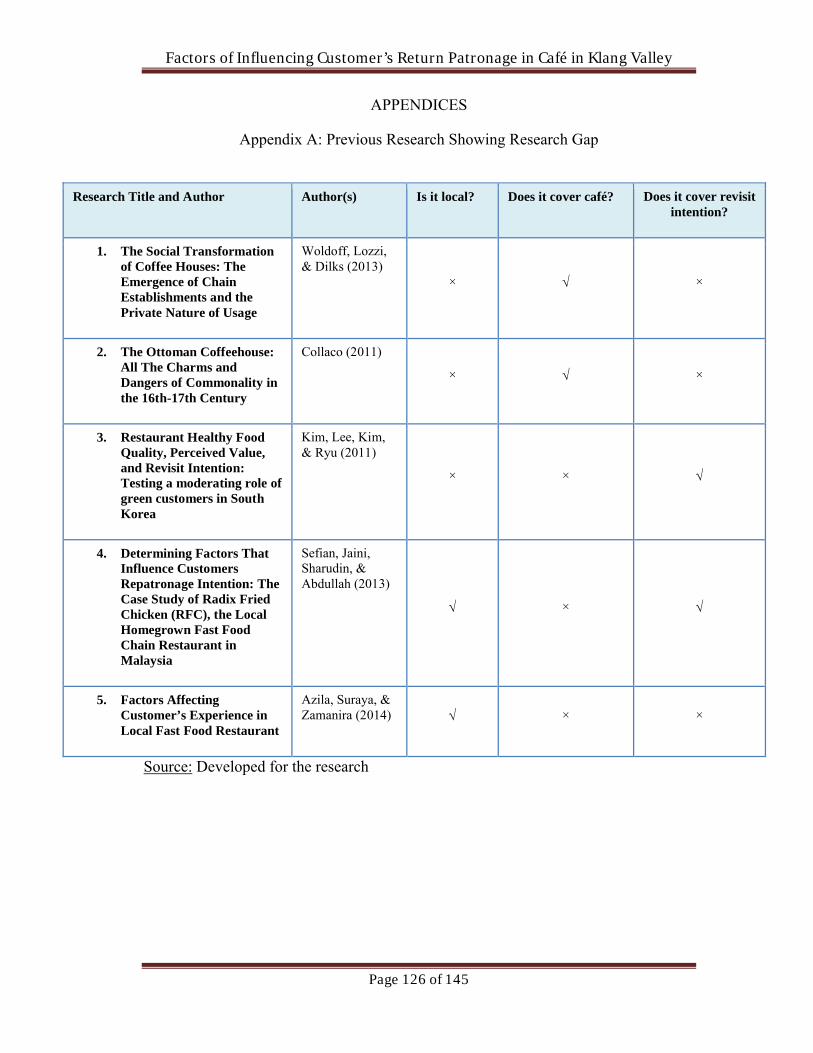
Factors of Influencing Customer’s Return Patronage in Café in Klang Valley
Page 126 of 145
APPENDICES
Appendix A: Previous Research Showing Research Gap
Source: Developed for the research
Research Title and Author Author(s) Is it local? Does it cover café? Does it cover revisit intention?
1. The Social Transformation of Coffee Houses: The Emergence of Chain Establishments and the Private Nature of Usage
Woldoff, Lozzi, & Dilks (2013)
× ×
2. The Ottoman Coffeehouse: All The Charms and Dangers of Commonality in the 16th-17th Century
Collaco (2011)
× ×
3. Restaurant Healthy Food Quality, Perceived Value, and Revisit Intention: Testing a moderating role of green customers in South Korea
Kim, Lee, Kim, & Ryu (2011)
× ×
4. Determining Factors That Influence Customers Repatronage Intention: The Case Study of Radix Fried Chicken (RFC), the Local Homegrown Fast Food Chain Restaurant in Malaysia
Sefian, Jaini, Sharudin, & Abdullah (2013)
×
5. Factors Affecting Customer’s Experience in Local Fast Food Restaurant
Azila, Suraya, & Zamanira (2014) × ×

Factors of Influencing Customer’s Return Patronage in Café in Klang Valley
Page 127 of 145
Appendix B: Questionnaire
UNIVERSITI TUNKU ABDUL RAHMANFACULTY OF ACCOUNTANCY AND MANAGEMENT
Bachelor of International Business (HONS) (IN)
Survey on Factors Influencing Customer’s Return Patronage to Café in Klang Valley
Survey Questionnaire
Dear Respondents,
We are students from Universiti Tunku Abdul Rahman (UTAR), Faculty of
Accountancy and Management, pursuing the degree in Bachelor of International
Business (HONS) (IN), currently conducting a research on “Factors Influencing
Return Patronage to Café in Klang Valley” for our final year project. The objective of
this research is to understand the factors that affecting patrons revisit to café twice
and above in Klang Valley.
We sincerely hope that you will take a few minutes to complete this questionnaire.
Your responses are important for us to complete our study. Your participation is on
voluntary basis.
Please take note that this survey is strictly for academic purposes and we would like
to assure you that all the information collected will remain PRIVATE AND
CONFIDENTIAL. We greatly appreciate you for taking the time, efforts and
participation in completing this questionnaire. Thank you for cooperation.
NAME STUDENT ID NO.HUI HUE YEOW 11UKB05075LAU HENG KIT 11UKB05252NG YI-YEN 11UKB02821

Factors of Influencing Customer’s Return Patronage in Café in Klang Valley
Page 128 of 145
Section A: Demographic Profile
Instruction: Please read EACH question carefully and provide the correct
information by placing a TICK (√) in the boxes provided.
Q1. Gender
Male
Female
Q2. Age
Less than 21 years old
21 – 30 years old
31 – 40 years old
41 – 50 years old
51 – 60 years old
More than 60 years old
Q3. Race
Malay
Chinese
Indian
Others (Please state: ____________ )
Q4. Marital Status
Single
Married

Factors of Influencing Customer’s Return Patronage in Café in Klang Valley
Page 129 of 145
Q5. Monthly Income
Less than RM800
RM801 – RM1,300
RM1,301 – RM1,800
RM1,801 – RM2,300
RM2,301 – RM2,800
RM2,801 – RM3,200
More than RM3,200
Q6. How many times have you been to this (any particular) café?
1st Visit
2nd Visit
More than twice

Factors of Influencing Customer’s Return Patronage in Café in Klang Valley
Page 130 of 145
Section B: Construct Measurement
INSTRUCTION: Based on the statement, please CIRCLE the most suitable answer to indicate the importance rating of attribute with the statement by placing a circle on a scale of 1 to 5.
Question
Service Quality(Comparison between customer expectation and his/her perception of the firm) S
tron
gly
Dis
agre
e
Dis
agre
e
Neu
tral
Agr
ee
Str
ongl
y A
gree
1. The café has clean restrooms. 1 2 3 4 5
2. The café has a dining area which is easy for me to move around in.
1 2 3 4 5
3. The café staffs provide dependable and consistent service.
1 2 3 4 5
4. The café serves me within the time promised. 1 2 3 4 5
5. The staff shifts to help each other to maintain the speed of service during peak hours.
1 2 3 4 5
6. The staffs are attentive. 1 2 3 4 5
7. The café provides prompt service. 1 2 3 4 5
8. The staffs seemed well trained, competent and experienced.
1 2 3 4 5
9. The staffs have knowledge about its food and beverages offerings.
1 2 3 4 5
10. The staffs are sensitive to individual needs and wants rather than always relying on policy and procedures.
1 2 3 4 5
11. The staffs are sympathetic and reassuring if something is wrong.
1 2 3 4 5
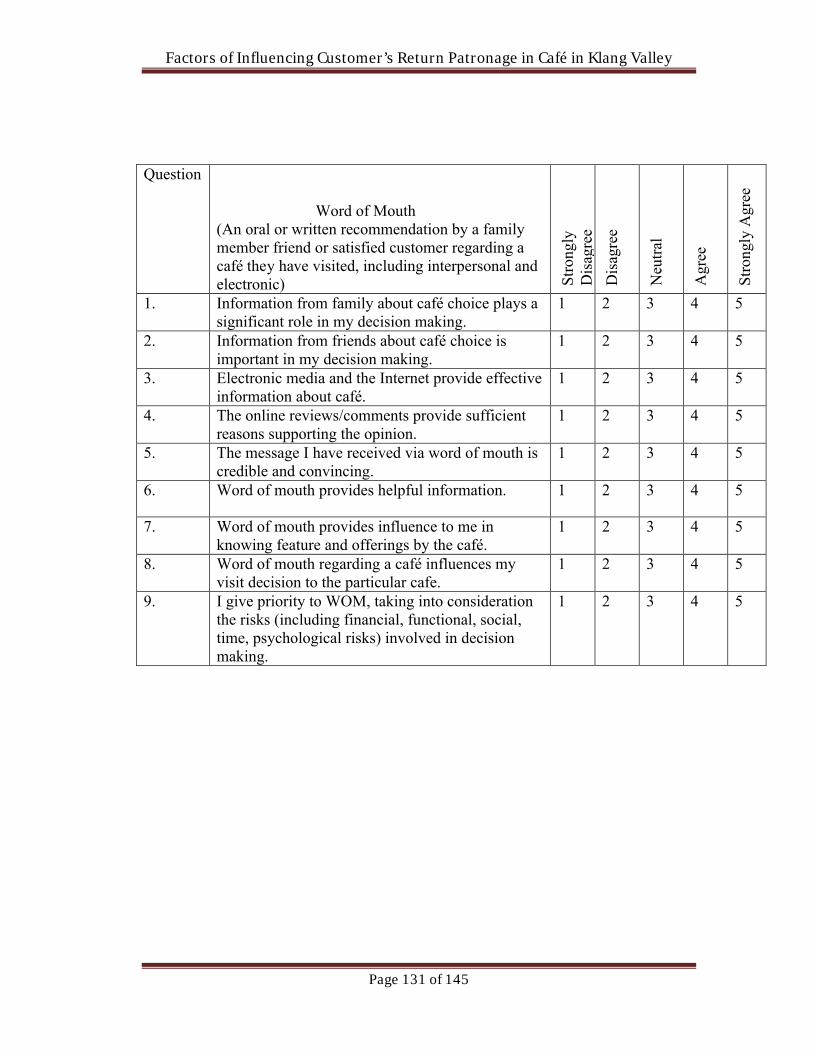
Factors of Influencing Customer’s Return Patronage in Café in Klang Valley
Page 131 of 145
Question
Word of Mouth(An oral or written recommendation by a family member friend or satisfied customer regarding a café they have visited, including interpersonal and electronic) S
tron
gly
Dis
agre
e
Dis
agre
e
Neu
tral
Agr
ee
Str
ongl
y A
gree
1. Information from family about café choice plays a significant role in my decision making.
1 2 3 4 5
2. Information from friends about café choice is important in my decision making.
1 2 3 4 5
3. Electronic media and the Internet provide effective information about café.
1 2 3 4 5
4. The online reviews/comments provide sufficient reasons supporting the opinion.
1 2 3 4 5
5. The message I have received via word of mouth is credible and convincing.
1 2 3 4 5
6. Word of mouth provides helpful information. 1 2 3 4 5
7. Word of mouth provides influence to me in knowing feature and offerings by the café.
1 2 3 4 5
8. Word of mouth regarding a café influences my visit decision to the particular cafe.
1 2 3 4 5
9. I give priority to WOM, taking into consideration the risks (including financial, functional, social, time, psychological risks) involved in decision making.
1 2 3 4 5

Factors of Influencing Customer’s Return Patronage in Café in Klang Valley
Page 132 of 145
Question
Value for money(A cognitive opportunity cost between the perceived quality and sacrificed in terms of monetary exchange concept like money) S
tron
gly
Dis
agre
e
Dis
agre
e
Neu
tral
Agr
ee
Str
ongl
y A
gree
1. The food I had last time was very good value for the money.
1 2 3 4 5
2. The price charged for my food last time was very acceptable.
1 2 3 4 5
3. At the price I paid, the food was very reasonable. 1 2 3 4 5
4. The food at this café appears to be a bargain. 1 2 3 4 5
5. I consider the food I received to be a good deal. 1 2 3 4 5
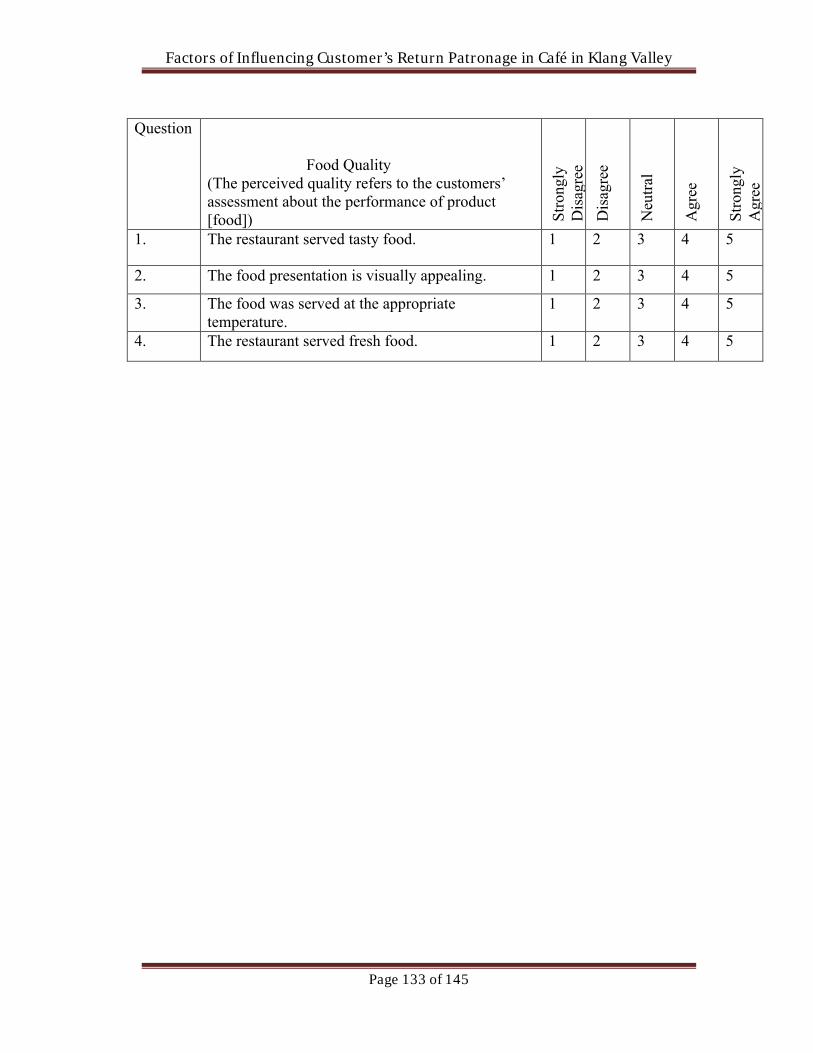
Factors of Influencing Customer’s Return Patronage in Café in Klang Valley
Page 133 of 145
Question
Food Quality(The perceived quality refers to the customers’ assessment about the performance of product [food]) S
tron
gly
Dis
agre
e
Dis
agre
e
Neu
tral
Agr
ee
Str
ongl
y A
gree
1. The restaurant served tasty food. 1 2 3 4 5
2. The food presentation is visually appealing. 1 2 3 4 5
3. The food was served at the appropriate temperature.
1 2 3 4 5
4. The restaurant served fresh food. 1 2 3 4 5

Factors of Influencing Customer’s Return Patronage in Café in Klang Valley
Page 134 of 145
Question
Environment(Ambient Condition - Different musical conditions influenced subjects’ perception about the cafeteria)(Physical Environment – Observable features of the situation such as geographical location, setting, sound, odor, light and temperature) E
xtre
mel
y U
nim
port
ant
Uni
mpo
rtan
t
Neu
tral
Impo
rtan
t
Ext
rem
ely
Impo
rtan
t
1. Music was played in café. 1 2 3 4 5
2. The type of music being played in café was appropriate.
1 2 3 4 5
3. The music played in café creates positive emotions.
1 2 3 4 5
4. The attractiveness of color of the interior of café. 1 2 3 4 5
5. The seating capacity of the café. 1 2 3 4 5
6. The seating arrangement of the café. 1 2 3 4 5

Factors of Influencing Customer’s Return Patronage in Café in Klang Valley
Page 135 of 145
Section C: Return Patronage
INSTRUCTION: Based on the statement, please CIRCLE the most suitable answer to indicate the importance rating of attribute with the statement by placing a circle on a scale of 1 to 5.
Question
Return patronage(Customer’s willingness is conveyed to commit into repeat patronage to preferred restaurant and provide good comments regarding the restaurant to social influence, like family or friends in future.) S
tron
gly
Dis
agre
e
Dis
agre
e
Neu
tral
Agr
ee
Str
ongl
y A
gree
1. I would like to come back to this café. 1 2 3 4 5
2. I would consider revisiting this café in the future. 1 2 3 4 5
3. I would recommend this café to my friends or others.
1 2 3 4 5
4. I would say positive things about this café to others.
1 2 3 4 5
5. I would encourage others to visit this café. 1 2 3 4 5

Factors of Influencing Customer’s Return Patronage in Café in Klang Valley
Page 136 of 145
Appendix C: Pilot Test
Service Quality
Scale: ALL VARIABLES
Word of Mouth
Scale: ALL VARIABLES
Case Processing Summary
N %
Cases
Valid 30 100.0
Excludeda 0 .0
Total 30 100.0
a. Listwise deletion based on all variables in the procedure.
Reliability Statistics
Cronbach's Alpha
N of Items
.772 9
Case Processing Summary
N %
Cases
Valid 30 100.0
Excludeda 0 .0
Total 30 100.0
a. Listwise deletion based on all variables in the procedure.
Reliability Statistics
Cronbach's Alpha
N of Items
.803 11

Factors of Influencing Customer’s Return Patronage in Café in Klang Valley
Page 137 of 145
Value for Money (Price)
Scale: ALL VARIABLES
Case Processing Summary
N %
Cases
Valid 30 100.0
Excludeda 0 .0
Total 30 100.0
a. Listwise deletion based on all variables in the procedure.
Reliability Statistics
Cronbach's Alpha
N of Items
.839 5
Food Quality
Case Processing Summary
N %
Cases
Valid 30 100.0
Excludeda 0 .0
Total 30 100.0
a. Listwise deletion based on all variables in the procedure.
Reliability Statistics
Cronbach's Alpha
N of Items
.842 4

Factors of Influencing Customer’s Return Patronage in Café in Klang Valley
Page 138 of 145
Environment
Case Processing Summary
N %
Cases
Valid 30 100.0
Excludeda 0 .0
Total 30 100.0
a. Listwise deletion based on all variables in the procedure.
Reliability Statistics
Cronbach's Alpha
N of Items
.758 6
Return Patronage
Case Processing Summary
N %
Cases
Valid 30 100.0
Excludeda 0 .0
Total 30 100.0
a. Listwise deletion based on all variables in the procedure.
Reliability Statistics
Cronbach's Alpha
N of Items
.843 5
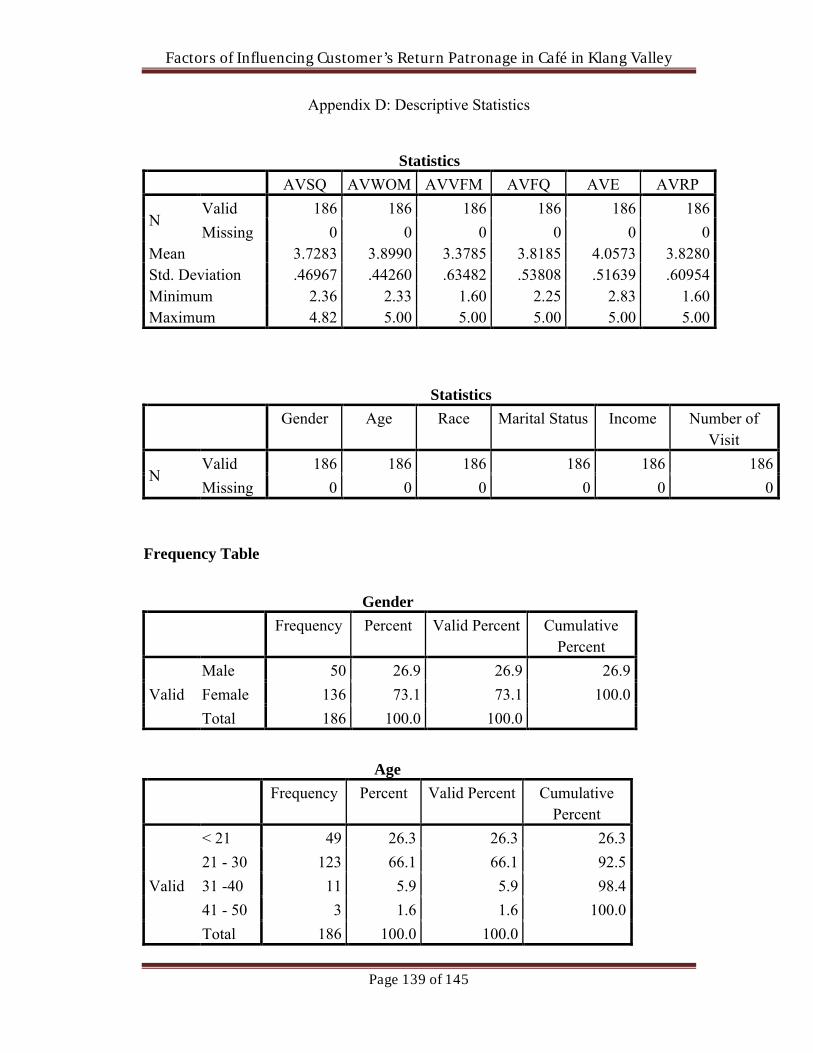
Factors of Influencing Customer’s Return Patronage in Café in Klang Valley
Page 139 of 145
Appendix D: Descriptive Statistics
Statistics
AVSQ AVWOM AVVFM AVFQ AVE AVRP
NValid 186 186 186 186 186 186
Missing 0 0 0 0 0 0Mean 3.7283 3.8990 3.3785 3.8185 4.0573 3.8280Std. Deviation .46967 .44260 .63482 .53808 .51639 .60954Minimum 2.36 2.33 1.60 2.25 2.83 1.60Maximum 4.82 5.00 5.00 5.00 5.00 5.00
Statistics
Gender Age Race Marital Status Income Number of Visit
NValid 186 186 186 186 186 186
Missing 0 0 0 0 0 0
Frequency Table
Gender
Frequency Percent Valid Percent Cumulative Percent
Valid
Male 50 26.9 26.9 26.9
Female 136 73.1 73.1 100.0
Total 186 100.0 100.0
Age
Frequency Percent Valid Percent Cumulative Percent
Valid
< 21 49 26.3 26.3 26.3
21 - 30 123 66.1 66.1 92.5
31 -40 11 5.9 5.9 98.4
41 - 50 3 1.6 1.6 100.0
Total 186 100.0 100.0

Factors of Influencing Customer’s Return Patronage in Café in Klang Valley
Page 140 of 145
Race
Frequency Percent Valid Percent Cumulative Percent
Valid
Malay 11 5.9 5.9 5.9
Chinese 163 87.6 87.6 93.5
Indian 2 1.1 1.1 94.6
Others 10 5.4 5.4 100.0
Total 186 100.0 100.0
Marital Status
Frequency Percent Valid Percent Cumulative Percent
Valid
Single 176 94.6 94.6 94.6
Married 10 5.4 5.4 100.0
Total 186 100.0 100.0
Income
Frequency Percent Valid Percent Cumulative Percent
Valid
< 800 123 66.1 66.1 66.1
801 - 1300 12 6.5 6.5 72.6
1301 - 1800 6 3.2 3.2 75.8
1801 - 2300 8 4.3 4.3 80.1
2301 - 2800 4 2.2 2.2 82.3
2801 - 3300 3 1.6 1.6 83.9
> 3301 30 16.1 16.1 100.0
Total 186 100.0 100.0
Number of Visit
Frequency Percent Valid Percent Cumulative Percent
Valid
1st visit 61 32.8 32.8 32.8
2nd visit 32 17.2 17.2 50.0
more than twice 93 50.0 50.0 100.0
Total 186 100.0 100.0

Factors of Influencing Customer’s Return Patronage in Café in Klang Valley
Page 141 of 145
Appendix E: Reliability Test
Service Quality
Scale: ALL VARIABLES
Case Processing Summary
N %
Cases
Valid 186 100.0
Excludeda 0 .0
Total 186 100.0
a. Listwise deletion based on all variables in the procedure.
Reliability Statistics
Cronbach's Alpha
N of Items
.841 11
Word of Mouth
Case Processing Summary
N %
Cases
Valid 186 100.0
Excludeda 0 .0
Total 186 100.0
a. Listwise deletion based on all variables in the procedure.
Reliability Statistics
Cronbach's Alpha
N of Items
.785 9

Factors of Influencing Customer’s Return Patronage in Café in Klang Valley
Page 142 of 145
Value for Money (Price)
Case Processing Summary
N %
Cases
Valid 186 100.0
Excludeda 0 .0
Total 186 100.0
a. Listwise deletion based on all variables in the procedure.
Reliability Statistics
Cronbach's Alpha
N of Items
.853 5
Food Quality
Case Processing Summary
N %
Cases
Valid 186 100.0
Excludeda 0 .0
Total 186 100.0
a. Listwise deletion based on all variables in the procedure.
Reliability Statistics
Cronbach's Alpha
N of Items
.739 4
Environment
Case Processing Summary
N %
Cases
Valid 186 100.0
Excludeda 0 .0
Total 186 100.0

Factors of Influencing Customer’s Return Patronage in Café in Klang Valley
Page 143 of 145
a. Listwise deletion based on all variables in the procedure.
Reliability Statistics
Cronbach's Alpha
N of Items
.780 6
Return Patronage
Case Processing Summary
N %
Cases
Valid 186 100.0
Excludeda 0 .0
Total 186 100.0
a. Listwise deletion based on all variables in the procedure.
Reliability Statistics
Cronbach's Alpha
N of Items
.899 5
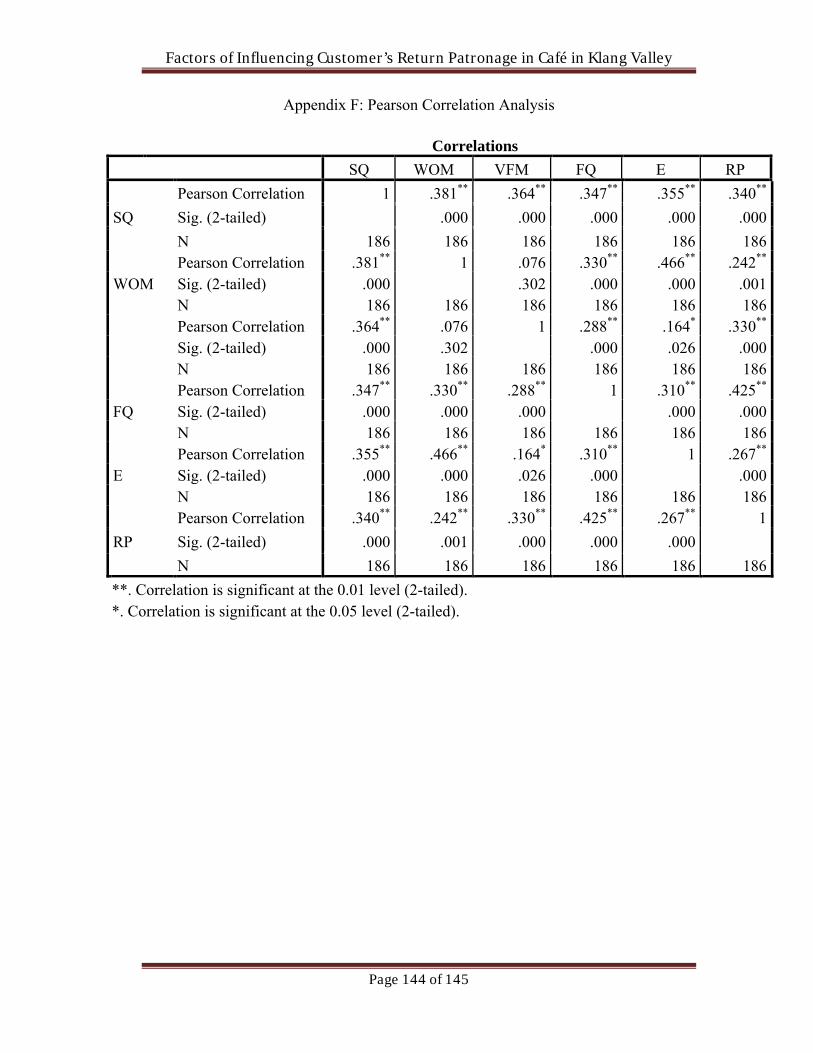
Factors of Influencing Customer’s Return Patronage in Café in Klang Valley
Page 144 of 145
Appendix F: Pearson Correlation Analysis
Correlations
SQ WOM VFM FQ E RP
SQ
Pearson Correlation 1 .381** .364** .347** .355** .340**
Sig. (2-tailed) .000 .000 .000 .000 .000
N 186 186 186 186 186 186
WOMPearson Correlation .381** 1 .076 .330** .466** .242**
Sig. (2-tailed) .000 .302 .000 .000 .001N 186 186 186 186 186 186Pearson Correlation .364** .076 1 .288** .164* .330**
Sig. (2-tailed) .000 .302 .000 .026 .000N 186 186 186 186 186 186
FQPearson Correlation .347** .330** .288** 1 .310** .425**
Sig. (2-tailed) .000 .000 .000 .000 .000N 186 186 186 186 186 186
EPearson Correlation .355** .466** .164* .310** 1 .267**
Sig. (2-tailed) .000 .000 .026 .000 .000N 186 186 186 186 186 186
RP
Pearson Correlation .340** .242** .330** .425** .267** 1
Sig. (2-tailed) .000 .001 .000 .000 .000
N 186 186 186 186 186 186
**. Correlation is significant at the 0.01 level (2-tailed).*. Correlation is significant at the 0.05 level (2-tailed).

Factors of Influencing Customer’s Return Patronage in Café in Klang Valley
Page 145 of 145
Appendix G: Multiple Regression Analysis
Variables Entered/Removeda
Model Variables Entered
Variables Removed
Method
1E, VFM, FQ, SQ, WOMb . Enter
a. Dependent Variable: AVRPb. All requested variables entered
Model Summary
Model R R Square
Adjusted R Square
Std. Error of the
Estimate
Change Statistics
R Square Change
F Change df1 df2 Sig. F Change
1 .509a .259 .238 .53205 .259 12.563 5 180 .000
a. Predictors: (Constant), E, VFM, FQ, SQ, WOM
ANOVAa
Model Sum of Squares
df Mean Square F Sig.
1
Regression 17.781 5 3.556 12.563 .000b
Residual 50.954 180 .283
Total 68.735 185
a. Dependent Variable: RPb. Predictors: (Constant), E, VFM, FQ, SQ, WOM
Coefficientsa
Model Unstandardized Coefficients Standardized Coefficients
t Sig.
B Std. Error Beta
1
(Constant) .737 .441 1.671 .097
SQ .164 .099 .126 1.651 .100
WOM .065 .106 .047 .610 .543
VFM .176 .068 .184 2.600 .010
FQ .326 .082 .288 3.971 .000
E .095 .089 .081 1.076 .284a. Dependent Variable: RP