factors determining access to credit facilities for
TRANSCRIPT
FACTORS DETERMINING ACCESS TO CREDIT FACILITIES
FOR FARMERS IN CHERANGANY CONSTITUENCY IN
TRANS- NZOIA COUNTY
PRESENTED BY:
ISAAC MBUGUA
D61/73233/2012
A RESEARCH PROJECT SUBMITTED IN PARTIAL
FULFILLMENT OF THE REQUIREMENT FOR THE AWARD OF
MASTER OF BUSINESS ADMINSTRATION (MBA) IN FINANCE,
UNIVERSITY OF NAIROBI
2013
DECLARATION
STUDENT
This research project report is my original work and has not been presented for any
award to any examination body.
Signature.......................... Date………………………
SUPERVISOR
MR. MARTIN ODIPO
Signature................................. Date:……………………..

ACKNOWLEDGEMENT
I would like to express my sincere gratitude to my supervisor Mr. Martin Odipo for his
valuable guidance throughout this research project of which without his direction it
would have been impossible to reach this far.

DEDICATION
I dedicate this work to God who has bestowed me with knowledge and wisdom
throughout the entire course, to my brothers and sisters for their immense support and
to my friends for their motivation.
ABSTRACT
It has been postulated that access to credit for farmers has been influenced by a number
of factors. It is presumed that there exists a relationship between agriculture productivity
and poverty alleviation (Nyoro, 2002), and hence the critical need to address inadequate
credit facilities in rural areas that are a key constraint to farmers investments. Given that
the major economic function of financial institutions include addressing the restraints
imposed by inadequate access to financial services; it is argued that these institutions are
well positioned to dealing with these financial constrains among which include access to
credit. Literature review in chapter two revealed that access to credit was a challenge
facing farmers in various parts of the globe. Studies indicated that a significant proportion
of challenges in the farming industry could be alleviated through the provision of
sustainable and easily accessible credit. For this study, data was gathered using
questionnaires and was analyzed using Ms-Excel and presented using elementary
statistical techniques such frequency tables and charts. After analyzing the findings, the
researcher drew conclusions and made recommendations. Areas for further studies were
identified as well. Research established that collateral, basic loan requirements and
interest rates on loans are key determinants to farmer’s access to credit, deficiency in any
of the above factors hindered farmers from getting credit. After assessing the findings of
the study, the researcher made recommendations aimed at improving and making it easy
for farmers to access credit, e.g. coming up with loan products specifically tailored for
farmers and opening of rural branches by financial institutions to bring services closer to
farmers.
TABLE OF CONTENT
Declaration……………………………………………………………………………...i
Acknowledgement……………………………………………………………..………ii
Dedication……………………………………………………………………………..iii
Abstract………………………………………………………………………………..iv
Table of content……………………………………………………………………..…v
List of Tables…………………………………………………………………………vii
List of Figure…………………………………………………………………………vii
CHAPTER 1: INTRODUCTION……………………………………………………1
1.1 Background of the Study…………………………………………………………………...1
1.1.1 Credit Facilities for Farmers…………………………………………………………2
1.1.2 Factors Determining Access to Credit……………………………………………….3
1.1.3 Relationship Between Credit and Determinants of Access to Credit………………..4
1.2 Research Problem…………………………………………………………………………..5
1.3 Objective of the Study……………………………………………………………...………6
1.4 Value of the Study………………………………………………………………….………7
CHAPTER 2: LITERATURE REVIEW……………………………………………8
2.1 Introduction…………...……………………………………………………………8
2.2 Theoretical Review………………………………………………..……………….8
2.2.1 Demand and Supply Theory………………………………………..……………8
2.2.2 The Pecking Order Theory……………………………………………...………10
2.2.3 Signaling Theory……………………………………………………..…………11
2.3 Empirical Studies…………………………………………………………...…….13
2.4 Summary of Literature Review………………………………..………………….18
CHAPTER 3: RESEARCH METHODOLOGY…………………………….……19
3.0 Introduction……………………………………………………………………….19
3.1 Research Design…………………………………………………………..............19
3.2 Target Population…………………………………………………………………19
3.4 Data Collection Methods…………………………………………………………20
3.5 Data Analysis and Interpretation………………………...………………..............20
CHAPTER 4: DATA ANALYSI, RESSULTS AND DISCUSSION…………..…21
4.1 Introduction……………………………………………………………………….21
4.2 Demographic Information………………………………………………………...21
4.3 Study Information…………………………………………………………….…..26
4.4 Model Analysis………………………………………………………...…………32
CHAPTER 5: SUMMARY, CONCLUSION AND RECOMMENDATIONS…..36
5.1 Introduction……………………………………………………………………….36
5.2 Summary of Findings……………………………………………..………………36
5.3 Conclusion……………………………………………………………….……….37
5.4 Recommendations………………………………………………………..……….38
5.5 Limitations of the Study…………………………………………………………..39
Suggestions for Further Research………………………………………….…………40
REFERENCE……………………………………………………………..…………41
QUESTIONAIRE……………………………………………………………………45

LIST OF TABLES
Table 4.1 Respondents Age in Years…………………………...…………………….21
Table 4.2 Respondents Gender………………………………………...……………..22
Table 4.3 Years of Farming………………………………………………………..…23
Table 4.4 T Test Coefficients……………………………………………...………….33
Table 4.5 Model Summary……………………………………………..……………..33
Table 4.5 F Test for Full Model…………………………………………...………….34
LIST OF FIGURES
Figure 4.1 Size of the Firm…………………………………………………...………24
Figure 4.2 Income from Farming……………………………………………..………25
Figure 4.3 If the Respondents Owe Credit to Financial Institutions……………...…..26
Figure 4.4 Measure of Security for a Loan……………………………………….…..27
Figure 4.5 Measures for Loan Requirements……………………………………...….28
Figure 4.6 Measure of Factors Determining Interest Charged on Loans……………30
Figure 4.7 Sources of Money for Firm Inputs, School Fee and Other Investments….31
Figure 4.8 What Lenders should do to Encourage Farmers Apply for Credit……..…35

CHAPTER ONE
INTRODUCTION
1.1 Background of the Study
Until recently, the African agricultural landscape was characterized by sluggish growth,
low factor productivity, declining terms of trade, and often also by practices that
aggravated environmental problems. Since the late 1970s to mid 1980s, many African
countries have implemented macroeconomic and sectoral reforms aimed at ensuring high
and sustainable food productivity, economic growth and poverty reduction.
Some recent agricultural growth accelerations notwithstanding, the sector’s growth
remained insufficient to adequately address poverty, attain food security, and lead to
sustained GDP growth on the continent (Nyoro, 2002).
The principal function of credit is to transfer property from those who own it to those
who wish to use it, as in the granting of loans by banks to individuals who plan to initiate
or expand a business venture. The transfer is temporary and is made for a price, known as
interest, which varies with the risk involved and with the demand for, and supply of,
credit. Credit puts to use property that would otherwise lay idle, thus enabling individuals
or a country to more fully employ its resources.
A study by Atieno (2001), indicates that income level, distance to credit sources, security,
past credit participation and assets owned were significant variables that explain the
participation in formal credit markets. Hussein (2007), also indicated that Farm
households are more likely to prefer the informal sector to the formal sector with respect
to flexibility in rescheduling loan repayments in times of unexpected income shocks. This
was also supported by Padmanabhan (1996), comparing the informal credit sector from
the formal stated that proximity, comfortable atmosphere, quick credit, all times access,
freedom of deployment, repayment flexibility and lower transaction costs are the
advantages of the informal sector have made them almost indispensable, particularly to
small farmers.
1.1.1 Access to Credit by farmers
Rural credit markets in developing countries are full of imperfections. The imperfections
manifest in the generally accepted fact that, despite numerous government policies to
increase household’s access to credit, many rural households remain credit-constrained.
The formal banking sector does not satisfy the growing demand for credit, and many
borrowers turn to informal loan sources (relatives, private moneylenders, etc.) to meet
their production and consumption needs. It has been estimated that only five percent of
the farmers in Africa and about fifteen percent in Asia and Latin America have had
access to formal credit; and on an average across developing countries five percent of the
borrowers have received eighty percent of the credit (Bali, 2001). Access to affordable
agricultural credit enables farmers, who constitute the majority of population in most
developing countries, to adopt new technology and take advantage of new economic
opportunities to increase production and income.
The principal function of credit is to transfer resources from those who have and don’t
use them to those who don’t have and wish to use them, this is done using different

avenues e.g. granting of loans by banks and MFI’s to individuals who plan to initiate or
expand a business venture or agricultural production. The transfer is temporary and is
made for a price, known as interest, which varies with the risk involved and with the
demand for, and supply of, credit (Kimuyu and Omiti 2000).
According to Mutua and Oyugi (2005), interest in access to finance has increased
significantly in recent years, as growing evidence suggests that lack of access to credit
prevents lower-income households and small firms from financing high return investment
projects, having an adverse effect on growth and poverty alleviation. They examined
literature on the causal relationship between access to financial services and its impact on
agricultural production. The literature, mostly observational from a few case studies,
reveals that access to financial services by the rural people (or low income population
segments) can improve their incomes and therefore their welfare.
1.1.2 Factors determining access to Credit
The business of Kenya is agriculture – the principal source of income for 75% of the
nation’s population. Yet agriculture accounts for only 25% of the Gross Domestic
Product. As a result, 75% of Kenyans depend on a technically inefficient industry whose
average labor input is three times greater than its output. Due to its dominance, any
change in the agricultural sector translates to changes in the entire economy. Efforts to
grow the economy and reduce poverty must begin with agriculture. For the majority of
Kenyans, farming exists mainly for subsistence. The level and scale of crop production is
geared towards satisfying household requirements. Kenya’s agriculture is mainly rain-fed
and is entirely dependent on the bimodal rainfall in most parts of the country. A large
proportion of the country, accounting for more than 80 per cent, is semi-arid and arid
with an annual rainfall average of 400 mm. Droughts are frequent and crops fail in one
out of every three seasons.
Kenya’s agriculture is predominantly small-scale farming mainly in the high-potential
areas. Production is carried out on farms averaging 0.2–3 ha, mostly on a commercial
basis. This small-scale production accounts for 75 per cent of the total agricultural output
and 70 per cent of marketed agricultural produce.
In 2005, agriculture, including forestry and fishing, accounted for about 24 percent of
the GDP, as well as for 18 percent of wage employment and 50 percent of revenue
from exports. (Macharia et al, 2008).
Farming is the most important economic sector in Kenya, although less than 8 percent
of the land is used for crop and feed production, and less than 20 percent is suitable for
cultivation. Kenya is a leading producer of tea and coffee, as well as the third-leading
exporter of fresh produce, such as cabbages, onions and mangoes. Small farms grow
most of the corn and also produce potatoes, bananas, beans and peas. Growth of the
national economy is therefore highly correlated to growth and development in
agriculture.
1.1.3 Credit and determinants for access to credit for farmers
Credit provision is one of the principal components of rural development, which helps to
attain rapid and sustainable growth of agriculture. Rural credit is a temporary substitute
for personal savings, which catalyses the process of agricultural production and
productivity. To boost agricultural production and productivity farmers have to use
improved agricultural technologies. However the adoption of modern technologies is
relatively expensive and small farmers cannot afford to self finance. It is widely
acknowledged that inadequate financial resources are a key constraint to farmers’
investments, the key to enhancing agricultural productivity (Townsend, 2008). In Kenya,
MFI’s have set strategies aimed at addressing financial deficiency in the farming
industry. Such institutions are well positioned to explore innovations and design products
that are tailored toward addressing constraints of access to credit, with a view of
stimulating agricultural growth and productivity.
In the first Medium Term Plan of Kenya’s vision 2030, the government aims at
transforming the agriculture sector into a vibrant modern sector, supporting value-
addition through scientific and technological innovation, and most importantly access to
credit.
1.2 Research Problem
Despite the fact that a bigger percentage of Kenya’s population live in rural areas and
that 80 percent are involved in farming activities, there is little effort by commercial
banks and other financial institutions to facilitate credit to this industry which is
crucial in rapid development of this dominant section of the population. There is no
bank which caters for the specific credit and saving needs. The available piecemeal
credit services are operated by small credit schemes, which are limited in scope and
have specific target groups. The inadequacy in financing and credit arrangements in
rural Kenya and in specific the spread of this study impede development of agriculture
and rural sectors. Given that this sector is the mainstay of a large segment of the
populace; their poor performance makes the fight against poverty even more
challenging (Kimuyu and Omiti, 2000).
According to Nyoro (2002), lack of access to credit facilities has been highlighted a key
constraint to farmers investment. The demand for credit by farmers has been high and
increasing. It includes access to credit to cover lump sum and smooth farmers’
consumption among others. The expenditure requiring lump sum includes purchase of
farm inputs, ploughing, top dressing, and labor and irrigation activities. Many farmers
have hardly been able to meet these farm expenditures due to lack of financial command
and potential. The thrust of this study draws from the premise that access to credit by
farmers is key to increasing productivity. In this respect, one of the major reasons is that
purchased seasonal inputs and requisite labor are rarely affordable by farmers on a “cash”
basis. Majority of these farmers face liquidity constraints that compromise the crucial
investments in agriculture and other sectors necessary in increasing productivity (Doward
et al, 1998).
The study therefore seeks to establish how lack of collateral, basic loan requirements by
financial institutions and interest on loans has hindered farmer’s access to credit.
1.3 Objective of the Study
The objective of the study is to establish factors determining access to credit facilities for
farmers in Cherangany constituency.
1.4 Value of the Study
The study will provide useful information on the status of farmers in accessing credit
from commercial banks and other financial institutions. This information will be vital for
policy makers in taking appropriate actions toward facilitating the establishment of
comprehensive and sustainable credit products for the development of agriculture in
Cherangany. The study results will also benefit development partners and civil society
organizations involved in the provision of credit facilities to farmers in modifying the
lending measures and conditions to better serve the specific credit needs of their clients.
In general, it is hoped that the end result of this study will provide a thrust to explore the
possibility of providing credit facilities that directly support farmers to increase
productivity.
CHAPTER TWO
LITERATURE REVIEW
2.1 Introduction
This chapter will look into studies done by other researchers on the same topic. It will
therefore contain theoretical review, give an overview on rural finance and discuss on
empirical studies on determinants of borrowers access to credit.
2.2 Theoretical Review
2.2.1 Demand and Supply Theory
Demand theory was first raised as a fundamental principle of microeconomics by a
French economist Walras (1834-1910). The theory is an analysis of the relationship
between the demand for goods or services and prices which examines purchasing
decisions of consumers and subsequent impact of prices on commodity demanded.
According to Walras (1834-1910), price of a commodity influences its demand. This
theory was criticized by later up-coming economists as shallow; however, they used it as
a base to develop the law of demand, stated by many economists as: an inverse
relationship exists between the price of a commodity and the quantity demanded of the
product, that is, when the price of some commodities goes up, the quantity we consume
of these commodities goes down and vice versa, other things held equal (Saleemi, 2000;
Mudida, 2003).
Economists have attempted to explain consumer behavior on demand for a commodity
using different theoretical and empirical economic concepts. A large number of social-
economic factors play an important role in determining demand for a commodity by an
individual entrepreneur. Credit is an important commodity for improving the welfare of
the poor in their micro-economic activities especially in developing countries. In the
Kenyan economy, most of small-scale enterprises are operated within the informal sector.
The sector covers all semi-organized and unregulated economic activities that are small
scale in terms of employment. Its economic contribution is more than double that of
medium and large enterprise sectors that stands at 7% of the country’s GDP (GoK, 2003).
The sector therefore is a major source of employment and income to many households in
Kenya.
When cost of credit goes up, the marginal utility per Shilling raised from that credit goes
down. The household therefore chooses to consume, or use less of the credit (David,
2001). The concept of utility and marginal utility used by economists explains consumer
demand on a commodity. Utility is the capacity or power of a commodity to satisfy the
desire of a user (Lisper et al, 1987). Any commodity that satisfies human wants has
utility. For example, if credit borrowed will satisfy financial needs of a household, then
credit has utility (Saleemi, 2000). The main objective of any individual business operator
is to maximize satisfaction out of any financial support borrowed, given or self made.
Mudida (2003), points out that if income increases, the demand for most goods will
increase. Small-scale investors tend to cluster and limit their business activities to similar
products mostly of low quality that target low income earners. This leads to low business
returns that cannot empower the business owners to borrow credit from formal
institutions where the trader will be required to undergo implicit and explicit costs.
Livingston and Ord (1994) argued that the amount an individual wishes to buy of a
commodity depends on several factors. Firstly is his/her taste or preference, which may
be influenced by factors such as age, sex, education or religion. Secondly, the amount an
individual buys may depend on the price of the commodity. Therefore, if the goods are
very expensive, the buying power is reduced and vice versa. In the credit market, this
consideration is on implicit and explicit costs of credit, which are added costs to business
operators and have to be considered when making a decision to borrow or not to borrow
and from which source. Thirdly, Livingston and Ord (1994) explained that amount
bought is affected by availability of other goods. This applies more to close substitutes
like in this case, consideration of borrowing credit from commercial formal institutions,
formal government subsidized institutions, or from informal credit markets. If formal
markets prove expensive, borrowers are likely to turn to informal markets. The opposite
will apply if the informal markets are expensive. Lastly, Livingston and Ord (1994)
pointed out that the size of a household’s income affects the amount it buys of a
commodity. If the income increases, they will be able to buy more. This argument holds
only for necessity goods such as credit borrowing to finance business operations,
otherwise it will not apply to inferior goods.
2.2.2 The Pecking Order Theory
The pecking order theory of capital structure is among the most influential theories of
leverage. Originally developed by Myers (1984), it considers the role of information
asymmetries. According to Myers, firms use internal funds that are less costly than
external funds. When internal funds are insufficient, firms then consider outside funds.
Here, firms prefer debt to equity because of lower information costs associated with debt
issues, while equity is rarely issued. Later, these ideas were refined into testable
predictions and confirmed by Vogt (1994) who finds that internal funds have an
important influence in firm’s investment decisions. In agriculture, pecking order behavior
is clearly pronounced where farmers who invest in this industry prefer to use internal
funds (in many cases savings) and when the latter is not sufficient they resort to debt in
form of loans from financial institutions to finance their farming investments.
2.2.3 The Signaling Theory
The concept of signaling was first studied in the context of job and product markets by
Akerlof and Arrow and was developed into signal equilibrium theory by Spence (1973),
which says a good firm can distinguish itself from a bad firm by sending a credible signal
about its quality to markets. The signal will be credible only if the bad firm is unable to
mimic the good firm by sending the same signal. If the cost of the signal is higher for the
bad type than that of the good type firm, the bad type may not find it worthwhile to
imitate, and so the signal could be credible. Ross (1977) shows how debt could be used as
a costly signal to separate the good from the bad firms. Under the asymmetric
information between management and investors, signals from firms are crucial to obtain
financial resources. Signaling of higher debt by managers then suggests an optimistic
future and high quality firms would use more debt while low quality firms have lower
debt levels. In this way, good firm can separate itself by attracting scrutiny while the

bad firm will not ape because the bad firm will not want to be discovered. Two types of
signaling inside information have been suggested: one is the costly signaling equilibrium
discussed by Spence (1973), Leland and Pyle (1977), Ross (1977) and Talmor (1981)
etc., the other is the costless signaling equilibrium as proposed by Bhattacharya and
Heinkel (1982), Rennan and Kraus (1984). A signal is costly if the production of the
signal consumes resource or if the signal is associated with a loss in welfare generated by
deviations from distribution of claims in perfect markets. The signaling paradigm is
multivariate for financial instruments.
Poitevin (1989) demonstrates that debt could be used as a signal to differentiate the
potential competition of new entrant firms. Low cost entrants signal this fact by issuing
debt while the incumbent or high cost entrants issue only equity; (Harris and Raviv,
1985) argue that calling firm’s convertibles can be a kind of signal and Bhattacharya and
Dittmar (1991) show stock repurchase is another kind of signal to represent firm value.
In farming industry, the signaling theory talks about financing tactics, where good firms
try to distinguish themselves from bad quality firms by using different financing device.
Farm owners also have incentives to get external financing by adopting such financing
strategies. Unlike corporate firms who offer signals to stock market, farm owners send
signals to all potential lenders in agricultural capital market. The signal instruments for
farm business can be its profitability, farm income, the historical good performance
record (return on assets) farm leverage, risk management documentation, operating
products
2.3 Empirical Studies
A study by Kashuliza et al, (1996) revealed that the type of financial institution and its
policy will often determine the access. Where credit duration, terms of payment, required
security and the provisions of supplementary services do not fit the needs of the target
group, potential borrowers will not apply for credit even where it exists and when they
do, they will be denied access. In addition, Bigsten et al. (2003), and fliesig (1995), stated
that in developing countries asymmetric information, high risks, lack of collateral, lender-
borrower distance, small and frequent credit transactions of rural households make real
costs of borrowing vary among different sources of credit.
In another study, based on the data from a sample survey of 699 randomly selected
peasant farmers in Bolivia, Miller and Ladman (1983), applied discriminant analysis to
identify a set of socio-economic, physical and psychological factors that influence credit
use among small farmers with a view to differentiate between borrowers, potential
borrowers, and non-borrowers. The results of the study indicated that borrowers were
characterized by higher resource base, farm size, higher level of education, large number
of cattle, higher household incomes, higher level of market integration, greater use of
improved technology, larger operating costs and investments, higher risk ability, etc.
Potential borrowers were characterized by further distance from markets, low level of
market integration, higher transaction costs, less number of cattle, etc. Furthermore, non-
potential borrowers were characterized by lack of interest to expand production, lower
level of education, limited use of improved technology, shortage of labour and proximity
to market.

In the 1950s and early 1960s, credit provision was considered a key instrument for
breaking the ‘vicious circle’ of low incomes, low savings, and low productivity.
However, in that period emphasis was far more on market oriented farmers and
commercial agriculture than on peasants. From the mid-1960s, and up to the present time,
farmers and the rural poor has increasingly become the chief target of credit
interventions. In addition, since the early-1970s a strong equity dimension emerged in the
aims of credit schemes and small farm projects.
The traditional approach to credit policy is funds for lending to farmers to be
predominantly supply-led. This means that they originate from the central bank or from
external donors, rather than from local saving in the rural economy (Ellis, 1992).
According to Assefa et al (2005), the new rural financial market approach assigned a
different role to the government with less direct intervention of the government in credit
allocation and credit delivery.
Ellis (1992) stated that Past credit policies have tended to make wrong assumptions about
peasants, viz. that they are unable to save, and that their demand for credit is highly
sensitive to the level of the interest rate. There were new views of credit objectives,
instruments (interest rate, credit targeting, and loan portfolio regulation and others) and
institutions that arise from the defects of the old. A traditional view that smallholder
farmers and poor rural people are unable to save has been shown to be wrong in several
experiments. The main features of the rural poor in this context are: their income is
uneven; their potential to save involves very small amounts, they cannot afford ‘costs’
associated with saving, and they are naturally concerned with the security of saving. For
peasants who are not so-poor, lack of saving is much more to do with lack of opportunity,
or distrust of the alternatives available, than to do with low savings capacity. Households
keep their assets in goats or cattle rather than in the bank, especially when the bank
discourages savings, or appears to be run by untrustworthy officials.
In a study by Kebede (1995), credit makes traditional agriculture more productive
through the purchase of farm equipment and other agricultural inputs, the introduction of
modern irrigation system and other technological developments. Credit can also be used
as an instrument for market stability. Rural farmers can build their bargaining power by
establishing storage facilities and providing transport system acquired through credit.
Credit plays a key role in covering consumption deficits of farm households. This would,
in turn, enable the farm family to work efficiently in agricultural activities. Credit can
further be used as an income transfer mechanism to remove the inequalities in income
distribution among the small, middle, and big farmers. Moreover, credit encourages
savings and savings held with rural financial institutions that could be channeled to
farmers for use in agricultural production. Credit also creates employment opportunities
for rural farmers.
Poor households do not want to use formal financial services due to costs implication
such as transaction costs, processing fee, commission, insurance fee and minimum
requirement, or proximity to financial institutions; they prefer informal services due to
reasons like lower transaction costs and greater flexibility. Bertrand et al (2010) in a
survey in South Africa tested the relative importance of interest charged on poor
household decision to open saving account and marketing features, they found that
interest rates mattered. Likewise interest rates influence the usage of formal financial
institutions. For instance, in an experiment in Philippine conducted by Ashraf et al (2006)
shows the evidence that distance to the bank, education and income are positively
correlated with the use of informal financial institutions. On the other hand, Rahman
(1998) shows that lack of proximity is one of the major reasons for not using formal
financial institutions.
Evidence from Asia and Latin America illustrates that the major constraint for accessing
credit was product design; as such products need to be tailored specifically to the needs
of the borrowers (Meyer, 2002). According to Hudon (2004), the poor require flexible
and inexpensive products that match their capacity to borrow, and address their needs for
them to cope with crisis thus there is a strong need for credit. The challenge for MFI’s is
to design credit products tailored to respond to different client needs. Similarly these
products should be easily accessible (opening hours and proximity), with reasonable
interest charged and more attractive terms than what they already access informally (Bass
et al 2000).
Transaction cost incurred by poor household to access credit services influences their
decision. The time spent to gain access to credit in formal institution is among such cost
that leads small borrowers to prefer informal lending services. For example, a survey on
women in Kenya by Anderson and Baland (2002) found that majority of women joining
informal funds groups were aimed at saving and borrowing to keep their money away
from commercial banks to avoid costs and commissions charged.
Physical distance of farm households from formal lending institutions is one of the
factors that influence access to formal credit. According to Hussein (2007), farm
households are discouraged to borrow from credit sector if it is located farther. This is
because both temporal and monetary costs of transaction, especially transportation cost,
increase with lender-borrower distance which raises the effective cost of borrowing at
otherwise relatively lower interest rate in the sector.
The orientation of credit policy in the future requires an imaginative and experimental
approach to institutional innovation. Rural credit provision needs to be located in a
context of diverse institutions providing lots of different services, not a single
bureaucracy providing just one kind of service. The few case studies of successful credit
institutions show that devices like regular small savings collected on the door step, group
lending and group accountability for loan repayment, and improved incentives and
performance methods within financial institutions, provide potential ways forward (Ellis,
1992).
The government of Kenya has underscored, in its national plans and policies, the key role
of the Agricultural Sector in promoting economic growth and in poverty alleviation. The
sector contributes about 24 per cent of the GDP, and is one of the major employers of
rural people, with an estimated 3.8 million Kenyans directly employed in farms, livestock
production, and fishing (Mutua and Oyugi, 2005).
Sustaining and improving production efficiency in agriculture by poor small holder
farmers under the existing credit constraint conditions, require the improvement of access
to credit and other factors involved. Within the design of agriculture in Kenya, for credit
components to be effective in rural development, they must be demand driven and have a
clear and efficient method of implementation. Linkage of credit to proven modern
farming methods that are well suited to increasing productivity is a necessary starting

point for farmers seeking to increase production. Lending to small-scale farmers has been
an important policy measure to stimulate agricultural development in Kenya (Mutua and
Oyugi, 2005).
2.4 Summary of Literature Review
From the literature review, it is clear that researchers have assessed various determinants
of access to credit for farmers’, they acknowledge that farming industry has been
sidelined by credit providers due to a number of factors like lack of collateral, asymmetry
information, proximity to these institutions among others. Within the design of
agriculture in Kenya, for credit components to be effective in rural development, they
must be demand driven and tailored the specific needs of farmers while at the same time
supply should be readily available and accessible.
CHAPTER THREE
RESEARCH METHODOLOGY
3.0 Introduction
This chapter focuses on the methodology that was employed to carry out the study,
determining the population and the sampling procedure as well as data collection and
analysis methods used.
3.1 Research Design
This research adopted a descriptive survey design. Descriptive research portrays an
accurate profile of persons, events, or situations. Surveys allow the collection of large
amount of data from a sizable population in a highly economical way. It allows one to
collect quantitative data which can be analyzed quantitatively using descriptive and
inferential statistics (Saunders et al, 2009). Therefore, the descriptive survey was deemed
the best strategy to fulfill the objectives of the study.
3.2 Target Population
In research, target population is the entire set of units for which the survey data is to
be used to make inferences. It can also be defined as the eligible population that is
included in research work. The constituency of the study has a total population of
48,455 people as per the 2009 census. The target population was 50 farmers in
Cherangany constituency.

3.3 Data Collection Methods
Primary data was collected using questionnaires. The questionnaires were
administered with the help of a research assistant who helped the respondents in cases
where a need for assistance arose. The questionnaires were distributed using a drop
and pick format where the researcher and the assistant delivered them to farmers and
picked them after a week.
3.5 Data Analysis and Report Writing
Data was analyzed using descriptive statistics using frequency distributions to measure
and compare results. Information was presented using percentages, tables and charts. MS
Excel and Statistical Package for Social Sciences Software (SPSS) were used to conduct
statistical analysis of the data. Bar graphs and percentages were used to analyze section A
of the questionnaire which covers demographic information of the respondents. To assess
the determinants of access to credit covered in section B, regression analysis was used;
Y = a + b1X1 + b2X2+b3X3 where;
Y is the dependent variable denoting access to credit, a is a constant, b1, b2, b3 and b4 are
the coefficients for independent variables X1, X2, and respectively, X1, X2, and X3 are
the independent variables i.e. X1(Collateral), X2(Basic Loan requirements) and
X3(interest on loans). The X variables were measured and obtained from data got from
section B of the questionnaire.
The analysis was done to assess determinants of access to credit facilities for farmers in
Cherangany constituency.
CHAPTER FOUR
DATA ANALYSIS, RESULTS AND DISCUSSION
4.1 Introduction
This chapter was concerned with discussing data findings, analysis, interpretation, and
presentation. The data collected was analyzed using the Statistical method and the
output presented in tabular form. Descriptive survey was undertaken for the study
where the target population for this study was the 50 farmers. The response for
farmers was 32 out of the 50 targeted thus indicating a 64% response rate. The
findings were presented as follows;
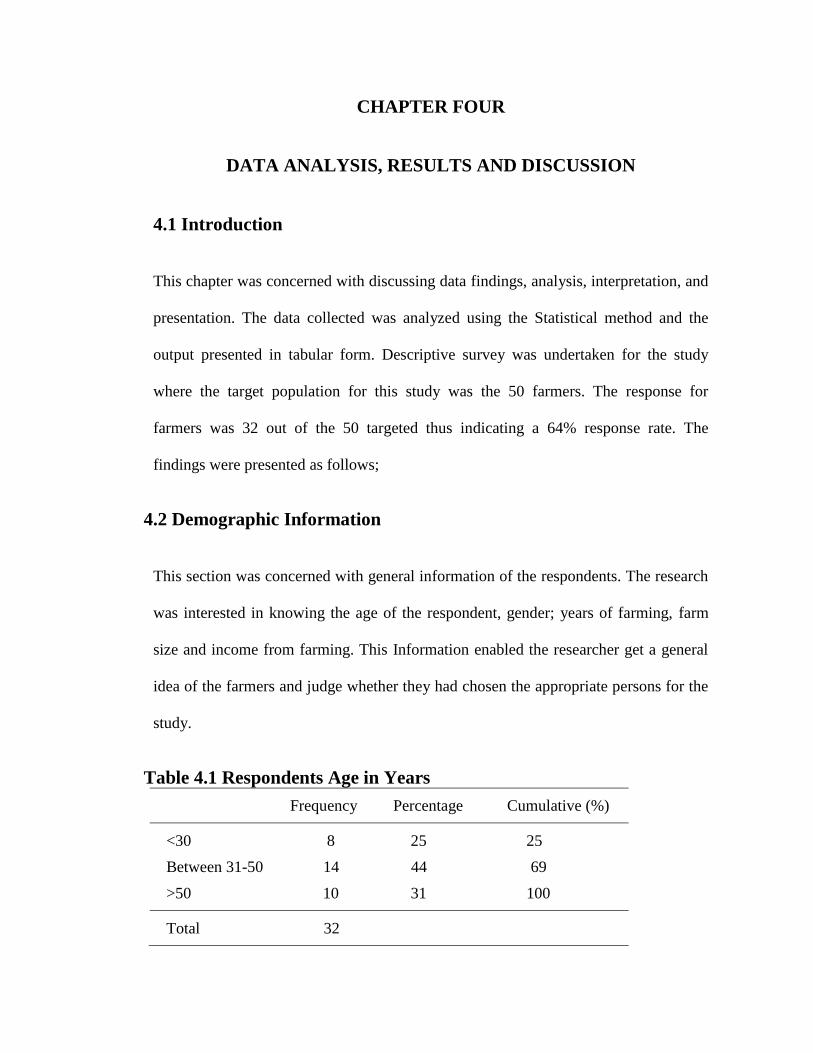
4.2 Demographic Information
This section was concerned with general information of the respondents. The research
was interested in knowing the age of the respondent, gender; years of farming, farm
size and income from farming. This Information enabled the researcher get a general
idea of the farmers and judge whether they had chosen the appropriate persons for the
study.
Table 4.1 Respondents Age in Years
Frequency Percentage Cumulative (%)
<30 8 25 25
Between 31-50 14 44 69
>50 10 31 100
Total 32

Table 4.1 above sought to establish the respondent’s age where farmers who were below
the age of 30 years were 25% of the total respondents, 44% were between the ages of
thirty one to fifty years while those above 50 years were 31%. Majority of those who
were below the age of thirty were school leavers who had cleared colleges and
universities and were waiting either to graduate or join, in this category as well there
were some respondents who dropped from school and were actively involved in farming
as this is their main source of income and livelihood. Those between the ages of 31-50
were practicing farming for various reasons ranging from as a source of livelihood and
others for commercial purposes. A bigger percentage of those who were above 50 years
were retirees.
Table 4.2 Respondents Gender
Frequency Percentage Cumulative (%)
Male 19 59 59
Female 13 41 100
Total 32
The table above sought to establish gender of the respondents. From the total farmers
who participated in the study, 59% were male while 41% were female. This area being in
a rural set up, majority of the communities here believe that farming is male activity
while female gender is mainly concerned with household affair. This concept explains
why majority of the respondents were male as well the rationale as to why the researcher
was directed to male partners where he was initially approaching the female gender. In a

sub-location like Kapsara, the respondents constituted a large number of female farmers
and the researcher also noted that majority of them we either single parents or widows.
Table 4.3 Years of Farming
Frequency Percentage Cumulative (%)
Below 5 Years 5 15.6 15.6
28.1 43.7 Between 5-15 Years 9
More than 15 Years 18 56.3 100
Total 32
The table above sought to know the number of years the respondents have practiced
farming. This question was asked for the researcher to have a clear view and an idea in
mind that the respondents know too well about farming thus making it easy to get
information from them, the researcher concluded that the more years the respondents
have practiced farming the more easy it would be for them to provide the information
needed for the study. From the findings, the researcher established that 15.6% had been
in farming for less than 5 years, 28.1% between 5 to 15 years and 56.3% more than 15
years respectively. Majority of those who were in the less than 5 years brackets acquired
land here recently. Those who had more than 5 and 10 years were born in this region thus
grew up practicing farming thus explaining the reason why they had many years in
farming. Considering that 84.4% of the respondents had practiced farming for more than
5 years, they were in a good position to give the researcher reliable information to aid in
the study.
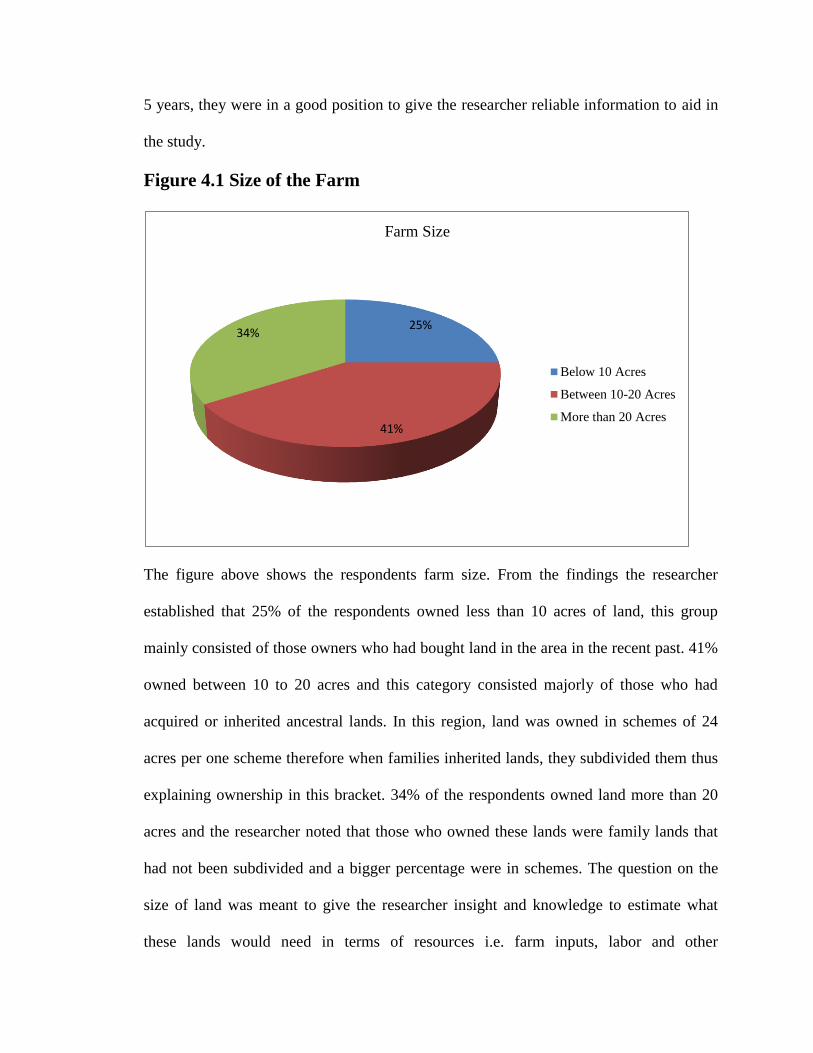
Figure 4.1 Size of the Farm
The figure above shows the respondents farm size. From the findings the researcher
established that 25% of the respondents owned less than 10 acres of land, this group
mainly consisted of those owners who had bought land in the area in the recent past. 41%
owned between 10 to 20 acres and this category consisted majorly of those who had
acquired or inherited ancestral lands. In this region, land was owned in schemes of 24
acres per one scheme therefore when families inherited lands, they subdivided them thus
explaining ownership in this bracket. 34% of the respondents owned land more than 20
acres and the researcher noted that those who owned these lands were family lands that
had not been subdivided and a bigger percentage were in schemes. The question on the
size of land was meant to give the researcher insight and knowledge to estimate what
these lands would need in terms of resources i.e. farm inputs, labor and other
25%
41%
34%
Farm Size
Below 10 Acres
Between 10-20 Acres
More than 20 Acres

requirements thus establishing the sources of this finances and to concentrate on credit
source which is the backbone of this study.
Figure 4.2 Incomes from Farming
The figure sought to establish what the farmers get as income from farming. This
question was important as it showed how farming is significant in this area
13%
47%
53%
Income from Farming
Below Ksh 5,000
Between Ksh 5,001-10,000
More than Ksh 10,000
SECTION B: STUDY INFORMATION
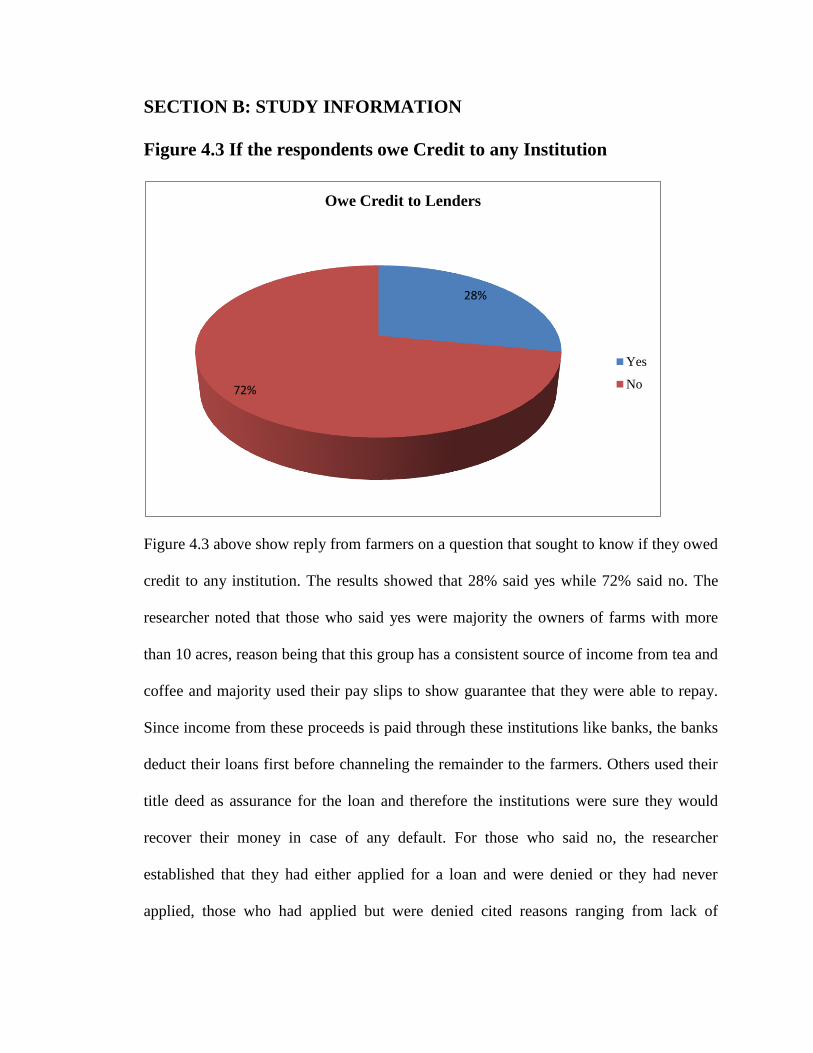
Figure 4.3 If the respondents owe Credit to any Institution
Figure 4.3 above show reply from farmers on a question that sought to know if they owed
credit to any institution. The results showed that 28% said yes while 72% said no. The
researcher noted that those who said yes were majority the owners of farms with more
than 10 acres, reason being that this group has a consistent source of income from tea and
coffee and majority used their pay slips to show guarantee that they were able to repay.
Since income from these proceeds is paid through these institutions like banks, the banks
deduct their loans first before channeling the remainder to the farmers. Others used their
title deed as assurance for the loan and therefore the institutions were sure they would
recover their money in case of any default. For those who said no, the researcher
established that they had either applied for a loan and were denied or they had never
applied, those who had applied but were denied cited reasons ranging from lack of
28%
72%
Owe Credit to Lenders
Yes
No
collateral, lack of guarantors, proximity from this institutions as they have to travel 16
miles to reach them while at the same the infrastructure is not good.
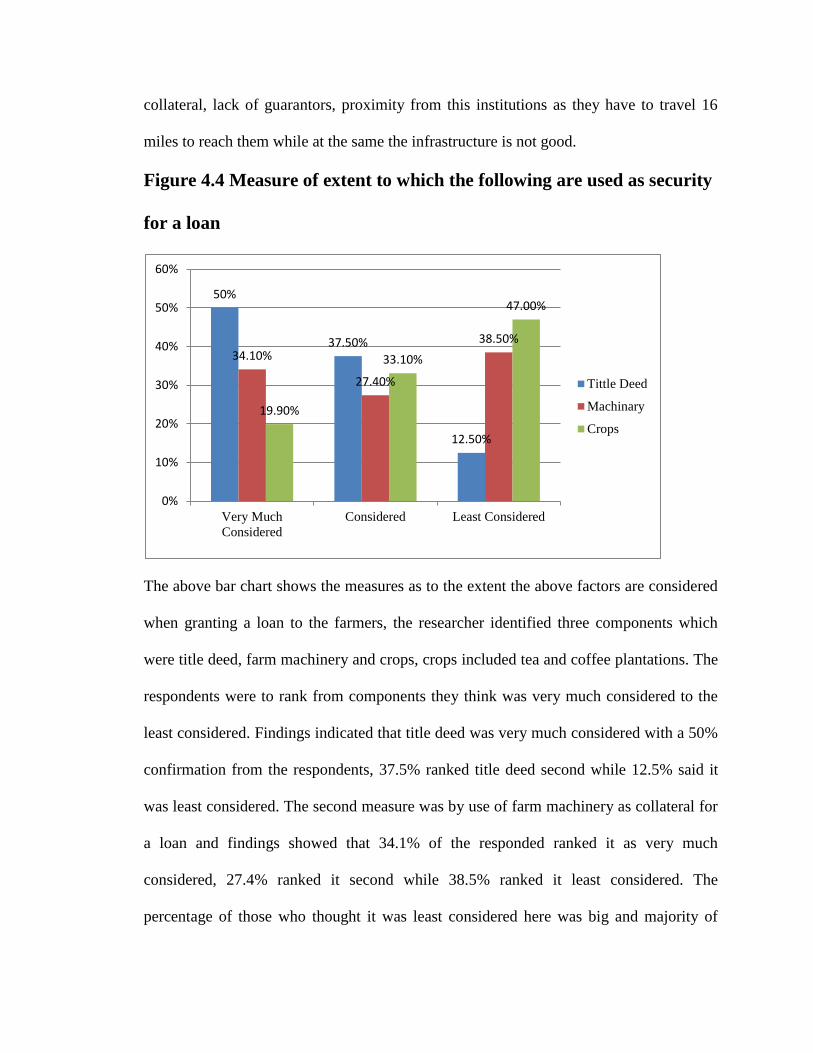
Figure 4.4 Measure of extent to which the following are used as security
for a loan
The above bar chart shows the measures as to the extent the above factors are considered
when granting a loan to the farmers, the researcher identified three components which
were title deed, farm machinery and crops, crops included tea and coffee plantations. The
respondents were to rank from components they think was very much considered to the
least considered. Findings indicated that title deed was very much considered with a 50%
confirmation from the respondents, 37.5% ranked title deed second while 12.5% said it
was least considered. The second measure was by use of farm machinery as collateral for
a loan and findings showed that 34.1% of the responded ranked it as very much
considered, 27.4% ranked it second while 38.5% ranked it least considered. The
percentage of those who thought it was least considered here was big and majority of
50%
37.50%
12.50%
34.10%
27.40%
38.50%
19.90%
33.10%
47.00%
0%
10%
20%
30%
40%
50%
60%
Very Much
Considered
Considered Least Considered
Tittle Deed
Machinary
Crops
them said that the use machinery is less considered because of its nature of depreciation
thus may not be a good gauge of value. The third class was use of crops to secure a loan,
and in this category 19.9% of the respondents said it was very much considered, 33.1%
ranked it second while 47% said it was least considered. The researcher further
established that in this category those who were considered were those with cash crops
like tea and coffee as they have assurance of getting income at the end of every month
thus recovering loan from them would not be difficult.
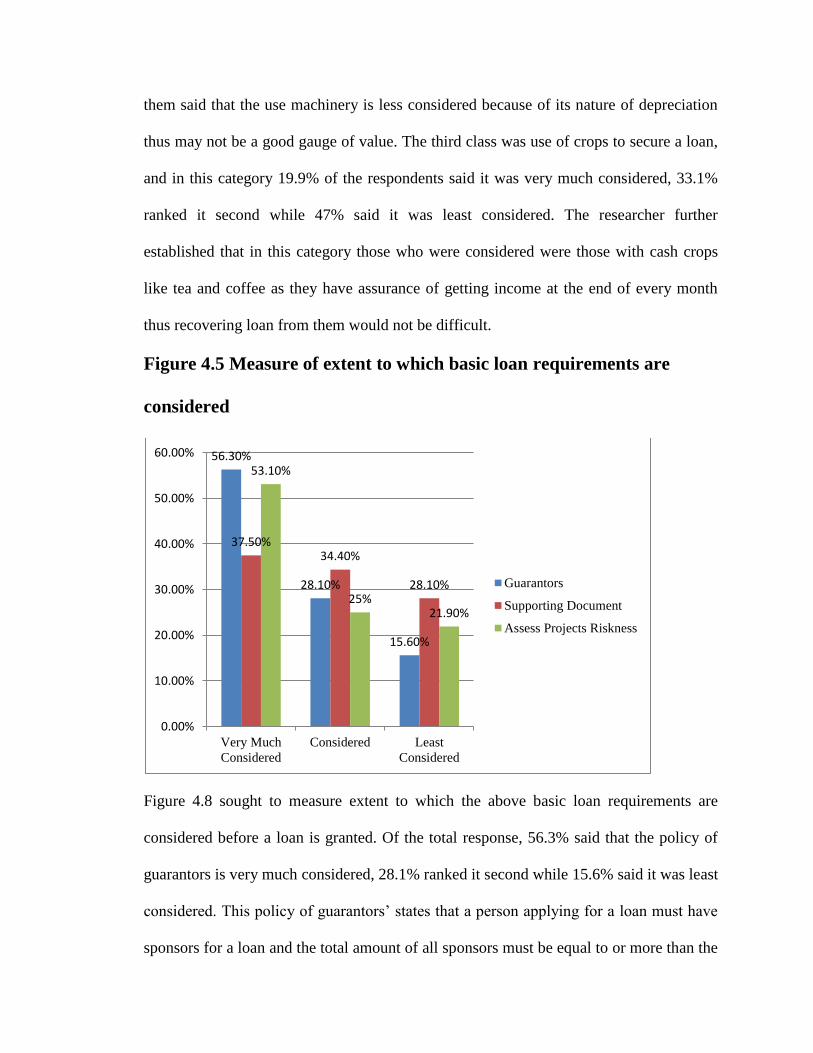
Figure 4.5 Measure of extent to which basic loan requirements are
considered
Figure 4.8 sought to measure extent to which the above basic loan requirements are
considered before a loan is granted. Of the total response, 56.3% said that the policy of
guarantors is very much considered, 28.1% ranked it second while 15.6% said it was least
considered. This policy of guarantors’ states that a person applying for a loan must have
sponsors for a loan and the total amount of all sponsors must be equal to or more than the
56.30%
28.10%
15.60%
37.50% 34.40%
28.10%
53.10%
25% 21.90%
0.00%
10.00%
20.00%
30.00%
40.00%
50.00%
60.00%
Very Much
Considered
Considered Least
Considered
Guarantors
Supporting Document
Assess Projects Riskness
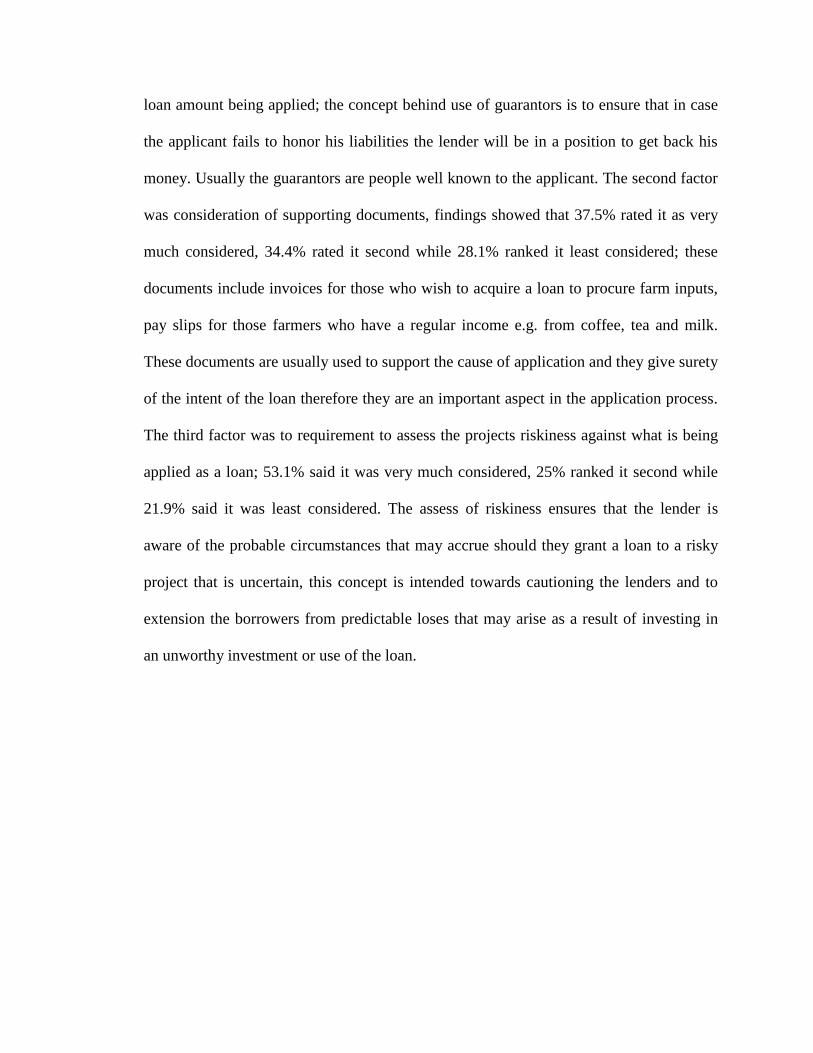
loan amount being applied; the concept behind use of guarantors is to ensure that in case
the applicant fails to honor his liabilities the lender will be in a position to get back his
money. Usually the guarantors are people well known to the applicant. The second factor
was consideration of supporting documents, findings showed that 37.5% rated it as very
much considered, 34.4% rated it second while 28.1% ranked it least considered; these
documents include invoices for those who wish to acquire a loan to procure farm inputs,
pay slips for those farmers who have a regular income e.g. from coffee, tea and milk.
These documents are usually used to support the cause of application and they give surety
of the intent of the loan therefore they are an important aspect in the application process.
The third factor was to requirement to assess the projects riskiness against what is being
applied as a loan; 53.1% said it was very much considered, 25% ranked it second while
21.9% said it was least considered. The assess of riskiness ensures that the lender is
aware of the probable circumstances that may accrue should they grant a loan to a risky
project that is uncertain, this concept is intended towards cautioning the lenders and to
extension the borrowers from predictable loses that may arise as a result of investing in
an unworthy investment or use of the loan.
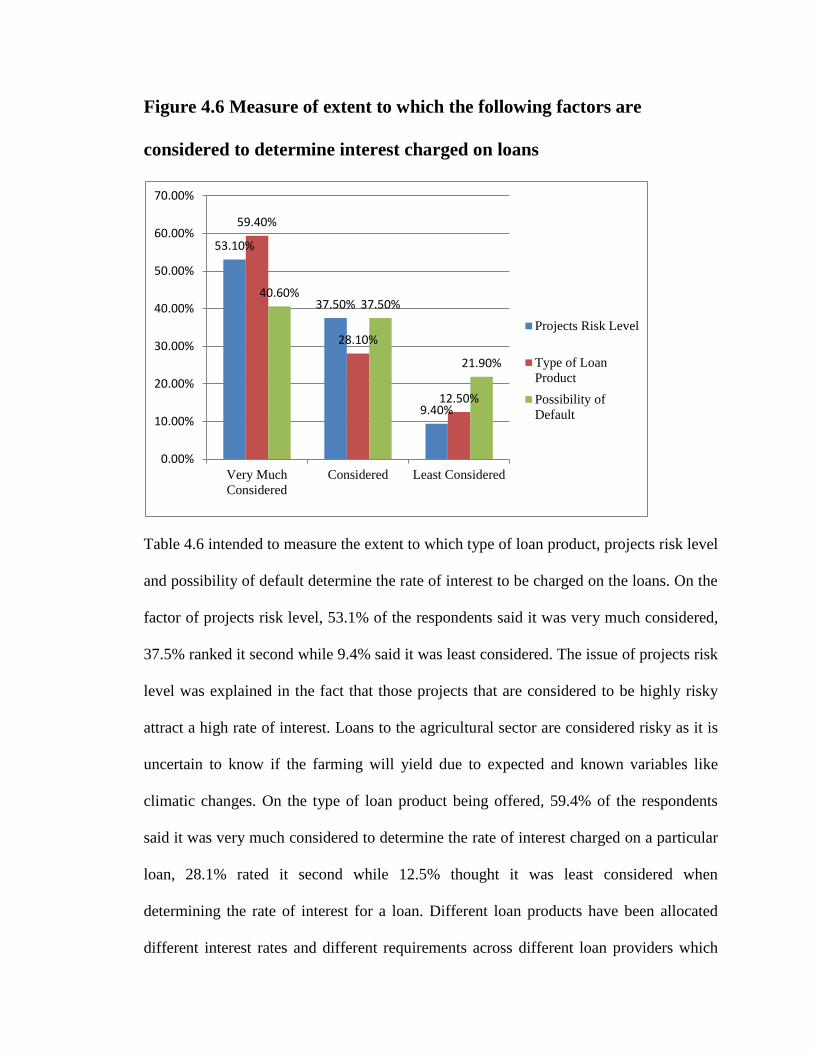
Figure 4.6 Measure of extent to which the following factors are
considered to determine interest charged on loans
Table 4.6 intended to measure the extent to which type of loan product, projects risk level
and possibility of default determine the rate of interest to be charged on the loans. On the
factor of projects risk level, 53.1% of the respondents said it was very much considered,
37.5% ranked it second while 9.4% said it was least considered. The issue of projects risk
level was explained in the fact that those projects that are considered to be highly risky
attract a high rate of interest. Loans to the agricultural sector are considered risky as it is
uncertain to know if the farming will yield due to expected and known variables like
climatic changes. On the type of loan product being offered, 59.4% of the respondents
said it was very much considered to determine the rate of interest charged on a particular
loan, 28.1% rated it second while 12.5% thought it was least considered when
determining the rate of interest for a loan. Different loan products have been allocated
different interest rates and different requirements across different loan providers which
53.10%
37.50%
9.40%
59.40%
28.10%
12.50%
40.60% 37.50%
21.90%
0.00%
10.00%
20.00%
30.00%
40.00%
50.00%
60.00%
70.00%
Very Much
Considered
Considered Least Considered
Projects Risk Level
Type of Loan
Product
Possibility of
Default
are set using their respective policies and by laws as guideline. Loan products to projects
that are considered unpredictable like farming usually attract a high interest rate. On the
possibility of default on loan, 40.6% thought it was very much considered, 37.5% ranked
it as second considered while 21.9% thought it was least considered. To establish the risk
or possibility of default, majority of lenders look at the credit history of the borrowers
before deciding whether to grant them a loan or not and if they decide to give them this
concept guides them on what type of loan to give and the interest to charge. Basically
loans to agricultural industry for farming and dairy activities are considered to be risky
because of the nature of the industry which is surrounded by many uncertain and non
predictable events thus they tend to attract a high interest rate.
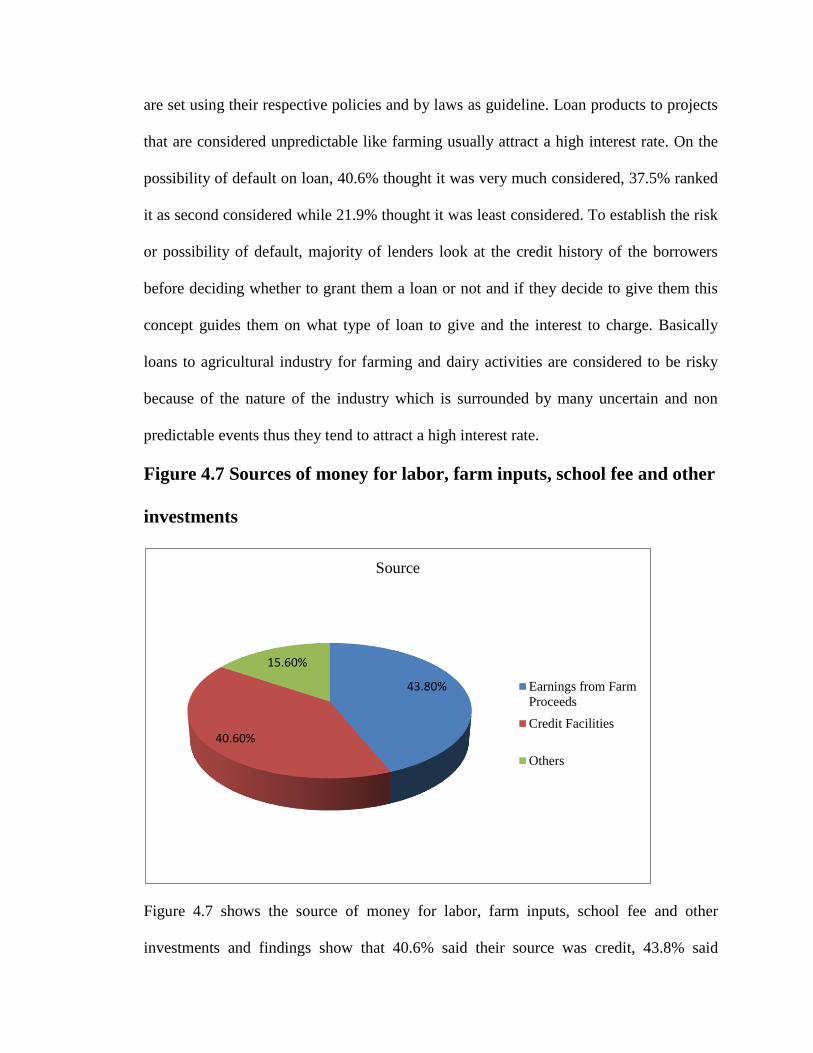
Figure 4.7 Sources of money for labor, farm inputs, school fee and other
investments
Figure 4.7 shows the source of money for labor, farm inputs, school fee and other
investments and findings show that 40.6% said their source was credit, 43.8% said
43.80%
40.60%
15.60%
Source
Earnings from Farm
Proceeds
Credit Facilities
Others
earning from farm inputs while other sources had 15.6%, the researcher established that
those who used credit were mainly for school fees and buying farm inputs since majority
of them have big farms and have no ready cash for acquisition of the required inputs.
This credit is got from lenders like commercial banks, Sacco’s, self help group and
MFI’s. Earnings from farm proceeds included sale of horticulture crops, earnings from
cash crops like tea and coffee and milk for those who practice daily farming. Other
sources mentioned included support from friends and families though this component
was small in number. This question therefore was important to assess as the researcher’s
findings show that those who rely on credit are 40.6% which is a considerable percentage
thus significant for the study.
4.4 T Test for Coefficients
First, the researcher regressed the findings to assist explain how the determinants under
study influence access to credit for farmers. The following regression model was adopted
to show the expected relationship between the above variables: Y=a + b1 x1 +b2 x2 + b3 x3
+ b 4 x4 Where: Y= access to credit which was measured using the responses on
determinants of access to credit ; a= the intercept that is the value of Y when x is zero; b1,
b2, and b3, are independent variables; x1 = collateral; x2 = basic loan requirements and x3 =
interest rate. All the three independent variables were considered using the responses on
each of the variables obtained from the respondents. The results are shown below;
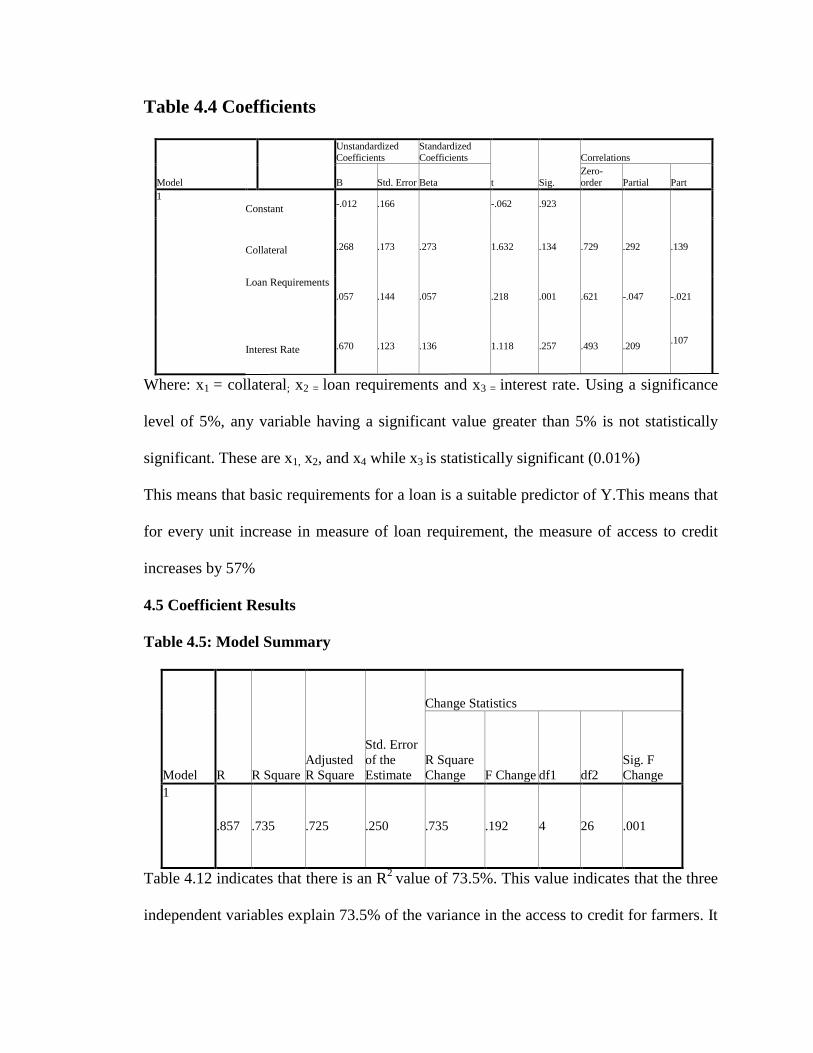
Table 4.4 Coefficients
Model
Unstandardized
Coefficients
Standardized
Coefficients
t Sig.
Correlations
B Std. Error Beta
Zero-
order Partial Part
1 Constant
-.012 .166 -.062 .923
Collateral .268 .173 .273 1.632 .134 .729 .292 .139
Loan Requirements
.057 .144 .057 .218 .001 .621 -.047 -.021
Interest Rate .670 .123 .136 1.118 .257 .493 .209 .107
Where: x1 = collateral; x2 = loan requirements and x3 = interest rate. Using a significance
level of 5%, any variable having a significant value greater than 5% is not statistically
significant. These are x1, x2, and x4 while x3 is statistically significant (0.01%)
This means that basic requirements for a loan is a suitable predictor of Y.This means that
for every unit increase in measure of loan requirement, the measure of access to credit
increases by 57%
4.5 Coefficient Results
Table 4.5: Model Summary
Model R R Square
Adjusted
R Square
Std. Error
of the
Estimate
Change Statistics
R Square
Change F Change df1 df2
Sig. F
Change
1
.857 .735 .725 .250 .735 .192 4 26 .001
Table 4.12 indicates that there is an R2
value of 73.5%. This value indicates that the three
independent variables explain 73.5% of the variance in the access to credit for farmers. It
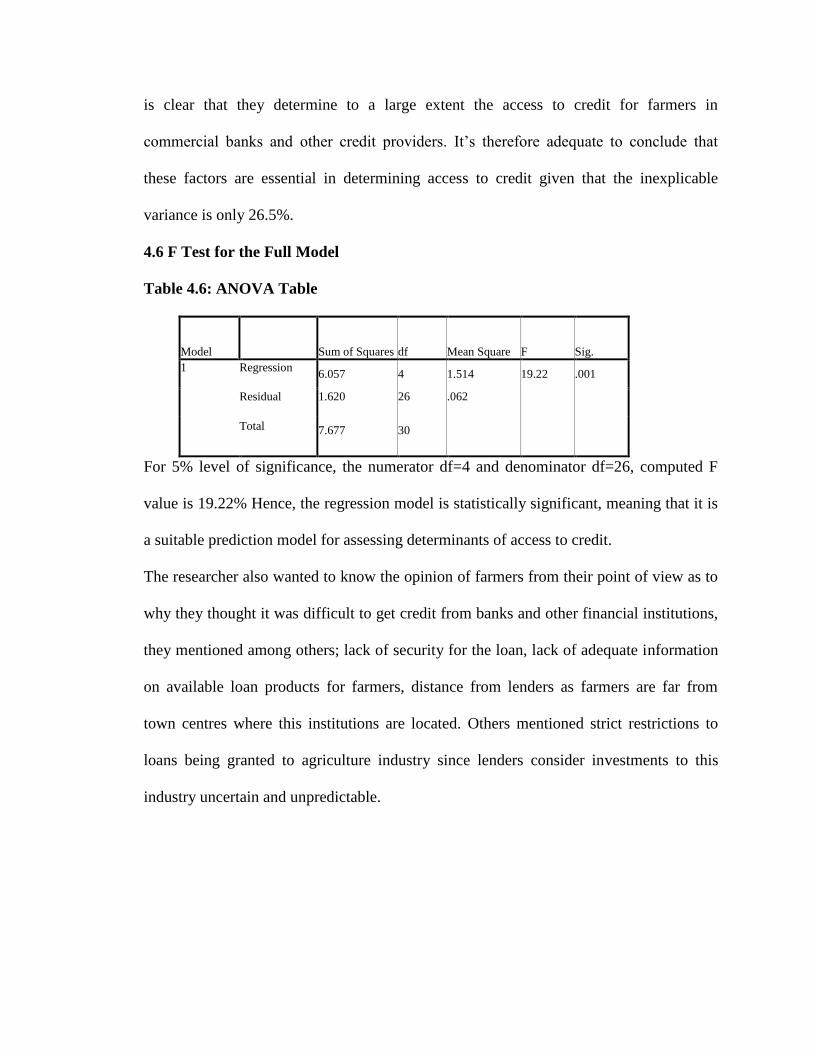
is clear that they determine to a large extent the access to credit for farmers in
commercial banks and other credit providers. It’s therefore adequate to conclude that
these factors are essential in determining access to credit given that the inexplicable
variance is only 26.5%.
4.6 F Test for the Full Model
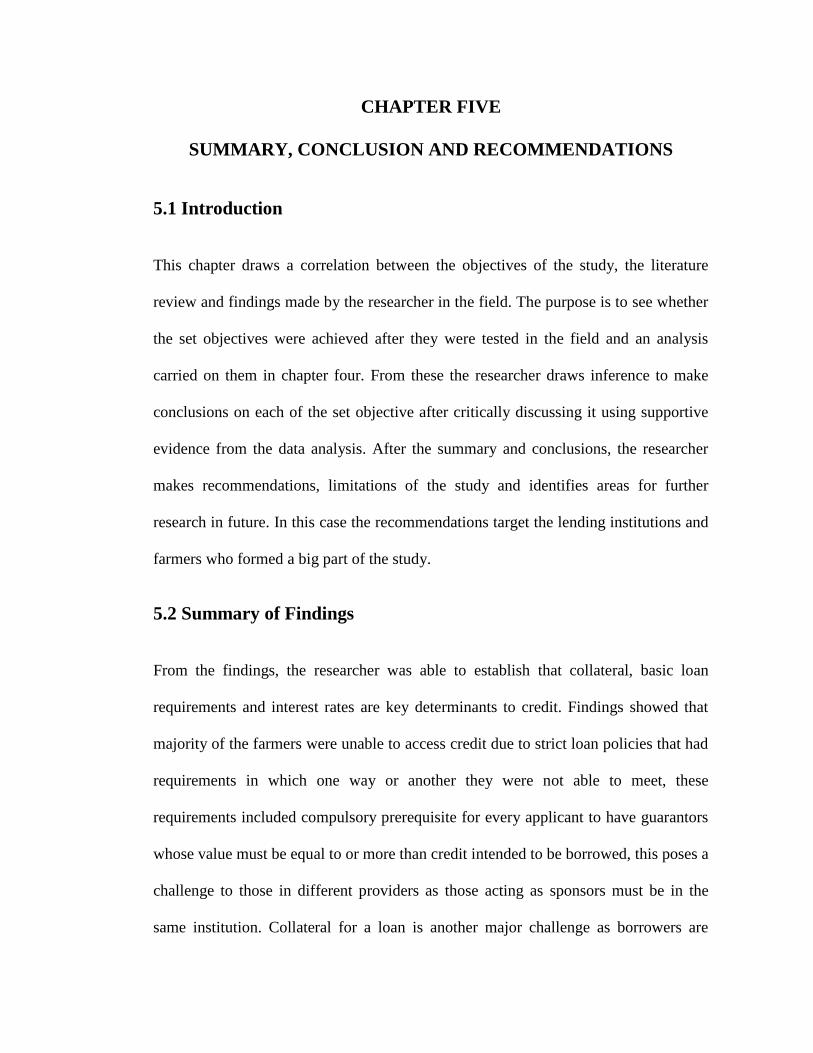
Table 4.6: ANOVA Table
Model Sum of Squares df Mean Square F Sig.
1 Regression 6.057 4 1.514 19.22 .001
Residual 1.620 26 .062
Total 7.677 30
For 5% level of significance, the numerator df=4 and denominator df=26, computed F
value is 19.22% Hence, the regression model is statistically significant, meaning that it is
a suitable prediction model for assessing determinants of access to credit.
The researcher also wanted to know the opinion of farmers from their point of view as to
why they thought it was difficult to get credit from banks and other financial institutions,
they mentioned among others; lack of security for the loan, lack of adequate information
on available loan products for farmers, distance from lenders as farmers are far from
town centres where this institutions are located. Others mentioned strict restrictions to
loans being granted to agriculture industry since lenders consider investments to this
industry uncertain and unpredictable.

Figure 4.8 What Lenders should do to encourage farmers apply for credit
From the findings above, the researcher established that 42% of the respondents
suggested that credit providers should set up rural branches to encourage farmers apply
for credit, this would mean that proximity to this institutions is fast hence borrowers will
not have to travel long distances to get this service. 13% said that the providers should
educate farmers on loan products and how to apply, what is required and how long it will
take before a loan is granted, 36% suggested that they provide a variety of loan products
for farmers to choose from while 9% thought upgrading infrastructure like
communication in farming areas would encourage farmers to apply. These suggestions if
taken into consideration would play an important role in ensuring farmers access credit.
42%
13%
36%
9%
What Lenders should do
Set up Rural Branches
Educate Farmers on Loans
Provide variety of Loan
Products
Upgrade Infrustructure
CHAPTER FIVE
SUMMARY, CONCLUSION AND RECOMMENDATIONS
5.1 Introduction
This chapter draws a correlation between the objectives of the study, the literature
review and findings made by the researcher in the field. The purpose is to see whether
the set objectives were achieved after they were tested in the field and an analysis
carried on them in chapter four. From these the researcher draws inference to make
conclusions on each of the set objective after critically discussing it using supportive
evidence from the data analysis. After the summary and conclusions, the researcher
makes recommendations, limitations of the study and identifies areas for further
research in future. In this case the recommendations target the lending institutions and
farmers who formed a big part of the study.
5.2 Summary of Findings
From the findings, the researcher was able to establish that collateral, basic loan
requirements and interest rates are key determinants to credit. Findings showed that
majority of the farmers were unable to access credit due to strict loan policies that had
requirements in which one way or another they were not able to meet, these
requirements included compulsory prerequisite for every applicant to have guarantors
whose value must be equal to or more than credit intended to be borrowed, this poses a
challenge to those in different providers as those acting as sponsors must be in the
same institution. Collateral for a loan is another major challenge as borrowers are
required to attach their assets like land and machinery; a challenge in this aspect arises
where a farmer
5.3 Conclusions
This paper examined the various determinants of access to credit for farmers. The data
collected from Cherangany constituency was used to identify and analyze these
determinants. The main factors explaining inaccessibility to credit were found to be
security for the applied credit, strict loan policies for applicants in the agriculture
sector, high interest rates charged on loans, proximity to financial institutions and lack
of proper and accurate information on available credit. The study results show that
farming has limited access to credit services in Cherangany, a situation which has
constrained the agricultural development in this expanse. The findings indicate that
lending institutions have inadequate products for meeting credit needs of the farming
society since the yardstick they use to assess their creditworthiness is same with all
applicants from other sectors. Commercial banks were found to have no specific
products designed for farmers and above all, most of the credit conditions are too
difficult for farmers to meet. Interest rates charged by the banks and collateral
requirements largely restricted them from seeking loans from these sources.
These findings no doubt show that farmers have inadequacy in accessing credit and
other financial services, and therefore it becomes a concept that must be looked in to
and ways developed to address the challenges facing farmers.
5.4 Recommendations
After making conclusions from the research findings, the researcher made the following
recommendations;
The government, banks as well as other lending institutions should consider the
possibility of coming up with policies and procedures geared towards catering for
specific credit needs for farmers by developing customized designed loan products
targeting farmers, e.g. coming up with a different loan product for a farmer who practices
horticulture farming, for those who practice perennial farming and dairy farming. Credit
to this various farming methods should be customized to each mode of farming as they
have different challenges and therefore would require different requirements and
assessment before credit is granted. These credits should also require minimal collateral.
The existing commercial banks need to be encouraged to lend to farmers. Government
owned institutions like Agricultural Finance Corporation and National Bank have to take
a principal role in extending credit facilities designed for the agriculture sector. It has to
take purposeful initiatives, like reducing the cost of lending and computerizing
operational systems in order to reduce operating costs. These exercises will make sure the
loans are more accessible and affordable to borrowers.
The establishment of bank branches in rural areas to serve the farming sector may not be
possible to the banking institutions thus the formation of farmer’s cooperatives, farmers
associations or other forms of group responsibility for the administration and supervision
of credit programmes at the local level should be promoted and encouraged. Group
lending approach may not only reduce the high operating cost costs associated with
lending in rural areas but may also encourage the establishment of good credit culture and
help in achieving acceptable loan products for farmers. The emergence of saving and
credit cooperatives (SACCOs) and saving and credit groups e.g. Kapsara Tea Sacco
should be encouraged to cater for other farmers as well as it caters for tea farmers only.
Provision of training to credit beneficiaries in aspects of credit should be enhanced; this
will ensure beneficiaries are well informed on their obligations, particularly on loan
requirements and repayment needs and therefore will make sound decisions on credit.
5.5 Limitations of the Study
The research was conducted in a small area and conclusions made with the researcher
assuming that findings from this area reflect what is in other parts of the country
which may not be the case as different regions have different set up as well as varied
challenges.
The provision of sustainable credit facilities to farmers is only one of the possible
factors that influence production especially in relation to availability of farm inputs.
There are many other factors and therefore the study will not explore these others.
Time and resources were limited and therefore the findings the researcher got used it
to generalize. Information made using generalization may sometime stray away from
accuracy thus giving conclusions which are not correct.
5.6 Suggestions for Further Research
The researcher suggests that further research study be carried out on farmers in other
parts of the country as this study only concentrated on those in Cherangany
constituency.
Research should be conducted to establish why there are no financial institutions and
MFI’s in Cherangany and other remote areas as a whole, and investigate possible reasons
that are hindering their establishment.
Research should also be conducted in banks to establish from their perspective what
hindrances exist that limit farmers to access credit compared to other borrowers.
REFERENCE
Adams, D.W. (2001). “AfDB Policy Guidelines for the Rural Financial Sub-sector”. African
Development Bank.
Anderson, S. and Baland J.M. (2002); “The Economics of ROSCAs and Intra-household
Resource Allocation,” Quarterly Journal of Economics, CXVII, pp 963–995
Andersson, A. (2006), “Poverty and Agricultural Development in Sub Saharan Africa” Expert
Group on Development Issues, Stockholm
Assefa, A. and Asfaw A. 2004. “The Role of Household Member's Education on the Adoption
of Agricultural Inputs under Different Environments in Ethiopia”. Agricultural
Economics, 215-228
Assefa, A., Ageba G., and Mulat D. (2005), “Rural Finance in Ethiopia: Assessment of the
Financial Products of Microfinance Institutions, Association of Ethiopian
Microfinance Institutions”, Occasional Paper number 12, Addis Ababa, January.
Atieno, R. 2001. “Formal and informal institutions” lending policies and access to credit by
small-scale enterprises in Keya: An empirical assessment. African Economic Research
Constortium, Nairobi.
Bali, S.R. (2001). ‘Demand, segmentation and rationing in the rural credit markets of Puri’.
Dissertation. Department of Economics, Uppsala University.
Bass, J.H, K and Weidemann Associates (2000): “The Microfinance Experience with Savings
Mobilization”. Innovations in Microfinance- Technical Note No. 3.

Bass, J. and Henderson, K. (2000). ‘Microfinance, Labour Markets and Poverty in Africa”
School of Public service, New York University
Bertran, M., Karlan, D., Mullainathan, S., Shafir, E., and Zinman, J., (2010). "What's
Advertising Content Worth? A Field Experiment in Consumer Credit Market":
Quarterly Journal of Economics forthcoming.
Bigsten, A., Collier, P., Dercon, S., Fafchamps, M., Gauthier, B., Gunning, J.W., Oduro, A.,
Oostendrop, R., Patillo, C., Soderbom, M., Teal, F., and Zewfack, A., 2003. ‘Credit
constraints in manufacturing enterprises in Africa’. Journal of African Economics
12(1): 104-125.
Doward, A., Jonathan, K., Fergus, L., Nigel, P., and Colin, P., (1998) “Commercial Financing
of Seasonal Input Use by Smallholders in Liberalised Agricultural Marketing
Systems”. London Overseas Development Institute (ODI).
Ellis, F. (1992), “Agricultural policies in developing countries”. School of development
studies. university of east Angelia, Cambridge university press.
Gonzalez, C. (2003), “Deepening Rural Financial Markets”: Macroeconomic Policy and
Political Dimension, the World Council of Credit Unions, Inc. (WOCCU)
Hudon, M. (2004); “New Challenges in Microfinance”: The Case for Extending its Range of
Financial Services’, Belgian Banking Review.
Hussien, H. (2007), “Farm Household Economic Behaviour in Imperfect Financial Markets”,
Doctorial Thesis, Swedish University of Agricultural Sciences, Uppsala.
Karlan, D. and Zinman, J. (2009); "Expanding microenterprise credit access: Using
randomized supply decisions to estimate the impacts in Manila". Yale University,
Dartmouth College, and Innovations in Poverty Action Working Paper
Kashuliza, A.K. and Kydd, J.G. (1996) ‘Determinants of bank credit access for small holder
farmers in Tanzania’: A discriminant analysis application. Saving and Development,
3: 285-97.
Kebede, K. (1995), ‘Agricultural Credit Analysis’. National Agricultural Policy Workshop.
Key, N. and Runsten, D. (1999). ‘Contract farming, smallholders, and rural development in
Latin America’. Elsevier Volume 27, Number 2, February 1999, pp. 381-401(21)
Kimuyu, P. and Omiti, J. (2000) ‘Institutional Impediments to Access to Credit by Micro and
Small Scale Enterprises in Kenya’. Institute of Policy Analysis & Research
Saunders, N. K., Adrian, T., Lewis, P. (2009) “Research Methods for Business Students’’
Oxford University Press
Meyer, R. (2002); ‘the Demand for Flexible Microfinance Products: Lessons from
Bangladesh’, Journal of International Development 14(3), pp. 351-368
Miller, C.J. and Jerry R.L. (1983), Factors Impeding Credit Use in Small Farm Households in
Bolivia. The Journal of Development Studies, 19(4): 523.
Mutua, J. and Oyugi, L. (2005) ‘Access to Financial Services and Poverty Reduction in Rural
Kenya’. Namibia. The Namibian Economic Policy Research Unit, 2005
Nyoro, J. (2002) Agriculture and Rural Growth in Kenya. Nairobi. Tegemeo Institute, Egerton
University.
Padmanabhan, K.H. 1996. ‘Rural credit’, lessons for rural bankers and policy makers,
London, UK.
Rahman, R.I. (1998): ‘Rural households’ attitude towards savings and demand for saving
services. Save the Children (USA).
Schmidt, R.H. and Kropp, E. 1987. “Rural finance guiding principles”. GTZ, Eschborn.
Townsend, R. (2008) ‘Agricultural Incentives in Africa: Policy Challenges’. Washington DC.
http://www.kenyampya.com/index.php?county=Trans%20Nzoia
http://www.extensionconference2011.cta.int/node/111
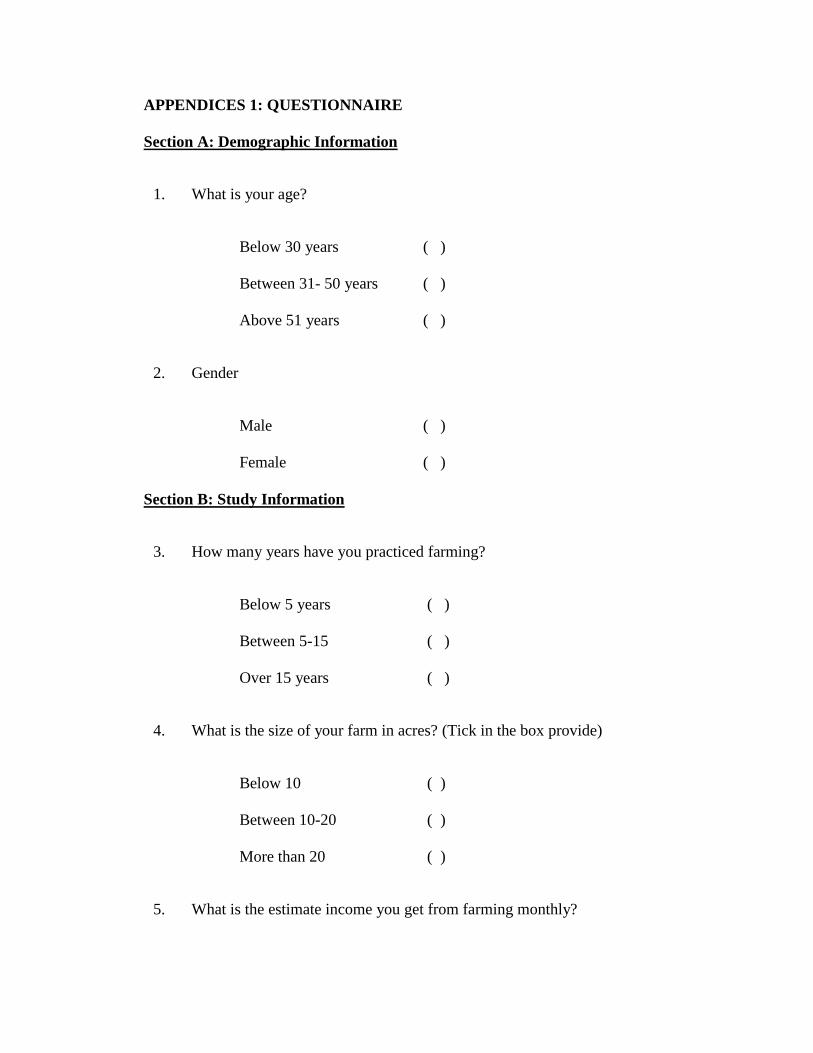
APPENDICES 1: QUESTIONNAIRE
Section A: Demographic Information
1. What is your age?
Below 30 years ( )
Between 31- 50 years ( )
Above 51 years ( )
2. Gender
Male ( )
Female ( )
Section B: Study Information
3. How many years have you practiced farming?
Below 5 years ( )
Between 5-15 ( )
Over 15 years ( )
4. What is the size of your farm in acres? (Tick in the box provide)
Below 10 ( )
Between 10-20 ( )
More than 20 ( )
5. What is the estimate income you get from farming monthly?
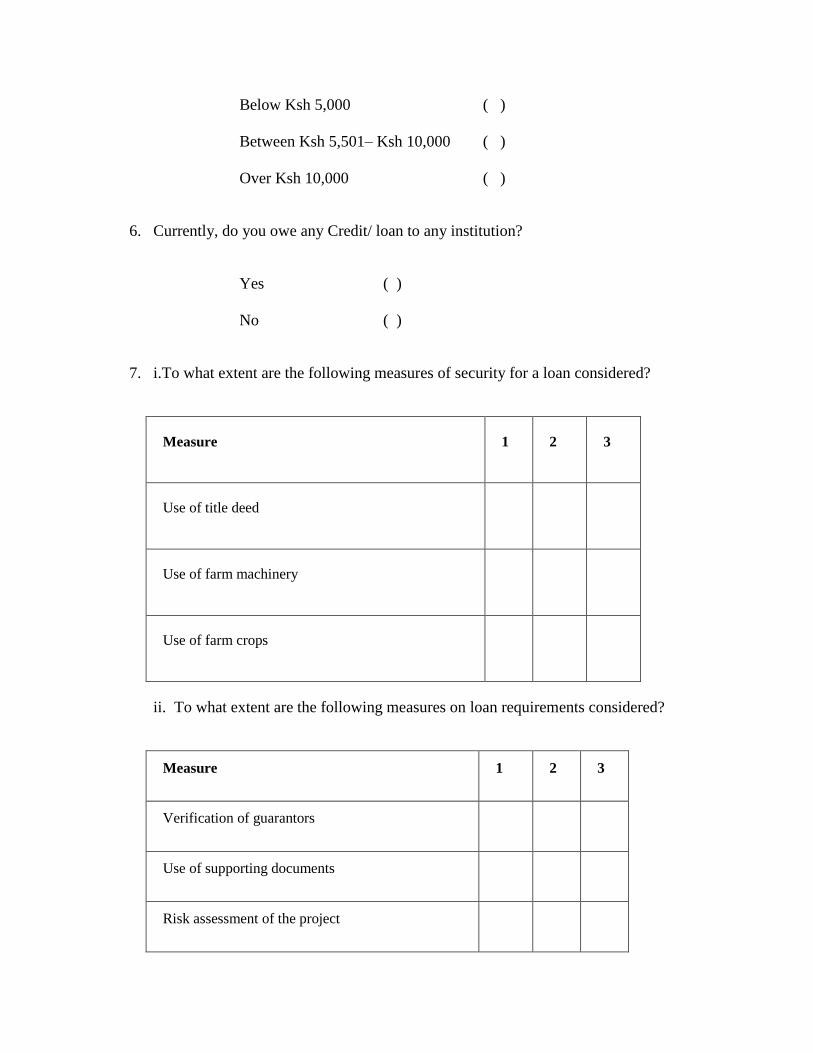
Below Ksh 5,000 ( )
Between Ksh 5,501– Ksh 10,000 ( )
Over Ksh 10,000 ( )
6. Currently, do you owe any Credit/ loan to any institution?
Yes ( )
No ( )
7. i.To what extent are the following measures of security for a loan considered?
Measure 1 2 3
Use of title deed
Use of farm machinery
Use of farm crops
ii. To what extent are the following measures on loan requirements considered?
Measure 1 2 3
Verification of guarantors
Use of supporting documents
Risk assessment of the project
ii. To what extent are the following measures used to determine interest on a loan?
Measure 1 2 3
Projects risk level
Type of loan product
Possibility of default
Have you ever applied , what were the reason/s cited for you not qualifying? List them
i. ……………………………………………………………………………
ii. ……………………………………………………………………………
iii. ……………………………………………………………………………
8. If you answered No to question 6 above, please list down the reasons why you have
never applied for a loan
i. ……………………………………………………………………………
ii. ……………………………………………………………………………
iii. ……………………………………………………………………………
9. What is your source of money for labor, farm inputs, school fees, and other
investments?
Earnings from farm proceeds ( )
Credit facilities ( )

Other ( )
10. In your own opinion, what do you think are the reasons why it’s difficult for farmers
to access loans or credit in commercial banks and other lending institutions?
i. …………………………………………………………………………………
ii. ……………………………………………………………………………………
iii. ……………………………………………………………………………………
iv. ……………………………………………………………………………………
v. ……………………………………………………………………………………
11. What do you think should be done by credit providers to encourage farmers apply for
credit? Rank from the most important to the least i.e. 1 being most important and 4
least important
Action Rank
i. Set up rural branches/ agents to bring service near to farmers
ii. Educate farmers on need and benefits of loans
iii. Offer a variety of loan products farmers
iv. Upgrade infrastructure (e.g. communication/roads) in farming areas
Other(s) specify……………………………………………………………………