factors associated with student performance in ... · factors associated with student performance...
TRANSCRIPT
Factors Associated with Student Performance in Intermediate Accounting: A Comparative Study at Commuter and Residential Schools
Mostafa M. Maksy
Kutztown University of Pennsylvania
Of the three motivation factors, the grade the student intends to earn had a strong association with student performance at the commuter school but a weak one at the residential school. Intention to take the CPA exam or attend graduate school had no associations with student performance at either school. The same with respect to self-perceived writing, reading and listening abilities and the distraction factors of job hours, job type, and course load. Math ability and GPA had strong associations with student performance at the commuter school only. Intermediate Accounting I grade is a strong predictor of student performance at both schools. INTRODUCTION
Several prior research studies have explored various factors (e.g., general academic performance,
aptitude, prior exposure to mathematics, prior exposure to accounting, age, gender, motivation, effort, and other intervening variables) that are associated with student performance in college-level courses. It is widely believed that motivation and effort significantly influence individual performance in college. However, as the review of prior research below indicates, few studies have investigated their impact on accounting education. This study investigates the associations between some selected motivation and distraction factors and student performance in the undergraduate Intermediate Accounting II course. The study also investigates whether students’ self-perceived abilities (such as writing, math, reading and listening) have any associations with their performance in this course. Maksy (2012) investigated student performance in the Intermediate Accounting II course at a commuter university. One of the limitations of Maksy’s study was that the study was conducted at a commuter school. He stated “we do not know whether the results will be the same for residential schools.” One of the suggestions for future research was to replicate the study at a residential school. In this study, the author does not only replicate the study at a residential school but also collects new data from students at a commuter school of similar characteristics to those of the residential school to determine whether factors affecting student performance at commuter schools are generalizable to residential schools. It is not the objective of this paper to show the impact of the distinction between these two types of schools on student performance, nor to show that students at commuter schools have different motivations and distractions than students at residential schools. On the contrary, the objective of the paper is to show that there are no major differences and most of the results are generalizable to both types of schools. If major differences exist, a suggestion for future research would be to conduct a new study to investigate the possible reasons for the differences. As proxies for motivation, the study uses a variety of factors: the grade the students intend to earn in the course, intention to take the Certified Public Accountant (CPA) examination, and intention to
86 Journal of Applied Business and Economics vol. 16(5) 2014
pursue graduate studies. As proxies for distraction, the study uses the number of hours of work per week, the type of job (especially if it is not related to accounting or business), and the number of courses taken per semester. To control for prior actual ability, the study uses two other factors: the grades earned in Intermediate Accounting I and overall Grade Point Average (GPA.) Student performance, the dependent variable, is measured once by the letter grade and another time by the total points earned in the course.
The study’s objectives are predicated on the assumption that identifying some factors that motivate students to perform well and some factors that distract them from performing well may help us to emphasize the motivation factors and discourage the distraction factors. For example, if educators know that student intention to sit for the CPA exam motivates students to study hard and earn higher grades in the Intermediate Accounting II course, during advising, educators may encourage their students to plan to sit for the CPA exam. Also, if educators know that the type of job (especially if it is not related to accounting) does not have an effect on student performance, they may not discourage their students to have non-accounting-related jobs. Similarly, if working too many hours (within a relevant range of, let us say, 0 to 40 hours a week) does not have an effect on student performance, educators may not advise students that have low grades that they must reduce their work hours per week. Educators may advise their students to make sure, regardless of how many hours they work per week, to devote sufficient time to their study and to make sure that they are using good study habits. Of course, some students heed their educators’ advice and some do not. Educators have no control over that.
The remaining parts of the paper present a review of prior research, discussion of the study objectives and hypotheses development, research methodology, and results. The paper ends with conclusions, recommendations, study limitations, and some suggestions for further research. LITERATURE REVIEW
Many prior studies have explored various factors (e.g., general academic performance, aptitude, prior exposure to mathematics, prior exposure to accounting, motivation, effort, and other intervening variables) that are associated with student performance in college-level courses. The Grade Point Average (GPA) is used frequently as a proxy for prior academic performance and aptitude. Several researchers, using US data, find evidence supporting GPA as a significant predictor of performance in accounting courses (Eckel and Johnson 1983; Hicks and Richardson 1984; Ingram and Peterson 1987; Eskew and Faley 1988; Doran et al. 1991, and Maksy and Zheng 2010). Wooten (1998) finds that aptitude is a significant variable in influencing performance of the traditional students in introductory accounting. In contrast, he finds that current performance of nontraditional students does not seem contingent on previous academic success. Maksy and Zheng (2008) find that the grade in Intermediate Accounting II is a strong predictor of student performance in the Advanced Accounting and Auditing courses. The research findings in the US are supported in Australia by Jackling and Anderson (1998) and in Scotland by Duff (2004). In Wales, Lane and Porch (2002) find that, in introductory accounting, performance can partially be explained by reference to factors in the students’ pre-university background. However, these factors are not significant when the student progresses to upper level accounting classes. In addition, using another measure, pre-university examination performance, Gist, et al. (1996) find no significant association between academic performance and performance in accounting courses at the university level.
Because accounting is a subject area that requires accumulation of prior knowledge and considerable quantitative skills, several studies have investigated the impact of prior exposure to mathematical background and accounting courses on performance in college accounting courses. The results are inconclusive. On the one hand, some studies (for example, Baldwin and Howe 1982; Bergin 1983; and Schroeder 1986) find that performance is not significantly associated with prior exposure to high school accounting education. On the other hand, some later studies (for example, Eskew and Faley 1988; Bartlett et al. 1993; Gul and Fong 1993; Tho 1994; Rohde and Kavanagh 1996) find that prior accounting knowledge, obtained through high school education, is a significant determinant of performance in college-level accounting courses. Ambiguity is also present with respect to the influence of mathematical background on performance in accounting courses. For example, Eskew and Faley (1988) and Gul and
Journal of Applied Business and Economics vol. 16(5) 2014 87

Fong (1993) suggest that students with strong mathematical backgrounds outperform students with weaker mathematical backgrounds. By contrast, Gist et al. (1996) do not report the same results. Additionally, Guney (2009) suggests that grades in secondary education mathematics are a very strong determinant of performance in accounting but only for non-accounting majors.
Bartlett et al. (1993) concluded that very few educational, demographic or financial characteristics variables appear to have a significant influence on student performance in university accounting examinations. Gracia and Jenkins (2003) observe that students who actively demonstrate commitment and self-responsibility towards their studies tend to do well in formal assessments. Accordingly, they agree with Bartlett et al. (1993) that intervening variables, rather than demographic variables, may be important determinants of student performance in university accounting examinations. They are also in agreement with Lane and Porch (2002) who suggest that other important factors like student motivation may explain student performance.
The influence of motivation and effort on student performance has been studied. Pascarella and Terenzini (1991) report that motivation and effort, among other factors, significantly influence individual performance in college. However, using self-reported data, Didia and Hasnat (1998) present counter-intuitive evidence that the more time spent studying per week, the lower the grade in the introductory finance course. However, the significance of this counter-intuitive result was at the weakest level (.10), appeared in only one of the four models they used, and most likely was due to the fact that they did not control for prior actual ability (i.e. GPA) even though it was one of their study variables. In this study, the author uses two prior actual ability factors (GPA and the Grade in Intermediate Accounting I) for control purposes. Also, using self-reported data, Nofsinger and Petry (1999) find no significant relationship between effort and performance. In contrast, Johnson et al.(2002) utilize computerized quizzes and analyze the effect of objectively measured effort on student performance. Their evidence shows that, after controlling for aptitude, ability, and gender, effort remains significant in explaining the differences in performance. Additionally, Maksy and Zheng (2008) find that the grade the student intends to earn (which they used as a proxy for motivation) in Advanced Accounting and Auditing courses is significantly associated with the student’s performance in those two courses.
In recent years, there has been increased interest in studying the influence of intervening variables on student performance. Paisey and Paisey (2004) and Guney (2009) show there is a clear positive relationship between attendance and academic performance. Paisey and Paisey also report that the most frequently cited reason for not attending classes was students’ participation in part-time employment. Similarly, Lynn and Robinson-Backmon (2005) find a significant adverse association between employment status and learning outcomes. These authors also indicate that a student’s self-assessment of course learning objectives is significantly and directly related to grade performance. In contrast, Maksy and Zheng (2008) find no significant negative association between the number of hours of work per week and student performance in Advanced Accounting and Auditing courses. Schleifer and Dull (2009) address metacognition in students and find a strong link between metacognitive attributes and academic performance. Metacognition is frequently described as “thinking about thinking” and includes knowledge about when and how to use particular strategies for learning and for problem solving.
Despite the fact that prior research has been largely inconclusive or replete with conflicting results, it is not the objective of this study to resolve this diversity of results. The literature review is conducted to show what was done in the past in relation to student performance and to make sure that this study does not repeat a prior study but adds to what was done. The author hopes, in this study, to provide more insight on those areas in which there was general agreement. Since motivation and effort has generally been positively associated with student performance, this study tries to test whether some new selected motivation factors affect student performance. The study also looks at several factors which are commonly viewed as possibly distracting students from performing well and tests whether indeed they are negatively affecting student performance. Moreover, the study investigates the impact of two specific measures of prior abilities on student performance, and also uses them as control variables while testing for the association between motivation and distraction factors and student performance in the Intermediate II course.
88 Journal of Applied Business and Economics vol. 16(5) 2014

STUDY OBJECTIVES AND HYPOTHESES DEVELOPMENT
The first objective of the study is to investigate the association between three selected motivation factors (the grade the student intends to earn in the course, the student’s intention to take the CPA examination, and the student’s intention to attend graduate school) and the student’s performance in the Intermediate Accounting II course in a commuter school and a residential school to determine if the results are generalizable to both types of schools. Commuter schools in the United States are those that do not have any organized on-campus housing for the students. Students live at their privately-owned or rented housing and commute to school using public transportation (trains and/or busses) or their private vehicles. At residential schools, a majority of the students live in organized housing on campus (university-owned dormitories) or in private housing (surrounding the campus) that is approved by the university housing administration. Students walk to the classrooms and do not use any public or private transportation.
Student performance is measured in two ways: (1) the letter “grade” and (2) the total “points” (including quizzes, mid-term exams, term projects and the final exam before any upward curving made by the faculty) earned in the course. The author expects a significant association between each of these motivation factors and student performance in the Intermediate Accounting II course whether students attend a commuter or a residential school. The students were asked “what grade do you intend to earn in this course?” A student whose answer is “an A” is assumed to be motivated (for whatever reasons) to study hard to earn an A. Also, a student whose answer is “at least a B” is motivated but not as strongly as a student whose answer is “an A.” On the other hand, a student whose answer is “a C is fine with me” appears to be not that motivated at all. With respect to the second motivation variable, the assumption is that students who intend to sit for the CPA examination are more motivated (to study hard to be able to pass that exam) than students who do not intend to sit for the CPA exam. Similarly, for the third motivation variable, the assumption is that students who intend to go to graduate school are more motivated (to study hard to be able to get accepted at a good graduate school) than students who do not intend to go to graduate school.
The second objective of the study is to investigate the association between three selected distraction factors (the student’s number of working hours per week, the student’s type of job if it is unrelated to accounting or business, and the student’s number of courses taken per semester) and the student performance. The assumption is that if the number of work hours per week is too high, the student will not have enough hours to devote to the study of the Intermediate Accounting II course (as well as the other courses the student is taking) and, thus, the student’s performance in this course will suffer, i.e., it will be lower than if the student was not working that many hours or was not working at all. The author also assumes that if the student’s job is related to accounting the student may gain some practical accounting experience that might compensate for the fact that the student is not devoting enough hours to his or her study. In this case, the student’s performance may not be affected negatively as when the student’s job type is not related to accounting at all. Furthermore, the author assumes that if the student is taking too many courses (i.e., more than the usual average number of courses per semester) the student’s performance in these courses (including the Intermediate Accounting II course) will be affected negatively because the student will not be able to devote the appropriate number of hours of study for each course. In light of the above discussion, the author expects that if the student’s number of work hours per week is too high, and/or the type of the student’s job is not related to accounting, and/or the number of courses taken per semester is too high, there will be a significant negative association between these distraction factors and student performance. Of course, distraction factors may offset each other, thereby cancelling out any single factor’s effect. For example, a student who works too many hours per week may take fewer courses, and vice versa, so that there is no negative effect on performance. Similarly, residential school students may work less hours per week but take more courses each semester, while commuter school students may work more hours per week and take fewer courses per semester. For this reason, the study will test the effect of each distraction factor on student performance while once
Journal of Applied Business and Economics vol. 16(5) 2014 89
controlling for the other two factors and another time controlling for the other two factors as well as the prior actual ability factors (the grade in Intermediate Accounting I and overall GPA).
The third objective of the study is to investigate whether students make reasonably accurate evaluations of their writing, math, reading, and listening abilities. If they make reasonably accurate evaluations of these abilities, we would expect positive and significant associations between these abilities and students’ performance in the Intermediate Accounting II course. On the other hand, if there are no positive and significant associations between these abilities and students’ performance, this would indicate that students do not make reasonably accurate evaluations of their abilities. In this case, instructors need to continuously give the students feedback about their performance in the course throughout the semester, so students can self- improve. Without such feedback, the author argues that most students will over-estimate their own abilities in these areas and rate them as either “good” or “very good” rather than “average” or “poor.”
As indicated in the literature review above, almost all prior studies showed positive and significant associations between prior ability factors (most commonly GPA) and student performance in college courses. The author expects this to be the case in this study as well. With regard to all three objectives of this study, the author uses two prior actual ability factors (the student’s grade in Intermediate Accounting I and the student’s overall GPA) to control their impact on student performance in the Intermediate Accounting II course. Based on the above discussion, the author formulates the following hypotheses: Motivation Factors: H1: There is a significant association between the grade the student intends to earn and student
performance. This is the case whether the student attends a commuter or a residential school. H2: There is a significant association between the student’s intention to take the CPA Exam and student
performance. This is the case whether the student attends a commuter or a residential school. H3: There is a significant association between the student’s intention to attend graduate school and
student performance. This is the case whether the student attends a commuter or a residential school.
Distraction Factors: H4: There is a significant negative association between the student’s number of working hours per week
and student performance. This is the case whether the student attends a commuter or a residential school.
H5: There is a significant negative association between the student’s type of job (if it is not related to
accounting) and student performance. This is the case whether the student attends a commuter or a residential school.
H6: There is a significant negative association between the student’s number of courses taken per
semester and student performance. This is the case whether the student attends a commuter or a residential school.
Self-Perceived Ability Factors: H7: There are no significant associations between the student’s self-perceived (a) writing, (b) math, (c)
reading, and (d) listening abilities and student performance in the Intermediate Accounting II course. This is the case whether the student attends a commuter or a residential school.
90 Journal of Applied Business and Economics vol. 16(5) 2014

Control Factors: H8: There is a significant association between the grade the student earned in Intermediate Accounting I
and student performance. This is the case whether the student attends a commuter or a residential school.
H9: There is a significant association between the student’s overall GPA and student performance. This is
the case whether the student attends a commuter or a residential school. METHODOLOGY Survey Questionnaire
The author modified a list of survey questions, from Ingram et al. (2002), to include, besides the study variables, some demographic and other information, and distributed it to students in the Intermediate Accounting II course at a commuter school and a residential school. For ethical, confidentiality, and potential risk issues pertaining to participants, the author had to submit a comprehensive 10-page application (together with a copy of the survey instrument) to the University’s Institutional Review Board (IRB) for approval. Prior to that, the author had to take the National Institute of Health (NIH)’s training course titled “Protecting Human Research Participants,” and pass the test given at the end of the course. The certificate of completion of the course was required to be submitted with the application to the University’s IRB. The University’s IRB required the author to include the statement “participation in the survey is completely voluntary” in the survey instructions. Data Collection and Measurement of Variables
The data on the survey questionnaire were collected from all of the 96 students enrolled in the Intermediate Accounting II course at a commuter school and all of the 42 students enrolled in the same course at a residential school. Other than the fact that one school is a commuter school and the other is a residential one, the author selected two schools that are very similar in many respects. First, each school enrolls about 10,000 students, and the College of Business in each school enrolls about 1600 students. Second, both schools are public (or state-supported) universities where public access is a major part of their mission statements. According to the College Board, there are 502 four-year public universities (with enrollment greater than 2000 students) in the United States of America. Of these 502 universities, 246 are residential (most students live on campus) and 256 are commuter universities (See https://bigfuture.collegeboard.org/college-search.) The College Board is a highly respected not-for-profit organization committed to excellence and equity in education in the US. The Board’s mission is to connect students to college success and opportunity (See http://about.collegeboard.org/). Excluding the flagship state university of each of the 50 states (because of exceptionally large student body, high academic rigor, etc.,) the two schools used in the study are representative of about 450 public universities in the U.S. Third, at both universities, faculty members are represented by a union that negotiates compensation and work conditions with the state on behalf of the faculty. With minor exceptions, each faculty member receives the same percent salary increase (if any) each year. Fourth, both universities are non-AACSB accredited but both are in the AACSB candidacy stage, i.e., both received a letter from the Association to Advance Collegiate Schools of Business (AACSB International) notifying them that their application for accreditation has met the minimum requirements and they are candidates for accreditation). Fifth, both universities are located either in or very near one of the largest cities in the United States. Thus, because of the major similarities between the two schools, the author assumes that any differences in the study results, if any, between the two schools should be largely attributed to the fact that one university is a commuter and the other is a residential school. The data was collected in fall 2010 from three sections of the Intermediate Accounting II course offered at the commuter school, and in spring 2011 from two sections of the same course offered at the residential school. All five sections in both schools were taught by the same instructor and, thus, instructor’s effect, if any, on the results at each school should not be a major concern. Because a small number of students failed to list their identification
Journal of Applied Business and Economics vol. 16(5) 2014 91

(ID) numbers on the questionnaire, their responses were excluded from the study. The final sample included 93 useful responses from the commuter school and 40 from the residential school. While all the data representing the independent variables are primary data, the author verified the data representing the control variables (student grades in Intermediate Accounting I and overall GPAs) with the school records using only the students ID numbers (for confidentiality reasons) and with the permission of the Dean of the College of Business. The data representing the two dependent variables (the letter “grade” and total “points” received for the course) were obtained directly from the faculty teaching the course, again using only students ID numbers for confidentiality concerns. Data Analysis
To test the hypotheses, the author used statistical methods that are similar to those used in Maksy and Zheng (2008) which was similar to this study but was conducted at a commuter school only. The author used One-Way Analysis of Variance (ANOVA), and regression analysis to determine the potential associations between the 12 independent variables and the two dependent variables. Because the dependent variable “grade” is ordinal, the author used the Spearman correlations non-parametric test to determine the potential associations between “grade” and the independent variables. The author used the Pearson correlations test to determine the potential associations between “points” and the independent variables. To control for the prior actual ability factors, the grade earned in Intermediate Accounting I (GIA1) and the overall Grade Point Average (GPA), the author used partial correlations. Because the number of job hours (JHours) per week, the job type (JType), and the course load (CLoad) per semester may offset the effect of each other on student performance, the author used partial correlations to determine the association between student performance and JHours while controlling for JType and CLoad. The author repeated the same process to determine the association between student performance and JType while controlling for JHours and CLoad, and the association between student performance and CLoad while controlling for JHours and JType. Furthermore, the author repeated the above three processes while controlling for GIA1 and GPA in addition to the two distraction factors. RESULTS OF THE STUDY
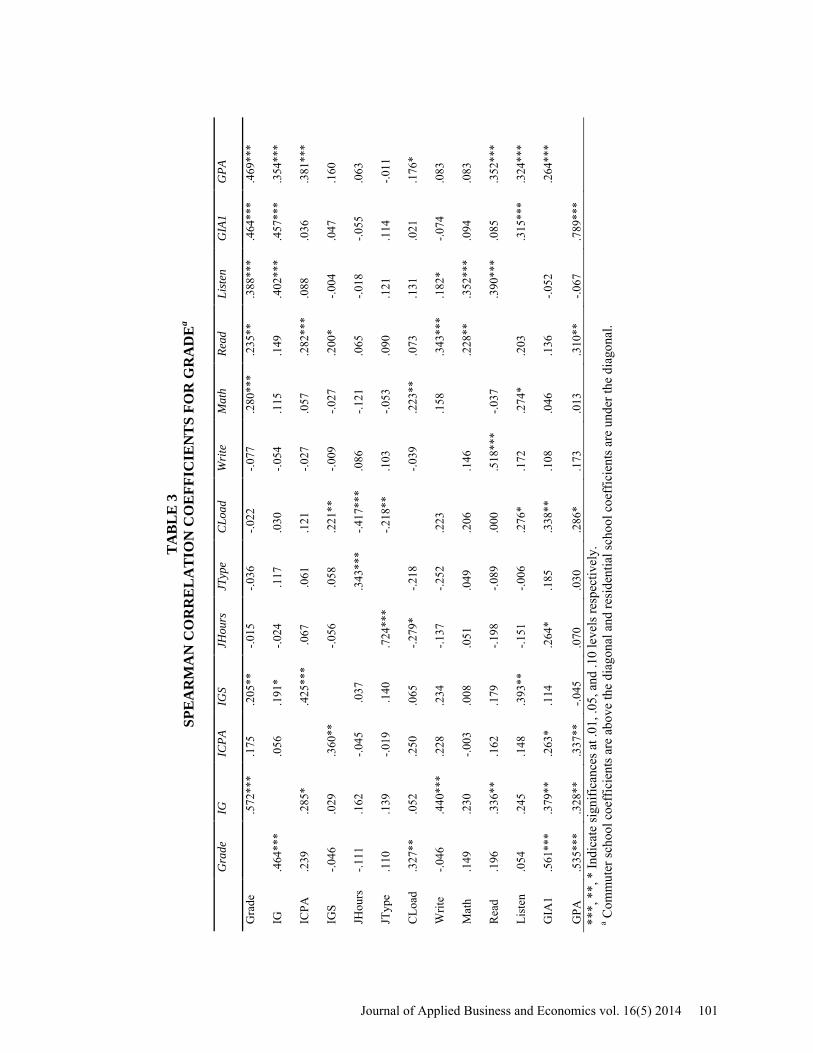
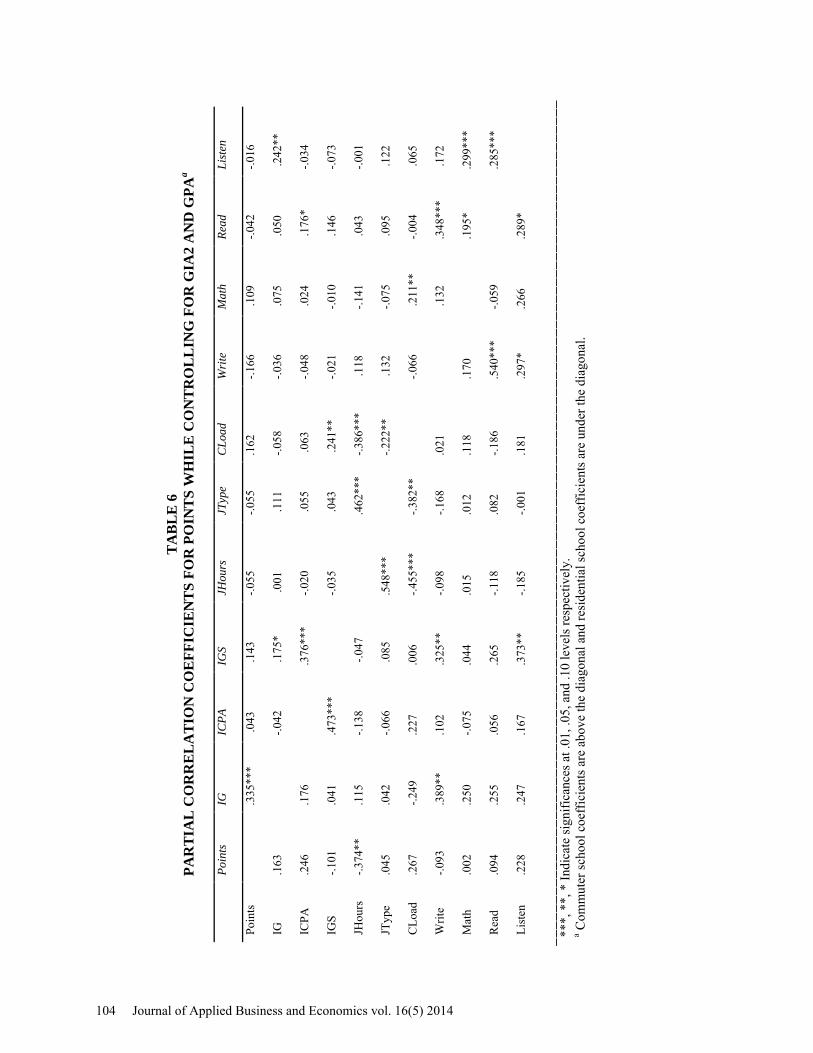
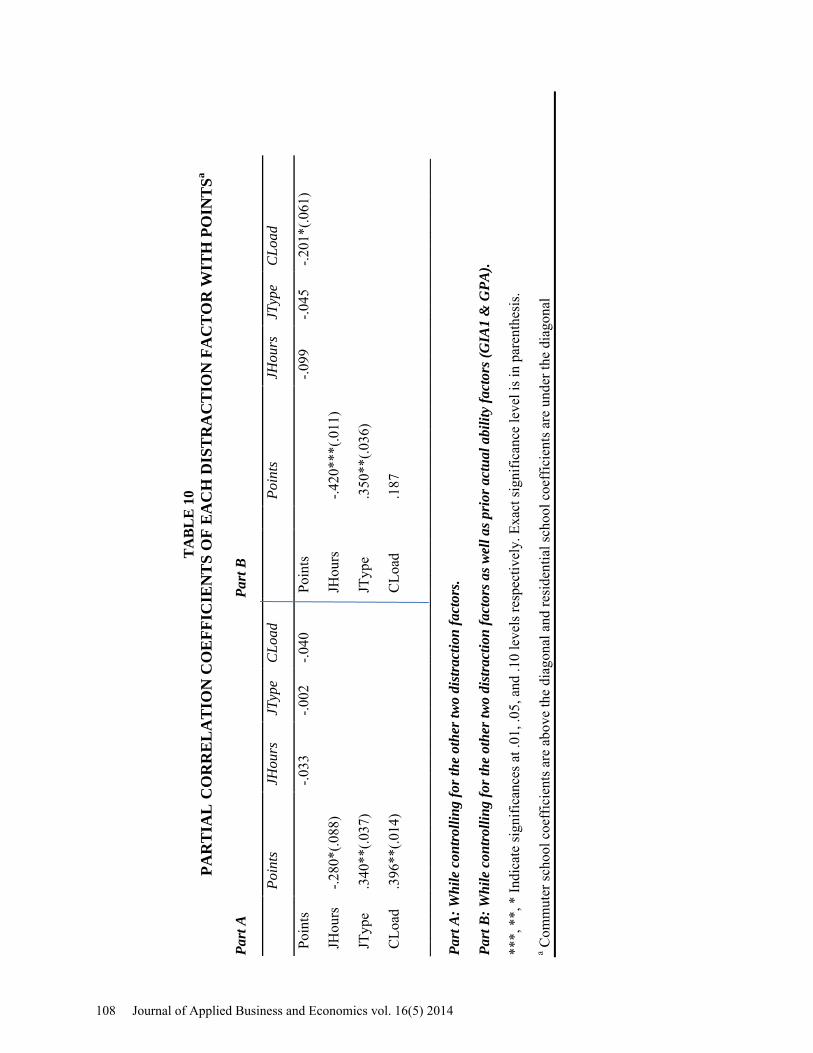
TABLE 1 presents the ANOVA results using “grade” and TABLE 2 presents the ANOVA results using “points” as a measure of student performance. TABLE 3 presents Spearman correlations for “grade” and TABLE 4 presents Pearson correlations for “points.” TABLE 5 presents partial correlations for “grade” while controlling for GIA1 and GPA and TABLE 6 presents partial correlations for “points” while controlling for the same prior actual ability variables. TABLE 7 presents regression analysis of the 12 independent variables on “grade” and TABLE 8 presents regression analysis of the 12 independent variables on “points.” Part A of TABLE 9 presents partial correlations for each distraction factor with “grade” while controlling for the other two distraction factors and Part B presents partial correlations for each distraction factor with “grade” while controlling for the other two distraction factors as well as GIA1 and GPA. Part A of TABLE 10 presents partial correlations for each distraction factor with “points” while controlling for the other two distraction factors and Part B presents partial correlations for each distraction factor with “points” while controlling for the other two distraction factors as well as GIA1 and GPA.
The author analyzes below the results of the study by the type of factors investigated. Motivation Factors Associated with Student Performance
At the commuter school, as TABLES 1 to 8 indicate, of the three motivation variables discussed in H1 to H3, one variable, the grade the student intends to earn in the course, is significantly associated (at the .01 significance level) with student performance (defined as “grade” or as “points) under all tests even after controlling for the prior actual ability factors (GIA1 and GPA). As TABLES 1 to 4 indicate, another motivation variable, intention to take the CPA exam, is also significantly associated with student performance (defined as “grade” or “points”) but at a lower significance level (.05 or .10) under the ANOVA and correlation tests. However, as TABLES 5 and 6, after controlling for the prior actual ability
92 Journal of Applied Business and Economics vol. 16(5) 2014

factors, this significant association totally disappeared. The third motivation variable, intention to attend graduate school, is significantly associated with student performance (at the .05 significance level when performance is defined as “grade” and at the .10 level when it is defined as “points”). After controlling for the prior ability factors, the association either became weaker (.10 level when performance is defined as “grade”) or totally disappeared (when performance is defined as “points”).
At the residential school, as TABLES 1 to 8 indicate, of the three motivation variables discussed in H1 to H3, one variable, the grade the student intends to earn in the course, is significantly associated with student performance. That association is stronger (at the .01 significance level however performance is defined) under the ANOVA and correlation tests but weaker (at the .05 level when performance is defined as “points’ and the .10 level when it is defined as “grade”) under the regression tests. However, as TABLES 5 and 6 indicate, after controlling for the prior actual ability factors, (GIA1 and GPA) this strong significant association totally disappeared. As TABLES 1 to 6 indicate, the second motivation variable, intention to take the CPA exam, is also significantly associated with student performance (only when it is defined as “points”) but at a lower significance level (.10 under the ANOVA and .05 under the Pearson correlation test.) However, after controlling for the prior actual ability factors, this significant association totally disappeared. The third motivation variable, intention to attend graduate school, is not significantly associated with student performance (however defined) under any test.
The above discussion indicates that the statistical analyses provide some support to H1 (that there is a significant association between the grade the student intends to earn and student performance) but only at the commuter school. The statistical analyses do not provide support to H2 and H3 at either school. This means that intentions to take the CPA exam and/or to go to graduate school are not motivating students to study hard to earn high grades in the Intermediate Accounting II course at either school. In other words, while most students at both schools responded that they intend to take the CPA exam and/or go to graduate school most of them did not earn high grades. It is not quite clear why this is the case. One explanation is that there is no penalty for responding yes for intention to take the CPA exam and/or go to graduate school. So, few students responded “may be” and even fewer responded “no.” In the end, just a few students received an “A” for the course. Distraction Factors Associated with Student Performance
At the commuter school, as TABLES 1-8 indicate, with the exception of a moderate (at the .05 level) significant negative association between course load and student performance (defined as “grade” or “points”) only under the regression tests, none of the three distraction factors has any significant negative association with student performance. After controlling for the other two distraction factors (JHours and JType) as well as prior ability factors (GIA1 & GPA), course load still has a weak (i.e., significant only at the .10 level) negative association with student performance but only when it is defined as “points.”
At the residential school, the associations between distraction factors and student performance are not quite as clear as at the commuter school. For example, the regression tests show negative association (significant at the .01 level when performance is defined as “grade” and at the .05 level when it is defined as “points”) between job hours and performance. However, the correlation tests do not show these negative associations between job hours and student performance until the author controls for the prior ability factors or for the other two distraction factors as well as the prior ability factors. The negative association between job hours and student performance is more significant (at the .05 level) when student performance is defined as “points” than when it is defined as “grade (.10 level.) As to the association between job type and student performance, only the regression tests show positive association (at the .05 ;level) and only when student performance is defined as “grade.” When the author controls for the other two distraction factors only or the other two distraction factors as well as the prior ability factors, these moderate positive associations between job type and student performance appear even when student performance is defined as ‘points.” The ANOVA tests and correlations tests show positive (not negative) association between course load and student performance (mostly at the .05 level of significance) even when the author controls for the other two distraction factors. However, once the author controls for prior ability factors, these positive associations between course load and performance totally disappear.
Journal of Applied Business and Economics vol. 16(5) 2014 93

In light of the above discussion, the author can generally state that the statistical analyses provide support to H5 (especially at the residential school) but do not provide support to H4 or H6. An exception to this general statement is that, there is an indication that the students at the residential school who have an accounting-related job will have better performance in the Intermediate Accounting II course than students whose jobs are non-accounting-related (even if they carry the same course load and work about the same number of hours per week.) Self-Perceived Abilities Factors Associated with Student Performance
At the commuter school, as TABLES 1 to 8 indicate, the self-perceived writing ability has no significant association with student performance (however defined) under any test. The self-perceived reading ability has a significant association (at the .05 level) with student performance (but only under the correlation test and only when student performance is defined as “grade.”) However, after controlling for the actual ability factors, that association totally disappeared. The self-perceived math ability has a significant association (at the .01 level under the correlation test and the .05 level under the ANOVA and regression tests) with student performance (but only when student performance is defined as “grade.”) However, after controlling for the actual ability factors, the significance of the association under the correlation test decreased from the .01 level to the .05 level. The self-perceived listening ability has a significant association under the ANOVA and correlation tests (at the .01 level when student performance is defined as “grade” and at the .05 level when student performance is defined as “points.”) However, after controlling for the actual ability factors, the significance of the association under the correlation tests totally disappeared.
At the residential school, as TABLES 1 to 8 indicate, the self-perceived ability factors have sporadic and rare associations with student performance. For example, the self-perceived listening ability has no significant association with student performance (however defined) under any test. The self-perceived writing ability has a significant association with student performance (but only at the .10 level and only under the regression test when student performance is defined as “grade.”) Similarly, the self-perceived reading ability has a significant association with student performance (but only at the .10 level and only under the ANOVA test when student performance is defined as “grade.”) Finally, the self-perceived math ability has a significant negative association (at the .05 level) with student performance (but only under the regression test when student performance is defined as “points.”) While the positive, even though weak, associations between self-perceived writing and reading abilities and student performance are understandable, the negative association between the self-perceived math ability and student performance is surprising and counter-intuitive. Possibly, this counter-logical association is a statistical anomaly, but most likely it is caused by the fact that students with lower performance in Intermediate Accounting II have substantially over-estimated their self-perceived math abilities by checking the top-rated “very good” response or the second-highest “good” response. A cross-tabulation analysis between “points” and math ability (which is available from the author upon request) shows that of the 40 students completing the survey, 19 (or 47.5%) checked the top-rated “very good” response, 20 students (or 50%) checked the second highest response “good” and only one student (or 2.5%) checked “average” No students checked “poor” about how they feel about their math ability. Furthermore, of the 19 students who checked the top-rated “very good” response no one earned 90 points or more (out of 100), only three (or 16%) received between 80 and 89 points, eight (or 42%) received between 70 and 79 points, six (or 32%) received between 60 and 69 points, and two (or 10%) received less than 60 points. Similarly, of the 20 students who checked the second highest “good” response only two (or 10%) received 90 or more points, only two (or 10%) received between 80 and 89 points, four (or 20%) received between 70 and 79 points, nine (or 45%) received 60 and 69 points, and three (or 15%) received less than 60 points. The only student who checked “average” received less than 60 points.
Prior Actual Ability Factors Associated with Student Performance
At the commuter school, as TABLES 1-4, 7, and 8 indicate, the two variables representing prior actual ability (GIA1 and GPA) have significant associations, at the .01 level, with student performance
94 Journal of Applied Business and Economics vol. 16(5) 2014

(however defined). However, that is not the case at the residential school. For example, the regression tests do not show any significant associations between GIA1 and GPA and student performance. Also, the ANOVA tests do not show any significant associations between GPA and student performance. Only the correlation tests show significant associations (at the .01 level) between GIA1 and GPA and student performance. The ANOVA tests show significant associations, at the .01 level, between GIA1 and student performance when it is defined as “grade” and at the .05 level when it is defined as “points.”
CONCLUSIONS AND RECOMMENDATIONS
One general conclusion of the study is that residential school students may not be as motivated as commuter school students to work hard to earn higher grades in the Intermediate Accounting II course. More specifically, all the tests used in the study provided strong evidence that the majority of the commuter school students who responded that they intend to earn high grades in the Intermediate Accounting II course ended up earning high grades. On the other hand, the study provided only moderate to weak evidence that this was the case with the residential school students. While a larger percentage of the residential school students (than the percentage of the commuter school students) responded that they intended to earn high grades in the Intermediate Accounting II course, a smaller percentage ended up earning such high grades. This indicates that the majority of the students were not really motivated enough to work hard to earn high grades. Other than the above difference, the study results are equally generalizable to commuter and residential schools. For example, speaking of motivation, intention to take the CPA examination and intention to pursue graduate studies do not seem, in this study, to be good motivating factors for either commuter school or residential school students to perform well in the Intermediate Accounting II course.
In light of the above general conclusion, the author recommends that, while accounting faculty (at both types of schools) should find ways to motivate their students to study hard to earn high grades, they should keep in mind that informing students to plan to sit for the CPA exam or get admitted to a good graduate school may not be good motivating factors. Thus, accounting faculty should think of other motivating factors that are not tested in this study.
Another general conclusion of the study is that, with some limited exceptions noted below, the distraction variables (i.e., working too many hours per week, working in non-accounting related jobs, and taking too many courses per semester) have no significant negative associations with student performance at either the commuter or residential school. That is, they are not distracting the students and preventing them from earning high grades in the Intermediate Accounting II course. One exception to this general conclusion is that there is a moderate evidence (but only under the regression analysis) of a negative association between the course load per semester and student performance at the commuter school. Another exception is that there is a strong evidence (especially when performance is measured as “points) of a negative association between job hours per week and student performance at the residential school. Specifically, of the students who carry the same course load and have the same type of job, those who work more hours have significantly lower performance than those who work less hours or do not work at all. Surprisingly, again only at the residential school, of the students who carry the same course load and work about the same number of hours per week, those whose jobs are accounting-related perform significantly better than those whose jobs are not accounting related. Also, of the students who work in the same type of job and work about the same number of hours per week, those who carry a higher course load perform significantly better than those who carry a lower course load.
In light of this conclusion, the author recommends that accounting faculty, when advising their students, should realize that working as few hours as possible will not necessarily lead to earning higher grades and working too many hours (within a relevant range of, let us say, zero to 40 hours a week) will not necessarily lead to earning lower grades. So, faculty need not automatically advise students with lower grades to significantly reduce their work hours, especially if the students have to work anyway to support themselves and/or their families. This is so because lower working hours will not necessarily and automatically lead to higher grades since students may not automatically devote the extra time to studying
Journal of Applied Business and Economics vol. 16(5) 2014 95
or they may have wrong study habits that they need to fix. Furthermore, if students have to work a significant number of hours anyway (even in non-accounting related jobs) to support their families, accounting faculty need not encourage those students to take as few courses per semester as possible, because higher course loads do not seem to lead to lower grades in the Intermediate Accounting II course. On the contrary, there is evidence that higher course loads lead to higher grades at the residential school.
A third general conclusion of the study is that, with some minor exceptions noted below, students at both the commuter and residential schools seem to over-estimate their own writing, math, reading, and listening abilities. This may be the case because students taking the Intermediate Accounting II course are not tested in these abilities and are not given feedback about these abilities. Lack of testing and continuous feedback, or delaying the feedback to the end or even close to the end of the semester, may put the students under the impression that they are doing just fine and, thus, they may not make any special effort to improve their performance. One exception to this general conclusion is that there is moderate evidence that students at the commuter school make accurate evaluation of their math ability. Conversely, there is moderate evidence (but only under the regression test) that at the residential school students who earned low points in the Intermediate Accounting II course over-estimated their math abilities than student who earned high points. Giving continuous feedback to students about their writing ability (or about any other abilities in any other course for that matter) helps students improve their overall performance in the course.
In light of this conclusion the author recommends that the college of business faculty in general, and accounting faculty teaching the Intermediate Accounting II course in particular, should give continuous feedback to the students at least about their writing and quantitative abilities. This may require faculty, who usually give one or two mid-tem exam(s) in addition to the final exam, to think about giving short weekly quizzes to continuously evaluate student performance. If the class time devoted to these many quizzes is an issue, faculty may consider a combination of in-class and take-home quizzes, or perhaps use an on-line homework system that is now provided by many textbook publishers. The author realizes that some faculty may already be doing this; thus, these recommendations are for those who may not be.
As expected and as shown in prior studies with respect to other courses, a fourth general conclusion of the study is that students with high prior actual ability end up earning high grades in the Intermediate Accounting II course at both schools. Specifically, the study provides strong evidence that students’ GPA, and more significantly, their performance in Intermediate Accounting I (particularly at the commuter school), are strong predictors of their performance in the Intermediate Accounting II course.
STUDY LIMITATIONS AND SUGGESTIONS FOR FURTHER RESEARCH
This study is subject to some limitations. One limitation is that the two schools selected for the study school are public (i.e., state-owned or state-supported) universities and, therefore, the results may not be the same for private schools. There are about 430 four-year, for-profit, medium-size (enrollment between 2000-15000 students), private universities in the U.S. (see https://bigfuture.collegeboard.org/college-search). Thus, one suggestion for further research is to replicate the study using two private schools that are representative of the majority of private schools. Another limitation is that the study sample for the residential school is somewhat small relative to the number of variables analyzed and, hence, the results may not be as robust as they would have been if that sample was larger. Therefore, another suggestion for further research is to replicate the study using a somewhat larger sample for the residential school. REFERENCES Baldwin, B. A. and Howe, K. R, (1982), “Secondary-level Study of Accounting and Subsequent
Performance in the First College Course”, The Accounting Review, vol. 3, pp.619-626. Bartlett, S. M., Peel, J. and Pendlebury, M, (1993), “From Fresher to Finalist: A Three-year Study of
Student Performance on an Accounting Degree Program”, Accounting Education: an international journal, vol. 2, pp. 111-122.
96 Journal of Applied Business and Economics vol. 16(5) 2014
Bergin, L. J. (1983), “The Effect of Previous Accounting Study on Student Performance in the First College-level Financial Accounting Course”, Issues in Accounting Education, vol.1, pp. 19-28.
Buckless, F. A., Lipe, M. G. and Ravenscroft, S.P., (1991), “Do Gender Effects on Accounting Course Performance Persist After Controlling for General Academic Aptitude?,” Issues in Accounting Education, vol. 6, pp. 248-261.
Canlar, M. (1986), “College-level Exposure to Accounting Study and Its Effect on Student Performance in the First MBA-level Financial Accounting Course”, Issues in Accounting Education, vol. 1, pp. 13-23.
Chen, C. T., Maksy, M. and Zheng, L. (2009), “Factors Associated with Student Performance in Intermediate Accounting II and Contemporary Financial Accounting Issues,” International Journal of Education Research, Vol. 4, No.2, (Spring 2009), pp. 56-71.
Didia, D. and Hasnat, B. (1998), “The Determinants of Performance in the University Introductory Finance Course”, Financial Practice and Education, vol. 1, pp. 102-107.
Doran, B., Bouillon, M. L. and Smith, C.G. (1991), “Determinants of Student Performance in Accounting Principles I and II”, Issues in Accounting Education, vol. 6, pp.74-84.
Duff, A. (2004), “Understanding Academic Performance and Progression of First-year Accounting and Business Economics Undergraduates: The Role of Approaches to Learning and Prior Academic Achievement”, Accounting Education, (December), vol. 13, pp. 409-430.
Eckel, N. and Johnson, W.A. (1983), “A Model for Screening and Classifying Potential”, Accounting Education, vol. 2, pp. 1-15.
Eskew, R. K. and Faley, R. H. (1988), “Some Determinants of Student Performance in the First College-level Financial Accounting Course”, The Accounting Review (January), pp.137-147.
Gammie, E., Paver, B., Gammie, B, and Duncan, F. (2003), “Gender Differences in Accounting Education: An Undergraduate Exploration”, Accounting Education (June), vol. 12, pp. 177-197.
Gist, W. E., Goedde, H. and Ward, B.H. 1996, “The Influence of Mathematical Skills and Other Factors on Minority Student Performance in Principles of Accounting”, Issues in Accounting Education, vol. 1, pp. 49-60.
Gracia, L. and Jenkins, E. (2003), “A Quantitative Exploration on an Undergraduate Accounting Programme of Study”, Accounting Education (March), vol. 12, pp. 15-32.
Gul, F. A. and Fong. S. C. (1993), “Predicting Success for Introductory Accounting Students: Some Further Hong Kong Evidence”, Accounting Education: an international journal, vol. 1, pp. 33-42.
Guney, Y. (2009), “Exogenous and Endogenous Factors Influencing Students’ Performance in Undergraduate Accounting Modules”, Accounting Education (February), vol. 18, pp. 51-73.
Hicks, D. W. and Richardson, F. M. (1984), “Predicting Early Success in Intermediate Accounting: The Influence of Entry Examination and GPA”, Issues in Accounting Education, (Spring), pp. 61-67.
Ingram, R. W. and Peterson, R. J. (1987), “An Evaluation of AICPA Tests for Predicting the Performance of Accounting Majors”, The Accounting Review (January), pp. 215-223.
Ingram, R. W, Albright, T. L. and Baldwin, A. B. (2002) Financial Accounting—a Bridge to Decision Making. Cincinnati, OH: Thomson South-western.
Jackling, B. and Anderson, A. (1998), “Study Mode, General Ability and Performance in Accounting: A Research Note”, Accounting Education: an international journal, vol. 1, pp.33-42.
Jenkins, E. K. (1998), “The Significant Role of Critical Thinking in Predicting Intermediate Accounting II Students’ Performance”, Journal of Education for Business, vol. 5, pp. 274-280.
Johnson, D. L., Joyce, P., and Sen, S. (2002), “An Analysis of Student Effort and Performance in the Finance Principles Course”, Journal of Applied Finance (Fall/Winter), pp.67-72.
Kohl, M. Y. and Kohl, H. C. (1999), “The Determinants of Performance in an Accountancy Degree Course”, Accounting Education: an international journal, vol. 1, pp.13-29.
Lane, A. and Porch, M. (2002), “The Impact of Background Factors on the Performance of No specialist Undergraduate Students on Accounting Modules – A Longitudinal Study: A Research Note”, Accounting Education, vol. 1, pp. 109-118.
Journal of Applied Business and Economics vol. 16(5) 2014 97
Lipe, M. G. (1989), “Further Evidence on the Performance of Female Versus Male Accounting Students”, Issues in Accounting Education, vol. 1, pp. 144-152.
Lynn, S. and Robinson-Backmon, I. (2005), “An Investigation of an Upper-Division Undergraduate Accounting Course and the Factors That Influence Learning Outcomes”, vol. 13, pp.133-140.
Maksy, M. and Zheng, L. (2008), “Factors Associated with Student Performance in Advanced Accounting and Intermediate Accounting II: An Empirical Study in a Public University”, Accounting Research Journal, vol. 21, pp. 16-32.
Maksy, M. (2012), “Motivation and Distraction Factors Associated with Student Performance in Intermediate Accounting: An Empirical Investigation,” Journal of Accounting and Finance, Vol. 12, No. 3, pp. 188-208.
Mutchler, J. E., Turner, T. H. and Williams, D.D. (1987), “The Performance of Female Versus Male Accounting Students”, Issues in Accounting Education, vol. 1, pp. 103-111.
Nosfinger, J. and Petri, G. (1999), “Student Study Behavior and Performance in Principles of Finance”, Journal of Financial Education, (spring), pp. 33-41.
Paisey, C. and Paisey, N. (2004), “Student Attendance in an Accounting Module – Reasons for Non-attendance and the Effect on Academic Performance in a Scottish University”, Accounting Education, (December), vol. 13, pp. 39-53.
Pascarella, E. and Terenzini, P. (1991), “How College Affects Students: Findings and Insights from Twenty Years of Research”, San Francisco, CA: Jossey-Bass Publisher.
Rohde, F. H. and Kavanagh, M. (1996), “Performance in First Year University Accounting; Quantifying the Advantage of Secondary School Accounting”, Accounting and Finance, vol. 2, pp. 275-285.
Schleifer, L. and Dull, R. (2009), “Metacognition and Performance in the Accounting Classroom”, (August), vol. 24, pp. 339-367
Schroeder, N. W. (1986), “Previous Accounting Education and College-level Accounting Examination Performance”, Issues in Accounting Education, vol. 1, pp. 37-47.
Tickell, G. and Smyrnios, K (2005), “Predictors of Tertiary Accounting Students’ Academic Performance: A Comparison of Year 12-to-University Students with TAFE-to-University Students”, Journal of Higher Education Policy and Management, (July), vol. 27, pp. 239 – 259.
Tho, L. M. (1994), “Some Determinants of Student Performance in the University of Malaya Introductory Accounting Course”, Accounting Education: an international journal, vol. 4, pp. 331-340.
Tyson, T. (1989), “Grade Performance in Introductory Accounting Courses: Why Female Students Outperform Males”, Issues in Accounting Education, vol. 1, pp. 153-160.
Wooten, T. (1998), “Factors Influencing Student Learning in Introductory Accounting Classes: A Comparison of Traditional and Nontraditional Students”, Issues in Accounting Education (May), vol. 13, pp. 357-373.
TABLES Note: Legend Of Independent Variables In All Tables Below: IG: Intended Grade (the grade the student intends to earn in the course); ICPA: Intention to take the CPA exam; IGS: Intention to attend Graduate School; JHours: Number of Job Hours per week; JType: Type of Job; CLoad: Number of courses taken per semester; Write: Student’s self-perceived writing ability; Math: Student’s self-perceived math ability; Read: Student’s self-perceived reading ability; Listen: Student’s self-perceived listening ability; GIA1: Grade in Intermediate Accounting I; GPA: Overall GPA
98 Journal of Applied Business and Economics vol. 16(5) 2014
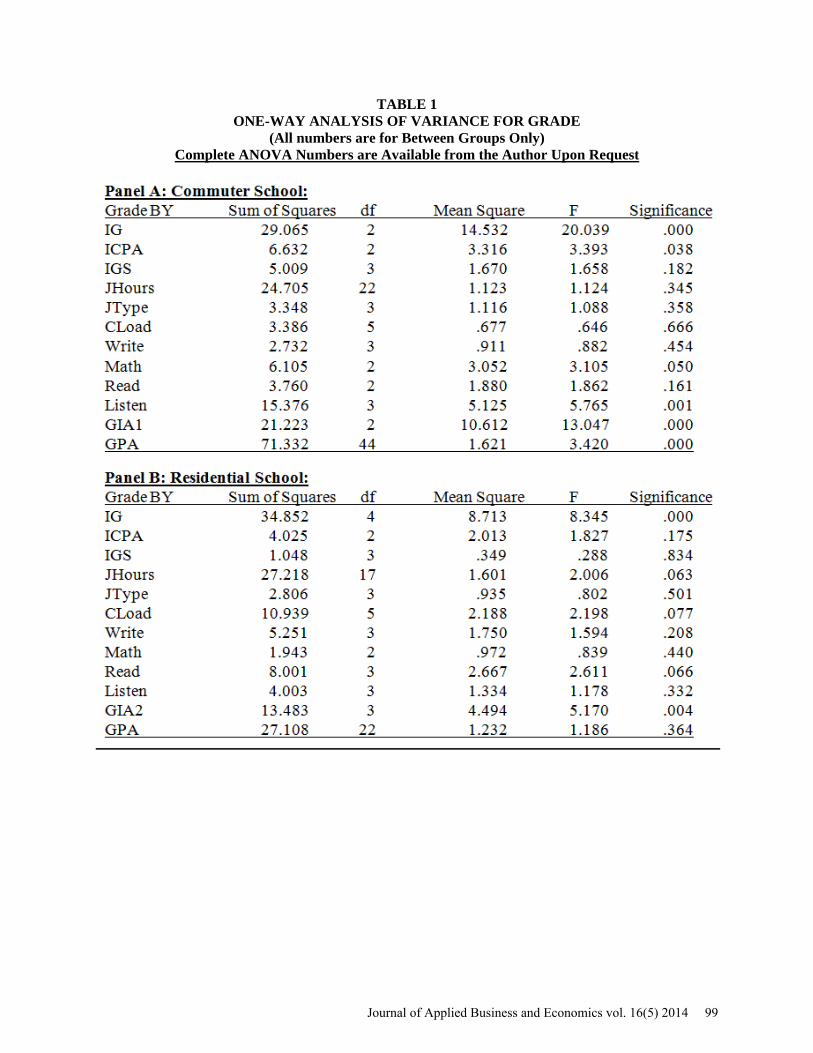
TABLE 1 ONE-WAY ANALYSIS OF VARIANCE FOR GRADE
(All numbers are for Between Groups Only) Complete ANOVA Numbers are Available from the Author Upon Request
Journal of Applied Business and Economics vol. 16(5) 2014 99
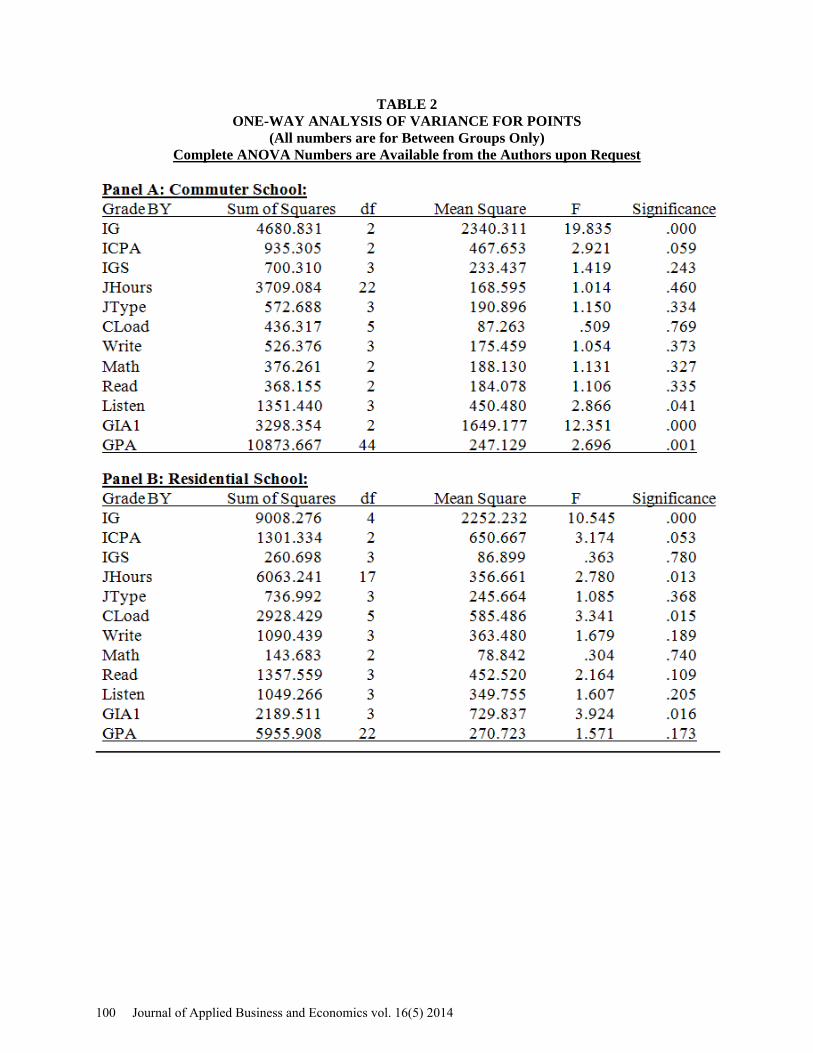
TABLE 2 ONE-WAY ANALYSIS OF VARIANCE FOR POINTS
(All numbers are for Between Groups Only) Complete ANOVA Numbers are Available from the Authors upon Request
100 Journal of Applied Business and Economics vol. 16(5) 2014
T
AB
LE
3
SPE
AR
MA
N C
OR
RE
LA
TIO
N C
OE
FFIC
IEN
TS
FOR
GR
AD
Ea
Gra
de
IG
ICPA
IG
S JH
ours
JT
ype
CLo
ad
Wri
te
Mat
h Re
ad
List
en
GIA
1 G
PA
Gra
de
.5
72**
* .1
75
.205
**
-.015
-.0
36
-.022
-.0
77
.280
***
.235
**
.388
***
.464
***
.469
***
IG
.464
***
.0
56
.191
* -.0
24
.117
.0
30
-.054
.1
15
.149
.4
02**
* .4
57**
* .3
54**
*
ICPA
.2
39
.285
*
.425
***
.067
.0
61
.121
-.0
27
.057
.2
82**
* .0
88
.036
.3
81**
*
IGS
-.046
.0
29
.360
**
-.0
56
.058
.2
21**
-.0
09
-.027
.2
00*
-.004
.0
47
.160
JHou
rs
-.111
.1
62
-.045
.0
37
.3
43**
* -.4
17**
* .0
86
-.121
.0
65
-.018
-.0
55
.063
JTyp
e .1
10
.139
-.0
19
.140
.7
24**
*
-.218
**
.103
-.0
53
.090
.1
21
.114
-.0
11
CLo
ad
.327
**
.052
.2
50
.065
-.2
79*
-.218
-.039
.2
23**
.0
73
.131
.0
21
.176
*
Writ
e -.0
46
.440
***
.228
.2
34
-.137
-.2
52
.223
.158
.3
43**
* .1
82*
-.074
.0
83
Mat
h .1
49
.230
-.0
03
.008
.0
51
.049
.2
06
.146
.228
**
.352
***
.094
.0
83
Rea
d .1
96
.336
**
.162
.1
79
-.198
-.0
89
.000
.5
18**
* -.0
37
.3
90**
* .0
85
.352
***
List
en
.054
.2
45
.148
.3
93**
-.1
51
-.006
.2
76*
.172
.2
74*
.203
.315
***
.324
***
GIA
1 .5
61**
* .3
79**
.2
63*
.114
.2
64*
.185
.3
38**
.1
08
.046
.1
36
-.052
.264
***
GPA
.5
35**
* .3
28**
.3
37**
-.0
45
.070
.0
30
.286
* .1
73
.013
.3
10**
-.0
67
.789
***
**
*, *
*, *
Indi
cate
sign
ifica
nces
at .
01, .
05, a
nd .1
0 le
vels
resp
ectiv
ely.
a C
omm
uter
scho
ol c
oeff
icie
nts a
re a
bove
the
diag
onal
and
resi
dent
ial s
choo
l coe
ffic
ient
s are
und
er th
e di
agon
al.
Journal of Applied Business and Economics vol. 16(5) 2014 101

T
AB
LE
4
PEA
RSO
N C
OR
RE
LA
TIO
N C
OE
FFIC
IEN
TS
FOR
PO
INT
Sa
Poin
ts IG
IC
PA
IGS
JHou
rs
JTyp
e C
Load
W
rite
M
ath
Read
Li
sten
G
IA1
GPA
Poin
ts
.5
47**
* .2
18**
.1
84*
-.025
-.0
10
-.029
-.1
06
.157
.1
56
.241
**
.466
***
.532
***
IG
-.679
***
.0
96
.199
* .0
06
.132
.0
16
-.027
.1
26
.171
.3
99**
* .4
51**
* .3
81**
*
ICPA
.3
82**
.2
73
.3
98**
* .0
11
.039
.1
31
-.002
.0
51
.288
***
.082
.0
63
.375
***
IGS
-.075
.0
56
.391
**
-.0
23
.038
.2
62**
-.0
06
.002
.1
86*
-.022
.0
30
.144
JHou
rs
-.242
.1
58
-.127
.0
36
.4
47**
* -.3
61**
* .1
29
-.138
.0
67
.007
-.0
40
.072
JTyp
e .0
73
.071
-.0
60
.121
.5
66**
*
-.223
**
.116
-.0
66
.079
.1
35
.115
-.0
18
CLo
ad
.390
**
-.094
.3
14**
.0
16
-.360
**
.328
**
-.0
42
.220
**
.068
.1
14
.024
.1
96*
Writ
e .0
09
.404
***
.173
.2
72*
-.119
-.1
75
.071
.131
.3
59**
* .1
65
-.065
.1
01
Mat
h .0
14
.244
-.0
68
.056
.0
34
.022
.1
20
.161
.210
**
.320
***
.103
.0
86
Rea
d .2
02
.299
* .1
68
.192
-.1
48
.057
-.0
90
.570
***
-.062
.355
***
.081
.3
60**
*
List
en
.155
.2
03
.123
.3
65**
-.1
75
-.003
.1
46
.273
* .2
64*
.250
.319
***
.321
***
GIA
1 .4
85**
* .3
56**
.2
73*
.111
.2
24
.123
.3
18**
.0
91
.043
.1
35
-.059
.264
***
GPA
.5
05**
* .3
34**
.3
87**
-.0
54
.020
.0
21
.317
**
.199
.0
08
.292
* -.0
77
.776
***
***,
**,
* In
dica
te si
gnifi
canc
es a
t .01
, .05
, and
.10
leve
ls re
spec
tivel
y.
a Com
mut
er sc
hool
coe
ffic
ient
s are
abo
ve th
e di
agon
al a
nd re
side
ntia
l sch
ool c
oeff
icie
nts a
re u
nder
the
diag
onal
.
102 Journal of Applied Business and Economics vol. 16(5) 2014

T
AB
LE
5
PA
RT
IAL
CO
RR
EL
AT
ION
CO
EFF
ICIE
NT
S FO
R G
RA
DE
WH
ILE
CO
NT
RO
LL
ING
FO
R G
IA1
AN
D G
PAa
Gra
de
IG
ICPA
IG
S JH
ours
JT
ype
CLo
ad
Wri
te
Mat
h Re
ad
List
en
Gra
de
.3
50**
* .0
92
.177
* -.1
09
-.083
-.1
02
-.123
.2
33**
.0
31
.126
IG
.187
-.042
.1
75*
.001
.1
11
-.058
-.0
36
.075
.0
50
.242
**
ICPA
.0
83
.176
.376
***
-.020
.0
55
.063
-.0
48
.024
.1
76*
-.034
IGS
-.116
.0
41
.473
-.035
.0
43
.241
**
-.021
-.0
10
.146
-.0
73
JHou
rs
-.316
.1
15
-.138
-.
047
.4
62**
* -.3
86**
* .1
18
-.141
.0
43
-.001
JTyp
e .1
44
.042
-.0
66
.085
.5
48**
*
-.222
**
.132
-.0
75
.095
.1
22
CLo
ad
.159
-.2
49
.227
.0
06
-.455
***
-.382
**
-.0
66
.211
**
-.004
.0
65
Writ
e -.1
90
.389
**
.102
.3
25**
-.0
98
-.168
.0
21
.1
32
.348
***
.172
Mat
h .1
49
.250
-.0
75
.044
.0
15
.012
.1
18
.170
.195
* .2
99**
*
Rea
d .0
48
.255
.0
56
.265
-.1
18
.082
-.1
86
.540
***
-.059
.285
***
List
en
.089
.2
47
.167
.3
73**
-.1
85
-.001
.1
81
.297
* .2
66
.289
*
_
____
____
____
____
____
____
____
____
____
____
____
____
____
____
____
____
____
____
____
____
____
____
____
____
**
*, *
*, *
Indi
cate
sign
ifica
nces
at .
01, .
05, a
nd .1
0 le
vels
resp
ectiv
ely.
a C
omm
uter
scho
ol c
oeff
icie
nts a
re a
bove
the
diag
onal
and
resi
dent
ial s
choo
l coe
ffic
ient
s are
und
er th
e di
agon
al.
Journal of Applied Business and Economics vol. 16(5) 2014 103
T
AB
LE
6
PAR
TIA
L C
OR
RE
LA
TIO
N C
OE
FFIC
IEN
TS
FOR
PO
INT
S W
HIL
E C
ON
TR
OL
LIN
G F
OR
GIA
2 A
ND
GPA
a
Poin
ts IG
IC
PA
IGS
JHou
rs
JTyp
e C
Load
W
rite
M
ath
Read
Li
sten
Poin
ts
.3
35**
* .0
43
.143
-.0
55
-.055
.1
62
-.166
.1
09
-.042
-.0
16
IG
.163
-.042
.1
75*
.001
.1
11
-.058
-.0
36
.075
.0
50
.242
**
ICPA
.2
46
.176
.376
***
-.020
.0
55
.063
-.0
48
.024
.1
76*
-.034
IGS
-.101
.0
41
.473
***
-.0
35
.043
.2
41**
-.0
21
-.010
.1
46
-.073
JHou
rs
-.374
**
.115
-.1
38
-.04
7
.462
***
-.386
***
.118
-.1
41
.043
-.0
01
JTyp
e .0
45
.042
-.0
66
.085
.5
48**
*
-.222
**
.132
-.0
75
.095
.1
22
CLo
ad
.267
-.2
49
.227
.0
06
-.455
***
-.382
**
-.0
66
.211
**
-.004
.0
65
Writ
e -.0
93
.389
**
.102
.3
25**
-.0
98
-.168
.0
21
.1
32
.348
***
.172
Mat
h .0
02
.250
-.0
75
.044
.0
15
.012
.1
18
.170
.195
* .2
99**
*
Rea
d .0
94
.255
.0
56
.265
-.1
18
.082
-.1
86
.540
***
-.059
.285
***
List
en
.228
.2
47
.167
.3
73**
-.1
85
-.001
.1
81
.297
* .2
66
.289
*
__
____
____
____
____
____
____
____
____
____
____
____
____
____
____
____
____
____
____
____
____
____
____
____
____
__
***,
**,
* In
dica
te si
gnifi
canc
es a
t .01
, .05
, and
.10
leve
ls re
spec
tivel
y.
a Com
mut
er sc
hool
coe
ffic
ient
s are
abo
ve th
e di
agon
al a
nd re
side
ntia
l sch
ool c
oeff
icie
nts a
re u
nder
the
diag
onal
.
104 Journal of Applied Business and Economics vol. 16(5) 2014

TABLE 7 REGRESSION ANALYSIS FOR GRADE
Journal of Applied Business and Economics vol. 16(5) 2014 105
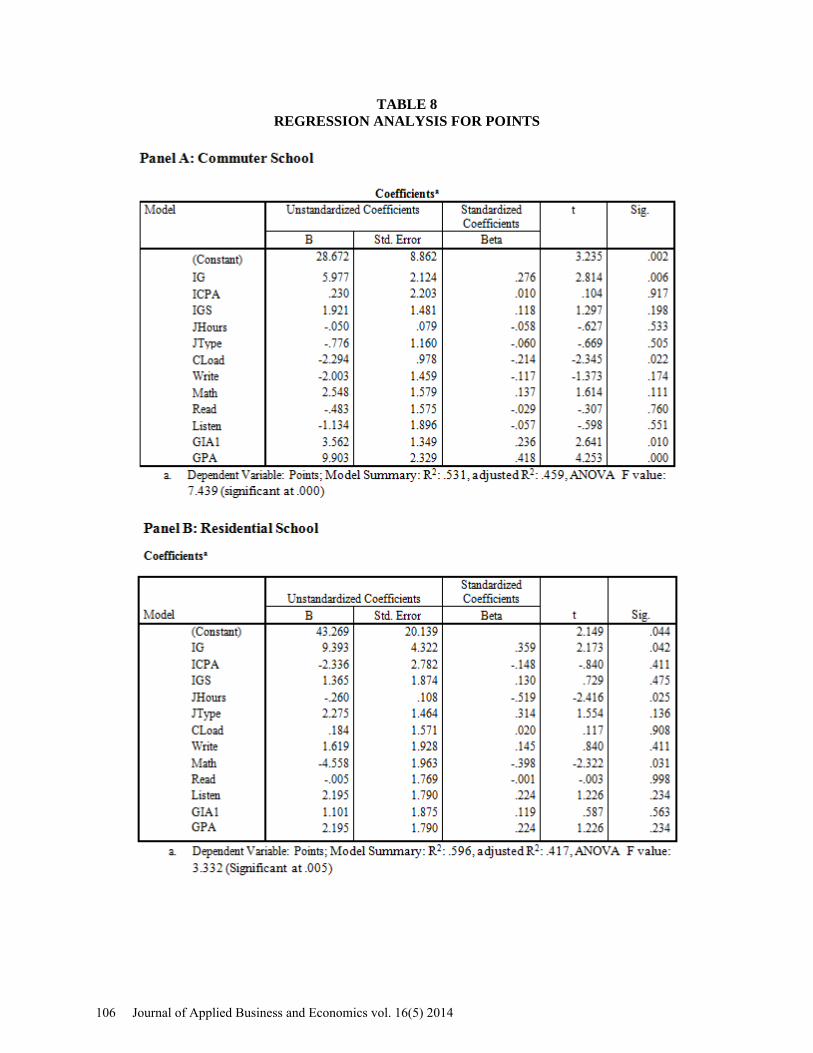
TABLE 8 REGRESSION ANALYSIS FOR POINTS
106 Journal of Applied Business and Economics vol. 16(5) 2014

T
AB
LE
9
PAR
TIA
L C
OR
RE
LA
TIO
N C
OE
FFIC
IEN
TS
OF
EA
CH
DIS
TR
AC
TIO
N F
AC
TO
R W
ITH
GR
AD
Ea
P
art A
P
art B
G
rade
JH
ours
JT
ype
CLo
ad
Gra
de
JHou
rs
JTyp
e C
Load
Gra
de
-.0
68
.001
-.0
19
Gra
de
-.128
-.0
46
-.159
JHou
rs
-.257
JHou
rs
- .4
36**
*(.0
08)
JTyp
e .3
79**
(.019
)
JTyp
e
.409
** (.
013)
CLo
ad
.351
**(.0
31)
C
Load
-.159
__
__
__
__
__
__
__
__
__
__
__
__
__
__
__
__
__
__
__
__
__
__
__
__
__
__
__
__
__
__
__
__
__
__
__
__
__
__
__
__
__
__
__
__
__
_
Part
A: W
hile
con
trolli
ng fo
r the
oth
er tw
o di
stra
ctio
n fa
ctor
s.
Part
B: W
hile
con
trolli
ng fo
r the
oth
er tw
o di
stra
ctio
n fa
ctor
s as w
ell a
s pri
or a
ctua
l abi
lity
fact
ors (
GIA
1 &
GPA
).
***,
**,
* In
dica
te si
gnifi
canc
es a
t .01
, .05
, and
.10
leve
ls re
spec
tivel
y. E
xact
sign
ifica
nce
leve
l is i
n pa
rent
hesi
s.
a Com
mut
er sc
hool
coe
ffic
ient
s are
abo
ve th
e di
agon
al a
nd re
side
ntia
l sch
ool c
oeff
icie
nts a
re u
nder
the
diag
onal
.
Journal of Applied Business and Economics vol. 16(5) 2014 107
T
AB
LE
10
PAR
TIA
L C
OR
RE
LA
TIO
N C
OE
FFIC
IEN
TS
OF
EA
CH
DIS
TR
AC
TIO
N F
AC
TO
R W
ITH
PO
INT
Sa
Pa
rt A
Pa
rt B
Po
ints
JH
ours
JT
ype
CLo
ad
Poin
ts
JHou
rs
JTyp
e C
Load
Poin
ts
-.0
33
-.002
-.0
40
Poin
ts
-.099
-.0
45
-.201
*(.0
61)
JHou
rs
-.280
*(.0
88)
JH
ours
-.420
***(
.011
)
JTyp
e .3
40**
(.037
)
JTyp
e
.350
**(.0
36)
CLo
ad
.396
**(.0
14)
C
Load
.187
____
____
____
____
____
____
____
____
____
____
____
____
____
____
____
____
____
____
____
____
____
____
____
____
____
____
____
_
Part
A: W
hile
con
trol
ling
for t
he o
ther
two
dist
ract
ion
fact
ors.
Part
B: W
hile
con
trol
ling
for t
he o
ther
two
dist
ract
ion
fact
ors a
s wel
l as p
rior
act
ual a
bilit
y fa
ctor
s (G
IA1
& G
PA).
***,
**,
* In
dica
te si
gnifi
canc
es a
t .01
, .05
, and
.10
leve
ls re
spec
tivel
y. E
xact
sign
ifica
nce
leve
l is i
n pa
rent
hesi
s. a C
omm
uter
scho
ol c
oeff
icie
nts a
re a
bove
the
diag
onal
and
resi
dent
ial s
choo
l coe
ffic
ient
s are
und
er th
e di
agon
al
108 Journal of Applied Business and Economics vol. 16(5) 2014