factors affecting the performance of distribution
TRANSCRIPT
i
FACTORS AFFECTING THE PERFORMANCE OF DISTRIBUTION LOGISTICS
AMONG MANUFUCTURING FIRMS IN KENYA: A CASE STUDY OF KIBOS SUGAR
COMPANY LIMITED
BY
EVANCE OCHIENG ONGATI
A RESEARCH PROJECT REPORT SUBMITTED IN PARTIAL FULFILLMENT FOR
THE REQUIREMENTS OF THE DEGREE OF MASTER OF SCIENCE IN SUPPLY
CHAIN MANAGEMENT
SCHOOL OF BUSINESS AND ECONOMICS
MASENO UNIVERSITY
© 2019

ii
DECLARATION
I declare that this research project is my own work and has never been presented in any
University for any award.
Evance Ongati
MSC/BE/00092/2016
Sign………………………………….. Date…………………………………..
This research project has been presented for examination with my approval as the University
supervisor.
Dr. Tambo Albert
School of Business and Economics
Department of Management Science
Maseno University
Sign………………………………….. Date…………………………………..
iii
ACKNOWLEDGEMENT
I wish to express my sincere gratitude to the entire Maseno University and specifically to Mr.
Tambo Albert for his guidance and encouragement in carrying this project work. I also wish to
thank the management of Kibos sugar and Allied Industries for the cooperation and assistance
and for giving me the opportunity to do my research work in their organization, which has
therefore made this research project a success. My special thanks also goes to my wife Anjeline
Akoth to my children, and to the entire family for the moral support which has helped me see
this end. Finally, I thank my friend Robert Odek for the support he accorded me during this
project study

iv
DEDICATION
I wish to dedicate this work to my late father Mzee Antipa Ongati and to my loving family, my
wife Anjelyne, my brother Prof Omolo Ongati my children, Lindah Olivia and Ethan for their
immense support and encouragement during this study.

v
ABSTRACT
Empirical studies shows that distribution logistics impact tremendously on performance of an
entire organization as it links the organization to the customers. Kibos sugar company report in
2016 revealed that there was a performance drop from 56% in 2014 to 47% in 2015 and this was
attributed to distribution logistics. Therefore this study established factors affecting performance
of distribution logistics among production firms in Kenya: a case of Kibos Sugar Company
limited and allied industries. The study specifically; determined the effect of product nature on
performance of distribution logistics and the effect of distribution structure on performance of
distribution. The conceptualization of the study was guided by game theory. The study applied
descriptive approach through survey design. The target population comprised 26 employees. The
sample size of the study was 24 respondents sampled using census sampling technique. Data
analysis was done by descriptive statistics. The study realized that accuracy of data collected,
size of data base and ability of management information system to predict future decisions are
significant elements of information systems that has got vast influence on the performance of
distribution logistics. This study filled the gap in empirical studies which reported that there is no
existing relationship between information systems and distribution performance which the
present study finds to be existing. The study therefore concludes that management information
system coupled with various information technology are key in managing every distribution
aspect for sure performance. The study also revealed that distribution structure is a factor which
influences distribution performance through availability of regional depots which enables
customers to easily reach the products limiting stock outs which in the long run translates to
positive distribution performance. Besides, route-planning if considered, enables timely
deliveries of products, cost reduction in regard to time, fuel and vehicle maintenance. The
present study filled the gap in previous studies which reported that in logistics system,
distribution cost is typically the highest single expense. That is, through implementing proper
distribution structure, nearly all the avoidable costs may be limited. It is concluded that
distribution structure used by a manufacturing firm have an impact on the ability of its
Distribution Logistics to perform. The study recommends need of embracing modern and current
technology which can help various users of organization information to collect, analyze, interpret
and come up with various useful decisions affecting the organization. Further study needs to be
done on the same topic but in other smaller institutions especially nationally so as to spur
development in the country Kenya and in Africa at large.

vi
TABLE OF CONTENTS
TITLE PAGE……………………………………………..………………………………………..i
DECLARATION ............................................................................................................................ ii
ACKNOWLEDGEMENT ............................................................................................................. iii
DEDICATION ............................................................................................................................... iv
ABSTRACT .....................................................................................................................................v
TABLE OF CONTENTS ............................................................................................................... vi
LIST OF TABLES ....................................................................................................................... viii
LIST OF FIGURES ....................................................................................................................... ix
OPERATIONAL DEFINITION OF TERMS .................................................................................x
ABBREVIATIONS AND ACRONYMS ...................................................................................... xi
CHAPTER ONE: INTRODUCTION ..........................................................................................1
1.1 Background of the study ............................................................................................................1
1.1.2 Kibos Sugar Company and Allied Industries..........................................................................4
1.2 Statement of the Problem ...........................................................................................................4
1.3 Objectives of the Study ..............................................................................................................5
1.3.1 Main Objective........................................................................................................................5
1.3.2 Specific Objectives .................................................................................................................5
1.4 Research questions .....................................................................................................................6
1.5 Scope of the study ......................................................................................................................6
1.6 Justification of the Study ...........................................................................................................6
1.7 Conceptual frame work ..............................................................................................................7
CHAPTER TWO: LITERATURE REVIEW .............................................................................9
2.1 Theoretical Literature Review ...................................................................................................9
2.2.1 Game Theory ......................................................................................................................... 9
2.2 Empirical Literature .................................................................................................................10
2.2.1 Information system and Distribution Logistics Performance .............................................. 10
2.2.2 Distribution Structure and Distribution Logistics Performance .......................................... 11
2.3 Summary of Gaps ....................................................................................................................12
CHAPTER THREE: RESEARCH METHODLOGY ..............................................................14
3.1 Research design .......................................................................................................................14

vii
3.2 Study area.................................................................................................................................14
3.3 Target population .....................................................................................................................14
3.4 Sample and Sampling Technique.............................................................................................14
3.5 Data Collection ........................................................................................................................15
3.5.1 Data Types and source‟s ...................................................................................................... 15
3.5.2 Data Collection Procedure ................................................................................................... 15
3.5.3 Data Collection Instruments ................................................................................................ 15
3.5.4 Instruments Reliability Test ................................................................................................. 16
3.5.5 Instruments Validity............................................................................................................. 16
3.6 Data Analysis Method..............................................................................................................17
CHAPTER FOUR: RESULTS AND DISCUSSIONS ..............................................................18
4.1 Introduction ..............................................................................................................................18
4.2 Presentations of findings ..........................................................................................................18
4.2.1 Demographic information .................................................................................................... 18
4.2.2 Gender of Respondents ........................................................................................................ 18
4.2.3 Age group of the respondents .............................................................................................. 18
4.2.4 Work experience…………………………………………………………………………...19
4.2.5 Education level..................................................................................................................... 20
4.3 Study findings ......................................................................................................................... 21
4.3.1 Information systems related factors that influence the performance of distribution ........... 21
4.3.2 Effect of distribution structure on performance of distribution in Kibos Sugar and Allied
Industries Limited, Kenya………………………………………………………………………..23
CHAPTER FIVE: SUMMARY OF FINDINGS, CONCLUSIONS AND
RECOMMENDATIONS ...........................................................................................28
5.1 Introduction ..............................................................................................................................28
5.2 Summary of findings................................................................................................................28
5.3 Conclusions ..............................................................................................................................29
5.4 Recommendations ....................................................................................................................30
5.5 Suggestion for further study.....................................................................................................31
REFERENCES .............................................................................................................................32
APPENDICES……………………………………………………………………...…………...34

viii
LIST OF TABLES
Table 3.1: Reliability Statistics ......................................................................................................16
Table 4.1: Gender of the respondents ............................................................................................18
Table 4.2: Work experience ...........................................................................................................20
Table 4.3: Education level of the respondents ...............................................................................20
Table 4.4: Accuracy of information influence performance of distribution ..................................21
Table 4.5:Size of data base influences distribution performance ..................................................22
Table 4.6: Predictability of information influences distribution performance ..............................23
Table 4.7: Route planning influences distribution performance ....................................................25
Table 4.8: Mode of transport influences distribution performance ...............................................26
Table 4.9: Merits of route planning ...............................................................................................27
ix
LIST OF FIGURES
Figure 2.1: Conceptual framework on effects of distribution logistics factors on performance….7
Figure 4.1: Age of the respondents ................................................................................................19
Figure 4.2:Satisfaction is an information element affecting distribution ......................................22
Figure 4.3: Distribution structure used by a manufacturing firms have impact on the ability ......24
Figure 4.4: Availability of regional depots impacts positively on the ability of its Distribution
Logistics performance ..................................................................................................25
Figure 4.5: Merits of regional depots .............................................................................................26
Figure 4.6: Importance of adopting a particular mode of transport ...............................................27
x
OPERATIONAL DEFINITION OF TERMS
Distribution channel Consists of a group of individuals or organizations that assist in
getting the product to the right place at the right time.
Distribution logistics Is the management activities to pursue customer satisfaction and
order fulfillment, connecting the main body of supply and demand,
overcoming space and time obstacles to achieve efficient and rapid
movement of goods.
Performance Logistics Is the process of planning, implementing, and controlling the
efficient, effective flow and storage of goods, services, and related

xi
ABBREVIATIONS AND ACRONYMS
SCM : Supply Chain Management
USA : United States of America
1
CHAPTER ONE
INTRODUCTION
This chapter contains the background information of the study on the analysis of factors affecting
the performance of distribution logistics among production firms in Kenya, the statement of the
problem, the objectives of the study, the research questions that guided the study and the
significance of the study.
1.1 Background of the study
Logistics is increasingly becoming a strategic source of competitive advantage with the increase
in global production sharing, shortening of product life cycles and intensification of global
competition. In the highly competitive business environment, quality of logistics has assumed
great significance; it influences such decisions of firms as the choice of; country to locate in,
suppliers to buy from, and/or consumer markets to enter in. Essentially, high logistics costs
coupled with low service quality are a barriers to trade and foreign direct investment (FDI) and
consequently to economic growth. Massive investments are being made worldwide with some of
the best known investment gurus putting their bet on distribution industry which is directly
linked to the growth of any economy (Prabhakarsri, 2010). Distribution is increasingly becoming
a significant factor that can contribute to the realization of successful organizational strategy.
However, performance of distribution logistics is still a challenge to major manufacturing firms
Kibos sugar Company and allied industries being one of them and thus the need of the present
study on performance of distribution logistics.
Today‟s business environment has become increasingly competitive. This causes enormous
pressure for many companies in many industries. In such an environment, companies need to
continuously search for ways to design and manufacture new products, and distribute these
products in an efficient and effective fashion (Xu, 2013). For many years, companies focused
their efforts on reducing costs occurring in the manufacturing processes as well as other
operations. There are an increasing number of companies looking at distribution and recognizing
it as the last frontier for cost reduction.Xu(2013) in his study points that companies need to
design a distribution strategy that can ensure products are distributed in an efficient and effective
2
fashion. However, he does not clearly point put as to these strategies which thus necessitates the
present study which intended to establish the strategies to be adopted to enable performance of
distribution logistics.
According to Parthanadee and Logendran (2006) in 1991, the Council of Logistics Management,
a trade organization based in the United States, defined logistics as the process of planning,
implementing, and controlling the efficient, effective flow and storage of goods, services, and
related information from point of origin to point of consumption for the purpose of conforming
to customer requirements. This is a frequently used definition, which originated in the military.
The present study adopted this definition.
In United States logistics costs constitutes about 30% of the cost of the products sold (Eskigun,
Uzsoy, Preckel, Beauj, Krishnan and Tew, 2005). In a logistics system, distribution cost is
typically the highest single expense, which is usually greater than warehousing cost, inventory
cost and order processing cost Parthanadee and Logendran (2006). Distribution has captured
management‟s attention due to rapid wage and freight rate inflation, critical swing of
transportation costs and regulation, the high cost of carrying inventory, and oil market
uncertainties. From the study by (Eskigun, Uzsoy, Preckel, Beauj, Krishnan and Tew, 2005), and
Parthanadee and Logendran (2006), it implies that logistics is major concern as most of the costs
incurred in a production system are majorly in logistics. The present study therefore sought to
find out if cost is a factor that affect performance of distribution logistics in production firms
with specific reference to Kibos Sugar Company.
Since logistics advanced from 1950s, due to the trend of nationalization and Globalization in
recent decades, the importance of logistics management has been growing in various areas. For
industries, logistics helps to optimize the existing production and distribution processes based on
the same resources through management techniques for promoting the efficiency and
competitiveness of enterprises (Kahia, 2014). Distribution logistics makes goods and products
movable and provides timely and regional efficacy to promote value-added under the least cost
principle. Distribution affects the results of SCM activities and, of course, it influences
production and sale. In the logistics system, transportation cost could be regarded as a restriction

3
of the objective market. Value of distribution varies with different industries. According to
Knemeyer and Murphy, (2004) for those products with small volume, low weight and high
value, distribution cost simply occupies a very small part of sale and is less regarded; for those
big, heavy and low- valued products, distribution occupies a very big part of sale and affects
profits more, and therefore it is more regarded. The demand for products can only be satisfied
through the proper and cost-effective delivery of goods and services of which the present study
sought to establish if there was proper and cost effective delivery of goods and services at Kibos
Sugar Company.
Distribution channel consists of a group of individuals or organizations that assist in getting the
product to the right place at the right time (Asiamah, Alfred and Solomon, 2013). Distribution
plays a vital role, primarily because it ultimately affects the sales turnover and profit margins of
the organization. If the product cannot reach its chosen destination at the appropriate time, then it
can erode competitive advantage and customer retention. Therefore, distribution logistics is the
link between a company and its customers (Skjoett, 2002); it comprises all activities related to
the provision of finished products and merchandise to a customer. The products can be delivered
directly from the production process or from the trader‟s stock located close to the production
site or, possibly, via additional regional distribution warehouses. Like procurement logistics,
distribution logistics is a market-linked logistics system. It links a company‟s production
logistics with the customer‟s procurement logistics Kahia (2014). In distribution logistics,
customer orientation plays a special role because of the close link to the customer. According to
(Zheng and Zhang, 2010) distribution logistics is the management activities to pursue customer
satisfaction and order fulfillment, connecting the main body of supply and demand, overcoming
space and time obstacles to achieve efficient and rapid movement of goods. It also involves
conveying of information related to the distribution of physical goods thus making it slightly
distinct from physical distribution.
Performance of distribution logistics can be measured by on time delivery. This determines
whether a perfect delivery has taken place or not, it thus measures customer service. Xu (2013)
in Stewart (1995) identifies the following as the measures of performance logistics: delivery-to-
request rate, delivery-to-commit date, order fill lead-time and goods in transit. Quality and the

4
way the information is exchanged determine performance of distribution logistics to a large
extent; possible performance indicators are: number of faultless invoices, flexibility of delivery
systems to meet particular customer needs.
1.1.2 Kibos Sugar Company and Allied Industries
Kibos Sugar Company is manufacturing organization based within the outskirts of Kisumu at
Kibos center. Its mission statement is „to maintain a competitive advantage by economical
pricing, improving the production technology and empowerment of our stakeholders through
skills, knowledge, inspiration and motivation. By strengthening commitment and partnership so
as to achieve and sustain long term growth and wealth creating for all stakeholders while
maintaining high health and safety standards. Focusing on differentiation and diversification of
products by investing in research, development and innovation. Adapt environmentally friendly
production techniques so as to reduce the global warming and embracing corporate governance
practices‟. Its main objective is to produce high quality refined sugar for the Kenyan market
among other sugar products.
1.2 Statement of the Problem
Most manufacturing firms in Kenya currently are ensuring that customers are able to place orders
on phone and via email such that the order processing is done so fast to enable loading and the
forthcoming delivery at the customers‟ door. For instance, Equator Bottlers, equally a
manufacturing firm currently uses ERP an information management system which is able to
collect data from various transaction points, relate it to the requirements, generate back the
feedback on the instructions given and proceed till the whole transaction process is achieved.
This has made them a dynamic and an outstanding performing company. This is what is required
by the current changes to be embraced by other companies. However, at Kibos sugar company,
they still use the SERA system, an application which does not have the capability to post and put
appropriately every detail needed in the distribution process from production to delivery point.
This is one of the major factors that pose a great challenge to their distribution process and
performance since they are not able to respond to customer enquiries‟ in time, they are not able
to communicate between departments effectively such that credit control section cannot easily
know the levels of stock from production department instantly unless a physical verification
5
from the manual bin cards is done. This implies that if a customer places an order, the invoicing
department cannot proceed instantly implying time wastage which will spread to the customers.
Besides, modern companies have networked their systems such that they are capable of
accessing their bank accounts and instantly detecting payments that have been made by their
customers in regard to their fresh orders. However, at Kibos Sugar Company and Allied
industries, the customers still have to deliver the payment slips physically. That is, after
depositing the cash, they have to find a way of the deposit slips reaching the credit controller.
The time involved in doing all these equally spread to the whole distribution process. The present
study therefore intended to establish how lack of modern information systems translates to poor
distribution performance at Kibos Sugar Company and Allied Industries. Kibos Sugar Company
and Allied Industries lack enough regional depots within the market that they serve. This has in
fact been one of their major challenge which has affected their distribution system as the
customers must wait until the truck comes all the way from the main plant. In addition, they
have-not clearly mapped their network of clients that they serve so as to enable them to
understands which markets to concentrate in and how to reactivate other dead markets. This
therefore has negatively impacted on their logistics system which the present study seeks to find
out.
1.3 Objectives of the Study
1.3.1 Main Objective
The study‟s main objective was to determine the effectsof factors affecting performance of
distribution logistics in Kibos Sugar and Allied Industries Limited, Kenya.
1.3.2 Specific Objectives
The study was guided by the following specific objectives:
i. To determine the effects of information systems on performance of distribution logistics in
Kibos Sugar and Allied Industries Limited, Kenya
ii. To establish the effects of distribution structure on performance of distribution in Kibos
Sugar and Allied Industries Limited, Kenya

6
1.4 Research questions
The study was guided by the following research questions:
i. What was the effects of information systems on performance of distribution logistics in
Kibos Sugar and Allied Industries Limited, Kenya?
ii. What was the effects of distribution structure on performance of distribution in Kibos
Sugar and Allied Industries Limited, Kenya?
1.5 Scope of the study
The study was based at Kibos Sugar and Allied Industries Limited in Kisumu County, Kenya to
analyze factors affecting the performance of distribution logistics. The period of the study was
between January 2018 and August 2018. The main concepts of the study were the effects of;
product nature, and distribution structure on performance of distribution logistics. The study
gives recommendations on how to curb the latter challenges.
1.6 Justification of the Study
The current study aids in identifying the major challenges that affect the performance of
distribution logistics. This aids the company managers to come up with various ways and
approaches to curb the identified challenges thus enabling the achievement of the main goal of
the organization. Besides, the present paper adds to the existing pool of knowledge on
performance of distribution logistics.
The employees of Kibos Sugar and Allied Industries Limited are therefore enlightened by the
findings of this study on the importance of managing distribution logistics and therefore they can
therefore comprehend the usefulness of limiting un-necessary costs thereby enabling easy
implementation of appropriate distribution structures and thus, the company‟s competitive
advantage enhanced.
The results of this benefits not only the Kibos Sugar and Allied Industries Limited and also other
manufacturing industries in Kenya and the international business arena which are experiencing
problems in terms of having an effective and efficient distribution logistics which if the factors
limiting the performance of logistics are identified, then this can enable the company‟s
7
competitive advantage. Also this study is significant in developing underachieving
manufacturing companies and organizations as productive and effective entities in the future.
People interested in performance of distribution logistics and factors affecting them may use this
study as a stepping stone for future studies in other manufacturing companies. The management
of performance of distribution logistics of an organization may also find the study useful. It is
through this that researchers are then able to find out how to focus on the investigation on a
particular subject and also know the possible methods that can be used at the time that they may
choose to conduct a new study. Thus, another significance of this study is that it serves as a guide
for researches that focus on distribution logistics and general organizational performance.
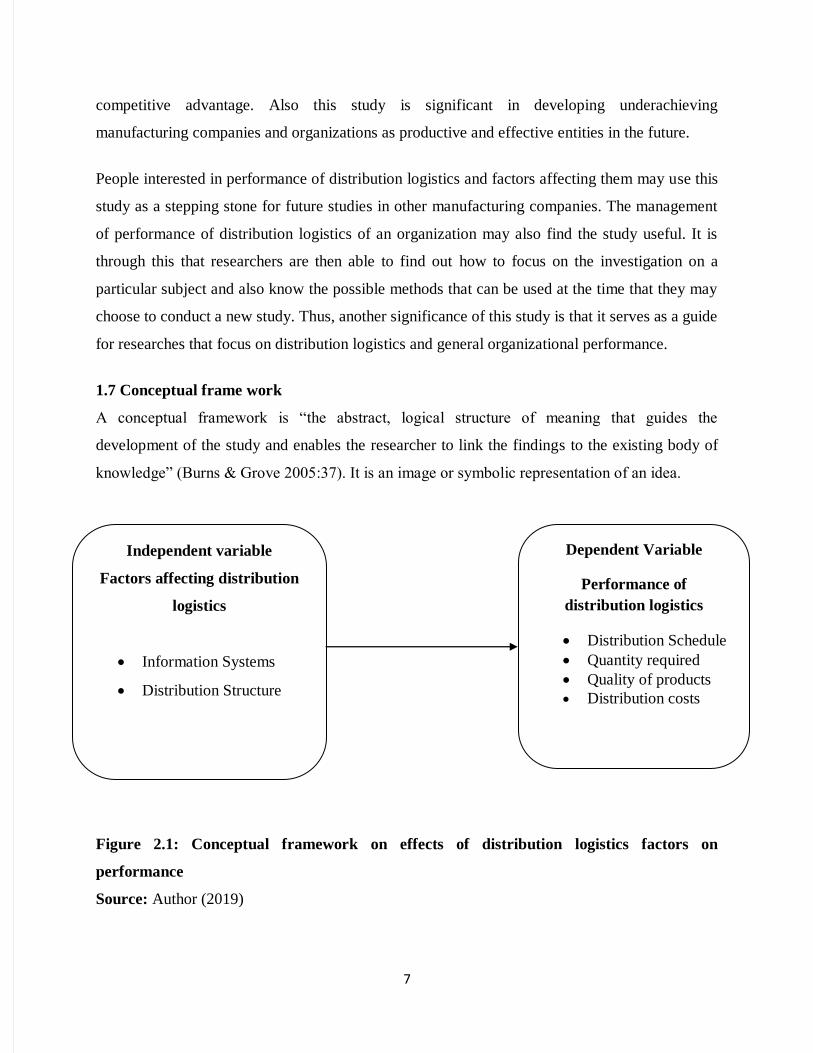
1.7 Conceptual frame work
A conceptual framework is “the abstract, logical structure of meaning that guides the
development of the study and enables the researcher to link the findings to the existing body of
knowledge” (Burns & Grove 2005:37). It is an image or symbolic representation of an idea.
Figure 2.1: Conceptual framework on effects of distribution logistics factors on
performance
Source: Author (2019)
Independent variable
Factors affecting distribution
logistics
Information Systems
Distribution Structure
Dependent Variable
Performance of
distribution logistics
Distribution Schedule
Quantity required
Quality of products
Distribution costs
8
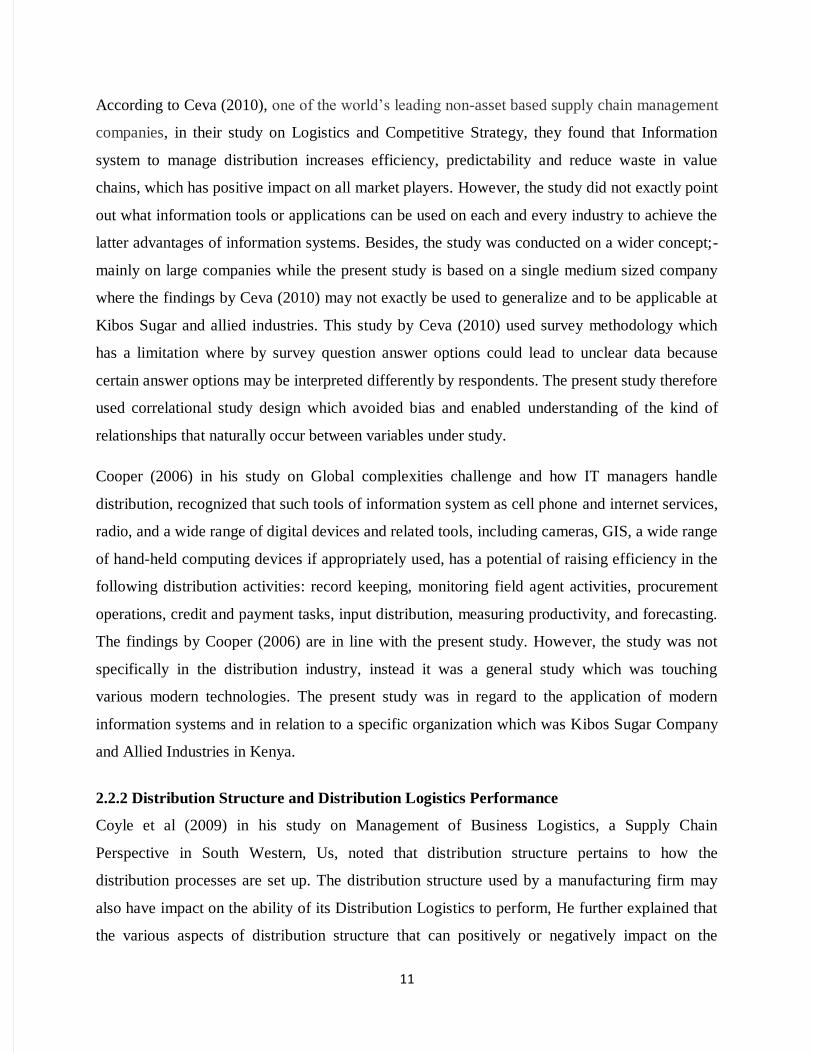
Referring to figure 2.1-conceptual framework, it is depicted that information system enable
performance of distribution logistics by increasing efficiency, predictability and reducing waste
in value chains, which has positive impact on all market players in the long run. Further,
distribution structure pertains to how the distribution processes are set up. The distribution
structure used by a manufacturing firm have an impact on the ability of its Distribution Logistics
to perform, the various aspects of distribution structure including; availability of regional
deports, route planning, and mode of transport used.
9
CHAPTER TWO
LITERATURE REVIEW
In this chapter the researchers reviewed the findings of research done in this area in
order to identify the gap that needs to be filled. The purpose of literature review is to
acquaint the researcher with the history of distribution logistics skill that has been
adopted by other researchers. It establishes various principles adopted by previous researchers
in related fields and at the same time acknowledging their contribution to management training
in what firms do not regard as a fundamental aspect in management of a firm.
2.1 Theoretical Literature Review
Theories are important in predicting, explaining and mastering phenomenon (behavior of
systems, events, activities of employees and time). Generalizations about observations are made
in theories (Matalanga, 2014). A theoretical framework explains the existence of the problem
under study. It mainly guides how the research will be conducted. It is important to the
researcher because it provides a general framework of the study. The current study was guided
by the game theory.
2.2.1 Game Theory
Game theory
Game theory is the formal study of decision-making where several players must make choices
that potentially affect the interests of the other players; it is official study of conflict and
cooperation (Xu, Pan & Ballot, 2013). Game theoretic concepts apply whenever the actions of
several agents are interdependent (Dai & Chen, 2012). These agents may be individuals, groups,
firms, or any combination of these. The concepts of game theory provide a language to formulate
structure, analyze, and understand strategic scenarios (Dai &Chen, 2012).
According to (Xu, et al., 2013) the game theory is divided into two main approaches: the non-
cooperative and the cooperative game theory. The cooperative game theory can be applied to the
case where players can achieve more benefit by cooperating than staying alone (Xu, et al., 2013).
The gain sharing issue was intensively investigated in the cooperative game theory; therefore we

10
adopted cooperative game theoretic approaches in constructing the hypothesis on transport
management and firm performance. Today cooperation is becoming more and more crucial to
improve the global performance of logistics (Drechsel & Kimms, 2010). As the complement of
traditional vertical cooperation, a new cooperation model, the horizontal cooperation was proven
efficient to reduce global cost and improve service rate in logistics (Drechsel & Kimms, 2010).
In game theory, horizontal cooperation in logistics was proved efficient to reduce global cost and
improve the performance level (Cruijssen, Cools, &Dullaert, 2007; Pan, Ballot, Fontane
&Hakimi, 2012). However, despite these advantages, horizontal cooperation is not considerably
employed in logistics (Muir, 2010). One main obstacle in the implementation of horizontal
cooperation is the absence of an appropriate cooperation decision making model (Xu, etal.,
2013).
In regard to the present study, the game theory is applicable in that, Kibos Sugar Company and
Allied Industries can decide to work hand in hand with their distributors. That is, they can
outsource transportation services from their own distributors. Besides, they can also decide to
empower one major distributor who can in most cases act as their point of sale so that at all
times, the market is serviced and goods are at the reach of the customers.
2.2 Empirical Literature
2.2.1 Information system and Distribution Logistics Performance
Stank and Keller (2001) studied the 306 firms have been integrated in North America for
logistical and performance benchmarking. The study identified and used six aspects of
integration and six different measures of performance. Relationships influence internal,
operational and customer, technology and planning integration vs information systems support
and advanced shipment notification support. The researcher noted that there was no significant
relationship. The present study is therefore of key since the relationship is not yet established
specifically between information systems and distribution performance. Besides, Stank & Keller
(2001), concentrated on planning integration and information systems while the present study
concentrated on Information systems and distribution logistics thus need to research tis area as it
has been researched yet.
11
According to Ceva (2010), one of the world‟s leading non-asset based supply chain management
companies, in their study on Logistics and Competitive Strategy, they found that Information
system to manage distribution increases efficiency, predictability and reduce waste in value
chains, which has positive impact on all market players. However, the study did not exactly point
out what information tools or applications can be used on each and every industry to achieve the
latter advantages of information systems. Besides, the study was conducted on a wider concept;-
mainly on large companies while the present study is based on a single medium sized company
where the findings by Ceva (2010) may not exactly be used to generalize and to be applicable at
Kibos Sugar and allied industries. This study by Ceva (2010) used survey methodology which
has a limitation where by survey question answer options could lead to unclear data because
certain answer options may be interpreted differently by respondents. The present study therefore
used correlational study design which avoided bias and enabled understanding of the kind of
relationships that naturally occur between variables under study.
Cooper (2006) in his study on Global complexities challenge and how IT managers handle
distribution, recognized that such tools of information system as cell phone and internet services,
radio, and a wide range of digital devices and related tools, including cameras, GIS, a wide range
of hand-held computing devices if appropriately used, has a potential of raising efficiency in the
following distribution activities: record keeping, monitoring field agent activities, procurement
operations, credit and payment tasks, input distribution, measuring productivity, and forecasting.
The findings by Cooper (2006) are in line with the present study. However, the study was not
specifically in the distribution industry, instead it was a general study which was touching
various modern technologies. The present study was in regard to the application of modern
information systems and in relation to a specific organization which was Kibos Sugar Company
and Allied Industries in Kenya.
2.2.2 Distribution Structure and Distribution Logistics Performance
Coyle et al (2009) in his study on Management of Business Logistics, a Supply Chain
Perspective in South Western, Us, noted that distribution structure pertains to how the
distribution processes are set up. The distribution structure used by a manufacturing firm may
also have impact on the ability of its Distribution Logistics to perform, He further explained that
the various aspects of distribution structure that can positively or negatively impact on the
12
performance of the firm‟s Distribution Logistics include availability of regional deports, route
planning, mode of transport used. These were true factors however, they were too general and
not substantiated and thus did not clearly bring out the sub-variables of regional deports, route
planning, mode of transport and how they exactly relate to logistics performance.
Kahia (2014) on his study on factors affecting performance of distribution logistics in Bata shoe
Company in Kenya, he noted that aavailability of regional depots refers to whether a
manufacturing firm has set up depots in various regions so as to bring distribution near the
customers. And that regional depots may allow for proper capacity utilization of transport over
long distances as this is not dependent on individual customer orders. Regional depots also
ensure that the products are in close proximity to the customer thus making it possible for
deliveries under short notice. He also found that route planning pertains to matters of route
selection, vehicle capacity utilization as well as planning for dispatches, He further discussed
that route selection, involves the route selected which may impact highly on the ability to deliver
goods in time as trucks can avoid traffic congestions or use the shortest routes available.
However, the findings of Kahia (2014) were specifically in regard to the Bata shoe company
which may not necessarily apply to the present study which was based in a different sugar
manufacturing industry.
2.3 Summary of Gaps
In the study by Parthanadee and Logendran (2006) in USA, they noticed that in logistics system,
distribution cost is typically the highest single expense, which is usually greater than
warehousing cost, inventory cost and which implies that logistics is major concern as most of the
costs incurred in a production system are majorly in logistics. The present study therefore sought
to find out if cost was a factor that affect performance of distribution logistics in production
firms with specific reference to Kibos Sugar Company while relating it to distribution structures.
According to Knemeyer and Murphy, (2004) for those products with small volume, low weight
and high value, distribution cost simply occupies a very small part of sale and is less regarded;
for those big, heavy and low- valued products, distribution occupies a very big part of sale and
affects profits more, and therefore it is more regarded. The demand for products can only be
13
satisfied through the proper and cost-effective delivery of goods and services of which the
present study sought to establish, that is, if there was proper and cost effective mode of delivery
of goods and services to clients of Kibos Sugar Company.
The performance of any distribution company is strongly dependent on application of proper
information systems and applying proper distribution structure. Kibos sugar should not be an
exception to applying the latter. However, according to Stank and Keller (2001) in their study,
they did not find any relationship between information systems and distribution performance
which the present study sought to find out at Kibos sugar Company and Allied Industries.
Kahia (2014) on his study on factors affecting performance of distribution logistics in Bata shoe
Company in Kenya, he noted that aavailability of regional depots refers to whether a
manufacturing firm has set up depots in various regions so as to bring distribution near the
customers. However, the findings of Kahia (2014) were specifically in regard to the Bata shoe
company which may not necessarily apply to the present study which was based in a different
sugar manufacturing industry.
14
CHAPTER THREE
RESEARCH METHODLOGY
This chapter presented a detailed description of the selected research design. It described in
details what had been done and how. It included the target population, sample design, procedure
for data collection, validity and reliability tests.
3.1 Research design
This study was descriptive thus applied survey study design. Survey method research is where
participants answer questions administered through interviews or questionnaires. After
participants answer the questions, researchers describe the responses given. In order for the
survey to be both reliable and valid, the questions were constructed properly. Questions should
were written so that they were clear and easy to comprehend.
3.2 Study area
The study was based at Kibos Sugar and Allied Industries Limited in Kisumu County, Kenya to
analyze factors affecting the performance of distribution logistics between January and June
2018. The main concepts of the study were the effects of; information system and distribution
structure on performance of distribution logistics.
3.3 Target population
The target population of this study comprised of 4 retail and distribution managers, 4 store
managers, 2 distribution center supervisors, 6 clerks, 6 distributors and 4 marketing executives,
thus a target population of 26employees (Moonbluz Enterprises Limited organization data, 2018)
with the sample size being 24. The sample size was arrived at by considering all the key persons
as per the targeted respondents.
3.4 Sample and Sampling Technique
This study applied census sampling technique. This was so because census is a simple sampling
method which allowed the researcher to collect data from each and every member in the
population of which the sample size was arrived at by picking all the key respondents. This

15
therefore eliminated predisposition. The design besides, aids in collecting focused information
and furthermore, saves time and money.
3.5 Data Collection
Data collection is the process of gathering and measuring information on variables of interest, in
an established systematic fashion that enables one to answer stated research objectives, test
hypotheses, and evaluate outcomes. The data collection components of the current research
included physical collection of data by use of various data collection instruments.
3.5.1 Data Types and source’s
The present study used primary data which was obtained from the original respondents. This was
done with the aid of data collection instruments.
3.5.2 Data Collection Procedure
The researcher before proceeding to collect data sought permission which was granted with an
introductory letter from School of Graduate studies to the persons to be interviewed. This was
then followed by the training of the research assistant on ethical issues in research which was
expected to be done within one day. Data was collected primarily using Semi structured
questionnaire and secondary data through the relevant books, journals and periodicals.
3.5.3 Data Collection Instruments
The researcher used questionnaire to collect primary data. Questionnaires are commonly used to
obtain important information about the population. According to Cooper and Schindler (2003), a
self-administered questionnaire is the only way to elicit self-reports on people‟s opinion,
attitudes, beliefs and values. The questionnaire had items aiming at answering the study
questions so that it could meet research objectives. The choice of this tool of data collection was
guided by the time available and the objectives of the study. Semi structured questionnaire were
be used to collect data. The closed ended questions were used for easy coding and analysis while
the open ended questions were used to elicit more information from respondents to complete the
missing links. These types of questions were accompanied by a list of possible alternatives
ranging from strongly disagree to strongly agree, from which respondents were required to select
the answer that best described their situation i.e. strongly disagree on the one extreme to strongly
agree on the other. The questionnaire was divided into two sections; part (A) which entails
16
questions on personal information of the respondents and Part (B) which entailed questions
related to the objectives that the research intended to achieve. Secondary data was obtained from
relevant books, journals and periodicals.
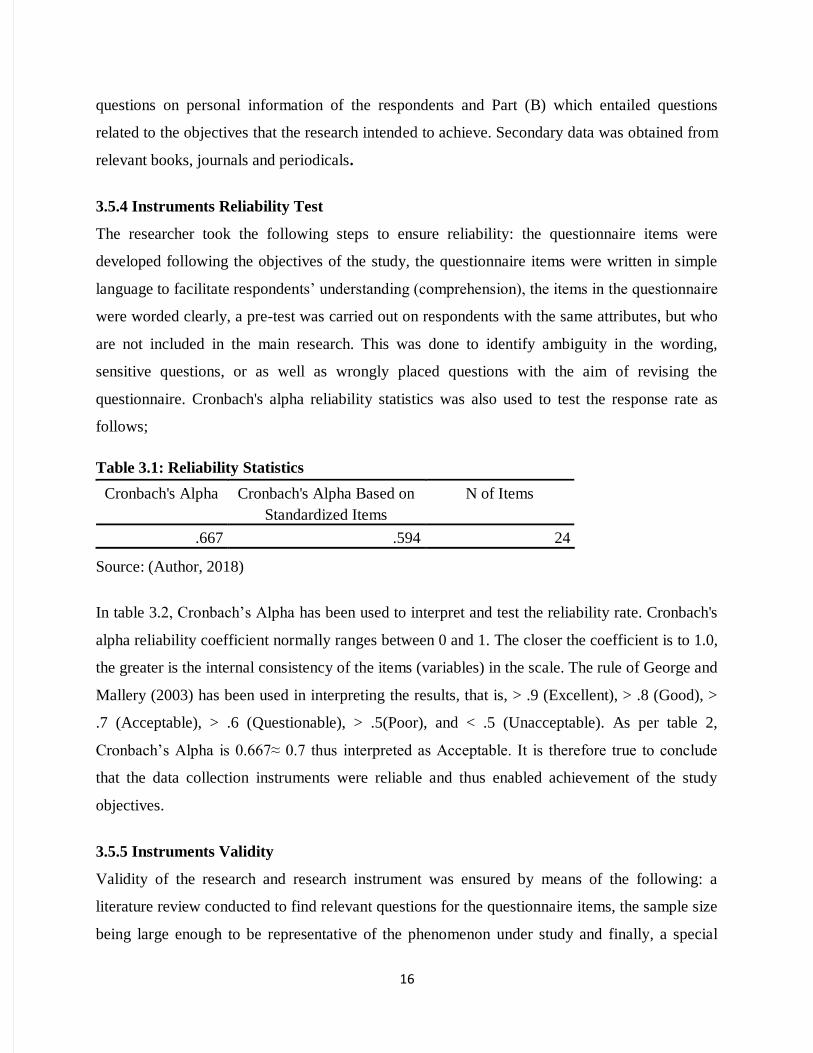
3.5.4 Instruments Reliability Test
The researcher took the following steps to ensure reliability: the questionnaire items were
developed following the objectives of the study, the questionnaire items were written in simple
language to facilitate respondents‟ understanding (comprehension), the items in the questionnaire
were worded clearly, a pre-test was carried out on respondents with the same attributes, but who
are not included in the main research. This was done to identify ambiguity in the wording,
sensitive questions, or as well as wrongly placed questions with the aim of revising the
questionnaire. Cronbach's alpha reliability statistics was also used to test the response rate as
follows;
Table 3.1: Reliability Statistics
Cronbach's Alpha Cronbach's Alpha Based on
Standardized Items
N of Items
.667 .594 24
Source: (Author, 2018)
In table 3.2, Cronbach‟s Alpha has been used to interpret and test the reliability rate. Cronbach's
alpha reliability coefficient normally ranges between 0 and 1. The closer the coefficient is to 1.0,
the greater is the internal consistency of the items (variables) in the scale. The rule of George and
Mallery (2003) has been used in interpreting the results, that is, > .9 (Excellent), > .8 (Good), >
.7 (Acceptable), > .6 (Questionable), > .5(Poor), and < .5 (Unacceptable). As per table 2,
Cronbach‟s Alpha is 0.667≈ 0.7 thus interpreted as Acceptable. It is therefore true to conclude
that the data collection instruments were reliable and thus enabled achievement of the study
objectives.
3.5.5 Instruments Validity
Validity of the research and research instrument was ensured by means of the following: a
literature review conducted to find relevant questions for the questionnaire items, the sample size
being large enough to be representative of the phenomenon under study and finally, a special
17
attempt was made to ensure similarity between research questions, objectives, investigation,
findings and recommendations. Further validity test was done using SPSS version 21.0. All the
variables were keyed into the variable view of the SPSS software. Then the Likert scale helped
to key the data in the data view. After which analysis was done using the bivariate tool. In
interpreting the data, every questionnaire item that had significance level (Sig. 2-tailed) of
0.000<0.05 was considered valid and thus all the questionnaire items were tested and interpreted
as valid.
3.6 Data Analysis Method
This study used descriptive statistics to analyze quantitative data. Descriptive statistics involves
the collection, organization and analysis of all data relating to some population or sample under
study. Data was checked for completeness, accuracy, errors in responses, omissions and other
inconsistencies. The data was then coded using numerals in order to put them in limited number
of categories. The data was analyzed using the SPSS (version 21.0) as it was more user friendly
and most appropriate for analysis of Management related attitudinal responses (Martin and
Acuna, 2002) and then presented in the report in the form of tables and graphical presentations.
Tables and other graphical presentations as appropriate were used to present the data collected
for ease of understanding and analysis. Tables were used to summarize responses for further
analysis and facilitate comparison. This generated quantitative reports through tabulations,
percentages, and measure of central tendency. Cooper and Schindler (2003) notes that the use of
percentages is important for two reasons; first they simplify data by reducing all the numbers to
range between 0 and 100. Second, they translate the data into standard form with a base of 100
for relative comparisons. The mean score for each attribute was calculated and the standard
deviation used to interpret the respondents deviation from the mean. The results were presented
on frequency distribution tables, graphs, pie charts and bar charts. Here the interest was focused
on frequency of occurrence across attributes of measures.
18
CHAPTER FOUR
RESULTS AND DISCUSSIONS
4.1 Introduction
This chapter presents the analysis of information collected in relation to the analysis of factors
affecting performance of distribution logistics in Kibos Sugar and Allied Industries Limited,
Kenya.
4.2 Presentations of findings
The research data were analyzed according to the objectives of the study and findings presented
in the form of figures and tables. The entire questions formulated were administered and the
responses received were analyzed.
4.2.1 Demographic information
4.2.2 Gender of Respondents
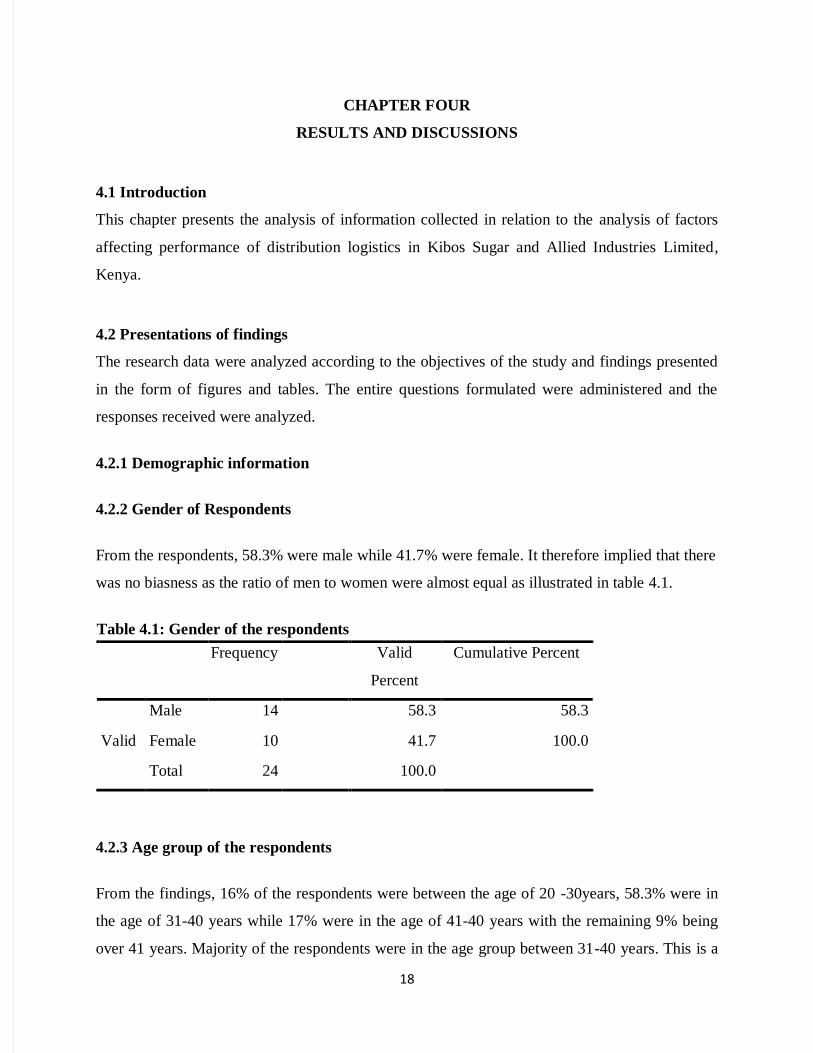
From the respondents, 58.3% were male while 41.7% were female. It therefore implied that there
was no biasness as the ratio of men to women were almost equal as illustrated in table 4.1.
Table 4.1: Gender of the respondents
Frequency Valid
Percent
Cumulative Percent
Valid
Male 14 58.3 58.3
Female 10 41.7 100.0
Total 24 100.0
4.2.3 Age group of the respondents
From the findings, 16% of the respondents were between the age of 20 -30years, 58.3% were in
the age of 31-40 years while 17% were in the age of 41-40 years with the remaining 9% being
over 41 years. Majority of the respondents were in the age group between 31-40 years. This is a

19
clear indicator that they had experience and could easily respond to the questionnaire items as
illustrated in figure 4.1.
Figure 4.1: Age of the respondents
4.2.4 Work experience
In table 4.2, 12.5% of the respondents have got 0-2 years work experience at Kibos, 37.5% have
got 2-4 years work experience, 29.2% have got 4-6 years while the remaining 20.8% have more
than 6 years work experience at Kibos Sugar company. Majority of the respondents (66.7%)
have got more than 4 years work experience which therefore will aid the study as the respondents
fully have the knowledge of the questionnaire items as illustrated in 4.2.
0%
10%
20%
30%
40%
50%
60%
20-30yrs 31-40yrs 41-50yrs more than 50 yrs
17%
8%
58%
17%

20
Table 4.2: Work experience
Frequency Valid Percent Cumulative Percent
Valid
0-2 years 3 12.5 12.5
2-4 years 9 37.5 50.0
4-6 years 7 29.2 79.2
Over 6
years
5 20.8 100.0
Total 24 100.0
4.2.5 Education level
Table 4.3: Education level of the respondents
Frequency Valid Percent Cumulative Percent
Valid
Less than degree 14 58.3 58.3
Degree 8 33.3 91.7
Masters degree 2 8.3 100.0
Total 24 100.0
It is evidenced that majority of the respondents had less than a degree, that diploma and other
professional qualifications. Despite this, but it signified the literacy level therefor the ability to
understand the theme of the study.
21
4.3 Study findings
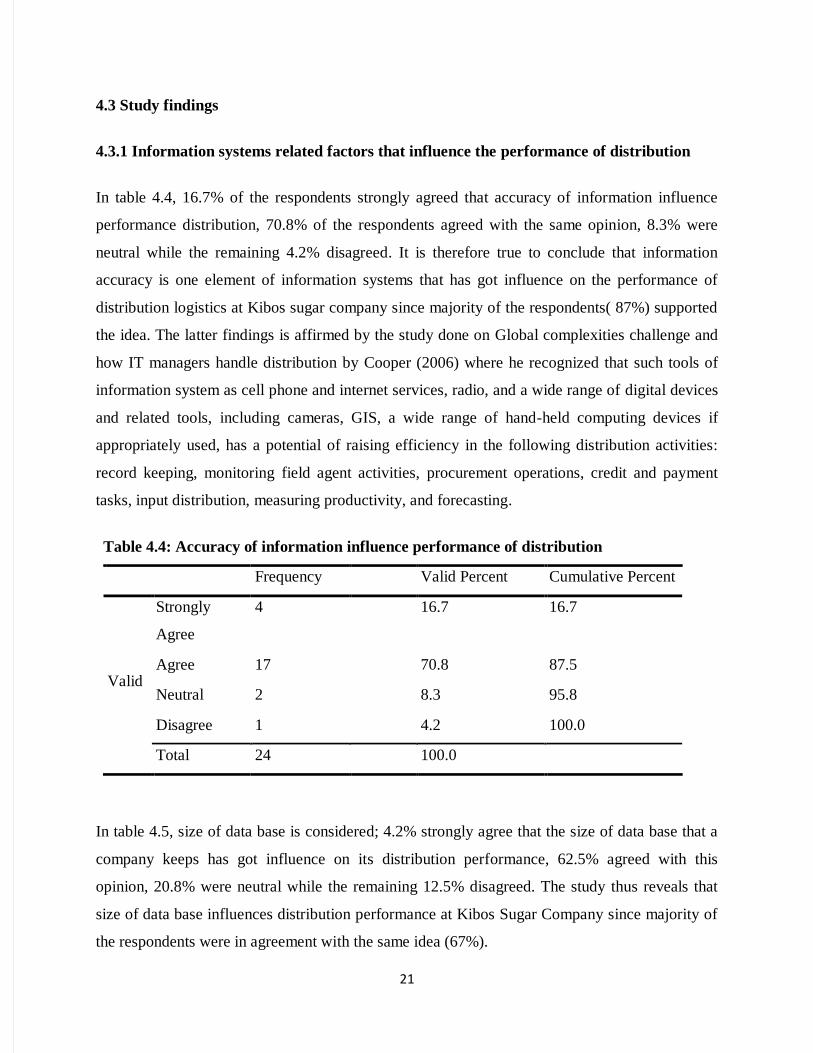
4.3.1 Information systems related factors that influence the performance of distribution
In table 4.4, 16.7% of the respondents strongly agreed that accuracy of information influence
performance distribution, 70.8% of the respondents agreed with the same opinion, 8.3% were
neutral while the remaining 4.2% disagreed. It is therefore true to conclude that information
accuracy is one element of information systems that has got influence on the performance of
distribution logistics at Kibos sugar company since majority of the respondents( 87%) supported
the idea. The latter findings is affirmed by the study done on Global complexities challenge and
how IT managers handle distribution by Cooper (2006) where he recognized that such tools of
information system as cell phone and internet services, radio, and a wide range of digital devices
and related tools, including cameras, GIS, a wide range of hand-held computing devices if
appropriately used, has a potential of raising efficiency in the following distribution activities:
record keeping, monitoring field agent activities, procurement operations, credit and payment
tasks, input distribution, measuring productivity, and forecasting.
Table 4.4: Accuracy of information influence performance of distribution
Frequency Valid Percent Cumulative Percent
Valid
Strongly
Agree
4 16.7 16.7
Agree 17 70.8 87.5
Neutral 2 8.3 95.8
Disagree 1 4.2 100.0
Total 24 100.0
In table 4.5, size of data base is considered; 4.2% strongly agree that the size of data base that a
company keeps has got influence on its distribution performance, 62.5% agreed with this
opinion, 20.8% were neutral while the remaining 12.5% disagreed. The study thus reveals that
size of data base influences distribution performance at Kibos Sugar Company since majority of
the respondents were in agreement with the same idea (67%).

22
Table 4.5: Size of data base influences distribution performance
Frequency Valid Percent Cumulative Percent
Valid
Strongly
Agree
1 4.2 4.2
Agree 15 62.5 66.7
Neutral 5 20.8 87.5
Disagree 3 12.5 100.0
Total 24 100.0
In figure 4.2, 16.7% of the respondents strongly agreed that satisfaction is an information factor
affecting distribution, 58.3% agreed with the same opinion, 16.7% were neutral and the
remaining 8.3% disagreed. At Kibos Sugar Company, from the responses gathered, it was
realized that if there information system is not rusted it gives no confidence to the users and thus
no satisfaction which is then detrimental to the distribution performance.
Figure 4.2:Satisfaction is an information element affecting distribution
16.70%
58.30%
16.70%
8.70%
Strongly agree Agreed Neutral Diagree

23
In table 4.6, 8.3% of the respondents indicated that predictability of information influences
performance of distribution logistics, 66.7% agreed with the same opinion, 12.5% were neutral
while 12.5% disagreed. It is hence true to comment that predictability affects financial
information element is an important factor which affect performance distribution. This is in line
with the study by Ceva (2010), who noted in their study on Logistics and Competitive Strategy,
that Information system to manage distribution increases efficiency, predictability and reduce
waste in value chains, which has positive impact on all market players.
Table 4.6: Predictability of information influences distribution performance
Frequency Valid Percent Cumulative Percent
Valid
Strongly
Agree
2 8.3 8.3
Agree 16 66.7 75.0
Neutral 3 12.5 87.5
Disagree 3 12.5 100.0
Total 24 100.0
4.3.2 Effect of distribution structure on performance of distribution in Kibos Sugar and
Allied Industries Limited, Kenya
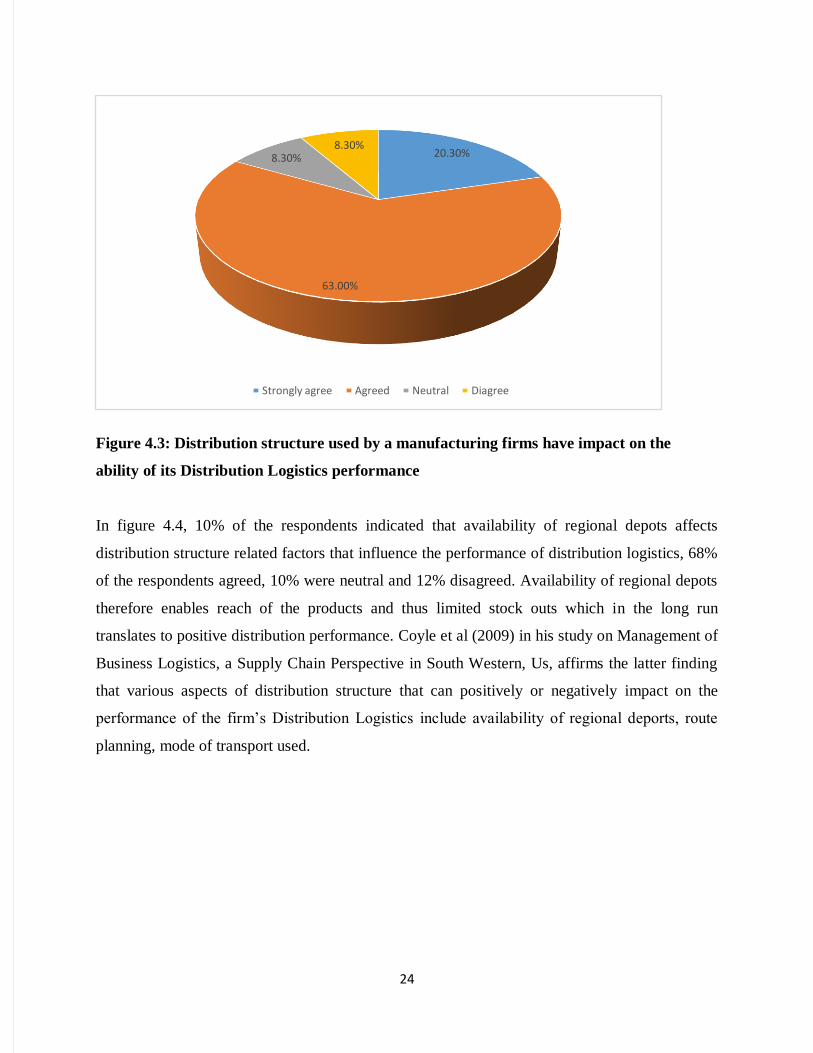
In figure 4.3, 20.3% strongly agreed that distribution structure used by a manufacturing firms
have impact on the ability of its Distribution Logistics performance, 63% agreed with the same
opinion, 8.3% were indifferent while the remaining 8.3% disagreed. It therefore clear that
distribution structure is a factor which to a greater extent assist or influences distribution
performance. This is in line with the findings of Coyle et al (2009) in his study on Management
of Business Logistics, a Supply Chain Perspective in South Western, Us, where he noted that
distribution structure pertains to how the distribution processes are set up and thus the
distribution structure used by a manufacturing firm may also have impact on the ability of its
Distribution Logistics to perform.
24
Figure 4.3: Distribution structure used by a manufacturing firms have impact on the
ability of its Distribution Logistics performance
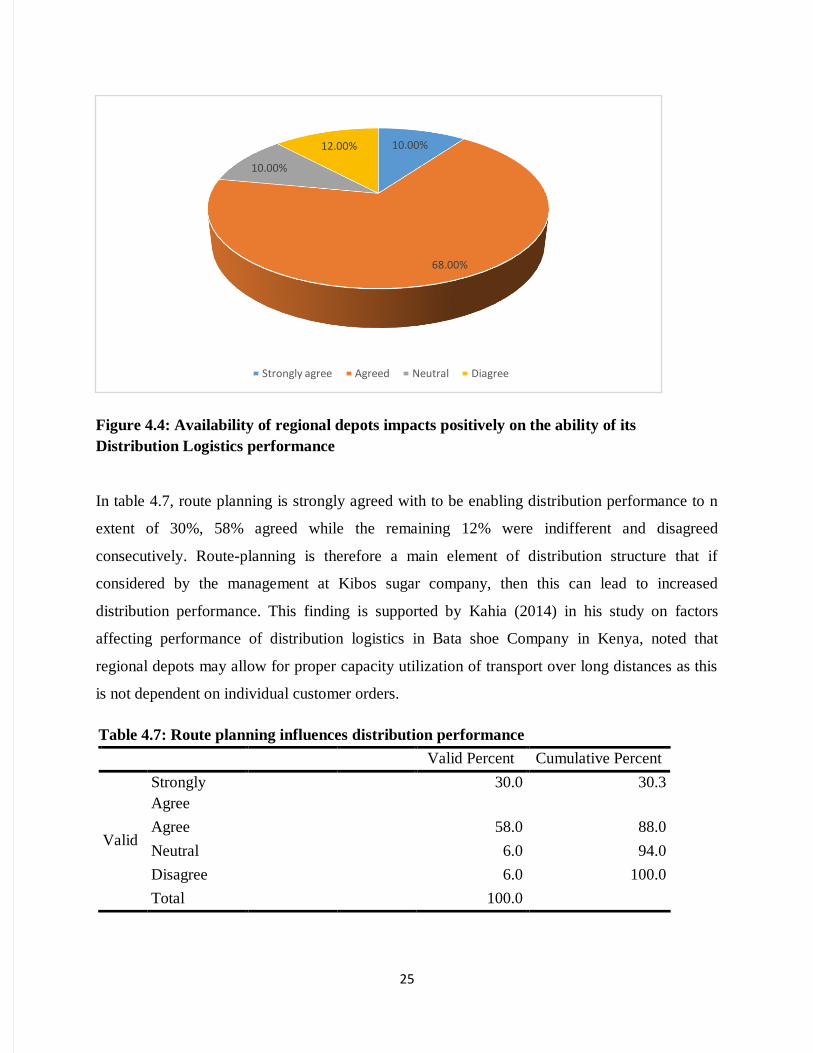
In figure 4.4, 10% of the respondents indicated that availability of regional depots affects
distribution structure related factors that influence the performance of distribution logistics, 68%
of the respondents agreed, 10% were neutral and 12% disagreed. Availability of regional depots
therefore enables reach of the products and thus limited stock outs which in the long run
translates to positive distribution performance. Coyle et al (2009) in his study on Management of
Business Logistics, a Supply Chain Perspective in South Western, Us, affirms the latter finding
that various aspects of distribution structure that can positively or negatively impact on the
performance of the firm‟s Distribution Logistics include availability of regional deports, route
planning, mode of transport used.
20.30%
63.00%
8.30%8.30%
Strongly agree Agreed Neutral Diagree
25
Figure 4.4: Availability of regional depots impacts positively on the ability of its
Distribution Logistics performance
In table 4.7, route planning is strongly agreed with to be enabling distribution performance to n
extent of 30%, 58% agreed while the remaining 12% were indifferent and disagreed
consecutively. Route-planning is therefore a main element of distribution structure that if
considered by the management at Kibos sugar company, then this can lead to increased
distribution performance. This finding is supported by Kahia (2014) in his study on factors
affecting performance of distribution logistics in Bata shoe Company in Kenya, noted that
regional depots may allow for proper capacity utilization of transport over long distances as this
is not dependent on individual customer orders.
Table 4.7: Route planning influences distribution performance
Valid Percent Cumulative Percent
Valid
Strongly
Agree
30.0 30.3
Agree 58.0 88.0
Neutral 6.0 94.0
Disagree 6.0 100.0
Total 100.0
10.00%
68.00%
10.00%
12.00%
Strongly agree Agreed Neutral Diagree
26
In table 4.8, mode of transport is considered and 12% of the respondents strongly agrees that the
mode of transport is a factor, 48% are supporting the idea, 20% are neutral while the remaining
20% are disagreeing. It is true therefore that the mode of transport like using a trailer instead of a
ten wheeler is recommended as it encourages performance distribution.
Table 4.8: Mode of transportinfluences distribution performance
Valid
Percent
Cumulative
Percent
Valid
Strongly
Agree
12.0 12.0
Agree 48.0 60.0
Neutral 20.0 80.0
Disagree 6.0 100.0
Total 100.0
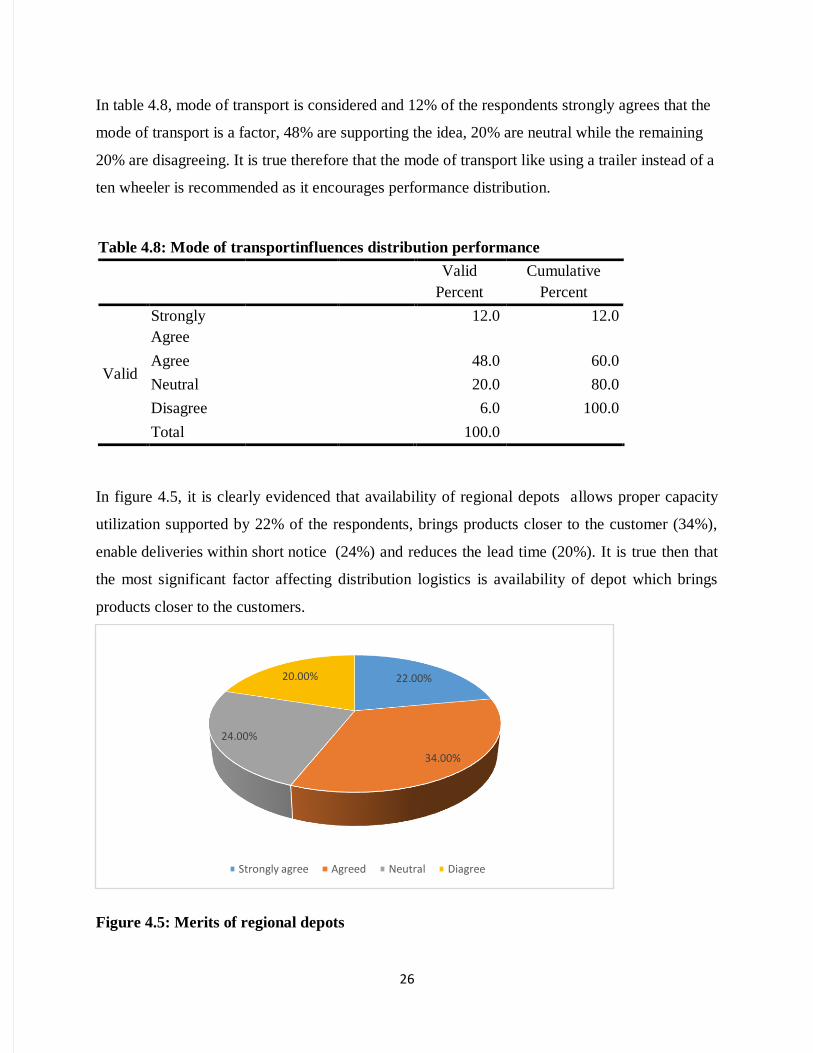
In figure 4.5, it is clearly evidenced that availability of regional depots allows proper capacity
utilization supported by 22% of the respondents, brings products closer to the customer (34%),
enable deliveries within short notice (24%) and reduces the lead time (20%). It is true then that
the most significant factor affecting distribution logistics is availability of depot which brings
products closer to the customers.
Figure 4.5: Merits of regional depots
22.00%
34.00%
24.00%
20.00%
Strongly agree Agreed Neutral Diagree
27
In table 4.9, majority of the respondents 78% indicated that one of the importance of route
planning is that it enables timely deliveries of products, and that it enables cost reduction as the
customer is already predetermined therefore no more trials to consume cost in regard to time,
fuel and vehicle maintenance costs.
Table 4.9: Merits of route planning
Valid Percent Cumulative Percent
Valid
Timely
deliveries
78.0 78.0
Cost
reduction
22.0 22.0
Total 100.0
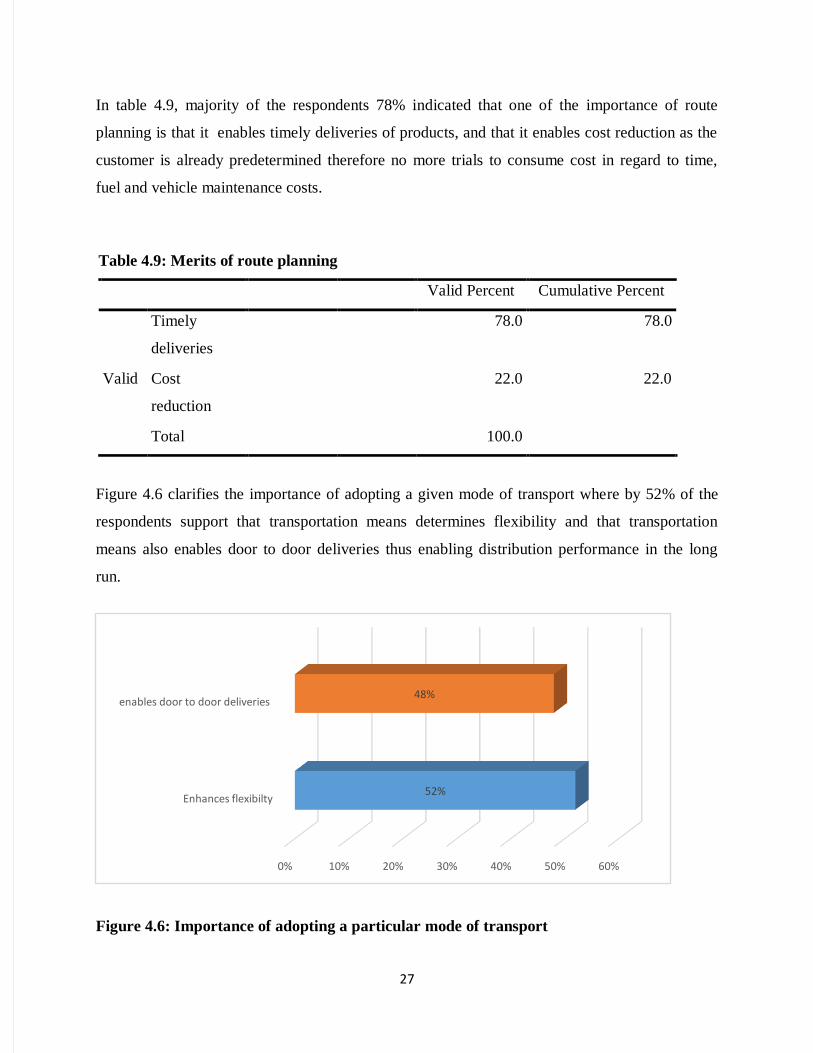
Figure 4.6 clarifies the importance of adopting a given mode of transport where by 52% of the
respondents support that transportation means determines flexibility and that transportation
means also enables door to door deliveries thus enabling distribution performance in the long
run.
Figure 4.6: Importance of adopting a particular mode of transport
0% 10% 20% 30% 40% 50% 60%
Enhances flexibilty
enables door to door deliveries
52%
48%

28
CHAPTER FIVE
SUMMARY OF FINDINGS, CONCLUSIONS AND RECOMMENDATIONS
5.1 Introduction
This chapter discusses the summary of findings, answers to research questions, recommendations
arising from the study and conclusions drawn. It also suggests area for further research. The
objective of the study was to analyze factors affecting the performance of distribution logistics
among manufacturing firms in Kenya; case of Kibos Sugar and Allied Industries.
5.2 Summary of findings
From the questionnaires issued, all the respondents, that is, the 24 respondents who were
included in the sample size responded. They all marked the questionnaires before they were
picked by the researcher. Both genders were well represented and thus, this limited bias. A
greater percentage of the respondents were college graduates/professionals meaning they were
all literate and thus easily interpreted the questionnaire items. Most respondents were between
the age of 31 - 40 therefore were mature enough to tackle the questionnaire items. It was also
confirmed by the respondents themselves as per their response that they were experienced and
could tackle the questionnaire items since majority had more than 4 years working experience at
Kibos Sugar and Allied Industries.
The summary of the findings has been done according to the research questions. They were as
follows:
5.2.1 Effects of information systems on performance of distribution logistics in Kibos Sugar
and Allied Industries Limited, Kenya
The study revealed that information accuracy is one element of information systems that has got
influence on the performance of distribution logistics at Kibos Sugar Company since majority of
the respondents supported the idea. The study also found that size of data base influences
distribution performance at Kibos Sugar Company since and that if information system is not
trusted it gives no confidence to the users and thus no satisfaction which is then detrimental to
the distribution performance. Finally on this objective, the study realized that predictability
affects future financial information and therefore is an important factor which affect performance
29
distribution. This is in line with the findings of Coyle et al (2009) in his study on Management of
Business Logistics, a Supply Chain Perspective in South Western, Us, where he noted that
distribution structure pertains to how the distribution processes are set up and thus the
distribution structure used by a manufacturing firm may also have impact on the ability of its
Distribution Logistics to perform
5.2.2 Effect of distribution structure on performance of distribution in Kibos Sugar and
Allied Industries Limited, Kenya
It was evidenced from the study that distribution structure is a factor which to a greater extent
assist or influences distribution performance. Besides, the study revealed that availability of
regional depots enables customers to easily reach the products and thus limited stock outs which
in the long run translates to positive distribution performance. The study found that route-
planning is therefore a main element of distribution structure that if considered by the
management at Kibos sugar company, then this can lead to increased distribution performance,
that is, route planning enables timely deliveries of products, and that it enables cost reduction as
the customer is already predetermined therefore no more trials to consume cost in regard to time,
fuel and vehicle maintenance costs. This finding is supported by Kahia (2014) in his study on
factors affecting performance of distribution logistics in Bata shoe Company in Kenya, noted
that regional depots may allow for proper capacity utilization of transport over long distances as
this is not dependent on individual customer orders. Also learnt is that the mode of transport like
using a trailer instead of a ten wheeler is recommended as it encourages performance
distribution.
5.3 Conclusions
The findings of this study fills the gap left out in previous theoretical and qualitative studies on
distribution and logistics performance. From the findings the study found that the main sub
variables of distribution affects the distribution performance. On the effects of information
systems on performance of distribution logistics, the study realized that accuracy of
information/data collected, size of data base and ability of management information system to
predict future decisions are significant elements of information systems that has got vast
influence on the performance of distribution logistics. This fills the gap in the study by Stank and

30
Keller (2001), they did not find any relationship between information systems and distribution
performance while the present study finds that indeed there exist a relationship between
information systems and logistics performance at Kibos sugar Company and Allied Industries.
The study therefore concludes that management information system coupled with various
information technology are key in managing every distribution aspect for sure performance.
From the findings on effects of distribution structure on performance of distribution, the study
realized that distribution structure is a factor which influences distribution performance through
availability of regional depots which enables customers to easily reach the products limiting
stock outs which in the long run translates to positive distribution performance. Besides,route-
planning which is still part of the distribution structure if considered enables timely deliveries of
products, cost reduction as the customer is already predetermined therefore no more
trials/voluntary selling, reduces cost in regard to time, fuel and vehicle maintenance costs. The
present study hence fill the gap in the study by Knemeyer and Murphy, (2004) and in the study by
Parthanadee and Logendran (2006) in USA, where he noticed that in logistics system,
distribution cost is typically the highest single expense. That is, through implementing proper
distribution structure, nearly all the avoidable costs will be limited. The study therefore
concludes that distribution structure used by a manufacturing firm have an impact on the ability
of its Distribution Logistics to perform.
5.4 Recommendations
There is need of embracing modern and current technology which can aid various user of
organization information to collect, analyze, interpret and come up with various useful decisions
affecting the organization.
Finally, the researcher recommends that Kibos Sugar Company and Allied Industries should
consider the findings of this study on distribution structure which in the long run will give them
an edge over other sugar suppliers/manufacturers. That is, distribution structure which is more
organized enables flow of information and activities which enables easy order tracking, efficient
loading and delivery to the customers.

31
5.5 Suggestion for further study
This study provides quantitative evidence for the implication of managing distribution channels
and how this translates to the overall organizational goals. Therefore, this evidences that there is
need to emphasize the need of proper distribution structure. Further, this study was only carried
out in Kisumu specifically at Kibos Sugar Company and Allied Industries therefore the findings
are only limited to this organization. Further study needs to be done on the same topic but in
other smaller institutions especially nationally so as to spur development in the country and in
Africa at large.
32
REFERENCES
Asiamah Y., Alfred O., Solomon B.; Effective distribution management, a pre-requisite for retail
operations: a case of Poku trading Published by European Centre for Research Training
and Development UK, (www.ea-journals.org)
Bataworld new steam. (2012). distribution logistics structure. Retrieved August 14, 2013, from
bataworldnews:…http://www.world.bata.com/cn/en/virtual_library/distribution_Infrastru
cture/Lo gistics.pdf
Bowersox, Closs, & Cooper. (2010). Supply Chain Logistics Management. Boston: McGraw-
Hil.
Ceva, “Logistics and Competitive Strategy," European Management Journal, 11(2), 126-138,
2010
Chopra, S., “Designing the distribution network in a supply chain”, Transportation Research Part
E, 39(2), 123-140, 2003.
Coyle et al (2009) The Management of Business Logistics, a Supply Chain Perspective,
Thompson Learning, South Western
Cooper, F. “Global complexities challenge how IT managers handle distribution,” Journal of
Marketing, Fall. 47, pg. 96, 2006
Cyplik, P., Hadaś , L. & Domański, R. (2009). Implementation of the theory of constraints in the
area of stock management within the supply chain: a case study, Electronic Scientific
Journal of Logistics, 5(6), 34
Du, F. & Evans, G.W., “A bi-objective reverse logistics network analysis for post-sale service”,
Computers & Operations Research, 35(8), 2617-2634, 2008.
Eskigun, E., Uzsoy, R., Preckel, P.V., Beaujon, G., Krishnan, S., & Tew, J.D., “Outbound
supply chain network design with mode selection, lead times and capacitated vehicle
distribution centers”, European Journal of Operational Research, 165(1), 182-206, 2005.
Kahia G. Factors Affecting the Performance of Distribution Logistics among Production Firms
in Kenya: A Case Study of Bata Shoe Company (K) Limited International Journal of
Academic Research in Business and Social Sciences October 2014, Vol. 4, No. 10 ISSN:
2222-699

33
Knemeyer, A. M., & Murphy, P. R. (2004). Evaluating the performance of third-party logistics
arrangements: A relationships marketing perspective. Journal of Supply Chain
Management, 40(1), 35-51
Kotler, eta‟l( 2010) marketing management, Prentice Hall, USA
Kothari, C. (2008). Pretesting in questionnaire design: The impact of respondent characteristics
on error detection. Journal of the Market Research Society, 36(October), 295–
314.
La-Londe, Martha, Cooper, & Noordewier. (2008). A management perspective:. Customer
service , 51-56.
M.Christopher, & D. To will. (2001). An integrated model for the design of agile supply chains.
International Journal of Physical distribution & Logistics Management , 235-246.
Mugenda, O. &Mugenda, A. (2003). Research Methods: Quantitative & Qualitative
Approaches. Nairobi: Acts Press.
Parthanadee, P. & Logendran, R., “Periodic product distribution from multi-depots underlimited
supplies”, IIE Transactions, 38(11), 1009-1026, 2006.
Paulraj, & Chen. (2007). “Strategic Buyer-Supplier Relationships. Journal of Supply chain
Management , 2-14. Vol. 1, No. 3, pp.28-44, September 2013
Prabhakarsri, “A brief note on logistics industry in India,” Retrieved from
http://prabhakarsri.wordpress.com/ 2010/10/12/abrief-note-on-logistics-industry-in-india/
on November 7th, 2010
Simatupang, T.M., & Sridharan, R. (2005).An integrative framework for supply chain
collaboration, International Journal of Logistics Management11 (2), 257-274.
Weiss, H.J and Gershon, M.E (2002) Production and Operation Management.
XU Y. A Review of Distribution Related Problems in Logistics and Supply Chain Research
Department of Marketing and Decision Sciences, San Jose State University1 Washington
Square, San Jose, California, USA Vol. 2, No. 4, December 2013

34
APPENDICES
APPENDIX I: BUDGET
Source: Author (2018)
Activity Amount in Ksh.
Transport1 5,000
Research assistants2 30,000
Typing, Photocopying and Binding3 10,500
Internet4 8,000
Laptop5 105,000
Publication6 13,000
Total 171,500

35
APPENDIX II: QUESTIONNAIRE
PART A: DEMOGRAPHICS
1. What is your gender?
1=Female [ ] 2=Male [ ]
2. In which age group do you belong?
1=20-30 years [ ]
2=31-40 years [ ]
3=41-50 years [ ]
4=51-60 years [ ]
5=More than 60 years [ ]
3. No. of years served in Kibos ?
0 – 2 years [ ]
2 – 4 years [ ]
4 – 6 years [ ]
Over 6 years [ ]
4. What is the highest education you achieved?
Less than degree [ ]
Degree [ ]
Masters degree [ ]
36
PART B: Objectives Questions
1. What are the information systems related factors that influence the performance of
distribution?
Strongly
Agree=1
Agree=2 Neutral=3 Disagree=4 Strongly
Disagree=5
Speed
Accuracy
Size of data
base
Satisfaction
Predictability
2. a).Does distribution structure used by a manufacturing firms have impact on the ability of
its Distribution Logistics performance?
1=Strongly Agree ( )
2=Agree ( )
3=Not sure ( )
4=Disagree ( )

37
b). What are the distribution structure related factors that influence the performance of
distribution logistics?
Strongly Agree=1 Agree=2 Neutral=3 Strongly Disagree=4
Availability of
regional depots
Route planning
Mode of
transport
c). How does availability of regional depots impacts on DL performance
Allows proper capacity utilization 1=Yes[ ] 2=No [ ] 3=Not Sure [ ]
Brings products closer to the customer 1=Yes[ ] 2=No [ ] 3=Not Sure [ ]
Enable deliveries within short notice 1=Yes[ ] 2=No [ ] 3=Not Sure [ ]
Reduces the lead time 1=Yes[ ] 2=No [ ] 3=Not Sure [ ]
Any other ………………………………………………………………………
d). Impact of route planning on distribution logistic performance
Timely deliveries of products 1=Yes[ ] 2=No [ ]
Cost reduction 1=Yes[ ] 2=No [ ]
Add at least two………………………………………………………………….
e). What is the effect of transportation means on Distribution Logistics performance
Determines flexibility 1-Agree [ ] 2=Disagree 3=Not certain
Enhances door to door deliveries 1-Agree [ ] 2=Disagree 3=Not certain
Add at least two……………………………………………………………………
THANK YOU FOR TIME AND YOUR PARTICIPATION