factors affecting online shopping of...
TRANSCRIPT
FACTORS AFFECTING ONLINE SHOPPING OF
PURCHASING APPARELS AMONG YOUNG
ADULTS
CHONG HUI TEING
MASTER OF BUSINESS ADMINISTRATION
UNIVERSITI TUNKU ABDUL RAHMAN
FACULTY OF ACCOUNTANCY AND MANAGEMENT
AUGUST 2014
Factors Affecting Online Shopping of Purchasing Apparels
among Young Adults
Chong Hui Teing
A research project submitted in partial fulfillment of the
requirement for the degree of
Master of Business Administration
Universiti Tunku Abdul Rahman
Faculty of Accountancy and Management
August 2014

Factors Affecting Online Shopping of Purchasing Apparels
among Young Adults
By
Chong Hui Teing
This research project is supervised by:
Ms Malathi Nair a/p G. Narayana Nair
Senior Lecturer
Department of International Business
Faculty of Accountancy and Management

__________________________________________________________________________________
______________________________________________________________________________
iii
Copyright @ 2014
ALL RIGHTS RESERVED. No part of this paper may be reproduced, stored in a
retrieval system, or transmitted in any form or by any means, graphic, electronic,
mechanical, photocopying, recording, scanning, or otherwise, without the prior
consent of the authors.

__________________________________________________________________________________
______________________________________________________________________________
iv
DECLARATION
I hereby declare that:
(1) This MKMA25106 Research Project is the end result of my own work and
that due acknowledgement has been given in the references to all sources of
information be they printed, electronic, or personal.
(2) No portion of this research project has been submitted in support of any
application for any other degree or qualification of this or any other university,
or other institutes of learning.
(3) The word count of this research report is 16,776.
Name of Student: Chong Hui Teing____
Student ID: 09UKM07177_____
Signature: _________________
Date: _________________

__________________________________________________________________________________
______________________________________________________________________________
v
ACKNOWLEDGEMENT
I would like to take this opportunity to acknowledge the contribution of the people
who have been supporting, guiding and assisting me to complete this research project.
First of all, I would like to express my gratitude to my supervisor Ms. Malathi Nair
for continuous support with her patience and encouragement throughout my research
project. She is an excellent mentor who dedicates her time and knowledge to lead me
until the completion of this research project.
Besides that, I also wish to thank all the respondents who had participated in my
questionnaire survey and contribute their opinion to my research successful. Last but
not least, heartfelt appreciation to my friends and my family for their understanding,
encouragement and endless support during the time of my research in progress to
complete.

__________________________________________________________________________________
______________________________________________________________________________
vi
TABLE OF CONTENTS
Pages
Copyright Page ………………………………………………………………...
Declaration …………………………………………………………………….
Acknowledgement ……………………………………………………………..
Tables of Contents …………………………………………………………......
List of Tables ………………………………………………………………......
List of Figures ………………………………………………………………….
Abstract ………………………………………………………………………...
iii
iv
v
vi
xi
xiii
xiv
CHAPTER 1 INTRODUCTION
1.0 Introduction …………………………………………………….
1.1 Background of Study …………………………………………..
1.1.1 Overview of Online Apparel Retailing in Malaysia …...
1.2 Problem Statement ……………………………………………..
1.3 Research Objectives ……………………………………………
1.4 Research Questions …………………………………………….
1.5 Hypotheses Development ……………………………………...
1.5.1 Privacy/ Security and E-Shopping Satisfaction ………..
1.5.2 Website Design and E-Shopping Satisfaction ………….
1.5.3 Customer Service and E-Shopping Satisfaction ………..
1.5.4 Atmospheric/ Experiential and E-Shopping Satisfaction .
1.5.5 E-Shopping Satisfaction and E-Shopping Intention ……
1.5.6 E-Shopping Quality Dimensions and E-Shopping
Intention ………………………………………………...
1.6 Significance of Study …………………………………………..
1.7 Conclusion ……………………………………………………...
1
1
3
6
9
10
10
10
11
11
11
12
12
13
14
CHAPTER 2 LITERATURE REVIEW
2.0 Introduction …………………………………………………….
15

__________________________________________________________________________________
______________________________________________________________________________
vii
2.1 Dimensions of E-Shopping Quality ……………………………
2.1.1 Privacy/ Security ….........................................................
2.1.2 Website Design ………………………………………...
2.1.3 Customer Service ………………………………………
2.1.4 Atmospheric/ Experiential …..…………………………
2.1.5 E-Shopping Satisfaction ……………………………….
2.1.6 E-Shopping Intention …………………………………..
2.2 E-Shopping Quality-Satisfaction-Behavioral Intention
Link …………………………………………………………….
2.3 Theoretical Framework ………………………………………...
2.4 Conceptual Framework ………………………………………...
2.5 Hypotheses Development ……………………………………...
2.5.1 Privacy/ Security and E-Shopping Satisfaction ………..
2.5.2 Website Design and E-Shopping Satisfaction ………….
2.5.3 Customer Service and E-Shopping Satisfaction ………..
2.5.4 Atmospheric/ Experiential and E-Shopping Satisfaction ...
2.5.5 E-Shopping Satisfaction and E-Shopping Intention ……
2.5.6 E-Shopping Quality Dimensions and E-Shopping
Intention ………………………………………………...
2.6 Conclusion ……………………………………………………...
15
20
22
23
24
25
26
27
29
30
31
31
32
32
33
33
34
35
CHAPTER 3 RESEARCH METHODOLOGY
3.0 Introduction …………………………………………………….
3.1 Research Design ………………………………………………..
3.2 Data Collection …………………………………………………
3.2.1 Primary Data ……………………………………………
3.3 Sampling Design ………………………………………………..
3.3.1 Target Population ……………………………………….
3.3.2 Sampling Frame and Location ………………………….
3.3.3 Sampling Elements …………………………………….
3.3.4 Sample Size ……………………………………………
3.3.5 Sampling Technique …………………………………...
36
36
37
37
38
38
38
39
39
40

__________________________________________________________________________________
______________________________________________________________________________
viii
3.4 Research Instrument ……………………………………………
3.4.1 Questionnaire Design ………………………………….
3.4.2 Measurement Scales …………………………………...
3.4.2.1 Nominal Scale ………………………………….
3.4.2.2 Interval Scale …………………………………..
3.4.2.3 Likert-Style Rating Scale ………………………
3.5 Data Processing ……………………………………...................
3.5.1 Descriptive Analysis …………………………………...
3.5.2 Pilot Test and Reliability Analysis …………………….
3.5.3 Pearson Correlation Analysis …………………………..
3.5.4 Multiple Regression Analysis ………………………….
3.5.5 Linear Regression Analysis …………………………….
3.6 Conclusion ……………………………………………………...
41
41
43
43
43
43
44
44
44
46
47
48
48
CHAPTER 4 DATA ANALYSIS
4.0 Introduction …………………………………………………….
4.1 Descriptive Analysis ……………………………………………
4.1.1 Frequency of Target Respondents Based on Gender
Group …………………………………………………..
4.1.2 Frequency of Target Respondents Based on Age
Group …………………………………………………..
4.1.3 Frequency of Target Respondents Based on Gender
Group …………………………………………………..
4.1.4 Frequency of Target Respondents Based on Monthly
Income …………………………………………………
4.1.5 Frequency of Target Respondents Based on Highest
Education Attained ……………………………………..
4.2 Reliability Test ………………………………………………….
4.3 Pearson Correlation Analysis …………………………………..
4.4 Multiple Regression Analysis (Independent Variables toward
E-Shopping Satisfaction) ………………………………………
4.5 Multiple Regression Analysis (Independent Variables toward
49
49
50
51
52
53
54
56
57
58
__________________________________________________________________________________
______________________________________________________________________________
ix
E-Shopping Intention) …………………………………………
4.6 Simple Linear Regression (Mediator toward E-Shopping
Intention) ………………………………………………………
4.7 Hypothesis Testing …………………………………………….
4.8 Conclusion ……………………………………………………..
61
63
65
66
CHAPTER 5 DISCUSSION AND CONCLUSION
5.0 Introduction …………………………………………………....
5.1 Summary of Statistical Analysis ………………………….........
5.1.1 Descriptive Analysis …………………………………...
5.1.2 Scale Measurement …………………………………….
5.1.3 Pearson Correlation Analysis ………………………….
5.1.4 Multiple Regression Analysis (Independent Variables
toward E-Shopping Satisfaction) ………………………
5.1.5 Multiple Regression Analysis (Independent Variables
toward E-Shopping Intention) …………………………
5.1.6 Linear Regression Analysis ……………………………
5.2 Discussions of Major Findings ………………………………...
5.2.1 Privacy/ Security and E-Shopping Satisfaction ………..
5.2.2 Website Design and E-Shopping Satisfaction ………….
5.2.3 Customer Service and E-Shopping Satisfaction ………..
5.2.4 Atmospheric/ Experiential and E-Shopping Satisfaction ..
5.2.5 E-Shopping Satisfaction and E-Shopping Intention ……
5.2.6 E-Shopping Quality Dimensions and E-Shopping
Intention ………………………………………………...
5.3 Implications of the Study ……………………………………….
5.3.1 Implications for Online Apparel Marketers …………….
5.4 Limitation of Study ……………………………………………..
5.5 Future Studies …………………………………………………..
5.6 Conclusion ……………………………………………………...
67
67
67
68
68
69
70
71
71
73
74
75
76
77
78
79
79
80
81
82

__________________________________________________________________________________
______________________________________________________________________________
x
REFERENCES ………………………………………………………………...
APPENDICES …………………………………………………………………
83
91

__________________________________________________________________________________
______________________________________________________________________________
xi
LIST OF TABLES
Page
Table 2.1: Summary of Dimensions of E-Shopping Quality ………………….
Table 3.1: Sample Sizes for Different Sizes of Population at a 95 Confidence
level ………………………………………………………………..
Table 3.2: Source of Questionnaire …………………………………………...
Table 3.3: Results of Reliability Analysis (n=30) ……………………………
Table 4.1: Gender Group (n=384) ……………………………………………
Table 4.2: Age Group (n=384) ……………………………………………….
Table 4.3: Race Group (n=384) ……………………………………………...
Table 4.4: Monthly Income Group (n=384) …………………………………
Table 4.5: Highest Education Attained Group (n=384) ……………………..
Table 4.6: Results of Reliability Test (n=384) ………………………………
Table 4.7: Pearson Correlation Analysis …………………………………….
Table 4.8: Model Summary for Independent Variables toward E-Shopping
Satisfaction ……………………………………………………….
Table 4.9: ANOVAb
for Relationship between Independent Variables and
E-Shopping Satisfaction ………………………………………….
Table 4.10: Coefficientsa for Relationship between Independent Variables
and E-Shopping Satisfaction ……………………………………..
Table 4.11: Model Summary for Independent Variables toward E-Shopping
Intention ………………………………………………………….
Table 4.12: ANOVAb
for Relationship between Independent Variables and
E-Shopping Intention …………………………………………….
Table 4.13: Coefficientsa
for Relationship between Independent Variables
and E-Shopping Intention ………………………………………..
Table 4.14: Model Summary for Simple Linear Regression …………………
19
40
42
46
50
51
52
53
54
56
57
58
59
60
61
62
62
63

__________________________________________________________________________________
______________________________________________________________________________
xii
Table 4.15: ANOVAb
for Simple Linear Regression …………………………
Table 4.16: Coefficientsa for Simple Linear Regression ……………………...
Table 4.17: Summary for Hypothesis Testing ………………………………..
Table 5.1: Summary of Research Objectives, Hypothesis and Results ……..
64
64
65
71
__________________________________________________________________________________
______________________________________________________________________________
xiii
LIST OF FIGURES
Page
Figure 1.1: Frost & Sullivan Malaysian E-Commerce Forecast ……………….
Figure 1.2: E-Commerce Categories of Online Shoppers Preferable ………….
Figure 1.3: Online Shoppers Profile …………………………………………...
Figure 2.1: Online Apparel Retailing: Roles of E-Shopping Quality and Experiential
E-Shopping Motives …………………………………
Figure 2.2: Factors Affecting E-Shopping Quality Dimensions on Apparel
E-Shopping Intention ……………………………………………..
Figure 3.1: Values of the Pearson Correlation Coefficient ……………………
Figure 4.1: Gender Group …………………………………………………….
Figure 4.2: Age Group ………………………………………………………..
Figure 4.3: Race Group ……………………………………………………….
Figure 4.4: Monthly Income Group ……………………………………………
Figure 4.5: Highest Education Attained Group ………………………………..
4
5
6
29
30
47
50
51
52
53
55
__________________________________________________________________________________
______________________________________________________________________________
xiv
ABSTRACT
FACTORS AFFECTING ONLINE SHOPPING OF PURCHASING APPARELS
AMONG YOUNG ADULTS
Chong Hui Teing
Rapid growth of internet service has provided another huge marketplace for apparel
retailing. In recent years online retailing has become another business trend in
Malaysia. Therefore, this research project establishes a valid measure on e-shopping
quality dimensions on online apparel retailing. The major aim of this research project
is to identify the factors of e-shopping quality dimensions that influence consumers’
e-shopping satisfaction and e-shopping intention on online apparel shopping. In
addition, it investigates the relationships between the independent variables (privacy/
security, website design, customer service and atmospheric/experiential), mediator (e-
shopping satisfaction) and dependent variable (e-shopping intention). Primary data
were collected through survey questionnaire with 384 respondents who have
experience purchasing apparel from online store. Through the Statistical Package for
Social Science (SPSS) version 20.0, data collected are able to be analyzed and results
are discussed in the form of table and chart. The analysis results of this research
project were discussed in order to understand the relationship between the
independent variables (privacy/ security, website design, customer service and
atmospheric/ experiential), mediator (e-shopping satisfaction) and dependent variable
(e-shopping intention). Lastly, managerial implications have been discussed to
provide useful information to the online apparel retailers. At the end of project, the
limitations and several recommendations will be addressed and presented in this
study.

__________________________________________________________________________________
__________________________________________________________________________________
page 1 of 106
CHAPTER 1
INTRODUCTION
1.0 Introduction
In this chapter background of the study, problem statement, research objectives and
research questions will be discussed. Then followed by the hypothesis development,
theoretical framework and significance of the studies will be discussed as well. In the
end of this chapter, a brief description of this chapter will be provided.
1.1 Background of Study
In recent years, business world has changed extremely with the development of
internet as essential business platform. No doubt electronic commerce (e-commerce)
has grown extensively and rapidly in current business world. E-commerce can be
defined as commercial transactions conducted electronically on the internet (Kotler &
Keller, 2012).
More and more companies are attempting to gain competitive advantages by using e-
commerce as business platform (Lee & Lin, 2005). The development technology of
internet has created unlimited opportunities for e-commerce due to the compelling
advantages that offers over conventional bricks and mortar stores such as greater
flexibility and market outreach, lower cost structures, broader product line, smoother
transaction, convenience and customization (Hou, 2005). However, in recent years

__________________________________________________________________________________
__________________________________________________________________________________
page 2 of 106
one of the most drastic changes in shopping behavior by most of the consumers in
apparel buying have shifted from offline to online. At the same time, more and more
apparel retailers are adopting the technology of internet as their major business
platform due to lower cost. However, the advance technology development of internet
creates intense competition among online retailers in marketplace. Besides that, easy
interaction with customers via online allows the internet based business to grow
tremendously and rapidly. Lee and Lin (2005) stated that most experience and
success retailers are beginning to realize that key determinants of success not merely
depend on presence of websites and lower price but also includes the online service
quality.
However, without a proper quality management from its systems, staff and supplier, it
is very hard to satisfy customers due to retailers unable to deliver the appropriate
level of service quality (Cox & Dale, 2001). Effectively managing online stores that
influence customer satisfaction not only for online retailer but also essential for multi-
channel retailer due to the reciprocal effects across the channel (Venkatesan, Kumar
& Ravishanker, 2007). According to Finn earlier study in 2008 (as cited in Ha &
Stoel, 2012) stated those customers who have a bad online shopping experience
appear to resist shop through the retailer’s other channels. Therefore, customer online
shopping satisfaction plays an important role to sustain the growth of not only the
online business but also the overall business.
Thus, it is crucial for apparel retailers to understand the determinants of online
shopping quality and key factors that influence consumer shopping outcome such as
e-shopping satisfaction and e-shopping intention (Lee & Lin, 2005; Ha & Stoel,
2012). Therefore, the complete framework is needed to identify the e-shopping
quality dimensions that influence consumer shopping outcomes (e-satisfaction and e-
shopping intention).

__________________________________________________________________________________
__________________________________________________________________________________
page 3 of 106
1.1.1 Overview of Online Apparel Retailing in Malaysia
The rapid growth of internet service has provided another huge marketplace for
apparel retailing in Malaysia. In the recent years, online retailing has become another
business trend in Malaysia. Online marketplace able provides benefits for both
retailers and consumers. Thus, it provides cost effective channel for retailers to reach
their target consumers. Also, benefit consumers because online purchasing save time
and money while providing with more product choices (Alba, Lynch, Weitz,
Janiszewski, Lutz & Wood, 1997). The advantages of online marketplace give impact
towards online apparel industry, to name few online stores such as Zalora,
Dressabelle, Lazada, Taobao and Dressmi that have been growing extensively in
Malaysia.
As a result, a study done by Kamaruzaman and Handrich (2010) showed that the e-
commerce spending behavior of online users show a newly adopted trend among
consumers in Malaysia. Based on Figure 1.1 indicated that e-commerce market size
of Malaysia in the year of 2010 reached USD 29.24 billion and estimated market size
able to reach USD 64.2 in the year of 2013.Through the statistic, it is revealed that
emerging of online market and huge potential opportunities for retailers.

__________________________________________________________________________________
__________________________________________________________________________________
page 4 of 106
Figure 1.1: Frost & Sullivan Malaysian E-Commerce Forecast
Note. From Kamaruzaman, K. N., and Handrich, Y. M. (2010). E-commerce adoption in Malaysia:
trends, issues and opportunities. ICT Strategic Review 2010/11 E-Commerce for Global
Reach (pp89-134). Pikom: Frost & Sullivan.
According to Lee (2014), most of the online consumers prefer to purchase via internet
because they can compare different types of products or services and discover
something exclusive. Among the online shoppers, Lee (2014) showed that the
statistics in the year of 2013 indicated that more than 50% of online shoppers shop
online once or more in a month meanwhile 85% of online shoppers spend RM500 to
purchase via internet or less in a month. Compare with traditional apparel retailing
outlet, online apparel retailing able to provide sharp price reductions and frequently
change assortment due to low cost of managing. In Malaysia, mostly apparel category
included fashion clothing with accessory and apparel consider emerged as the second
largest of e-commerce category (Figure 1.2) which consists 50% in the local site and
the largest e-commerce category that consist 27% in foreign site (Lee, 2014).

__________________________________________________________________________________
__________________________________________________________________________________
page 5 of 106
Figure 1.2: E-Commerce Categories of Online Shoppers Preferable
Note. From Lee, Y. L. (2014, February 19). “Cyberworld”. Sin Chew Daily, pp. 1-2.
Meanwhile, Lee (2014) stated that young adults has the most online purchase power
which consists 29% of aged from 18 to 25 and 51% of aged from 26 to 35. Based on
Figure 1.3, male consumers consist 51% and compare with female consumers were
49% (Lee, 2014). Therefore, it can be concluded that male and female consumers
equally important on online shopping and retailers can’t afford to ignore them.

__________________________________________________________________________________
__________________________________________________________________________________
page 6 of 106
Figure 1.3: Online Shoppers Profile
Note. From Lee, Y. L. (2014, February 19). “Cyberworld”. Sin Chew Daily, pp. 1-2.
1.2 Problem Statement
Online apparel retailing consists very large market share of total online sales in
Malaysia. Most of the traditional retailers have recognized internet will become
powerful marketing channel with the steady growth of market size (Tung, 2012).
Online consumers expect high standard of online service quality since it is much
easier to compare price online thus online service quality play a significant key factor
for consumers (Santos, 2003). In order to increase competiveness of online stores, in
depth understanding of online service quality or factors that influencing consumers
shop online should be given priority.
There is the involvement of money and personal information when purchase via
internet therefore online consumers always concern about safety of the site and
protection of customer information (Parasuraman, Zeithaml & Malhorta, 2005).

__________________________________________________________________________________
__________________________________________________________________________________
page 7 of 106
According to Sharma and Sheth (2004), indicated that privacy and security has been a
critical issue in online retailing because there is the risk that related to misuse of
personal information and cause people afraid to buy products through internet.
Therefore, privacy and security is one of the main factors that influence on consumers’
shopping outcome (satisfaction and shopping intention).
Website design that presented to customers is crucial for online stores (Than &
Grandon, 2002). The quality of website and features always play an important role to
influence consumers to shop online. Earlier study by Chen and Wells in year 1999 (as
cited in Kim & Stoel, 2004) indicated that online shoppers have been frustrated with
the ineffective website design even though created by website consultants.
Meanwhile, Srinivasan, Anderson, and Ponnavolu (2002) stated that online users
more easy to abandon the site if discouraged in their efforts to find needed
information due to the ineffective website. Kim, Kim and Lennon (2011) also
identified that lack of relevant product information in the website may lead to the risk
that consumer exiting the website without any purchase. Therefore, website design
factors are strong predictors of customer satisfaction (Cho & Park, 2001).
Furthermore, without doubt e-shopping quality always link to customer service. It is
because customer service refer to how often an online store voluntarily provides
services such as responding to customer needs and inquiries promptly. Making the
services available at the click of a mouse is one of the important elements of customer
service because online retailing has no salespersons presence and direct human
interaction is limited (Kim et al., 2011). Wolfinbarger and Gilly (2003) stressed that
delayed customer inquiry services may lead to negative impact on consumer thus
affecting consumer purchase intention. Therefore, Ha and Stoel (2012) stated that
customer service had a significant relationship on e-shopping outcome and considers
one of the important factors that impact on e-shopping outcome.

__________________________________________________________________________________
__________________________________________________________________________________
page 8 of 106
Some of the consumers seek for fun, excitement or pleasure while shop online. Bauer,
Falk and Hammerschmidt (2006) and Ha and Stoel (2009) noted that very less study
account for hedonic aspect and consumer’s beliefs about enjoyment of a retail website.
According to Ha and Stoel (2009), consumers are more likely to experience greater
enjoyment and have more fun when shop at online store. Moreover, Ha and Stoel
(2012) also noted that value of atmospheric/ experiential able to influence overall
assessment of an online store. Therefore, atmospheric/ experiential dimension
considers a critical factor that influence consumers while shop online apparel store.
Lee and Lin (2005) suggested that customer perceptions of online service quality had
significant relationship with customer satisfaction and purchase intention. Nowadays,
online retailers are striving to fulfill every consumer’s needs due to intense
competitive online market. Customer satisfaction plays a critical role on establishing
long term client relationships and sustaining profitability (Schaupp & Belanger, 2005).
Moreover, Llusar, Zornoza and Tena (2011) also proved that customer satisfaction
played a critical mediator role between service quality and purchase intention.
Therefore, poor customer satisfaction will affect the client relationships and negative
word of mouth will spread from customers. Thus, reputation will affect by negative
evaluation from customers and profitability of online business definitely will decrease.
Therefore, online retailers always need to put more effort on the customer satisfaction
since customer satisfaction is a critical key to sustain profitability of online business.
According to Im and Ha (2011), shopping or purchase intention considers one of the
most important variables to predict future behavior of consumers. Based on earlier
study of Schlosser in the year 2003 (as cited in Im & Ha, 2011) suggested that
purchase intention can be a measurement to predict actual consumers purchase
behavior. Therefore, possible negative effects will occur on online business if online
retailer underestimates consumers shopping or purchase intention since it can predict
actual consumers purchase behavior.

__________________________________________________________________________________
__________________________________________________________________________________
page 9 of 106
Chua, Khatibi and Ismail (2006) and Tung (2012) stated that very limited studies and
references of online shopping quality dimensions major focused on online apparel
industry. Although there is high potential of online market in apparel industry but still
lack of understanding the subject matter that potential impact on consumer
satisfaction and shopping intention (Chua, Khatibi & Ismail, 2006). Therefore, a
framework is needed to structure e-shopping quality dimensions (privacy/security,
website design, customer service and atmospheric/ experiential) with the effects on e-
shopping outcomes (e-shopping satisfaction and e-shopping intention) on online
apparel retailing in Malaysia.
1.3 Research Objectives
This study was aim to examine the relationship among e-shopping quality dimensions,
e-shopping satisfaction and e-shopping intention towards online apparel retailing in
Malaysia. More specifically, the proposed study is:
1) To examine privacy/ security and e-shopping satisfaction on online apparel
retailing.
2) To examine website design and e-shopping satisfaction on online apparel
retailing.
3) To examine customer service and e-shopping satisfaction on online apparel
retailing.
4) To examine atmospheric/ experiential and e-shopping satisfaction on online
apparel retailing.
5) To examine mediation effect of e-shopping satisfaction towards e-shopping
intention.
6) To examine e-shopping quality dimensions and e-shopping intention on online
apparel retailing.

__________________________________________________________________________________
__________________________________________________________________________________
page 10 of 106
1.4 Research Questions
Six research questions for the proposed study are as follows:
1) Does privacy/ security influence e-shopping satisfaction on online apparel
retailing?
2) Does website design influence e-shopping satisfaction on online apparel retailing?
3) Does customer service influence e-shopping satisfaction on online apparel
retailing?
4) Does atmospheric/ experiential influence e-shopping satisfaction on online
apparel retailing?
5) Does e-shopping satisfaction mediate e-shopping quality dimensions (privacy/
security, website design, customer service and atmospheric/ experiential) and e-
shopping intention?
6) Do e-shopping quality dimensions play a role towards consumer online apparel
shopping intention?
1.5 Hypotheses Development
1.5.1 Privacy/ Security and E-Shopping Satisfaction
Privacy/ security usually are one of the unquestionably important factors that
influence consumers’ e-shopping intention. According to Hung (2004), consumers
always concerned with payment or personal risk, privacy and security when
considering online shopping. Therefore, the hypotheses will be postulated as:
H1: There is a significant relationship between privacy/ security and e-shopping
satisfaction on online apparel retailing.

__________________________________________________________________________________
__________________________________________________________________________________
page 11 of 106
1.5.2 Website Design and E-Shopping Satisfaction
The ability to build an effective marketing web site has become crucial requirement
for survival in internet marketing (Kala, Chee & Muhammad, 2013). According to Ha
and Stoel (2012), visually appealing and tidy, readable and user friendly website
always play an important role to increase consumers’ e- shopping satisfaction as well
as e-shopping intention. So the hypotheses will be postulated as:
H2: There is a significant relationship between website design and e-shopping
satisfaction on online apparel retailing.
1.5.3 Customer Service and E-Shopping Satisfaction
Liao and Cheung (2002) stated that consumers always expect online retailer to
respond to their inquiries and needs promptly. Therefore Yang and Jun (2002)
highlighted customer service is one of the important factors on satisfaction as well as
shopping intention. So the hypotheses will be postulated as:
H3: There is a significant relationship between customer service and e-shopping
satisfaction on online apparel retailing.
1.5.4 Atmospheric/ Experiential and E-Shopping Satisfaction
According to Ha and Stoel (2012), consumers seek and value atmospheric features as
feeling of fun, excitement or pleasure and consider distinct features that influence
overall e-store assessment. Therefore, Ha and Stoel (2012) stated that atmospheric is
one of the critical factors that affected e-shopping intention through e-shopping
satisfaction. So the hypotheses will be postulated as:
H4: There is a significant relationship between atmospheric and e-shopping
satisfaction on online apparel retailing.

__________________________________________________________________________________
__________________________________________________________________________________
page 12 of 106
1.5.5 E-Shopping Satisfaction and E-Shopping Intention
According to the study of Rust and Zahorik in the year 1993 (as cited in Lee & Lin,
2005) found that customer satisfaction significantly influence on customer purchase
intention and profitability of online store. Besides that previous study of Lee and Lin
(2005) suggested that customer perceptions of service quality and satisfaction
positively influence on purchase intention. So the hypotheses will be postulated as:
H5: There is a significant relationship between e-shopping satisfaction and e-shopping
intention on online apparel retailing.
1.5.6 E-Shopping Quality Dimensions and E-Shopping Intention
According to the studies from McDougall and Levesque (2000) and Ha and Stoel
(2012) found that privacy/ security and customer service dimension has direct impact
on consumer e-shopping intention. The study of Sam and Tahir (2009) indicated that
website design positively have direct influence on online purchase intention. Recent
study of Wu, Lee, Fu and Wang (2014) indicated that atmospheric of an online
website elicit positive or negative effect to influence consumers’ purchase intention
and behavior. So the hypotheses will be postulated as:
H6: There is a significant relationship between e-shopping quality dimensions and e-
shopping intention on online apparel retailing.

__________________________________________________________________________________
__________________________________________________________________________________
page 13 of 106
1.6 Significance of Study
The main purpose of this study is to examine the variables of e-shopping quality
dimensions that influence consumers’ e-shopping outcomes (e-shopping satisfaction
and e-shopping intention) towards online apparel retailing. At the same time to
investigate the interdependent relationship between independent variables (privacy/
security, website design, customer service and atmospheric/ experiential), mediator
(e-shopping satisfaction) and dependent variable (e-shopping intention). It is also to
examine consumers’ perspective on e-shopping quality dimensions towards online
purchase apparel in online stores.
From the online apparel retailer perspective, an in-depth understanding on e-shopping
quality dimensions provides a positive contribution such as:
1. Online apparel retailer able to get the useful information and knowledge to
better understand online consumer response process and develop an
innovative online marketing strategy.
2. A successful online marketing strategy able to improve the business
competitiveness and profitability.
From the consumers’ point of view, consumers able to get more concern from
marketer with the e-shopping quality dimensions such as privacy/security, website
design, customer service and atmospheric. Thus consumers will feel fun and pleasure
when shop online meanwhile feel secure too when doing payment or transaction via
internet.
Moreover, this study also can create a valuable reference to researchers. For future
research, researchers can use other type of methodologies such as qualitative method
to examine the e-shopping quality dimensions (privacy/security, website design,
customer service and atmospheric/ experiential) with the e-shopping outcome (e-
shopping satisfaction and e-shopping intention). Besides that, researchers have a

__________________________________________________________________________________
__________________________________________________________________________________
page 14 of 106
better understanding and knowledge on consumer purchase decision making on
online apparel retailing. Therefore, researchers may replicate similar studies
involving online shopper and find out the difference in different industry or area.
Apparel or fashion consists a very large market share and considered one of the
largest e-commerce categories. However, very limited studies focus on online apparel
industry in Malaysia. Therefore, this study is conducted in Malaysia in attempts to fill
the gap on Malaysian consumers’ e-shopping quality dimensions (privacy/security,
website design, customer service and atmospheric/ experiential) and e-shopping
outcome (e-shopping satisfaction and e-shopping intention) and contribute useful
information on the Malaysian consumers’ e-shopping behavior specifically in apparel
industry.
1.7 Conclusion
This chapter is the overview of this research project and describes the background of
online apparel retailing, the issues on research problem questions, objectives,
hypotheses development and the significant of study. On next chapter discussion on
the past researchers studies and identified the potential hypotheses and presented the
theoretical framework that adopted for this research project.

__________________________________________________________________________________
__________________________________________________________________________________
page 15 of 106
CHAPTER 2
LITERATURE REVIEW
2.0 Introduction
Literature review focuses on discussion of past studies by previous researchers. All
the variables will be highlighted and elaborated in this chapter. Meanwhile,
development of theoretical framework will be discussed by providing the relationship
between dependent variable, mediator and independent variables. Besides, hypotheses
development will be discussed in this chapter by associating the relationship between
the dependent variable, mediator and independent variables.
2.1 Dimensions of E-Shopping Quality
From the consumers’ point of view, e-shopping is related to the experience of variety
encounters such as information search, website browsing and navigation, engaging in
transaction, post purchase problem resolution and satisfaction with one’s purchases.
According to Ha and Stoel (2012), e-shopping quality refers to overall consumer
perceptions of the online store’s performance and effectiveness in terms of its product
or service offering through its virtual store.

__________________________________________________________________________________
__________________________________________________________________________________
page 16 of 106
In numerous earlier studies, researchers have attempted to identify multi aspects of e-
shopping quality dimensions that best fit to the online business environments such as
perceived quality of an internet shopping site (SITEQUAL) (Yoo & Donthu, 2001),
internet retail service quality (IRSQ) (Janda, Trocchia & Gwinner, 2002), e-retail
quality (eTailQ) (Wolfinbarger & Gilly, 2003), electronic service quality (E-S-QUAL)
(Parasuraman et al., 2005), modified of e-service quality scale (Lee & Lin, 2005),
quality of electronic service (QES) (Fassnacht & Koese, 2006), an instrument for
consumer evaluation of web sites (WebQual) (Loiacono, Watson & Goodhue, 2007),
perceived e-service quality (PeSQ) (Cristobal, Flavian & Guinaliu, 2007) and review
and evaluate the customer’s internet purchase experience (RECIPE) (Francis, 2009).
Additional in a previous study by Yoo and Donthu (2001) developed a scale
composed of four factors – ease of use, aesthetic design, processing speed and
security to measure SITEQUAL. The generated items of the four factors (ease of use,
aesthetic design, processing speed and security) are mainly focused on consumers’
own descriptions on the quality of an internet shopping site. The SITEQUAL scale
proposed by Yoo and Donthu (2001) indicated appropriate reliability and validity in
every aspect and showed that higher quality of internet shopping will lead to higher
rated in variety of consumer attitudes and behavior such as attitude towards the site,
purchase intention, revisit intention, site loyalty and site equity. Besides that, Janda et
al. (2002) have measured IRSQ by in depth interview with consumers who actively
making purchases online and discovered five dimensions of IRSQ such as
performance, access, security, sensation and information. The findings of the study
from Janda et al. (2002) demonstrated overall dimensions of IRSQ were strong
predictive power for estimating customer satisfaction, word-of-mouth, purchase
intention and to a lesser extent likehood of complaining.

__________________________________________________________________________________
__________________________________________________________________________________
page 17 of 106
Wolfinbarger and Gilly (2003) were focused in measuring eTailQ that incorporates
factors that contributes to experience and satisfaction of online shopping. At first,
Wolfinbarger and Gilly (2003) developed 40 online retail quality items that composed
to eight factors such as fulfillment/ reliability, customer service, personalization,
experiential/atmospheric, ease of use, informativeness, selection and security/ privacy.
The final eTailQ scale is proposed to four dimensions that consists 14 items such as
website design, customer service, fulfillment/ reliability and security/ privacy.
Analysis of Wolfinbarger and Gilly (2003) study suggested that the factors of website
design and fulfillment/ reliability are strongly related to quality of online store. For
the factor of customer service only mildly related to the quality of online stores and
surprisingly security/ privacy not significant to measure the quality of online store
except for the frequent buyer at the online store.
Furthermore, Lee and Lin (2005) examined and revised SERVQUAL model
developed by Parasuraman, Zeithaml and Berry (1988) to establish dimensions of e-
service quality through web site design, reliability, responsiveness, trust and
personalization. Lee and Lin (2005) found that trust and reliability most strongly
affected overall service quality and customer satisfaction. Although dimensions of
responsiveness and website design mildly affected customer satisfaction of online
store, but Lee and Lin (2005) stated that its important should not be underestimated.
Overall study of Lee and Lin (2005) only indicated dimension of personalization not
a significant predictor of overall service quality and customer satisfaction of online
store.
Moreover, Parasuraman et al. (2005) also measuring the service quality of websites
by separated into the scale of E-S-QUAL and E-RecS-QUAL. The scale of E-S-
QUAL is refer to e-core service quality aspects (efficiency, fulfillment, system
availability and privacy) and E-RecS-QUAL is measuring e-recovery service quality
(responsiveness, compensation and contact) is link to the items focused on handling
service problems, inquires and customers had non routine encounters. According to
the findings from variety of reliability and validity tests, Parasuraman et al. (2005)

__________________________________________________________________________________
__________________________________________________________________________________
page 18 of 106
noted that the scale of E-S-QUAL and E-RecS-QUAL demonstrated good
psychometric properties.
Fassnacht and Koese (2006) identified and finalized another dimensions for QES
model such as environment quality (appearance of use interface), delivery quality
(customer and website interaction) and outcome quality (feedback of customer). The
study of Fassnacht and Koese (2006) able to provide empirical evidence suggesting
that developed scale of QES model is fairly robust across different type of electronic
services.
Furthermore, Loiacono et al. (2007) conducted a research on how consumers’
perceptions of websites influence behavior and revisit or purchase and suggested 12
dimensions of WebQual such as informational fit-to- task, tailored information, trust,
response time, ease of understanding, intuitive operations, visual appeal,
innovativeness, emotional appeal, consistent image, online completeness and relative
advantage. Through the study, Loiacono et al. (2007) able to prove the WebQual was
a highly validated instrument that provided wide and fine grained measurements of
organizational websites. By review of the earlier studies, Cristobal et al. (2007)
proposed another set of dimensions called PeSQ that composed four dimensions such
as web design, customer service, assurance and order management. Based on the
findings of this study, Cristobal et al. (2007) proved that dimensions of PeSQ had a
direct effect on the consumer website satisfaction and observed there were no
differences of the results although the sample divided into buyers and information
searchers.
More recently, Francis (2009) was using RECIPE model to measure the quality
across to different types of internet retailing and divided into categories of offline
goods (eg. books), offline services (eg. accommodation), electronic goods (eg.
software) and electronic service (eg. brokerage). The RECIPE model had covered the
dimensions of website, transaction, delivery, customer service and security to
measure category specific of internet retailing. Francis (2009) found that only security

__________________________________________________________________________________
__________________________________________________________________________________
page 19 of 106
and customer service dimensions are significant to all types of internet retailing.
Below is the comparison of different models developed from previous studies to
measure dimensions of e-shopping quality:
Table 2.1: Summary of Dimensions of E-Shopping Quality
Authors Model Dimensions
Yoo and Donthu (2001) SITEQUAL Ease of use; aesthetic design, processing
speed; security
Janda, Trocchia and
Gwinner (2002)
IRSQ Performance; access; security; sensation;
information
Wolfinbarger and Gilly
(2003)
eTailQ Website design; customer service;
fulfillment/ reliability; security/ privacy
Lee and Lin (2005) Revised
SERQUAL
Website design; reliability; responsiveness;
trust; personalization
Parasuraman, Zeithaml
and Malhorta (2005)
E-S-QUAL Efficiency; fulfillment; system availability;
privacy
E-Recs-QUAL Responsiveness; compensation; contact
Fassnacht and Koese
(2006)
QES Environment quality; delivery quality;
outcome quality
Loiacono, Watson and
Goodhue (2007)
WebQual Informational fit-to-task; tailored
information; trust; response time; ease of
understanding; intuitive operations; visual
appeal; innovativeness; emotional appeal;
consistent image; online completeness;
relative advantage
Cristobal, Flavian and
Guinaliu (2007)
PeSQ Web design; customer service; assurance;
order management
Francis (2009) RECIPE Website; transaction; delivery; customer
service; security
Source: Developed for research

__________________________________________________________________________________
__________________________________________________________________________________
page 20 of 106
However, Ha and Stoel (2012) found that a lot of previous studies tend to be biased
capturing well-rounded service quality dimensions that fit all types of online retailing.
Thus, Ha and Stoel (2012) developed and examined e-shopping quality dimensions
such as privacy/ security, website content/ functionality, customer service and
atmospheric/ experiential that focused specifically on online apparel retailing and
belong to the offline goods shopping category. Through the results of analysis, Ha
and Stoel (2012) indicated that website content/ functionality and atmospheric
affected e-shopping intention through e-shopping satisfaction. However, results also
indicated that privacy/ security and customer service has a direct impact on e-
shopping intention but not on e-shopping satisfaction.
As per this study, model of e-shopping quality dimensions developed by Ha and Stoel
(2012) was adopted and modified to examine the relationship between e-shopping
quality dimensions and e-shopping outcome (e-shopping satisfaction and e-shopping
intention) on online apparel retailing in Malaysia. Those adopted dimensions are: (1)
privacy/security; (2) website design; (3) customer service; and (4) atmospheric/
experiential.
2.1.1 Privacy/ Security
Privacy or security considers one of the unquestionably important issues when
consumers to shop online. Privacy or security refers to the degree of the protection of
customer information and technical safety of the network against fraud or hackers
(Santouridis, Trivellas & Tsimonis, 2012; Cox & Dale, 2001; Wolfinbarger & Gilly,
2003). According to Trocchia and Janda (2003), security and privacy can be divided
into categories of financial and non-financial. In the category of financial, consumers
are concern about safety of transaction and their credit card information when
purchase via internet while online scam and falsifying and misusing personal
information categorize into non-financial online risk (Madu & Madu, 2002).

__________________________________________________________________________________
__________________________________________________________________________________
page 21 of 106
In India, Sahadev and Purani (2008) pointed out issue of privacy and security is
important not merely for purchase via internet also for job seeker expect absolute
confidentiality of their own personal information and safety of any transaction from
the web site (job portals). Besides that, Loonam and Loughlin (2008) indicated
security and privacy played an essential role especially in online banking industry
because users or consumers assuming all web providers have secure web site as a
standard criterion for e-service quality delivery. In addition, Francis (2009) also
indicated safety of credit card and personal details become major concern of
customers for all types of internet retailing. Therefore, consumers always expect their
personal information and records to be kept accurately and securely (Miyazaki &
Fernandez, 2001).
Previous researcher also found that a lot of people were afraid to purchase via internet
due to the risk of safety of personal information (Santouridis et al., 2012). Meanwhile
consumers are sensitive to privacy and security issues due to the fears such as identity
theft and spam (Wolfinbarger & Gilly, 2003). Consequently, lack of confidence by
the absence of security and privacy of the site will become obstacles that prevent e-
commerce development (Cristobal et al., 2007). Therefore, e-retailers should aware
and strengthen security of online transactions meanwhile providing consumer privacy
policies thus improving consumers confidential, satisfaction and purchase intention
(Ranganathan & Ganapathy, 2002; Lee & Lin, 2005). However, the study from
Wolfinbarger and Gilly (2003) argued that privacy and security were not significant
to measure the online service quality except for those frequent online buyers at online
store.
Overall, previous researchers had defined security/ privacy played a significant role in
consumers’ assessment of a web site, influences perceptions of overall quality,
satisfaction and purchase intention regardless of cultural value and types of internet
retailing (Parasuraman et al., 2005; Yoo & Donthu, 2001; Branscum & Tanaka, 2000;
Francis, 2009; Kim & Kim, 2010).

__________________________________________________________________________________
__________________________________________________________________________________
page 22 of 106
2.1.2 Website Design
Website design is an infrastructure of diverse applications that combining layout,
graphics image, information, interactive or communication features, e-commerce and
energy management (Kapsalis, Charatsis, Georgoudakis, Nikoloutsos, &
Papadopoulos, 2004). Based on the previous studies, website design should include
all elements of consumer experience at the website such as information search, order
processing, personalization and product selection (Wolfinbarger & Gilly, 2003; Ha &
Stoel, 2009).
According to Kim and Lee (2002), website design refers to the appeal of user
interface design and user friendliness of website that is presented to customers.
Website design should also emphasize on how well a website can guide its user and
how easy it is to use (Kim & Stoel, 2004). Therefore, website design should be
readable, tidy and user interface should be visually attractive (Lee & Lin, 2005).
Besides that, Kim and Lennon (2008) indicated that graphic style is an important
element of website design especially for the apparel retail website because apparel is
a product that requires sensory evaluation and various visual presentation techniques
to attract online consumers.
Kim, Kim and Lennon (2011) stated that an ineffective website design and lack of
relevant information in the website may lead to the risk those consumers exiting the
website without any purchase. So the concept of web site design should consider on
the ease of understanding the structure of a system, functions, interface and relevant
content (Cristobal et al., 2007). Similarly, website design should be simple, ease of
site navigation and ability of user to easy control. Francis (2009) also indicated that
website design should be easy to locate information, fast speed of download, visually
attractive and clear product information together with products refund/ return policies
explanation.

__________________________________________________________________________________
__________________________________________________________________________________
page 23 of 106
According to Wolfinbarger and Gilly (2001), consumers always prefer to purchase on
a website with the easily accessed and well-organized of large freely available
information. Consumers can easily to compare products and make a good choice with
the well design of an online shop and offering enough information (Cristobal et al.,
2007). However, Madu and Madu (2002) identified potential problems that may lead
to poor website design quality such as basic navigation (important to know location
of website that you were going), offering too many choice, delays of network
connection, lack of contexts and organization information.
Overall, a number of previous empirical studies indicated that website design
considers one of the strong predictors that influence customer perception of e-
shopping quality to achieve the global satisfaction of the user (Wolfinbarger & Gilly,
2003; Kim & Eom, 2002; Lee & Lin, 2005).
2.1.3 Customer Service
In online store, it is important to provide immediate customer service through
multiple channels to customers due to no sales people are present and direct human
interaction are limited (Kim et al., 2011). According to Wolfinbarger and Gilly
(2003), customer service is combining of interest in problems solving, willingness of
personnel to help and promptly to answer inquires. Meanwhile customer service
should be always ready as supportive service, helpful and willing to respond
customers’ inquiries quickly.
Cristobal et al. (2007) pointed out website management should ensure always meet
the customers’ expectation by providing service such as helping customers to
complete transaction correctly, pay attention on customers need, product delivered on
time, answer customers email quickly and to have access to information. A study by
Francis (2009), stated that customer service consider strong predictor to all types of
internet retailing such as offline goods, offline services, electronic goods and
electronic services.

__________________________________________________________________________________
__________________________________________________________________________________
page 24 of 106
Customer service provided by online store should be easy to contact service personnel,
reply to customer emails quickly, helpful answers to customer questions, happy to fix
customer problems, well interactive with customers and information of company easy
to obtain (Francis, 2009). In United States, a study by Jun, Yang and Kim (2004)
noticed that enough staff supports for customer service access is very important in
order to improve their customer service to satisfy their customers. In addition, Jedd
(2000) noticed that lack of internal and external collaboration such as tight integration
of website with customer service operations and effective communication among
different departments is one of the major obstacles to improve its shopping quality.
The similar study by Jedd (2000) also indicated that customer service play an
important role and advised online retailers to improve their customer service. Besides
that, Zeithaml et al. (2002) noticed that that customer service mostly useful when a
customer problem occurs and only after the online transaction is made. However, the
findings of previous study from Ha and Stoel (2012) argued that customer service
was not significant to influence consumer response (satisfaction) but direct impact to
consumers’ e-shopping intention. Overall, customer service has proved itself as
important factor for online business success (Zeithaml et al., 2002; Kim et al., 2011;
Ha & Stoel, 2012; Francis, 2009).
2.1.4 Atmospheric/ Experiential
Atmospheric/ experiential can be defined as the aspects of the environment that evoke
emotional that positively affects behavioral consumer responses (Ha & Stoel, 2012).
In addition, atmospheric quality dimension able to support greater enjoyment and fun
to consumer especially for hedonic aspect of website such as apparel website
(Childers, Carr, Peck & Carson, 2001). Moreover, other earlier research revealed that
customers seek and value atmospheric features as generating feeling of fun,
excitement or pleasure (Ha & Stoel, 2012).

__________________________________________________________________________________
__________________________________________________________________________________
page 25 of 106
Wu et al. (2014) stated that the online shopping environment or atmosphere created
by websites will affect the willingness of consumers to make purchase and elicit
positive or negative emotions that will influence consumers’ attitudes, behaviors and
purchase intention. Based on earlier study of Lorenzo-Romero, Gomez-Borja and
Molla-Descals (2011) suggested that atmospheric can be more significant element at
the point of consumers online purchase. Previous study by Wu et al. (2014) also
proved that atmospheric had higher level of influence on consumers’ emotion such as
pleasure therefore consumers are more likely to shop in an environment with full of
fun and greater enjoyment.
Besides that, Ha and Stoel (2012) noticed that atmospheric dimension consider as
unique element and play an important role in e-shopping quality on developing
customers’ evaluations of online stores especially for apparel industry. Although
there is limited previous studies on atmospheric quality, but overall previous studies
indicated emotional states evoked by website atmospheric/ experiential were
positively associated with satisfaction and purchase intent as well as online shopping
behavior (Kim, Kim & Lennon, 2009; Park, Lennon & Stoel, 2005; Ha & Stoel, 2012;
Bauer, Falk & Hammerschmidt, 2006).
2.1.5 E-Shopping Satisfaction
E-shopping satisfaction is the online consumer response of the judgment that an
online product or service feature provided a pleasurable level of consumption related
fulfillment (Oliver, 1997 as cited in Ha & Stoel, 2012; Cronin, Brady & Hult, 2000).
Anderson and Srinivasan (2003) also defined online satisfaction as the contentment of
customer base on prior purchasing experience from e-commerce firm. Customer
satisfaction is fundamental aspect of marketing which suggest that satisfying
customer needs can generate customer purchase intention (Chang & Wang, 2011).

__________________________________________________________________________________
__________________________________________________________________________________
page 26 of 106
Based on earlier study of Oliver (1997) and Woodruff (1997) (as cited in Chang &
Wang, 2011), customer satisfaction referred to consumer reaction and elicit positive
or negative feeling about the value of service or product from a retailer. Another
study from Kotler in the year 2000 (as cited in Chang & Wang, 2011) described
consumer satisfaction as a person feeling of either pleasure or disappointment
resulting from judgment of the product or service performance in relation to
consumer expectations. Another earlier study of Schaupp and Belanger (2005) found
that satisfaction is the consequences of consumer experiences during different
purchasing stages such need something, information gathering, evaluation of
purchase alternatives, purchase intention and post purchase behavior.
Moreover, measuring degree of customer satisfaction is important for online retailer
due to customer satisfaction able to influence consumer purchase decision (Lin & Sun,
2009). Research by Schaupp and Belanger (2005) also indicated that consumer
satisfaction is important and critical to establish long term client relationship which
significantly sustaining profitability of business. Therefore, retailers have to ensure
products or services meet the expectation of the consumers as satisfied customers are
likely make repetitive purchase which increase profitability of e-commerce firm
(Jiradilok, Malisuwan, Madan & Sivaraks, 2014).
However, there are a lot of factors that influence customers’ e-shopping satisfaction.
As in this study, e-shopping quality dimensions such as privacy/ security, website
design, customer service and atmospheric/ experiential affect are provided as
potential determinants on consumers’ e-shopping satisfaction.
2.1.6 E-Shopping Intention
According to Thamizhvanan and Xavier (2013), e-shopping intention can be defined
as the construct that gives the force and stimulate consumer intent to shop online.
Purchase intention also referred to the outcome of attitude or behavior of consumers’
willingness to buy from particular online retailer (Jiradilok et al., 2014). A study by
__________________________________________________________________________________
__________________________________________________________________________________
page 27 of 106
Irshad (2012) also described purchase intention indicated person’s motivation in
sense of conscious plan for further effort to carry out the behavior which customer
consideration in buying after perceived performance (outcome) of online products or
services. Here with the terms of shopping intention and purchase intention will be
used interchangeably.
Earlier study of Schlosser in the year 2003 (as cited in Im & Ha, 2011) stated that
measurement of purchase intention able to predict actual purchase behavior of
consumers. Pavlou (2003) observed appropriate measurement of online purchase
intention on a website able to assess online consumer behavior. Previous study
(Jiradilok et al., 2014) also found that not practical to examine and study on actual
purchase behavior therefore suggested that purchase intention as the representative in
order to predict actual purchase behavior.
Moreover, Im and Ha (2011) emphasized that purchase intention plays as critical role
to predict future behavior of consumers. In addition, Thamizhvanan and Xavier (2013)
stated that online retailers have to pay attention on the factors that influence purchase
intention among consumers in order to enhance the chance of actual purchase from
consumers. Therefore, in this study e-shopping intention is tested as the dependent
variable to find out possible e-shopping quality dimensions that influence consumers’
online shopping intention which can represent the actual purchase behavior of
consumers.
2.2 E-Shopping Quality-Satisfaction-Behavioral Intention Link
Numerous studies adopt Oliver’s (1997) (as cited in Ha & Stoel, 2012) quality-
satisfaction-behavioral intention link framework and indicated strong relationship
between quality, satisfaction and behavioral intention (Choi, Cho, Lee, Lee & Kim,
2004; White & Yu, 2005; Cronin et al., 2000). Oliver’s (1997) (as cited in Ha &
Stoel, 2012) quality-satisfaction-behavioral intention link framework proposed that
__________________________________________________________________________________
__________________________________________________________________________________
page 28 of 106
cognitive e-shopping quality dimensions (evaluation) drive the level of customer e-
shopping satisfaction (affective response) thus contribute the development of
reactions that emphasize on future behavioral intention such as customer e-shopping
intention.
Ha and Stoel (2012) stated that evaluation of e-shopping quality dimensions process
concern on shopping experience and results in two consequences such as outcome-
desired conflict and outcome-desired fulfillment. Outcome-desired conflict occurs
when a person experience an unpleasant event thus develop negative emotional
reactions such as dissatisfaction that lead to unpleasant outcome; outcome-desired
fulfillment occurs when a person experience a pleasant event thus develop positive
emotional response such as satisfaction that lead to maintain the pleasant outcome
(Bagozzi,1992 as cited in Ha & Stoel, 2012).
The study of Ha and Stoel (2012) proved that customer satisfaction derived from the
e-shopping quality dimensions able to predict customer behavioral intention (e-
shopping intention). Rust and Zahorik (1993) (as cited in Lee & Lin, 2005) noted that
overall service quality and customer satisfaction significantly influence customer
retention, profitability and market share. Moreover, Llusar et al. (2001) also indicated
that customer satisfaction plays as a mediator with the relationship between perceived
service quality and purchase intention.
Therefore in this study, quality-satisfaction-behavioral intention link framework
(Oliver, 1997) (as cited in Ha & Stoel, 2012) is adopted and modified to e-shopping
quality – e-shopping satisfaction – e-shopping intention in order to check the
relationship in the context of online apparel retailing.

__________________________________________________________________________________
__________________________________________________________________________________
page 29 of 106
2.3 Theoretical Framework
Figure 2.1: Online Apparel Retailing: Roles of E-Shopping Quality and Experiential
E-Shopping Motives
Note. From Ha, S., and Stoel, L. (2012). Online apparel retailing: roles of e-shopping quality and
experiential e-shopping motives. Journal of Service Management, 23(2), 197-215.
Theoretical framework of Figure 2.1 was regarding of the study of Ha and Stoel
(2012) that examine and explore how the e-shopping quality dimensions influence
consumer shopping outcomes (e-shopping satisfaction and e-shopping intention) and
test the moderating effects of consumer experiential e-shopping motives within the
context of online apparel retailing in United States.
The finding indicated that website content/ functionality and atmospheric/
experiential significantly influence e-shopping satisfaction that contribute to e-
shopping intention. However, the finding indicated that privacy/ security and
customer service only significantly contributed to e-shopping intention but not e-
shopping satisfaction. In addition, the finding supported the moderating roles of
Privacy/Security
Website Content/
Functionality
Customer Service
Atmospheric/ Experiential
E-Shopping
Satisfaction
E-Shopping
Intention

__________________________________________________________________________________
__________________________________________________________________________________
page 30 of 106
experiential e-shopping motives. The model was able to provide better understanding
and useful implication to online retailers on factors that influence consumers’
response (satisfaction) and purchase intention.
2.4 Conceptual Framework
Figure 2.2: Factors Affecting E-Shopping Quality Dimensions on Apparel
E-Shopping Intention
E-Shopping Quality Dimensions
Source: Developed for research
Relevant independent variables (privacy/ security, website design, customer service
and atmospheric/ experiential), mediator (e-shopping satisfaction) and dependent
variable (e-shopping intention) are identified and proposed by researcher based on the
reference of previous study (Ha & Stoel, 2012). The conceptual framework is
developed based on theoretical framework proposed by Ha and Stoel (2012).
H6
H4
H1
H2
H3
E-Shopping
Satisfaction
Privacy/Security
Website Design
Customer Service
Atmospheric/
Experiential
E-Shopping
Intention
H5

__________________________________________________________________________________
__________________________________________________________________________________
page 31 of 106
2.5 Hypotheses Development
Hypotheses act as a guidance to structure theoretical framework and predicts the
relationship between independent variables and dependent variable. Thus, the
independent variables included privacy/ security, website design, customer service
and atmospheric/ experiential while dependent variable will be e-shopping intention
and e-shopping satisfaction as mediator.
2.5.1 Privacy/ Security and E-Shopping Satisfaction
Through the literature studies, privacy or security describes as the degree of
protection on customer information and technical safety of the network against fraud
or hackers (Santouridis, Trivellas & Tsimonis, 2012; Cox & Dale, 2001;
Wolfinbarger & Gilly, 2003). According to Hung (2004) and Santouridis et al. (2012),
consumers are always concerned and sensitive with payment or personal risk, privacy
and security when considering online shopping.
Cristobal et al. (2007) stated that lack of confidence by the absence of security/
privacy of the website will lead to the obstacles of development of e-commerce.
Therefore, privacy/ security unquestionably play as a significant role in overall e-
shopping quality that influence of customer satisfaction (Parasuraman et al., 2005;
Yoo & Donthu, 2001; Branscum & Tanaka, 2000; Francis, 2009; Kim & Kim, 2010).
So, the hypotheses will be postulated as:
H1: There is a significant relationship between privacy/ security and e-shopping
satisfaction on online apparel retailing.

__________________________________________________________________________________
__________________________________________________________________________________
page 32 of 106
2.5.2 Website Design and E-Shopping Satisfaction
Website design describes as the appeal of user interface design and user friendliness
of website that presented to customers (Kim & Lee, 2002). Kim and Stoel (2004)
noted that website design also should emphasize on how well a website guided its
user and how easy it was to use. According to Kala et al. (2013), the ability to build
an effective marketing web site has become crucial requirement to survival in internet
marketing.
Kim, Kim and Lennon (2011) stated that an ineffective website and lack of relevant
information in the website may lead to the risk of consumer negative reactions thus
exiting the website without any purchase. Therefore, Ha and Stoel (2012) suggested
that website design should be visually appealing and tidy, readable and user friendly.
Overall, previous studies found that website design considers one of the strong
predictors that influence customer perception of e-shopping quality to achieve the
global satisfaction of the user (Wolfinbarger & Gilly, 2003; Kim & Eom, 2002; Lee
& Lin, 2005). Therefore, the hypotheses will be postulated as:
H2: There is a significant relationship between website design and e-shopping
satisfaction on online apparel retailing.
2.5.3 Customer Service and E-Shopping Satisfaction
Customer service represents the service combining of interest in problems solving,
willingness of personnel to help and promptly to answer inquires (Wolfinbarger &
Gilly, 2003). It is important to provide immediate customer service due to no sales
people is present in virtual store (Kim et al., 2011).
Liao and Cheung (2002) stated that online retailer to respond their inquiries and needs
promptly are important to its customers because customers always expect to be able
complete transaction correctly, receive personalized attention, product deliver on time,

__________________________________________________________________________________
__________________________________________________________________________________
page 33 of 106
inquiry email answer quickly and access to information. Previous studies have
examined customer service has proved itself as important factor for online business
success (Yang & Jun, 2002; Zeithaml et al., 2002; Kim et al., 2011; Ha & Stoel, 2012;
Francis, 2009). So the hypotheses will be postulated as:
H3: There is a significant relationship between customer service and e-shopping
satisfaction on online apparel retailing.
2.5.4 Atmospheric/ Experiential and E-Shopping Satisfaction
Atmospheric/ experiential is referring to the aspects of the environment that evoke
emotional positively affect behavioral consumer responses (Ha & Stoel, 2012).
Consumers are likely to experience greater enjoyment and have more fun in those
hedonic websites (Ha & Stoel, 2009). The further study by Ha and Stoel (2012) stated
that, consumers seek and value atmospheric features as feeling of fun, excitement or
pleasure and consider distinct features that influence overall e-store assessment.
Therefore, atmospheric/ experiential is one of the critical factors positively associated
with purchase intent as well as online shopping behavior (Kim, Kim & Lennon, 2009;
Park, Lennon & Stoel, 2005; Ha & Stoel, 2012; Bauer, Falk & Hammerschmidt,
2006). So the hypotheses will be postulated as:
H4: There is a significant relationship between atmospheric/ experiential and e-
shopping satisfaction on online apparel retailing.
2.5.5 E-Shopping Satisfaction and E-Shopping Intention
A number of previous studies are examined on the Oliver’s (1997) (as cited in Ha &
Stoel, 2012) quality-satisfaction-behavioral intention link framework and indicated
that strong relationship between quality, satisfaction and behavioral intention (Choi,
Cho, Lee, Lee & Kim, 2004; White & Yu, 2005; Cronin et al., 2000). Furthermore,

__________________________________________________________________________________
__________________________________________________________________________________
page 34 of 106
the study by Ha and Stoel (2012) added that quality-satisfaction-behavioral intention
link framework proposed that assessment of e-shopping quality drive the level of
customer e-shopping satisfaction that contribute the development of reactions that
emphasize on customer e-shopping intention. E-shopping satisfaction is the online
consumer response of the judgment that an online product or service feature provided
a pleasurable level of consumption related fulfillment (Oliver, 1997 as cited in Ha &
Stoel, 2012; Cronin et al., 2000).
Llusar et al. (2001) indicated that customer satisfaction plays as a mediator with the
relationship between perceived service quality and purchase intention. According to
Lee and Lin (2005), customer perceptions of service quality and satisfaction
positively influence on purchase. So the hypotheses will be postulated as:
H5: There is a significant relationship between e-shopping satisfaction and e-shopping
intention on online apparel retailing.
2.5.6 E-Shopping Quality Dimensions and E-Shopping Intention
According to the studies from McDougall and Levesque (2000) and Ha and Stoel
(2012) found that privacy/ security and customer service dimension has direct impact
on consumer e-shopping intention. Lee and Lin (2005) also found that overall service
quality significantly direct have effect on customer purchase intention. Moreover,
earlier study of Sam and Tahir (2009) and Wu et al. (2014) also found that website
design and atmospheric/ experiential had positively influence on consumers’ online
purchase intention. Therefore, the hypotheses will be postulated as:
H6: There is a significant relationship between e-shopping quality dimensions and e-
shopping intention on online apparel retailing.

__________________________________________________________________________________
__________________________________________________________________________________
page 35 of 106
2.6 Conclusion
The literature regarding e-shopping quality (privacy/ security, website design,
customer service and atmospheric/ experiential) and e-shopping outcome (e-shopping
satisfaction and e-shopping intention) were being reviewed in this chapter. Moreover,
the findings and relevant theoretical models of previous researchers are used to
support the hypotheses and relationship between those variables and mediator. In next
chapter, the explanation of research methodology will be presented in next chapter.
__________________________________________________________________________________
__________________________________________________________________________________
page 36 of 106
CHAPTER 3
RESEARCH METHODOLOGY
3.0 Introduction
This chapter is mainly describing research methodology of the study that includes
research design, data collection, sampling design, research instrument, questionnaire
design, pilot test, data processing as well as methods of analysis.
3.1 Research Design
According to Saunders, Lewis and Thornhill (2009), research design will be the
general plan of how to answer research question. Moreover, research design contain
objectives derived from research question, specify the sources from which intend to
collect data, ethical issues and consideration of the constraints such as access to data,
time, location and money.
This research study is design based on quantitative approach which is developed
through the conceptual framework from previous literature and tested data analysis
(Zikmund, 2003). Descriptive and explanatory analysis will be used in this research
study. According to Saunders et al. (2009), descriptive analysis is describing the
characteristics of the population or phenomenon. Meanwhile, explanatory analysis is
used to establish relationships between variables and studying a situation in order to

__________________________________________________________________________________
__________________________________________________________________________________
page 37 of 106
explain the relationship between variables (Saunders et al., 2009). Overall, descriptive
study is used to describe characteristics of the population; explanatory study is used
to study and explain the e-shopping quality dimensions on online apparel retailing
and it relationship with e-shopping satisfaction and e-shopping intention.
3.2 Data Collection
Primary data and secondary data collecting method will be used in this research study.
Primary data and secondary data are collected for the purpose of doing statistical
analysis. In this research study, primary data and secondary data collecting method is
used to examine the relationship of e-shopping quality dimensions with e-shopping
outcome (e-shopping satisfaction and e-shopping intention) on online apparel
retailing.
3.2.1 Primary Data
Primary data can be described as the data collected specifically for the research being
undertaken (Saunders et al., 2009). In this research study, primary data is collected
through the self-administered types of questionnaire. According to Saunders et al.
(2009), self-administered types of questionnaire can be administered electronically
using internet, delivered by hand to each respondent and collected later or posted to
respondents who return them by post after completion.
The method of questionnaire administered electronically using internet (Facebook
and email) has been selected to obtain the primary data in this research study in order
to support the research objectives. The main reason of using electronic survey due to
the sample size of this research study is related to online shoppers who had
experienced shopping and had purchased apparel from online store. The research
duration took about 3 weeks to distribute and collect the entire questionnaires from
targeted respondents, which are from 25 May 2014 to 15 June 2014.

__________________________________________________________________________________
__________________________________________________________________________________
page 38 of 106
Besides, electronic survey is convenient to researcher because the respondents are
requested to answer the survey by their own time meanwhile electronic survey can be
distributed in bulk to respondents and collected back at the same time. Therefore,
researcher can collect accurate data with a huge population with more efficiency in a
shorter time.
3.3 Sampling Design
Sampling is the data collection process from an entire population of a manageable
size and entire population is referred as the groups that share some common set of
characteristics (Saunders et al., 2009). The sampling is needed when there is
impossible to collect all the data from the entire population due to restriction of time,
money and open access meanwhile Saunders et al. (2009) also stated that sampling
able to provide a range of methods that enable to reduce the amount of data that need
to collect and sample obtained is considered as sub-group from large population.
3.3.1 Target Population
According to Zikmund (2003), population is indicated to the specific and complete
group that related to the research study. The research objective is to examine the
relationship between e-shopping quality dimensions and e-shopping outcome (e-
shopping satisfaction and e-shopping intention) on online apparel retailing in
Malaysia. Therefore, respondents of this study are targeted on consumers who
experienced shopping and had purchased apparel through online store.
3.3.2 Sampling Frame and Location
Sampling frame is referred to the complete list of all the cases in the population from
which the sample will be drawn (Saunders et al., 2009). The target population
consists of 384 online consumers. The questionnaires are randomly distributed

__________________________________________________________________________________
__________________________________________________________________________________
page 39 of 106
throughout Malaysia states such as Selangor, Pulau Penang, Johor, Melaka, Negeri
Sembilan, Perak and Pahang.
3.3.3 Sampling Elements
The respondents of this study were the online apparel shoppers who had purchase and
shop apparel through online store and can provide evaluation of e-shopping quality
dimensions on online apparel stores.
3.3.4 Sample Size
Sample size is indicated to the number of respondents in this research study. Cost
and time constraint need to take into considerations when determine the sample size.
Lee (2014) stated that total number of internet users of Malaysia on the year 2012 is
19,240,000 and there are 91% of internet users who always shop online. Therefore,
the sample sizes for population more than 10,000,000 at the 95% confidence level
(Table 3.1) are 384 respondents (Saunders et al., 2009).

__________________________________________________________________________________
__________________________________________________________________________________
page 40 of 106
Table 3.1: Sample Sizes for Different Sizes of Population at a 95 Confidence level
Population
Margin of Error
5% 3% 2% 1%
50 44 48 49 50
100 79 91 96 99
150 108 132 141 148
200 132 168 185 196
250 151 203 226 244
300 168 234 267 291
400 196 291 343 384
500 217 340 414 475
750 254 440 571 696
1000 278 516 706 906
2000 322 696 1091 1655
5000 357 879 1622 3288
10 000 370 964 1936 4899
100 000 383 1056 2345 8762
1 000 000 384 1066 2395 9513
10 000 000 384 1067 2400 9595
Note. Adapted from Saunders, M., Lewis, P., & Thornhill, A. (2009). Research methods for business
students (5th
ed.). Prentice Hall: Financial Times.
3.3.5 Sampling Technique
Convenience sampling is selected for this study which is under the category of non-
probability sampling technique. Based on Saunders et al. (2009), non-probability
sampling technique is defined as sampling technique that provide a range of
techniques to select samples according to personal own subjective judgments.
Meanwhile, convenience sampling technique is involved selecting haphazardly those
cases that are easiest to obtain for the sample and sample selection process is
continued until required sample has been reached (Saunders et al., 2009). By using

__________________________________________________________________________________
__________________________________________________________________________________
page 41 of 106
the convenience sampling technique, researcher able to obtain the sample sizes
quickly with the easiest way.
3.4 Research Instrument
3.4.1 Questionnaire Design
Self-administered questionnaire is the most common method and been selected in this
research study. Questionnaire is a set of questions developed to obtain primary
sources to be used in the descriptive and explanatory research (Zikmund, 2003;
Saunders et al., 2009). Questionnaires design is a key important process and need to
ensure precise data from respondents to be collected in order to answer research
questions and achieve research objectives. It is because the design of questionnaire
will affect the response rate, reliability and validity of the data (Zikmund, 2003;
Saunders et al., 2009). Table 3.2 shows the questionnaire adopted from past
researchers’ article and journal (Ha & Stoel, 2012). The questionnaire in this study is
designed in closed-ended form because closed-ended form questionnaire is easier to
transform into statistical form for future analysis through Statistical Package of Social
Science (SPSS) Version 20.0.
The questionnaire consists of 3 parts: (A) demographic information, (B) factors
affecting e-shopping satisfaction on online apparel retailing, (C) e-shopping
satisfaction and e-shopping intention. The variables except part of demographic
information is assessed using 5 point Likert-type scale (1=strongly disagree,
5=strongly agree). Questionnaire is distributed using non-probability sampling
technique by convenience sampling through internet.

__________________________________________________________________________________
__________________________________________________________________________________
page 42 of 106
Table 3.2: Source of Questionnaire
Variables Sample of items Adopted from
Privacy/
Security
1. I feel like my privacy is protected at this site.
2. I feel safe in my transactions with this website.
3. I feel I can trust this website.
4. The website has adequate security features.
5. The company behind the site is reputable.
Ha and Stoel
(2012)
Website
Design
1. The site does not waste my time.
2. I can go to exactly what I want quickly.
3. The organization and layout of the website
facilities searching for products.
Ha and Stoel
(2012)
Customer
Service
1. The company is ready and willing to respond to
customer needs.
2. The website has reasonable shipping and handling
costs.
3. Customer service personnel are always willing to
help you.
4. Inquiries are answered promptly.
Ha and Stoel
(2012)
Atmospheric/
Experiential
1. It is really fun to shop at this website.
2. The site almost says, “come in and shop”.
Ha and Stoel
(2012)
E-Shopping
Satisfaction
1. My choice to shop using the website is a wise idea.
2. I am satisfied with my decision to shop this
website.
3. I have really enjoyed shopping from this website.
Ha and Stoel
(2012)
E-Shopping
Intention
1. I intend to use the internet frequently to shop for
apparel.
2. I intend to use the internet whenever appropriate to
do apparel shopping.
Ha and Stoel
(2012)
Source: Developed for research
Note. Adopted from Ha, S., and Stoel, L. (2012). Online apparel retailing: roles of e-shopping quality
and experiential e-shopping motives. Journal of Service Management, 23(2), 197-215.

__________________________________________________________________________________
__________________________________________________________________________________
page 43 of 106
3.4.2 Measurement Scales
The most common of the measurement scales will be nominal scale, ordinal scale,
interval scale and ratio scale. In this study, nominal scale, interval scale and Likert-
style rating scale is used to measure the research questionnaire.
3.4.2.1 Nominal Scale
Nominal scale is merely to distinguish the categories that comprise a given variable
such as male or female, marital status, religion, races and education (Saunders et al.,
2009). In this research study, nominal scale is used to distinguish the categories of
gender, races, religion and education background.
3.4.2.2 Interval Scale
Interval scale is used to measure age and income group. According to Saunders et al.
(2009) stated that interval scale is incorporate the concept of equality of interval and
interval data has the power of nominal and ordinal data strength. Therefore, zero
point in interval scale does not mean the absence of the attribute or characteristic.
3.4.2.3 Likert-Style Rating Scale
Likert-style rating scale is refer to the respondent is asked on how strongly she or he
agrees or disagrees with a question or statement and usually on a four, five, six or
seven point rating scale (Saunders et al., 2009). Likert-style rating scale will apply on
the independent variables, mediator and dependent variables in the questionnaire. In
this study, five Likert-style rating scale is selected with the five alternative options:
strongly disagree, disagree, neutral, agree and strongly agree for independent and
dependent variables question’s statement.

__________________________________________________________________________________
__________________________________________________________________________________
page 44 of 106
3.5 Data Processing
After collecting the 384 set of data, researcher will convert the quantitative data into
an interpretive form by using several types of data analysis technique. Researcher was
able to justify the hypothesis and further understand about the data through the result
of data analysis. Researcher was doing data analysis using SPSS Version 20.0
computer software because SPSS Version 20.0 computer software enables researcher
to analyze the quantitative data more effectively and efficiently. The types of analysis
methods will be used in conducting this research include descriptive analysis, pilot
test and reliability analysis, correlation analysis and multiple linear regression.
3.5.1 Descriptive Analysis
In this study, descriptive analysis is used to analysis the demographic data. Saunders
et al. (2009) indicated the results of individual variable can be present through
frequency distribution. Meanwhile, frequency distribution can be presented into the
form of table, bar chart, histogram, pictogram, pie chart and others for the purpose of
easier to interpret. By doing descriptive analysis, researcher was able to identify the
information of demographic respondents in the research study.
3.5.2 Pilot Test and Reliability Analysis
The main reason of pilot test is to refine questionnaire that enable respondents do not
have any problems when respond to questionnaire meanwhile to obtain some
assessment of the questions’ validity and reliability of the data (Saunders et al., 2009).
Pilot test will be conducted before the actual distribution of questionnaire to the
respondents. Saunders et al. (2009) indicated that number of people in the pilot test
are depend on research questions, objectives, sample size and other resources such as
time and money. Meanwhile, researcher was able to gather some useful opinion
regarding the design of questionnaire from target respondent. Moreover, the problem
or error at the early stage able to minimize through the pilot test.
__________________________________________________________________________________
__________________________________________________________________________________
page 45 of 106
According to Saunders et al. (2009), reliability analysis is referred to the extent of
which data collection technique or technique will yield consistent findings, similar
observations would be made or conclusions reached by other researchers or there is
transparency in how sense was made from the raw data. Reliability is an indicator of
measuring internal consistency and reliability analysis using Cronbach’s Alpha to
determine the correlation among the items (Saunders et al., 2009). Sekaran and
Bougie (2010) indicated that Cronbach’s Alpha range less than 0.60 consider poor;
the range above 0.60 and of 0.70 indicate the range at the level of acceptable. Besides
that, the range of reliabilities over 0.8 means there is 80% consistencies in the score
and considers good correlation.
Pilot test was conducted using 30 sets of questionnaire and were distributed for the
reliability analysis purpose and reliability test were conducted by SPSS Version 20.0
software. Table 3.3 indicate the results of reliability analysis and all the variables are
significant with the Cronbach’s Alpha value more than 0.60.

__________________________________________________________________________________
__________________________________________________________________________________
page 46 of 106
Table 3.3: Results of Reliability Analysis (n=30)
Variables Cronbach's Alpha Number of Item
Ind
epen
den
t
Va
ria
ble
s
Privacy/ Security 0.860 5
Website Design 0.883 3
Customer Service 0.795 4
Atmospheric/ Experiential 0.706 2
Med
iato
r
E-Shopping Satisfaction
0.825 3
Dep
end
ent
Vari
ab
le
E-Shopping Intention
0.847 2
Source: Developed for research
Note. Adopted from Ha, S., and Stoel, L. (2012). Online apparel retailing: roles of e-shopping quality
and experiential e-shopping motives. Journal of Service Management, 23(2), 197-215.
3.5.3 Pearson Correlation Analysis
Saunders et al. (2009) stated that Pearson Correlation Analysis is enabled to quantify
the strength of the linear relationship between two numerical or ranked variables. In
this study, Pearson Correlation coefficient is used to analyze the relationship between
each variable. The coefficient can take on any value between -1 and +1; the value of
+1 represents a perfect positive correlation by contrast a value of -1 represents a
perfect negative correlation (Saunders et al., 2009). The rules about the Pearson
Correlation Analysis are shown in Figure 3.1:

__________________________________________________________________________________
__________________________________________________________________________________
page 47 of 106
Figure 3.1: Values of the Pearson Correlation Coefficient
-1 -0.7 -0.3 0 0.3 0.7 1
Note. From Saunders, M., Lewis, P., & Thornhill, A. (2009). Research methods for business students
(5th
ed.). Prentice Hall: Financial Times.
3.5.4 Multiple Regression Analysis
Multiple regression is described as the calculating coefficient of multiple
determination and regression equation using two or more independent variables or a
measure of linear association that investigates a straight line relationship (Saunders et
al., 2009; Zikmund, 2003). The relationship between independent variables and
dependent variable can be determined using a linear equation. According to Saunders
et al. (2009) and Zikmund (2003), the multiple regression equation is:
Y = a + bX1 + bX2 + bX3 + …….…+ bnXn
Where: Y= Dependent variable
a= Constant value, the value of Y when the line cuts Y axis all X
value =0
b= The slope, or change in Y for any corresponding change in one
unit of X
X=Independent variables use to predict Y
Moreover, Zikmund (2003) indicated that coefficient of multiple determinations
(adjusted R²) shows the percentage of variation in Y (dependent variable) explained
by variation of independent variables. Therefore, this research study will investigate
Perfect
Negative
Strong
Negative
Weak
Negative
Perfect
Independence
Weak
Positive
Strong
Positive
Perfect
Positive

__________________________________________________________________________________
__________________________________________________________________________________
page 48 of 106
the relationship between independent variables (privacy/ security, website design,
customer service and atmospheric/ experiential) towards mediator (e-shopping
satisfaction) and dependent variable (e-shopping intention). Through the analysis
results, researcher is able to have a better understanding of factors that influence
consumers’ e-shopping satisfaction and e-shopping intention to establish a better
online marketing strategy.
3.5.5 Linear Regression Analysis
Linear regression analysis is used in a situation where one independent variable is
hypothesized to affect one dependent variable (Sekaran & Bougie, 2010). Therefore,
linear regression is used to determine the relationship between mediator (e-shopping
satisfaction) and dependent variable (e-shopping intention) in this study. An equation
is formed as:
Y = a + bX
Where: Y= Dependent variable
a= Constant value
b= Beta Coefficient Value
X= Variable use to predict Y
3.6 Conclusion
In this chapter, researcher has described the detail of the methodologies such as
research design, data collection, sampling design, research instrument and data
processing method which applied in this research. Researcher will investigate the data
obtained through the questionnaire from respondents and perform the results of data
analysis.

__________________________________________________________________________________
__________________________________________________________________________________
page 49 of 106
CHAPTER 4
DATA ANALYSIS
4.0 Introduction
Data analysis results of this study are presented in this chapter. Data collected from
target respondents were analyzed by using Statistical Package for Society Science
(SPSS) Version 20.0. The target respondents are Malaysian who experienced online
apparel shopping. Descriptive analysis, scale measurement, Pearson Correlation,
multiple regressions, and linear regressions will be presented in order to find out the
relationship between the e-shopping quality dimensions, e-shopping satisfaction and
e-shopping intention.
4.1 Descriptive Analysis
There were 474 respondents took part in this questionnaire survey but only 384
respondents have experienced online apparel shopping. Therefore, the total
respondents will be 384 for further analysis. In this section, several profile of target
respondents who experienced online apparel shopping are presented such as
demographic information of target respondents which included gender, age, race,
highest education attained and income status.

__________________________________________________________________________________
__________________________________________________________________________________
page 50 of 106
4.1.1 Frequency of Target Respondents Based on Gender Group
Table 4.1: Gender Group (n=384)
Gender
Frequency Percent Valid Percent Cumulative
Percent
Valid
Female 252 65.6 65.6 65.6
Male 132 34.4 34.4 100.0
Total 384 100.0 100.0
Source: Developed for research
Figure 4.1: Gender Group
Source: Developed for research
According to the Table 4.1 and Figure 4.1, it indicates that 252 (65.6%) female and
132 (34.4%) male consumers were involved in this research study.
65.60%
34.40%
Gender
Female
Male

__________________________________________________________________________________
__________________________________________________________________________________
page 51 of 106
4.1.2 Frequency of Target Respondents Based on Age Group
Table 4.2: Age Group (n=384)
Age
Frequency Percent Valid Percent Cumulative
Percent
Valid
20 - 29 303 78.9 78.9 78.9
30 - 39 69 18.0 18.0 96.9
40 - 49 12 3.1 3.1 100.0
Total 384 100.0 100.0
Source: Developed for research
Figure 4.2: Age Group
Source: Developed for research
Based on Table 4.2 and Figure 4.2, shows that among the target respondents, majority
age falls into the ranges of 20 – 29 years old (78.9%) which is 303 respondents.
0.00%
10.00%
20.00%
30.00%
40.00%
50.00%
60.00%
70.00%
80.00%
20 - 29 years old 30 - 39 years old 40 - 49 years old
78.90%
18% 3.10%
Age

__________________________________________________________________________________
__________________________________________________________________________________
page 52 of 106
Followed by age group between 30 – 39 years old (18%) constitute of 69 respondents
and 12 respondents are between 40 – 49 years old (3.1%). According to Lee (2014),
majority of the online shoppers were young adults similar to this study as shown in
Table 4.2 and Figure 4.2 whereby the result indicated most of the online apparel
shoppers also within the young adults’ age group category.
4.1.3 Frequency of Target Respondents Based on Gender Group
Table 4.3: Race Group (n=384)
Race
Frequency Percent Valid Percent Cumulative
Percent
Valid
Malay 18 4.7 4.7 4.7
Chinese 366 95.3 95.3 100.0
Total 384 100.0 100.0
Source: Developed for research
Figure 4.3: Race Group
Source: Developed for research
4.70%
95.30%
Race
Malay
Chinese

__________________________________________________________________________________
__________________________________________________________________________________
page 53 of 106
Based on Table 4.3 and Figure 4.3, most of the respondents are Chinese which
consists of 366 respondents (95.3%) followed by 18 respondents (4.7%) are Malay.
Although research questionnaires have been distributed to Indian and other race
respondents however none of them are online apparel shoppers.
4.1.4 Frequency of Target Respondents Based on Monthly Income
Table 4.4: Monthly Income Group (n=384)
Income
Frequency Percent Valid Percent Cumulative
Percent
Valid
Below RM 1,000 36 9.2 9.2 9.2
RM 1,000 – RM 1,999 24 6.3 6.3 15.5
RM 2,000 – RM 2,999 120 31.3 31.3 46.8
RM 3,000 – RM3,999 117 30.5 30.5 77.3
Above RM4,000 87 22.7 22.7 100.0
Total 384 100.0 100.0
Source: Developed for research
Figure 4.4: Monthly Income Group
Source: Developed for research
31.30% 30.50%
22.70%
9.20%
6.30%
0.00%
5.00%
10.00%
15.00%
20.00%
25.00%
30.00%
35.00%
RM 2,000 –
RM 2,999
RM 3,000 –
RM3,999
Above
RM4,000
Below RM
1,000RM 1,000 –
RM 1,999
Income

__________________________________________________________________________________
__________________________________________________________________________________
page 54 of 106
For the personal monthly income, majority of the 120 respondents (31.3%) have
received monthly income between RM 2,000 – RM 2,999. Next group consists of 117
respondents (30.5%) received income between the range of RM 3,000 – RM 3,999
monthly, followed by 87 respondents (22.7%) have received income above RM 4,000
monthly, 36 respondents (9.2%) received income below RM 1,000 and lastly 24
target respondent (6.3%) received income between the ranges of RM 1,000 – RM
1,999 monthly.
4.1.5 Frequency of Target Respondents Based on Highest Education Attained
Table 4.5: Highest Education Attained Group (n=384)
Education
Frequency Percent Valid Percent Cumulative
Percent
Valid
Secondary 33 8.6 8.6 8.6
Diploma 132 34.4 34.4 43.0
Undergraduate Degree 87 22.7 22.7 65.7
Postgraduate Degree 120 31.3 31.3 97.0
Professional
Qualifications 12 3.0 3.0 100.0
Total 384 100.0 100.0
Source: Developed for research

__________________________________________________________________________________
__________________________________________________________________________________
page 55 of 106
Figure 4.5: Highest Education Attained Group
Source: Developed for research
Based on the Table 4.5 and Figure 4.5, 132 respondents (34.4%) have completed
diploma, 120 respondents (31.3%) have obtained postgraduate degree, 87 respondents
(22.7%) have completed undergraduate degree, 33 respondents (8.6%) completed
secondary and 12 respondents (3%) have professional qualifications. Most of the
respondents have attained certain level of qualifications.
34.40%
31.30%
22.70%
8.60% 3%
Education
Diploma
Postgraduate Degree
Undergraduate Degree
Secondary
Professional
Qualifications

__________________________________________________________________________________
__________________________________________________________________________________
page 56 of 106
4.2 Reliability Test
Table 4.6: Results of Reliability Test (n=384)
Variables Cronbach's Alpha Number of Item
Ind
epen
den
t
Va
ria
ble
s
Privacy/ Security 0.902 5
Website Design 0.825 3
Customer Service 0.840 4
Atmospheric/ Experiential 0.838 2
Med
iato
r
E-Shopping Satisfaction
0.875 3
Dep
end
ent
Va
ria
ble
E-Shopping Intention
0.862 2
Source: Developed for research
Note. Adopted from Ha, S., and Stoel, L. (2012). Online apparel retailing: roles of e-shopping quality
and experiential e-shopping motives. Journal of Service Management, 23(2), 197-215.
According to Saunders et al. (2009), reliability test is an indicator of measure for
internal consistency meanwhile Cronbach’s Alpha is one of the popular approaches
used to determine the correlation among the items. The range of Cronbach’s Alpha
less than 0.60 is consider poor and the range above 0.60 and of 0.70 indicate at the
level of acceptable (Sekaran and Bougie, 2010).
Based on Table 4.6, the highest scores of reliability test among the variables is
privacy/ security (value of Cronbach’s Alpha is 0.902), followed by e-shopping
satisfaction (value of Cronbach’s Alpha is 0.875), e-shopping intention (value of
Cronbach’s Alpha is 0.862), customer service (value of Cronbach’s Alpha is 0.840),
atmospheric/ experiential (value of Cronbach’s Alpha is 0.838) and website design

__________________________________________________________________________________
__________________________________________________________________________________
page 57 of 106
(value of Cronbach’s Alpha is 0.825). All the Cronbach’s Alpha values for all the
items are more than 0.6 therefore all the items are well-established with acceptable
level of reliability.
4.3 Pearson Correlation Analysis
Table 4.7: Pearson Correlation Analysis
Privacy
Security
Website
Design
Customer
Service
Atmospheric E-Shopping
Satisfaction
E-Shopping
Intention
Privacy/
Security
Pearson
Correlation 1 .526
** .491** .391
** .574** .415
**
Sig. (2-tailed) .000 .000 .000 .000 .000
N 384 384 384 384 384 384
Website
Design
Pearson
Correlation .526** 1 .577** .415** .522** .401**
Sig. (2-tailed) .000 .000 .000 .000 .000
N 384 384 384 384 384 384
Customer
Service
Pearson
Correlation .491
** .577** 1 .522
** .444** .458
**
Sig. (2-tailed) .000 .000 .000 .000 .000
N 384 384 384 384 384 384
Atmospheric
/Experiential
Pearson
Correlation .391
** .415** .522
** 1 .576** .420
**
Sig. (2-tailed) .000 .000 .000 .000 .000
N 384 384 384 384 384 384
E-Shopping
Satisfaction
Pearson
Correlation .574
** .522** .444
** .576** 1 .618
**
Sig. (2-tailed) .000 .000 .000 .000 .000
N 384 384 384 384 384 384
E-Shopping
Intention
Pearson
Correlation .415
** .401** .458
** .420** .618
** 1
Sig. (2-tailed) .000 .000 .000 .000 .000
N 384 384 384 384 384 384
**Correlation is significant at the 0.01 level (2-tailed).
Source: Developed for research
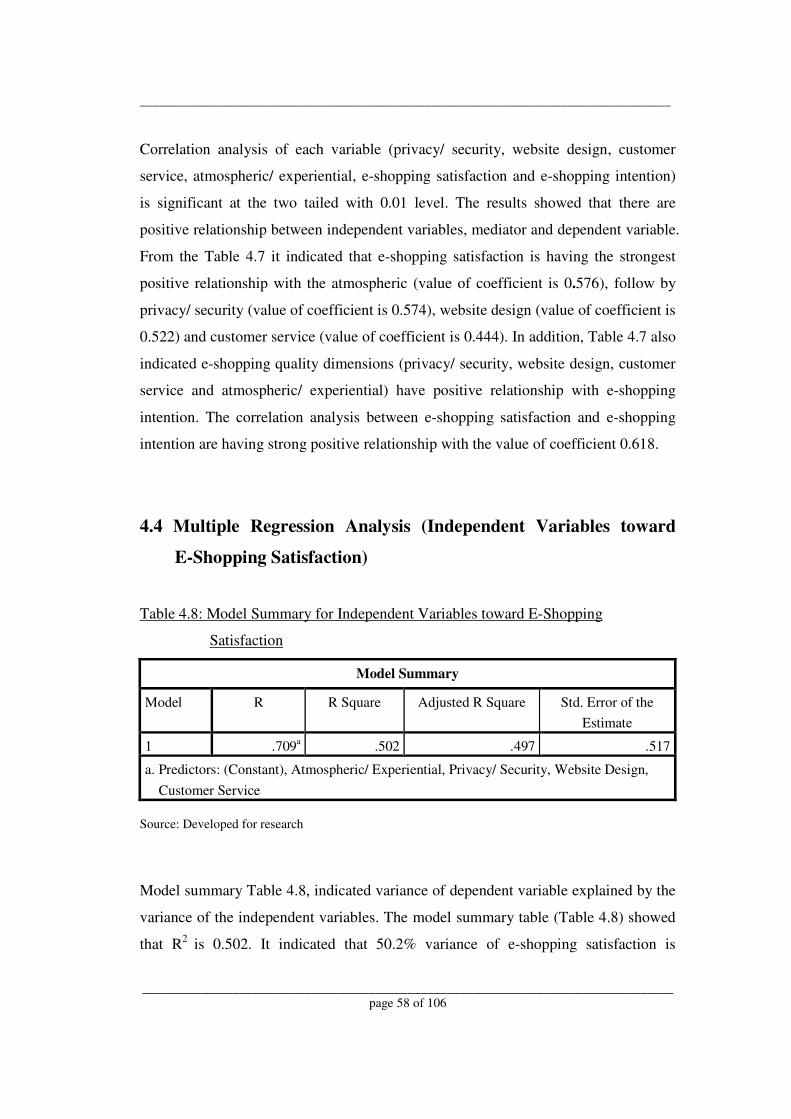
__________________________________________________________________________________
__________________________________________________________________________________
page 58 of 106
Correlation analysis of each variable (privacy/ security, website design, customer
service, atmospheric/ experiential, e-shopping satisfaction and e-shopping intention)
is significant at the two tailed with 0.01 level. The results showed that there are
positive relationship between independent variables, mediator and dependent variable.
From the Table 4.7 it indicated that e-shopping satisfaction is having the strongest
positive relationship with the atmospheric (value of coefficient is 0.576), follow by
privacy/ security (value of coefficient is 0.574), website design (value of coefficient is
0.522) and customer service (value of coefficient is 0.444). In addition, Table 4.7 also
indicated e-shopping quality dimensions (privacy/ security, website design, customer
service and atmospheric/ experiential) have positive relationship with e-shopping
intention. The correlation analysis between e-shopping satisfaction and e-shopping
intention are having strong positive relationship with the value of coefficient 0.618.
4.4 Multiple Regression Analysis (Independent Variables toward
E-Shopping Satisfaction)
Table 4.8: Model Summary for Independent Variables toward E-Shopping
Satisfaction
Model Summary
Model R R Square Adjusted R Square Std. Error of the
Estimate
1 .709a .502 .497 .517
a. Predictors: (Constant), Atmospheric/ Experiential, Privacy/ Security, Website Design,
Customer Service
Source: Developed for research
Model summary Table 4.8, indicated variance of dependent variable explained by the
variance of the independent variables. The model summary table (Table 4.8) showed
that R2
is 0.502. It indicated that 50.2% variance of e-shopping satisfaction is
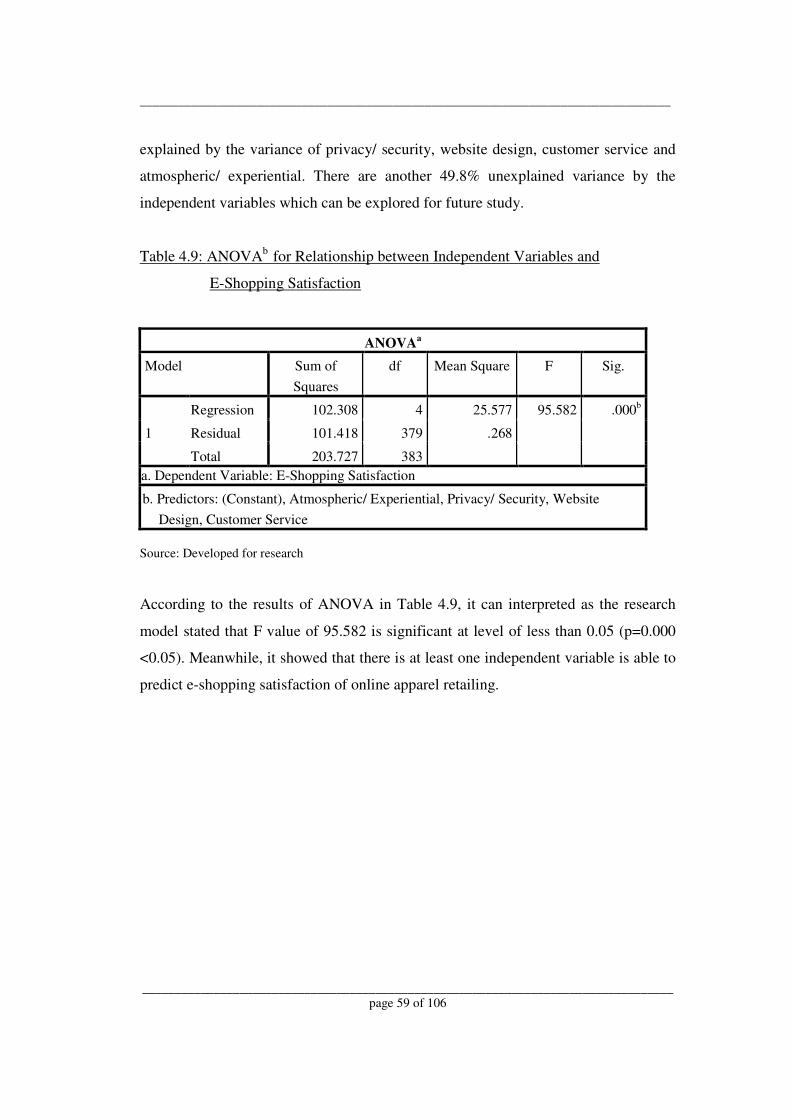
__________________________________________________________________________________
__________________________________________________________________________________
page 59 of 106
explained by the variance of privacy/ security, website design, customer service and
atmospheric/ experiential. There are another 49.8% unexplained variance by the
independent variables which can be explored for future study.
Table 4.9: ANOVAb
for Relationship between Independent Variables and
E-Shopping Satisfaction
ANOVAa
Model Sum of
Squares
df Mean Square F Sig.
1
Regression 102.308 4 25.577 95.582 .000b
Residual 101.418 379 .268
Total 203.727 383
a. Dependent Variable: E-Shopping Satisfaction
b. Predictors: (Constant), Atmospheric/ Experiential, Privacy/ Security, Website
Design, Customer Service
Source: Developed for research
According to the results of ANOVA in Table 4.9, it can interpreted as the research
model stated that F value of 95.582 is significant at level of less than 0.05 (p=0.000
<0.05). Meanwhile, it showed that there is at least one independent variable is able to
predict e-shopping satisfaction of online apparel retailing.

__________________________________________________________________________________
__________________________________________________________________________________
page 60 of 106
Table 4.10: Coefficientsa
for Relationship between Independent Variables and
E-Shopping Satisfaction
Coefficientsa
Model Unstandardized
Coefficients
Standardized
Coefficients
t Sig.
B Std. Error Beta
1
(Constant) .765 .151 5.068 .000
Privacy/ Security .302 .040 .334 7.469 .000
Website Design .201 .045 .212 4.464 .000
Customer Service -.038 .047 -.040 -.814 .416
Atmospheric/ Experiential .318 .037 .378 8.704 .000
a. Dependent Variable: E-Shopping Satisfaction
Source: Developed for research
Based on the Table 4.10, the standardized coefficients for privacy/ security is 0.334,
website design is 0.212, for customer service is -0.040 and atmospheric/ experiential
is 0.378. Atmospheric/ experiential is the highest Beta value (0.378) among all the
independent variables therefore atmospheric is considered as the important predictor
in this study. Moreover, independent variables are significantly related to dependent
variable when the p value is less than 0.05. Therefore, the results from Table 4.10
showed that only privacy/ security, website design and atmospheric are significantly
related to e-shopping satisfaction while p value of customer service is greater than
0.05 (p=0.416) and found to be not significantly related to e-shopping satisfaction.

__________________________________________________________________________________
__________________________________________________________________________________
page 61 of 106
Furthermore, unstandardized coefficients values indicated the contribute of each
independent variable to the dependent variable. According to Table 4.10, all the
variables have the positive relationship with e-shopping satisfaction except customer
service. The relationship between independent variables and e-shopping satisfaction
can be explained by the following equation:
E-Shopping Satisfaction = 0.765 + 0.302 (Privacy/ Security) + 0.201 (Website Design)
+ 0.318 (Atmospheric/ Experiential) – 0.038 (Customer
Service)
4.5 Multiple Regression Analysis (Independent Variables toward
E-Shopping Intention)
Table 4.11: Model Summary for Independent Variables toward E-Shopping Intention
Model Summary
Model R R Square Adjusted R Square Std. Error of the
Estimate
1 .542a .294 .287 .770
a. Predictors: (Constant), Atmospheric/ Experiential, Privacy/ Security, Website Design,
Customer Service
Source: Developed for research
From the Table 4.11, model summary table showed that R2 only 0.294. It indicate that
only 29.4% variance of e-shopping intention is explained by the variance of privacy/
security, website design, customer service and atmospheric/ experiential meanwhile
another 70.6% remain unexplained by the independent variables.

__________________________________________________________________________________
__________________________________________________________________________________
page 62 of 106
Table 4.12: ANOVAb
for Relationship between Independent Variables and
E-Shopping Intention
ANOVAa
Model Sum of
Squares
df Mean Square F Sig.
1
Regression 93.712 4 23.428 39.499 .000b
Residual 224.798 379 .593
Total 318.510 383
a. Dependent Variable: E-Shopping Intention
b. Predictors: (Constant), Atmospheric/ Experiential, Privacy/Security, Website Design,
Customer Service
Source: Developed for research
From the Table 4.12, the independent variables toward e-shopping intention is
significant and accepted based on the F value of 39.499 is significant at level of less
than 0.05 (p=0.000 <0.05). Therefore, it indicates that there is at least one
independent variable is able to direct predict e-shopping intention of online apparel
retailing.
Table 4.13: Coefficientsa
for Relationship between Independent Variables and
E-Shopping Intention
Coefficientsa
Model Unstandardized
Coefficients
Standardized
Coefficients
t Sig.
B Std. Error Beta
1
(Constant) .552 .225 2.458 .014
Privacy/ Security .205 .060 .181 3.405 .001
Website Design .125 .067 .106 1.867 .063
Customer Service .243 .069 .204 3.503 .001
Atmospheric/ Experiential .209 .054 .198 3.830 .000
a. Dependent Variable: E-Shopping Intention
Source: Developed for research

__________________________________________________________________________________
__________________________________________________________________________________
page 63 of 106
Based on the Table 4.13, showed the standardized coefficients for privacy/ security is
0.181, website design is 0.106, customer service is 0.204 and 0.198 for atmospheric/
experiential. Besides that, results also showed that only privacy/ security, customer
service and atmospheric/ experiential are significantly related to e-shopping intention
while p value of website design is greater than 0.05 (p=0.063) and found to be not
significantly related to e-shopping intention.
Unstandardized coefficients values indicated contribute of each independent variable
to the e-shopping intention. From the Table 4.13, all the variables have the positive
relationship with e-shopping intention however website design had insignificant value.
Therefore, relationship between independent variables and e-shopping intention can
be explained by the following equation:
E-Shopping Intention = 0.552 + 0.205 (Privacy/ Security) + 0.243 (Customer Service)
+ 0.209 (Atmospheric/ Experiential) + 0.125 (Website
Design)
4.6 Simple Linear Regression (Mediator toward E-Shopping
Intention)
Table 4.14: Model Summary for Simple Linear Regression
Model Summary
Model R R Square Adjusted R Square Std. Error of the
Estimate
1 .618a .382 .381 .718
a. Predictors: (Constant), E-Shopping Satisfaction
Source: Developed for research
From the Table 4.14, the R2
value 0.382 indicated that 38.2% variance of e-shopping
intention has been explained by e-shopping satisfaction.

__________________________________________________________________________________
__________________________________________________________________________________
page 64 of 106
Table 4.15: ANOVAb for Simple Linear Regression
ANOVAa
Model Sum of
Squares
df Mean Square F Sig.
1
Regression 121.817 1 121.817 236.582 .000b
Residual 196.693 382 .515
Total 318.510 383
a. Dependent Variable: E-Shopping Intention
b. Predictors: (Constant), E-Shopping Satisfaction
Source: Developed for research
Results from Table 4.15, it can interpreted as highly significant and accepted based
on the F value of 236.582 is significant at level of less than 0.05 (p=0.000 < 0.05)
therefore can be explained the mediator (e-shopping satisfaction) in the regression
model can be used to predict e-shopping intention on online apparel retailing.
Table 4.16: Coefficientsa for Simple Linear Regression
Coefficientsa
Model Unstandardized
Coefficients
Standardized
Coefficients
t Sig.
B Std. Error Beta
1
(Constant) .556 .182 3.053 .002
E-Shopping
Satisfaction .773 .050 .618 15.381 .000
a. Dependent Variable: E-Shopping Intention
Source: Developed for research
Results of Table 4.16 showed that mediator (e-shopping satisfaction) is statistically
significant contribution to the equation. Standardized coefficients values (Beta
value=0.618) of mediator (e-shopping satisfaction) indicated a positive contribution

__________________________________________________________________________________
__________________________________________________________________________________
page 65 of 106
toward e-shopping intention at the significant level of less than 0.05 (p=0.000 <0.05).
The relationship can be explained by following equation:
E-Shopping Intention = 0.556 + 0.773 (E-Shopping Satisfaction)
4.7 Hypothesis Testing
Table 4.17: Summary for Hypothesis Testing
Hypothesis Results
H1 There is a significant relationship between
privacy/ security and e-shopping satisfaction
on online apparel retailing.
Beta value = 0.334
p = 0.000
Supported
H2 There is a significant relationship between
website design and e-shopping satisfaction on
online apparel retailing.
Beta value = 0.212
p = 0.000
Supported
H3 There is a significant relationship between
customer service and e-shopping satisfaction
on online apparel retailing.
Beta value =
-0.040
p = 0.416
Not
Supported
H4 There is a significant relationship between
atmospheric/ experiential and e-shopping
satisfaction on online apparel retailing.
Beta value = 0.378
p = 0.000
Supported
H5 There is a significant relationship between e-
shopping satisfaction and e-shopping intention
on online apparel retailing.
Beta value = 0.618
p = 0.000
Supported
H6 There is a significant relationship between e-
shopping quality dimensions and e-shopping
1. Privacy/ Security
Beta value = 0.181
Supported
Except

__________________________________________________________________________________
__________________________________________________________________________________
page 66 of 106
intention on online apparel retailing. p = 0.001
2. Website Design
Beta value = 0.106
p = 0.063
3. Customer Service
Beta value = 0.204
p = 0.001
4. Atmospheric/
Experiential
Beta value = 0.198
p = 0.000
Website
Design Has
Insignificant
Value
Coefficients are significant at p value less than 0.05
Source: Developed for research
Based on Table 4.17, it showed that hypothesis for privacy/ security, website design
and atmospheric/ experiential toward e-shopping satisfaction are supported at 0.05
significant level while customer service is not supported as the p value is greater than
0.05. Besides that, there is significant positive relationship between e-shopping
satisfaction and e-shopping intention. Moreover, e-shopping quality dimensions have
direct significant to e-shopping intention except for website design.
4.8 Conclusion
The analysis results are obtained from questionnaire surveys are presented in this
chapter. Demographic profile of target respondents is summarized by using
descriptive analysis. Besides that, Pearson Correlation, multiple regression and linear
regression used to find out the relationship between independent variables, mediator
and dependent variable. Based on those analyses, an in-depth discussion will be
presented in Chapter 5.

__________________________________________________________________________________
__________________________________________________________________________________
page 67 of 106
CHAPTER 5
DISCUSSION AND CONCLUSION
5.0 Introduction
Chapter 5 will discussed about the research results that obtained from data analysis in
Chapter 4. Research results will be further discussed with the possible implications.
The limitation of the study will be identified and discussed in this chapter as well.
Lastly, recommendation for further studies and conclusion of this study are discussed
at the last part.
5.1 Summary of Statistical Analysis
5.1.1 Descriptive Analysis
The demographic information of target respondents was classified as gender, age,
race, monthly income and level of education background. Majority of the respondents
were female which consists of 65.6% in this research study. Age of respondents
consists between 20 – 29 years old (78.9%) and 30 – 39 years old (18%) were the
large portion in the age group category and this result were similar to earlier study by
Lee (2014) which stated that most of the Malaysian online shoppers were young
adults. Moreover, 95.3% of Chinese were participants who already had the online
apparel shopping experience. Based on the results, 31.3% of the target respondents

__________________________________________________________________________________
__________________________________________________________________________________
page 68 of 106
received monthly income between RM 2,000 – RM 2,999 and followed by 30.5% of
respondents received monthly income between RM 3,000 – RM3, 999. Lastly, most
of the target respondents completed diploma which consists of 34.4% and followed
by postgraduate degree which consist of 31.3%.
5.1.2 Scale Measurement
Reliability test which Cronbach’s Alpha were adopted for the scale measurement of
this research study. Cronbach’s Alpha approach is used to measure the reliability and
correlation among the 19 items of this study. In the reliability test, all the items were
more than 0.8 which is well above the acceptable level. Privacy/ security obtained the
highest score of Cronbach’s Alpha which 0.902, followed by e-shopping satisfaction
with the score of 0.875, e-shopping intention with the score of 0.862, customer
service with the score of 0.840 and atmospheric/ experiential with the score of 0.838.
Lastly, website design obtained the lowest score of Cronbach’s Alpha which is 0.825.
5.1.3 Pearson Correlation Analysis
Pearson Correlation Analysis is used to measure the relationship of each variable
(privacy/ security, website design, customer service, atmospheric/ experiential, e-
shopping satisfaction and e-shopping intention). Among the independent variables,
atmospheric/ experiential (value of coefficient is 0.576) had the strongest positive
relationship with e-shopping satisfaction. Followed by privacy/ security (value of
coefficient is 0.574), website design (value of coefficient is 0.522) and customer
service (value of coefficient is 0.444) at the significant level of 0.01. The results also
showed that there is positive correlation between independent variables (privacy/
security, website design, customer service and atmospheric/ experiential) and
dependent variables (e-shopping intention) at the significant level of 0.01. Meanwhile,
there are also positive relationships between mediator (e-shopping satisfaction) and
dependent variable (e-shopping intention) with the value of coefficient was 0.618.

__________________________________________________________________________________
__________________________________________________________________________________
page 69 of 106
Overall, the results indicated that there were significant positive relationship between
independent variables, mediator and dependent variable.
5.1.4 Multiple Regression Analysis (Independent Variables toward E-Shopping
Satisfaction)
Multiple regression analysis is adopted for the purpose to examine the association
among the independent variables (privacy/ security, website design, customer service
and atmospheric/ experiential) towards e-shopping satisfaction on online apparel
retailing. According the Table 4.8, it indicated that R2
is 0.502 which means 50.2 %
variance of e-shopping satisfaction is explained by the independent variables
(privacy/ security, website design, customer service and atmospheric/ experiential).
Table 4.10 indicated that privacy/ security, website design and atmospheric/
experiential (except for customer service p=0.416) had significant influence on e-
shopping satisfaction when the p value is less than 0.05. Based on Table 4.10,
relationship between independent variables and e-shopping satisfaction can be
explained by the following equation:
E-Shopping Satisfaction = 0.765 + 0.302 (Privacy/ Security) + 0.201 (Website Design)
+ 0.318 (Atmospheric/ Experiential) – 0.038 (Customer
Service)
Among the independent variables, atmospheric/ experiential had the strongest impact
on e-shopping satisfaction which indicate Beta value is 0.378 with the p value is less
than 0.05 (p=0.000). Therefore, atmospheric/ experiential is an important predictor of
e-shopping satisfaction and followed by privacy/ security and website design. Overall,
H1, H2 and H4 were supported.

__________________________________________________________________________________
__________________________________________________________________________________
page 70 of 106
5.1.5 Multiple Regression Analysis (Independent Variables toward E-Shopping
Intention)
Model summary of Table 4.11 indicated R2
is 0.294 which mean that only 29.4%
variance of e-shopping intention is explained by the independent variables (privacy/
security, website design, customer service and atmospheric/ experiential). Based on
Table 4.13, only privacy/ security, customer service and atmospheric/ experiential
had the direct impact on e-shopping intention with the p value is less than 0.05 while
p value of website design is greater than 0.05 (p=0.063) and found to be not
significantly related to e-shopping intention. Based on Table 4.13, an equation
developed as the following:
E-Shopping Intention = 0.552 + 0.205 (Privacy/ Security) + 0.243 (Customer Service)
+ 0.209 (Atmospheric/ Experiential) + 0.125 (Website
Design)
Customer service obtained the highest Beta value of 0.204 as the strongest
independent variable that have direct influence on e-shopping intention and followed
by atmospheric/ experiential and privacy/ security. H6 were supported by the results
which proved that there is a significant relationship between e-shopping quality
dimensions (privacy/ security, customer service and atmospheric/ experiential) except
for website design (p=0.063) which is insignificant to e-shopping intention on online
apparel retailing.

__________________________________________________________________________________
__________________________________________________________________________________
page 71 of 106
5.1.6 Linear Regression Analysis
Linear regression analysis is used to examine the significant relationship between e-
shopping satisfaction and e-shopping intention. According to Table 4.14, 38.2% (R2
is 0.382) variance of e-shopping intention has been explained by mediator (e-
shopping satisfaction). Based on Table 4.16, linear equation can be formed as:
E-Shopping Intention = 0.556 + 0.773 (E-Shopping Satisfaction)
Overall, H5 was supported with significant level of p value 0.000 which is less than
0.05.
5.2 Discussions of Major Findings
Table 5.1: Summary of Research Objectives, Hypothesis and Results
Research Objectives Hypothesis Sig P Results
To examine the privacy/
security and e-shopping
satisfaction on online
apparel retailing.
H1: There is significant
relationship between
privacy/ security and e-
shopping satisfaction on
online apparel retailing.
p=0.000 Supported
To examine the website
design and e-shopping
satisfaction on online
apparel retailing.
H2: There is significant
relationship between
website design and e-
shopping satisfaction on
online apparel retailing.
p=0.000 Supported

__________________________________________________________________________________
__________________________________________________________________________________
page 72 of 106
To examine the customer
service and e-shopping
satisfaction on online
apparel retailing.
H3: There is significant
relationship between
customer service and e-
shopping satisfaction on
online apparel retailing.
p=0.416 Not Supported
To examine the
atmospheric and e-
shopping satisfaction on
online apparel retailing.
H4: There is significant
relationship between
atmospheric and e-
shopping satisfaction on
online apparel retailing.
p=0.000 Supported
To examine the
mediation effect of e-
shopping satisfaction
towards e-shopping
intention.
H5: There is significant
relationship between e-
shopping satisfaction and e-
shopping intention on
online apparel retailing.
p=0.000 Supported
To examine the e-
shopping quality
dimensions and e-
shopping intention on
online apparel retailing.
H6: There is significant
relationship between e-
shopping quality
dimensions and e-shopping
intention on online apparel
retailing.
Privacy/
Security =
0.001
Website
Design =
0.063
Customer
Service =
0.01
Atmospheric
= 0.000
Overall
Supported
Except
Website
Design Has
Insignificant
Value
Coefficients are significant at p value is less than 0.05
Source: Developed for research

__________________________________________________________________________________
__________________________________________________________________________________
page 73 of 106
5.2.1 Privacy/ Security and E-Shopping Satisfaction
Research Objective: To examine privacy/ security and e-shopping satisfaction on
online apparel retailing.
Research Question: Does privacy/ security influence e-shopping satisfaction on
online apparel retailing?
H1: There is a significant relationship between privacy/ security and e-shopping
satisfaction on online apparel retailing.
Based on the results obtained from multiple regression analysis, p value for privacy/
security towards e-shopping satisfaction was less than 0.05 (p=0.000). Thus,
hypothesis (H1) is accepted as there is a significant relationship between privacy/
security and e-shopping satisfaction. For privacy/ security, the result was consistent
with the findings from Kim and Kim (2010) which indicated privacy/ security
significantly contributing to the consumers’ online shopping satisfaction but it is
contradicted with the study of Ha and Stoel (2012) which found that privacy/ security
was not significant to e-shopping satisfaction.
According to Kim and Kim (2010), consumers were afraid on the misuse of personal
information and fraud of credit card transaction even though they were high
frequency online shoppers. Therefore, consumers were always sensitive and
concerned on safety of credit card and personal details during online transaction
(Francis, 2009).
In this research based on the results obtained, it indicated that privacy/ security is the
second most important predictor to the consumers’ e-shopping satisfaction on online
apparel retailing. As a conclusion, most of the consumers are alert and sensitive to
privacy/ security issues due to the fear of misuse of personal information and fraud of

__________________________________________________________________________________
__________________________________________________________________________________
page 74 of 106
credit card transaction into illegal or crime activities. Hence, the hypothesis (H1) and
research objective is achieved and answered the research question.
5.2.2 Website Design and E-Shopping Satisfaction
Research Objective: To examine website design and e-shopping satisfaction on online
apparel retailing.
Research Question: Does website design influence e-shopping satisfaction on online
apparel retailing?
H2: There is a significant relationship between website design and e-shopping
satisfaction on online apparel retailing.
According to the results obtained from multiple regression analysis, p value for
website design towards e-shopping satisfaction was less than 0.05 (p=0.000).
Therefore, hypothesis (H2) is accepted as there is a significant relationship between
website design and e-shopping satisfaction. For website design, the result was
consistent with the findings from Ha and Stoel (2012) which indicated website design
significantly contributing to the consumers’ e-shopping satisfaction. Consumers
always prefer to purchase through a well-organized website with freely available
information which allow consumers to easily compare products to make a good
choice (Wolfinbarger & Gilly, 2001; Cristobal et al., 2007). Furthermore, in another
study by Kim, Kim and Lennon (2011) stated that a poor website design may lead to
the risk those consumers dissatisfied and exit the website without any purchase.
In this study, website design is least important factor that influences the consumers’
e-shopping satisfaction. Overall result indicated website design has least effect on e-
shopping satisfaction, but online apparel retailers should not underestimate the
importance of website design. Online apparel retailers still need to pay attention on

__________________________________________________________________________________
__________________________________________________________________________________
page 75 of 106
the website design elements. Therefore, the hypothesis (H2) and research objective is
achieved meanwhile research question has been answered.
5.2.3 Customer Service and E-Shopping Satisfaction
Research Objective: To examine customer service and e-shopping satisfaction on
online apparel retailing.
Research Question: Does customer service influence e-shopping satisfaction on
online apparel retailing?
H3: There is a significant relationship between customer service and e-shopping
satisfaction on online apparel retailing.
In this study, p value of customer service is greater than 0.05 (p=0.416) therefore
hypothesis (H3) is rejected as there is no significant relationship between customer
service and e-shopping satisfaction on online apparel retailing. This result was
consistent with the previous study of Ha and Stoel (2012) as customer service also
does not show any significant influence on e-shopping satisfaction.
The findings of this study might indicate the emotion or response (satisfaction level)
of respondents not really affected by the customer service. Although the results of this
study indicated customer service had no significant influence or affect on consumers’
response (e-shopping satisfaction), customer service possibly has the influence on
consumers’ shopping behavior. Online apparel retailers should not underestimate and
still need to be alert on customer service element. As a conclusion, the results
obtained from the findings unable to answer the research question and research
objective meanwhile hypothesis (H3) is rejected.

__________________________________________________________________________________
__________________________________________________________________________________
page 76 of 106
5.2.4 Atmospheric/ Experiential and E-Shopping Satisfaction
Research Objective: To examine atmospheric/ experiential and e-shopping
satisfaction on online apparel retailing.
Research Question: Does atmospheric/ experiential influence e-shopping satisfaction
on online apparel retailing?
H4: There is a significant relationship between atmospheric/ experiential and e-
shopping satisfaction on online apparel retailing.
Based on the results obtained from multiple regression analysis, p value for
atmospheric/ experiential towards e-shopping satisfaction was less than 0.05 (p=0.000)
and results indicated atmospheric/ experiential is the most important factor to
influence the consumers’ e-shopping satisfaction. Therefore, hypothesis (H4) is
accepted as there is a significant relationship between atmospheric and e-shopping
satisfaction on online apparel retailing. The result is consistent with the study of Ha
and Stoel (2012) as the atmospheric/ experiential significantly contributing to e-
shopping satisfaction.
Childers et al. (2001) also stated that atmospheric/ experiential features able to
generate the feeling of excitement and fun therefore considered as strong factor to
influence consumer response (e-shopping satisfaction) especially for those hedonic
website such as apparel website. Ha and Stoel (2012) noticed that atmospheric/
experiential dimension played an important role on customers’ evaluations of the
online store. As a conclusion, results of this study indicate that atmospheric/
experiential has the strongest influence on consumers’ emotion or response
(satisfaction). Hence, the hypothesis (H4) and research objective is achieved thus
answered the research question.

__________________________________________________________________________________
__________________________________________________________________________________
page 77 of 106
5.2.5 E-Shopping Satisfaction and E-Shopping Intention
Research Objective: To examine mediation effect of e-shopping satisfaction towards
e-shopping intention.
Research Question: Does e-shopping satisfaction mediate e-shopping quality
dimensions (privacy/ security, website design, customer service and atmospheric/
experiential) and e-shopping intention?
H5: There is a significant relationship between e-shopping satisfaction and e-shopping
intention on online apparel retailing.
The results obtained from linear regression analysis indicated that p value for e-
shopping satisfaction towards e-shopping intention was less than 0.05 (p=0.000).
Thus, hypothesis (H5) is accepted as there is a significant relationship between e-
shopping satisfaction and e-shopping intention on online apparel retailing. Similar
with the earlier study of Ha and Stoel (2012), the results of this study support Oliver’s
(1997) quality – satisfaction – behavioral intention link model on the online apparel
retailing.
Based on this research findings, e-shopping quality dimensions (privacy/ security,
website design and atmospheric/ experiential) affected e-shopping intention through
e-shopping satisfaction. However, customer service played an insignificant role in
affecting e-shopping intention through e-shopping satisfaction. The findings of this
study also indicated that e-shopping satisfaction played as mediating role between e-
shopping quality dimension and e-shopping intention. Moreover, the findings further
supported by Lee and Lin’s (2005) study which found a positive relationship among
overall quality dimensions, customer satisfaction and purchase intention on an online
store. As a conclusion, maximizing consumers’ e-shopping satisfaction is essential
which will be able to increase consumers’ e-shopping intention. Therefore, online
apparel retailers should always aware on the most contributing factors to the

__________________________________________________________________________________
__________________________________________________________________________________
page 78 of 106
consumers’ e-shopping satisfaction in order to increase consumers online shopping
intention. Overall, the hypothesis (H5) and research objective is achieved and the
research question has been answered.
5.2.6 E-Shopping Quality Dimensions and E-Shopping Intention
Research Objective: To examine e-shopping quality dimensions and e-shopping
intention on online apparel retailing
Research Question: Do e-shopping quality dimensions play a role towards consumer
online apparel shopping behavior?
H6: There is a significant relationship between e-shopping quality dimensions and e-
shopping intention on online apparel retailing.
Multiple regression analysis between e-shopping quality dimensions (privacy/
security, website design, customer service and atmospheric) and e-shopping intention
and found that the p value was less than 0.05 (p=0.000) which proved the hypothesis
(H6) is accepted as there is a significant relationship between e-shopping quality
dimensions and e-shopping intention on online apparel retailing.
Furthermore among the variables of e-shopping quality dimensions, it was found that
privacy/ security (p=0.001), customer service (p=0.001) and atmospheric (p=0.000)
was significantly related to e-shopping intention while p value of website design is
greater than 0.05 (p=0.063).Additionally, the results also showed that privacy/
security and customer service significantly related to e-shopping intention were
consistent with the earlier study of Ha and Stoel (2012). However, the findings of
atmospheric/ experiential is contradicted with the study of Ha and Stoel (2012) who
found that atmospheric/ experiential has the insignificant value to e-shopping
intention.

__________________________________________________________________________________
__________________________________________________________________________________
page 79 of 106
Although the results showed that e-shopping quality dimensions (privacy/ security,
customer service and atmospheric/ experiential) had the significant direct influence
on e-shopping intention, but the variance (29.4%) is much lower compared to the
variance of e-shopping quality dimensions towards e-shopping satisfaction (50.2%)
and e-shopping satisfaction towards e-shopping intention (38.2%). As overall, the
results of this study supported Oliver’s (1997) quality – satisfaction – behavioral
intention link model in which e-shopping quality dimensions influence e-shopping
satisfaction and in turn contributes to e-shopping intention. Thus, the hypothesis (H6)
and research objective is achieved and the research question has been answered.
5.3 Implications of the Study
In order to gain online market share, it is important to understand the factors
influence consumers’ e-shopping satisfaction that contribute to e-shopping intention.
This research study tried to provide depth measurement and understand the
antecedents of e-shopping quality dimensions towards e-shopping outcome (e-
shopping satisfaction and e-shopping intention) on online apparel retailing. Based on
the research findings, several implications will be provided for online apparel
marketers.
5.3.1 Implications for Online Apparel Marketers
This research study has suggested the following implications for online apparel
marketers. Firstly, this study suggested online apparel marketers should enhance their
marketing strategy in terms of privacy/ security and atmospheric/ experiential because
the results indicated that privacy/ security and atmospheric had the significant
relationship towards consumers’ e-shopping satisfaction and also had the direct
impact on consumers’ e-shopping intention. Online apparel marketers should
targeting on hedonic dominant aspects, create the high quality of website content in
order to generate fun and excitement to online consumers since atmospheric/

__________________________________________________________________________________
__________________________________________________________________________________
page 80 of 106
experiential has the most important factor to influence e-shopping satisfaction and e-
shopping intention (Ha & Stoel, 2012). Meanwhile, online consumers very sensitive
on fraud of transaction and misuse of personal information issues therefore
enhancement of online security systems is essential in order to protect privacy of
personal information and safety of transaction.
Second, website design cannot be underestimated although it has the least impact on
e-shopping satisfaction. Website design is an important instrument to provide
consumers ease of use and usefulness during online transaction processes (Lee & Lin,
2005). Online apparel marketers still need to always pay attention to ensure website
design is readable and tidy, easy to locate information and have clear product
information. Third, customer service cannot be ignored although insignificantly
related to e-shopping satisfaction. Customer service still consider play an important
role because it has direct influence on consumers’ online shopping intention therefore
online apparel marketers still need to ensure customer service provided is able to
meet the expectation of customers.
5.4 Limitation of Study
There were some limitations have been discovered and identified in order to ensure
quality improvement of the future research. First, the samples size obtained from
respondents may not be representative of the general population of online apparel
shoppers. Most of the respondents in this study were Chinese compare to other ethnic
group. Thus, analytical results presented here may tend to be bias to certain ethnic
group. Apart from that, the results accomplished by using single segment of retail
industry only which focused on online apparel industry. It is unclear whether the
analytical results can generalized to other areas of retailing such as service or other
product categories. Hence, caution should be noted if apply the results to other areas
of retailing.

__________________________________________________________________________________
__________________________________________________________________________________
page 81 of 106
Third, the measurement instrument constructed might be the limitation in this study.
The consumers’ e-shopping satisfaction is not explained completely by the e-
shopping quality dimensions (privacy/ security, website design, customer service and
atmospheric/ experiential) which the variance only carried 50.2% and there is another
49.8% variance of e-shopping satisfaction unexplained by the e-shopping quality
dimensions. Thus, it is possible there are more predictors of e-shopping quality that
able to explain the undiscovered e-shopping satisfaction.
5.5 Future Studies
Several suggestions and recommendations can be included for future research study.
Through this research, it is able to provide an in-depth understanding on contribution
of e-shopping quality dimensions to measure e-shopping outcome (e-shopping
satisfaction and e-shopping intention).
First, select the sample more representative of the population thus able to provide
macro view of entire Malaysian online shopping behavior. Second, there is only 50.2%
of the e-shopping satisfaction explained by the e-shopping quality dimensions and
38.2% of e-shopping intention explained by e-shopping satisfaction. Therefore, future
research might consider developing and discovering more factors or predictors and
antecedents to allow richer coverage of e-shopping quality dimensions, e-shopping
satisfaction and e-shopping intention. Moreover, future research may replicate and
elaborate more scale measurement of e-shopping quality dimensions, e-shopping
satisfaction and e-shopping intention to observe different findings across different
culture, ethnicity and cover more segment of retail industry.

__________________________________________________________________________________
__________________________________________________________________________________
page 82 of 106
5.6 Conclusion
This study was conducted to provide in-depth investigation on factors that influence
consumers’ e-shopping outcome (e-shopping satisfaction and e-shopping intention)
on online apparel retailing. This research project had achieved the objectives to
identify the variables or predictors of e-shopping quality and examine the relationship
towards e-shopping outcomes (e-shopping satisfaction and e-shopping intention).
Through the analytical results, it indicated that e-shopping quality dimension
(privacy/ security, website design and atmospheric/ experiential) had significantly
affect e-shopping intention through e-shopping satisfaction except for customer
service had been found insignificant to e-shopping satisfaction. Therefore, the
findings of this this study is supported Oliver’s (1997) quality - satisfaction –
behavioral intention link model. Meanwhile, findings of this study also indicated that
privacy/ security, customer service and atmospheric/ experiential had direct
relationship to e-shopping intention.
As a conclusion, the outcome of this research project indicated that atmospheric/
experiential is the most important factor to influence e-shopping outcome (e-shopping
intention) via e-shopping satisfaction to the hedonic dominant website such as apparel
website. Although atmospheric/ experiential has the strongest impact on e-shopping
outcome (e-shopping satisfaction), other factors such as privacy/ security, website
design and customer service should not be underestimated. In addition, implication,
limitation and recommendations for future studies have been provided in this study as
a guideline for online retailers to develop innovative online marketing strategy and
reference for future research to find out more coverage of e-shopping quality
dimensions across the different retail segment, culture and ethnic.

__________________________________________________________________________________
__________________________________________________________________________________
page 83 of 106
REFERENCES
Alba, J., Lynch, B., Weitz, C., Janiszewski, R., Lutz, A. S., and Wood, S. (1997).
Interactive home shopping: consumer, retailer, and manufacturer incentives to
participate in electronic marketplaces. Journal of Marketing, 61(3), 38-53.
Anderson, R. E., & Srinivasan, S. S. (2003). E-satisfaction and e-loyalty: a
contingency framework. Psychology and Marketing, 20(2), 123-138.
Bagozzi, R. P. (1992). The self-regulation of attitudes, intentions, and behavior.
Social Psychology Quarterly, 55(22), 178-204.
Bauer, H. H., Falk, T., & Hammerschmidt, M. (2006). E-TransQual: a transaction
process-based approach for capturing service quality in online shopping. J Bus
Res, 59(7), 866-875.
Branscum, D., & Tanaka, T. (2000). Guarding online privacy. Newsweek, 77-78.
Chang, H. H., & Wang, H. W. (2011). The moderating effect of customer perceived
value on online shopping behavior. Online Information Review, 35(3), 333-
359.
Chen, Q., & Wells, W. D. (1999). Attitude towards the site. Journal of Advertising
Research, 39(5), 27-37.
Childers, T. L., Carr, C. L., Peck, J., & Carson, S. (2001). Hedonic and utilitarian
motivation for online retail shopping behavior. Journal of Retail, 77(4), 511-
535.
Choi, K. S., Cho, W. H., Lee, S., Lee, H., & Kim, C. (2004). The relationship among
quality, value, satisfaction and behavioral intention in health care provider
choice: a South Korean study. Journal of Business Research, 57, 913-921.
Cho, N., & Park, S. (2001). Development of electronic commerce user – consumer
satisfaction index (ECUSI) for internet shopping. Industrial Management and
Data Systems, 101(8), 400-405.
Chua, A. P. H., Khatibi, A., & Ismail, H. (2006). E-commerce: a study on online
shopping in Malaysia. Journal of Social Science, 13(3), 231-242.

__________________________________________________________________________________
__________________________________________________________________________________
page 84 of 106
Cox, J., and Dale, B. G. (2001). Service quality and e-commerce: an exploratory
analysis. Managing Service Quality, 11(2), 121-131.
Cristobal, E., Flavian, C., & Guinaliu, M. (2007). Perceived e-service quality (PeSQ)
measurement validation and effects on consumer satisfaction and web site
loyalty. Managing Service Quality, 17(3), 317-340.
Cronin, J. J., Brady, M. K., & Hult, G. (2000). Assessing the effects of quality, value,
and customer satisfaction on consumer behavioral intentions in service
environments. Journal of Retailing, 76(2), 193-218.
Fassnacht, M., & Koese, I. (2006). Quality of electronic services: conceptualizing and
testing a hierarchical model. Journal of Service Research, 9(1), 19-37.
Francis, J.E. (2009). Category-specific RECIPEs for internet retailing quality. Journal
of Service Marketing, 23(7), 450-461.
Ha, S., and Stoel, L. (2009). Consumer e-shopping acceptance: antecedents in a
technology acceptance model. Journal of Business Research, 62, 565-571.
Ha, S., and Stoel, L. (2012). Online apparel retailing: roles of e-shopping quality and
experiential e-shopping motives. Journal of Service Management, 23(2), 197-
215.
Hou, G. (2005). Service quality of online apparel retailers and its impact on customer
satisfaction, customer trust and customer loyalty. (Doctoral dissertation,
University of North Caroline, 2005), pp. 236.
Hung, P. S. (2004). An empirical study on predicting user acceptance of e-shopping
on the web. Information & Management, 41, 351-368.
Im, H., & Ha, Y. (2011). The effect of perceptual fluency and enduring involvement
on situational involvement in an online apparel shopping context. Journal of
Fashion Marketing and Management, 15(3), 345-362.
Irshad, W. (2012). Service based brand equity, measure of purchase intention,
mediating role of brand performance. Academy of Contemporary Research
Journal, 1(1), 1-10.

__________________________________________________________________________________
__________________________________________________________________________________
page 85 of 106
Janda, S., Trocchia, P. J., & Gwinner, K. P. (2002). Consumer perceptions of internet
retail service quality. International Journal of Service Industry Management,
13(5), 412-431.
Jedd, M. (2000). Sizing up home delivery. Logistics Management and Distribution
Report, 39(2), 51-56.
Jiradilok, T., Malisuwan, S., Madan, N., & Sivaraks, J. (2014). The impact of
customer satisfaction on online purchasing: a case study analysis in Thailand.
Journal of Econimics,Business and Management, 2(1), 5-11.
Jun, M., Yang, Z., & Kim, D. S. (2004). Customers’ perceptions of online retailing
service quality and their satisfaction. International Journal of Quality and
Reliability Management, 21(8), 817-840.
Kala, D. V., Chee, W. M., & Muhammad, L. O. H. (2013). Online shopping and
customer satisfaction in Malaysia. International Journal of Marketing
Practices, 1(1), 43-51.
Kamaruzaman, K. N., and Handrich, Y. M. (2010). E-commerce adoption in
Malaysia: trends, issues and opportunities. ICT Strategic Review 2010/11 E-
Commerce for Global Reach (pp89-134). Pikom: Frost & Sullivan.
Kapsalis, V., Charatsis, K., Georgoudakis, M., Nikoloutsos, E., & Papadopoulos, G.
(2004). A SOAP based system for the provision of e-services. Computer
Standard & Interfaces, 26, 527-541.
Kim, E. B., & Eom, S. B. (2002). Designing effective cyber store user interface.
Industrial Management & Data Systems, 102(5/6), 241-251.
Kim, J. H., & Kim, C. (2010). E-service quality perceptions: a cross-cultural
comparison of American and Korean consumers. Journal of Research in
Interactive Marketing, 4(3), 257-275.
Kim, J. H., Kim, M., & Lennon, J. (2009). Effects of web site atmospheric on
consumer response: music and product presentation. Direct Marketing: An
International Journal, 31(1), 4-19.

__________________________________________________________________________________
__________________________________________________________________________________
page 86 of 106
Kim, J., & Lee, J. (2002). Critical design factors for successful e-commerce systems.
Behavior and Information Technology, 21(3), 185-189.
Kim, M., Kim, J. H., & Lennon, S. J. (2011). E-service attributes available on men’s
and women’s apparel web sites. Managing Service Quality, 21(1), 25-45.
Kim, M., & Lennon, S. (2008). The effects of visual and verbal information on
attitudes and purchase intentions in internet shopping. Psychology &
Marketing, 25(2), 146-178.
Kim, S., & Stoel, L. (2004). Apparel retailers: website quality dimensions and
satisfaction. Journal of Retailing and Consumer Services, 11, 109-117.
Kotler, P. (2000). Marketing Management (10th
ed.). Prentice Hall: Englewood Cliffs,
NJ.
Kotler, P., & Keller, K.L. (2012). Marketing management (14th
ed.). England:Prentice
Hall
Lee, G. G., & Lin, H. F. (2005). Customer perceptions of e-service quality in online
shopping. International Journal of Retail & Distribution Management, 33(2),
161-176.
Lee, Y. L. (2014, February 19). Cyberworld. Sin Chew Daily, pp. 1-2.
Liao, Z., and Cheung, M. T. (2002). Internet based e-banking and consumer attitudes:
an empirical study. Information and Management, 39(4), 283-295.
Lin, G. T. R., & Sun, C. C. (2009). Factors influencing satisfaction and loyalty in
online shopping: an integrated model. Online Information Review, 33(3), 458-
475.
Llusar, J. C. B., Zornoza, C. C, & Tena, A. B. E. (2001). Measuring the relationship
between firm perceived quality and customer satisfaction and its influence on
purchase intentions. Total Quality Management, 12(6), 719-734.

__________________________________________________________________________________
__________________________________________________________________________________
page 87 of 106
Loiacono, E. T., Watsons, R. T., & Goodhue, D. L. (2007). WebQual: an instrument
for consumer evaluation of web sites. International Journal of Electronic
Commerce, 11(3), 51-87.
Loonam, M., & Loughlin, D. O. (2008). Exploring e-service quality: a study of Irish
online banking. Marketing Intelligence & Planning, 26(7), 759-780.
Lorenzo-Romero, C., Gomez-Borja, M. A., & Molla-Descals, A. (2011). Effects of
utilitarian and hedonic atmospheric dimensions on consumer response in an
online shopping environment. African Journal of Business Management, 5(21),
8649-8667.
Madu, C. N., & Madu, A. A. (2002). Dimensions of e-quality. International Journal
of Quality & Reliability Management, 19(3), 246-258.
McDougall, G. H. G., & Levesque, T. (2000). Customer satisfaction with services:
putting perceived value into the equation. Journal of Services Marketing,
14(5), 392-410.
Miyazaki, A. D., & Fernandez, A. (2001). Consumer perceptions of privacy and
security risks for online shopping. Journal of Consumer Affairs, 35(1), 27-44.
Oliver, R. L. (1997). Satisfaction: A Behavioral Perspective on the Consumer,
McGraw-Hill, New York, NY.
Parasuraman, A., Zeithaml, V. A., & Berry, L. L. (1988). SERVQUAL: a multiple
item scale for measuring customer perceptions of service quality. Journal of
Retailing, 64(1), 12-40.
Parasuraman, A., Zeithmal, V. A., & Malhotra, A. (2005). E-S-QUAL: a multiple-
item scale for assessing electronic service quality. Journal of Service
Research, 7, 213-233.
Park, J. H., Lennon, S., & Stoel, J. (2005). On-line product presentation: effects on
mood, perceived risk and purchase intention. Psychology & Marketing, 22(9),
695-719.

__________________________________________________________________________________
__________________________________________________________________________________
page 88 of 106
Pavlou, P. A. (2003). Consumer acceptance of electronic commerce: integrating trust
and risk with the technology acceptance model. International Journal of
Electronic Commerce, 7(3), 101-134.
Ranganathan, C., and Ganapathy, S. (2002). Key dimensions of business to consumer
web sites. Information and Management, 30, 457-465.
Rust, R. T., and Zahorik, A. (1993). Customer satisfaction, customer retention and
market share. Journal of Retailing, 69(2), 193-215.
Sahadev, S., & Purani, K. (2008). Modelling the consequences of e-service quality.
Marketing Intelligence & Planning, 26(6), 605-620.
Sam, M. F. M., & Tahir, M. N. H. (2009). Website quality and consumer online
purchase intention of air ticket. International Journal of Basic & Applied
Sciences, 9(10), 4-9.
Santos, J. (2003). E-service quality: a model of virtual service quality dimension.
Management Service Quality, 13(3), 233-246.
Santouridis, I., Trivellas, P., & Tsimonis, G. (2012). Using E-S-QUAL to measure
internet service quality of e-commerce web sites in Greece. International
Journal of Quality and Service Sciences, 4(1), 86-98.
Saunders, M., Lewis, P., & Thornhill, A. (2009). Research methods for business
students (5th ed.). Prentice Hall: Financial Times.
Schaupp, L. C., & Belanger, F. (2005). A conjoint analysis of online consumer
satisfaction. Journal of Electronic Commerce Research, 6(2), 95-111.
Schlosser, A. E. (2003). Experiencing products in the virtual world: the role of goal
and imagery in influencing attitudes versus purchase intention. Journal of
Consumer Research, 30, 184-198.
Sekaran, U., & Bougie, R. (2010). Research methods for business: a skill building
approach (5th
ed.). United States of America: John Wiley & Son.

__________________________________________________________________________________
__________________________________________________________________________________
page 89 of 106
Sharna, A., & Sheth, J. N. (2004). Web-based marketing: the coming revolution in
marketing thought and strategy. Journal of Business Research, 57(7), 696-702.
Srinivasan, S. S., Anderson, R., & Ponnavolu, K. (2002). Customer loyalty in e-
commerce: an exploration of its antecedents and consequences. Journal of
Retailing, 78(1), 41-50.
Thamizhvanan, A., & Xavier, M. J. (2013). Determinants of customers’ online
purchase intention: an empirical study in India. Journal of Indian Business
Research, 5(1), 17-32.
Than, C. R., & Grandon, E. (2002). An exploratory examination factors affecting
online sales. Journal of Computer Information Systems, 42(3), 87-93.
Trocchia, P. J., & Janda, S. (2003). How do customers evaluate internet retail service
quality. Journal of Service Marketing, 17(3), 243-253.
Tung, H. L. (2012). Effect of e-service quality on consumer online repurchase
intentions. (Doctoral dissertation, Lynn University, 2012). UMI Dissertation
Publishing, Proquest LLC.
Venkatesan, R., Kumar, V., & Ravishanker, N. (2007). Multichannel shopping:
causes and consequences . Journal of Marketing, 71(2), 114-132.
White, C., & Yu, Y. T. (2005). Satisfaction emotions and consumer behavioral
intention. Journal of Service Marketing, 19(6), 411-420.
Wolfinbarger, M., & Gilly, M. C. (2003). eTailQ: dimensionalizing, measuring and
predicting etail quality. Journal of Retailing, 79, 183-198.
Wolfinbarger, M., & Gilly, M. C. (2001). Shopping online for freedom, control and
fun. California Management Review, 43(2), 34-55.
Woodruff, R. B. (1997). Customer value: the next source for competitive advantage.
Journal of the Academy of Marketing Science, 25(2), 139-153.

__________________________________________________________________________________
__________________________________________________________________________________
page 90 of 106
Wu, W. Y., Lee, C. L, Fu, C. S., & Wang, H. C. (2014). How can online store layout
design and atmosphere influence consumer shopping intention on a website.
International Journal of Retail & Distribution Management, 42(1), 4-24.
Yang, Z., & Jun, M. (2002). Consumer perception of e-service quality: from internet
purchaser and non-purchase perspectives. Journal of Business Strategies,
19(1), 19-41.
Yoo, B., & Donthu, N. (2001). Developing a scale to measure the perceived quality of
an internet shopping site (SITEQUAL). Quarterly Journal of Electronic
Commerce, 2(1), 31-47.
Zeithaml, V. A., Parasuraman, A., & Malhotra, A. (2002). Service quality delivery
through web sites: a critical review of extant knowledge. Journal of the
Academy of Marketing Science, 39, 362-410.
Zhu, F. X., Wymer, W., & Chen, I. (2002). IT- based services and service quality in
consumer banking. International Journal of Service Industry Management,
13(1), 69-90.
Zikmund, W. G. (2003). Business research method (7th
ed.). South-Western:
Thomson.

__________________________________________________________________________________
__________________________________________________________________________________
page 91 of 106
APPENDIX A
RESEARCH QUESTIONNAIRE
UNIVERSITI TUNKU ABDUL RAHMAN
FACULTY OF ACCOUNTANCY AND MANAGEMENT
Research Topic: Factors Affecting Online Shopping of Purchasing Apparels among
Young Adults
Dear participant,
I am a postgraduate student of Master of Business Administration at Universiti Tunku
Abdul Rahaman (UTAR). I am currently conducting a research project as a part of
the requirement to complete my master program. The aim of this research is to
examine e-shopping quality dimensions on online apparel retailing and it relationship
on e-shopping satisfaction and e-shopping intention.
Your cooperation and support is needed to complete the questionnaire, which takes
about 15 minutes. No information that identifies you personally will be revealed.
Your participation will be anonymous and all the information will be kept
confidential and for academic purpose only.
We hope that you will find completing the questionnaire enjoyable. If you have any
questions or would like to have further information regarding this research study,
please do not hesitate to reach us at the contact given below.
Thank you once again for your precious time and assistance.
Yours faithfully,
NAME ID CONTACT NO.
CHONG HUI TEING 09UKM07177 012-6243122

__________________________________________________________________________________
__________________________________________________________________________________
page 92 of 106
Part A: Demographic Information
(Please tick only one answer in the relevant box for each of the following statements)
1. Have you ever purchased any apparel from apparel online stores?
� Yes
� No (Thank You for Your Participation, Please Return The Questionnaire)
2. Gender:
� Male
� Female
3. Age group :
� Below 20 years old
� 20 – 29 years old � 40 – 49 years old
� 30 – 39 years old � 50 years old and above
4. Race:
� Chinese
� Indian
� Malay
� If others, please specify:_________
5. Highest education attained:
� Primary � Post Graduate Degree
� Secondary � Professional Qualifications
� Diploma � If other, please specify_________
� Under Graduate Degree
6. Monthly salary
� Below RM 1000
� RM 1000 – RM 1,999
� RM 2000 – RM 2,999
� RM 3,000 – RM3,999
� Above RM4,000

__________________________________________________________________________________
__________________________________________________________________________________
page 93 of 106
Part B: Factor Affecting E-Shopping Satisfaction towards Online Apparel
Retailing
Please indicate how strong you agree or disagree to each statement by placing a circle from 1
(Strongly Disagree) to 5 (Strongly Agree), where:
Privacy/ Security SD D N A SA
1. I feel like my privacy is protected at this site. 1 2 3 4 5
2. I feel safe in my transactions with this website. 1 2 3 4 5
3. I feel I can trust this website. 1 2 3 4 5
4. The website has adequate security features. 1 2 3 4 5
5. The company behind the site is reputable. 1 2 3 4 5
Website Design SD D N A SA
1. The site does not waste my time. 1 2 3 4 5
2. I can go to exactly what I want quickly. 1 2 3 4
5
3. The organization and layout of the web site
facilities searching for products. 1 2 3 4 5
Customer Service SD D N A SA
1. The company is ready and willing to respond to
customer needs.
1 2 3 4 5
2. The website has reasonable shipping and handling
costs.
1 2 3 4 5
3. Customer service personnel are always willing to
help you.
1 2 3 4 5
4. Inquiries are answered promptly. 1 2 3 4 5
1 2 3 4 5
Strongly
Disagree (SD) Disagree
(D) Neutral
(N) Agree
(A) Strongly Agree
(SA)

__________________________________________________________________________________
__________________________________________________________________________________
page 94 of 106
Atmospheric/ Experiential SD D N A SA
1. It is really fun to shop at this website. 1 2 3 4 5
2. The site almost says, “come in and shop”. 1 2 3 4
5
Part C: E-Shopping Satisfaction and E-Shopping Intention
Please indicate how strongly you agree or disagree to each statement by placing a circle from
1 (Strongly Disagree) to 5 (Strongly Agree), where:
E-Shopping Satisfaction SD D N A SA
1. My choice to shop using the website is a wise idea. 1 2 3 4 5
2. I am satisfied with my decision to shop this website. 1 2 3 4 5
3. I have really enjoyed shopping from this website. 1 2 3 4 5
E-Shopping Intention SD D N A SA
1. I intend to use the internet frequently to shop for
apparel.
1 2 3 4 5
2. I intend to use the internet whenever appropriate to
do apparel shopping.
1 2 3 4 5
“Thank you for your participation. All response will be kept private and confidential.”
1 2 3 4 5
Strongly
Disagree (SD) Disagree
(D) Neutral
(N) Agree
(A) Strongly Agree
(SA)

__________________________________________________________________________________
__________________________________________________________________________________
page 95 of 106
APPENDIX B
APPENDIX B1: PILOT TEST ON PRIVACY/ SECURITY
Case Processing Summary
N %
Cases
Valid 30 100.0
Excludeda 0 .0
Total 30 100.0
a. Listwise deletion based on all variables in the
procedure.
Scale Statistics
Mean Variance Std. Deviation N of Items
16.93 16.202 4.025 5
Reliability Statistics
Cronbach's
Alpha
N of Items
.860 5
Item-Total Statistics
Scale Mean if
Item Deleted
Scale Variance
if Item Deleted
Corrected Item-
Total
Correlation
Cronbach's
Alpha if Item
Deleted
I feel like my privacy is
protected at this site. 13.60 10.731 .725 .819
I feel safe in my
transactions with this
website.
13.63 9.826 .762 .808
I feel I can trust this
website. 13.43 10.668 .803 .803
The website has adequate
security features. 13.47 10.740 .746 .815
The company behind the
site is reputable. 13.60 11.697 .421 .901

__________________________________________________________________________________
__________________________________________________________________________________
page 96 of 106
APPENDIX B2: PILOT TEST ON WEBSITE DESIGN
Case Processing Summary
N %
Cases
Valid 30 100.0
Excludeda 0 .0
Total 30 100.0
a. Listwise deletion based on all variables in the
procedure.
Scale Statistics
Mean Variance Std. Deviation N of Items
11.13 5.706 2.389 3
Reliability Statistics
Cronbach's
Alpha
N of Items
.883 3
Item-Total Statistics
Scale Mean if
Item Deleted
Scale Variance
if Item Deleted
Corrected Item-
Total
Correlation
Cronbach's
Alpha if Item
Deleted
The site does not waste my
time. 7.33 2.713 .756 .849
I can go to exactly what I
want quickly. 7.43 2.461 .782 .830
The organization and layout
of the web site facilities
searching for products.
7.50 2.879 .792 .824

__________________________________________________________________________________
__________________________________________________________________________________
page 97 of 106
APPENDIX B3: PILOT TEST ON CUSTOMER SERVICE
Case Processing Summary
N %
Cases
Valid 30 100.0
Excludeda 0 .0
Total 30 100.0
a. Listwise deletion based on all variables in the
procedure.
Scale Statistics
Mean Variance Std. Deviation N of Items
13.40 10.317 3.212 4
Reliability Statistics
Cronbach's
Alpha
N of Items
.795 4
Item-Total Statistics
Scale Mean if
Item Deleted
Scale Variance
if Item Deleted
Corrected Item-
Total
Correlation
Cronbach's
Alpha if Item
Deleted
The company is ready and
willing to respond to
customer needs.
10.10 5.266 .740 .670
The website has reasonable
shipping and handling costs. 9.83 7.937 .409 .826
Customer service personnel
are always willing to help
you.
10.03 6.240 .616 .739
Inquiries are answered
promptly. 10.23 5.357 .686 .702

__________________________________________________________________________________
__________________________________________________________________________________
page 98 of 106
APPENDIX B4: PILOT TEST ON ATMOSPHERIC/ EXPERIENTIAL
Case Processing Summary
N %
Cases
Valid 30 100.0
Excludeda 0 .0
Total 30 100.0
a. Listwise deletion based on all variables in the
procedure.
Scale Statistics
Mean Variance Std. Deviation N of Items
7.17 2.971 1.724 2
Reliability Statistics
Cronbach's
Alpha
N of Items
.706 2
Item-Total Statistics
Scale Mean if
Item Deleted
Scale Variance
if Item Deleted
Corrected Item-
Total
Correlation
Cronbach's
Alpha if Item
Deleted
It is really fun to shop at
this website. 3.30 1.252 .572 .
The site almost says,
¡°come in and shop¡±. 3.87 .671 .572 .

__________________________________________________________________________________
__________________________________________________________________________________
page 99 of 106
APPENDIX B5: PILOT TEST ON E-SHOPPING SASTISFACTION
Case Processing Summary
N %
Cases
Valid 30 100.0
Excludeda 0 .0
Total 30 100.0
a. Listwise deletion based on all variables in the
procedure.
Scale Statistics
Mean Variance Std. Deviation N of Items
10.63 4.447 2.109 3
Reliability Statistics
Cronbach's
Alpha
N of Items
.825 3
Item-Total Statistics
Scale Mean if
Item Deleted
Scale Variance
if Item Deleted
Corrected Item-
Total
Correlation
Cronbach's
Alpha if Item
Deleted
My choice to shop using the
website is a wise idea. 7.03 1.895 .773 .660
I am satisfied with my
decision to shop this
website.
7.17 2.282 .667 .774
I have really enjoyed
shopping from this website. 7.07 2.271 .612 .826

__________________________________________________________________________________
__________________________________________________________________________________
page 100 of 106
APPENDIX B6: PILOT TEST ON E-SHOPPING INTENTION
Case Processing Summary
N %
Cases
Valid 30 100.0
Excludeda 0 .0
Total 30 100.0
a. Listwise deletion based on all variables in the
procedure.
Scale Statistics
Mean Variance Std. Deviation N of Items
6.00 3.586 1.894 2
Reliability Statistics
Cronbach's
Alpha
N of Items
.847 2
Item-Total Statistics
Scale Mean if
Item Deleted
Scale Variance
if Item Deleted
Corrected Item-
Total
Correlation
Cronbach's
Alpha if Item
Deleted
I intend to use the internet
frequently to shop for
apparel.
3.03 1.137 .739 .
I intend to use the internet
whenever appropriate to do
apparel shopping.
2.97 .930 .739 .

__________________________________________________________________________________
__________________________________________________________________________________
page 101 of 106
APPENDIX C
APPENDIX C1: RELIABILITY TEST ON PRIVACY/ SECURITY
Case Processing Summary
N %
Cases
Valid 384 100.0
Excludeda 0 .0
Total 384 100.0
a. Listwise deletion based on all variables in the
procedure.
Scale Statistics
Mean Variance Std. Deviation N of Items
17.23 16.237 4.030 5
Reliability Statistics
Cronbach's
Alpha
N of Items
.902 5
Item-Total Statistics
Scale Mean if
Item Deleted
Scale Variance
if Item Deleted
Corrected Item-
Total
Correlation
Cronbach's
Alpha if Item
Deleted
I feel like my privacy is
protected at this site. 13.80 10.972 .692 .894
I feel safe in my
transactions with this
website.
13.83 10.184 .832 .864
I feel I can trust this
website. 13.72 10.197 .824 .865
The website has adequate
security features. 13.76 10.617 .797 .872
The company behind the
site is reputable. 13.84 11.260 .641 .905

__________________________________________________________________________________
__________________________________________________________________________________
page 102 of 106
APPENDIX C2: RELIABILITY TEST ON WEBSITE DESIGN
Case Processing Summary
N %
Cases
Valid 384 100.0
Excludeda 0 .0
Total 384 100.0
a. Listwise deletion based on all variables in the
procedure.
Scale Statistics
Mean Variance Std. Deviation N of Items
10.75 5.311 2.304 3
Reliability Statistics
Cronbach's
Alpha
N of Items
.825 3
Item-Total Statistics
Scale Mean if
Item Deleted
Scale Variance
if Item Deleted
Corrected Item-
Total
Correlation
Cronbach's
Alpha if Item
Deleted
The site does not waste my
time. 7.15 2.555 .646 .795
I can go to exactly what I
want quickly. 7.19 2.377 .752 .684
The organization and layout
of the web site facilities
searching for products.
7.16 2.769 .650 .788

__________________________________________________________________________________
__________________________________________________________________________________
page 103 of 106
APPENDIX C3: RELIABILITY TEST ON CUSTOMER SERVICE
Case Processing Summary
N %
Cases
Valid 384 100.0
Excludeda 0 .0
Total 384 100.0
a. Listwise deletion based on all variables in the
procedure.
Scale Statistics
Mean Variance Std. Deviation N of Items
13.79 9.425 3.070 4
Reliability Statistics
Cronbach's
Alpha
N of Items
.840 4
Item-Total Statistics
Scale Mean if
Item Deleted
Scale Variance
if Item Deleted
Corrected Item-
Total
Correlation
Cronbach's
Alpha if Item
Deleted
The company is ready and
willing to respond to
customer needs.
10.37 5.356 .730 .772
The website has reasonable
shipping and handling costs. 10.21 6.402 .550 .847
Customer service personnel
are always willing to help
you.
10.35 5.304 .696 .788
Inquiries are answered
promptly. 10.44 5.275 .725 .774

__________________________________________________________________________________
__________________________________________________________________________________
page 104 of 106
APPENDIX C4: RELIABILITY TEST ON ATMOSPHERIC/ EXPERIENTIAL
Case Processing Summary
N %
Cases
Valid 384 100.0
Excludeda 0 .0
Total 384 100.0
a. Listwise deletion based on all variables in the
procedure.
Scale Statistics
Mean Variance Std. Deviation N of Items
7.24 3.004 1.733 2
Reliability Statistics
Cronbach's
Alpha
N of Items
.838 2
Item-Total Statistics
Scale Mean if
Item Deleted
Scale Variance
if Item Deleted
Corrected Item-
Total
Correlation
Cronbach's
Alpha if Item
Deleted
It is really fun to shop at
this website. 3.55 1.000 .729 .
The site almost says,
¡°come in and shop¡±. 3.70 .745 .729 .

__________________________________________________________________________________
__________________________________________________________________________________
page 105 of 106
APPENDIX C5: RELIABILITY TEST ON E-SHOPPING SATISFACTION
Case Processing Summary
N %
Cases
Valid 384 100.0
Excludeda 0 .0
Total 384 100.0
a. Listwise deletion based on all variables in the
procedure.
Scale Statistics
Mean Variance Std. Deviation N of Items
10.65 4.787 2.188 3
Reliability Statistics
Cronbach's
Alpha
N of Items
.875 3
Item-Total Statistics
Scale Mean if
Item Deleted
Scale Variance
if Item Deleted
Corrected Item-
Total
Correlation
Cronbach's
Alpha if Item
Deleted
My choice to shop using the
website is a wise idea. 7.09 2.043 .792 .796
I am satisfied with my
decision to shop this
website.
7.06 2.377 .754 .830
I have really enjoyed
shopping from this website. 7.14 2.361 .740 .841

__________________________________________________________________________________
__________________________________________________________________________________
page 106 of 106
APPENDIX C6: RELIABILITY TEST ON E-SHOPPING INTENTION
Case Processing Summary
N %
Cases
Valid 384 100.0
Excludeda 0 .0
Total 384 100.0
a. Listwise deletion based on all variables in the
procedure.
Scale Statistics
Mean Variance Std. Deviation N of Items
6.60 3.326 1.824 2
Reliability Statistics
Cronbach's
Alpha
N of Items
.862 2
Item-Total Statistics
Scale Mean if
Item Deleted
Scale Variance
if Item Deleted
Corrected Item-
Total
Correlation
Cronbach's
Alpha if Item
Deleted
I intend to use the internet
frequently to shop for
apparel.
3.32 .923 .757 .
I intend to use the internet
whenever appropriate to do
apparel shopping.
3.28 .970 .757 .