factors affecting mobile gaming adoption - a study of...
TRANSCRIPT

Factors Affecting Mobile Gaming Adoption - A Study ofChinese Users and Contexts
Marketing
Master's thesis
Tianyi Pan
2011
Department of MarketingAalto UniversitySchool of Economics

AALTO UNIVERSITY SCHOOL OF ECONOMICS ABSTRACT Department of Marketing Master’s Thesis September 4, 2011 Tianyi Pan FACTORS AFFECTING MOBILE GAMING ADOPTION – A STUDY OF CHINESE USERS AND CONTEXTS Objective of the Study The objective of the study was to discover the main factors affecting mobile gaming in the Chinese context. The theoretical base of the study was built on the Technology Acceptance Model (TAM) and its later revisions. Special attention was paid on recent TAM studies on mobile gaming in China or other East Asian areas. In addition, to bring the TAM theory closer to marketing applications, the study produced clusters from the respondent data in order to identify different consumer segments and divide the users into them. Methodology The data for the study was collected in the spring of 2011 through a quantitative online survey, which was distributed on a Finnish game company’s Chinese microblog sites and other relevant Chinese online channels. A total of 492 usable responses were obtained for further analysis. Four main analytical methods were used in the study: factor analysis, regression analysis, cluster analysis and cross-tabulation. Findings and Conclusions The study identified four key factors that affect mobile gaming adoption in China: Perceived Ease of Use, Perceived Enjoyment, Social Influence and Flow. Of these factors, perceived enjoyment had the largest effect on adoption, followed by social influence, flow and lastly, ease of use. The factors also seemed to interact with each other. For example, social influence has a strong effect on perceived enjoyment, and the link between perceived enjoyment and flow is also very strong. Marketing-wise, the cluster analysis identified five user or potential user segments. Their profiles were interpreted based on the clustering solutions and additional cross-tabulation with background variables age, gender, experience and use context. Keywords 3G, China, mobile gaming, mobile internet, mobile services, segmentation, smartphones, TAM, Technology Acceptance Model, technology adoption

1
Table of Contents
1 Introduction .............................................................................................................................................. 4
1.1 Overview of the past studies in the field ............................................................................... 5
1.2 Research questions and the structure of the thesis .......................................................... 7
2 Models on Technology Acceptance .................................................................................................. 9
2.1 Origins of Technology Acceptance Models ........................................................................... 9
2.2 First Major Extension: TAM2 and Social Influence ......................................................... 11
2.3 Second Extension: Unified Theory of Acceptance and Use of Technology
(UTAUT) .................................................................................................................................................. 14
3 Additional Relevant Studies ............................................................................................................. 18
3.1 Mobile Services Adoption Studies ......................................................................................... 18
3.2 Specific Studies on Mobile Games ......................................................................................... 21
3.3 Flow ................................................................................................................................................... 24
3.4 Use Context .................................................................................................................................... 27
4 Theoretical Framework ..................................................................................................................... 30
5 Empirical Study ..................................................................................................................................... 32
5.1 Questionnaire Design ................................................................................................................. 32
5.2 Data Collection .............................................................................................................................. 34
6 Analysis of the Data ............................................................................................................................. 38
6.1 Factor Analysis.............................................................................................................................. 38
6.2 Regression Analysis .................................................................................................................... 41
6.3 Cluster Analysis ............................................................................................................................ 42
6.4 Cross-tabulation ........................................................................................................................... 45
6.5 Reliability and Validity .............................................................................................................. 47
7 Findings.................................................................................................................................................... 51
7.1 Factors and Surrogate Variables ............................................................................................ 52
7.2 Regression Analysis with Adjusted Theoretical Framework ..................................... 56
7.3 Segmentation Using Cluster Analysis and Cross-Tabulation ...................................... 58
7.3.1 The Five Cluster Solution and Cluster Means ........................................................... 58
7.3.2 Cross-Tabulation with Gender ....................................................................................... 60
7.3.3 Cross-Tabulation with Age Groups ............................................................................... 61

2
7.3.4 Cross-Tabulation with Experience ............................................................................... 62
7.3.5 Cross-Tabulation with Use Context .............................................................................. 63
8 Conclusions ............................................................................................................................................. 66
8.1 Results .............................................................................................................................................. 67
8.2 Theoretical and Managerial Implications........................................................................... 69
8.3 Limitations and Suggestions for Future Research .......................................................... 70
References .................................................................................................................................................. 72
Appendix A: Survey Questionnaire (English) ............................................................................... 76
Appendix B: Survey Questionnaire (Chinese) .............................................................................. 78
List of Figures and Tables
Figure 1: The earliest Technology Acceptance Model ............................................................... 10
Figure 2: TAM2 ......................................................................................................................................... 13
Figure 3: Unified Theory of Acceptance and Use of Technology (UTAUT) ........................ 15
Figure 4: The evolution of fundamental Technology Acceptance Models in the past
two decades ............................................................................................................................................... 17
Figure 5: Elements in recent studies on technology acceptance ........................................... 21
Figure 6: Partial framework of mobile gaming ............................................................................ 24
Figure 7: Most people play mobile games in their homes. From the survey on
Chinese Mobile Gaming Users (Analysys 2010) .......................................................................... 29
Figure 8: Theoretical framework of the present master’s thesis .......................................... 30
Figure 9: Scree plot ................................................................................................................................. 40
Figure 10: The use of dendrograms. ................................................................................................. 45
Figure 11: Visual clustering solution choice with five relatively equal clusters ............. 46
Figure 12: The suggested theoretical framework from Chapter 6 with proposed
adjustments ................................................................................................................................................ 52
Figure 13: Simplified theoretical framework with results of regression analysis ......... 56
Figure 14: The final model: Four factors and one dependent variable............................... 67
Table 1: Respondent demographics ................................................................................................. 36
Table 2: Eigenvalue and cumulative % of variance explained .............................................. 40

3
Table 3: Reliability analysis ................................................................................................................. 48
Table 4: Convergent validity................................................................................................................ 50
Table 5: Discriminant validity ............................................................................................................. 50
Table 6: Factor loading table ............................................................................................................... 53
Table 7: Cluster means of the factor analysis results ................................................................ 59
Table 8: Cross-tabulation with gender ............................................................................................ 60
Table 9: Cross-tabulation with age groups .................................................................................... 62
Table 10: Cross-tabulation with experience ................................................................................. 63
Table 11: Cluster means of Use Context and cross-tabulation of contextual locations . 64
Table 12: Summary of the suggested segment profiles ............................................................ 65

4
1 Introduction
In the recent years, the mobile industry as a whole has been growing at an
increasing pace (Liu & Li 2011). Despite the recent downturn following the global
financial crisis in 2008, the mobile industry has stayed relatively unscathed. With
the so-called smart phone revolution, where advanced mobile devices are starting
to see mass-adoption, the demand for more sophisticated mobile services is on the
rise. Indeed, the year 2010 saw strong demand growth, while the overheating sales
figures of high-end smart phones were only hindered by the limited manufacturing
capacity of some critical components such as touch-based displays (Wilson 2010).
As the component manufacturers are scrambling to ramp up production scale to
meet the increasing demand, we can expect to see the industry trend going
forward on the same pace in 2011. Yet, growth may slow down amid fears of a new
economy downturn looming ahead (IDC 2011).
In addition to the mobile industry, one particular geographical area in the world
also survived the last global financial crisis pretty much unharmed, China. When
talking about mobile technology, however, China has lagged behind the western
world. The first 3G service was launched as late as January 2009, and even in 2010,
the 3G penetration rate1 in China was only around 5.5%, although the growth is
still strong (Shen 2011). On the other hand, this means there is huge potential on
mobile internet services adoption. According to Liu and Li (2010), China may soon
be expected to form the single largest mobile internet market in the world.
Speaking of mobile services in China, Liu and Li (2011) further highlight that Asian
users in general, and the Chinese in particular, have a strong tendency for adopting
mobile hedonic services. The concept is further explained in Section 1.1 below. As
the section details, much of the previous research on mobile internet and gaming
adoption approaches the phenomenon from the information systems (IS) science
point of view, building and validating models. The major reason for this is because
1 The number of 3G subscribers compared to all mobile subscribers
5
the theoretical basis of the research stream also comes from the IS discipline.
However, from the marketing perspective, there is an opportunity to incorporate
additional research directions, such as consumer segments, into the studies on
adoption.
1.1 Overview of the past studies in the field
Before moving on, a clear understanding of what mobile gaming actually is needs
to be established. Liang and Yeh (2011, 188) define mobile game as “a video game
played on mobile devices, including mobile phones, smart phones, PDA’s or
handheld computers”. However, as handheld gaming has existed for such a long
time in the form of Gameboys, Tetrises and other small devices, the phenomenon is
not very new anymore. Thus, the present thesis applies an even stricter definition,
where, mobile gaming is understood as the form of gaming introduced by the new
smart phone categories. Following this interpretation, mobile games are purchased
or downloaded from online digital application stores, without ever taking any
physical forms in the distribution chain.
Currently the research on mobile industry and mobile gaming in East Asia or China
has largely consisted of studies on the factors affecting mobile services adoption
(Liu & Li 2010; 2011; Lu et al. 2008; Qi et al. 2009, for example). On the other hand,
some studies have also tackled the issue of loyalty (Deng et al. 2010; Zhou et al.
2010). A common foundation of all the studies in this field is the Technology
Acceptance Model (TAM) and many of its variations and applications.
Originally introduced by Fred Davis as early as in the 1980s, the Technology
Acceptance Model sought to measure the willingness of people to accept and adopt
new information technology innovations of that era, such as the electronic mail
systems (Davis 1989). The model had two main determinants which explained IT
adoption: Perceived Usefulness and Perceived Ease of Use. Obviously, as more
and more studies referred and continued Davis’s (1989) line of research, the model
received extensions and additions. Davis himself was involved in the two

6
subsequent iterations of the model, TAM2 (Venkatesh & Davis 2000) and UTAUT
(Venkatesh et al. 2003). These studies included new elements such as Social
Influence and introduced background variables like age and gender that
moderated the effects of the determinants.
As to more recent studies with an oriental focus, especially on mobile industry, we
can mention Lu et al. (2007), who studied whether a TAM-based model is
applicable in the Chinese context. Qi et al. (2009) also sought to expand the original
TAM to take into account China-specific factors. One of the additions to the model
Qi et al. (2009) introduced is the concept of Flow experience. They described it as
something that made people completely concentrated in an activity, detaching
themselves from everything around them. Later, Zhou et al. (2010) adopted the
concept of flow and use it to explain loyalty to a specific case of mobile internet
service: social networking sites. Furthermore, two of the three researchers in that
study (Liu & Li 2011) continued the line of research in their recent article on
mobile hedonic services, as mentioned above, and introduced further additional
determinants such as Perceived Enjoyment.
The concept of hedonic services contains a wide range of entertainment such as
games, books, music and video. Liu and Li (2011) showed that Use Context and
cognitive concentration – which is essentially the same as flow – are significant
factors of mobile gaming adoption in the version of TAM they used. One of the
potential topics for future research, according to Liu and Li (2011, 897), is “a
further evaluation of actual use [of mobile games]” instead of just the intention to
use. The researchers concluded that China and other Asian countries are unique in
mobile use context because an urban citizen’s life there is typically marked by long
commutes in crowded bus, metro or train cars with a lot of idle time. This creates
an ideal situational context for escapist and hedonic behavior, such as mobile
gaming.
In addition to the fertile research avenue opened by previous studies, the whole
research topic, mobile gaming adoption, stands at the very interesting crossroads
between the information systems sciences and the marketing discipline, as

7
mentioned above. The influence of the IS sciences is prominent in the TAM
literature, but lately, mobile gaming has also increasingly become a phenomenon
that touches marketing. As such, the traditional TAM research is not able to cater
the needs of marketers, but the present thesis introduces new methods of analysis
(in the context of TAM research) such as cluster analysis and cross-tabulation.
These methods can bridge the gap, at least to some extent. The methodology is
discussed in more detail in Chapter 6. Next, we take a look at the overall goals of
the thesis.
1.2 Research questions and the structure of the thesis
Based on the theoretical foundation, this thesis aims to answer Liu and Li’s (2011)
call for further study on mobile gaming in China and bridge the gap between
marketing and information systems disciplines. To achieve this, the present thesis
poses one main research question with two supplementary research questions,
described below.
Main research question:
What are the main factors affecting mobile gaming adoption in the Chinese
context?
Supplementary research questions:
How has Technology Acceptance Model evolved in the past two decades into
covering mobile gaming research in China?
What kind of consumer segments the current and potential adopters of mobile
gaming in China can be divided into?
To answer these questions, the thesis is structured into eight chapters. This
introduction chapter serves both as a road map for the reader and as an internal
organizational logic of the thesis and its theoretical and empirical contents.
8
Chapters 2 and 3 construct the theoretical background of the study. They offer a
deeper review of the conceptual base that was briefly presented above, with an
addition of numerous other relevant studies. Chapter 4 summarizes the theoretical
foundation into a single, coherent framework by synthesizing the fundamental
theories with the latest research in the field of mobile adoption. Although some
core concepts of the present study such as TAM are over 20 years old, mobile
gaming is such a young industry and still developing at a breakneck pace.
Therefore, to stay relevant and on top of current issues, extra care is taken to make
sure that the cutting edge of scientific research is represented in the thesis.
Chapters 5 and 6 outline the methodology of the study, starting from the planning
and design of the questionnaire to the methods employed during the analysis of
the data. They include factor analysis, regression analysis, cluster analysis and
cross-tabulation. Chapter 7 presents the findings of the analyses with some
interpretations that can be extracted from the results.
Finally, the concluding Chapter 8 summarizes the results and discusses their
implications, linking back to the research goals presented in this chapter. It also
points out limitations of the current study and suggests directions for future
research.

9
2 Models on Technology Acceptance
Starting from the latest studies in the field of mobile internet or service use and
tracing back at what academic works are being cited, one cannot miss the
numerous references to Technology Acceptance Model, or TAM (Liu & Li 2011;
Zhou et al. 2010; Qi et al. 2009; Lu et al. 2008; Venkatesh et al. 2003, for example).
TAM was first developed by Fred D. Davis, an information systems professor at the
University of Michigan in 1989. In the early 21st century, the model was followed
by additions and extensions, most notably TAM2 (Venkatesh & Davis, 2000) and
UTAUT, or the Unified Theory of Acceptance and Use of Technology (Venkatesh et
al. 2003).
These subsequent extensions not only underlined the influence of the original
model, but took it further to the levels that even started to draw criticisms over
their complexity (van Raaij & Schepers 2008; Bagozzi 2007, for example). Recently,
papers on mobile adoption and usage often use one or some of the above models
as their starting point, adding minor revisions to suit the specific needs of the
studies (Liu & Li 2010; Ha et al. 2007; Lu et al. 2007, among others), as we later see
in Chapter 3. However, as a key theory influencing the development of a whole line
of research, we should first take a closer look at the conception of the original TAM.
2.1 Origins of Technology Acceptance Models
In his seminal work, Davis (1989) postulated two fundamental determinants, or
beliefs, people consider when adopting a technological innovation: Perceived
Usefulness (PU) and Perceived Ease of Use (PEOU). He defined them as “the
degree to which a person believes that using a particular system would enhance
his or her job performance” and “the degree to which a person believes that using a
particular system would be free of effort”, respectively (Davis 1989, 320). Contrary
to his hypothesis, Davis (1989) reported that the relationship between perceived
usefulness and adoption was significantly stronger than that of between perceived

10
ease of use and adoption. Furthermore, he noted that perceived ease of use might
even precede perceived usefulness, suggesting the existence of a causal
relationship instead of the independence of the determinants. The results seemed
to place the two determinants and usage on a more linear causal chain, as seen in
Figure 1 (Davis 1989, 334).
Figure 1: The earliest Technology Acceptance Model (Davis 1989)
The Figure 1 above suggests an interpretation that respondents tend to consider
the usefulness of a new system before making a decision to use it. However, the
easier the system is perceived to be, the more useful it becomes in the minds of the
people, thus improving the overall perception and leading to increased usage. Still,
there is a certain limitation to how usage is measured in the study, as Davis (1989)
duly stated. In his study, usage was subjective and self-reported, and not based on
any standard measures.
The focus on subjective perceptions in this study might raise questions, but as
Davis (1989) explained it, even if it was possible to objectively measure the
usefulness and ease of use of a system, people would still behave according to their
beliefs. Therefore, perceptions, or beliefs, should be studied as direct determinants
of behavior, not as intermediary measures of some objective and unobtainable
“truths”. However, Sharma et al. (2009) argued that because the measurements in
TAM are behaviorally and perceptually anchored, and individual variables are
measured using the same methods, the resulting correlations are actually inflated
by what is called the common method variance. The common method variance
describes a situation when the measurement errors in individual scales also

11
covary, adding into the overall correlation score, and according to Sharma et al.
(2009), it threatens the validity of as much as half of the current TAM literature.
They suggested using multiple and different methods to measure a scale,
something that Davis’s (1989) methods lacked at that time.
Still, one of the merits and perhaps the main reasons that elevated Davis’s (1989)
theory to its ubiquitous position was his carefully refined set of questions and
scales for measuring the beliefs. He also described the steps in a painstakingly
detailed manner. Initially, 14 questions were asked for each determinant, in order
to obtain the respondents’ perceptions on them. Through two series of
development, pre-testing and study iterations, the number of scale items was
downsized to ten for each determinant. Additionally, some wordings were
adjusted and a few questions were replaced with new ones to improve relevancy.
The final set of questions then became the framework in the studies on technology
acceptance for years to come (Venkatesh & Davis 2000), as can be witnessed from
the sheer number of references to TAM in the literature (see the beginning of
Section 2.2 below). However, in a very recent study, Verdegem and Marez (2011)
criticized the “openness” of the model that allows other researchers to add their
own determinants and thus fragmenting the research body. There are also other
criticisms, especially towards the complexities of the later evolutions of the model,
which are discussed in more detail in Section 2.3.
2.2 First Major Extension: TAM2 and Social Influence
Despite the fact that TAM held its place for over a decade, time was soon ripe for a
small facelift. In 2000, Davis collaborated with Professor Viswanath Venkatesh to
bring about the first overhaul of his original theory. In their new research paper,
Venkatesh and Davis (2000) noted that by the start of the new millennia, Davis’s
TAM was already being cited in over 420 journal articles and its initial findings
held somewhat consistently in subsequent studies. However, popularity of the
model did not stop the authors from introducing a series of extensions to it in
2000, naming the resulting framework simply as TAM2.

12
Indeed, Venkatesh and Davis (2000) introduced two sets of additional processes in
TAM2 compared to the previous model: Social Influence (SI) process and
cognitive instrumental process. Social influence originates from the concept of
subjective norm in the Theory of Reasoned Action (Fishbein & Ajzen 1975), which
is a theory in the discipline of social psychology. Fishbein and Ajzen (1975, 302)
described subjective norm as “person’s perception that most people who are
important to him think he should or should not perform the behavior in question”.
The irony is that TRA, in turn, was one of the references for Davis’s (1989) original
TAM. In that first version of the model, however, he decided to leave the social
aspect out of the model, only for it to make a full circle to being recognized again
(Venkatesh & Davis 2000). For example, social influence later also appeared in the
article by Venkatesh et al. (2003). Cognitive instrumental process, on the other
hand, turned out to be an addition that did not survive the test of time and,
consequently, did not appear in any relevant subsequent studies. Figure 2 details
the full TAM2 with the additional elements built around the original TAM.
The findings of the Venkatesh and Davis (2000) study show that the old theory still
holds for the modern times, while the additional processes improve the
explanatory ability of the model, and that especially the concept of subjective norm
yields some interesting results. According to the study, during the time between
TAM and TAM2, the original model typically managed to explain consistently about
40% of the variance in usage (both intentions and actual) when applied in the
numerous studies that cited it. The new model with its multiple antecedents,
however, explained a range of 37-52% of the usage variance, so the results suggest
some improvement from the old model.

13
Figure 2: TAM2 (Venkatesh & Davis 2000)
In addition to confirming prior research outcomes, the most significant finding
(also considering the present thesis) Venkatesh and Davis (2000) reported was
how the social influence played out in the results. Represented mainly by the
subjective norm, it significantly and directly affected usage intentions, but had only
limited effect on perceived usefulness and almost none on ease of use. This
suggests that social influence should be granted a more prominent position in the
model, almost parallel to perceived usefulness. Additionally, since the study
consisted of longitudinal data as well, the social effect could be studied over time.
The time-series data revealed that when first coming into contact with a new
system, people relied more on social information to form their perceptual beliefs.
However, as their familiarity of the system grew, the importance of social influence
decreased.
In light of the importance and relevance of the social effect, it is curious that the
researchers did not change the model accordingly. Perhaps because the effect of
the subjective norm on intention to use was moderated by whether the use is
mandatory (significant effect) or voluntary (less significant effect), Venkatesh and
Davis (2000) chose to leave the factor in the peripheral of the model. The

14
inconsistent effect was certainly a limitation, but it does not mean that subjective
norm, and by extension, social influence is not an important factor, nevertheless.
2.3 Second Extension: Unified Theory of Acceptance and Use of
Technology (UTAUT)
In 2003, Davis once again collaborated with Venkatesh to build the most
comprehensive model ever in “this mature stream of research” (Venkatesh et al.
2003, 470). This time, they also had two additional researchers contributing into
the paper: Michael Morris and Gordon Davis. The aim of the UTAUT model was to
conduct a broad literature review of eight separate models and corporate them
into a single model. (Venkatesh et al. 2003.)
The end result of the UTAUT model, as shown in Figure 3, resembled that of the
TAM2, but there were also new variables. The authors also changed some of the
names of the items in the model. However, in general, the basic idea was the same.
Parentheses are used here to highlight the corresponding items in previous
models. The four main factors in UTAUT were named as performance expectancy
(similar to PU), effort expectancy (similar to PEOU), social influence and facilitating
conditions (Venkatesh et al. 2003). Of these four factors, it was proposed, the first
three lead to behavioral intention. Behavioral intention, on the other hand, affects
usage together with the fourth factor, facilitating conditions. In addition, wrapped
around the central parts of the model were four moderating elements: gender, age,
experience and voluntariness of use.
As can be seen from Figure 3, the UTAUT streamlined the social influence concepts
presented in TAM2 and moved some of the elements such as experience and
voluntariness of use into background variables (moderating effects). However, the
way these moderating effects were predicted to selectively affect in the UTAUT
model is left without explanation. Also, the complex nature of different
relationships drew many criticisms, which are discussed in more detail later this
section.

15
Figure 3: Unified Theory of Acceptance and Use of Technology (UTAUT, Venkatesh et al.
2003)
Despite criticisms, Venkatesh et al. (2003) confirmed that conceptually, UTAUT
was able to represent the majority of the eight separate models which formed its
basis. The findings were also in line with prior research, noting that performance
expectancy (the equivalent of perceived usefulness) was the most important
predictor of intention. The paper also further underlined the importance of social
influence, introduced in TAM2, with similar results to the earlier study by
Venkatesh and Davis (2000).
However, while the UTAUT model was a further improvement from TAM2, there
were still clear limitations and even drawbacks that came with the added
complexity. Although UTAUT reportedly explained up to 70% of variance in usage,
one of the limitations the authors reported has to do with the practicalities and the
way the analysis was conducted: According to Venkatesh et al. (2003), they only
used those research questions, whose answers carried most weight in analyzing
each of the core constructs (eg. performance expectancy, effort expectancy etc.).
What this effectively meant is that sometimes the richer and more diverse items in

16
one or more of the eight underlying models were discarded due to their limited
impact, thus resulting in lesser representativeness and validity of the findings.
The increasing complexity with each revision of the model was also starting to
attract vocal criticisms towards it. In 2007, Bagozzi (2007) recognized the wide
adoption of Davis’s (1989) original model and its later extensions, but at the same
time pointed out several shortcomings. One of the points he made was the fact that
the latest UTAUT revision adds so many different variables that it made the whole
model difficult to use. Although Bagozzi’s (2007) criticisms on the victory march of
TAM should be taken with a grain of salt (as he cites 30 prior articles by himself in
the article!), his core claim was still valid: the model had become somewhat too
large and difficult to grasp.
A year later, van Raaij and Schepers (2008) further criticized that in trying to
incorporate multiple models into one, UTAUT actually became a complex system
whose individual constructs (specifically social influence and facilitating
conditions) were combinations of too many different factors and therefore
representative of none. They also claimed that the 70% explanatory power is only
achieved by introducing the moderating elements, so inherently the model was not
much better than TAM or TAM2. Accordingly, van Raaij and Schepers (2008) ended
up using a modified version of TAM2 instead of the UTAUT model as the basis of
their own study on technology acceptance.
However, not all feedback has been as negative as shown above. Despite having
been critical towards the diverse body of whole TAM research, as mentioned in
Section 2.1, Verdegem and Marez (2011) commended the UTAUT model for being
robust and relevant in the terms of bridging the theoretic and the empirical world.
Chapter 2 offered a brief overview on the historical development of the
Technology Acceptance Models, starting from the invention of the model by Fred
Davis in the late 1980s up until its latest iterations in the 21st century, as can be
seen from Figure 4. In addition, some of the criticisms towards the models,
especially the later iterations, were presented. From the van Raaij and Schepers
(2008) paper discussed above, we can conveniently segue into Chapter 3 with

17
other recent studies that incorporate some variant of the Technology Acceptance
Model and, due to the focus of the present thesis, are conducted within the context
of China or East Asia.
Figure 4: The evolution of fundamental Technology Acceptance Models in the past two
decades
TAM (Davis 1989)
TAM2 (Venkatesh & Davis 2000)
UTAUT (Venkatesh et al. 2003)

18
3 Additional Relevant Studies
In the previous chapter, we looked at the Technology Acceptance Model and its
historic evolution. Now, the emphasis is put on studies related to mobile device
and service usage in general and specifically on mobile gaming, with an added
focus on the Chinese or East Asian territories. Even with such constraints, the field
of study is still quite broad, including the adoption of mobile internet (Liu & Li
2010) and data services (Lu et al. 2007; Lu et al. 2008; Qi et al. 2009), mobile
virtual communities (Zhang et al. 2010), mobile social networking sites (Zhou et al.
2010) and, finally, mobile games (Ha et al. 2007; Liu & Li 2011). Some of the
studies mentioned above incorporated concepts or theories that did not belong to
the original TAM repertoire, but which are also relevant to the present thesis.
Although they are covered in passing during the discussion in the first two sections
of this chapter, they are also further detailed in their own separate two sections
later on.
3.1 Mobile Services Adoption Studies
Regarding mobile internet adoption, Liu and Li (2010) quite interestingly mixed
the original TAM with Rogers’s (1962) theory on the diffusion of innovations in
their study. Mobile internet was defined as a ubiquitous access to the internet on a
mobile device. In the study, the respondents were divided into five different stages
of innovation adoption following the theory: innovators, early adopters, early
majority, late majority and finally, laggards. From the point of view of the present
thesis, the researchers added two interesting determinants into TAM: Use Context
(UC) and Perceived Enjoyment (PE). Of these two, perceived enjoyment turned
out to be a significant predictor of mobile internet use across all innovation stages,
while use context was only significant during the first two stages (innovators and
early adopters). In the later stages, other indicators such as compatibility and
complexity tended to have more effect on adoption rate. Use context is covered in
more detail in Section 3.4.

19
Qi et al. (2009) also studied mobile data services adoption in China. Their
definition of mobile data services was rather broad, covering all sorts of activities
from using messaging services to browsing the internet and even watching online
TV and videos. In many ways, what they focused on was similar to that of mobile
internet use in Liu and Li’s (2010) study. Qi et al. (2009) used the original TAM
coupled with a new experience factor in their analysis. Within the experience
factor, there was one item, Flow, which was clearly separated from other
experience types. Flow was defined as a state of extreme concentration, when the
person is facing a high but optimal level of challenge. The authors reported a
significant flow effect on both the attitudes towards and the intentions to use. The
general research on flow was mainly carried out by Csikszentmihalyi (see
Csikszentmihalyi & LeFevre 1989, for example), although in the article, he was
curiously misspelled as Caltabianol. Csikszentmihalyi’s flow theory is covered in
greater depth in Section 3.3.
Lu et al. (2007; 2008) also examined mobile data services in China. They
incorporated social influence and other determinants into the UTAUT-based
framework (where PU and PEOU were replaced by performance and effort
expectancies, as discussed in Section 2.3). However, social influence turned out to
be an insignificant determinant in their studies. In the first study (Lu et al. 2007),
when only the relationship between social influence and performance expectancy
(perceived usefulness) was investigated, it measured insignificant. Furthermore, in
their second study (Lu et al. 2008), when the researchers added the relationship
between social effects and the intention to use into review, the new relationship
was in fact significant, but negative! This may suggest that negative user
experience heard from friends can have a strong effect. However, the researchers
acknowledged there might be some limitations to interpretation due to the way
the questions were set in this particular study.
Contradictory to the findings by Lu et al. (2007; 2008), the Zhang et al. (2010)
study on virtual communities in both China and Korea reported that social
influence, as discussed in Section 2.2, had a significant effect on use intention.
Obviously we must consider the difference in the nature of these studies. While Lu

20
et al. (2007; 2008) studied mobile data services in general, Zhang et al. (2010)
concentrated more on communities and social interactions. Accordingly, Zhang et
al. (2010) also modified perceived enjoyment described by Liu and Li (2010) into a
similar concept called perceived playfulness. Although their study concentrated on
virtual communities and not games per se, they noted that people join these
communities for entertainment and joy, similar reasons they would play a game.
Thus, with regard to games, playfulness should be a strong predictor of adoption.
In their study, however, Liu and Li (2010) were assuming an indirect effect,
modeling playfulness to first affect perceived usefulness, and the perceived
usefulness to affect the intention to use subsequently. With regard to Rogers’s
(1962) theory on innovation adoption, the authors suggested that in the later
stages, when a service has become ubiquitous and its usefulness is no longer
disputed, the impact of perceived usefulness will dilute. Their findings seem to be
consistent with their hypothesis, although it is difficult to imagine a mobile service
that had really reached a maturity stage still in 2010.
The flow research was once again cited in the study on mobile social networking
sites by Zhou et al. (2010), who were especially interested in the effect of flow on
users’ loyalty. The study actually did not directly use TAM or any of its successors
described above, although the theories were briefly reviewed in the beginning.
Instead, Zhou et al. (2010) decided to harness something they call the Information
Systems Success Model (ISSM), by DeLone and McLean (2003). It is an alternative
to the Technology Acceptance Model, and its starting point is not user perception
but quality. The main determinants in the basic ISSM are system quality and
information quality. DeLone and McLean (2003) argued that these determinants
lead to both increased use and user satisfaction.
The reason why Zhou et al. (2010) used the ISSM might be the interest in loyalty in
their study. On one hand, satisfaction is built in to the model by default and on the
other hand, satisfaction is known to be one of the precursors to customer loyalty.
Thus, the choice of this model seems justified. The results of the study suggest that
information and system quality tend not to lead directly to the flow experience, but

21
rather affect it through enhancing the user’s trust to the system. Moreover, flow
seems to be a significant determinant in creating customer loyalty. Loyalty, on the
other hand, tends to result in increased repeat purchase and use activities, and is
therefore important to the present thesis as well. Actually, in light of previously
presented theories, loyalty can be interpreted as elevated intentions to use and
increased use behavior.
Figure 5 combines some of the most highlighted and often used elements in the
studies above. Note that the resulting image is not a full theory as is the case with
Figures 1-3, but only a suggested building block in a larger theoretical framework.
For the full theoretical framework, please see Chapter 4.
Figure 5: Elements in recent studies on technology acceptance (adapted from Lu et al. 2007;
2008; Qi et al. 2009; Liu & Li 2010 and Zhang et al. 2010, with additional theories by
Csikszentmihalyi & LeFevre 1989 and DeLone & McLean 2003)
3.2 Specific Studies on Mobile Games
Finally, the review on research that features Technology Acceptance Models
concludes with three studies that are directly related to mobile games in East Asia
and China specifically. First, Ha et al. (2007) carried out a straightforward research
to find the determinants of mobile (wireless) games adoption. Although the paper
never mentioned it explicitly, the study seemed to be conducted in South Korea,

22
based on where the authors come from. Second, Liang and Yeh (2011) were
interested in the effects of use contexts on mobile gaming in Taiwan. Third, Liu and
Li (2011) also examined in a very recent paper the effects of use context on the
adoption of mobile gaming, but instead of Taiwan, their research was conducted in
mainland China.
The Ha et al. (2007) study used the basic Technology Acceptance Model with four
additional determinants: perceived enjoyment, perceived attractiveness, perceived
lower sacrifices and, similarly to some studies we have discussed earlier, the flow
experience. Contrary to most of the studies reviewed earlier, it only measured
attitude as the affected construct, completely ignoring intentions and actual use. As
in the earlier Liu and Li (2010) study, perceived enjoyment was a strong predictor
of attitude, in this case. However, the effect of perceived ease of use on perceived
enjoyment was even stronger. This implies that when a game is perceived to be
easy to use (or play), the perceived enjoyment will increase. Perceived enjoyment
also seemed to affect the flow experience significantly, although the causal link
from flow to attitude was reported to be weaker.
Unlike Ha et al. (2007), Liang and Yeh (2011) did not only measure attitude, but
also intention. From the antecedents’ perspective, they used the familiar perceived
ease of use concept but had changed usefulness into playfulness. Besides these
items, subjective norm was also regarded as an antecedent to intention. Use
context was seen as having moderating effects on the relationships between other
items and intention. The findings of the Liang and Yeh (2011) study indicate a
significant relationship along the path of ease of use – playfulness – attitude –
intention. As discussed earlier in this thesis, subjective norm and the whole social
influence aspect seemed to lead to contradictory outcomes between studies, and
here, it did not measure to have a significant effect on intention.
Even fresher article than the previous one, Liu and Li’s latest study (2011) on
mobile gaming in China represents one of the newest within this stream of
research. Their research model, also derived from a very basic TAM framework,
featured the usual elements, perceived ease of use and usefulness, with added

23
determinants of perceived enjoyment, cognitive concentration and use context,
many of which we have already seen being measured in previous studies. Cognitive
concentration was Liu and Li’s (2011) new, albeit limited way to describe flow
experience (Csikszentmihalyi & LeFevre 1989).
The five determinants in Liu and Li’s (2011) theoretical framework were
hypothesized to affect each other and finally have an effect on attitude and
intention to adopt mobile games. Although this study contained many elements of
the Ha et al. (2007) study, the framework was constructed slightly differently. The
causal relationship from perceived ease of use to perceived enjoyment, for
example, was not investigated here. Therefore, there was no indication on
determine whether it is significant. From those relationships that were
investigated, Liu and Li (2011) highlighted the use context, which seemed to affect
almost all other items in the model. Flow, or rather cognitive concentration, was
also reported to significantly affect perceived enjoyment.
However, there was one major drawback in the Liu and Li (2011) study, especially
considering the prominent role that was given to use context: According to the
survey questionnaire, use context was only explored in terms of whether the
person is bored or having nothing else to do. As we see in Section 3.4 that deals
with use context more thoroughly, the very term implicitly refers to multiple
contextual situations. Thus, use context should be measured through some kind of
multiple-choice instrument. In this regard, the framework in the Liang and Yeh
(2011) study was more nuanced, as it broke down the concept of use context into
two dimensions: place and stress, and measured both dimensions with two scales,
resulting into a 2x2 matrix. Figure 6 suggests a combined representation of the
concepts presented in the three studies on mobile gaming discussed above, with
the addition of the framework in seen in Figure 5. Just as the previous Figure, this
framework, too, is only depicted in its partial state and is still missing elements
from the basic Technology Acceptance Models.

24
Figure 6: Partial framework of mobile gaming (adapted from Figure 4, Ha et al. 2007; Liang &
Yeh 2011 and Liu & Li 2011)
As can be seen from Figure 6, the present thesis also suggests solving the use
context problem by extending the respondents’ ability to describe different use
contexts in their answers, similarly to what Liang and Yeh (2011) facilitated in
their research. The added side benefit from this practice is the reduced risk of
common method variance in the correlation data, since use context will be
measured via two separate methods (Sharma et al. 2009). The study design is
further explained in Chapters 5 and 6. The next sections cover in more detail the
two additional concepts that emerged above, flow and use context, both of which
are relevant considering the theoretical framework of the present thesis.
3.3 Flow
The concept of flow has already been briefly touched upon multiple times
previously, but this section details its conception much like Chapter 2 did for TAM.
Besides a short history lesson, more recent studies featuring the flow concept are
discussed, along with commentary on how flow is incorporated in the recent TAM
studies and how the present thesis treats the concept differently compared to
them, at least to some extent.
Flow is a state of mind, an experience of deep concentration, as stated in Section
3.1. The term was coined by Mihaly Csikszentmihalyi, who in 1990 wrote a

25
bestseller book called Flow: The Psychology of Optimal Experience, in which he
presented the central findings from his past few decades of research. He is a
psychology professor, and according to Philip Mirvis who reviewed the book,
Csikszentmihalyi began his research already back in the 1960s as a graduate
student. By the 1980s, his studies had attracted a whole school of followers around
the world (Mirvis 1991).
In 1989, Csikszentmihalyi and Judith LeFevre wrote an article on the effect of flow
in both work and leisure contexts. Although it has been subsequently said that flow
is somewhat elusive or even too broad as a concept (see Hoffman & Novak 2009,
for example), Csikszentmihalyi and LeFevre (1989) suggested that in its basic
form, the flow experience is created by having high enough challenges that can be
matched by high enough skills. From this definition, we can see that flow is related
to the activity of completing tasks. Indeed, the initial reason for the authors to
study flow was to optimize conditions at workplaces. Interestingly, they found that
flow situations occurred three times more often at work than in leisure
(Csikszentmihalyi & LeFevre 1989). However, they stress that because of the very
lenient definitions of flow, the feelings can have very substantial variations across
individuals, thus making the interpretation of the results a bit tricky.
Csikszentmihalyi was not, however, the first one to talk about flow. According to
Ann Jennings (2002), the ideas of the interplay between challenges and skills
originated all the way from Aristotle himself. Jennings (2002) argued that
enjoyment and increasingly higher skill and task levels (essentially, skills and
challenges as defined by Csikszentmihalyi) are all part of the Aristotelian
principles. In her research paper, she described the process of letting students
create an interactive game and the feelings that the task evoked in them. She
proposed that the task or the challenge side needs three qualities to be able to
create flow: clear structure, clear goals and rapid feedback. On the skills side, the
person’s capabilities should be balanced, or matched, with the task goals.
In recent studies on mobile industry, as discussed earlier this chapter, Zhou et al.
(2010) employed the concept of flow in their study on user loyalty. Koufaris

26
(2002) also studied flow in relation to technology adoption, actually combining it
with the Technology Acceptance Model. He proposed three dimensions of flow:
enjoyment, perceived control and attention focus. Zhou et al. (2010) noted that
these three dimensions have been subsequently most often cited in research.
However, the two other authors in Zhou’s team, Liu and Li, later argued in their
own study that since perceived enjoyment was often already included in TAM-
derivatives, it was more important to look at the attention focus side (Liu & Li
2011). Hence, they named the flow aspect as cognitive concentration in their
model, as seen in Section 3.2.
Since Liu and Li (2011) only measured the cognitive concentration aspect in their
study, the present thesis has a bit different approach to flow. First, cognitive
concentration is still recognized as one of the two important antecedents to flow.
Cognitive concentration is understood as the measure for challenge, with the
rationale being: the more challenging the task is, the more concentration is needed.
However, it was unfortunate that Liu and Li (2011) left out Koufaris’s (2002)
perceived control dimension. Recall that according to Csikszentmihalyi and
LeFevre (1989), both challenges and skills needed to be high in order to
experience flow. Therefore, the present thesis proposes to retain the second
antecedent, perceived control, as a measure for skill level. The logic here is that
higher skill levels translate to higher perceived control over the situation.
Finally, the present thesis agrees with Liu and Li (2011) that perceived enjoyment
is already an integral element in studies on gaming (see Ha et al. 2007, for another
example). Thus, it is proposed that perceived enjoyment is actually the outcome of
the two antecedents: perceived high challenge and perceived high skills (control).
Figure 5 in the end of Section 3.2 actually already contains the suggested model as
described here. Concluding the review on flow, the next section takes a detailed
look at how another additional concept not present in original TAM, use context,
affects technology acceptance.

27
3.4 Use Context
Use context, as discussed briefly in Sections 3.1 and 3.2, can be described as the
situational, social and environmental factors that influence the use of technology,
or in the case of the present thesis, mobile gaming. According to Liu and Li (2011),
these influences draw power from the users’ lifestyle backgrounds and hence,
context is more than just location. Mallat et al. (2009) researched the effects of
different use contexts with regard to mobile ticketing adoption in public transit
systems. They concluded that because of the near-ubiquitous nature of mobile
devices, the users are able to benefit from them if, for example, there is an urgency
and no other means to pay for the ticket. The results showed a significant
relationship between use context and perceived usefulness and mobility, while use
context itself was also a significant determinant of intention to use the service.
Liu and Li (2011) argued, partially using results from the Mallat et al. (2009) study,
that use context should indeed be added into the models explaining technology
adoption. However, as mentioned in Section 3.2, the present thesis views the
definition of use context by Liu and Li (2011) falling short of capturing the full
essence of the concept. While they regarded use context to only be the situations
when user is feeling bored and wants to kill time, other researchers have shown
there are alternative meanings to the idea of use context.
Liang and Yeh (2011), for example, employed a more advanced tool to analyze the
moderating effects of use context, as mentioned earlier. They broke down the use
cases of mobile gaming into four different categories along two dimensions: place
(in terms of either home or school/office) and the existence of other pressing tasks
(or stress). This kind of classification is already offering a much deeper view into
the types of use context that can exist, compared to Liu and Li’s (2011) “bored or
not” scale.
The above criticism is not to say that Liu and Li (2011) had too limited a view on
use context. Quite the contrary, in their article, they had described genuinely

28
revealing facts on the specific contextual issues related to the Chinese market. For
the focus of the present thesis, these are very valuable insights. According to them,
China has one of the longest average commuting times in the world and for urban
population, even up to four hour commutes are quite common. During these long
stretches of times, people have very limited accessibility to other means of
entertainment. Perhaps, against this kind of backdrop, the researchers’ eagerness
to only study the boredom of the user can be better understood.
However, as Liang and Yeh (2011) successfully demonstrated, there are other
types of use contexts as well. One way to organize different use contexts can be
found in the Analysys (2010) report on Chinese mobile gaming users. It included a
multiple selection question on where the users were playing mobile games.
Different options included in-class, public and outdoor venues, workplace,
commute, dorm and home and other places. Figure 7 shows the distribution of
spatial contexts according to that study.
Unlike Liang and Yeh’s study (2011), this survey did not ask whether the users
were under stress or not. However, Figure 7 reveals that the most popular place to
play mobile games is not on the move, but in fact, at home. About 28% of
respondents reported playing games during commute, the third most common
situation after number two, which was school dormitory. Note that because of the
multiple choice option, the percentages cannot be summed up to 100%.
For aforementioned reasons, the present thesis approaches the concept of use
context from two distinct directions. First, a more traditional approach is
employed. This part adheres to the survey question set by Liu and Li (2011) and
focuses on the boredom/interestingness and accessibility aspects of use context.
For the second approach, the options in the Analysys (2010) report are introduced
to the respondent as well. For detailed information on the research methods,
please see Chapter 5 and 6. In Chapter 4, all the theories discussed in Chapters 2
and 3 are combined to form the theoretical framework of the present study.

29
Figure 7: Most people play mobile games in their homes. From the survey on Chinese Mobile
Gaming Users (Analysys 2010)

30
4 Theoretical Framework
Combining the original TAM with its later revisions, together with recent
derivatives of it in the field of mobile services and mobile gaming adoption study,
the present thesis suggests a theoretical framework, shown in Figure 8.
Figure 8: Theoretical framework of the present master’s thesis
As can be seen from Figure 8, the theoretical framework seeks to utilize the full
diversity of the research on technology acceptance. On the left side of the
framework, there are background variables, which are strongly influenced by
TAM2 and UTAUT theories (Venkatesh & Davis 2000; Venkatesh et al. 2003). Since
the present thesis is studying mobile gaming, the voluntariness of use item was
dropped, the rationale being that gaming is always voluntary activity. Use context,
as mentioned in the previous chapter, will be measured both with a one-
dimensional bored-not scale and with a similar multiple choice question as in the
Analysys (2010) report. The methodology is further detailed in Chapters 6 and 7.
The middle column in Figure 8 represents the combined list of relevant
antecedents from the body of research discussed above. Davis’s (1989) original

31
usefulness and ease of use items are present, and on top of them, enjoyment and
flow items are used to better accommodate the mobile gaming setting (Qi et al.
2009; Zhou et al. 2010; Liang & Yeh 2011; Liu & Li 2011). Social influence had also
been rooted in the model as early as TAM2 and UTAUT (Venkatesh & Davis 2000;
Venkatesh et al. 2003), as discussed in Chapter 2.
Finally, on the right side of the framework, there are the usage items. While the
central Technology Acceptance Models measured Intention to use and actual Use
behavior (Davis 1989; Venkatesh & Davis 2000; Venkatesh et al. 2003), most
studies on mobile services adoption that were covered in the previous chapter
only concentrated on intention (Lu et al. 2007; Lu et al. 2008; Mallat et al. 2009;
Zhang et al. 2010; Liang & Yeh 2011). There was one study that only measured
Attitude (Ha et al. 2007). Some other studies measured two outcomes, but unlike
the original TAM and its derivatives, they focused on attitude and intention (Qi et
al. 2009; Liu & Li 2011). It seems that none of the articles reviewed have
incorporated all of the attitude, intention and use behavior items. On the contrary,
the present thesis measures all three items that are related to use to see whether
there is an actual distinction between them from the respondents’ point of view.
This chapter covered the theoretical framework, based on the studies and theories
reviewed in the two previous chapters. Next, we move from theory to the empirical
part of the present thesis. Chapters 5 and 6 describe the methodology of the
research that was conducted based on the theoretical framework, while Chapter 7
highlights its findings.

32
5 Empirical Study
The rationale for choosing the determinants and other items from a variety of past
studies to the theoretical framework was covered in the Chapter 4. Chapters 5 and
6 cover the empirical research methods, the design of the survey questionnaire
and the target groups whom the survey was administered to. They also give an
overview of the methodology that was applied in the analysis of the results.
Since the theoretical framework of the thesis is built strongly on the Technology
Acceptance Model, the methodology of the study is for the most part also inherited
from that line of research. Starting from Davis’s (1989) initial publication, and
going all the way to present day studies on mobile gaming discussed earlier in this
paper, quantitative surveys have been the choice of method (see eg. Venkatesh &
Davis 2000; Ha et al. 2007; Liu & Li 2011). The next two sections describe in detail
the process of choosing and refining the different parts and questions of the
finished survey questionnaire.
5.1 Questionnaire Design
The base for the background questions came from the Venkatesh et al. (2003)
study, where the Unified Theory of Acceptance and Use of Technology (UTAUT)
was introduced. These background questions included gender, age, experience and
voluntariness of use. However, as described in the previous chapter, the nature of
games resulted in the voluntariness item to be discarded.
For the experience item, the present thesis utilized a subjective method of letting
the respondent describe themselves as being either novice or experienced with
regard to gaming in general, similarly to what Ha et al. (2007) did in their study.
This choice was made following mainly two reasons: First, as Davis (1989) already
explained in his study, the subjective or perceptual measure items tend to have a
more direct link to behavior. Second, coming up with explicit definitions for

33
experience and can be extremely difficult. Especially, if the predetermined
experience categories are defined in terms of time (days, months or years, for
example), they can be rather poor at capturing the different respondents in a
balanced manner, resulting in skewed distributions that are not very useful for
analysis (see Qi et al. 2009; Liu & Li 2011, for example). Qu and Pan (2011) also
noticed the same effect during a study conducted on a small scale a few months
prior to the research in the present thesis.
In addition to the background items from UTAUT, there is also a comprehensive
multiple choice item about different use situations. This question is the result of
dissatisfaction to the almost one-dimensional way some previous studies have
dealt with use context, as discussed in Section 3.4. Specifically, Liu and Li’s (2011)
study seemed to consider use context only as a synonym to boredom. On the other
hand, Qi et al. (2009) divided respondents into five groups depending on the
“scenes” when mobile data services usage took place. This is already somewhat
more nuanced than the Liu and Li (2011) study, although three out of five groups
were still about “waiting time”, “killing time” or “pastime”, essentially the same
thing. However, for the present thesis, the list of different use cases was as long as
eight items, which were adapted from the extensive study on mobile gaming habits
in China by Analysys (2010).
From background questions, we can move to the actual focus of the thesis: scale
items that measure determinants. They were refined into the final questionnaire
set through a multi-step process. First, as detailed by Chapter 4, following the
review of past literature, a theoretical framework of the study was constructed,
and relevant determinants were chosen on the framework. Second, for each chosen
determinant, all the previous questionnaire sets from past studies were reviewed
and the questions associated to them were listed. Then, three to five most often
occurring questions or statements for each determinant were shortlisted and their
feasibility was discussed among the thesis group with the professor and other
researchers for peer review. This process finally resulted in 36 questionnaire
statements across six constructs (perceived usefulness, perceived ease of use,
perceived enjoyment, social influence, flow, use context) and three behavioral

34
measures (attitude, intention and use). In line with previous studies, a 7-point
Likert scale was chosen to measure each scale item.
Because the survey was conducted in China, the next step was to translate the
English questionnaire into Chinese. During this step, help was received from
professors Liu & Li (2011) who provided their own questionnaire items in the
Chinese language so that the current translation would maintain a similar
academic tone and style to their study. The translation was then produced in
collaboration with a former lecturer from Zhejiang University and a current
professor and Ph.D. at Hangzhou Dianzi University. At this point, due to similarities
in translation, item under the perceived enjoyment construct was discarded.
Lastly, the style and grammar of the questionnaire was proofread by a Master’s
Degree graduate of Chinese language and literature at Fudan University. For the
detailed questionnaire design in both English and Chinese, see Appendices A and B,
respectively.
5.2 Data Collection
Previous studies on mobile gaming in China have been conducted either by face-to-
face contact (Liu & Li 2011) or through online survey service providers (Ha et al.
2007; Liang & Yeh 2010). Since the ideal respondent and target of this study is a
mobile gamer or at least a potential one, they can be, at least to some extent,
regarded as tech savvy people, easily reachable by online surveys. Therefore, an
online survey method was chosen. Another reason is more practical one: the
author of the present thesis was conducting the study from Finland, with limited
possibility to go and collect the survey responses on-site, had it been done the face-
to-face way.
The translated questionnaire was converted into a Chinese online survey form
with the help, feedback and support from the survey service provider and a
handful of volunteer respondents who helped smooth the edges of the web form
design. At this point, for example, the order of displaying the scale items was

35
randomized for each respondent to control for survey fatigue. Lastly, the test
responses were erased from the database prior to making the actual questionnaire
available to make sure that the pilot answers did not interfere with the actual
results. The finished questionnaire was then distributed online through multiple
channels.
For distributing the questionnaire, the Finnish game company Rovio offered their
customer contact channels in China to this use. Rovio is the developer behind the
popular mobile game “Angry Birds”. During the time of writing the thesis, the
author was employed by the company, thus getting access to its channels in the
Chinese microblog services (similar to Twitter in the west). In fact, the author
participated in creating the said channels so that by the time the survey link was
published, Rovio’s official microblog profiles in China already covered over
300,000 followers. Moreover, the company provided toys for free as incentives for
people to participate in the survey.
The survey questionnaire was online during a two-week period between May and
June 2011, during which a total of 585 responses were collected from four
different sources. In order to distinguish, at least to some extent, the effectiveness
of different channels, each channel had a customized link so that there were a total
of four different ways (two primary, two secondary) the respondent could end up
to the questionnaire site. The survey link was seeded to the primary and secondary
sources on the first day the questionnaire went live, along with a cover message to
urge people to participate. A reminder message was sent to the primary source in
the middle of the collection period.
Most of the responses were collected a few days after the initial announcement or
the reminder message. In general, the study employed a mixture of sampling
techniques: there were elements of both convenience and snowball sampling
methods. (Jankowicz 2005, 203-208; Malhotra & Birks 2007, 410-411, 414). The
convenience sampling approach can be argued, because not everyone in the
300,000 follower base happened to see the links to the survey, only those who
were online to see the message or its reminder did. The snowball sampling

36
method, on the other hand, can be explained through the very nature of the
Internet, where people also distributed the participation link on their own, virally.
Therefore, some people who did not see the original message might have seen the
link later broadcasted by one of their friends. Even people who were never part of
the initial 300,000 followers might have become exposed to the message through
their friend circles, resulting in some long-tail response collection outside of the
most active response periods (Anderson 2006).
The majority of the responses, 405 (69%) came from the links seeded on Rovio’s
official profiles at two of the major Chinese microblog websites, Sina Weibo (262,
45%) and QQ Weibo (143, 24%). In addition to the primary sources, two
secondary sources were also used. 123 (21%) of the responses were collected
from the link that was spread through the Chinese blogosphere2 and 57 (9.7%)
responses from the survey application in the Kaixin001 (or Happy Network), one of
China’s largest social networking site among white-collar workers (Chen & Haley
2010). Of the 585 responses, 492 were fully completed, thus usable, and were
retained for analysis. The resulting effective response rate is 84%. Of the usable
responses, a demographic overview is available in Table 1. These and other
background variables’ contribution to the results are discussed in detail in Section
7.3.
Female Male
Under 18 18 (3.7%) 46 (9.3%) 64 (13%)
18-23 44 (8.9%) 91 (18%) 135 (27%)
24-29 93 (19%) 132 (27%) 225 (46%)
Above 30 19 (3.9%) 49 (10%) 68 (14%)
174 (35%) 318 (65%) 492 (100%)
Percentages % of
Total
Gender
Total
Age
Groups
Total
Table 1: Respondent demographics
As seen above, specific measures were taken to ensure that using Rovio’s own
channels as the primary data collection source did not result in biased answers. On
2 The socially formed, cross-linking network of blogs (see: Graham 1999; Quick 2002)

37
the other hand, Rovio’s channels are probably one of the most unbiased channels
in terms of demographical factors, because the massive player base of the Angry
Birds games has resulted in a relatively even gender and age distributions. For
example, according to the Analysys (2010) report, the gender bias of mobile
gamers in China in 2010 was as extreme as 92:8 towards males. In light of this, the
65:35 gender distribution through Rovio’s channels is much closer to the natural
distribution, and thus, more applicable to the general audience.

38
6 Analysis of the Data
After collecting the response data using the methods described in Chapter 5, it is
time to do the analysis, covered in this chapter. The present thesis uses a multi-
step and method approach in the analysis of the data. All computerized
calculations were performed on the SPSS statistics software. Each of the steps is
thoroughly explained below, although most of the actual results are not presented
in detail until Chapter 7: Findings.
The steps and methods detailed below include factor, regression and cluster
analysis, cross-tabulation of data and finally, reliability and validity assessment. Of
these methods, the first two were commonly used in TAM literature along with
reliability and validity tests. However, the past studies rarely conducted cluster
analysis on the data, followed by cross-tabulating the resulting clusters against
demographic and other variables. This “limitation” is understandable, since cluster
analysis is more relevant in the field or marketing than in the information systems
sciences, where the origins of TAM lie. The present thesis benefits from this
insight, and can hopefully help bridge the gap between the more theoretical basis
of model building in the information systems sciences and the more application-
centric approach in the marketing discipline.
6.1 Factor Analysis
As the first step, factor analysis was applied to the questionnaire data, but actually
even before that, some data was already processed as a part of the pre-analysis
reliability and validity assessments. See Section 6.5 for more information on the
effects that some of the tests had on the data. For example, some items were
deleted because of the issues with data consistency. Also, the fitness of the data
specific to factor analysis needed to be assessed. According to Jokivuori and Hietala
(2007, 113), there are two indicators for this. The so-called Kaiser-Meyer-Olkin
(KMO) test of sampling adequacy should be at least 0.5 (Malhotra & Birks 2007,

39
648) and the Bartlett’s test of sphericity should be significant. Since the KMO score
of the current data was 0.941 with Bartlett’s test significant at p < 0.001, it is safe
to conclude that the data (after reliability and validity processing) has excellent fit
for factor analysis.
In a nutshell, factor analysis looks at the correlations between initial scale items
and comes up with n artificial factors that the items seem to best belong to
(Jokivuori & Hietala 2007, 89). Ideally each item would correlate or load only one
factor but in reality, items tend to, at best, have a noticeable loading in one factor
and some residual cross-loading on other factors. To maximize the difference
between high and low loadings and to minimize cross-loadings, the initial result
from the factor analysis was rotated around the origin. The rotation does not affect
the number of factors, but the item loadings on each factor so that the results
would be easier to interpret (Malhotra & Birks 2007, 656). In the end, the software
cannot do the interpretation work, and it falls to the researcher to apply common
sense when looking at the resulting factor loading tables.
The main reason to run a factor analysis is to reduce the number of the constructs
(Jokivuori & Hietala 2007, 90; Malhotra & Birks 2007, 646), effectively removing
some of the complexity of the model that has been criticized in the past (Bagozzi
2007; Raaij & Schepers 2008, for example). Indeed, initially a total of eight
different constructs were identified and included in the theoretical framework in
Chapter 4. They were: perceived ease of use, perceived usefulness, perceived
enjoyment, social influence, flow, attitude, intention and behavior. In addition, use
context was studied as one of the background variables. That theoretical
framework was based on literature review. Factor analysis gives an empirical
confirmation of the theory, based on the actual data, but it also helps reduce data
to a more manageable level (Malhotra & Birks 2007, 646). Especially for the later
stages of analysis, the more granular and complex the data is, the more difficult it is
to make clear distinctions and conclusions.
For data reduction, there are multiple ways to determine the number of output
factors and none of them is the single correct way. In the end, the decision is

40
always a subjective but reasoned combination of all of them (Jokivuori & Hietala
2007, 99). The present thesis employs the three following approaches:
eigenvalues, scree plot and the percentage of variance explained (Malhotra & Birks
2007, 654).
Eigenvalue is a measure that shows the relative variance explained associated with
a factor compared to the average of a single construct. Hence, a cut-off point of
eigenvalue 1.0 is often used. Scree plot is a visual way to display the same “number
of factors / eigenvalue” data, and can indicate an appropriate range of factors to be
included. Jokivuori and Hietala (2007, 98) suggest a range where the scree plot is
seen to straighten out considerably. The percentage of variance explained
approach is a bit different from eigenvalue or scree plotting. Here, an artificial level
of acceptable cumulative explanatory power of the model is set beforehand and the
number of factors is determined by this cut-off level. Malhotra and Birks (2007,
654) recommend that the level be set at 60%. However, Jokivuori and Hietala
(2007, 98) mention that even 50% of cumulative variance explained can be
considered quite satisfactory. See Table 2 and Figure 9 for the data on all three
methods.
Table 2: Eigenvalue and cumulative % of variance explained. Highlight: Acceptable range
Factor Initial Eigenvalues
Total
Cumulative % of Var Exp
1 9.896 31.9 2 1.682 37.3 3 1.348 41.7 4 1.296 45.9 5 1.161 49.6 6 1.047 53.0 7 0.930 56.0 8 0.916 59.0 9 0.832 61.6 10 0.799 64.2
Figure 9: Scree plot

41
Looking at the data, several solutions can be proposed. Strict eigenvalue approach
would yield six factors at maximum, but the percentage of variance would view
anything above six to nine factors as satisfactory. Furthermore, visual
interpretation of the scree plot would suggest anything between three to eight
factors. Since initially the number of scale items amounted to nine constructs, the
preference here is less than nine factors. On the low end, according to the scree
plot, three factors looks sufficient, but actually they only account for over 40% of
the explanatory power. Therefore, six factors were chosen, as that number
satisfied all three approaches.
The detailed factor loading tables are discussed in Chapter 7 with other results and
findings of the analysis. However, before moving on to the next analytical step, one
should note a final issue about the factor analysis. Because this analysis method
outputs the resulting new factor scores as standard (normal) distribution values,
adjustments need to be done for some subsequent analyses (Jokivuori & Hietala
2007, 105). Hence, based on the results of the factor analysis, new surrogate
variables were built by manually combining the highest-loading scale items within
these new artificial factors (Malhotra & Birks 2007, 657). This step allows
obtaining the factor analysis-like output data that is still on an original Likert scale,
with minimal sacrifice to the validity of data (Jokivuori & Hietala 2007, 103-104).
In the later steps of analysis, the information on whether factor scores or surrogate
variables are used is provided, because different analyses may need input data in
either form.
6.2 Regression Analysis
The second step into the analysis, regression analysis, is one of the most common
ways in statistics to identify relationships between a dependent and independent
variables (Jokivuori & Hietala 2007, 40). It can be used to firstly establish the
existence of the relationship, secondly to measure the strength of it and thirdly to
predict the behavior of the dependent variable through changes in independent
variables (Malhotra & Birks 2007, 581).

42
The majority of the past studies presented earlier have used regression analysis to
prove the link between different constructs and, most importantly, to show that
the items surveyed leads to acceptance and adoption of the technology in question.
However, as pointed out by Jokivuori and Hietala (2007, 40) and Malhotra and
Birks (2007, 581), the mere existence of a relationship does not automatically
imply causality. The models in research papers often assume different chains of
causality, although nothing can confirm or deny the direction of the relationship. Of
course, like always, common sense can be applied here, and it is fairly easy to
argue that constructs such as perceived usefulness or perceived enjoyment could
affect mobile game adoption, and not the other way around.
Following the data reduction phase of factor analysis, the model that was
presented in Chapter 4: Theoretical Framework was adjusted with the surrogate
variables based on the factor analysis. Then, the regression analysis was conducted
with the new variables. The results of this process are detailed in Chapter 7.
6.3 Cluster Analysis
A thorough look into the past TAM studies reveals that the previous research in the
field of information systems sciences has rarely pushed beyond the traditional
factor analysis – regression analysis double steps. Instead, it has settled with
confirming the soundness of whichever model that was being tested at the time.
However, from the marketing perspective, the respondents themselves are very
interesting as segments and informants. In the end, it is the consumers’ behavior
that the models are trying to predict, as far as the marketers are concerned.
Therefore, the next step of the analysis is cluster analysis. It is a technique, or
rather a set of them, that help classify data into different groups, or clusters. One of
the benefits of cluster analysis is that it looks at the data from the holistic
perspective and does not treat dependent and independent variables differently
(Malhotra & Birks 2007, 671). Therefore, it ignores the whole causality assumption
problem identified earlier when talking about regression analysis. It just extracts

43
information from the data. In the present thesis, the aim of the cluster analysis is to
group the respondents into different clusters that are relatively homogeneous
(Malhotra & Birks 2007, 672) based on how they responded to the questionnaire
items. The idea is different than in the factor analysis, where the items themselves
were being re-grouped into factors.
Background variables were excluded from the clustering process, though, because
the idea is to segment the respondents based on their reactions to behavioral
claims in the questionnaire. In addition, cluster analysis can use the factor analysis
output data directly, so surrogate variables are not needed. Indeed, to follow the
simplicity principle, the factor analysis results are directly fed as input data to the
cluster analysis. This also leads to more precise clusters as the input data is as
detailed as possible.
When talking about clustering methods, two schools of methodology can be
applied: hierarchical or non-hierarchical. Hierarchical models employ a stepwise
process where either separate items are combined one-by-one based on their
similarity, or one big cluster is divided in halves based on average dissimilarity
until all items are separate. The benefit of the hierarchical method is that the
number of optimal clusters can be unknown and assessed after the fact from the
hierarchical data. The drawback of the method is that the number of calculations
increases quickly with the number of items being clustered (Malhotra & Birks
2007, 676). Non-hierarchical clustering method works much like the opposite of
hierarchical method: The number of clusters must be pre-defined, so in a situation
where it is unknown, multiple solutions must be considered and compared in
parallel. However, non-hierarchical models are much faster than hierarchical
models, especially with large data sets (Malhotra & Birks 2007, 678).
Again, applying a marketing approach to the selection of methods, since the
optimal solution was unknown at the start of the analysis, the present thesis used a
hierarchical model, interpreting the resulting output to obtain the feasible number
of clusters. There are many differing methods even under the hierarchical school.
However, as the aim of segmenting is to find clusters whose members are as

44
homogeneous as possible, a method called Ward’s procedure (belonging to a group
of variance methods) was used. Variance methods attempt to minimize the
variance within clusters (Malhotra & Birks 2007, 677), which is exactly what
segmenting seeks after. In addition, Milligan (1980) suggests that Ward’s
procedure outperforms some of the other methods.
Section 7.3 discusses the actual clusters in more detail, while here only the process
of identifying them is described. There are multiple ways to assess a suitable
number of clusters from the hierarchical output. Malhotra and Birks (2007, 681)
suggest a visual interpretation from the dendrogram, which is an output chart
generated by the hierarchical clustering process.
The quick overview of how to read the dendrogram is provided in Figure 10.
Accoding to ESRI (2002), three kinds of information can be quickly assessed from
the visual dendrogram representation:
Weight - the rough percentage of all individuals that fall within each cluster,
marked by the height of the selected cluster
Compactness - how similar to one another the elements of a cluster are,
marked by the distance between the left edge to the node
Distinctness - how different one cluster is from its closest neighbor, marked
by the distance between the node to the branch
The SPSS software outputs a similar dendrogram than in Figure 10. However, due
to the large number of respondents (492), the resulting image is beyond
comprehension without resizing it in such a way that all identifying information,
for example respondent number, becomes illegible. Still, the optimal number of
clusters was easy to determine from the branches. Figure 11 shows the
dendrogram generated from the survey data, where five unique clusters was
identified. The choice of the number of clusters was made based on balancing the
weight, compactness and distinctness indicators as shown in the instructions
above (ESRI 2002).

45
Figure 10: The use of dendrograms. Clusters marked with different colors. Image courtesy of
ESRI (2002)
6.4 Cross-tabulation
Finally, one more step in the analysis closely related to the clustering is cross-
tabulation, although it is often considered to belong to basic analyses (Malhotra &
Birks 2007, 503). Cross-tabulation can be used in two ways with regard to present
study. First, it can be used to refine the interpretation of the different clusters by
cross-examining the background variables (age, gender, experience and use
context) against the clusters. Second, and perhaps most interestingly from the
marketing and segmenting perspective, it can be used to analyze how the clusters
themselves differ from each other in terms of their position on the factors.
Cross-tabulation can also be used to analyze frequency distributions, as it can
reveal whether the observed distribution differs significantly from the expected
one, as mentioned by Malhotra and Birks (2007, 521). They note that the expected
distribution is calculated from the row and column totals, with the assumption that
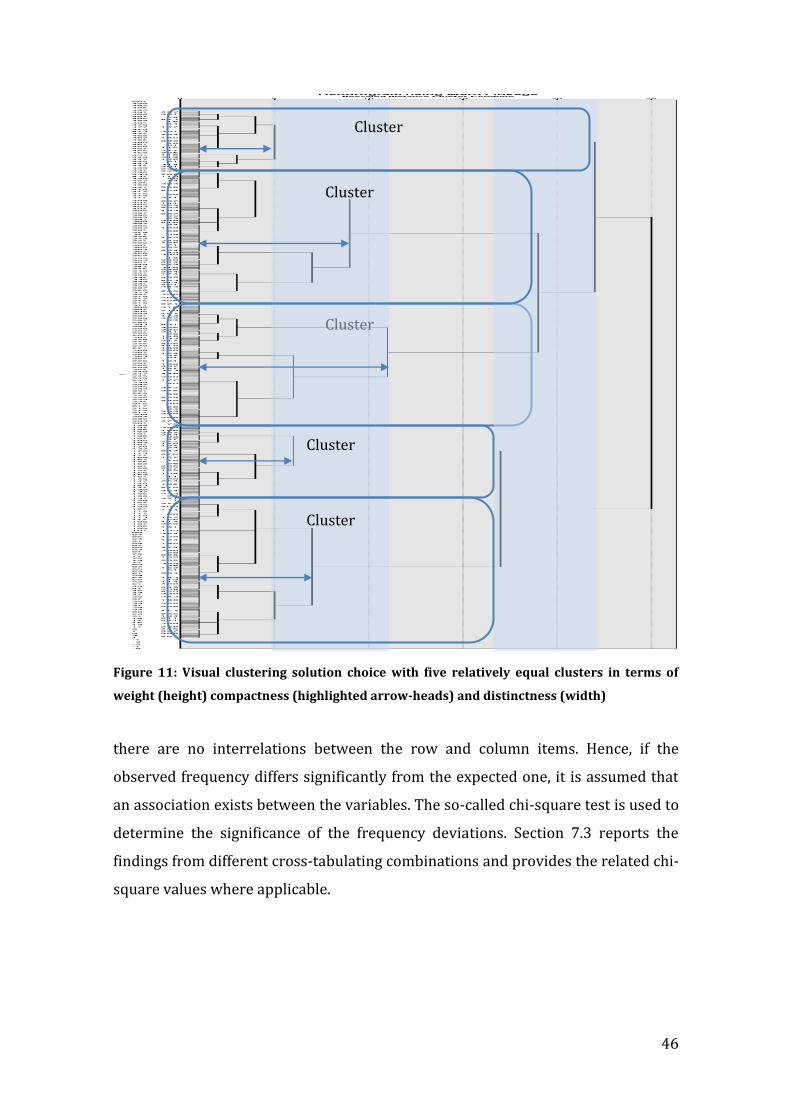
46
Figure 11: Visual clustering solution choice with five relatively equal clusters in terms of
weight (height) compactness (highlighted arrow-heads) and distinctness (width)
there are no interrelations between the row and column items. Hence, if the
observed frequency differs significantly from the expected one, it is assumed that
an association exists between the variables. The so-called chi-square test is used to
determine the significance of the frequency deviations. Section 7.3 reports the
findings from different cross-tabulating combinations and provides the related chi-
square values where applicable.
Cluster
Cluster
Cluster
Cluster
Cluster

47
6.5 Reliability and Validity
Last but not least, reliability and validity of the data was assessed and tested, using
multiple available methods. Reliability measures consistency, and therefore the
less random error and more consistent results a study design can produce over
time and multiple repetitions, the better the reliability. Validity, on the other hand,
measures precision. In other words, it tests whether the scales developed for the
task are able to truly reflect the underlying phenomenon that is being studied
(Jankowicz 2005, 111-112; Malhotra & Birks 2007, 159, 357-359).
Regarding reliability, the internal consistency of scale items within each construct
is measured through Cronbach’s alpha. According to Jokivuori and Hietala (2007,
104, 135), as well as Malhotra and Birks (2007, 358), the figure should be above
0.6. In this study, Cronbach’s alpha meets the requirement in all but one construct:
perceived ease of use. Thus, the internal consistency reliability is satisfactory.
However, closer examination reveals that in the survey questionnaire, two of the
scale items under perceived ease of use and one item under flow are conceptually
negatively worded compared to the rest of the questions. This would not be a
problem normally, since those item scores can be just reverse-coded by replacing
the score 1 with 7, 2 with 6 et cetera.
However, even after the recoding process, the data was still inconsistent – and for
some parts even less consistent than originally! This indicates a moderate
respondent confusion even though the order of the items in the questionnaire was
randomized. Recall the Lu et al. (2008) study, mentioned in Section 3.1, where a
similar effect was observed regarding social influence. Thus, it should be noted
that the wordings on the questionnaire must be as consistent as possible in the
future. On the other hand, this undermines the independent relationship of how a
question is presented and what results it yields. However, since the present thesis
is not about the metaphysical essence of science, we will leave this topic and move
on.

48
Furthermore, the reliability analysis revealed that a second item under flow was
also internally inconsistent, although the wording used there was not negative.
Following de Vaus’s (2004) suggestion that any item having corrected item-to-total
correlation within their construct less than 0.3 should be considered weak and not
be included, it was also discarded from subsequent analysis. All other remaining
items met the requirements. Table 3 summarizes the reliability tests and shows
that in general, the requirements for Cronbach’s alpha and average corrected item-
to-total correlations of each construct are met to a satisfactory degree.
Construct
Cronbach's
Alpha (Initial)
Cronbach's Alpha
(Adjusted*)
Average Corrected
Item-Total
Correlation (Initial)
Average Corrected
Item-Total Correlation
(Adjusted*)
Perceived Ease of Use 0.401 0.475 0.221 0.312
Perceived Usefulness 0.647 0.458
Perceived Enjoyment 0.712 0.531
Social Influence 0.732 0.493
Flow 0.680 0.721 0.415 0.511
Attitude 0.788 0.596
Intention 0.762 0.560
Behavior 0.713 0.555
* One or more items deleted due to the inability to meet the recommended value.
Recommended value: > 0.6 Recommended value: > 0.3
Table 3: Reliability analysis with Cronbach's alpha and corrected item-total correlations
(Highlighted values are less than recommended)
As to the test-retest reliability, the items were chosen based on careful synthesis of
previous literature on the topic, as depicted in Section 5.1. One should also note
that despite having examined prominent TAM studies from the past 20 years, none
of them appeared an exact repetition of their predecessors. There were always
some changes in the study design or the items used. In other words, there is no
single one-size-fits-all TAM template. However, since the present thesis is drawing
influence from multiple past studies, it can be argued that to a high extent, the
external reliability is built-in by design. The reliability here refers to the whole
TAM research body, not any single study.
Moving on from reliability to validity, the content validity argument is the same as
above: since the methods were applied directly from the previous studies, it would

49
be relatively safe to assume that the metrics that have been developed for decades
are validated through the rigorous scientific process. In the end, however, the
evaluation of the content validity is subjective, as noted by Malhotra and Birks
(2007, 358).
In addition to content validity, some objective measures include convergent and
discriminant validity. Convergent validity means that the scale item should have
high intra-construct correlation within its own construct and discriminant validity
means they should differ enough from constructs that they do not belong to, (Liu &
Li 2011; Malhotra & Birks 2007, 359). In terms of sufficient levels of convergent
validity, Fornell and Larcker (cf. Liu & Li 2011) suggested that the average
variance extracted (AVE) of each construct should exceed 0.5. For assessing
discriminant validity, they recommended comparing the square root of AVE to
inter-construct correlations. If the AVE of each construct is higher than any inter-
construct correlations, the discriminant validity requirement is met (Liu & Li
2011). The AVE figure itself can be calculated as a by-product of the factor analysis.
In order to obtain the inter-construct correlations, surrogate variables calculated
from the results of the factor analysis were used to represent the constructs in the
correlation analysis. The reasoning for doing so is similar to the situation with
regression analysis, and was explained in detail in the final paragraph of Section
6.1. Tables 4 and 5 summarize the validity tests and show that the convergent and
discriminant validity requirement were both met.

50
Table 4 (left): Convergent validity requirement met
Construct AVE Construct PEOU PU PE SI Flow Att Int Beh
PEOU 0.711 PEOU 0.843
PU 0.717 PU 0.330* 0.847
PE 0.722 PE 0.363* 0.619* 0.850
SI 0.738 SI 0.251* 0.476* 0.497* 0.859
Flow 0.760 Flow 0.260* 0.489* 0.451* 0.467* 0.872
Att 0.737 Att 0.374* 0.582* 0.580* 0.504* 0.481* 0.859
Int 0.714 Int 0.360* 0.515* 0.564* 0.479* 0.468* 0.742* 0.845
Beh 0.669 Beh 0.329* 0.461* 0.481* 0.466* 0.456* 0.559* 0.603* 0.818
* Significant at p < 0.001
Recommended
value: > 0.5
Table 5 (right): Discriminant validity requirement met as the square root of
AVE (displayed on the diagonal axis) is larger than any single correlation

51
7 Findings
Chapter 6 detailed the different methods of analysis that included factor analysis,
regression analysis, cluster analysis and cross-tabulation. This chapter reports the
actual findings from these analyses and discusses their implications. The first two
parts of the results report follow the traditional TAM research line’s confirmatory
assessment of the model. The last two parts move more towards exploratory
marketing application sphere, and identifies different segments that have adopted
or are interested in adopting mobile gaming, as well as extract information on how
they would potentially respond to stimuli from different factors.
First, the outcome of the factor analysis is presented. As discussed in Chapter 8, the
factor analysis yielded six different factors, reducing the number of constructs
down from nine. Second, the theoretical model is refined based on the surrogate
variables built from the new factors, and a regression analysis is conducted with
these variables to test the feasibility and fit of the model. Generally, the proposed
relationships seem to exist to a significant degree, and the overall explanatory
power of the model is satisfactory.
Third, an exploratory cluster analysis is performed with regard to informants
(respondents of the survey). As described in Chapter 8, the cluster analysis
identified five respondent clusters that were distinct enough from each other on
the outside and homogeneous enough with others in the same group. Fourth and
finally, the resulting clusters are cross-tabulated against different background and
other variables. Based on interpreting the cluster solution with help from cross-
tabulation techniques, the profiles of the five clusters, or segments, are created.

52
7.1 Factors and Surrogate Variables
Table 6 details the factor loadings, which are the extent that the particular scale
item affects the resulting factors F1 – F6. As discussed in Section 6.1, the initial
solution is rotated around the origin so that the item loadings on the primary
factor are maximized while the loadings on secondary factors (or cross-loadings)
are minimized.
As we can see from Table 6, there are some interesting findings. For example,
recall the right side of the suggested theoretical framework in Chapter 4 (See
Figure 12 which details the model with proposed adjustments), where the “target
constructs”, attitude, intention and behavior together represented what could
described as the ideal outcome, namely adoption of mobile gaming. The rotated
factor loading table shows that the respondents do not consciously separate these
theoretical constructs from each other; otherwise, they would not all load on the
same factor. The same phenomenon can be seen from the correlation matrix in
Table 5 (Section 6.5), where all three constructs correlate more highly with each
other than with other constructs in the questionnaire. It would be quite safe to say,
therefore, that we can treat these items as one dependent construct, and name it
simply as Adoption.
Figure 12: The suggested theoretical framework from Chapter 6 with proposed adjustments
Combined
PE and PU
as just PE
Combined
these as
Adoption

53
In addition, adoption ranks number one in the factor order, which is not a surprise.
Table 2 (Section 6.1) shows that the first factor accounts for over 30% of the total
variance explained. Recall that in Section 6.2, the problem of implied causality was
discussed. However, it seems that the choice of treating adoption as a dependent
variable was a right one: the factor loading values suggest that F1 is actually not a
Item Coding Construct F1 F2 F3 F4 F5 F6
1. Mobile games are easy to learn PEOU1 Perceived 0.258 0.035 -0.067 0.102 0.101 0.685
2. Playing mobile games requires mental effort. PEOU2 Ease of Use Deleted
3. Mobile games are easy to play. PEOU3 0.096 0.207 0.083 0.028 0.123 0.611
4. It takes effort to become skillful at mobile games. PEOU4 Deleted
5. Mobile games are useful. PU1 Perceived 0.165 0.544 0.020 0.266 0.153 -0.023
6. Mobile games can increase my quality of life. PU2 Usefulness 0.339 0.658 0.128 0.110 0.010 -0.001
7. Playing mobile games makes my life better. PU3 0.218 0.619 0.212 0.140 0.092 0.209
8. Mobile games make me happy. PE1 Perceived 0.242 0.665 0.257 0.033 0.125 0.201
9. Mobile games can provide me enjoyment. PE2 Enjoyment 0.242 0.529 0.147 0.110 0.149 0.183
10. Playing mobile games is fun. PE3 0.331 0.440 0.145 0.115 0.043 0.415
11. My friends play and recommend mobile games to
me.
SI1 Social
Influence
0.223 0.203 0.469 0.175 0.166 0.356
12. People that are close to me play mobile games. SI2 0.275 0.079 0.606 0.010 0.083 0.324
13. People that I look up to play mobile games. SI3 0.176 0.027 0.696 0.176 -0.062 0.088
14. People who play mobile games have more
prestige.
SI4 0.198 0.221 0.657 0.055 0.055 -0.200
15. Playing mobile games is considered a status
symbol.
SI5 0.055 0.276 0.633 0.219 0.112 -0.058
16. When playing mobile games, I’m intensely
absorbed in the game.
FLOW1 Flow 0.161 0.206 0.205 0.627 0.209 0.051
17. When playing mobile games, I’m concentrated on
the game.
FLOW2 0.132 0.160 0.203 0.664 0.095 0.241
18. When playing mobile games, I feel detached
from my surroundings.
FLOW3 0.153 0.010 0.107 0.746 0.109 -0.056
19. When playing mobile games, I have a feeling of
control.
FLOW4 0.282 0.352 0.010 0.588 -0.057 0.105
20. When playing mobile games, I feel calm. FLOW5 Deleted
21. When playing mobile games, I feel confused. FLOW6 Deleted
22. I play mobile games when I’m feeling bored. UC1 Use Context 0.200 0.041 0.006 0.081 0.731 0.197
23. I play mobile games as a way to kill time. UC2 (background 0.126 0.286 -0.068 0.063 0.685 0.134
24. I play mobile games when I have nothing serious
to do.
UC3 variable) 0.303 0.118 0.256 0.230 0.515 0.050
25. I play mobile games when I have no access to
other games.
UC4 0.389 0.007 0.196 0.123 0.509 -0.046
26. I favor the idea of playing mobile games. ATT1 Attitude 0.637 0.157 0.155 0.029 0.249 -0.020
27. I think playing mobile games is a good idea. ATT2 0.606 0.346 0.111 0.201 0.111 -0.015
28. I like playing mobile games. ATT3 0.635 0.307 0.168 0.057 0.154 0.143
29. I feel good about using mobile games. ATT4 0.636 0.212 0.111 0.166 0.112 0.162
30. I intend to play mobile games in the future. INT1 Intention 0.707 0.155 0.079 0.147 0.029 0.104
31. I believe I will play mobile games in the future. INT2 0.663 0.164 0.078 0.121 0.148 0.128
32. I will try different types of mobile games in the
future.
INT3 0.623 0.159 0.096 0.057 0.119 0.146
33. I will play mobile games more frequently in the
future.
INT4 0.588 0.154 0.192 0.172 0.167 0.153
34. I frequently play mobile games. BEH1 Behavior 0.559 0.160 0.235 0.175 0.148 0.202
35. I play mobile games a lot. BEH2 0.446 0.123 0.207 0.282 0.149 0.222
Factor Loadings
Table 6: Factor loading table for each scale item after varimax rotation.

54
real factor but the variable which is being studied. In fact, Vyas and Kumaranayake
(2006) even went as far in their own study as not naming a dependent variable
initially at all, but tracing backwards and determining it from the most explaining
factor suggested by the results of the analysis!
F2, the factor with the second highest eigenvalue, has items of perceived
usefulness and perceived enjoyment loading primarily on it. Following the logic
above, this could indicate that the factor is in the middle of a causal relationship
chain, with other independent factors affecting it first, and in turn, it affecting
adoption. Indeed, the theoretical framework in Chapter 4 suggests that actually
both perceived enjoyment and perceived usefulness are being affected by social
influence, and additionally, flow would affect perceived enjoyment. We can, to
some extent, conclude that the suggested causal relationship exists.
The fact that the second factor draws from both perceived enjoyment and
perceived usefulness as shown above is in line with previous studies. Generally in
TAM research, the concept of usefulness is something that measures the efficiency
of the technology, or the ability for it to accomplish the task it is set and supposed
to do. For example, in the Davis (1989) study, where electronic mail was examined,
the items that measured usefulness concentrated on whether job performance,
productivity or quality was increased due to the email, something it was clearly
designed for.
However, for games and other voluntarily accessed technology, the word
usefulness may sound out of context. People do not tend to play games for an
external goal (excluding professional players who earn their living by playing
competitive games). What could be the “use” of playing games, then? Perhaps the
answer is fun and enjoyment, as shown here. Literature review reveals that of the
studies directly involving mobile gaming, Liang and Yeh (2011) only employed the
construct playfulness which can be seen as almost synonymous to enjoyment,
while Liu and Li (2011) employed both constructs, just like the present thesis.
However, they discovered that the construct perceived enjoyment has better
explanatory power in the model (R2=49%) than perceived usefulness (R2=34%).

55
Similar trend can be observed in the present thesis, with the model fit indices
being 35% and 27%, respectively. Recall that these values are based on the initial,
unadjusted theoretical framework, where the two constructs were still kept
separate. The detailed analysis on the model fit after is reported in Section 7.2
when discussing the adjusted theoretical framework, based on the results of the
factor analysis.
Following above reasoning, we can treat both perceived enjoyment and perceived
usefulness as different sides of one factor and propose a common name for them.
As discussed above, because of the nature of games, the suggestion would be to
retain the name Perceived Enjoyment and make it cover the whole factor.
Regarding factors F3, F4 and F5, they all have the exact items from the original
constructs as highest loading, with no significant cross-loading items above 0.300.
Therefore, it can be concluded that the factors in question retain the original
construct names Social Influence, Flow and Use Context, respectively. Once again,
to avoid confusion, it is worth recalling that use context is treated as a background
variable.
The sixth and last factor is somewhat a residual one with the least explanatory
power that is still acceptable (eigenvalue just above 1.0). The initial perceived ease
of use construct that mainly loads on the sixth factor was also most affected by
inconsistencies with the questionnaire design, as discussed in Section 6.5.
However, despite the challenging circumstances, the loadings on the factor still
give a strong indication that Perceived Ease of Use should be regarded as one of
the factors when considering the adoption of mobile gaming. With a single
additional cross-loading item from the enjoyment construct (fun), it almost hints to
a smooth user experience often associated with Apple Inc.’s products. Not very
important on its own, but it acts as an icing on the cake that seals the deal. The next
section details how the resulting factors are used in the regression analysis to
validate the model.

56
7.2 Regression Analysis with Adjusted Theoretical Framework
Based on the factor analysis results above, an adjusted and simplified theoretical
framework is proposed. This model will be used when conducting the regression
analysis, with surrogate values calculated from factor analysis used as input data.
As discussed in the end of Section 6.1, some further analyses, such as regression
analysis, are not possible without using surrogate values. This is because factor
analysis outputs the results on a standardized normal distribution scale, making
regression analysis with them impossible. The simplified theoretical framework,
along with the results from the regression analysis, is shown in Figure 13.
Figure 13: Simplified theoretical framework with results of regression analysis (* p < 0.001)
As can be seen from Figure 13, all observed relationships are statistically
significant. However, the strengths of the relationship vary depending on the
connection in question. The results are in line and consistent with the usual level of
relationship strengths observed in previous TAM studies, be it on mobile gaming
specifically (Liang & Yeh 2011; Liu & Li 2011) or research on technology
acceptance in general (Lu et al. 2008; Mallat et al. 2009; Zhang et al. 2010, for
example). Recall also that, as discussed in Section 6.3, the background variables
age, gender, experience and use context are cross-tabulated in a later stage with

57
the results from cluster analysis. Therefore, they are not included in the theoretical
model at this point.
What can be discerned from the results is that enjoyment is the single most
important factor that leads to adoption. It also has strong ties to the concept of
flow. The more enjoyable the game is, the more it tends to lead to a flow-like state
of the player, which in turn feeds back to the feeling of joy. This is in line with Liu
and Li’s (2010) findings and explains why people may have experience of
situations when a very enjoyable game makes them lose track of place and time,
and be completely absorbed in the activity. However, flow itself does not seem to
directly affect adoption very much. Social influence and perceived ease of use also
seem to be more indirect factors, both having more effect on perceived enjoyment
than adoption directly.
Another small detail worthy of noting is the increased model fit for the new,
combined perceived enjoyment factor, now at R2 = 43%. Recall that in Section 7.1,
it was noted that in their initial and separate constructs, the model fits for
perceived enjoyment and usefulness amounted to 35% and 27%, respectively. This
is another indication that factor analysis does not only reduce the complexity of
data, it also enhances its quality to some extent by increasing the fit index. Looking
at the overall model, the fit indices range from 27% to 56%, which Jokivuori and
Hietala (2007, 46) consider to be acceptable at the least and excellent at best, a
result that is still in line with other TAM studies covered above.
As discussed in Section 6.3, TAM related studies traditionally stop after reporting
the findings in factor analysis and regression analysis, the results that were already
presented in this chapter. However, one of the aims of the thesis is to take TAM,
inherently considered to be an information systems science theory, and connect it
to the discipline of marketing. From the marketing point of view, the focus is not
only whether the theory works under given parameters with the sample that is
used to validate it, but interest is also put on the composition of that sample itself.
One of the most important processes in marketing is the act of segmentation, or
identifying different customer profiles from the marketplace. This is because in

58
recent years, argued by Kotler and Armstrong (2006, 195), the market has
fragmented in such a way that it is increasingly difficult to develop a product that
appeals to everybody (a mass-marketable product). Hence, in order to use the data
gathered for TAM purposes to identify different customer segments, a combination
of cluster analysis and cross-tabulation techniques is used. The next section takes a
look at what kinds of different segments the sample data is able to provide.
7.3 Segmentation Using Cluster Analysis and Cross-Tabulation
Sections 6.3 and 6.4 already detailed the methods of cluster analysis and cross-
tabulation techniques. Therefore, this section only discusses the findings from
these analyses. Table 7 outlines each cluster in terms of where their cluster centers
are with regard to each factor. As discussed in Section 6.4, the factor analysis
output data is fed directly as input data in the cluster analysis, so the cluster center
means are not on a Likert scale anymore, but on a standard distribution scale.
7.3.1 The Five Cluster Solution and Cluster Means
In the end, no software is will give automatic labels on clusters, so the
interpretation of the results falls more or less on the researcher’s subjectivity.
Therefore, this section will be more qualitative in terms of content, compared to
the more quantitative sections elsewhere. The first step of interpreting clusters is
just to look at the values in Table 7 as they are. Second, using cross-tabulation,
additional segmentation information can be drawn from variables not used for
clustering, such as demographics: age (or rather, age groups) and gender. Finally,
further profiling can be conducted using other background variables in the same
manner as demographics. These include experience and use context. (Malhotra &
Birks 2007, 682.)

59
Adoption PE SI FLOW PEOU
Mean 0.253 0.019 0.447 0.858 0.536
Stdev 0.763 0.962 0.820 0.649 0.651
Mean 0.134 0.751 0.034 -0.264 -0.550
Stdev 0.890 0.687 0.991 0.694 0.655
Mean -0.572 -0.069 0.042 -0.781 0.711
Stdev 0.915 0.711 0.905 0.972 0.634
Mean 0.715 -0.658 -1.183 0.148 0.179
Stdev 0.824 1.011 0.672 0.937 0.734
Mean -0.618 -1.027 0.097 -0.031 -1.575
Stdev 1.212 0.743 0.882 0.882 0.778
Clusters/Factors
1 (N=132)
2 (N=135)
3 (N=109)
4 (N=62)
5 (N=54)
Table 7: Cluster means of the factor analysis results
Based on Table 7 alone, we can already draw some preliminary conclusions on
different clusters. Compared to just looking at the big picture in Section 7.2, cluster
analysis reveals surprisingly large differences in terms of how each segment react
to or value the factors:
Cluster 1 seems to be above average in terms of willingness to adopt mobile
gaming, but it reacts even more positively to social stimuli, ease of use and
especially the flow experience. It could be described as socially active and
dedicated players with a usability focus. From a very practical point of view,
the description actually sounds very much like a stereotypical user of the
Apple Inc.’s products.
Cluster 2 is really just looking for enjoyment with a mildly positive attitude
to adoption. However, it seems like they do not regard mobile games very
easy to use. This cluster could be described as casual gamers looking for fun
but still struggling with usability issues.
Cluster 3 is market by its members’ strong position on the ease of use of
mobile games. So much, in fact, that they don’t seem to be getting any flow
experience from it. Therefore, they may not be so interested to adopt
mobile gaming. Before cross-examining the data with background variables,
the suggested profile for this cluster is advanced gamers who prefer more
challenging and hard-core games on consoles or PC instead of mobile.
Cluster 4 is a smaller niche with strong adoption rate but only mediocre
position on challenge or ease of use. Even more prominent, this cluster has

60
a strong negative relationship to enjoyment and social aspect, as if there is
still some other reason for them to adopt mobile gaming. Therefore, it is
assumed that this cluster consists of highly individual people who strongly
favor mobile gaming no matter if they actually like playing or not, but as
such, further information on the cluster needs to be discovered elsewhere,
in subsequent analyses.
Finally, the small Cluster 5 is marked by a strong negative attitude on
adoption. This is definitely the non-gamer cluster. The group also
responded negatively to enjoyment and very strongly and negatively to
ease of use. The profile suggests this cluster to be a group of people to whom
mobile games are too difficult to learn, and they are not very fun anyway, so
they just wouldn’t bother. However, one needs to note the extremely high
standard deviation (over 1.2) on Adoption, which suggests the factor scores
are all over the map. Therefore, slight criticism and care should be applied
when interpreting this cluster.
7.3.2 Cross-Tabulation with Gender
Next, using cross-tabulation together with demographic variables gender and age
groups, we attempt to draw additional conclusions from the five clusters whose
profiles are now briefly outlined. Table 8 details the gender distribution of
respondents across the five clusters.
Female Male
1 42 % 58 % 132
2 32 % 68 % 135
3 33 % 67 % 109
4 27 % 73 % 62
5 41 % 59 % 54
174 318 492
35 % 65 % 100 %
Gender
Total
Cluster
Total
Table 8: Cross-tabulation with gender (chi-square 6.3 with 4 degrees of freedom, p = 0.18,
insignificant)

61
First of all, please note that the chi-square test of significance measured at p = 0.18,
which is still higher than the threshold value of 0.05, meaning that the observed
distribution does not significantly exceed expected values. This means that there is
no dependent relationship between cluster memberships and gender (Malhotra &
Birks 2007, 522). Indeed, across all clusters, the gender distribution pretty much
follows that of the whole sample. The largest discrepancies are observed with
Clusters 1, 4 and 5:
In Cluster 1, the gender distribution is actually closest to 50/50. The profile
above even suggested this to be the so-called “Apple segment”, and indeed,
the broad appeal to both genders may indicate the existence of this kind of
segment.
Cluster 4 was the mystery cluster which strongly favors mobile gaming
without an apparent reason. From the gender distribution point of view,
this cluster seems to be consisting of mostly male players, with the highest
proportional male representation across all clusters.
In terms Cluster 5, non-gaming seems more gender-neutral, as seen by the
closer to 50/50 gender distribution, quite similar to that in Cluster 1.
7.3.3 Cross-Tabulation with Age Groups
Next, the five clusters are observed through the age distribution of the
respondents, with a similar matrix as shown above. Table 9 details the age groups
distribution.
As can be seen from Table 9 and the chi-square probability tests, age distribution is
even more independent from the clustering memberships, as almost all clusters
observe the similar age distribution as the respondents overall. The discrepancies
become more difficult to analyze because the number of observations in some cells
are too low (Malhotra & Birks 2007, 523). In this regard, there might not be
enough data for a meaningful age or age group based analysis. However, we can

62
Under 18 18-23 24-29 Above 30
1 17 % 28 % 46 % 9 % 132 23.6
2 13 % 27 % 45 % 15 % 135 24.5
3 12 % 28 % 49 % 12 % 109 24.2
4 15 % 24 % 40 % 21 % 62 24.5
5 6 % 30 % 46 % 19 % 54 25.8
64 135 225 68 492 24.3
13 % 27 % 46 % 14 % 100 %
Age Groups
Total
Cluster
Total
Average
Table 9: Cross-tabulation with age groups (chi-square 10.5 with 12 degrees of freedom, p =
0.57, insignificant)
briefly focus on Cluster 4 data in the attempt to discern more information about
the mystery cluster. From the Age Groups information, there seems to be a gap
where the 24-29 year olds have an underrepresentation and above 30s are
overrepresented in the cluster. Therefore, we may assume this small cluster has a
fewer number of children and students, and more working people and beyond.
Still, looking at average ages, Cluster 4 does not seem that different from other
clusters. The age difference alone does not explain the adoption inclination, and
further analyses are needed.
7.3.4 Cross-Tabulation with Experience
Next, we move on from plain demographic information to more background
variables and look at the gaming experience. Note that this was a purely subjective
self-estimate that the respondents were supposed to make. See results in Table 10.
Interestingly, the relationship between experience and clustering solution seems
to be dependent, as shown by the lower-than-threshold chi-square test probability
value (Malhotra & Birks 2007, 522). Indeed, there are three clusters that differ
greatly from the overall, almost 50/50 distribution between Novice and Expert
players: Clusters 1, 3 and 5, of which 3 and 5 are more towards non-usage. Next,
we cross-examine the findings with previous information on the clusters:

63
Novice Expert
1 44 % 56 % 132
2 50 % 50 % 135
3 61 % 39 % 109
4 50 % 50 % 62
5 63 % 37 % 54
256 236 492
52 % 48 % 100 %
Total
Experience
Total
Cluster
Table 10: Cross-tabulation with experience (chi-square 9.6 with 4 degrees of freedom, p =
0.047, significant)
Cluster 1, the so-called “Apple user” cluster, has definitely more self-
proclaimed experts than average – actually more than any other clusters.
Perhaps there is a connection between how these people view mobile
games as easy to use and the fact that they regard themselves more as
experts rather than novices.
Cluster 3 was profiled earlier as advanced gamers for whom mobile games
were too easy and unchallenging, therefore uninteresting. However, in light
of this new information, with over 61% respondents in this cluster
considering themselves as novices, the previous profile description needs to
be updated. Since so few people turned out to be experts, the new
assumption for the Cluster 3 profile is people who are mostly novice with
mobile gaming but still feel it is too unchallenging and therefore
uninteresting.
Cluster 5 is also a non-gaming cluster, with people reacting strongly to the
difficulty of using mobile games. Therefore, it is expected that the relative
share of novices would be higher; in fact it is the highest among different
clusters (63%).
7.3.5 Cross-Tabulation with Use Context
Finally, the clusters are examined against use context. For this, there are two kinds
of contextual items. First, there is the use context factor that is derived directly
from the factor analysis output data that mainly measures context in one

64
dimension: whether the respondent is bored. The second available data is from the
multiple choice selection (Where do you play or imagine would be a good place to
play?) asked during the background question set. Table 11 combines both use
context data into a single view.
In
classroom
Public
venues
such as
restaurant
s or cafes
Outdoor
such as
parks At work
When in
public
transportat
ion such
as during
commute
School
dormitory At home
1 -0.003 29 % 64 % 46 % 33 % 77 % 33 % 86 % 132
2 -0.076 23 % 64 % 43 % 33 % 76 % 31 % 82 % 135
3 0.181 30 % 54 % 36 % 26 % 78 % 39 % 76 % 109
4 0.011 21 % 56 % 42 % 24 % 87 % 39 % 89 % 62
5 -0.179 24 % 35 % 33 % 26 % 70 % 31 % 76 % 54
128 284 202 145 381 169 403 492
26 % 58 % 41 % 29 % 77 % 34 % 82 %
Total
Cluster
Use
Context
Total
Where do you play or imagine would be a good place to play?
Table 11: Cluster means of Use Context and cross-tabulation of contextual locations
First, based on the use context factor scores within each cluster, the only larger
difference can be extracted between Clusters 3 and 5, both of which tend to be
more towards non-adoption. Cluster 3, who wouldn’t bother playing because the
games are not challenging enough, would still give the games a chance if they are
bored. On the contrary, the stronger non-gaming Cluster 5 does not even consider
mobile gaming as a means to fight boredom.
Second, from the mobile gaming locations perspective, there is also little new
information to learn. Unfortunately, chi-square tests are unavailable for multiple
choice answers from the software side, but based on a brief evaluation, only a
handful of cells have values that differ much from the expected values based on
total numbers, so it is unlikely that there are any dependencies between cluster
membership and use location. Still, a few highlights can be noted from the data:
For the non-gaming Cluster 5, the number of potential or actual use
locations are lower than average across all response options, as can be
expected. However, the starkest difference is on the “Public venues such as

65
restaurants or cafés” option, with 23 percentage points lower than average.
Also, there were smaller but still noticeable discrepancies on “Outdoor” and
“Commute” options. This might indicate that the cluster is less outgoing, so
they do not actually even have similar opportunities to play mobile games
outside homes, compared to other clusters.
In Cluster 4, there is a distinct 10 percentage points higher than average
interest to play mobile games during commutes, which indicate a way to
fight boredom. Although the specific item to measure this in Table 11, use
context, is only slightly above average for Cluster 4, there is higher variation
(standard deviation over 1.0). Furthermore, the standardized factor score of
0 means roughly 4 on the 1-7 Likert scale, so the tendency for boredom
killing for is still moderate. With all available information, we might be able
to further complete the profile for Cluster 4. It now seems to be mostly adult
males, who have long, boring commutes and choose mobile games for an easy
way to fill the downtime.
To summarize, the complete proposed profiles for the five different clusters
extracted from the questionnaire sample data can be seen in Table 12. As
mentioned earlier this section, the cluster or segment profiles are more or less
subjective evaluations and interpretations based on the results of the analyses, so
some discretion is always needed. As such, the resulting profiles may also come
under some criticism and alternative interpretations, which is perfectly fine as
long as they can be justified.
Cluster
% of
sample Profile
1 27 % socially active and dedicated, skilled players with a usability focus, "Apple-
like usergroup"
2 27 % casual gamers looking for fun but still struggling with difficulty and usability
issues
3 22 % mostly novice mobile gamers but still feel it is too unchallenging and
therefore uninteresting, "non-adoption"
4 13 % white-collar workforce, mostly male, not very social, have long commutes
and choose mobile games for an easy way to fill the downtime
5 11 % less outgoing people to whom mobile games are too difficult to learn, and
not very fun anyway, "non-gamers"
Table 12: Summary of the suggested segment profiles

66
8 Conclusions
The purpose of this study was to explore the factors affecting mobile gaming
adoption. For practical purposes, the focus of the study was limited to mobile
gaming in the Chinese context. The theoretical foundation of the thesis was built on
Davis’s (1989) Technology Acceptance Model (TAM) and its later revisions, with a
specific focus on studies on mobile industry and mobile gaming.
The two-fold goal of the thesis were to respond to Liu and Li’s (2011) call for
research on the actual use of mobile gaming instead of just the intentions, and to
better connect TAM research, originating from the information systems sciences,
with the marketing discipline. With mobile gaming coming out of its nascent state,
the actual gaming behavior could indeed be studied. The cross-disciplinary
function of the thesis, on the other hand, was achieved by introducing the
analytical methods that were common on the marketing side into what inherently
was the IS sciences theory and methodology.
The empirical portion of the study was carried out as an online survey,
administered to the fans of a popular mobile game. Out of 585 respondents who
participated in the survey, 492 complete questionnaire forms were collected. The
data was processed with factor, regression and cluster analyses together with
cross-tabulation techniques to obtain the results to the research questions. The
initial three research questions were:
What are the main factors affecting mobile gaming adoption in the
Chinese context?
How has Technology Acceptance Model evolved in the past two decades into
covering mobile gaming research in China?
What kind of consumer segments the current and potential adopters of mobile
gaming in China can be divided into?

67
8.1 Results
With regard to the main research question, the factor analysis revealed that
respondents did not distinguish between different behavioral concepts (attitude,
intention and use), but instead considered them as one single item. Therefore, it
was natural to combine them into just one Adoption construct. In addition, the
thesis found four key factors that affected the said adoption: Perceived Ease of Use
(PEOU), Perceived Enjoyment (PE), Social Influence (SI) and Flow. Figure 14 recaps
the results of the factor and regression analyses.
Figure 14: The final model: Four factors and one dependent variable
As seen in Figure 14, PE had the strongest observed effect on adoption, followed by
SI and flow. PEOU had the least direct effect on adoption. However, SI, flow and
PEOU had a larger indirect effect; all three of them had a greater effect on PE than
adoption. PE also fed back to the experience of flow. The model is generally able to
explain between 27% and 56% of variance, which can be considered between
acceptable and excellent (Jokivuori and Hietala 2007, 46). The results are in line
with previous research, both fundamental theories such as the original TAM (Davis
1989) and the latest studies on mobile gaming in China and East Asia (Ha et al.
2007; Liang & Yeh 2011; Liu & Li 2011).

68
In terms of China-specific characteristics that emerged from the data, contextual
analysis confirmed what Liu and Li (2011) described about the Chinese urban life:
long commutes and lots of idle time. Still, public transportation was only the
second most popular contextual situation (77%) to play games, the most popular
place still being home, reported by 82% of respondents. The third most popular
use context were public venues such as restaurants (58%) and fourth, outdoor
(41%). The popularity of playing during commute witnessed a drastic increase
from 28% in the Analysys (2010) study to 77% in this thesis. Overall, almost all
situational contexts explored in the thesis scored higher compared to previous
studies, albeit not as significantly as commuting. The only exception was home,
which actually scored lower than in the past. Analysys (2010) reported that 85% of
respondents played at home.
From the marketing and segmentation perspective, perhaps the most interesting
and unique results of the thesis were the outcomes of the cluster and cross-
tabulation analyses. Based on the cluster analysis, five respondent clusters, or
segments, were identified, followed by cross-tabulating them against different
background variables (age, gender, experience and use contexts). Subjective
interpretations and profiling of the segments were conducted based on cross-
tabulations. The following five segments emerged:
1. The so-called Apple user group. These are young, hip, socially active people
who are also dedicated and skilled mobile gamers. 27% of the respondents
belong to this segment.
2. More casual, non-experienced gamers who are looking for fun but who still
are struggling with some usability issues, for example difficult-to-use
games. This segment is also 27% of the respondents.
3. The apathetic players. They are actually novice players but still consider
mobile games not very challenging, perhaps favoring other means to play.
Not very likely to adopt mobile games. The group size is 22% of the
respondents.

69
4. Mostly adult males. Possibly single because not very social, but have long
commutes and need some entertainment to fill the emptiness. High
adoption tendency but the segment size is only 13% of all respondents.
5. Non-gamers, with a few common denominators: less outgoing, not very
skilled at games, nor interested in entertaining themselves. Slightly older
than other segments. 11% of the respondents.
8.2 Theoretical and Managerial Implications
From the theoretical perspective, the results are yet another confirmation of the
applicability of Technology Acceptance Model (TAM) and its variants, when it
comes to the research on mobile services adoption. Mobile gaming does not seem
to be an exception. In fact, findings against that would probably have been counter-
intuitive, as there are already studies on mobile gaming, even China-specific ones,
which have successfully implemented TAM in their theory and research.
When looking at the development of the TAM research stream itself, the thesis
seemed to achieve what it set out to do: namely, extending TAM literature more
towards marketing discipline. The study introduced cluster analysis and cross-
tabulation techniques, seldom present in TAM and other information systems
studies, but which are more common in marketing. The five different segments
that were identified and profiled suggest that same analytical methods and
techniques could also be used in the future TAM studies with a marketing focus.
The managerial implications of the results are two-fold. First, by reaffirming the
past results, the thesis argues that business practitioners involved in the
development of mobile games should keep in mind the four key factors that affect
adoption: enjoyment, social influence, ease of use and flow experience. In other
words, great mobile games should be fun and social experiences with attention to
usability as well.

70
Second, the developers and marketers of mobile games should be aware of the
different player segments, or even non-players. Needless to say, it is increasingly
more difficult to create a product with wide, mass-like appeal. The segment
profiles seem to suggest, however, that to achieve a wider audience, the games
should be even easier to use. However, this trend could at the same time turn off
some potential gamers (such as the apathetic players). Some niche opportunities
also emerge, with the potentially single, white-collar male commuter segment.
Needless to say, all the resulting segment profiles apply only within the research
context, which in this thesis was China. There are no guarantees that the same
segments would exist in other areas.
8.3 Limitations and Suggestions for Future Research
Like always, there are some limitations with the study that should be considered
before making too decisive conclusions. First, the theoretical foundation of this
thesis is mainly based on one set of theories, TAM. Despite attempts to diversify
the theory basis into some supporting concepts such as flow, the end result looks
very much like a TAM study. There are both benefits and drawbacks to this. The
benefits are the easy validation process: there is a large, known research body
against which to reflect the findings. However, the drawback is that much of the
research is restricted to the same, familiar template: methodological innovations
rarely occur. For example, during the review of literature, we also came across
alternative models, such as the Information Systems Success Model (DeLone &
McLean 2003). Would it have made the theoretical framework and the data richer?
Possibly. However, fitting two models into a Master’s thesis would definitely have
been a test of resilience. The idea is fascinating, though, and hopefully gives one
avenue for future research to a scholar up for the challenge.
Second, as the sampling of the respondents was a mix of convenient and snow-ball
methods, concerns over respondent quality and the ability to generalize the results
are well-founded. Future research might be able to take this into account, and even

71
extend the scope of the study into a comparative review on the factors affecting
adoption on different parts of the world.
The third limitation links to two sorts of reliability issues. As noted in the
reliability assessment in Section 6.5, the questionnaire design was not perfect on
all aspects. The negatively worded items led to inconsistencies in the data, and
some items had to be removed. In future research, even more attention should be
put on how to build reliable questionnaire measures. The other reliability issue
concerns the qualitative way the segment profiles were produced. Because prior
data was not available, there was no way to assess whether the profiles sensible or
not. Only future, confirmatory studies on the topic can settle this open question.

72
References
Analysys. 2010. Chinese mobile gaming user research report 2010. China: Analysys International & d.cn, (accessed 21.2.2011).
Anderson, Chris. 2006. The long tail: Why the future of business is selling less of more. New York: Hyperion.
Bagozzi, Richard P. 2007. The legacy of the technology acceptance model and a proposal for a paradigm shift. Journal of the Association for Information Systems 8 (4) (04): 244-54.
Chen, Huan, and Eric Haley. 2010. The Lived Meanings of Chinese Social Network Sites (SNSS) among Urban White-Collar Professionals: A Story of Happy Network. Journal of Interactive Advertising 11 (1): 11-26.
Csikszentmihalyi, Mihaly, and Judith LeFevre. 1989. Optimal experience in work and leisure. Journal of Personality & Social Psychology 56 (5): 815-22.
Davis, Fred D. 1989. Perceived usefulness, perceived ease of use, and user acceptance of information technology. MIS Quarterly 13 (3) (09): 319-40.
de Vaus, David. 2002. Surveys in social research. 5th ed. London: Routledge.
DeLone, William H., and Ephraim R. McLean. 2003. The DeLone and McLean model of information systems success: A ten-year update. Journal of Management Information Systems 19 (4) (Spring2003): 9-30.
Deng, Zhaohua, Yaobin Lu, Kwok Kee Wei, and Jinlong Zhang. 2010. Understanding customer satisfaction and loyalty: An empirical study of mobile instant messages in china. International Journal of Information Management 30 (4) (08): 289-300.
ESRI. ArcObjects online documentation: Cluster analysis tool. 2002. Available from http://edndoc.esri.com/arcobjects/8.3/default.asp?URL=/arcobjects/8.3/samples/analysis%20and%20visualization/cluster%20analysis/clusteranalysis.htm (accessed July 15, 2011).
Fishbein, Martin, and Ajzen Icek. 1975. Belief, attitude, intention, and behavior: An introduction to theory and research. Reading, MA: Addison-Wesley.
Graham, Brad L. Blog post titled "september 10, 1999". 1999. Available from http://www.bradlands.com/weblog/comments/september_10_1999/ (accessed July 13, 2011).

73
Ha, Imsook, Youngseog Yoon, and Munkee Choi. 2007. Determinants of adoption of mobile games under mobile broadband wireless access environment. Information & Management 44 (3) (04): 276-86.
Hoffman, Donna L., and Thomas P. Novak. 2009. Flow online: Lessons learned and future prospects. Journal of Interactive Marketing (Mergent, Inc.) 23 (1) (02): 23-34.
IDC. IDC forecasts worldwide smartphone market to grow by nearly 50% in 2011. 2011. Available from http://www.idc.com/getdoc.jsp?containerId=prUS22762811 (accessed August 19, 2011).
Jankowicz, A. D. 2005. Business research projects. 4th ed. London: Thomson Learning.
Jennings, Ann S. 2002. Creating an interactive science murder mystery game: The optimal experience of flow. IEEE Transactions on Professional Communication 45 (4) (12): 297.
Jokivuori, Pertti, and Risto Hietala. 2007. Määrällisiä tarinoita: Monimuuttujamenetelmien käyttö ja tulkinta. 1st ed. Helsinki: WSOY.
Kotler, Philip, and Gary Armstrong. 2006. Principles of marketing. 11th ed. New Jersey: Pearson.
Koufaris, Marios. 2002. Applying the technology acceptance model and flow theory to online consumer behavior. Information Systems Research 13 (2): 205-23.
Liang, Ting-Peng, and Yi-Hsuan Yeh. 2011. Effect of use contexts on the continuous use of mobile services: The case of mobile games. Personal and Ubiquitous Computing 15 (2): 187-96.
Liu, Yong, and Hongxiu Li. 2011. Exploring the impact of use context on mobile hedonic services adoption: An empirical study on mobile gaming in china. Computers in Human Behavior 27 (2) (3): 890-8.
Liu, Yong, and Hongxiu Li. 2010. Mobile internet diffusion in china: An empirical study. Industrial Management & Data Systems 110 (3): 309-24.
Lu, June, Chang Liu, Chun-Sheng Yu, and Kanliang Wang. 2008. Determinants of accepting wireless mobile data services in china. Information & Management 45 (1) (01): 52-64.
Lu, June, Lu-Zhuang Wang, and Chun-Sheng Yu. 2007. Is TAM for wireless mobile data services applicable in china? A survey report from zhejiang, china. International Journal of Mobile Communications 5 (1) (01): 11-31.

74
Malhotra, Naresh K., and David F. Birks. 2007. Marketing research: An applied orientation. 3rd European Edition ed. Harlow: Prentice Hall.
Mallat, Niina, Matti Rossi, Virpi Kristiina Tuunainen, and Anssi Öörni. 2009. The impact of use context on mobile services acceptance: The case of mobile ticketing. Information & Management 46 (3): 190-5.
Milligan, Glenn W. 1980. An examination of the effect of six types of error perturbation on fifteen clustering algorithms. Psychometrika 45 (3): 325-42.
Mirvis, Philip H. 1991. Flow: The psychology of optimal experience. Academy of Management Review 16 (3) (07): 636-40.
Qi, Jiayin, Ling Li, Yuanquan Li, and Huaying Shu. 2009. An extension of technology acceptance model: Analysis of the adoption of mobile data services in china. Systems Research & Behavioral Science 26 (3) (05): 391-407.
Qu, Zhaorui, and Tianyi Pan. 2011. Conjoint analysis on the preferences of mobile gaming - 27E02000 models in marketing assignment 1 (spring 2011). Aalto University School of Economics, .
Quick, William. Untitled blog post on january 1, 2002 at 12:45am. 2002. Available from http://web.archive.org/web/20071227073108/http://www.iw3p.com/DailyPundit/2001_12_30_dailypundit_archive.php#8315120 (accessed July 7, 2011).
Rogers, Everett M. 1962. Diffusion of innovations. 1st ed. New York: Free Press.
Sharma, Rajeev, Philip Yetton, and Jeff Crawford. 2009. Estimating the effect of common method variance: The method--method pair technique with an illustration from tam research. MIS Quarterly 33 (3) (09): 473-A13.
Shen, Jingting. 3G drives up phone contracts. in China Daily. 2011. Available from http://www.chinadaily.com.cn/cndy/2011-06/20/content_12731865.htm (accessed August 19, 2011).
van Raaij, Erik M., and Jeroen J. L. Schepers. 2008. The acceptance and use of a virtual learning environment in china. Computers & Education 50 (3) (4): 838-52.
Venkatesh, Viswanath, and Fred D. Davis. 2000. A theoretical extension of the technology acceptance model: Four longitudinal field studies. Management Science 46 (2): 186-204.
Venkatesh, Viswanath, Michael G. Morris, Gordon B. Davis, and Fred D. Davis. 2003. User acceptance of information technology: Toward a unified view. MIS Quarterly 27 (3) (09): 425-78.

75
Verdegem, Pieter, and Lieven De Marez. 2011. Rethinking determinants of ICT acceptance: Towards an integrated and comprehensive overview. Technovation In Press, Corrected Proof .
Vyas, Seema, and Lilani Kumaranayake. 2006. Constructing socio-economic status indices: How to use principal components analysis. Health Policy and Planning 21 (6): 459-68.
Wilson, Dean. Smarphone boom keeping display manufacturers afloat. in TechEYE. 2010. Available from http://news.techeye.net/hardware/smartphone-boom-keeping-display-manufacturers-afloat (accessed August 19, 2011).
Zhang, Chen, Jinghua Huang, Jian Chen, Mingzhi Li, Hong Joo Lee, Jaewon Choi, and Jong Woo Kim. 2010. Research on adoption of mobile virtual community in china and korea. 2010 Ninth International Conference on Mobile Business / 2010 Ninth Global Mobility Roundtable: 220-9.
Zhou, Tao, Hongxiu Li, and Yong Liu. 2010. The effect of flow experience on mobile SNS users' loyalty. Industrial Management & Data Systems 110 (6): 930-46.

76
Appendix A: Survey Questionnaire (English)
Instructions: This survey will ask several questions on mobile phone gaming and games. For the sake of clarity, please only consider games that can be downloaded into mobile phones, such as applications on the iPhone. Traditional portable games and gaming devices such as Playstation Portable, Nintendo DS are not considered as “mobile phone gaming” in this study. Background info Gender: M/F Age: I see myself as an expert/novice gamer. Where do you play mobile games? (multiple choice)
o In classroom o Public venues such as restaurants or cafes o Outdoor such as parks o At work o When in public transportation such as during commute o School dormitory o At home o Other, specify: __________________________________________
Survey questionnaire Please rate the following statements from 1 (fully disagree) to 7 (fully agree). Perceived ease of use
1. Mobile games are easy to learn. 2. Playing mobile games requires mental effort. 3. Mobile games are easy to play. 4. It takes effort to become skillful at mobile games.
Perceived usefulness
5. Mobile games are useful. 6. Mobile games can increase my quality of life. 7. Playing mobile games makes my life better.
Perceived enjoyment
8. Mobile games make me happy. 9. Mobile games can provide me enjoyment. 10. Playing mobile games is fun.
Social influence
11. My friends play and recommend mobile games to me. 12. People that are close to me play mobile games.

77
13. People that I look up to play mobile games. 14. People who play mobile games have more prestige. 15. Playing mobile games is considered a status symbol.
Flow
16. When playing mobile games, I’m intensely absorbed in the game. 17. When playing mobile games, I’m concentrated on the game. 18. When playing mobile games, I feel detached from my surroundings. 19. When playing mobile games, I have a feeling of control. 20. When playing mobile games, I feel calm. 21. When playing mobile games, I feel confused.
Use context
22. I play mobile games when I’m feeling bored. 23. I play mobile games as a way to kill time. 24. I play mobile games when I have nothing serious to do. 25. I play mobile games when I have no access to other games.
Attitude
26. I favor the idea of playing mobile games. 27. I think playing mobile games is a good idea. 28. I like playing mobile games. 29. I feel good about using mobile games.
Intention
30. I intend to play mobile games in the future. 31. I believe I will play mobile games in the future. 32. I will try different types of mobile games in the future. 33. I will play mobile games more frequently in the future.
Behavior
34. I frequently play mobile games. 35. I play mobile games a lot.

78
Appendix B: Survey Questionnaire (Chinese)
问卷说明:本问卷仅就手机游戏进行调研,因此,只涉及能下载到手机(比如 iPhone)
里的一类游戏,不涉及 PSP,任天堂 DS 等游戏机中的游戏。
背景问题
性别:男/女
年龄:
我认为自己是个游戏:高手/新手。
你在什么场合玩游戏?(可选多项)
教室
餐饮等公共场所
公园等户外场地
办公室
乘坐公交工具时
学校宿舍
家里
其他,请指出:_________________________________________
问答卷
说明:请对以下陈述做评判,选 1(完全不同意)至 7(完全同意)。 Perceived ease of use
1. 手机游戏学起来快
2. 玩手机游戏费脑子
3. 手机游戏容易玩
4. 要下功夫才能成为手机游戏高手 Perceived usefulness
5. 手机游戏有用
6. 手机游戏提高我的生活质量
7. 手机游戏使我的生活更美好 Perceived enjoyment
8. 玩手机游戏让我高兴
9. 手机游戏给我带来快乐
10. 玩手机游戏很有趣 Social influence
11. 我朋友玩手机游戏,也建议我玩
12. 我的家人或朋友圈玩手机游戏
13. 我崇拜的人玩手机游戏

79
14. 玩手机游戏的人威望较高
15. 玩手机游戏能提高身价 Flow
16. 玩手机游戏时,我完全沉浸在游戏中
17. 玩手机游戏时,我集中注意力
18. 玩手机游戏时,我不知道周围发生什么事
19. 玩手机游戏时,我有掌控感
20. 玩手机游戏时,我很淡定
21. 玩手机游戏时,我不知如何下手 Use context
22. 我无聊时玩手机游戏
23. 我用玩手机游戏来打发时间
24. 我没什么重要事情做时就玩手机游戏
25. 无法玩其他游戏时我就玩手机游戏 Attitude
26. 我赞成玩手机游戏
27. 我认为玩手机游戏是件好事
28. 我喜欢玩手机游戏
29. 玩手机游戏时感觉不错 Intention
30. 我以后要玩手机游戏
31. 我觉得我以后会玩手机游戏
32. 我以后会尝试不同类型的手机游戏
33. 我以后会更经常地玩手机游戏 Behavior
34. 我经常玩手机游戏
35. 我玩手机游戏玩得很多