factors affecting carbon impacts of hsr - … · factors affecting carbon impacts of hsr ... 2.1...
TRANSCRIPT
CARBON IMPACTS OF HS2
Factors affecting carbon impacts of HSR
Version 3.1, 28 November 2011

28/11/2011 Carbon Impacts of HS2
Factors affecting carbon impact of HSR, version 3.1
2
CONTENTS GLOSSARY ............................................................................................... 3
1. INTRODUCTION ..................................................................................... 4
1.1 Scope .................................................................................................. 4
1.2 Organisation of this document .................................................................... 5
1.3 Method ................................................................................................ 5
1.3.1 How are emissions estimated? ............................................................................. 5
1.3.2 Which greenhouse gases? ................................................................................... 6
1.4 Embedded emissions ................................................................................ 6
2. FACTORS INFLUENCING TRAIN EMISSIONS ........................................................... 8
2.1 Train resistance ...................................................................................... 8
2.2 Rolling stock characteristics ...................................................................... 13
2.2.1 Aerodynamics ............................................................................................... 13
2.2.2 Seating capacity ............................................................................................ 13
2.3 Impact of operational strategy on train energy consumption ............................... 15
2.3.1 Timetable margins ......................................................................................... 15
2.3.2 Economic driving ........................................................................................... 16
2.3.3 Impact of booking strategy on train occupancy ....................................................... 17
2.3.4 Impact of intermediate stops ............................................................................ 17
2.4 Impact of infrastructure configuration on energy consumption during operation ....... 17
2.4.1 Horizontal and vertical alignment ...................................................................... 17
2.4.2 Route length ................................................................................................ 17
2.4.3 Speed restrictions .......................................................................................... 18
2.4.4 Integration of green energy sources with HSR infrastructure ...................................... 18
2.5 Breakdown of factors influencing train energy consumption ................................ 18
3. ADVICE AND APPROPRIATE ASSUMPTIONS ......................................................... 20
3.1 Embedded emissions: rolling stock .............................................................. 20
3.2 Operational emissions ............................................................................. 21
3.3 Likely or possible rolling stock developments in the future ................................. 26
3.3.1 Energy for comfort functions ............................................................................ 26
3.3.2 Air intake for ventilation ................................................................................. 26
3.3.3 Energy efficient automatic (computer-controlled) driving ......................................... 26
3.3.4 Overall train performance ................................................................................ 27
4. CONCLUSION ....................................................................................... 29
5. REFERENCES ....................................................................................... 30

28/11/2011 Carbon Impacts of HS2
Factors affecting carbon impact of HSR, version 3.1
3
GLOSSARY
ADEME Agence de l’environnement et de la maîtrise de l’énergie – French Agency for Energy and the Environment
AGV Automotrice à grande vitesse, high-speed rolling stock built by Alstom
EF Emissions Factor
GHG Greenhouse gas
HS High speed
HS2 High Speed 2
HSR High Speed Rail
HST High Speed Train
TGV Train à Grande Vitesse, French high speed train
RS Rolling stock
RSSB Rail Safety & Standards Board
UIC Union International des Chemins de fer – International Union of Railways

28/11/2011 Carbon Impacts of HS2
Factors affecting carbon impact of HSR, version 3.1
4
1. INTRODUCTION
SYSTRA has produced this desk study in the context of Greengauge 21’s ongoing work on the carbon impacts of high speed rail (HSR). The objective of this document is to provide input on the technological, engineering and operational factors that are likely to affect the carbon impacts of HSR through to 2050.
We concentrate on factors impacting the energy consumption (and thus the greenhouse gas emissions) of high speed trains:
The speed/energy relationship
The impact of operational strategy on emissions
The impact of technical (rolling stock and infrastructure) characteristics on energy consumption
1.1 Scope
In general, the objective of a carbon impact evaluation is to estimate (the order of magnitude of) greenhouse gas emissions resulting from a human activity and to establish the relative contribution of each emissions source.
The carbon impact of a high speed rail network includes:
Those emissions generated directly or indirectly by the HSR network
Those emissions avoided thanks to the high speed rail system
Often, carbon impact evaluations of transportation systems are limited to operational emissions, which are associated with operations of a given transportation mode, including any changes in other transport sectors (i.e. road, classic rail and air in the case of evaluation of a HSR) [8].
Nonetheless, a transport project generates emissions starting from the design stage, through construction, operations and on to final disposal of equipment. The HS2 Appraisal of Sustainability defines these embedded emissions as “emissions associated with construction of the scheme and manufacture of rolling stock” [8].
In the current document, we concentrate almost exclusively on operational emissions, in particular the technical and operational characteristics that impact carbon emissions of high speed rail.
Operational emissions include those emissions caused by:
Generation of electricity consumed for:
o Train traction and comfort functions (also called “hotel power”)
o Operations of stations, technical facilities and equipment
Operation of vehicles and equipment used for maintenance of infrastructure and rolling stock
Operation of vehicles
o Used by rail employees to access their place of work
o Used by passengers to access high speed rail stations

28/11/2011 Carbon Impacts of HS2
Factors affecting carbon impact of HSR, version 3.1
5
In addition, the overall operational carbon foot print includes emissions that are avoided thanks to high speed rail, due to modal shift from cars and airplanes; the overall operational footprint is thus estimated by subtracting those emissions that are avoided thanks to high speed rail from those that are generated by high speed rail.
The current document addresses only those operational emissions caused by the generation of electricity used for train traction and comfort functions.
The factors impacting these operating emissions include:
1) Rolling stock performance: capacity, traction, comfort functions and losses
2) Infrastructure characteristics
3) Operating strategy: booking strategy, operating speed, timetable margin, number of stops, etc.
4) Future developments in rolling stock
5) Overall ridership and load factor
6) Energy generation mix
7) Energy consumption/emissions from other modes: reductions due to modal shift from cars and planes, emissions due to access journeys to/from HSR stations
The current paper discusses the first 4 items; items 5 through 7 are being sourced elsewhere.
1.2 Organisation of this document
Chapter 2 discusses the impacts of
Rolling stock characteristics,
High speed infrastructure configuration,
Operational characteristics
on energy consumption.
The reasonable assumptions regarding train energy assumption and CO2 emissions that can be taken for work going forward are presented in chapter 3.2. Future developments in rolling stock are discussed in chapter 3.3.
All sources are referenced in brackets []; complete references are provided at the end of this document, starting on page 30.
1.3 Method
1.3.1 How are emissions estimated?
The evaluation of the carbon impact of a high speed rail project should be carried out from the cradle to the grave. That is, it includes not only emissions generated via operations, but also those embedded emissions linked to construction and ultimate disposal of structures and equipment.
Data regarding HSR-related activities is converted into estimations of greenhouse gas emissions using emissions factors.
The basic principle is thus to determine:

28/11/2011 Carbon Impacts of HS2
Factors affecting carbon impact of HSR, version 3.1
6
An inventory of the activities (and materials) related to the high speed rail system within the defined scope
The appropriate emissions factor for each activity
Greenhouse gas emissions are measured in terms of kg (or tons, or grams...) of carbon dioxide equivalent, written CO2e. If an activity emits 1 kg of CO2e, this means that the greenhouse gases emitted have the climactic heating power of 1 kg of CO2. For example, 1 kg of the greenhouse gas sulphur hexafluoride (SF6) has the heating power of 22,800 kg of CO2. Thus if a process releases 1 kg of SF6, this emission would appear in the global carbon footprint as 22.8 t CO2e.
The overall emissions linked to a given activity are calculated as follows:
Activity x emissions factor = greenhouse gas emissions
For example, according to version 2.2 of the Ecoinvent database [10], the production of 1 kg of “Reinforcing steel, at plant” emits 1.482 kg CO2e. Thus if the construction of a structure necessitates 10 tons of reinforcing steel, the embedded emissions due to the production of the steel are calculated as follows:
10,000 kg of reinforcing steel x 1.482 kg CO2e/kg of reinforcing steel = 14.82 t CO2e
1.3.2 Which greenhouse gases?
The estimations of greenhouse gas (GHG) emissions carried out in the Appraisal of Sustainability for HS2 take into consideration only carbon dioxide (C02): “no consideration has been given to convert other greenhouse gases to carbon dioxide equivalent” [8].
Of course, construction and operation of high speed rail systems lead to the release of other greenhouse gases recognised by the Kyoto protocol.
Deutsche Bahn notes the following examples related to rail systems:
Sulphur hexafluoride (SF6) (1 kg is the equivalent of 22.8 tons of CO2 [1]) is an inert gas used for shielding in electrical control gear [9]
Hydrofluorocarbons (HFC) are used in air conditioning systems (of both trains and cars) [9]
Methane (CH4) and nitrous oxide (N2O), though not produced directly by train operations, are released during extraction, production and transportation of fossil fuels [9]
Nonetheless, carbon dioxide emissions are the main source for the global warming potential of transportation-related processes. Deutsche Bahn estimates 93.4% of GHG emissions from train traction were due to CO2 [9].
The consideration of CO2 emissions only is particularly relevant given that one of the main objectives of greenhouse footprinting of high speed rail projects is to compare them with other modes. As long as the same approach is used in all cases, the comparison is valid.
1.4 Embedded emissions
As mentioned above, a complete carbon impact analysis of a high speed rail system should include both embedded and operational emissions. In order to evaluate overall carbon impact per passenger-km, for example, embedded emissions are spread out over the life of equipment and infrastructure.

28/11/2011 Carbon Impacts of HS2
Factors affecting carbon impact of HSR, version 3.1
7
Embedded emissions due to high speed line construction are not considered elsewhere in this document. Nonetheless, it is worth noting that1:
Operations represent the majority of overall emissions, but embedded emissions are non-negligible.
The vast majority of embedded emissions come from infrastructure, and not rolling stock construction.
The level of embedded emissions from civil engineering construction per km of line can vary from 1 to 20 (or more) in function of:
o The proportion of the line that is made up of tunnels, viaducts or major earthworks
o The construction methods (in particular, the use of quicklime to treat soil in earthworks has an enormous impact in terms of carbon emissions : in the case of the Rhein-Rhone high speed line, the use of quicklime represented 33% of emission related to construction work [25])
1 Conclusions taken from the article "L’évaluation carbone de la grande vitesse, une comparaison international” [24], which describes the work carried out by SYSTRA in 2010 for the UIC, comparing the carbon footprints high speed rail projects in various countries and various conditions.

28/11/2011 Carbon Impacts of HS2
Factors affecting carbon impact of HSR, version 3.1
8
2. FACTORS INFLUENCING TRAIN EMISSIONS
As explained in chapter 1.3.2, we remain consistent with prior work and only take into consideration emissions of carbon dioxide (CO2); other greenhouse gases are disregarded. As such, and given that all high speed rolling stock runs on electrical power, emissions are directly proportional to electrical consumption.
As the question of electricity generation mix (both today and in the future) is being sourced separately, and in order to focus solely on the question of energy consumption, the current analysis examines electrical consumption (expressed in kWh) rather than CO2 emissions. In ongoing carbon impact work, it will suffice to multiply energy consumption by the appropriate emissions factor in order to determine greenhouse gas emissions.
In order to allow for comparisons between trains and operating modes, it is often useful to speak in terms of energy consumption per seat or per seat-km; we do so often in the text that follows. Nonetheless, it is to be kept in mind that the exact number of seats in a train is a function not only of the train’s technical characteristics, but also of the commercial strategy of the train operating company. Thus energy consumption per seat necessarily increases when a train operator prefers to provide a large 1st class section (where each seat takes up more space), for example, though of course this parameter is completely independent of the train’s technical performance.
2.1 Train resistance
The energy needed to overcome train resistance is the energy needed to maintain a train at a constant speed on flat, straight track in the open air (that is, not in a tunnel). Traction to overcome resistance is the most significant source of energy consumption in high speed rail operations. At high speeds, overcoming aerodynamic resistance requires significantly more energy than acceleration.
As such, we take a detailed look at train resistance and its relationship with speed. It is important to keep in mind that the energy required to overcome resistance, as discussed in the current section, is only one part of the overall energy that is produced (and either lost or consumed) in order to run a high speed train.
For the moment we neglect hotel power, transmission losses, and mechanical losses. Furthermore, we compare theoretical journeys at constant speed (acceleration and deceleration are not taken into account) on perfectly straight flat infrastructure. The impacts of stops, gradients and losses are discussed in other sections.
The energy needed to maintain a train at a speed v is proportional to the running resistance R of the train. The running resistance R on a straight level track in the open air without wind is given by the Davis formula:
R = A + Bv + Cv2
A, B and C are coefficients specific to a rolling stock type (and to a set of assumptions regarding track), and each corresponds to specific types of resistance (breakdown according to [7]):
A (varies with weight): resistance that varies with axle load, including bearing friction, rolling friction and track resistance
B (term proportional to velocity): flange friction, effects of sway

28/11/2011 Carbon Impacts of HS2
Factors affecting carbon impact of HSR, version 3.1
9
C (term proportional to the square of velocity): air resistance, which depends on cross-section, streamlining of front and rear and length2, air density. Independent of weight.
Table 1 provides the Davis coefficients for two existing types of high-speed rolling stock (v is to be given in km/h, and the resulting R is in decanewtons).
Davis coefficients A B C
TGV-R 270 3.3 0.051
AGV-113 250 2.9 0.045
Table 1: Davis coefficients for TGV-R and AGV-11 high-speed rolling stock
The energy needed to overcome resistance R at constant speed for a distance d is given by R x d. We apply the proper conversions in order to determine the energy needed to overcome resistance at constant speed for a distance of 100 km; the results are presented in Table 2.
2 This includes material and paint, relief of vertical surfaces (doors and windows), roof (equipment, pantograph) and train bottoms (equipment, bogies, brake disks). 3 Corresponds to 11-car, 200-m AGV-11 rolling stock ordered by NTV in Italy. Each trainset has 460 seats.

28/11/2011 Carbon Impacts of HS2
Factors affecting carbon impact of HSR, version 3.1
10
Speed (km/h)
Journey time to
cover 100km
Energy to travel 100 km at constant speed (kWh)
Variation in energy consumption as
compared to 300 km/h Energy savings AGV-11 TGV-R AGV-11 TGV-R AGV-11
200 30 825 731 -49% -49% 11%
210 29 892 790 -45% -45% 11%
220 27 962 852 -41% -41% 11%
230 26 1,035 916 -36% -36% 11%
240 25 1,111 983 -32% -32% 11%
250 24 1,190 1,052 -27% -27% 12%
260 23 1,271 1,124 -22% -22% 12%
270 22 1,355 1,198 -17% -17% 12%
280 21 1,442 1,275 -11% -11% 12%
290 21 1,532 1,354 -6% -6% 12%
300 20 1,625 1,436 0% 0% 12%
310 19 1,721 1,520 6% 6% 12%
320 19 1,819 1,607 12% 12% 12%
330 18 1,920 1,697 18% 18% 12%
340 18 2,024 1,788 25% 25% 12%
350 17 2,131 1,883 31% 31% 12%
360 17 2,241 1,979 38% 38% 12%
370 16 2,354 2,079 45% 45% 12%
380 16 2,469 2,181 52% 52% 12%
390 15 2,587 2,285 59% 59% 12%
400 15 2,708 2,392 67% 67% 12%
Table 2: Energy4 needed to overcome resistance at constant speed for 100 km
Overall resistance is about 12% lower for the AGV, as compared with the TGV-R. (This does not mean that overall energy savings for the AGV per train-km is 12%, as energy for acceleration, regenerative braking, hotel power and a host of other parameters are not taken into consideration here. Alstom claims that the AGV reduces energy consumption by 15% as compared to competing rolling stock [2]. We have no reason to dispute this.)
At 350 km/h the AGV-11 requires about 250 fewer kWh than the TGV-R to overcome resistance per 100 km.
Figure 1 below shows that the C term (that is, air resistance) provides the overwhelming majority of resistance at high speeds.
4 The calculation estimates energy at the wheel, neglecting transmission and rolling stock losses, hotel power, etc. ; the assumed infrastructure is perfectly flat and straight, with no wind. Acceleration and braking are not taken into account.

28/11/2011 Carbon Impacts of HS2
Factors affecting carbon impact of HSR, version 3.1
11
0
1000
2000
3000
4000
5000
6000
7000
8000
9000
10000
0 100 200 300 400
Train resistance (daN
)
Speed (km/h)
C (air resistance)
B (rolling resistance)
A (bearing resistance)
Figure 1: Contribution of the 3 Davis equation terms to resistance of an AGV-11 in function of speed
Thus for high speed trains, the most relevant vector of improvement would be to reduce wind resistance per seat.
Higher speeds are of course only advantageous insofar as they provide reductions in journey times. Whereas Figure 2 presents the curve of the energy needed to overcome resistance for 100km in function of speed, Figure 3 shows the energy needed to overcome resistance over 100 km for the same range of speeds (from 200 km/h to 400 km/h), but in this graph the x-axis is scaled linearly function of journey time instead of speed. We can clearly see that, as speed increases, more energy is needed to save an extra minute. For example, an increase from 240 km/h to 300 km/h saves 5 minutes for a 100-km journey and requires approximately 450-400 kWh (depending on the rolling stock). However, in order to save another 5 minutes on the same 100-km journey, it is necessary to increase speed from 300 km/h to 400 km/h, a change which requires an additional ~1000 kWh.

28/11/2011 Carbon Impacts of HS2
Factors affecting carbon impact of HSR, version 3.1
12
0
500
1000
1500
2000
2500
3000
kWh
TGV‐R
AGV‐11
200 km/h(30 min)
250 km/h(24 min)
300 km/h(20 min)
350 km/h(17 min)
400 km/h(15 min)
speed(journey time for 100 km)
Figure 2: Energy to overcome resistance for a 100-km journey in function of speed/journey time (The x-axis provides a linear scale in terms of speed)
‐
500
1,000
1,500
2,000
2,500
3,000
kWh
TGV‐R
AGV‐11
15 min(400 km/h)
journey time for 100 km(speed)
25 min(240 km/h)
30 min(200 km/h)
20 min(300 km/h)
Figure 3: Energy to overcome resistance for a 100-km journey in function of journey time/speed (The x-axis provides a linear scale in terms of journey time)
The simulations carried out by the London Imperial College for HS2 Ltd [21] conclude that a Euston – Birmingham journey on High Speed 2 at a maximum speed of 360 km/h will consume 23% more energy than the same journey with a maximum speed of 300 km/h. As we do not know the Davis coefficients used for the reference train modelled in the simulations, we compare this result with the AGV-11.

28/11/2011 Carbon Impacts of HS2
Factors affecting carbon impact of HSR, version 3.1
13
The AGV-11 requires 38% more energy to overcome resistance at 360 km/h than at 300 km/h. This figure, however, applies to a theoretical journey at constant speed. The London-Euston journey of course involves accelerations, decelerations, and stretches of the journey with speed limitations that would be applied to both the 360 km/h and the 300 km/h scenario. Thus we cannot reproduce the simulation; nonetheless, it seems reasonable that the overall increase in energy consumption would be less than 38%, considering in particular the fact that the difference in speed would only apply for part of the journey.
2.2 Rolling stock characteristics
2.2.1 Aerodynamics
As we have seen above, the most important factor impacting energy consumption per seat-km as speed increases is air resistance, which increases with the square of the speed.
The air resistance of a high speed train is less than that of a conventional train (for example TGV-R or TGV-Duplex rolling stock offers about 35% less resistance than a conventional train [31]) thanks to such modification as front and back shape, continuity of the cars (small breaks, doors5 and windows flush with outer walls), rounded outer surface, streamlined protection where possible on equipment.
In theory, the passage from a 1- to a 2-level high speed train would increase air resistance by about 14%, but thanks to aerodynamic optimisations the TGV-Duplex only offers 5% more air resistance than previously existing 1-level TGV [31].
In additional, overall air resistance per seat is reduced when two trainsets are combined. The simulations carried out by London Imperial College indicate that a 3 – 4% net energy savings can be obtained on a Euston-Birmingham journey per seat by joining two trainsets [21].
2.2.2 Seating capacity
Naturally, the larger the seating capacity of a train, the lower the energy consumption per seat-km will tend to be.
According to Takao Shoji in the article “Efficiency Comparisons of the Typical High Speed Trains in the World”, published in Japanese Railway Engineering No. 165, 2009 [28], the primary factors affecting seating capacity are trainset width and height, power arrangement, type of connection between cars and number of seating levels. One can add to this list train length and operating considerations (that is, proportion of 1st and 2nd class seats, seat size and arrangement, number and type of rest facilities, type of refreshment/snack facilities, etc.).
2.2.2.1 Width and height
Whereas Japanese and Taiwanese high speed trains can be up to 3.38 m wide; French and Italian trains barely exceed 2.9 m; Spanish high speed trains are under 3m, and Germany high speed trains just barely exceed 3m in width (source: SYSTRA database). The wider passenger cars seen outside of Europe allow for rows of 5 seats, instead of only 4 [28], thus significantly improving potential seating capacity.
Providing 2 seating levels (as in the case of the TGV Duplex) also increases seating capacity; we see that the TGV Duplex offers the best capacity per metre of the shown European rolling stock.
5 In the case of the Shinkansen high speed trains run in Japan, doors are not flush with the trains’ outer wall; aerodynamics were sacrificed in favour of a door system allowing for more efficient dwell times.

28/11/2011 Carbon Impacts of HS2
Factors affecting carbon impact of HSR, version 3.1
14
Width (m) Length (m) Total seats
1st class seats % 1st class
Seats/metre of length
N700-3000 (Japan) 3.36 404.7 1323 200 15% 3.3
N700-7000 (Japan) 3.36 204.7 546 24 4% 2.7
THSRC (Taiwan) 3.38 304 989 66 7% 3.3
Eurostar 2.814 394 750 206 27% 1.9
TGV Réseau 2.904 200 375 118 31% 1.9
TGV Duplex 2.896 200 545 197 36% 2.7
AGV-11 2.9 200 460 2.3
Class 390 Pendolino 2.73 217 439 145 33% 2.0
Table 3: Seats/metre
2.2.2.2 Distributed motorisation
Current trends indicate that distributed motorisation (as in the ICE 3, the AGV, etc.) is the future of rolling stock. Distributed motorisation makes it possible to provide passenger seating in the cars that were formerly dedicated to motorisation. As we see in Table 3, the AGV (with distributed motorisation) offers the best seat/metre ratio of the 1-level European rolling stock shown here (the TGV Duplex has two seating levels).
2.2.2.3 Type of connection between cars
Whereas the French TGV, the AGV and the Talgo use an articulated car-connection system (in which each car-end shares a bogie with the adjacent car-end), other high speed rolling stock (German ICE, Japanese Shinkansen, etc.) possess 2 bogies per car. The articulated system offers the advantages of requiring fewer bogies per train length (and thus less maintenance), and providing particularly stable (and thus safer) rolling stock: the cars of articulated rolling stock maintain their upright alignment with each other, and as such articulated trains do not tend to topple over in case of derailment.
On the other hand, on high speed rail networks the maximum axle load is generally 17 tons, and articulated trains easily reach this limit. Classic connections between cars provide 2 bogies per car, and thus each car can be larger, heavier, and thus offer more seating capacity for a lower axle load.
2.2.2.4 Train length
Though wind resistance increases somewhat with train length, its elasticity to train length is less than one. That is, as train length increases (and seats are added), wind resistance per seat decreases. Nonetheless, train length is limited by infrastructure constraints. For the moment, High Speed 2 has been designed for trains with a maximum length of 400m (according to descriptions of Euston and Birmingham stations in HS2 Route Engineering Report [14]).
2.2.2.5 Operational considerations
The internal arrangement of any high speed rolling stock can be defined by the train operating company. Choices such as percentage of 1st-class seats, number of restrooms to provide, type of refreshment services (restaurant, bar or simply push-carts) of course have an impact on seating capacity.

28/11/2011 Carbon Impacts of HS2
Factors affecting carbon impact of HSR, version 3.1
15
Furthermore, rolling stock characteristics must be adapted to the intended services. More frequent and larger doors must be provided in order to reduce dwell times if frequent intermediate stops are planned for; these have an impact on overall seating capacity.
2.3 Impact of operational strategy on train energy consumption
2.3.1 Timetable margins
Train resistance shall provide us insight on the impact of timetable margins on overall energy consumption. SYSTRA’s paper on capacity for HS2 [31] indicates that a timetable margin must be applied in high speed rail operations. Assuming that the appropriate margin is 10%6, this means that timetabled travel times should be 10% longer than they theoretically would be if trains were to travel at the maximum authorised speed, using the strongest possible acceleration and deceleration. SYSTRA recommends in the capacity paper that in the case of HS2 this margin be applied to speed, and not to acceleration or braking. That is, acceleration and braking should be applied full-force, but “cruising” speed should be less than 90% of the maximum. Thus, considering that at term trains will be able to attain speeds of up to 360 km/h on HS2, most of the time (in normal operations, when there are no delays or speed restrictions), trains will travel at less than 324 km/h if a 10% margin is applied.
We have taken a look at the impact of timetable margins on the energy required to overcome resistance by calculating the energy saved when the constant “cruising” speed is reduced to 90% of the maximum. (Again, the energy measured here is that needed to overcome train resistance only. Energy losses, hotel power, accelerations, regenerative braking, etc., are not taken into consideration.) The results of this exercise are presented in Figure 4.
In function of rolling stock and of maximum speed, about 15 to 17% less energy is needed to maintain velocity for a given distance if trains run at about 90% of maximum speed.
As we have explained above, this corresponds to normal on-time operations. The impact of timetable margins should be taken into account in future work estimating the energy consumption of High Speed 2.
Version 1.0 of HS2 Ltd’s Summary Report on the Capacity and Capability for the High Speed Network [16] indicates that “in calculating the journey times and service patterns a maximum speed of 330 kph has been used (and a similar percentage of lower speeds down to 80kph). This allowance provides a margin for trains not operating to full potential and also the capability for trains to flex their relative positions during operation (i.e. catch up).”
This amounts to running trains at 91.7% of maximum speed; a 13% (maximum speed 200 km/h) to 15% (maximum speed 400 km/h) energy savings can be achieved to maintain velocity for a given distance if trains run at 91.7% of maximum speed.
6 10% is a particularly comfortable timetable margin, and corresponds to the margins applied in Spain, where RENFE guarantees extreme reliability; 5 to 7% margins are often applied in France.

28/11/2011 Carbon Impacts of HS2
Factors affecting carbon impact of HSR, version 3.1
16
0
500
1000
1500
2000
2500
3000
200 225 250 275 300 325 350 375 400
kWh
Max speed (km/h)
Energy to travel 100 km at constant speed(In function of maximum speed)
TGV‐R at max speed
AGV‐11 at max speed
TGV‐R at 90% of max speed
AGV‐11 at 90% of max speed
Figure 4: Energy to overcome resistance (for 100 km) in function of max speed, with and without timetable margin
2.3.2 Economic driving
Economic driving involves the intelligent utilisation of alignment characteristics, in particular gradients, in order to reduce overall energy consumption for a given alignment and journey time.
Clearly, braking on downhill gradients leads to losses in kinetic energy that must be made up for later by drawing in electricity. The higher the maximum allowable speed, the less braking must occur on downhill portions. It is for this reason, for example, that the maximum speed on some sections of the Paris – Lyon line – originally 260 km/h – was brought up to 270 km/h: in order to avoid braking on downhill sections.
If an uphill section is followed by a downhill section, it may be acceptable (if energy savings is a priority) to accept a loss of speed on the uphill section, so as to avoid achieving the maximum permitted speed (and thus needing to brake) before the end of the following downhill section. Of course, this form of economic driving also leads to some increase in journey time; a compromise must be found between the two constraints.
The way in which timetable margins are maintained also has an impact on overall energy consumption. The question arises of the way in which margin should be divvied up among acceleration, maintaining constant speed, coasting and braking.
The article “Energy-saving train operation” by West Japan Railway Company compared driving strategies in order to answer this question [35]. For a 644 km journey (maximum speed 285 km/h), the article indicates that a 4.4% energy reduction can be obtained by (1) maintaining for most of the journey a constant speed lower than the maximum, and then coasting at the end before the end-journey braking sequence, rather than (2) achieving the maximum speed, and then coasting at the end. The article goes on to indicate that the operating time remains the same in both cases.

28/11/2011 Carbon Impacts of HS2
Factors affecting carbon impact of HSR, version 3.1
17
Average energy consumption by Spanish AVE trains (per train-km) dropped by 10% with the introduction of economic driving [17].
The simulations carried out by London Imperial College indicate that an 11-13% savings in net energy consumption can be achieved on a London-Birmingham journey due to “optimised line speed” [21].
2.3.3 Impact of booking strategy on train occupancy
A reservation-only booking strategy allows for yield management and thus for higher occupancy rates. Furthermore, such a strategy allows passengers to place themselves on the platform before their trains arrives, thus reducing dwell times and increasing overall efficiency of the system.
Such a system means that all passengers must have a spot on a particular train; it does not exclude the possible of a show-up-and-go system in which passengers are able to reserve their spot 5 minutes before departure.
2.3.4 Impact of intermediate stops
According to the simulations carried out by London Imperial College, about 100 to 150 additional kWh are needed for traction per intermediate stop.
Thus service patterns impact overall energy consumption, and it may be desirable to attempt to maximise point-to-point services. (This is currently the case in France: Paris – Lyon, Paris – Marseille and Lyon-Marseille services exist; Paris-Marseille trains do not stop in Lyon.)
2.4 Impact of infrastructure configuration on energy consumption during operation
2.4.1 Horizontal and vertical alignment
Infrastructure configuration of course has an impact on energy consumption:
Curves. Curves increase mechanical resistance proportionally to rolling stock mass, but inversely proportional to the curve radius ([32], page 21). Large curve radii on high-speed infrastructure tend to minimise the impact of curves on energy consumption.
Gradients. Uphill gradients provide resistance that is proportional to train mass and the gradient. This resistance can be considerable, but with economic driving on high speed lines, efficient use can be made of the kinetic energy gained on downhill gradients. Simulations are needed in order to quantify the impact of gradients.
Tunnels. The simulations carried out by London Imperial College [21] indicate that a notional 10 km tunnel would increase energy needs at 320 km/h by 157, 107 or 65 kWh for tunnels with diameters of 8.5, 9.8 and 12 metres respectively. These results of course depend on the rolling stock and other assumptions applied to the simulation.
2.4.2 Route length
One simple reason for which high speed rail minimises energy consumption is that, for an itinerary between point A and point B, high speed infrastructure will tend to be shorter than conventional rail infrastructure. Of course one of the main objectives in the design of a high speed rail route is to minimise travel time; this necessarily means minimising the distance travelled. Furthermore, high speeds necessitate large curve radii, leading to “straighter” – and
28/11/2011 Carbon Impacts of HS2
Factors affecting carbon impact of HSR, version 3.1
18
thus shorter – rail lines. In Spain, for equivalent itineraries, high speed lines are around 18% shorter than conventional lines [3].
Another reason that high speed lines are often shorter than conventional lines is that they allow for higher gradients than conventional lines, which must be designed with freight traffic in mind. Thus, while conventional lines often follow meandering valleys, more flexibility is possible for high speed lines. This is the reason, for example, that the Paris-Lyon high speed line is 429 km long, 16% shorter than the 512-km old conventional line for the same itinerary.
2.4.3 Speed restrictions
One has a tendency to imagine that when high speed trains run on infrastructure with, say, a maximum speed of, 360 km/h, the trains literally accelerate to that speed, run for hundreds of kilometres at a constant speed of 360 km/h, and then come to a stop at the end. First of all, as we mentioned in section 2.3.1, the need to maintain timetable margins means that trains generally run at well below the maximum allowed speed. Furthermore, high speed trains may spend a great deal of their journey travelling at even lower speeds, due to (permanent) infrastructure-related speed restrictions (not to mention some number of intermediate stops).
Permanent speed restrictions may be imposed for a number of reasons: tunnels, turnouts, curves, stepped speed restrictions to conserve capacity7, etc. For example, current plans for the London-Birmingham stretch of High Speed 2 would indicate that the maximum speed is 320 km/h or less for about 50 km north of London ([30], diagram page 42). Furthermore, again in the case of High Speed 2, a great deal of running on the conventional line is planned.
Thus, a significant portion of a high speed train’s journey may be made at a speed well below top line speed; this minimises the variation observed in overall energy consumption, in function of variations in top line speed.
2.4.4 Integration of green energy sources with HSR infrastructure
Europe is beginning to see the creation of rail-specific green energy sources built into the infrastructure projects themselves. For example:
A Belgian high speed rail tunnel (on the Paris-Amsterdam high speed line) is topped with 16,000 solar panels. “The electricity produced is equivalent to that needed to power all the trains in Belgium for one day per year, and will also help power Antwerp station” [13].
The new Blackfriars station in London will have solar panels installed on the roof that should provide “enough energy to meet half its electricity needs” [12].
The widespread adoption of this type of approach can reduce HSR’s overall carbon footprint, all the while using spaces that have no other economic value [13].
2.5 Breakdown of factors influencing train energy consumption
Alberto García Alvarez, in his work carried out for the UIC, High speed, energy consumption and emissions (2010) [32], identifies and analyses the various factors contributing to train energy consumption, and compares the performance of high speed with that of conventional trains. His
7 Drastic speed reductions (from say 320 to 160 km/h) lead to significant losses in line capacity. However, capacity losses can be minimised if speed reductions are spread out over discrete steps (for example, 320 to 260 km/h, then 260 km/h to 160 km/h), at the cost of some increase in journey time. This concept is explained in SYSTRA’s document on capacity [30].
28/11/2011 Carbon Impacts of HS2
Factors affecting carbon impact of HSR, version 3.1
19
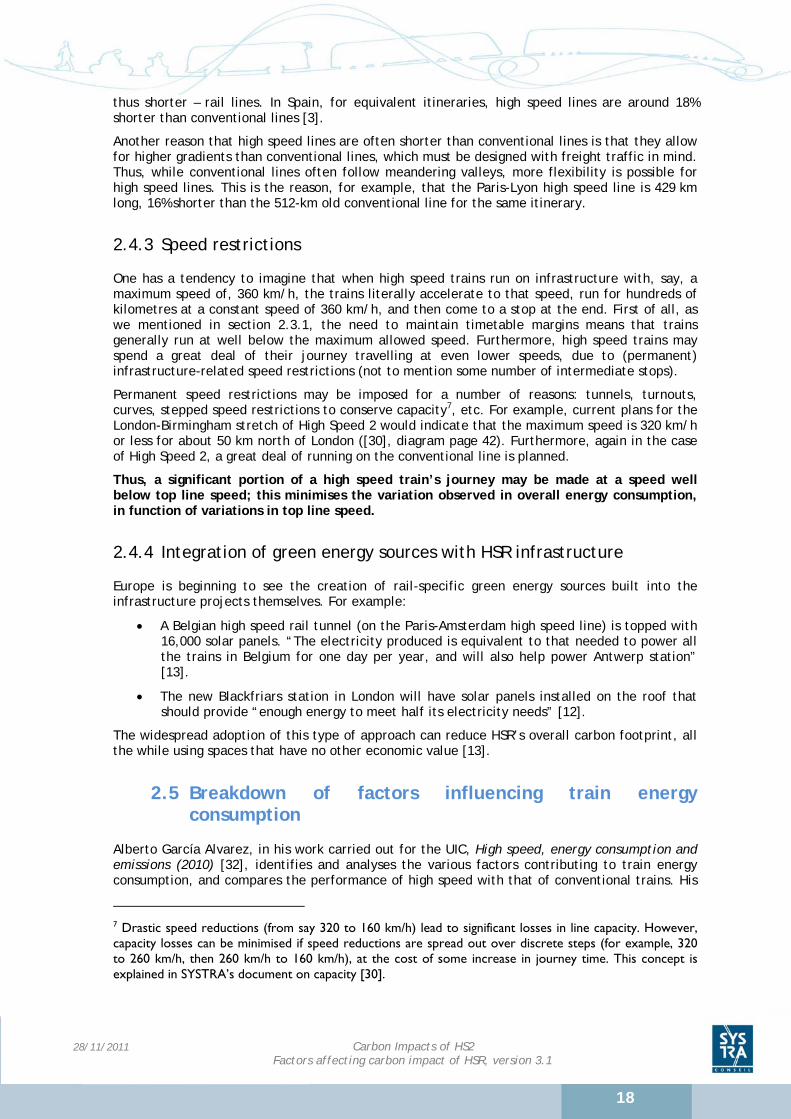
conclusions regarding the relationship of each term with speed (expressed as V) are summarised in Table 4 below. (We neglect for the moment both load factor and embedded emissions.)
The comments for each factor provide a comparison between the performance of high speed and conventional trains.
Factor Relationship with speed Comments
Mechanical resistance See
comment
Depends on track quality, bearing resistance, weight on each axle. According to AREMA [5] also bears linear relationship with speed, though Álvarez [24] neglects this.
Aerodynamic resistance
V2
“Varies directly with the cross-sectional area, length and shape of the vehicle and the square of its speed” [5]. The impact of aerodynamic resistance for high speed trains is minimised via aerodynamic shell design.
Air intake resistance V
Downhill braking losses
Decreases with speed
See above.
On-board comfort services Decreases
with speed
As energy consumption of on-board comfort services is linear with time, greater speed (and thus shorter journey time) leads to a decrease in the overall energy needed for comfort services.
Train and infrastructure losses
No relationship
Losses between the power plant and the substation are the same for conventional and high speed infrastructure. However, when high speed infrastructure is designed, Alvarez [32] argues that reduction of distance between substations can reduce losses between the substation and the pantograph.
Energy recuperated via regenerative braking
% increases with speed
Alvarez [32] in his paper for the UIC argues that on lines with high traffic density, a greater part of braking energy can be recuperated.
Energy lost due to curves
See comment
The energy lost in curves in the case of high speed lines is minimised (as compared to classic lines), as the curve radii are very large. (Alvarez [32] page 22)
Table 4: Train energy consumption: relationship with speed and comparison with conventional rail (Primary source: Alvarez 2010 [32])

28/11/2011 Carbon Impacts of HS2
Factors affecting carbon impact of HSR, version 3.1
20
3. ADVICE AND APPROPRIATE ASSUMPTIONS
An important part of our remit for the present work is to propose a set of reasonable parameters and assumptions that should be taken for work going forward on the carbon impact evaluation of High Speed 2. In particular, we need to determine whether the assumptions proposed by ATOC in their 2009 work on the CO2 impacts of high speed rail [6] need to be revised.
3.1 Embedded emissions: rolling stock
Previous work on the CO2 impacts of high speed rail has often neglected the impact of embedded emissions related to rolling stock construction and disposal. A complete carbon impact evaluation, taking into account the full lifecycle of the system in question, would make it possible to carry out a more complete (and thus more fully airtight) comparison among competing transportation modes. As such, we recommend that the construction and disposal of high-speed rolling stock be taken into consideration. In the same way, reductions in emissions achieved thanks the reduction in the overall market for cars and airplanes thanks to modal shift should also be taken into consideration.
The French carbon footprinting method [1] includes emissions due to construction to the emissions factors per vehicle-km. Per vehicle-km, the emissions taken into account for the construction of the vehicle are equal to the total emissions due to construction divided by the estimated lifespan of the vehicle (in km).

28/11/2011 Carbon Impacts of HS2
Factors affecting carbon impact of HSR, version 3.1
21
Parameter Value or
range Comments [Source(s)]
EF "passenger car, diesel, EURO5, city car, at plant"
1741.4
In kg CO2e/vehicle. Must be divided by estimated vehicle lifespan (in km) to obtain EF per vehicle-km [10]
EF "disposal, passenger car, diesel EURO5, city car"
172.76 In kg CO2e/vehicle. Must be divided by estimated vehicle lifespan (in km) to obtain EF per vehicle-km [10]
EF "maintenance, passenger car, diesel, EURO5, city car" 325.24
In kg CO2e/vehicle. Must be divided by estimated vehicle lifespan (in km) to obtain EF per vehicle-km [10]
Ratio EF production of recycled steel/production of non recycled steel
34%
If the production a certain quantity of non-recycled steel emits 1 kg CO2e, the production of the same quantity of recycled steel emits 0.34 kg CO2e Values in France [1]
EF Construction of HS rolling stock
3.7
In t C02e/tonne. Must be must be multiplied by train mass and divided by estimated vehicle lifespan (in km) to obtain EF per vehicle-km. Can be significantly reduced via utilisation of recycled steel. Based on ICE2 data, SYSTRA
EF Maintenance, cleaning and overhauls of HS rolling stock
4,600
In t C02e/train. Must be divided by estimated train lifespan (in km) to obtain EF per train-km. Can be significantly reduced via utilisation of recycled steel. Based on ICE2 data, SYSTRA
3.2 Operational emissions
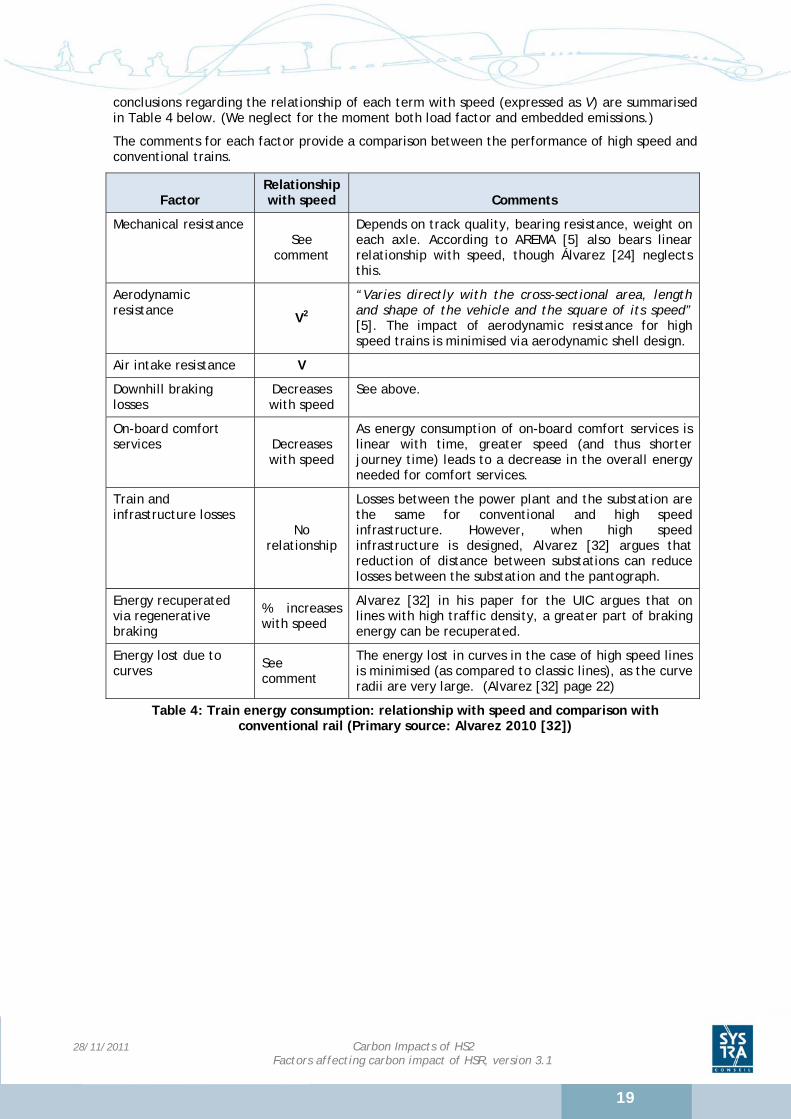
The ATOC work on CO2 impact of high speed rail presented the following summary of energy consumption per seat-km for a variety of existing high speed trains:
28/11/2011 Carbon Impacts of HS2
Factors affecting carbon impact of HSR, version 3.1
22
Train
Class 390 Pendolino (2003)
Class 373 Eurostar (1993)
TGV Réseau
(1992‐6)
TGV Duplex
(1995‐7)
Shinkansen 700 Series
(1998) AGV 2008Speed (km/h) 200 300 300 300 300 300Seating capacity 439 750 377 545 1323 650Length (m) 215 394 200 200 400 250Vehicles per unit 9 20 10 10 16 14Tare mass (tonnes) 460 723 386 384 634 510Mass per train metre (tonnes)
2.14 1.84 1.93 1.92 1.59 2.04
Mass per seat (tonnes)
1.05 0.96 1.02 0.7 0.48 0.78
Energy consumption (kWh/seat km)
0.033 0.041 0.039 0.037 0.029 0.033
Energy consumption (kWh/train km) 14 31 15 20 38 21
Figure 5: Energy consumption of existing HS rolling stock ([6] Reproduced with permission of GG21, addition by SYSTRA of last line)
It is extremely difficult to provide estimates of energy consumption per seat. In order to do so, it would be necessary to define identical infrastructure and service specifications and run simulations for each rolling stock type in question.
This work is not a part of our remit, and thus we cannot judge the figures provided for energy consumption. Nonetheless, we have taken the liberty of adding an additional line to the table in Figure 5: energy consumption per train-km. These figures seem to be in the same ballpark as those presented in Table 5, on page 24.
In any case, we consider that it is necessary to carry out software simulations of train journeys, based on appropriate rolling stock, operational and infrastructure characteristics, in order to estimate train energy consumption for HS2.
As for the other rolling stock characteristics provided, information available elsewhere does not contradict the data summarised in the table8. Nonetheless, we point out that the AGV with 650-seat capacity would correspond to a 250-m long AGV (14 cars). For the moment, the infrastructure of HS2 is planned to accommodate double trainsets for a total of about 400 m9, so the trainsets would be about 200 m long10.
8 It must be kept in mind that, for equivalent rolling stock, consumption varies greatly in function of maximum operating speed, driving technique, line profile, presence or not of speed restrictions, etc. As such, we can only expect that independent estimations of train energy consumption be around the same order of magnitude. 9 The Route Engineering Report published by HS2 Ltd in February 2011 [14] indicates that the planned Birmingham Curzon Street Station will accommodate 400-m trains (section 17.1), and that the length of the platforms built for high speed trains at London Euston will be 415 metres long (section 3.3). 10 A 200 m long, 11 car AGV trainset would have about 479 seats (assuming 57 seats per additional car, based on data from Alstom [2]). The 200-m 11-car AGV trainsets bought by NTV in Italy actually only have a capacity of 460 seats [23].
28/11/2011 Carbon Impacts of HS2
Factors affecting carbon impact of HSR, version 3.1
23
It is important to keep in mind that at this stage there is necessarily a great deal of uncertainty regarding the seating capacity of HS2 trains. The actual rolling stock that will be put into service is unknown, and even for a given type of rolling stock, actual seating capacity is not fixed, but rather determined by customer preferences.
The HS2 Technical Specifications published by HS2 Ltd in 2011 [14] indicate that trains will have a capacity of 1,100 seats, that is 550 seats per trainset. This figure was defined for demand modelling purposes. However, overall evaluations of the CO2 impact of high speed rail will need to give particular consideration to the uncertainty related to estimates of rolling stock capacity.
The table below presents a certain number of figures regarding average energy consumption per train-km that have been used by SYSTRA in various studies; most of these figures come from operating experience. Though they do not match exactly the figures presented in Figure 5, it must be kept in mind that for equivalent rolling stock, consumption varies greatly in function of: maximum operating speed, driving technique, line profile, presence or not of speed restrictions, etc.

24
Rolling stock Service description
Energy consumption
(kWh) Includes
hotel power?
Simulation or real data
With regenerative
braking? Description per train‐km
Eurotrain (2 locomotives and 12 cars)
Taipei-Kaohsiung (339 km), one 3-minute stop at Taichung, operating speed 285 km/h (Vmax=300)
27 NO Simulation YES
TGV SE (1 level, 2 locomotives, 8 cars)
Operating speed 270 km/h 24.2 NO SNCF
experience NO
Simulation TGV-R (1 level, 2 locomotives, 8 cars)
376 km route, speed unknown 22 NO Simulation NO
Single-level HST composed of 1 trainset (2 locomotives and 8 cars)
Operating speed 240 km/h (max speed 300 km/h)
23 YES SNCF experience
NO
Operating speed 290 km/h (max speed 350 km/h)
27 YES SNCF
experience NO
TGV Atlantique (1 level, 2 locomotives, 10 cars), max ramp 1.5%
Max speed 250 km/h 14.5 ?
SNCF experience
?
Max speed 270 km/h 17 ? ?
Max speed 300 km/h 21 ? ?
Japanese Series 500 train
On flat track at constant speed of 250 km/h 18 ?
Simulation ?
On flat track at constant speed of 300 km/h
24 ? ?
Real operations, max speed 270 km/h 26 ? Real data ?
TGV Duplex (2 levels, 2 locomotives, 8 cars)
Max speed 320 km/h 22.3 ? SNCF
experience ?
Table 5: Figures for average per-train-km energy consumption

28/11/2011 Carbon Impacts of HS2
Factors affecting carbon impact of HSR, version 3.1
25
In conclusion, the table below provides a summary of the value or range of values that we consider appropriate for a certain number of parameters related to operational emissions of high speed rail. All values are appropriate for present-day conditions, though they may evolve with time.
Parameter Value or
range Comments [Source(s)]
Electricity transmission losses (from the power plant to the pantograph)
8% - 11%
For example, if 1 kWh reaches the pantograph, between 1.0K and 1.11 kWh of electricity were generated. Ademe [1], RSSB [18]
Rolling stock traction energy losses (from pantograph to wheel)
20% SYSTRA
% comfort function power (as percentage of total power consumed by train)
6% - 15%
Electricity consumption for comfort functions is linear with time; it can be reduced via short turnaround times and high operating speeds. Köser [20], SYSTRA
Operating speed margin 5 - 10%
If operating speed margin is 10% and max speed is 360 km/h, on-time trains actually run at less than (100% - 10%) * 360 = 324 km/h. SYSTRA
Extra traction energy expended per stop (kWh)
100 - 150 Imperial College London HS2 Traction Energy Modelling 2009, 200m train [21]
Impact of passenger loading < 1% Variation in energy consumption between 70% and 100% load factor Imperial College [21], SYSTRA
Savings in energy consumption per seat due to 400 m train (as opposed to 200 m)
3 - 4 % per seat-km
Imperial College London HS2 Traction Energy Modelling 2009, for trip between Euston and Birmingham [21]
Savings possible due to "Economic" driving
11 - 15% Imperial College [21], Köser [20]
% of traction energy that can be recuperated
> 20%
Köser [20]
Note: This figure appears optimistic; it will be less for long, flat journeys, as is the case for most of HS2.
Impact of train mass Negligible for resistance (maintaining constant speed), linear with train mass in acceleration Köser [20]

28/11/2011 Carbon Impacts of HS2
Factors affecting carbon impact of HSR, version 3.1
26
Increase in air resistance due to passage from single- to double-decker train
5 – 14% Refers to overall resistance for trains of equivalent length.
SNCF [31]
Number of seats in an 11-car (4.07-ton and 200-m) AGV 460 – 479
Lower figure corresponds to AGV fleet to be put into service in Italy [23], higher figure is our estimate based on potential AGV seat capacity [2]
Number of seats in a 200-m 2-level trainset
550 Based on existing TGV Duplex, with 36% of seats in first class. Coherent with the 2011 HS2 Technical Specification [16].
3.3 Likely or possible rolling stock developments in the future
We begin this section with a discussion of the possible improvements that may be made in the future to reduce the energy consumption of rolling stock, and then move on to comment on the assumptions regarding future trends proposed by ATOC [6].
3.3.1 Energy for comfort functions
Comfort functions include lighting, heating, air conditioning, etc. As mentioned previously, energy needed for comfort functions is proportional to time. As such, this energy can be reduced via:
Augmentation of operating speeds, and thus reduction of journey times (though of course this also increases traction energy needs)
Maintenance of limited turnaround times in terminal stations
There is also the possible for comfort functions to be optimised. For example, a relatively wide range of temperatures inside seating areas may be acceptable. In particular, higher temperatures should be accepted in warm weather and lower temperatures in cold weather. It may also be feasible to optimise the timing of comfort functions. For example, it may be possible to cut off heating or cooling systems 10 minutes before arrival in a station.
3.3.2 Air intake for ventilation
Air is sucked into a high speed train for ventilation. The Alvarez paper for the UIC [32] indicates that the energy needed to overcome the resistance for this intake is proportional both to speed and the mass of air brought into the train (the speed of the air must be brought to the speed of the train, and the air must be conditioned or heated). A reduction in the quantity of air taken in would then reduce energy consumption. Currently, the mass of air is calculated based on the number of seats. Alvarez argues that in the future this function can be calculated dynamic based on actual train occupancy; if there are less passengers in a car, less air may be brought in ([32], page 50).
3.3.3 Energy efficient automatic (computer-controlled) driving
The tendency of current technology is to replace the functions of a human driver with automatic train control. If automatic train control acts like a car’s cruise control and simply maintains a constant speed (for example, maintaining very high speed on a uphill gradient, just to lose the

28/11/2011 Carbon Impacts of HS2
Factors affecting carbon impact of HSR, version 3.1
27
kinetic energy while braking on the following downhill gradient), the benefits of economic driving will be lost. It is thus imperative that automatic systems make “intelligent”, that is energy-efficient, decisions based on infrastructure characteristics and even weather conditions.
3.3.4 Overall train performance
The 2009 ATOC paper on CO2 impact of high speed rail indicates that for 2055 high speed rolling stock energy efficiency could be improved by 10% (as compared to Alstom’s AGV), “reflecting perhaps the use of light weight composite materials” ([6] page 15).
We have no reason to dispute this claim of a 10% overall improvement (for equivalent speeds), and we take the opportunity here to briefly discuss some possibilities.
42%
33%
16%
9%Bogies
Wet surface
Shape of front and back
Roof contour, pantograph, irregularities
Figure 6: Approximate breakdown of factors contributing to wind resistance of a TGV Duplex travelling at 320 km/h (Source: SNCF [31])
Figure 6 above shows that, in the case of a TGV Duplex, over 40% of wind resistance comes from the bogie. One source of resistance on the bogie are the vents designed to keep brakes from overheating. It may be imaginable to provide moveable covers for these vents that would deploy when the brake is not in use.
Other possible improvements could potentially come from better motor performance, additional streamline or indeed the use of lighter materials.
The table below, taken from the 2009 document on CO2 impact of high speed rail [6], presents a certain number of assumptions about the evolution of certain parameters up to 2055. As we pointed out in section 3.2, assumptions about energy consumption for High Speed 2 should be based on a 200-m trainset. (The 14-car, 650-seat theoretical AGV is a 250m trainset.)

28/11/2011 Carbon Impacts of HS2
Factors affecting carbon impact of HSR, version 3.1
28
Figure 7: Assumptions for evolution of RS energy consumption ([6] Reproduced with permission of GG21)

28/11/2011 Carbon Impacts of HS2
Factors affecting carbon impact of HSR, version 3.1
29
4. CONCLUSION
We have examined a number of factors influencing the energy consumption of high speed trains, including:
Rolling stock characteristics
Operational strategy
Infrastructure characteristics
Furthermore, we have provided an extremely brief look at the impact of embedded construction-related emissions. The points below summarise the most relevant or potentially surprising findings.
Timetable margins and economic driving. High speed trains do not generally run at maximum allowable speed, with maximum acceleration and braking. On the contrary, slightly longer journey times (from 5 to 10%) are timetabled in order to provide for recovery from the minor events of every-day operations. As a result, in order to calculate the energy consumption of a train running “at a maximum speed of 360 km/h”, one should consider that the train runs all or most of its journey at a lower speed. Furthermore, the presence of a margin makes it possible to apply economic driving techniques such as coasting before braking or adjusting speed in function of gradients.
Speed restrictions and stops. Infrastructure constraints (turnouts, curves, tunnels, etc.) may impose permanent speed restrictions for significant sections of line, even on high-speed infrastructure; furthermore, plans for High Speed 2 indicate that a large proportion of services will run on the conventional network. As such, the energy impact of the maximum operating speed on High Speed 2 will be mitigated by the fact that HS trains will be subject to speed restrictions for large sections of their journeys, no matter what the maximum speed.
Aerodynamics are the most significant source of resistance (and thus cause of energy consumption) at high speeds. On the other hand, mass is a relatively minor parameter to energy consumption. Furthermore, aerodynamic resistance grows more slowly than length. As such, joined trainsets consume less energy per seat-km than single trainsets.
Embedded emissions. Operations represent the majority of overall emissions, but embedded emissions are non-negligible.The vast majority of embedded emissions come from infrastructure, and not rolling stock construction. The level of embedded emissions from civil engineering construction per km of line can vary from 1 to 20 (or more) in function of: (1) The proportion of the line that is made up of tunnels, viaducts or major earthworks, and (2) The construction methods (in particular, the use of quicklime to treat soil in earthworks has an enormous impact in terms of carbon emissions : in the case of the Rhein-Rhone high speed line, the use of quicklime represented 33% of emission related to construction work [25])

28/11/2011 Carbon Impacts of HS2
Factors affecting carbon impact of HSR, version 3.1
30
5. REFERENCES
1 – ADEME. Bilan Carbone Entreprises et Collectivités – Guide des facteurs d’émissions version 6.1, French Agency for the Energy and the Environment (ADEME), June 2010.
2 – Alstom, AGV, Permance et modularité, archived by Wikipedia. Available at: http://archive.wikiwix.com/cache/?url=http://www.transport.alstom.com/home/elibrary/technical/products/32033.FR.php?languageId=FR%26dir=/home/elibrary/technical/products/&title=AGV%2C%20Performance%20et%20modularit%C3%A9 (Accessed: 2 November 2011)
3 – Álvarez, Alberto García. Incidencia del tren de alta velocidad en el consume energetic y emisiones del sector transporte, Funcación de los Ferrocarriles Españoles, Universidad Pontificia de Comillas, 14 November 2006. Available at http://www.ffe.es/dep/pdf/cenergia_tav.pdf (Accessed: 2 November 2011)
4 – Álvarez, Alberto García. Consumo de energía y emisiones del tren de alta velocidad en comparación con otros modos, January 2008. Available at: http://www.vialibre-ffe.com/PDF/Comparacion_consumo_AV_otros_modos_VE_1_08.pdf (Accessed: 2 November 2011)
5 – AREMA, Practical Guide to Railway Engineering. American Railway Engineering and Maintenance-of-Way Association (AREMA), 2003.
6 – ATOC. Energy consumption and CO2 impacts of High Speed Rail, ATOC analysis for Greengauge 21, April 2009. Available at: http://www.greengauge21.net/wp-content/uploads/Energy-Consumption-and-CO2-impacts.pdf (Accessed 2 November 2011)
7 – Barkan, Chris. Railroad Transportation Energy Efficiency, Illinois Railroad Engineering Program, 18 November 2009. Available at: http://128.173.204.63/courses/cee3604/cee3604_pub/rail_resistance.pdf (Accessed 2 November 2011)
8 – Booz & Co and Temple Group. HS2 London to the West Midlands Appraisal of Sustainability – Appendix 2 – Greenhouse Gas Emissions – A Report for HS2 Ltd, February 2011. Available at: http://highspeedrail.dft.gov.uk/library/documents/appraisal-sustainability (Accessed 27 October 2011)
9 – Deutsch Bahn. “DB vermeidet auch andere Treibhausgase”. Deutsche Bahn Nachhaltigkeitsbericht 2009, 1 July 2009. Available at: http://www.deutschebahn.com/site/nachhaltigkeitsbericht__2009/de/unsere__umwelt/klima/andere__treibhausgase/andere__treibhausgase.html (Accessed: 2 November 2011)
10 – Ecoinvent Database. Can be purchased at: http://www.ecoinvent.org/database/
11 – French Ministry of Transport, Infrastructures and Tourism. “25 ans de grande vitesse en France”, Press release, 2006.
12 – Fresh business thinking.com, “Blackfriars station to be powered by solar energy”, by M. Leach, 4 October 2011. Available at: http://www.freshbusinessthinking.com/news.php?NID=10372&Title=Blackfriars+station+to+be+powered+by+solar+energy (Accessed: 2 November 2011)
13 – Guardian, The. “High-speed Euro train gets green boost from two miles of solar panels”, 6 June 2011. Available at: http://www.guardian.co.uk/environment/2011/jun/06/tunnel-solar-belgium-rail. (Accessed: 2 November 2011)
14 – HS2 Ltd. High Speed Rail Consultation – Route Engineering Report, February 2011. Available at: http://highspeedrail.dft.gov.uk/sites/highspeedrail.dft.gov.uk/files/hs2-route-engineering.pdf (Accessed: 2 November 2011)
15 – HS2 Ltd. High Speed Rail Consultation - HS2 Technical Specification. Available at: http://www.hs2.org.uk/assets/x/77048 (Accessed: 2 November 2011)

28/11/2011 Carbon Impacts of HS2
Factors affecting carbon impact of HSR, version 3.1
31
16 – HS2 Ltd. Summary Report on the Capacity and Capability for the High Speed Network, version 1.0, 14 October 2011. Available at: http://www.hs2.org.uk/assets/x/79241 (Accessed: 25 November 2011)
17 – Jorgensen, Morten W., Spencer C, “Sorenson Estimating Emissions from Railway Traffic: Report for the Project MEET: Methodologies for Estimating Air Pollutant Emissions from Transport”, European Commission, July 1997. Available at: http://www.inrets.fr/ur/lte/cost319/MEETDeliverable17.PDF (Accessed: 14 November 2011)
18 – Kemp, Roger. T618 Traction energy metrics, Roger Kemp for the Rail Safety & Standards Board, 20 December 2007. Available at: http://www.rssb.co.uk/SiteCollectionDocuments/pdf/reports/research/T618_traction-energy-metrics_final.pdf (Accessed: 2 November 2011)
19 – KTH Railway Group. Green Train energy Consumption – Estimations on high-speed rail operations, P. Lukaszewicz, E. Andersson, 25 September 2009. Available at: http://www.gronataget.se/upload/PublikaDokument/GT%20Energy%20consumption%20slutl.pdf (Accessed: 2 November 2011)
20 – Köser et al. “Ökobilanzierung von Schienenverkehrssystemen am Beispiel des ICE-Verkehrs”, H. Köser, G. Herbst, E. Konitzer, C. Rozycki, 2002.
21 – London Imperial College. HS2 Traction Energy Modelling version 1.1, with simulation outputs from Imperial College, 31 December 2009. Available at: http://www.hs2.org.uk/assets/x/56774 (Accessed 2 November 2011)
22 – Network Rail. Comparing environmental impact of conventional and high speed rail. 2009. Available at: http://www.networkrail.co.uk/5878_Comparingenvironmentalimpactofconventionalandhighspeedrail.pdf (Accessed 2 November 2011)
23 – NTV (Nuovo Transporto Viaggiatori). La flotta NTV. Available at: http://www.ntvspa.it/it/nuovo-trasporto-viaggiatori/66/3/flotta-treni-alta-velocita-ntv (Accessed 2 November 2011)
24 – Revue générale des chemins de fer. “L’évaluation carbone de la grande vitesse, une comparaison internationale”, A. Jehanno, T. Baron, G. Martinetti, D. Pépion (SYSTRA), I. Barron de Angoiti (UIC), November 2010.
25 – RFF. Synthèse des resultants du Bilan Carbone ferroviaire global, RFF, ADEME, SNCF, 25 September 2009. Available at: http://www.bilan-carbone-lgvrr.fr/documents-dinformation (Accessed: 2 November 2011)
26 – RFF. Mission Grand Projet ferroviaire du Sud-Ouest GPSO – Fiche thématique Bilan Carbone, February 2011. Available at: http://www.gpso.fr/Fiche_thematique_bilancarbone_mars11.pdf (Accessed 2 November 2011)
27 – RFF. Focus sur l’utilisation de la chaux pendant le chantier, Antoine Hantz, 25 September 2009. Available at: http://www.bilan-carbone-lgvrr.fr/supports-presentation (Accessed: 2 November 2011)
28 – Shoji, T. “Efficiency Comparisons of the Typical High Speed Trains in the World”, Japanese Railway Engineering No. 165, 2009.
29 – SmartPlanet. “Sun-powered high speed rail rises in Europe”, Mahony, M., 7 June 2011. Available at: http://www.smartplanet.com/blog/intelligent-energy/sun-powered-high-speed-rail-rises-in-europe/6842 (Accessed: 2 November 2011)
30 – SYSTRA, SYSTRA Technical note: capacity and reliability (redacted), for HS2 Ltd, 26 October 2011. Available at: http://hs2.org.uk/publications/SYSTRA-Technical-note-capacity-and-reliability-redacted-77741 (Accessed: 2 November 2011)
31 – SNCF, Adaptation du TGV aux contraintes environnementales, by Olivier Brun. Available at: http://hs2.org.uk/publications/SYSTRA-Technical-note-capacity-and-reliability-redacted-77741 (Accessed: 2 November 2011)

28/11/2011 Carbon Impacts of HS2
Factors affecting carbon impact of HSR, version 3.1
32
32 – UIC, High speed, energy consumption and emissions, Alberto García Álvarez, Fundación de los Ferrocarriles Españoles, 21 December 2010. Available at: http://www.uic.org/IMG/pdf/report_hs_energy_consumption_emissions.pdf (Accessed 2 November)
33 – Ville Rail & Transports, “Un économiseur de trajet pour Canadien Pacifique”, 7 October 2009.
34 – Ville Rail & Transports. “Transports – L’enjeu énergétique”, by Marie-Hélène Poingt, 7 October 2009.
35 – West Japan Railway Company. “Energy-saving train operation”, by Takashi Aso and Naoki Takada. Available at http://www.energy-efficiency-days.org/IMG/pdf/25_West-Japan-Railway-Company_Energy_saving_Train_Operation3.pdf (Accessed: 14 November 2011)