factors affecting brand loyalty of …utcc2.utcc.ac.th/utccijbe/_uploads/v9no1june17_02.pdf ·...
TRANSCRIPT
3130
FACTORS AFFECTING BRAND LOYALTY OF ESSENCE OF CHICKEN BRAND TOWARDS CONSUMERS IN BANGKOK
by
Samachaya Homjitr E-mail: nui-iun_myself@hotmailcom
and
Suthawan Chirapanda Sato School of Business, University of the Thai Chamber of Commerce, Thailand
E-mail: [email protected]
Abstract
The objective of this research is to find the association or relation among factors that has an effect on the brand loyalty of chicken essence brand in Bangkok, including demographics, brand awareness, brand association, perceived quality and brand image which are the major factors that involved with brand loyalty. The sampling of 400 people was collected who has age over 15 years old and drink chicken essence as usual. The result indicated that there is no impact on demographic factors towards the brand loyalty in this study. Also, the finding from the multiple linear regression indicated that only brand association and perceived quality positively affected on the brand loyalty of chicken essence brands while the brand awareness and brand image have no relationship with brand loyalty.
Keywords:Demographics, Brand awareness, Brand association, Perceived quality, Brand image, Brand loyalty, Factors, Chicken Essence
1. Introduction
At present, the social in Thailand has economic prosperity, social and progress of communications. This communication channel could allow consumers to change their demands to a greater variety and also change their expending habits. In addition, Thai consumer behavior has been attracted by the health care flows which have gained widespread popularity such as eating chemical-free food, doing exercise, healthy eating lifestyle and nurture brain including various health products either in the form of tablets, capsules, powder and drinks. As a result, healthy drinks are becoming popularity nowadays. According to Richard Staack, he supposes “A functional beverage is a more convenient way to maintain a healthy lifestyle” (Kvidahl, 2014) and provides great taste. The chicken essence is classified as the brain functional drink, which is an alternative choice to consumers.
According to the result of Brand’s Essence of Chicken research, they found that the essence of chicken had a lot of benefits and the main benefits are to help people recover their physical and mental fatigues, especially it helped decrease levels of stress. Additionally, the essence of chicken actually helps people improve their concentration and memory (Wen, et al., 2014).
As a result, people start to consume the essence of chicken much more that compared to the past. However, Both Brand and Scotch companies, want to gain more percentage in the
3332
FACTORS AFFECTING BRAND LOYALTY OF ESSENCE OF CHICKEN BRAND TOWARDS CONSUMERS IN BANGKOK
by
Samachaya Homjitr E-mail: nui-iun_myself@hotmailcom
and
Suthawan Chirapanda Sato School of Business, University of the Thai Chamber of Commerce, Thailand
E-mail: [email protected]
Abstract
The objective of this research is to find the association or relation among factors that has an effect on the brand loyalty of chicken essence brand in Bangkok, including demographics, brand awareness, brand association, perceived quality and brand image which are the major factors that involved with brand loyalty. The sampling of 400 people was collected who has age over 15 years old and drink chicken essence as usual. The result indicated that there is no impact on demographic factors towards the brand loyalty in this study. Also, the finding from the multiple linear regression indicated that only brand association and perceived quality positively affected on the brand loyalty of chicken essence brands while the brand awareness and brand image have no relationship with brand loyalty.
Keywords:Demographics, Brand awareness, Brand association, Perceived quality, Brand image, Brand loyalty, Factors, Chicken Essence
1. Introduction
At present, the social in Thailand has economic prosperity, social and progress of communications. This communication channel could allow consumers to change their demands to a greater variety and also change their expending habits. In addition, Thai consumer behavior has been attracted by the health care flows which have gained widespread popularity such as eating chemical-free food, doing exercise, healthy eating lifestyle and nurture brain including various health products either in the form of tablets, capsules, powder and drinks. As a result, healthy drinks are becoming popularity nowadays. According to Richard Staack, he supposes “A functional beverage is a more convenient way to maintain a healthy lifestyle” (Kvidahl, 2014) and provides great taste. The chicken essence is classified as the brain functional drink, which is an alternative choice to consumers.
According to the result of Brand’s Essence of Chicken research, they found that the essence of chicken had a lot of benefits and the main benefits are to help people recover their physical and mental fatigues, especially it helped decrease levels of stress. Additionally, the essence of chicken actually helps people improve their concentration and memory (Wen, et al., 2014).
As a result, people start to consume the essence of chicken much more that compared to the past. However, Both Brand and Scotch companies, want to gain more percentage in the
3534
market share. Thus they have modified their strategy by improving their advertisement to modify their looks as well as using superstars who are knowledgeable and capable to present their image in order to convince the consumers to trust and need their brand and products. As a consequence, the action makes consumers concern about their health, loyal to their brand and have good attitude on purchasing decision.
Therefore, the researcher has seen the importance and been interested in doing the research on the topic of factors affecting brand loyalty of chicken essence brand towards consumers in Bangkok. Previous researchers have found the important variable such demographics, brand awareness, brand association, perceived quality, and brand image, all these variables have been identified as factors influencing brand loyalty. So these variables that researcher applied to brand loyalty of chicken essence consumers.
2. Literature Review
This research emphasizes on some variables that have an effect towards brand loyalty. This study is conducted by the researcher applying the research model from Charoenphan (2009). In previous study, the researcher had considered the factors of brand awareness, brand associations and perceived quality affecting to brand loyalty.
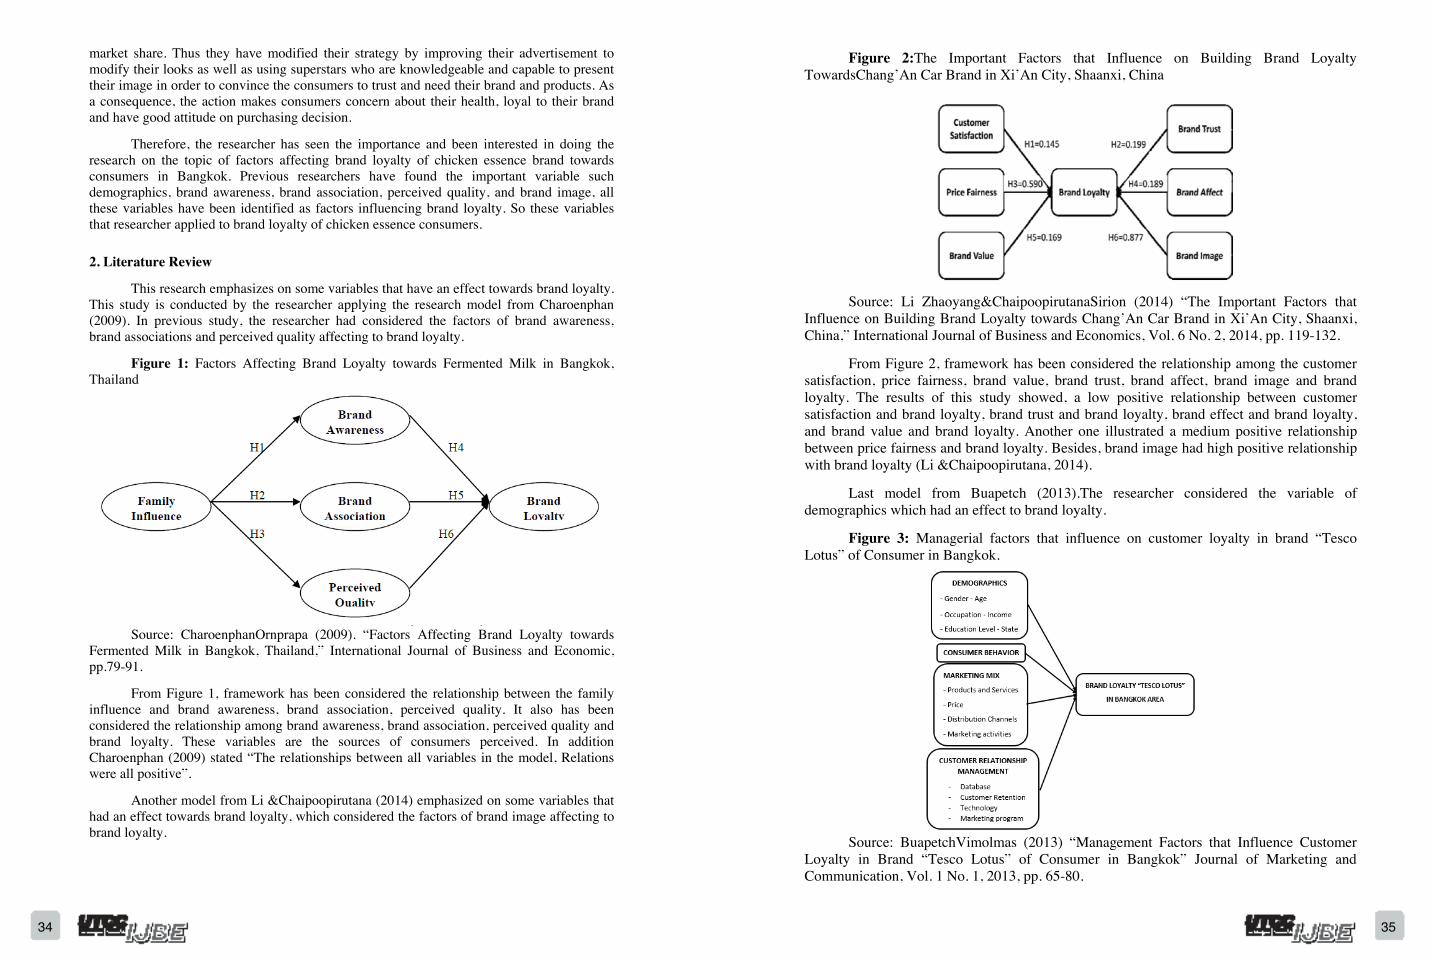
Figure 1: Factors Affecting Brand Loyalty towards Fermented Milk in Bangkok, Thailand
Source: CharoenphanOrnprapa (2009). “Factors Affecting Brand Loyalty towards Fermented Milk in Bangkok, Thailand,” International Journal of Business and Economic, pp.79-91.
From Figure 1, framework has been considered the relationship between the family influence and brand awareness, brand association, perceived quality. It also has been considered the relationship among brand awareness, brand association, perceived quality and brand loyalty. These variables are the sources of consumers perceived. In addition Charoenphan (2009) stated “The relationships between all variables in the model, Relations were all positive”.
Another model from Li &Chaipoopirutana (2014) emphasized on some variables that had an effect towards brand loyalty, which considered the factors of brand image affecting to brand loyalty.
Figure 2:The Important Factors that Influence on Building Brand Loyalty TowardsChang’An Car Brand in Xi’An City, Shaanxi, China
Source: Li Zhaoyang&ChaipoopirutanaSirion (2014) “The Important Factors that Influence on Building Brand Loyalty towards Chang’An Car Brand in Xi’An City, Shaanxi, China,” International Journal of Business and Economics, Vol. 6 No. 2, 2014, pp. 119-132.
From Figure 2, framework has been considered the relationship among the customer satisfaction, price fairness, brand value, brand trust, brand affect, brand image and brand loyalty. The results of this study showed, a low positive relationship between customer satisfaction and brand loyalty, brand trust and brand loyalty, brand effect and brand loyalty, and brand value and brand loyalty. Another one illustrated a medium positive relationship between price fairness and brand loyalty. Besides, brand image had high positive relationship with brand loyalty (Li &Chaipoopirutana, 2014).
Last model from Buapetch (2013).The researcher considered the variable of demographics which had an effect to brand loyalty.
Figure 3: Managerial factors that influence on customer loyalty in brand “Tesco Lotus” of Consumer in Bangkok.
Source: BuapetchVimolmas (2013) “Management Factors that Influence Customer Loyalty in Brand “Tesco Lotus” of Consumer in Bangkok” Journal of Marketing and Communication, Vol. 1 No. 1, 2013, pp. 65-80.
3736
According to Figure 3, framework has been considered the relationship between the demographics, consumer behavior, marketing mix, customer relationship management and brand loyalty. The results of this study in part of demographics showed that demographics has the different status impact on loyalty to the brand “Tesco Lotus” which was different while sex, age, education, occupation and income differences affecting brand loyalty to brand “Tesco Lotus” was no different (Buapetch, 2013).
The research framework of this study was adapted from the research model of Charoenphan (2009),Li &Chaipoopirutana (2014), Buapetch (2013). This research used some variables that had been already studied in the previous literatures.
As the previous mention, the researcher studied the topic of factors affecting brand loyalty of chicken essence brand towards consumers in Bangkok. The model was developed as follows.
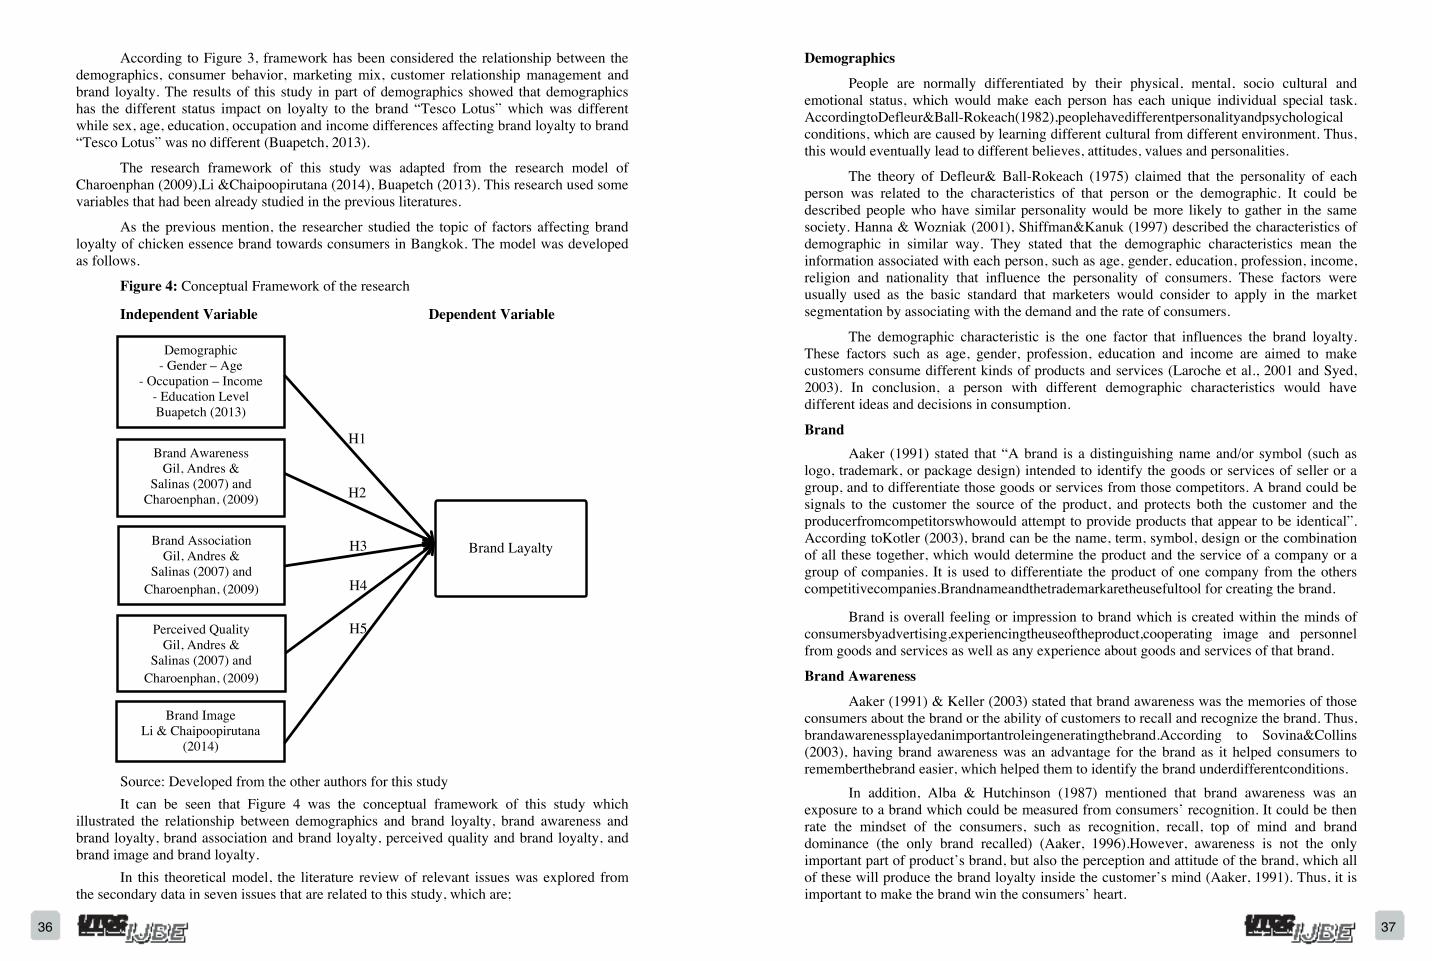
Figure 4: Conceptual Framework of the research
Independent Variable Dependent Variable
Source: Developed from the other authors for this study It can be seen that Figure 4 was the conceptual framework of this study which illustrated the relationship between demographics and brand loyalty, brand awareness and brand loyalty, brand association and brand loyalty, perceived quality and brand loyalty, and brand image and brand loyalty. In this theoretical model, the literature review of relevant issues was explored from the secondary data in seven issues that are related to this study, which are;
Brand Awareness Gil, Andres &
Salinas (2007) and Charoenphan, (2009)
Brand Association Gil, Andres &
Salinas (2007) and Charoenphan, (2009)
Perceived Quality Gil, Andres &
Salinas (2007) and Charoenphan, (2009)
Brand Image Li & Chaipoopirutana
(2014)
Brand Layalty
Demographic - Gender – Age
- Occupation – Income - Education Level Buapetch (2013)
H1
H2
H3
H4
H5
Demographics
People are normally differentiated by their physical, mental, socio cultural and emotional status, which would make each person has each unique individual special task. AccordingtoDefleur&Ball-Rokeach(1982),peoplehavedifferentpersonalityandpsychologicalconditions, which are caused by learning different cultural from different environment. Thus, this would eventually lead to different believes, attitudes, values and personalities.
The theory of Defleur& Ball-Rokeach (1975) claimed that the personality of each person was related to the characteristics of that person or the demographic. It could be described people who have similar personality would be more likely to gather in the same society. Hanna & Wozniak (2001), Shiffman&Kanuk (1997) described the characteristics of demographic in similar way. They stated that the demographic characteristics mean the information associated with each person, such as age, gender, education, profession, income, religion and nationality that influence the personality of consumers. These factors were usually used as the basic standard that marketers would consider to apply in the market segmentation by associating with the demand and the rate of consumers.
The demographic characteristic is the one factor that influences the brand loyalty. These factors such as age, gender, profession, education and income are aimed to make customers consume different kinds of products and services (Laroche et al., 2001 and Syed, 2003). In conclusion, a person with different demographic characteristics would have different ideas and decisions in consumption.
Brand Aaker (1991) stated that “A brand is a distinguishing name and/or symbol (such as logo, trademark, or package design) intended to identify the goods or services of seller or a group, and to differentiate those goods or services from those competitors. A brand could be signals to the customer the source of the product, and protects both the customer and the producerfromcompetitorswhowould attempt to provide products that appear to be identical”. According toKotler (2003), brand can be the name, term, symbol, design or the combination of all these together, which would determine the product and the service of a company or a group of companies. It is used to differentiate the product of one company from the others competitivecompanies.Brandnameandthetrademarkaretheusefultool for creating the brand.
Brand is overall feeling or impression to brand which is created within the minds of consumersbyadvertising,experiencingtheuseoftheproduct,cooperating image and personnel from goods and services as well as any experience about goods and services of that brand.
Brand Awareness
Aaker (1991) & Keller (2003) stated that brand awareness was the memories of those consumers about the brand or the ability of customers to recall and recognize the brand. Thus, brandawarenessplayedanimportantroleingeneratingthebrand.According to Sovina&Collins (2003), having brand awareness was an advantage for the brand as it helped consumers to rememberthebrand easier, which helped them to identify the brand underdifferentconditions. In addition, Alba & Hutchinson (1987) mentioned that brand awareness was an exposure to a brand which could be measured from consumers’ recognition. It could be then rate the mindset of the consumers, such as recognition, recall, top of mind and brand dominance (the only brand recalled) (Aaker, 1996).However, awareness is not the only important part of product’s brand, but also the perception and attitude of the brand, which all of these will produce the brand loyalty inside the customer’s mind (Aaker, 1991). Thus, it is important to make the brand win the consumers’ heart.
3938
It can be concluded that these factors namely brand name, logo, symbol, sale promotion, and so forth to certain associations in memory, are needed as the ability to make consumers to recall or recognize the brand (Keller, 2003).
Brand Association
Brand association is what the marketers create, such as characteristic, features and benefits, involved with the brand in order to create some mindset about the brand to the consumers. Through the thought processes, it is the belief of consumers to the brand (Aaker, 1991). However, consumers might have some positive or negative feeling to the brand, depending on their experiences of how incredible, memorable, or consistency of the brand.
Furthermore, Aakar’s theory had been supported by other academicians, such as Biel (1992), Keller (1993), Alba & Hutchinson (1987) and Park &Srinivasan (1994) which, had been reported that brand association had been created due to the feelings and experiences of consumers towards the brand. Arising from the experience, it was able to distinguish the difference of the product feature and can help consumers to make decision easierwhen consider whether they will purchase the products or not because it is the scope of the search for information on purchasing decisions (Osselaer& Alba, 2000). Also, this helps to reflect the features of the product (Chen, 2001).
Perceived Quality
Na et al. (1999), Boulding et al. (1993), Zeithaml (1988) and Steenkamp (1997) stated that consumers perceive quality from intrinsic and extrinsic attributes. The intrinsic attributes are related to the physical aspects of product (such as colour, flavour, form and appearance). On the other hand, extrinsic attributes are related to the product, not in the physical part of this one (such as brand name, stamp of quality, price, store, packaging and production information (Bernue´s et al., 2003).
This corresponds to the theory of Gronroos (1984) &Yoo et al. (2000) mentioning that the quality of the brand would be noticed through the communication by some marketing advertisement. Thus, the consumers could acknowledge the quality of the brand from direct experience and information received from environmental factors. However, the meanings of the perceived quality were included in the person that had never been used the product before or never had direct experience, while overheard and awareness something through the media allow mentioned above.
Furthermore, the perceived quality is created; it can make a difference of the product position, as the quality of the product could identify the level of the product. The product with high quality could attract more consumers; it would be likely the reason to buy the product (Morton, 1994). Also, it is a good basis to set the brand extension (Aaker, 1991).
Brand Image
Brand image, means the feelings of the customers when they are looking or talking about the brand. Temporal (2000) stated that the brand image was the reflection of the products and brand name, which showed how customers look or think about products.
Randazzo (1993) claimed that the brand image and the brand identity had the same meaning. He also stated that the brand image was a component of brand in the part of product components and perceptual components, which formed various factors such as the advertisement, packaging, labeling, trademark and the experience of using that product.
Thus, the brand image means the overall reflection of thoughts and feelings of consumers to the brand. The brand image usually comes from the advertisement or other marketing communication activities of the brand, which influences on the consumers to believe and perceive it and increase the relationship between customers and the brand. Thus, it would cause the brand image to have a significant effect on customer’s decision as the consumers do not only want the physical benefits, but also want the mental benefits.
Brand Loyalty
According to Dick &Basu (1994) & Taylor et al. (2004), brand loyalty was created by two factors, which were attitudinal and behavioral. The attitudinal factor was formed by the positive feelings of the consumers towards the brand, or created by the connection of the brand attitudes and the consumer’s preferences. Besides, behavior was the way that the consumers behave which results in a certain purchase habit. So it can be said that brand loyalty has an influence on the consumers’ experience, which is accumulated until it becomes familiar and brand loyalty (Kotler& Keller, 2006).
Aaker (1991) also mentioned that brand loyalty was the important factor for building up the brand equity. It was important to measure the consumers’ perspective of the brand loyalty for management interest in the value of brand equity (Keller, 2000). Also, brand loyalty could measure the relationship between the consumers and the brand by observing the amount of the products which had been sold (Keller, 1998).
In addition, Aaker (1992) stated that when consumers were loyal to the particular brand, it gave the benefits to those brands by reducing the marketing costs, trade leverage, attracting more consumers and competitor’s threats.
3. Research Methodology
In this research, questionnaire technique was used for data collection. It was collected from consumers who have drunk the essence of chicken both men and women over 15 years old. The time to collect questionnaires, started from 4 July, 2015 to 16 August, 2015. The amount of the data was 400 samples calculated by the quota sampling technique used for acquiring equally the number of respondents from each area. The respondents were recruited by using Convenience random from Bangkok area. The researcher focused on respondents who have studied in university 134 respondents, consisting of Kasetsart University and University of the Thai Chamber of Commerce; people who have worked in Sathon and Silom areas account for 133 respondents, including Silom Complex Tower and Empire Tower; and the rest of 133 respondents was collected from supermarkets, comprising of Big C Don Mueang and Tesco Lotus LatPrao.
The questionnaire was divided into six parts: the first part is included the study of the demographics of the respondents including gender, age, education, occupation, income, with five items; the second part is consisted of six items relating to brand awareness; the third part is comprised of eight items relating to brand association; the forth part is consisted of eight items relating to perceived quality; the fifth part is included of eight items relating to brand image; the final part is consisted of eight items relating to brand loyalty. Also, this study is set a different statement for each of those dimensions using Likert scale questions. Each question has a statement followed by a five-point Likert scale ranging from “strongly disagree” to “strongly agree” in the second part to the last part.
4140
Then, SPSS software was used to analyze the data from the questionnaire; test reliability (Cronbach’s Alpha), the Cronbach’s alpha value with greater than 0.7 represents high internal consistency reliability (Nunnally, 1978), descriptive statistics, T-test, One-way ANOVA, and multiple regression.
4. Results
4.1 Descriptive Analysis
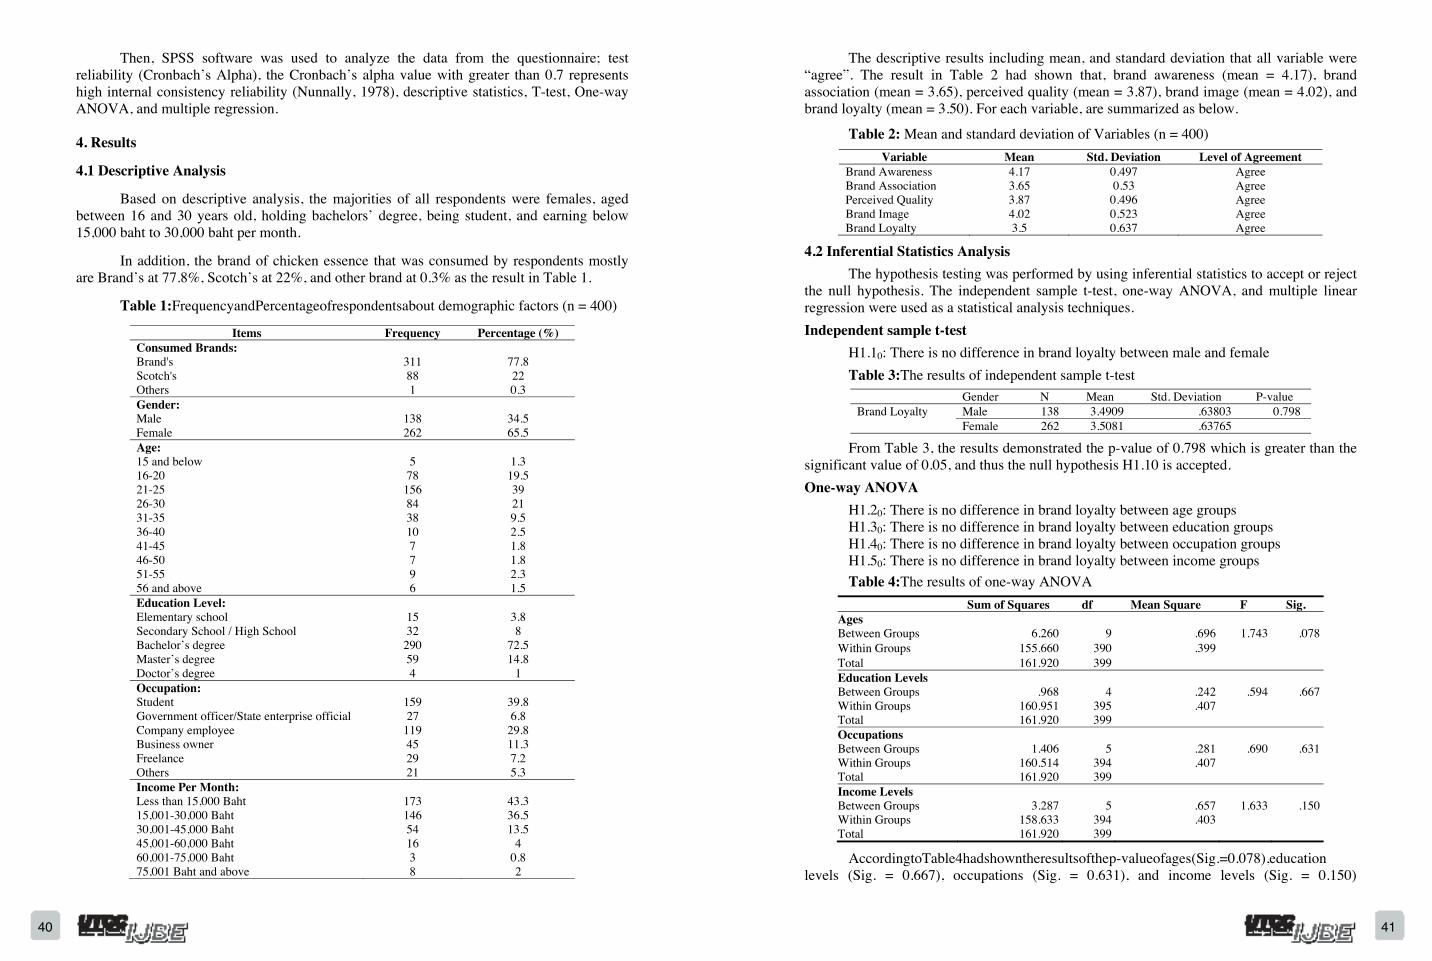
Based on descriptive analysis, the majorities of all respondents were females, aged between 16 and 30 years old, holding bachelors’ degree, being student, and earning below 15,000 baht to 30,000 baht per month.
In addition, the brand of chicken essence that was consumed by respondents mostly are Brand’s at 77.8%, Scotch’s at 22%, and other brand at 0.3% as the result in Table 1.
Table 1:FrequencyandPercentageofrespondentsabout demographic factors (n = 400)
Items Frequency Percentage (%) Consumed Brands: Brand's 311 77.8 Scotch's 88 22 Others 1 0.3 Gender: Male 138 34.5 Female 262 65.5 Age: 15 and below 5 1.3 16-20 78 19.5 21-25 156 39 26-30 84 21 31-35 38 9.5 36-40 10 2.5 41-45 7 1.8 46-50 7 1.8 51-55 9 2.3 56 and above 6 1.5 Education Level: Elementary school 15 3.8 Secondary School / High School 32 8 Bachelor’s degree 290 72.5 Master’s degree 59 14.8 Doctor’s degree 4 1 Occupation: Student 159 39.8 Government officer/State enterprise official 27 6.8 Company employee 119 29.8 Business owner 45 11.3 Freelance 29 7.2 Others 21 5.3 Income Per Month: Less than 15,000 Baht 173 43.3 15,001-30,000 Baht 146 36.5 30,001-45,000 Baht 54 13.5 45,001-60,000 Baht 16 4 60,001-75,000 Baht 3 0.8 75,001 Baht and above 8 2
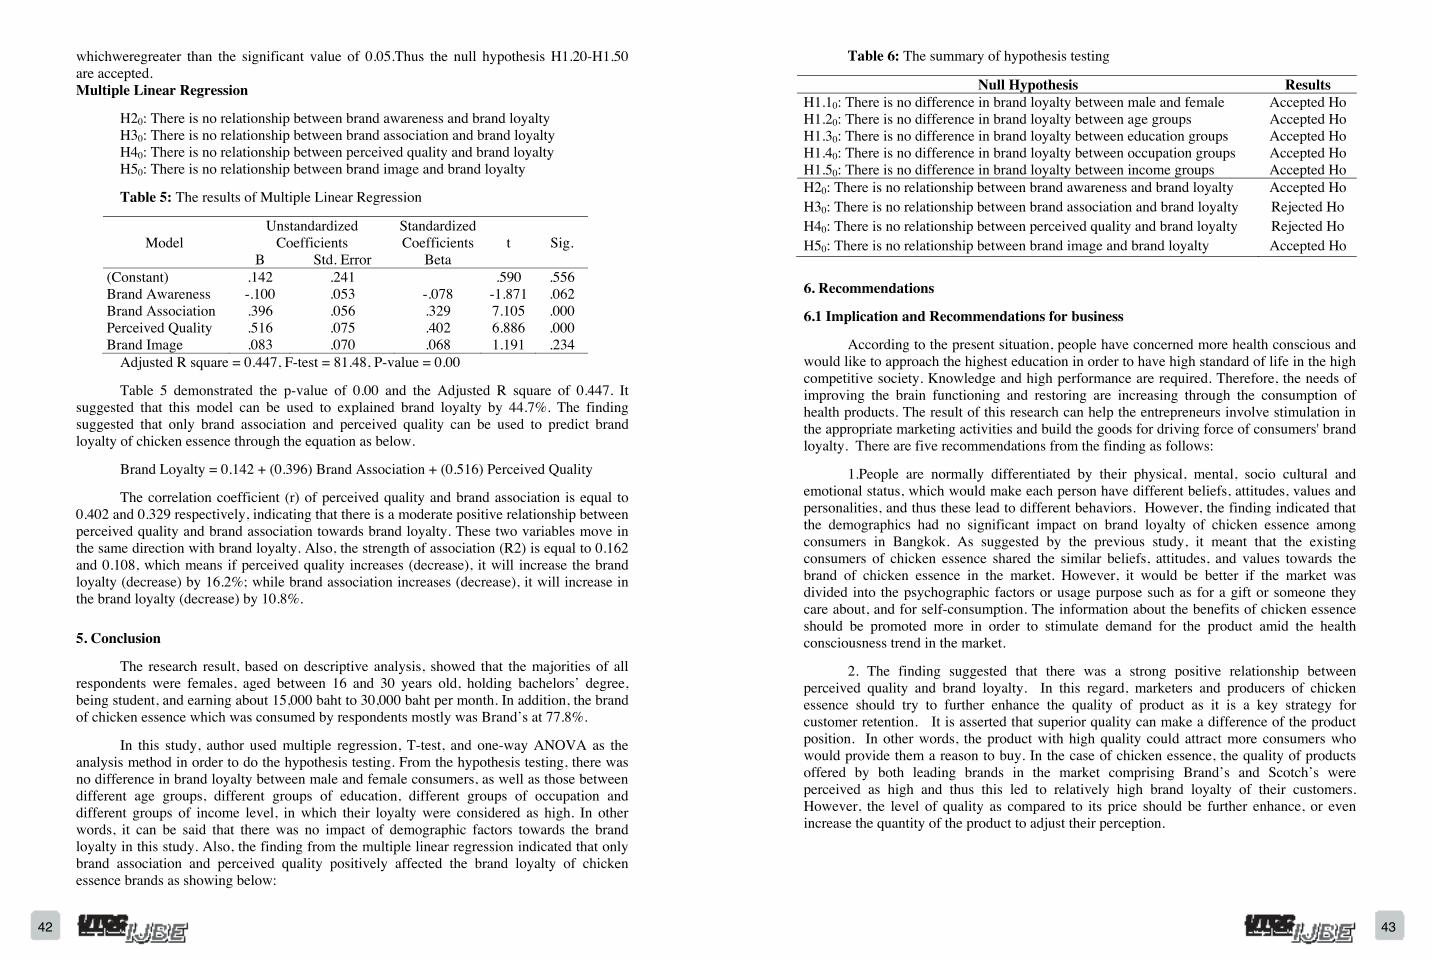
The descriptive results including mean, and standard deviation that all variable were “agree”. The result in Table 2 had shown that, brand awareness (mean = 4.17), brand association (mean = 3.65), perceived quality (mean = 3.87), brand image (mean = 4.02), and brand loyalty (mean = 3.50). For each variable, are summarized as below.
Table 2: Mean and standard deviation of Variables (n = 400) Variable Mean Std. Deviation Level of Agreement
Brand Awareness 4.17 0.497 Agree Brand Association 3.65 0.53 Agree Perceived Quality 3.87 0.496 Agree Brand Image 4.02 0.523 Agree Brand Loyalty 3.5 0.637 Agree
4.2 Inferential Statistics Analysis The hypothesis testing was performed by using inferential statistics to accept or reject the null hypothesis. The independent sample t-test, one-way ANOVA, and multiple linear regression were used as a statistical analysis techniques. Independent sample t-test H1.10: There is no difference in brand loyalty between male and female
Table 3:The results of independent sample t-test Gender N Mean Std. Deviation P-value Brand Loyalty Male 138 3.4909 .63803 0.798
Female 262 3.5081 .63765
From Table 3, the results demonstrated the p-value of 0.798 which is greater than the significant value of 0.05, and thus the null hypothesis H1.10 is accepted. One-way ANOVA H1.20: There is no difference in brand loyalty between age groups H1.30: There is no difference in brand loyalty between education groups H1.40: There is no difference in brand loyalty between occupation groups H1.50: There is no difference in brand loyalty between income groups
Table 4:The results of one-way ANOVA
AccordingtoTable4hadshowntheresultsofthep-valueofages(Sig.=0.078),educationlevels (Sig. = 0.667), occupations (Sig. = 0.631), and income levels (Sig. = 0.150)
Sum of Squares df Mean Square F Sig. AgesBetween Groups 6.260 9 .696 1.743 .078Within Groups 155.660 390 .399Total 161.920 399Education LevelsBetween Groups .968 4 .242 .594 .667Within Groups 160.951 395 .407Total 161.920 399OccupationsBetween Groups 1.406 5 .281 .690 .631Within Groups 160.514 394 .407Total 161.920 399Income LevelsBetween Groups 3.287 5 .657 1.633 .150Within Groups 158.633 394 .403Total 161.920 399
4342
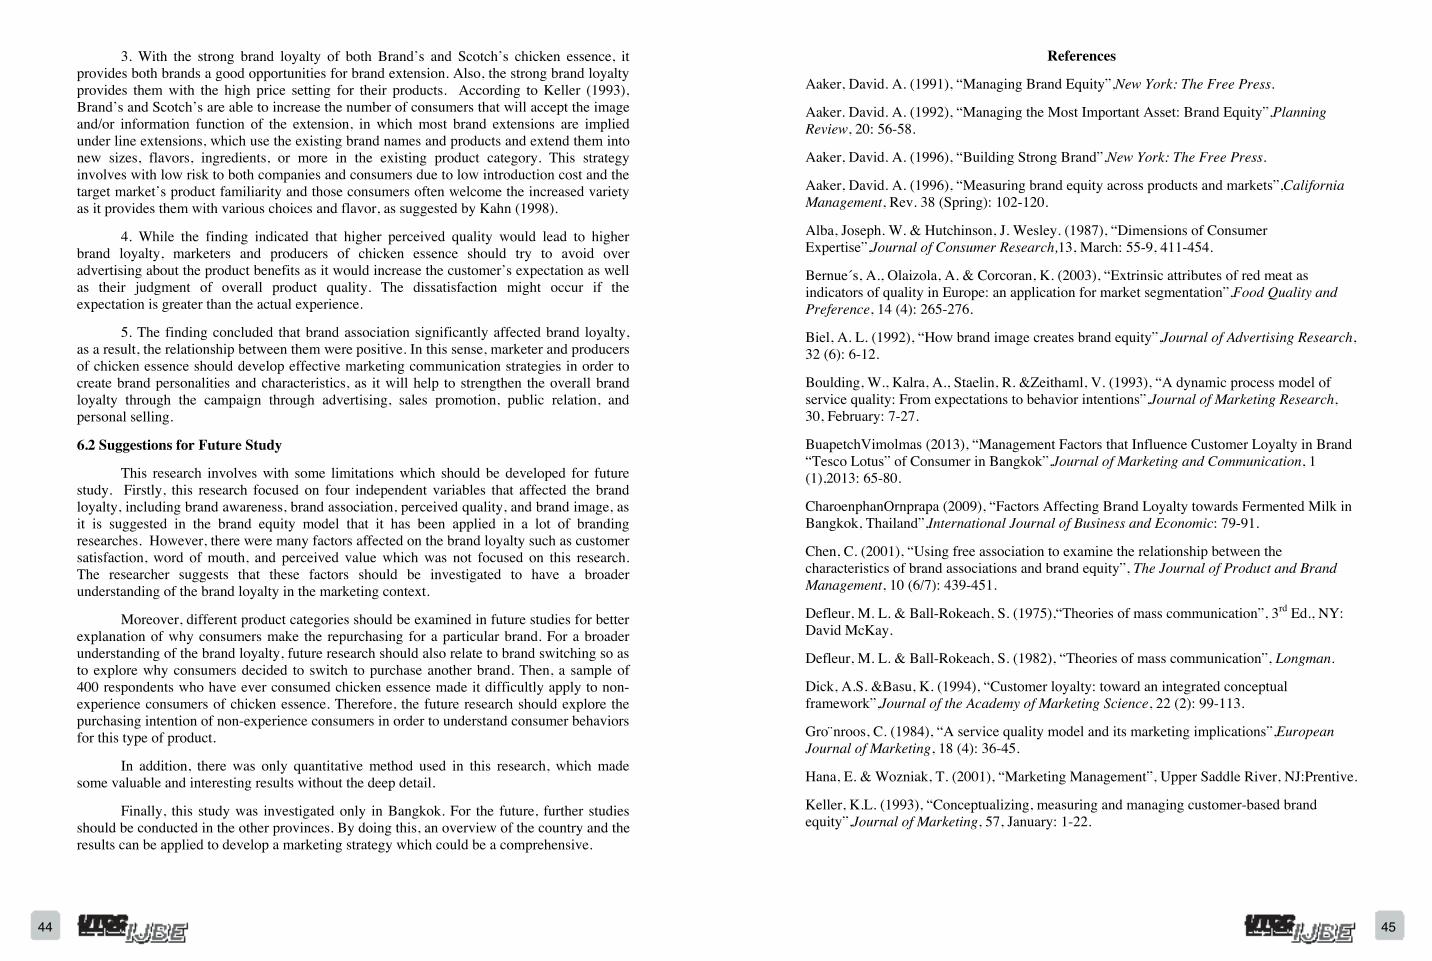
Table 6: The summary of hypothesis testing
Null Hypothesis Results H1.10: There is no difference in brand loyalty between male and female Accepted Ho H1.20: There is no difference in brand loyalty between age groups Accepted Ho H1.30: There is no difference in brand loyalty between education groups Accepted Ho H1.40: There is no difference in brand loyalty between occupation groups Accepted Ho H1.50: There is no difference in brand loyalty between income groups Accepted Ho H20: There is no relationship between brand awareness and brand loyalty Accepted HoH30: There is no relationship between brand association and brand loyalty Rejected Ho H40: There is no relationship between perceived quality and brand loyalty Rejected Ho H50: There is no relationship between brand image and brand loyalty Accepted Ho
6. Recommendations
6.1 Implication and Recommendations for business
According to the present situation, people have concerned more health conscious and would like to approach the highest education in order to have high standard of life in the high competitive society. Knowledge and high performance are required. Therefore, the needs of improving the brain functioning and restoring are increasing through the consumption of health products. The result of this research can help the entrepreneurs involve stimulation in the appropriate marketing activities and build the goods for driving force of consumers' brand loyalty. There are five recommendations from the finding as follows:
1.People are normally differentiated by their physical, mental, socio cultural and emotional status, which would make each person have different beliefs, attitudes, values and personalities, and thus these lead to different behaviors. However, the finding indicated that the demographics had no significant impact on brand loyalty of chicken essence among consumers in Bangkok. As suggested by the previous study, it meant that the existing consumers of chicken essence shared the similar beliefs, attitudes, and values towards the brand of chicken essence in the market. However, it would be better if the market was divided into the psychographic factors or usage purpose such as for a gift or someone they care about, and for self-consumption. The information about the benefits of chicken essence should be promoted more in order to stimulate demand for the product amid the health consciousness trend in the market.
2. The finding suggested that there was a strong positive relationship between perceived quality and brand loyalty. In this regard, marketers and producers of chicken essence should try to further enhance the quality of product as it is a key strategy for customer retention. It is asserted that superior quality can make a difference of the product position. In other words, the product with high quality could attract more consumers who would provide them a reason to buy. In the case of chicken essence, the quality of products offered by both leading brands in the market comprising Brand’s and Scotch’s were perceived as high and thus this led to relatively high brand loyalty of their customers. However, the level of quality as compared to its price should be further enhance, or even increase the quantity of the product to adjust their perception.
whichweregreater than the significant value of 0.05.Thus the null hypothesis H1.20-H1.50 are accepted. Multiple Linear Regression
H20: There is no relationship between brand awareness and brand loyalty H30: There is no relationship between brand association and brand loyalty H40: There is no relationship between perceived quality and brand loyalty H50: There is no relationship between brand image and brand loyalty
Table 5: The results of Multiple Linear Regression
ModelUnstandardized
Coefficients StandardizedCoefficients t Sig.
B Std. Error Beta(Constant) .142 .241 .590 .556Brand Awareness -.100 .053 -.078 -1.871 .062Brand Association .396 .056 .329 7.105 .000Perceived Quality .516 .075 .402 6.886 .000Brand Image .083 .070 .068 1.191 .234
Adjusted R square = 0.447, F-test = 81.48, P-value = 0.00
Table 5 demonstrated the p-value of 0.00 and the Adjusted R square of 0.447. It suggested that this model can be used to explained brand loyalty by 44.7%. The finding suggested that only brand association and perceived quality can be used to predict brand loyalty of chicken essence through the equation as below.
Brand Loyalty = 0.142 + (0.396) Brand Association + (0.516) Perceived Quality
The correlation coefficient (r) of perceived quality and brand association is equal to 0.402 and 0.329 respectively, indicating that there is a moderate positive relationship between perceived quality and brand association towards brand loyalty. These two variables move in the same direction with brand loyalty. Also, the strength of association (R2) is equal to 0.162 and 0.108, which means if perceived quality increases (decrease), it will increase the brand loyalty (decrease) by 16.2%; while brand association increases (decrease), it will increase in the brand loyalty (decrease) by 10.8%.
5. Conclusion
The research result, based on descriptive analysis, showed that the majorities of all respondents were females, aged between 16 and 30 years old, holding bachelors’ degree, being student, and earning about 15,000 baht to 30,000 baht per month. In addition, the brand of chicken essence which was consumed by respondents mostly was Brand’s at 77.8%.
In this study, author used multiple regression, T-test, and one-way ANOVA as the analysis method in order to do the hypothesis testing. From the hypothesis testing, there was no difference in brand loyalty between male and female consumers, as well as those between different age groups, different groups of education, different groups of occupation and different groups of income level, in which their loyalty were considered as high. In other words, it can be said that there was no impact of demographic factors towards the brand loyalty in this study. Also, the finding from the multiple linear regression indicated that only brand association and perceived quality positively affected the brand loyalty of chicken essence brands as showing below:
4544
3. With the strong brand loyalty of both Brand’s and Scotch’s chicken essence, it provides both brands a good opportunities for brand extension. Also, the strong brand loyalty provides them with the high price setting for their products. According to Keller (1993), Brand’s and Scotch’s are able to increase the number of consumers that will accept the image and/or information function of the extension, in which most brand extensions are implied under line extensions, which use the existing brand names and products and extend them into new sizes, flavors, ingredients, or more in the existing product category. This strategy involves with low risk to both companies and consumers due to low introduction cost and the target market’s product familiarity and those consumers often welcome the increased variety as it provides them with various choices and flavor, as suggested by Kahn (1998).
4. While the finding indicated that higher perceived quality would lead to higher brand loyalty, marketers and producers of chicken essence should try to avoid over advertising about the product benefits as it would increase the customer’s expectation as well as their judgment of overall product quality. The dissatisfaction might occur if the expectation is greater than the actual experience.
5. The finding concluded that brand association significantly affected brand loyalty, as a result, the relationship between them were positive. In this sense, marketer and producers of chicken essence should develop effective marketing communication strategies in order to create brand personalities and characteristics, as it will help to strengthen the overall brand loyalty through the campaign through advertising, sales promotion, public relation, and personal selling.
6.2 Suggestions for Future Study
This research involves with some limitations which should be developed for future study. Firstly, this research focused on four independent variables that affected the brand loyalty, including brand awareness, brand association, perceived quality, and brand image, as it is suggested in the brand equity model that it has been applied in a lot of branding researches. However, there were many factors affected on the brand loyalty such as customer satisfaction, word of mouth, and perceived value which was not focused on this research. The researcher suggests that these factors should be investigated to have a broader understanding of the brand loyalty in the marketing context.
Moreover, different product categories should be examined in future studies for better explanation of why consumers make the repurchasing for a particular brand. For a broader understanding of the brand loyalty, future research should also relate to brand switching so as to explore why consumers decided to switch to purchase another brand. Then, a sample of 400 respondents who have ever consumed chicken essence made it difficultly apply to non-experience consumers of chicken essence. Therefore, the future research should explore the purchasing intention of non-experience consumers in order to understand consumer behaviors for this type of product.
In addition, there was only quantitative method used in this research, which made some valuable and interesting results without the deep detail.
Finally, this study was investigated only in Bangkok. For the future, further studies should be conducted in the other provinces. By doing this, an overview of the country and the results can be applied to develop a marketing strategy which could be a comprehensive.
References
Aaker, David. A. (1991), “Managing Brand Equity”,New York: The Free Press.
Aaker. David. A. (1992), “Managing the Most Important Asset: Brand Equity”,PlanningReview, 20: 56-58.
Aaker, David. A. (1996), “Building Strong Brand”,New York: The Free Press.
Aaker, David. A. (1996), “Measuring brand equity across products and markets”,CaliforniaManagement, Rev. 38 (Spring): 102-120.
Alba, Joseph. W. & Hutchinson, J. Wesley. (1987), “Dimensions of Consumer Expertise”,Journal of Consumer Research,13, March: 55-9, 411-454.
Bernue´s, A., Olaizola, A. & Corcoran, K. (2003), “Extrinsic attributes of red meat as indicators of quality in Europe: an application for market segmentation”,Food Quality and Preference, 14 (4): 265-276.
Biel, A. L. (1992), “How brand image creates brand equity”,Journal of Advertising Research,32 (6): 6-12.
Boulding, W., Kalra, A., Staelin, R. &Zeithaml, V. (1993), “A dynamic process model of service quality: From expectations to behavior intentions”,Journal of Marketing Research,30, February: 7-27.
BuapetchVimolmas (2013), “Management Factors that Influence Customer Loyalty in Brand “Tesco Lotus” of Consumer in Bangkok”,Journal of Marketing and Communication, 1 (1),2013: 65-80.
CharoenphanOrnprapa (2009), “Factors Affecting Brand Loyalty towards Fermented Milk in Bangkok, Thailand”,International Journal of Business and Economic: 79-91.
Chen, C. (2001), “Using free association to examine the relationship between the characteristics of brand associations and brand equity”, The Journal of Product and Brand Management, 10 (6/7): 439-451.
Defleur, M. L. & Ball-Rokeach, S. (1975),“Theories of mass communication”, 3rd Ed., NY: David McKay.
Defleur, M. L. & Ball-Rokeach, S. (1982), “Theories of mass communication”, Longman.
Dick, A.S. &Basu, K. (1994), “Customer loyalty: toward an integrated conceptual framework”,Journal of the Academy of Marketing Science, 22 (2): 99-113.
Gro¨nroos, C. (1984), “A service quality model and its marketing implications”,EuropeanJournal of Marketing, 18 (4): 36-45.
Hana, E. & Wozniak, T. (2001), “Marketing Management”, Upper Saddle River, NJ:Prentive.
Keller, K.L. (1993), “Conceptualizing, measuring and managing customer-based brand equity”,Journal of Marketing, 57, January: 1-22.
4746
Keller, K. L. (1998), “Strategic Brand Management: Building, Measuring, and Managing Brand Equity”, Prentice-Hall, Upper Saddle River. NJ: New York, NY: 45-56. Keller, K.L. (2000), “The brand report card”, Harvard Business Review, 1, January-February: 147-157.
Kotler, Philip. A. (2003),Marketing Management, 11th Ed., New Jersey: Pearson Education.
Kotler, Philip. A. & Keller, Kevin. L. (2006),Marketing Management, 12thEd., Upper Saddle River, New Jersey: Pearson Prentice Hall.
Kvidahl, M. (2014),“A Better Beverage, Nutrition Industry Executive”: 23, Retrieved from http://digitaledition.qwinc.com/publication/?i=212881&p=25
Laroche, M., Bergeron, J. &Barbaro-Forleo, G. (2001), “Targeting Consumers Who are Willing to Pay More for Environmentally Friendly Products”,The Journal of Consumer Marketing, 18 (6): 503-520.
Li Z.&Chaipoopirutana S. (2014), “The Important Factors that Influence on Building Brand Loyalty towards Chang’An Car Brand in Xi’An City, Shaanxi, China”,International Journal of Business and Economics, 6 (2): 119-132.
Morton, J. (1994), “Predicating brand preference”,Marketing Management, 2 (4): 32-44.
Na, W. B., Marshall, Roger & Keller, K. L. (1999), “Measuring brand power: Validating a model for optimizing brand equity”,The Journal of Product and Brand Management, 8 (3): 170-184.
Nunnally, J. C. (1978),Psychometric theory, 2nd Ed., New York: McGraw-Hill.
Osselaer, S. & Alba, J. (2000), “Consumer learning and brand equity”,Journal of ConsumerResearch, 27 (June): 1-16.
Park, W.C. &Srinivasan, V. (1994), “A survey-based method for measuring and understanding brand equity and its extendibility”,Journal of Marketing Research, 31 (2): 271-288.
Randazzo, Sal (1993), “Advertising; Symbolism in advertising; Psychological aspects; Social aspects”,Brand name products, 3rd Ed. Chicago: Probus Pub. Co.
Schiffman, L. G. &Kanuk, L. L. (1997), “Consumer behavior”, 6thEd., New Jersey: Prentice-Hall, Inc.
Sovina, J.& Collins, C. J. (2003), “The Relationships between organizational marketing efforts, employment brand equity, and recruitment outcomes”,Journal of Management.
Steenkamp, J-B.E. (1997),“Dynamics in consumer behaviour with respect to agricultural and food products”,In Agricultural Marketing and Consumer Behaviour in a Changing World,Wierenga, B., van Tilburg, A., Grunert, K., Steenkamp, J.B. and Wedel, M. Eds. Dordrecht: Kluwer Academic Publishers.
Syed, A. (2003), “Digital Divide and Purchase Intention: Why Demographic Psychology Matters”,Journal of Economic Psychology, 24 (3): 321-327.
Taylor, S.A., Goodwin, S. &Celuch, K. (2004), “The relative importance of brand equity tocustomer loyalty in an industrial setting”,Journal Product & Brand Management, 13 (4): 217-227.
Temporal, P. (2000),“Branding in Asia”, John Wiley & Sons, Singapore”: 11, 25-26, 33. Wen CH., Ching IL., Ching CC., Yi TL., Wei KH., Hui Y H. & Chi CH. (2014), “Chicken Essence Improves Exercise Performance and Ameliorates Physical Fatigue”, Nutrients. DOI no.: 10.3390/nu6072681
Yoo, B., Donthu, N. & Lee, S. (2000), “An examination of selected marketing mix elements and brand equity”,Journal of the Academy of Marketing Science, 28 (2): 195-211.
Zeithaml, V. A. (1988), “Consumer perceptions of price, quality and value: a means end model and synthesis of evidence”,Journal of Marketing, 52, July: 2-22.