factor purity - frinfo.assetmanagement.hsbc.com · factor purity get what you desire ... any...
TRANSCRIPT
August 2017
HSBC Quantitative Research Team
Factor PurityGet what you desire
This document is intended for Professional Clients only and should not be distributed to or relied upon by Retail
Clients. For illustrative purposes only.
The commentary and analysis presented in this document reflect the opinion of HSBC Global Asset
Management on the markets, according to the information available to date. They do not constitute any kind of
commitment from HSBC Global Asset Management. Consequently, HSBC Global Asset Management will not
be held responsible for any investment or disinvestment decision taken on the basis of the commentary and/or
analysis in this document. Any forecast, projection or target where provided is indicative only and is not
guaranteed in any way. HSBC Global Asset Management accepts no liability for any failure to meet such
forecast, projection or target.
Non contractual document

2
3
Executive summary
This note sets out the premise behind our views on
smart beta investing and describes a method of
identifying the ‘purest’ factor driven strategies. Smart
beta strategies have become increasingly popular,
with many providers offering a broad suite of such
strategies. Most are based on well recognised risk
premium factors such as value, small cap,
momentum, low volatility and quality. However,
many such approaches have unintended risks and
additional exposure to untargeted factors because of
their construction methodology. We investigate a
method of determining the purity of a factor product
and apply it to our smart beta investment solutions.
By showing these strategies exhibit greater factor
purity than those of other providers, we can conclude
that they are relatively efficient: they have a larger
portion of active risk attributed to the targeted factor.
Non contractual document

4
Getting What You Desire
The appeal behind smart beta strategies is that they
are systematic and transparent, rendering them
easy to construct and rebalance. Smart beta is also
a low cost way for an investor to obtain exposure to
factors which they might be lacking within their
portfolios. Many smart beta approaches tend to be
constructed with an emphasis on simplicity, often
using simple sorting and weighting techniques
based on either a single factor (e.g. book-to-price)
or a composite score (e.g. value). Some are
constructed to maximise investability, combining
factor tilts with market cap weighting. Unfortunately,
even though this sort of construction technique
tends to result in higher factor exposures, there are
usually few restrictions on other style
characteristics. This leads to unintended factor
exposures and thus undesired risk.
Much of the debate on smart beta construction
stems from unintended factor exposures. These are
usually the result of conforming to the requirements
of transparency, simplicity and investability.
Strategies are constructed from stocks ranked by
factor of interest (e.g. factor indexes sold by FTSE,
MSCI and Russell). There is evidence that simple
minimum variance optimisation, a common smart
beta strategy, results in time-varying factor
exposures. Goldberg et al.1 suggest that it is
important to be aware of these exposures and
highlight the benefits of targeting pure exposures
when building such strategies.
In what follows we discuss the significance of
efficient risk allocation in factor strategy
construction. In particular, we introduce the idea of
the Factor Purity Ratio (FPR) to compare factor
strategies, explaining how it should be interpreted
and its relevant applications.
1 Goldberg, Leshem and Geddes (2013) – Restoring Value
to Minimum Variance, Forthcoming in Journal of Investment
Management Davis and Menchero (2010) – Risk
Contribution is Exposure times Volatility times Correlation,
MSCI Barra Research
Building Factor Strategies
A plethora of factor construction methods have been
proposed in the academic literature, some of which
have been implemented by industry practitioners. In
this expanding ecosystem of factor based products,
there is a common misconception that factor
investing is very simple, providing superior results to
traditional funds (e.g. cap-weighted indices, active
management, strategic asset allocation). ‘Raw’
strategies approach factor construction by
overweighting stocks that exhibit a particular
characteristic (e.g. Price-to-Book). To respond to
the challenge of transforming academic risk factors
into investable portfolios we focus on four key
qualities: our products must be Precise, Unbiased,
Robust and Efficient.
Precise: The factors we seek exposure to are
precisely defined, guided by empirical
research.
Unbiased: Our indices are constructed to
remove hidden bias towards untargeted factors.
Robust: Strong technological infrastructure,
proprietary risk models and the conceptual clarity
of our mathematical formulation ensure robust
implementation.
Efficient: Our indices deliver strong factor purity
ratios, exhibiting a high proportion of targeted risk
per unit of active risk.
We refer to this product range as our “pure” factor
strategy.
Robust
PreciseSingle target factor
EfficientUnbiasedPURE Factor Purity Ratio
= risk from desired factor
total active risks
Clear Ex–post Return Attribution
Clear Ex–anteRisk Decomposition
Source: HSBC Global Asset Management, for illustrative
purposes only
The commentary and analysis presented in this document reflect the opinion of HSBC Global Asset Management on the markets, according to the
information available to date. They do not constitute any kind of commitment from HSBC Global Asset Management. Consequently, HSBC Global
Asset Management will not be held responsible for any investment or disinvestment decision taken on the basis of the commentary and/or analysis
in this document. Any forecast, projection or target where provided is indicative only and is not guaranteed in any way.
Non contractual document

5
∑ARD is the sum of active risk contributions of the
desired factors while TAR is the total active risk of
the portfolio. Here we look at active risk contribution
as opposed to absolute risk contribution as the
purpose of smart beta is to add exposure beyond
that of a specified benchmark. For example, the FPR
of a single-factor value strategy is given by:
𝐹𝑃𝑅𝑉𝑎𝑙𝑢𝑒 = 𝐴𝑅𝑉𝑎𝑙𝑢𝑒𝑇𝐴𝑅
Ex-ante active risk can be decomposed as follows2:
T𝐴𝑅 = 𝑉𝑎𝑟 𝑅𝐴 = 𝑖 𝑥𝑖𝐴𝜎𝐹𝑖𝜌𝐹𝑖,𝑅𝐴 + 𝑖 𝑥𝑘
𝐴𝜎𝑢𝑘𝜌𝑢𝑘,𝑅𝐴
where 𝜎𝐹𝑣𝑎𝑙𝑢𝑒𝜌𝐹𝑣𝑎𝑙𝑢𝑒,𝑅𝐴 is otherwise equivalent to
the marginal contribution to risk of the value factor.
The FPR ratio is therefore by construction an ex-
ante ratio which decomposes the risk the portfolio
expects to deliver into desirable and undesirable
active risk.
The variables required can be estimated using a
factor risk model. We use our internal risk model
which is broadly similar to commercially available
factor models from Barra, Axioma and Bloomberg. It
is cross-sectional and decomposes systematic
market risk into broad style factors as well as
industry, country and currency factors. The cross-
sectional variance-covariance matrix is built using
10 years of weekly data and covariance shrinkage.
Data Requirements
First, we obtain the constituents and weights
through time for HSBC’s Pure strategies and
MSCI’s style indexes. We care about how these
change over time as the calculated factor purity is
time-varying. Next, we construct the factor risk
model specific to the investment universe, in this
case the MSCI World. We extract factor exposures
and factor returns from the risk model, which we
use to calculate marginal active contributions to
risk. Finally, we calculate the factor purity ratio for
each HSBC Pure strategy (value, momentum,
small cap, low volatility and quality) and compare
them to their closest competitors.
Understanding the FPR
The Factor Purity Ratio (FPR) is defined as
the ratio of tracking error from the desired
factor(s) to the total tracking error. This can be
used to measure the efficiency of a strategy,
i.e. the proportion of the total active risk
budget appropriately allocated to the target
factors.
Formally, it is constructed as follows:
𝐹𝑃𝑅𝐷 = 𝐴𝑅𝐷𝑇𝐴𝑅
Figure 1: Decomposition of total active risk
in a cross-sectional factor risk model
Total
Return/Risk
Systematic Contributions
Style Industry Country Currency
Stock Specific Contributions
2 For more detail, see Davis and Menchero (2010) – Risk
Contribution is Exposure times Volatility times Correlation,
MSCI Barra Research
Source: HSBC Global Asset Management, for illustrative
purposes only
The commentary and analysis presented in this document reflect the opinion of HSBC Global Asset Management on the markets, according to the
information available to date. They do not constitute any kind of commitment from HSBC Global Asset Management. Consequently, HSBC Global
Asset Management will not be held responsible for any investment or disinvestment decision taken on the basis of the commentary and/or analysis
in this document. Any forecast, projection or target where provided is indicative only and is not guaranteed in any way.
Non contractual document

6
Evaluating Factor Strategies
A strategy with high exposure to a particular factor
will not necessarily have high factor purity. For
example, a simple ranking of value stocks often has
significant small-cap exposure. If we were to buy the
top quintile of value names, we would anticipate a
high exposure to both value and small cap factors.
We would prefer a smart beta approach to have a
large proportion of active risk driven by the targeted
style factor and minimal active risk contributions from
the other factors.
In the table below we show the FPR ratios for our
Pure strategies, alongside their active exposures to
the target factor.
It is clear that high factor exposure does not
directly correlate with factor purity. For example,
Pure Momentum has a low factor exposure of 0.7
but a high factor purity ratio of 74%. This is
understandable as momentum is a more volatile
factor with a higher active risk contribution. Looking
at the desired factor’s exposures alone might be
misleading. Factor exposures fail to take into
account the risks from exposure to other potentially
undesirable factors.
Concentrating on active risk contribution also
connects back to the general debate on risk premia
factors. There is a degree of risk in investing in
factors and their returns are time-varying. Note that
strategies with the same factor exposures may have
different active risks based on the nature of the
factor. A strategy that is pure has less contribution
from undesired risks. The key point is that we are
only taking a risk on the factors that we choose to
invest in.
We will go on to compare these FPR ratios with
those of key competitors and to show that our Pure
strategies are indeed relatively ‘efficient’ from an
FPR perspective. This is not surprising as HSBC’s
portfolio construction process aims to minimise
unwanted factor exposures as well as broad active
risk due to its active weight constraints.
Figure 2 shows the decomposition of active risk for
HSBC Pure Value as of December 2016. This is a
common risk attribution output from portfolio
attribution packages. As is evident from both the
FPR ratio and the breakdown (Figures 2 & 3), the
active risk contribution from value is significantly
larger than most other active risk components. This
is indeed what we expect to see from an pure
strategy.
FPR (%)Active Exposure
(standard deviations)
VALUE 69% 1.1
QUALITY 17% 0.8
MOMENTUM 74% 0.7
VOLATILITY 53% 0.6
SIZE 54% 1.5
Source: HSBC Global Asset Management, Thompson Reuters,
IBES, Worldscope and MSCI as of end of December 2016
The commentary and analysis presented in this document reflect the opinion of HSBC Global Asset Management on the markets, according to the
information available to date. They do not constitute any kind of commitment from HSBC Global Asset Management. Consequently, HSBC Global
Asset Management will not be held responsible for any investment or disinvestment decision taken on the basis of the commentary and/or analysis
in this document. Any forecast, projection or target where provided is indicative only and is not guaranteed in any way.
Non contractual document

7
Figure 2: Decomposition of total active risk (31 December 2016)
Pure Value Enhanced Value
When comparing this to the MSCI World Enhanced Value Index (MSCI’s high exposure version of a value index), we
can see how different they are in terms of factor purity. The FPR of the MSCI World Enhanced Value Index is 35%,
compared to HSBC’s figure of 69%. This implies that our Pure strategy takes on approximately twice times as much
value-related active risk as the MSCI World Enhanced Value Index per 1% of non-value active risk, yet both strategies
exhibit the same level of active exposure to value (1.1).
Looking at the decomposition of style active risk for the MSCI index in Figure 4, we can see that even though the
biggest component of active risk is indeed value, there are still significant active risk contributions from volatility and
momentum. A significant portion of its total active risk also comes from contributions. A closer look at the breakdown
shows that the majority of this comes from active exposure to Japan. This does not appear to be consistent with the
concept of a single factor strategy.
Figure 3: Decomposition of style active risk (31 December 2016)
Pure Value Enhanced Value
0%
10%
20%
30%
40%
50%
60%
70%
80%
90%
100%
Sty
le
Countr
ies
Industr
ies
Curr
encie
s
Non-F
acto
r
Positive Contribution
Negative Contribution
0%
10%
20%
30%
40%
50%
60%
70%
80%
Va
lue
Mo
mentu
m
Vo
latilit
y
Pro
fita
bili
ty
Levera
ge
Tra
din
g A
ctivity
Siz
e
Gro
wth
Ea
rnin
gs V
aria
bili
ty
Positive Contribution
Negative Contribution
0%
10%
20%
30%
40%
50%
60%
70%
80%
90%
100%
Sty
le
Countr
ies
Industr
ies
Curr
encie
s
Non-F
acto
rPositive Contribution
Negative Contribution
0%
10%
20%
30%
40%
50%
60%
70%
80%
Va
lue
Mo
mentu
m
Pro
fita
bili
ty
Tra
din
g A
ctivity
Ea
rnin
gs
Va
ria
bili
ty
Levera
ge
Siz
e
Gro
wth
Vo
latilit
y
Positive Contribution
Negative Contribution
Source: HSBC Global Asset Management, Thompson Reuters, IBES, Worldscope and MSCI as of end of December 2016
Source: HSBC Global Asset Management, Thompson Reuters, IBES, Worldscope and MSCI as of end of December 2016
The commentary and analysis presented in this document reflect the opinion of HSBC Global Asset Management on the markets, according to the
information available to date. They do not constitute any kind of commitment from HSBC Global Asset Management. Consequently, HSBC Global
Asset Management will not be held responsible for any investment or disinvestment decision taken on the basis of the commentary and/or analysis
in this document. Any forecast, projection or target where provided is indicative only and is not guaranteed in any way.
Non contractual document
8
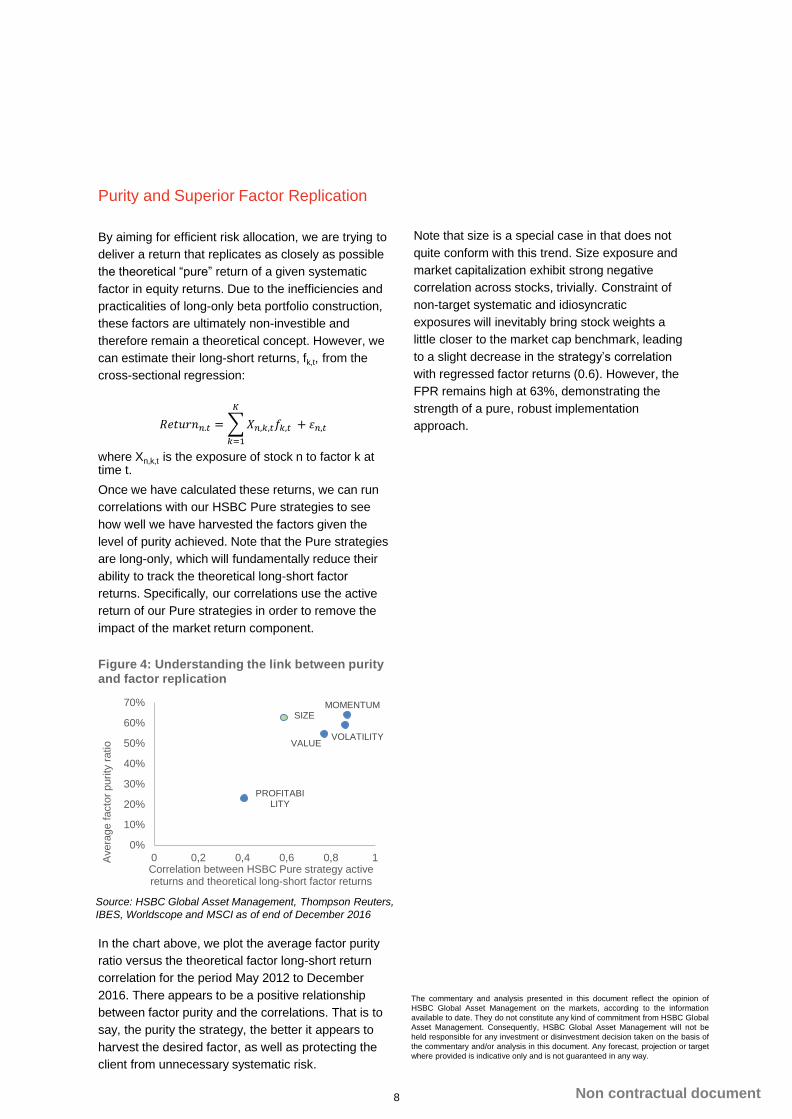
Purity and Superior Factor Replication
By aiming for efficient risk allocation, we are trying to
deliver a return that replicates as closely as possible
the theoretical “pure” return of a given systematic
factor in equity returns. Due to the inefficiencies and
practicalities of long-only beta portfolio construction,
these factors are ultimately non-investible and
therefore remain a theoretical concept. However, we
can estimate their long-short returns, fk,t, from the
cross-sectional regression:
𝑅𝑒𝑡𝑢𝑟𝑛𝑛.𝑡 =
𝑘=1
𝐾
𝑋𝑛,𝑘,𝑡𝑓𝑘,𝑡 + 𝜀𝑛,𝑡
where Xn,k,t is the exposure of stock n to factor k at time t.
Once we have calculated these returns, we can run
correlations with our HSBC Pure strategies to see
how well we have harvested the factors given the
level of purity achieved. Note that the Pure strategies
are long-only, which will fundamentally reduce their
ability to track the theoretical long-short factor
returns. Specifically, our correlations use the active
return of our Pure strategies in order to remove the
impact of the market return component.
Figure 4: Understanding the link between purity and factor replication
In the chart above, we plot the average factor purity
ratio versus the theoretical factor long-short return
correlation for the period May 2012 to December
2016. There appears to be a positive relationship
between factor purity and the correlations. That is to
say, the purity the strategy, the better it appears to
harvest the desired factor, as well as protecting the
client from unnecessary systematic risk.
VALUE
PROFITABILITY
MOMENTUM
VOLATILITY
SIZE
0%
10%
20%
30%
40%
50%
60%
70%
0 0,2 0,4 0,6 0,8 1Avera
ge f
acto
r purity
ratio
Correlation between HSBC Pure strategy active returns and theoretical long-short factor returns
Note that size is a special case in that does not
quite conform with this trend. Size exposure and
market capitalization exhibit strong negative
correlation across stocks, trivially. Constraint of
non-target systematic and idiosyncratic
exposures will inevitably bring stock weights a
little closer to the market cap benchmark, leading
to a slight decrease in the strategy’s correlation
with regressed factor returns (0.6). However, the
FPR remains high at 63%, demonstrating the
strength of a pure, robust implementation
approach.
Source: HSBC Global Asset Management, Thompson Reuters,
IBES, Worldscope and MSCI as of end of December 2016
The commentary and analysis presented in this document reflect the opinion of
HSBC Global Asset Management on the markets, according to the information
available to date. They do not constitute any kind of commitment from HSBC Global
Asset Management. Consequently, HSBC Global Asset Management will not be
held responsible for any investment or disinvestment decision taken on the basis of
the commentary and/or analysis in this document. Any forecast, projection or target
where provided is indicative only and is not guaranteed in any way.
Non contractual document

9
Figure 5: Comparison of Factor Purity RatiosFPRs as of December 2016
The Right Way to Assess Factor Purity
There is a right way and a wrong way to compare the purity of different factor products. It is important to
have a good feel for the characteristics of the FPR ratio in order to assess strategies fairly. In this section,
we highlight two important aspects of appropriate risk allocation evaluation.
Purity is indicative of superior implementation
FPR is a powerful metric for comparing construction methodologies across different providers, but it is
inappropriate to use it to choose between the factor premia themselves. Some factors exhibit more
intrinsic volatility than others. It is these factors that will tend to dominate risk attribution profiles if
exposure is sufficiently high. This means that products targeting such factors will harvest premia more
efficiently even if no purification measures are taken.
As an example, let us compare our Pure factors against two arrays of MSCI indices: their High
Capacity range as well as their High Exposure range. The former impose tilts on the full cap-weighted
index to increase investability. If we interpret the FPR ratios appropriately, the HSBC Pure strategies
appear to be more ‘pure’ than both MSCI ranges as of the end of December 2016. Moreover, this level
of purity is achieved whilst exhibiting target factor active exposures competitive with the MSCI High
Exposure range.
Figure 6: Comparison of active exposures
Active Exposures as of December 2016
0%
20%
40%
60%
80%
100%
VALUE QUALITY MOMENTUM VOLATILITY SIZE
HSBC Pure MSCI High Exposure MSCI High Capacity
0,0
0,2
0,4
0,6
0,8
1,0
1,2
1,4
1,6
VALUE QUALITY MOMENTUM LOW VOLATILITY SMALL CAP
HSBC Pure MSCI High Exposure MSCI High Capacity
Source: HSBC Global Asset Management, Thompson Reuters, IBES, Worldscope and MSCI as of end of December 2016
The commentary and analysis presented in this document reflect the opinion of HSBC Global Asset Management on the markets, according to the
information available to date. They do not constitute any kind of commitment from HSBC Global Asset Management. Consequently, HSBC Global
Asset Management will not be held responsible for any investment or disinvestment decision taken on the basis of the commentary and/or analysis
in this document. Any forecast, projection or target where provided is indicative only and is not guaranteed in any way.
Non contractual document

10
However, it would be inappropriate to criticise the low FPRs of the quality indices in comparison to the
high FPRs of the momentum indices. Ex-ante active risk depends on a series of factor-specific metrics. It
is a product of exposure, factor volatility and correlations, so any of these can influence the active risk
composition. Momentum is well known to be a factor with significant intrinsic and realised volatility.
Somewhat ironically, the “low volatility” factor also exhibits significant volatility in its long-short returns
driven primarily by market risk. Both momentum and low volatility demonstrate high FPR ratios. At the
opposite end of the spectrum, quality and size show relatively stable returns and have relatively low FPR
ratios. The Pure factor construction methodology does a particularly good job of enhancing the factor
purity of size, but quality also demonstrates marked improvement relative to MSCI.
Quality has the lowest average factor purity of all the factors. So what is contributing the majority of its
strategies’ active risk? Quality might be harder to capture as a pure factor because it is naturally skewed in
terms of exposures to countries and industries. We examine this by looking at snapshots of the quality
index active risk decomposition at different points in time. A substantial part of active risk appears to come
from countries in 2009 and industries in 2016 (see figure 7).
The purity of the Pure Quality could be improved through the direct control of country and industry
exposures. However this would inevitably reduce exposure to the factor as the additional constraints would
shrink the set of feasible solutions. Given the implementation challenges caused by the very nature of this
factor, we would not recommend investing in a quality strategy in isolation. After all, quality demonstrates
its greatest potential when used in combination with other factors, such as value.
Figure 7: Pure quality index active risk decomposition
0%
10%
20%
30%
40%
50%
60%
70%
80%
90%
100%
Sty
le
Countr
ies
Industr
ies
Curr
encie
s
NonF
acto
r
2009
0%
10%
20%
30%
40%
50%
60%
70%
80%
90%
100%
Sty
le
Countr
ies
Industr
ies
Curr
encie
s
NonF
acto
r
2016
Source: HSBC Global Asset Management, Thompson Reuters, IBES, Worldscope and MSCI as of end of December 2016
The commentary and analysis presented in this document reflect the opinion of HSBC Global Asset Management on the markets, according to the
information available to date. They do not constitute any kind of commitment from HSBC Global Asset Management. Consequently, HSBC Global
Asset Management will not be held responsible for any investment or disinvestment decision taken on the basis of the commentary and/or analysis
in this document. Any forecast, projection or target where provided is indicative only and is not guaranteed in any way.
Non contractual document

11
Purity needs to be evaluated over time
The dependence of factor purity on active risk
expands not only across different factors but also
over time. Constant monitoring of factor purity is
important. It is not necessarily stable; factors can
undergo periods of increased volatility and this can
cause the purity of some construction
methodologies to vary significantly over time.
The charts in figure 8 examine the fluctuations in
the factor purity of our Pure strategies, for which
we have full constituent and weight data history.
We are unable to do the same for the full range of
our competitors’ indexes due to the lack of data,
but in Figures 9 to 11 we present what we are
able.
Figure 8: 12 month rolling FPRs
We expect the factor purity ratio of the Pure
strategies to be higher over time. This is because
the evaluation of active risk is a product of
exposure and marginal contribution to risk. Pure
strategies explicitly constrain exposure to other
style factors so the risk contribution of the main
factor of interest should be proportionally higher.
0%
20%
40%
60%
80%
100%
11/2
012
03/2
013
07/2
013
11/2
013
03/2
014
07/2
014
11/2
014
03/2
015
07/2
015
11/2
015
03/2
016
07/2
016
11/2
016
VALUE
0%
20%
40%
60%
80%
100%
11/2
012
03/2
013
07/2
013
11/2
013
03/2
014
07/2
014
11/2
014
03/2
015
07/2
015
11/2
015
03/2
016
07/2
016
11/2
016
QUALITY
0%
20%
40%
60%
80%
100%
11/2
012
03/2
013
07/2
013
11/2
013
03/2
014
07/2
014
11/2
014
03/2
015
07/2
015
11/2
015
03/2
016
07/2
016
11/2
016
MOMENTUM
0%
20%
40%
60%
80%
100%
11/2
012
03/2
013
07/2
013
11/2
013
03/2
014
07/2
014
11/2
014
03/2
015
07/2
015
11/2
015
03/2
016
07/2
016
11/2
016
VOLATILITY
0%
20%
40%
60%
80%
100%
11/2
012
03/2
013
07/2
013
11/2
013
03/2
014
07/2
014
11/2
014
03/2
015
07/2
015
11/2
015
03/2
016
07/2
016
11/2
016
SIZE
Source: HSBC Global Asset Management, Thompson Reuters, IBES, Worldscope and MSCI as of end of December 2016
The commentary and analysis presented in this document reflect the opinion of HSBC Global Asset Management on the markets, according to the
information available to date. They do not constitute any kind of commitment from HSBC Global Asset Management. Consequently, HSBC Global
Asset Management will not be held responsible for any investment or disinvestment decision taken on the basis of the commentary and/or analysis
in this document. Any forecast, projection or target where provided is indicative only and is not guaranteed in any way.
Non contractual document

12
Figures 9 and 10 chart the changes in factor purity ratios over time for competitors’ factor indexes. They imply
that if the weight allocation process does not change over time, FPR ratios should stay within an expected
range.
Figure 9: Comparison of FPR for Figure 10. Comparison of FPR for
value strategies volatility strategies
Figure 11: Comparison of FPR for
quality strategies Even in the case of quality, the hardest factor to
harvest in a pure manner, we consistently
demonstrate higher FPR ratios than MSCI’s High
Exposure alternative. If the difference in the factor
purity ratios depicted is representative of the entire
factor range, it is natural to conclude that our Pure
strategies appear to be more efficient than the
series of MSCI indexes. This demonstrates the
benefit portfolio construction process that
minimises exposures to other factors, indirectly
causing a decrease in active risk contribution from
styles.
0%
10%
20%
30%
40%
50%
60%
70%
80%
90%
100%
10/2
012
01/2
013
04/2
013
07/2
013
10/2
013
01/2
014
04/2
014
07/2
014
10/2
014
01/2
015
04/2
015
07/2
015
10/2
015
01/2
016
04/2
016
07/2
016
10/2
016
MSCI Value Tilt Pure Value
0%
10%
20%
30%
40%
50%
60%
70%
80%
90%
100%
10/2
012
01/2
013
04/2
013
07/2
013
10/2
013
01/2
014
04/2
014
07/2
014
10/2
014
01/2
015
04/2
015
07/2
015
10/2
015
01/2
016
04/2
016
07/2
016
10/2
016
MSCI Minimum Volatility Pure Momentum
0%
10%
20%
30%
40%
50%
60%
70%
80%
90%
100%
10/2
012
01/2
013
04/2
013
07/2
013
10/2
013
01/2
014
04/2
014
07/2
014
10/2
014
01/2
015
04/2
015
07/2
015
10/2
015
01/2
016
04/2
016
07/2
016
10/2
016
MSCI Quality Pure Quality
Figures 9, 10 & 11: HSBC Global Asset Management, Thompson Reuters, IBES, Worldscope, MSCI as of end of December 2016
The commentary and analysis presented in this document reflect the opinion of HSBC Global Asset Management on the markets, according to the
information available to date. They do not constitute any kind of commitment from HSBC Global Asset Management. Consequently, HSBC Global
Asset Management will not be held responsible for any investment or disinvestment decision taken on the basis of the commentary and/or analysis
in this document. Any forecast, projection or target where provided is indicative only and is not guaranteed in any way.
Non contractual document

13
Conclusion
Factor purity ratios are a simple way of determining
the purity of smart beta strategies. There have been
concerns that smart beta products actually capture
unintended factor, country, industry or currency
risks. FPR ratio is an effective way of quantifying the
calibre of active risk budget allocation, allowing
investors to distinguish between strategies with
undesirable or perhaps unforeseen risks from those
that are truly desirable.
This note highlights the importance of focusing on
criteria beyond simple factor exposure when buying
a smart beta product. More sophisticated
construction techniques, although more complicated
than simple sorting and weighting, can significantly
improve the overall purity of smart beta strategies.
Non contractual document

14
Vis Nayar is Deputy CIO, Equities and is responsible for investment research. He has been working in the industry since 1988, joining HSBC Markets in 1996, and has been with HSBC Global Asset Management since 1999. Over his career Vis has extensive research and portfolio management experience in the long only equity, alternative investments and structured products businesses. Vis holds a BSc in Electrical Engineering from Imperial College, University of London and a Masters in Finance from London Business School. He is a CFA charterholder, holds a Certificate in Quantitative Finance (CQF) and also qualified as a Chartered Accountant in the UK. He is also a member of the advisory board for the Masters in Finance programmes at Imperial College
Biographies
Shan Jiang is a Quantitative Research Analyst in the Global Equity Research team and has been working in the industry since 2008. Prior to joining HSBC in 2015, Shan had been a Quantitative Equity Strategist (VP) at Deutsche Bank since 2013. Before that, he was a Quantitative Strategist (VP) at BCS Financial Group and an Assistant Portfolio Manager/ Quantitative Analyst at Gulf International Bank (UK). Shan holds a PhD in Engineering Optimisation from Imperial College London, an MSc (Distinction) in Computer Science from University of Essex, and a BEng in Computer Science from Northwestern Polytechnical University (China).
Nils Jungbacke is Senior Quantitative Research Analyst within the Global Equity Research team and has been working in the industry since 1997. Before joining HSBC in 2001, Nils worked for Barclays Global Investors as a Quantitative Fund Manager, where he gained experience in quantitative equity portfolio construction. He started his career as a Quantitative Analyst at Old Mutual Asset Managers. Nils holds an MSc in Financial Mathematics from King’s College London and is a CFA Charterholder. He holds a BSc in Maths/Physics and an MSc in Materials Science, both from the University of Cape Town.
Paul Denham is the Lead Structured Equity Research Analyst in the Global Equity Research team and has been working in the industry since 2004. Prior to joining HSBC in 2015, He worked as an Associate at Credit Suisse and as an independent research analyst. Paul holds a MA in Physics & Philosophy from the University of Oxford and is a CFA Charterholder.
Lucy Dimtcheva is a Quantitative Research Analyst in the Global Equity Research team and has been working in the industry since 1999. Prior to joining HSBC in 2016, she had been a Senior Quantitative Analyst at Pioneer Investments since 2011. She has more than 10 years experience working as a buy- and sell-side Quantitative Analyst in equities and alternative investments. Lucy holds a PhD in Quantitative Finance from Imperial College London, MSc (Distinction) in Mathematical Trading and Finance from CASS Business School and a BSc in Economics from Sofia University.
Ioannis Kampouris is a Quantitative Research Analyst in Global Equity Research and has been working in the industry since 2010. Prior to joining HSBC, Ioannis worked as a Quantitative Analyst at Gulf International Bank (GIB). He specializes in quantitative strategies research and development, statistical modelling and application of advanced optimization methods. Ioannis holds an MSc in Computational Statistics and Machine Learning from University College London (UCL) and MEng in Computer Engineering and Informatics from University of Patras (Greece).
Olivia Skilbeck is a Quantitative Research Analyst in the Global Equity Research team and has been working in the industry since 2012, when she joined HSBC. Prior to joining Global Equity Research in 2015, Olivia trained as an Analyst in the Asian Equities team in Hong Kong. Olivia holds an MA in Natural Sciences from Trinity College Cambridge and has completed all three levels of the CFA examinations. She is also an FRM candidate.
Vadim Karp is a Quantitative Research Analyst in the Global Equity Research team and has been working in the industry since 2015. Before joining HSBC in 2017, Vadim was a Quantitative Analyst at AlternativeSoft AG, where he gained experience in portfolio construction and exposure analysis. Vadim holds an MSc in Quantitative Finance from Cass Business School, BSc (Distinction) in Mathematical Methods in Economics from the Moscow Engineering and Physics Institute (Russia) and is CFA level 2 candidate.
Stamatis Sivitos is a Quantitative Research Analyst in the Global Equity Research team and has been working in the industry since 2012. Prior to joining HSBC in 2015, Stamatis worked as a Quantitative Developer at SS&C GlobeOp.Stamatis holds an MSc in Financial Mathematics from Cass Business School (UK), an MSc in Signal Processing form University of Athens (Greece) and a MEng in Computer Engineering and Informatics from University of Thessaly (Greece). .
Non contractual document
15
Important information
§