factor driven etfs the search for alternative beta april 25, 2012 michael cooke head of distribution...
TRANSCRIPT

Factor Driven ETFsThe search for alternative betaApril 25, 2012
Michael CookeHead of DistributionPowerShares Canada
This presentation was produced by Invesco Canada Ltd

2
Hypothetical Data Assumptions & Explanations
PowerShares S&P 500 Low Volatility (CAD Hedged) Index ETF and S&P® Low Volatility Index (CAD Hedged) PowerShares S&P 500 Low Volatility (CAD Hedged) Index ETF seeks to replicate, to the extent reasonably possible and before fees and expenses, the performance of the S&P 500® Low Volatility Index (CAD Hedged), or any successor thereto.
Index Methodology: The S&P 500 Low Volatility Index (CAD Hedged) is designed to replicate the returns of the S&P 500 Low Volatility Index (the “Underlying Index”), with all or substantially all of the direct US. dollar exposure of the Underlying Index hedged back to the Canadian dollar. The Underlying Index is designed to measure the performance of the 100 least volatile stocks in the S&P 500® Index. Volatility is defined as the standard deviation of the security’s daily price returns over the prior 252 trading days. Constituents are weighted relative to the inverse of their corresponding volatility, with the least volatile stocks receiving the highest weights. The Underlying Index is rebalanced quarterly after the close of trading on the third Friday of February, May, August and November of each year. The rebalancing reference dates are after the close of trading of the last business day of January, April, July and October, respectively. Additions are made to the Underlying Index only during the quarterly rebalancing. Constituents removed from the S&P 500 Index are removed from the Underlying Index simultaneously.
The S&P 500 Low Volatility Index (CAD Hedged) hedges its beginning-of-period balances of its U.S. dollar exposure back to the Canadian dollar by using rolling one-month forward contracts. Daily hedge returns are computed by interpolating between the spot price and the forward price.
This index was created April 20, 2011. PowerShares S&P/TSX Composite Low Volatility Index ETF and S&P/TSX Composite Low Volatility Index
PowerShares S&P/TSX Composite Low Volatility Index ETF seeks to replicate, to the extent reasonably possible and before fees and expenses, the performance of the S&P/TSX Composite Low Volatility Index, or any successor thereto.
Index Methodology: The S&P/TSX Composite Low Volatility Index is designed to measure the performance of the 50 least volatile stocks in the S&P/TSX Composite Index. Volatility is defined as the standard deviation of the security’s daily price returns over the prior 252 trading days. Constituents are weighted relative to the inverse of their corresponding volatility, with the least volatile stocks receiving the highest weightings. The Index is rebalanced quarterly after the close of trading on the third Friday of March, June, September and December of each year. The rebalancing reference dates are after the close of trading of the last business day of February, May, August and November, respectively. Additions are made to the Index only during the quarterly rebalancing. Constituents removed from the S&P/TSX Composite Index are removed from the S&P/TSX Composite Low Volatility Index simultaneously.
This index was created April 10, 2012.
3
Hypothetical Data Assumptions & Explanations
PowerShares FTSE RAFI US Fundamental (CAD Hedged) Index ETF and FTSE RAFI US 1000 Index (Canadian Hedged)
PowerShares FTSE RAFI US Fundamental (CAD Hedged) Index ETF seeks to replicate, to the extent reasonably possible and before fees and expenses, the performance of the FTSE RAFI® US 1000 Index (Canadian Hedged), or any successor thereto.
Index Methodology: The FTSE RAFI US 1000 Index (Canadian Hedged) is designed to replicate the returns of the FTSE RAFI® US 1000 Index (the “Underlying Index”), with all or substantially all of the direct U.S. dollar exposure of the Underlying Index hedged back to the Canadian dollar. The Underlying Index is part of the FTSE RAFI Index Series, launched by FTSE in association with RA. As part of the FTSE’s range of non-market capitalization weighted indices, the FTSE RAFI Index Series weights index constituents based on the following four fundamental measures of company size: dividends, cash flow, sales and book value. The Underlying Index is comprised of the 1,000 U.S. companies with the largest fundamental value that are included in the FTSE US All Cap Index.
Stocks in the Underlying Index are free-float weighted to ensure that only the investable opportunity set is included within the index. The Underlying Index is transparent, independently governed and provides investors with freely available index rules, overseen by an independent committee of leading market professionals. The methodology for the Underlying Index includes using the audited dollar values of cash flow, book value, total sales and gross dividends to derive each constituent index weight. Prices, which can be prone to speculation, are not a component of the weights. As the fundamental weightings are regularly reviewed each March, the constituent weights are less affected by market bubbles that can over-expose an investor to individual companies, sectors or countries. For more information, please go to www.ftse.com/rafi.
The Index hedges its beginning-of-period balances of its U.S. dollar exposure back to the Canadian dollar by using rolling one-month forward contracts. Daily hedge returns are computed by interpolating between the spot price and the forward price.
This index was created November 28, 2005.
4
Hypothetical Data Assumptions & Explanations
PowerShares FTSE RAFI Canadian Fundamental Index ETF and FTSE RAFI Canada Index
PowerShares FTSE RAFI Canadian Fundamental Index ETF seeks to replicate, to the extent reasonably possible and before fees and expenses, the performance of the FTSE RAFI® Canada Index, or any successor thereto.
Index Methodology: The FTSE RAFI Canada Index is part of the FTSE RAFI Index Series, launched by FTSE in association with RA. As part of the FTSE’s range of non-market capitalization weighted indices, the FTSE RAFI Index Series weights index constituents based on the following four fundamental measures of company size: dividends, cash flow, sales and book value. The FTSE RAFI Canada Index is comprised of the Canadian stocks included in the FTSE RAFI® Developed ex U.S. 1000 Index, which is comprised of the 1000 non U.S.-listed companies with thelargest fundamental value selected from the constituents of the FTSE Developed All Cap ex U.S. Index.
Stocks in the FTSE RAFI Canada Index are free-float weighted to ensure that only the investable opportunity set is included within the Index. The Index is transparent, independently governed and provides investors with freely available Index rules, overseen by an independent committee of leading market professionals. The methodology for FTSE RAFI Canada Index includes using the audited dollar values of cash flow, book value, total sales and gross dividends to derive each constituent index weight. Prices, which can be prone to speculation, are not a component of the weights. As the fundamental weightings are regularly reviewed each March, the constituent weights are less affected by market bubbles that can over-expose an investor to individual companies, sectors or countries. For more information, please go to www.ftse.com/rafi.
This index was created November 28, 2005.
Limitations on Use of Hypothetical Data: Performance data for the period before the creation date for the relevant index has been reconstructed, and indicates what the performance for each index would have been during the period had the index existed, calculated on a basis consistent with each index’s current basis of calculation. An investor cannot invest directly in an index. Performance for an index is gross of any fees and expenses that might be applicable to a fund. The hypothetical performance data for these Indices should not be taken as indicating that if the Index had, in fact, existed during the shown time periods, that this index would have achieved the hypothetical results shown. Actual results might have differed from the shown results.
CAD hedged: The PowerShares S & P 500 Low Volatility (CAD Hedged) Index ETF, PowerShares Senior Loan (CAD Hedged) Index ETF, PowerShares FTSE RAFI US Fundamental (CAD Hedged) Index ETF, and PowerShares Fundamental High Yield Corporate Bond (CAD Hedged) Index ETF are each based on a CAD hedged version of the Underlying Index. While each ETF will seek to hedge all or substantially all of the direct US dollar exposure back to the Canadian dollar, a perfect hedge may not be possible and it may not be able to achieve the same level of hedging as the hedged index it is seeks to replicate. For this reason, the returns of the underlying index will differ from the returns of an ETF that tracks a CAD hedged version of that index.
5
Standard Performance
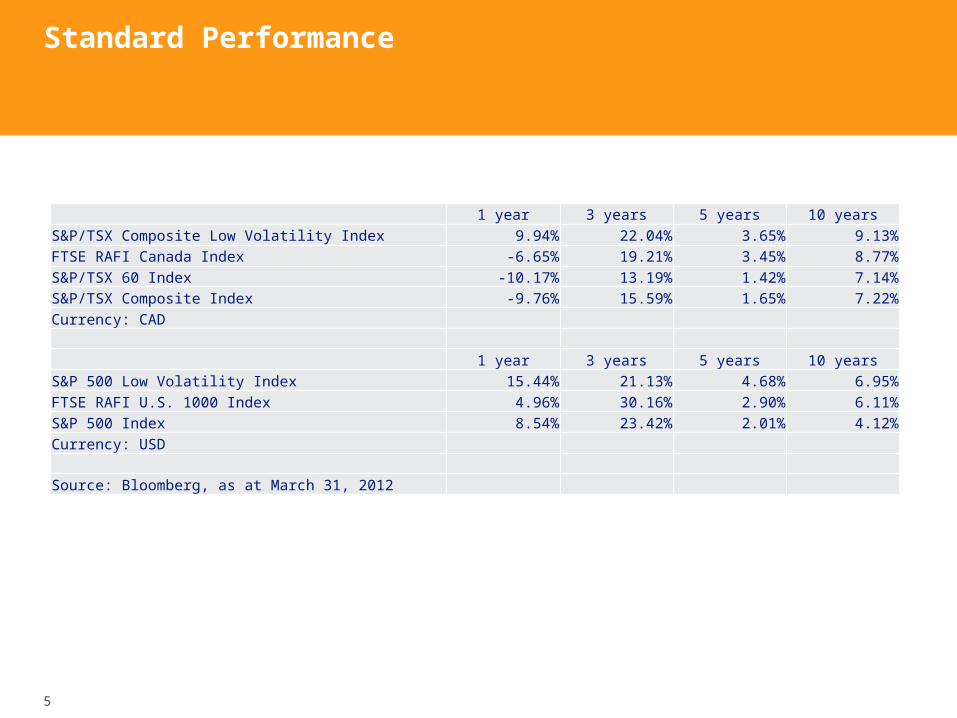
1 year 3 years 5 years 10 yearsS&P/TSX Composite Low Volatility Index 9.94% 22.04% 3.65% 9.13%FTSE RAFI Canada Index -6.65% 19.21% 3.45% 8.77%S&P/TSX 60 Index -10.17% 13.19% 1.42% 7.14%S&P/TSX Composite Index -9.76% 15.59% 1.65% 7.22%Currency: CAD
1 year 3 years 5 years 10 yearsS&P 500 Low Volatility Index 15.44% 21.13% 4.68% 6.95%FTSE RAFI U.S. 1000 Index 4.96% 30.16% 2.90% 6.11%S&P 500 Index 8.54% 23.42% 2.01% 4.12%Currency: USD
Source: Bloomberg, as at March 31, 2012
6
Trends in the global ETF market
Strategies for times of financial repression
2
1
Factor Driven ETFsThe search for alternative beta
7
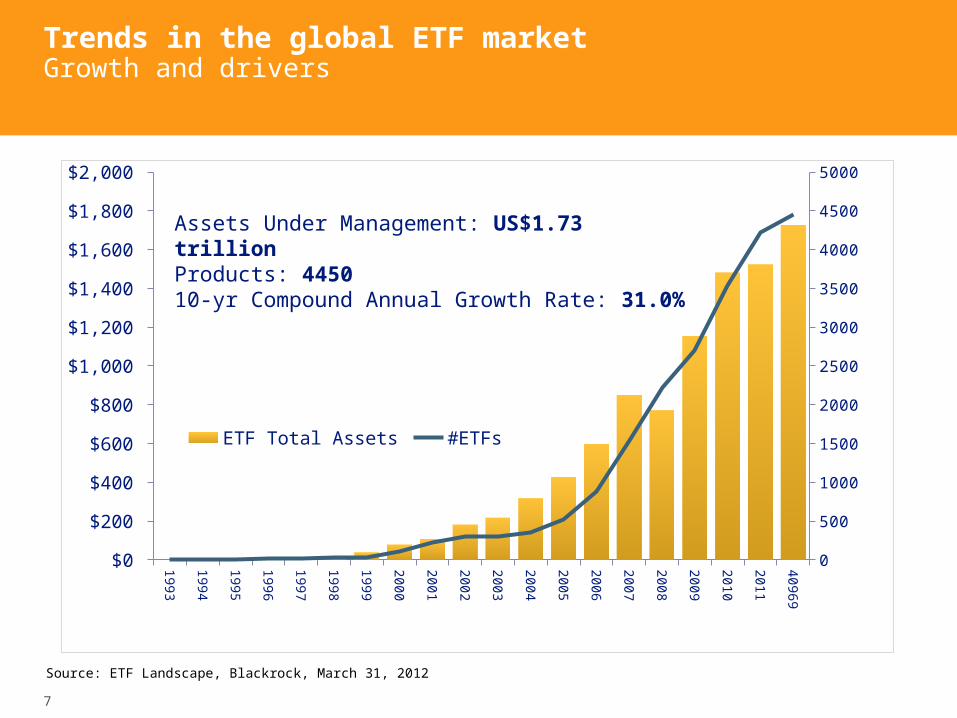
Trends in the global ETF marketGrowth and drivers
1993
1994
1995
1996
1997
1998
1999
2000
2001
2002
2003
2004
2005
2006
2007
2008
2009
2010
2011
40969
$0
$200
$400
$600
$800
$1,000
$1,200
$1,400
$1,600
$1,800
$2,000
0
500
1000
1500
2000
2500
3000
3500
4000
4500
5000
ETF Total Assets #ETFs
Source: ETF Landscape, Blackrock, March 31, 2012
Assets Under Management: US$1.73 trillionProducts: 445010-yr Compound Annual Growth Rate: 31.0%

8
Trends in the global ETF marketAlternative Beta
be-ta (β): a measure of the volatility, or systematic risk, of a security or a portfolio in comparison to the market as a whole
9
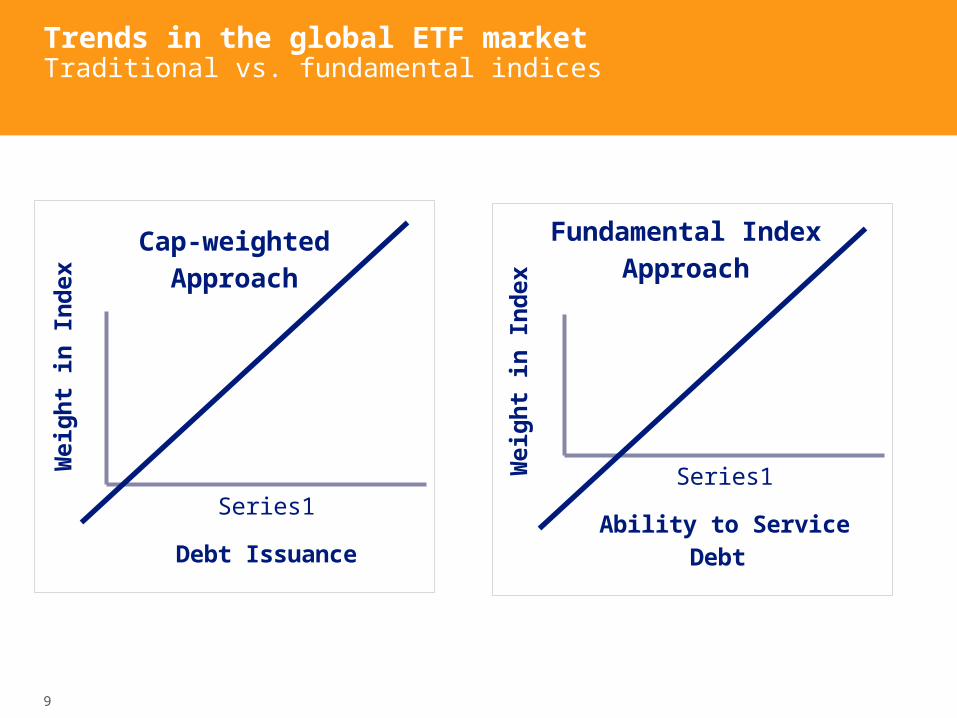
Trends in the global ETF marketTraditional vs. fundamental indices
Series1
Cap-weighted Approach
Debt Issuance
Weig
ht
in I
nd
ex
Series1
Fundamental Index Approach
Ability to Service Debt
Weig
ht
in I
nd
ex
10
Trends in the global ETF marketAlternative beta: the third choice
S&P 500 Index Median Large Cap Core Mutual Fund
FTSE RAFI US 1000 S&P 500 Low Volatility Index
0.0%1.0%2.0%3.0%4.0%5.0%6.0%7.0%8.0%
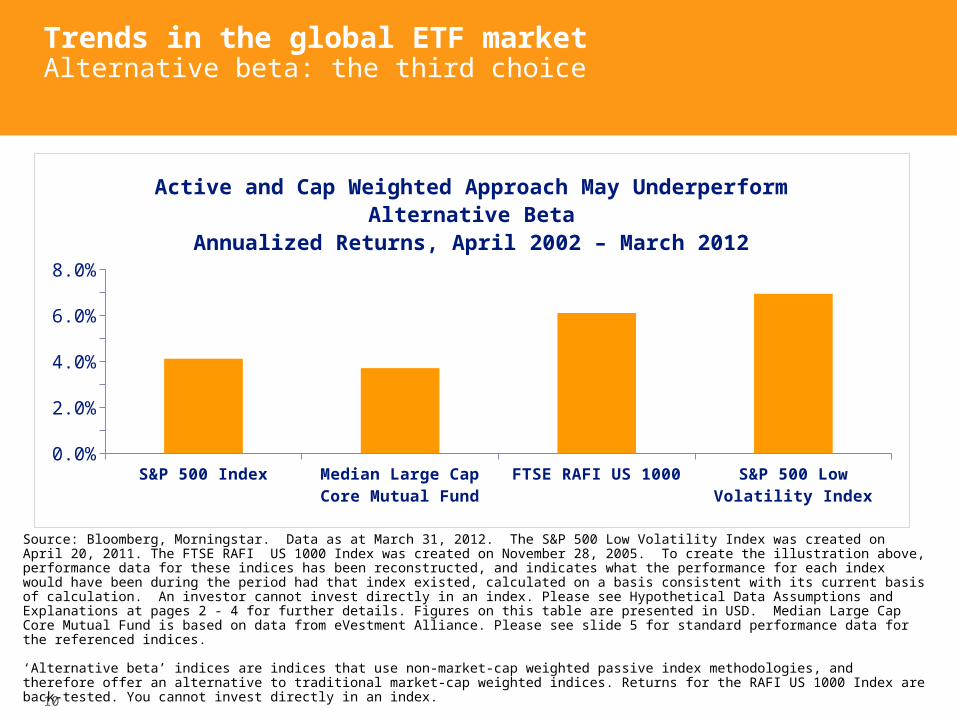
Active and Cap Weighted Approach May Underperform Alternative Beta
Annualized Returns, April 2002 – March 2012
Source: Bloomberg, Morningstar. Data as at March 31, 2012. The S&P 500 Low Volatility Index was created on April 20, 2011. The FTSE RAFI US 1000 Index was created on November 28, 2005. To create the illustration above, performance data for these indices has been reconstructed, and indicates what the performance for each index would have been during the period had that index existed, calculated on a basis consistent with its current basis of calculation. An investor cannot invest directly in an index. Please see Hypothetical Data Assumptions and Explanations at pages 2 - 4 for further details. Figures on this table are presented in USD. Median Large Cap Core Mutual Fund is based on data from eVestment Alliance. Please see slide 5 for standard performance data for the referenced indices.
‘Alternative beta’ indices are indices that use non-market-cap weighted passive index methodologies, and therefore offer an alternative to traditional market-cap weighted indices. Returns for the RAFI US 1000 Index are back-tested. You cannot invest directly in an index.
11
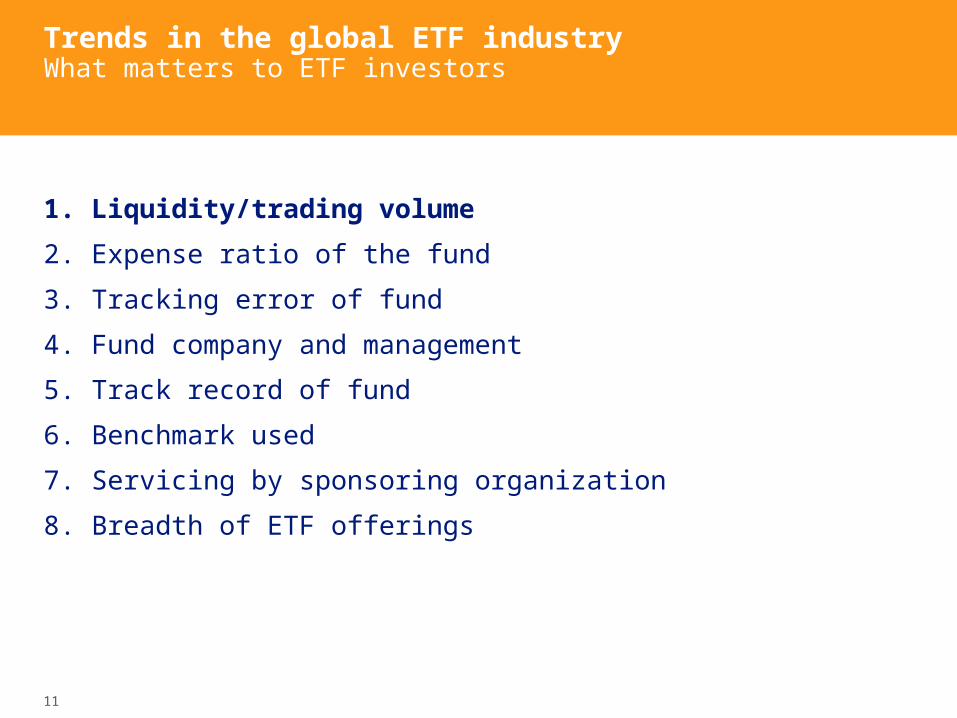
1. Liquidity/trading volume
2. Expense ratio of the fund
3. Tracking error of fund
4. Fund company and management
5. Track record of fund
6. Benchmark used
7. Servicing by sponsoring organization
8. Breadth of ETF offerings
Trends in the global ETF industryWhat matters to ETF investors

12
PowerShares QQQ0
0.5
1
1.5
2
2.5
3
3.5
4
4.5
Weighted avg. spread (underly-ing)ETF (median spread)
Spre
ad (
basis
poin
ts)
Trends in the global ETF marketLiquidity matters
Fund name Ticker20 Day Avg.
Bid/Ask spread
20 Day Avg. Bid/Ask
spread ratio
Average Daily Volume
Fund size (CAD $000)
PowerShares QQQ (CAD Hedged) Index ETF QQC 0.022 0.100% 11,763 $12,760
iShares NASDAQ 100 Hedged to CAD Index ETF XQQ 0.036 0.181% 7,084 $6,645
BMO NASDAQ 100 Equity Hedged to CAD Index ETF ZQQ 0.044 0.205% 43,974 $95,927
Source: Bloomberg March 9, 2012
13
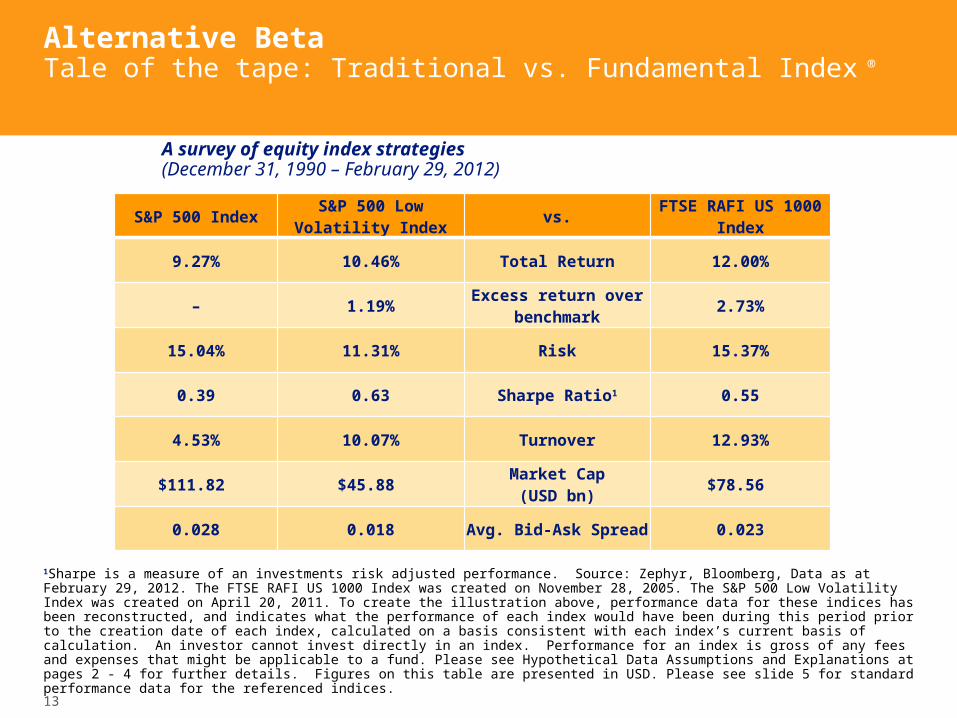
Alternative BetaTale of the tape: Traditional vs. Fundamental Index ®
1Sharpe is a measure of an investments risk adjusted performance. Source: Zephyr, Bloomberg, Data as at February 29, 2012. The FTSE RAFI US 1000 Index was created on November 28, 2005. The S&P 500 Low Volatility Index was created on April 20, 2011. To create the illustration above, performance data for these indices has been reconstructed, and indicates what the performance of each index would have been during this period prior to the creation date of each index, calculated on a basis consistent with each index’s current basis of calculation. An investor cannot invest directly in an index. Performance for an index is gross of any fees and expenses that might be applicable to a fund. Please see Hypothetical Data Assumptions and Explanations at pages 2 - 4 for further details. Figures on this table are presented in USD. Please see slide 5 for standard performance data for the referenced indices.
S&P 500 IndexS&P 500 Low
Volatility Indexvs.
FTSE RAFI US 1000 Index
9.27% 10.46% Total Return 12.00%
– 1.19%Excess return over
benchmark2.73%
15.04% 11.31% Risk 15.37%
0.39 0.63 Sharpe Ratio1 0.55
4.53% 10.07% Turnover 12.93%
$111.82 $45.88 Market Cap(USD bn)
$78.56
0.028 0.018 Avg. Bid-Ask Spread 0.023
A survey of equity index strategies (December 31, 1990 – February 29, 2012)
14
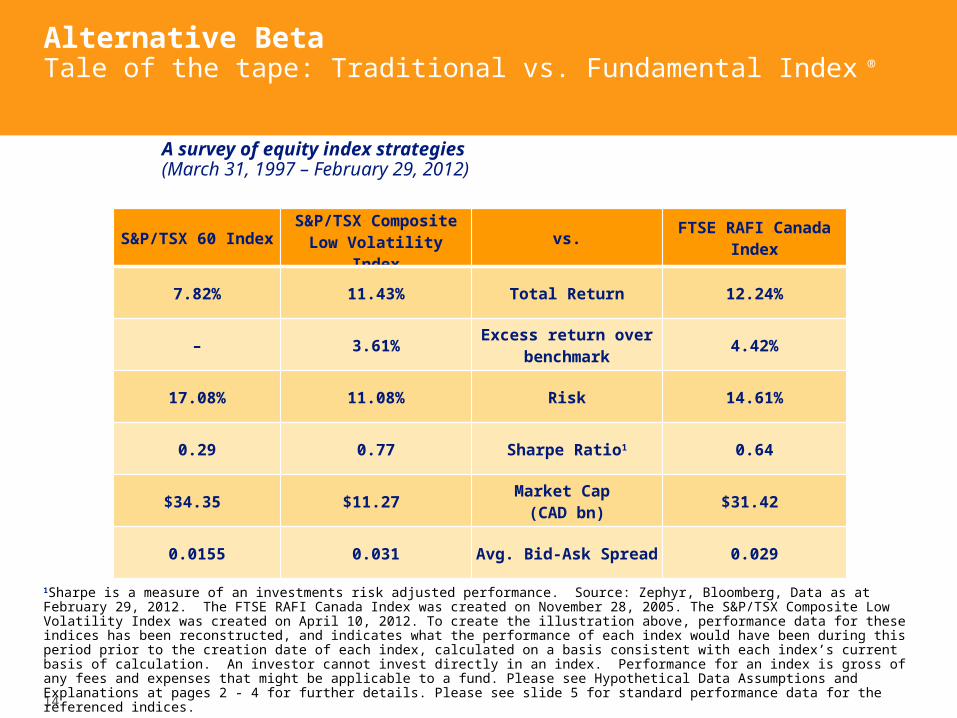
Alternative BetaTale of the tape: Traditional vs. Fundamental Index ®
1Sharpe is a measure of an investments risk adjusted performance. Source: Zephyr, Bloomberg, Data as at February 29, 2012. The FTSE RAFI Canada Index was created on November 28, 2005. The S&P/TSX Composite Low Volatility Index was created on April 10, 2012. To create the illustration above, performance data for these indices has been reconstructed, and indicates what the performance of each index would have been during this period prior to the creation date of each index, calculated on a basis consistent with each index’s current basis of calculation. An investor cannot invest directly in an index. Performance for an index is gross of any fees and expenses that might be applicable to a fund. Please see Hypothetical Data Assumptions and Explanations at pages 2 - 4 for further details. Please see slide 5 for standard performance data for the referenced indices.
S&P/TSX 60 IndexS&P/TSX Composite Low Volatility Index
vs.FTSE RAFI Canada
Index
7.82% 11.43% Total Return 12.24%
– 3.61%Excess return over
benchmark4.42%
17.08% 11.08% Risk 14.61%
0.29 0.77 Sharpe Ratio1 0.64
$34.35 $11.27 Market Cap
(CAD bn)$31.42
0.0155 0.031 Avg. Bid-Ask Spread 0.029
A survey of equity index strategies (March 31, 1997 – February 29, 2012)
15
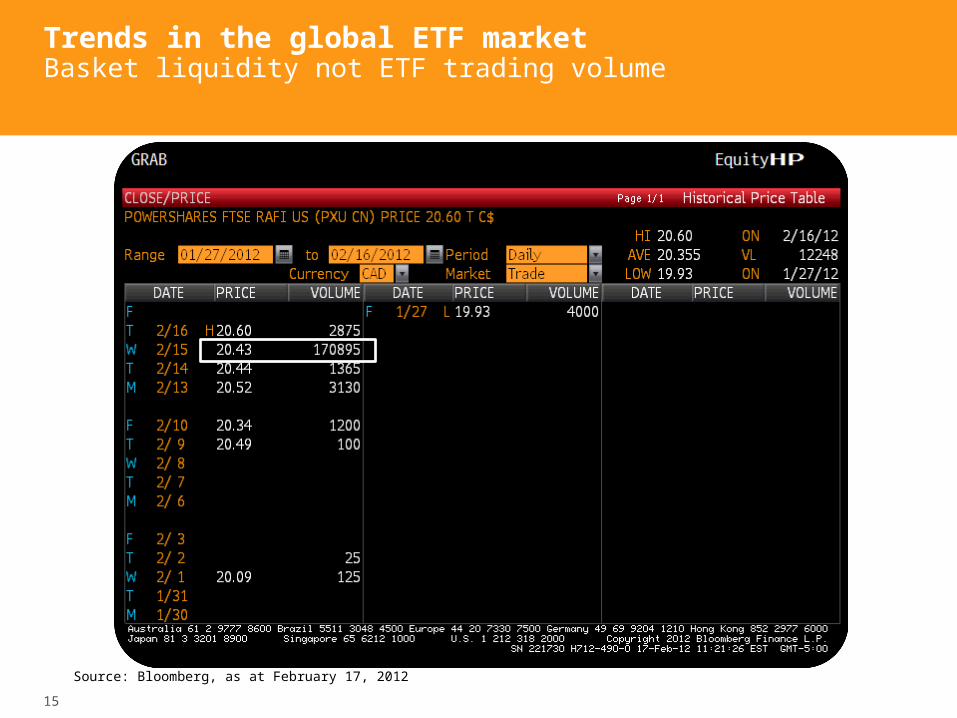
Trends in the global ETF marketBasket liquidity not ETF trading volume
Source: Bloomberg, as at February 17, 2012
16
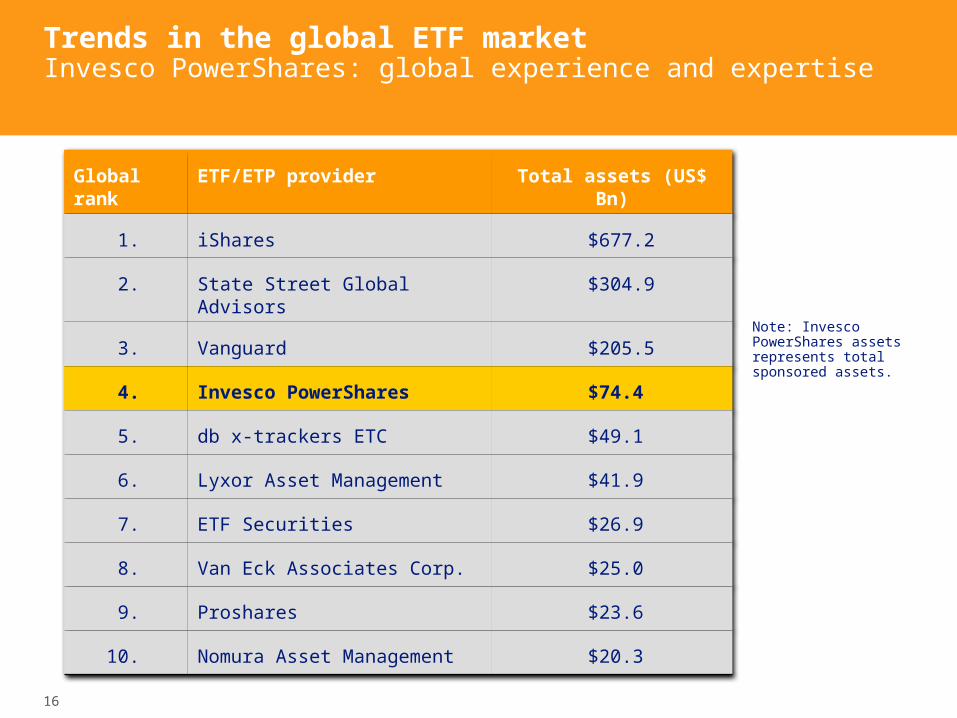
Trends in the global ETF marketInvesco PowerShares: global experience and expertise
Source: InvescoPowershares and Bloomberg, as at March 31, 2012
Global rank ETF/ETP provider Total assets (US$ Bn)
1. iShares $677.2
2. State Street Global Advisors $304.9
3. Vanguard $205.5
4. Invesco PowerShares $74.4
5. db x-trackers ETC $49.1
6. Lyxor Asset Management $41.9
7. ETF Securities $26.9
8. Van Eck Associates Corp. $25.0
9. Proshares $23.6
10. Nomura Asset Management $20.3
Note: Invesco PowerShares assets represents total sponsored assets.
17
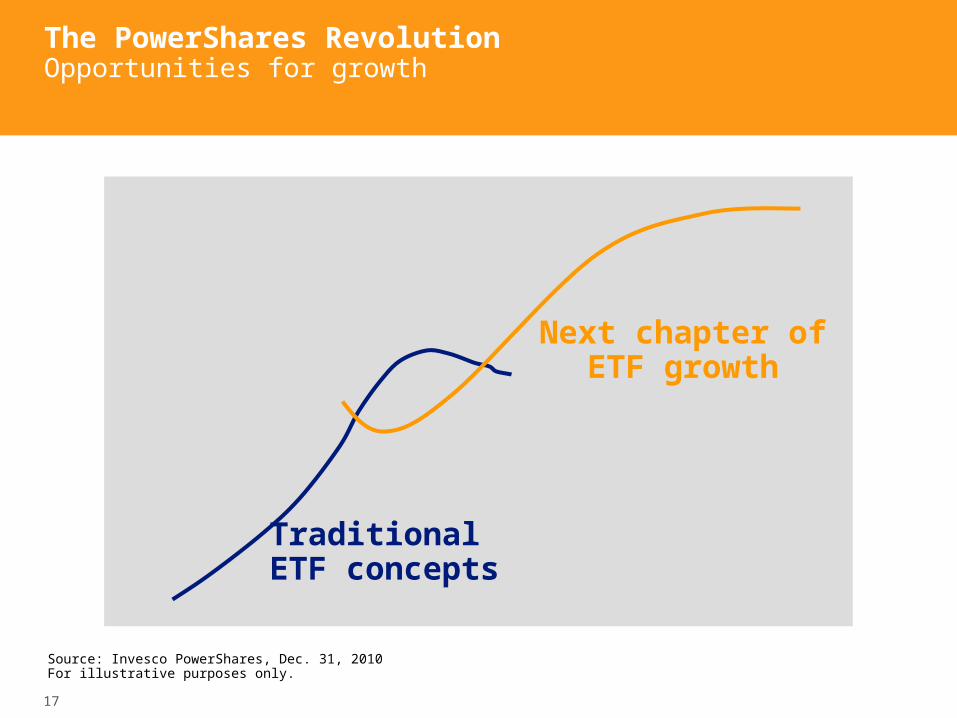
The PowerShares Revolution Opportunities for growth
Source: Invesco PowerShares, Dec. 31, 2010For illustrative purposes only.
Traditional ETF concepts
Next chapter of ETF growth

18
Trends in the global ETF marketPowerShares ETFs listed on TSX
Fixed income PSB - PowerShares 1-5 Year Laddered Investment Grade Corporate Bond Index ETF PGL - PowerShares Ultra DLUX Long Term Government Bond Index ETF BKL - PowerShares Senior Loan (CAD Hedged) Index ETF PFH - PowerShares Fundamental High Yield Corporate Bond (CAD Hedged) Index ETF
Equity income PPS - PowerShares Canadian Preferred Share Index ETF PDC - PowerShares Canadian Dividend Index ETF
Fundamental Index® equity PXC - PowerShares FTSE RAFI Canadian Fundamental Index ETF PXU - PowerShares FTSE RAFI US Fundamental (CAD Hedged) Index ETF
Low-volatility equity TLV - PowerShares S&P/TSX Composite Low Volatility Index ETF ULV - PowerShares S&P 500 Low Volatility (CAD Hedged) Index ETF
High-beta equity THB - PowerShares S&P/TSX Composite High Beta Index ETF UHB - PowerShares S&P 500 High Beta (CAD Hedged) Index ETF
U.S. equity QQC - PowerShares QQQ (CAD Hedged) Index ETF
19
Trends in the global ETF market
Strategies for times of financial repression
2
1
Alternative BetaHow does it affect the ETF experience?

20
Strategies for times of financial repressionA new normal requires a new approach
1900190519101915192019251930193519401945195019551960196519701975198019851990199520002005201020150
20
40
60
80
100
120
140U.S. federal debt to GDP ratio (%) 1900-2016
Deb
t to
GD
P R
ati
o
Source: usgovernmentspending.com. Data from 1900 – 2011 is actual Debt to GDP Ratio, while 2012 – 2016 is projected Debt to GDP Ratio
Financial Repression is a form of debt reduction employed by governments in order to deal with their high levels of accumulated debt. This could include governments capping interest rates, ownership of banks, creation of a captive market for government debt or restrictions on the transfer of assets.

21
Strategies for times of financial repressionA new normal requires a new approach
10-Year Treasury Yields during the 1940s
Year Nominal Yield Real Yield
1949 1.80% 3.90%
1948 2.12% -0.88%
1947 2.18% -6.62%
1946 1.82% -16.28%
1945 1.67% -0.53%
1944 2.10% -0.20%
1943 2.12% -0.88%
1942 2.11% -6.89%
1941 2.07% -7.83%
1940 1.88% -1.18%
Source: Guggenheim, “Market Perspectives”, October 2010
22
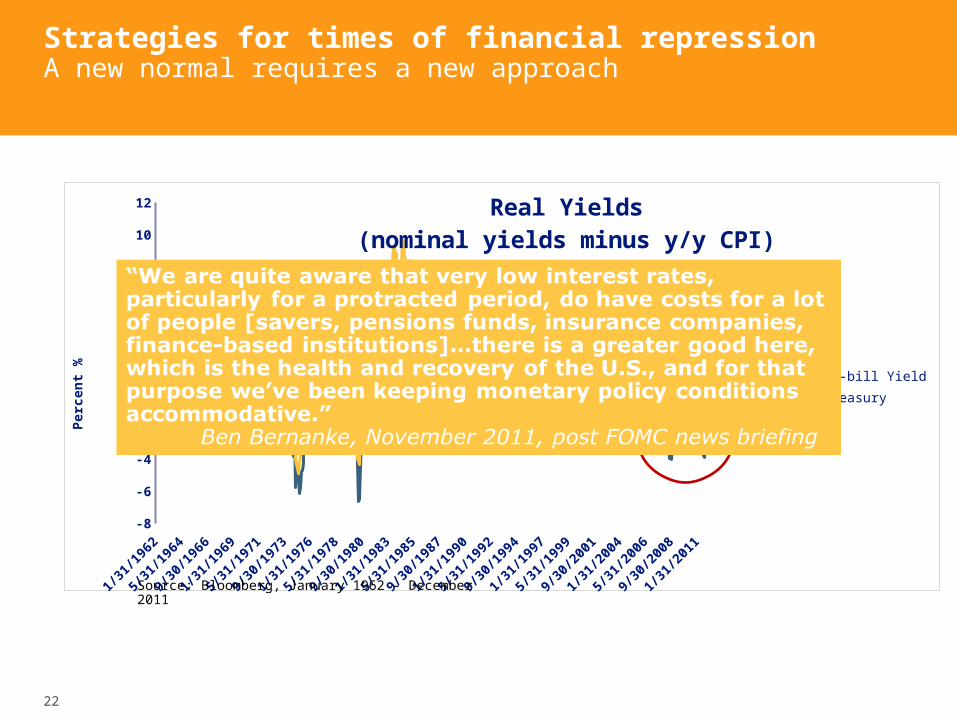
Strategies for times of financial repressionA new normal requires a new approach
1962 1969 1976 1983 1990 1997 2004 2011-8
-6
-4
-2
0
2
4
6
8
10
12 Real Yields(nominal yields minus y/y CPI)
90-day T-bill Yield10 Yr Treasury
Perc
ent
%
Source: Bloomberg, January 1962 - December 2011
23
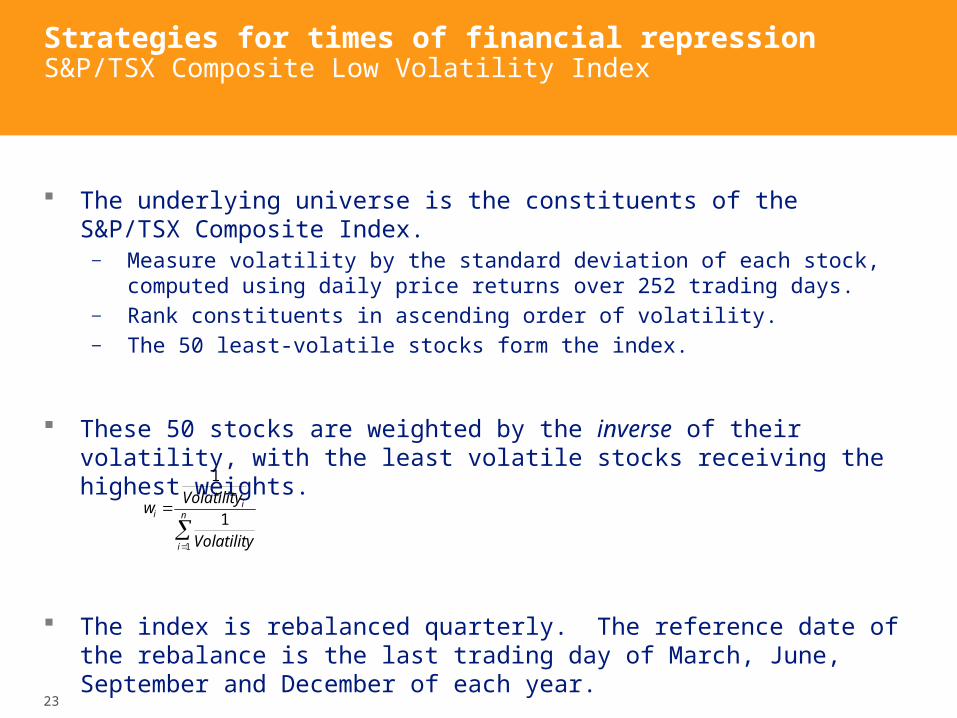
Strategies for times of financial repressionS&P/TSX Composite Low Volatility Index
The underlying universe is the constituents of the S&P/TSX Composite Index.
— Measure volatility by the standard deviation of each stock, computed using daily price returns over 252 trading days.
— Rank constituents in ascending order of volatility.— The 50 least-volatile stocks form the index.
These 50 stocks are weighted by the inverse of their volatility, with the least volatile stocks receiving the highest weights.
The index is rebalanced quarterly. The reference date of the rebalance is the last trading day of March, June, September and December of each year.
n
i
ii
Volatility
Volatilityw
1
1
1
24
Strategies for times of financial repressionS&P/TSX Composite Low Volatility Index
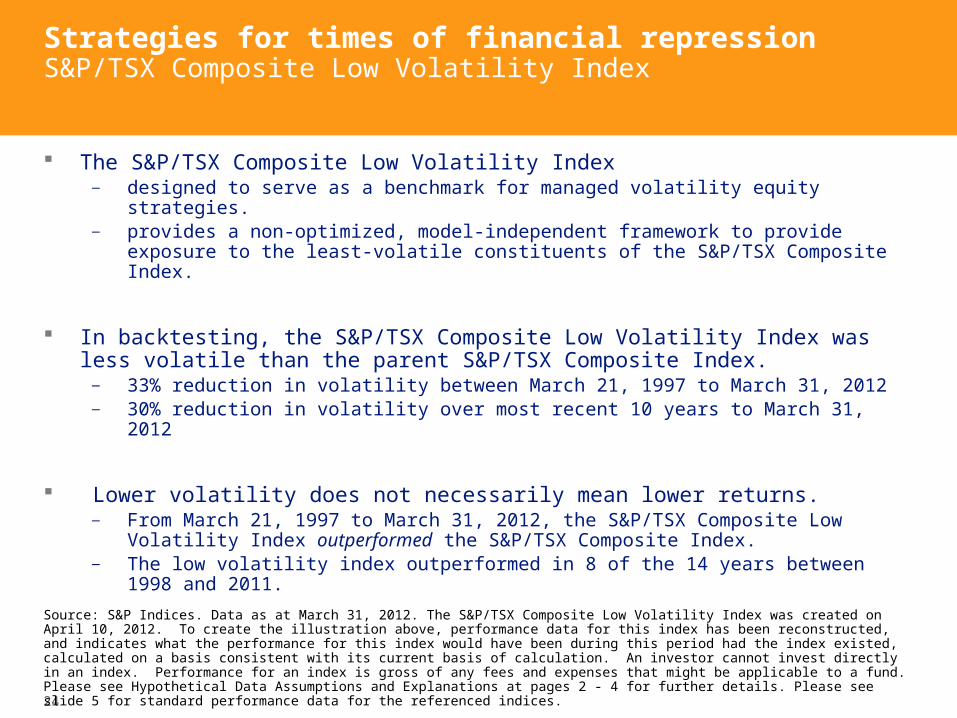
The S&P/TSX Composite Low Volatility Index — designed to serve as a benchmark for managed volatility equity strategies.— provides a non-optimized, model-independent framework to provide exposure to
the least-volatile constituents of the S&P/TSX Composite Index.
In backtesting, the S&P/TSX Composite Low Volatility Index was less volatile than the parent S&P/TSX Composite Index.
— 33% reduction in volatility between March 21, 1997 to March 31, 2012 — 30% reduction in volatility over most recent 10 years to March 31, 2012
Lower volatility does not necessarily mean lower returns.— From March 21, 1997 to March 31, 2012, the S&P/TSX Composite Low Volatility
Index outperformed the S&P/TSX Composite Index.— The low volatility index outperformed in 8 of the 14 years between 1998 and
2011.
Source: S&P Indices. Data as at March 31, 2012. The S&P/TSX Composite Low Volatility Index was created on April 10, 2012. To create the illustration above, performance data for this index has been reconstructed, and indicates what the performance for this index would have been during this period had the index existed, calculated on a basis consistent with its current basis of calculation. An investor cannot invest directly in an index. Performance for an index is gross of any fees and expenses that might be applicable to a fund. Please see Hypothetical Data Assumptions and Explanations at pages 2 - 4 for further details. Please see slide 5 for standard performance data for the referenced indices.
25
Strategies for times of financial repressionS&P/TSX Composite Low Volatility Index
3/1/
1997
3/1/
1998
3/1/
1999
3/1/
2000
3/1/
2001
3/1/
2002
3/1/
2003
3/1/
2004
3/1/
2005
3/1/
2006
3/1/
2007
3/1/
2008
3/1/
2009
3/1/
2010
3/1/
2011
0
100
200
300
400
500
600
S&P/TSX Composite Low Volatility Index
S&P/TSX 60 Index
S&P/TSX Composite Index
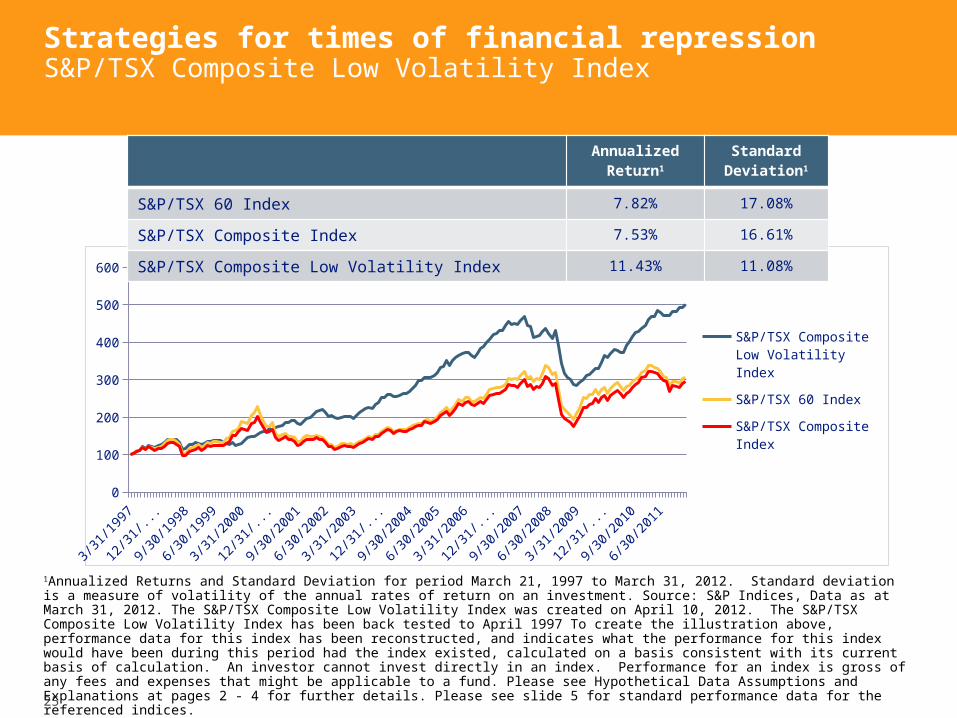
Annualized Return1
Standard Deviation1
S&P/TSX 60 Index 7.82% 17.08%
S&P/TSX Composite Index 7.53% 16.61%
S&P/TSX Composite Low Volatility Index 11.43% 11.08%
1Annualized Returns and Standard Deviation for period March 21, 1997 to March 31, 2012. Standard deviation is a measure of volatility of the annual rates of return on an investment. Source: S&P Indices, Data as at March 31, 2012. The S&P/TSX Composite Low Volatility Index was created on April 10, 2012. The S&P/TSX Composite Low Volatility Index has been back tested to April 1997 To create the illustration above, performance data for this index has been reconstructed, and indicates what the performance for this index would have been during this period had the index existed, calculated on a basis consistent with its current basis of calculation. An investor cannot invest directly in an index. Performance for an index is gross of any fees and expenses that might be applicable to a fund. Please see Hypothetical Data Assumptions and Explanations at pages 2 - 4 for further details. Please see slide 5 for standard performance data for the referenced indices.
26
Strategies for times of financial repression S&P/TSX Composite Low Volatility Index
Mar-97
Sep-97
Mar-98
Sep-98
Mar-99
Sep-99
Mar-00
Sep-00
Mar-01
Sep-01
Mar-02
Sep-02
Mar-03
Sep-03
Mar-04
Sep-04
Mar-05
Sep-05
Mar-06
Sep-06
Mar-07
Sep-07
Mar-08
Sep-08
Mar-09
Sep-09
Mar-10
Sep-10
Mar-11
Sep-11
Mar-12
0%
10%
20%
30%
40%
50%
60%
70%
80%
90%
100%
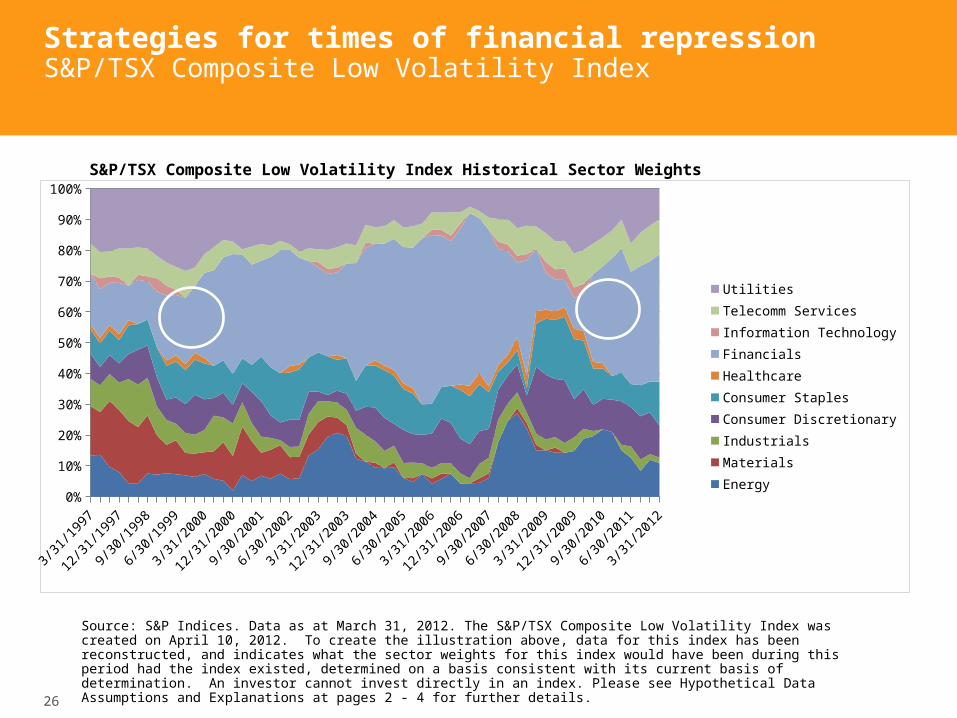
UtilitiesTelecomm ServicesInformation TechnologyFinancialsHealthcareConsumer StaplesConsumer DiscretionaryIndustrialsMaterialsEnergy
Source: S&P Indices. Data as at March 31, 2012. The S&P/TSX Composite Low Volatility Index was created on April 10, 2012. To create the illustration above, data for this index has been reconstructed, and indicates what the sector weights for this index would have been during this period had the index existed, determined on a basis consistent with its current basis of determination. An investor cannot invest directly in an index. Please see Hypothetical Data Assumptions and Explanations at pages 2 - 4 for further details.
S&P/TSX Composite Low Volatility Index Historical Sector Weights

27
Strategies for times of financial repression S&P/TSX Composite Low Volatility Index
3/1/19983/1/19993/1/20003/1/20013/1/20023/1/20033/1/20043/1/20053/1/20063/1/20073/1/20083/1/20093/1/20103/1/20113/1/20120%
1%
2%
3%
4%
5%
6%
7%
8%
9%
10%
S&P/TSX Composite Low Volatility Index S&P/TSX Composite Index
Dividend Yield Consistently Higher than S&P/TSX Composite Index
Source: S&P Indices. Data as at March 31, 2012. The S&P/TSX Composite Low Volatility Index was created on April 10, 2012. To create the illustration above, data for this index has been reconstructed, and indicates what the dividend yield for this index would have been during this period had the index existed, calculated on a basis consistent with its current basis of calculation. An investor cannot invest directly in an index. The dividend yield of an index is not indicative of the yield an investor could expect to earn on an ETF that seeks to replicate the performance of that index. Please see Hypothetical Data Assumptions and Explanations at pages 2 - 4 for further details.
28
TLV PowerShares S&P/TSX Composite Low Volatility Index ETF
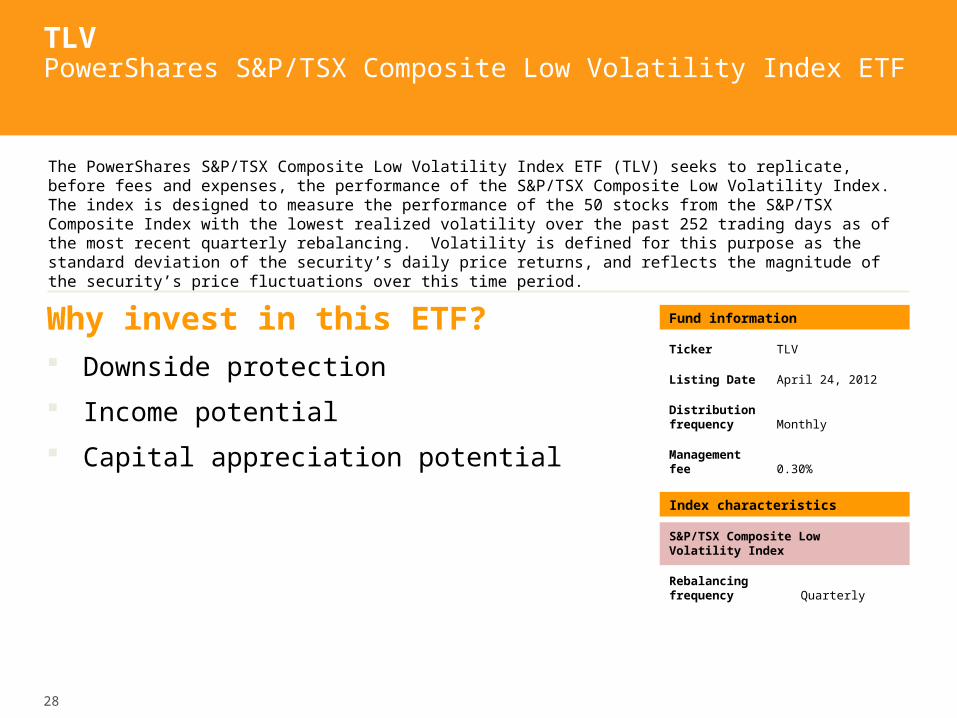
Why invest in this ETF? Downside protection
Income potential
Capital appreciation potential
The PowerShares S&P/TSX Composite Low Volatility Index ETF (TLV) seeks to replicate, before fees and expenses, the performance of the S&P/TSX Composite Low Volatility Index. The index is designed to measure the performance of the 50 stocks from the S&P/TSX Composite Index with the lowest realized volatility over the past 252 trading days as of the most recent quarterly rebalancing. Volatility is defined for this purpose as the standard deviation of the security’s daily price returns, and reflects the magnitude of the security’s price fluctuations over this time period.
Fund information
Ticker TLV
Listing Date April 24, 2012
Distributionfrequency Monthly
Management fee 0.30%
Index characteristics
S&P/TSX Composite Low Volatility Index
Rebalancing frequency Quarterly
29
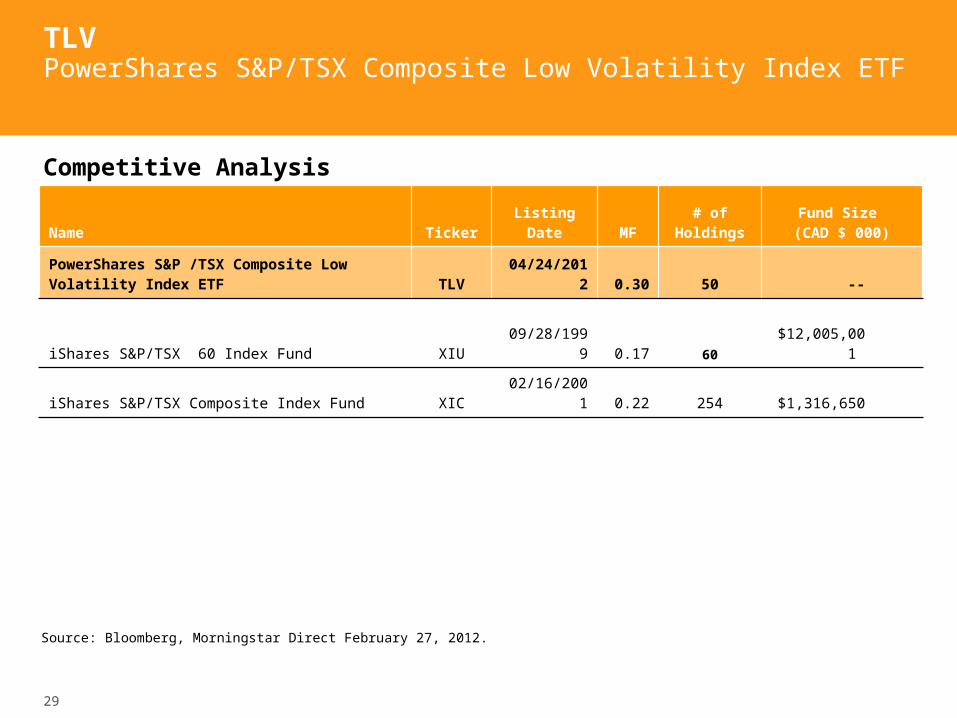
TLV PowerShares S&P/TSX Composite Low Volatility Index ETF
Name Ticker Listing Date MF# of
HoldingsFund Size
(CAD $ 000)
PowerShares S&P /TSX Composite Low Volatility Index ETF TLV 04/24/2012 0.30 50 --
iShares S&P/TSX 60 Index Fund XIU 09/28/1999 0.17 60 $12,005,001
iShares S&P/TSX Composite Index Fund XIC 02/16/2001 0.22 254 $1,316,650
Source: Bloomberg, Morningstar Direct February 27, 2012.
Competitive Analysis
30
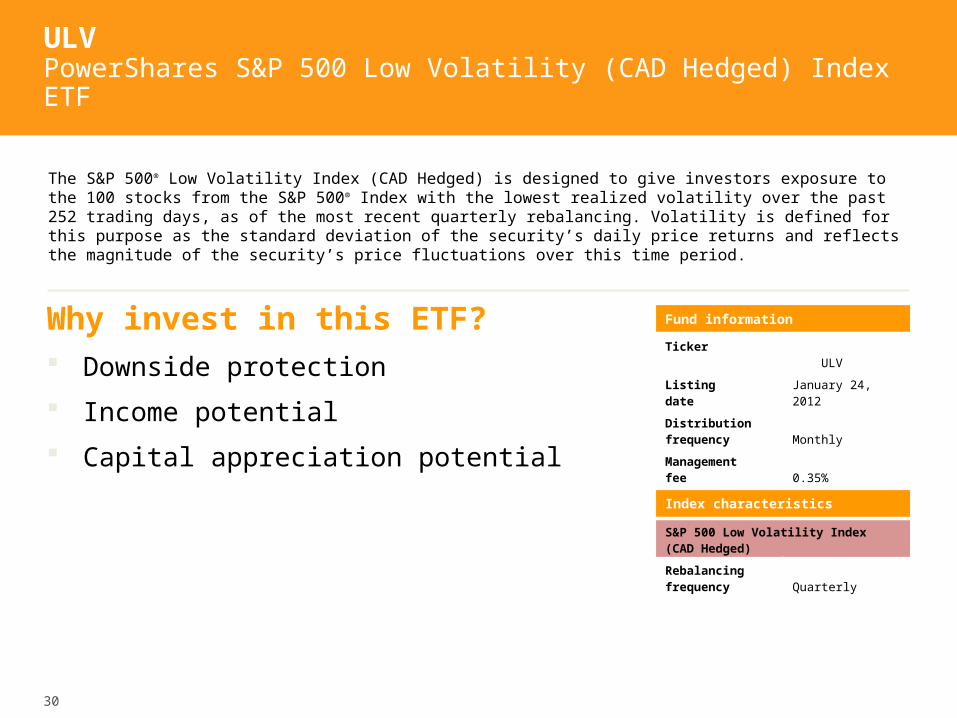
ULV PowerShares S&P 500 Low Volatility (CAD Hedged) Index ETF
Why invest in this ETF? Downside protection
Income potential
Capital appreciation potential
The S&P 500® Low Volatility Index (CAD Hedged) is designed to give investors exposure to the 100 stocks from the S&P 500® Index with the lowest realized volatility over the past 252 trading days, as of the most recent quarterly rebalancing. Volatility is defined for this purpose as the standard deviation of the security’s daily price returns and reflects the magnitude of the security’s price fluctuations over this time period.
Fund information
Ticker ULV
Listingdate
January 24, 2012
Distributionfrequency
Monthly
Management fee
0.35%
Index characteristics
S&P 500 Low Volatility Index (CAD Hedged)
Rebalancing frequency
Quarterly

31
ULV PowerShares S&P 500 Low Volatility (CAD Hedged) Index ETF
Name Ticker Listing Date MF# of
HoldingsFund Size
(CAD $ 000)
PowerShares S&P 500 Low Volatility (CAD-Hedged) Index ETF ULV 01/24/2012 0.35 100 $6,054
iShares S&P 500 Index Fund (CAD-Hedged) XSP 24/05/2001 0.24 501 $1,729,783
ETF Ticker YTM
ULV 3.35%
XSP 1.90%
Source: Bloomberg, Morningstar Direct March 9, 2012.1These are the weighted average yields of the S&P 500 Low Volatility Index and the S&P 500 Index as at March 9, 2012. These yields are not indicative of the yield an investor could expect to earn on an ETF that seeks to replicate the performance of one of these indices. Yields will vary over time.
Competitive Analysis
Index Dividend Yield comparison1
32
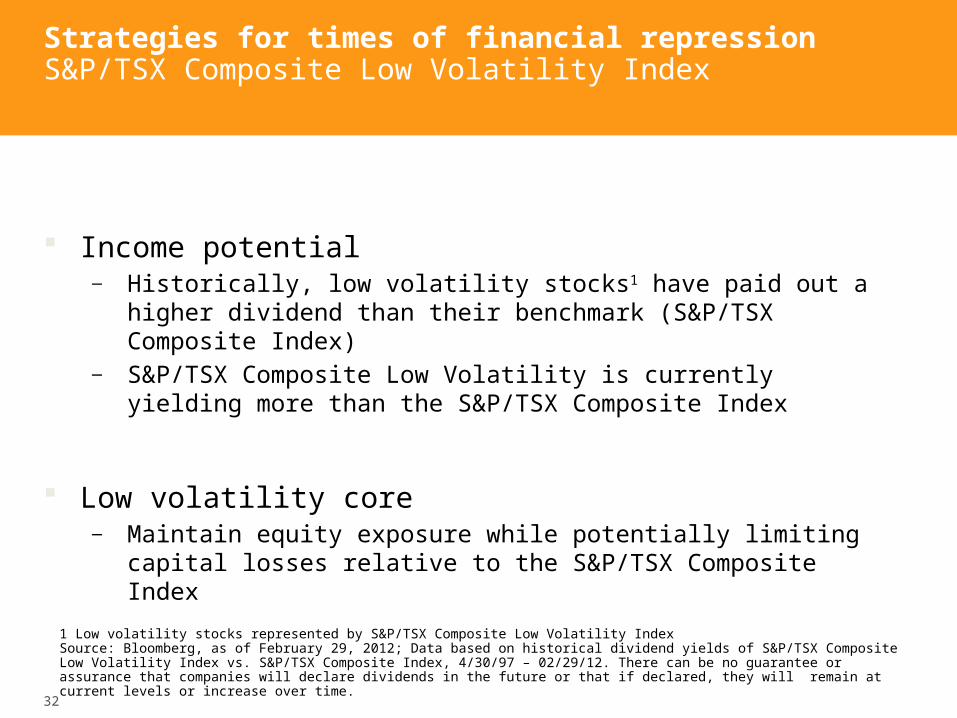
Strategies for times of financial repression S&P/TSX Composite Low Volatility Index
Income potential— Historically, low volatility stocks1 have paid out a higher
dividend than their benchmark (S&P/TSX Composite Index)— S&P/TSX Composite Low Volatility is currently yielding more
than the S&P/TSX Composite Index
Low volatility core — Maintain equity exposure while potentially limiting capital
losses relative to the S&P/TSX Composite Index
1 Low volatility stocks represented by S&P/TSX Composite Low Volatility IndexSource: Bloomberg, as of February 29, 2012; Data based on historical dividend yields of S&P/TSX Composite Low Volatility Index vs. S&P/TSX Composite Index, 4/30/97 – 02/29/12. There can be no guarantee or assurance that companies will declare dividends in the future or that if declared, they will remain at current levels or increase over time.
33
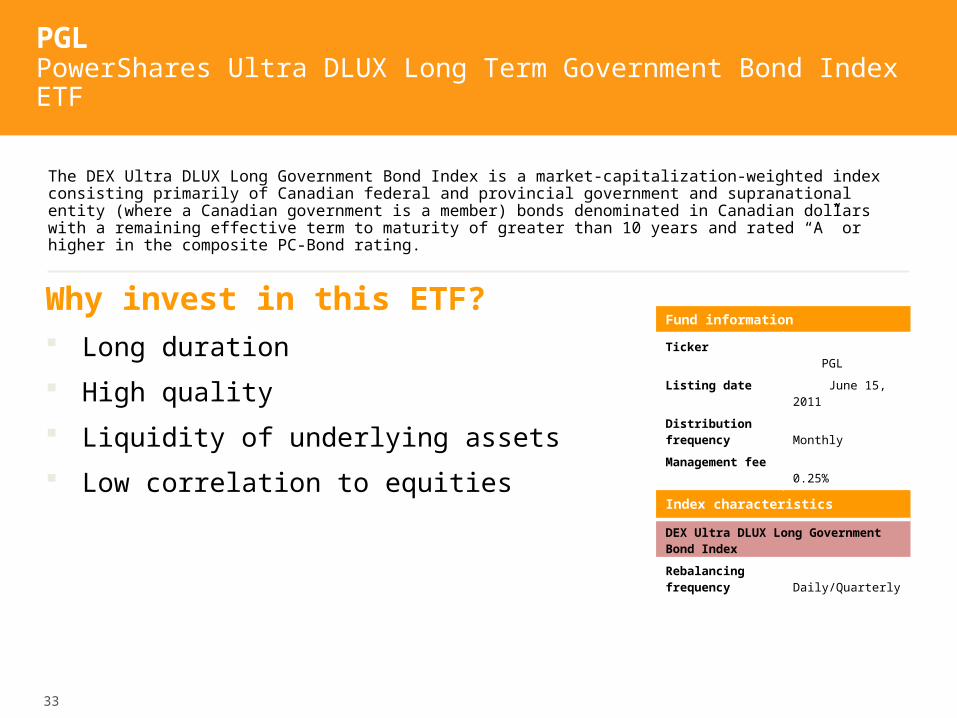
PGLPowerShares Ultra DLUX Long Term Government Bond Index ETF
Why invest in this ETF? Long duration
High quality
Liquidity of underlying assets
Low correlation to equities
The DEX Ultra DLUX Long Government Bond Index is a market-capitalization-weighted index consisting primarily of Canadian federal and provincial government and supranational entity (where a Canadian government is a member) bonds denominated in Canadian dollars with a remaining effective term to maturity of greater than 10 years and rated “A” or higher in the composite PC-Bond rating.
Fund information
Ticker PGL
Listing date June 15, 2011
Distribution frequency
Monthly
Management fee
0.25%
Index characteristics
DEX Ultra DLUX Long Government Bond Index
Rebalancing frequency
Daily/Quarterly
34
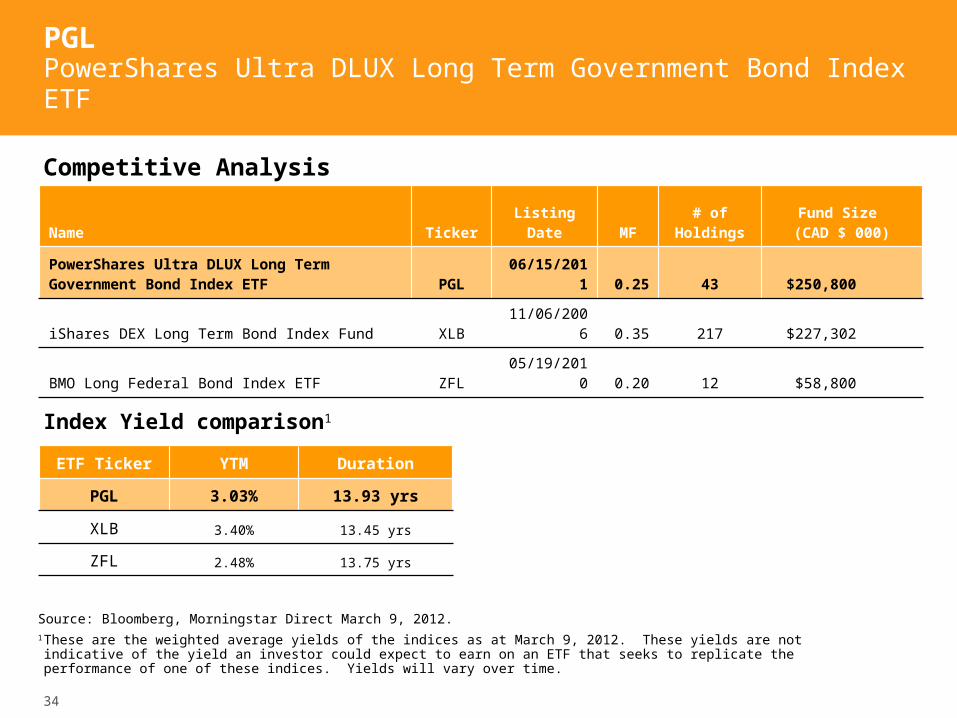
PGLPowerShares Ultra DLUX Long Term Government Bond Index ETF
Name Ticker Listing Date MF# of
HoldingsFund Size
(CAD $ 000)
PowerShares Ultra DLUX Long Term Government Bond Index ETF PGL 06/15/2011 0.25 43 $250,800
iShares DEX Long Term Bond Index Fund XLB 11/06/2006 0.35 217 $227,302
BMO Long Federal Bond Index ETF ZFL 05/19/2010 0.20 12 $58,800
ETF Ticker YTM Duration
PGL 3.03% 13.93 yrs
XLB 3.40% 13.45 yrs
ZFL 2.48% 13.75 yrs
Source: Bloomberg, Morningstar Direct March 9, 2012.1These are the weighted average yields of the indices as at March 9, 2012. These yields are not indicative of the yield an investor could expect to earn on an ETF that seeks to replicate the performance of one of these indices. Yields will vary over time.
Competitive Analysis
Index Yield comparison1
35
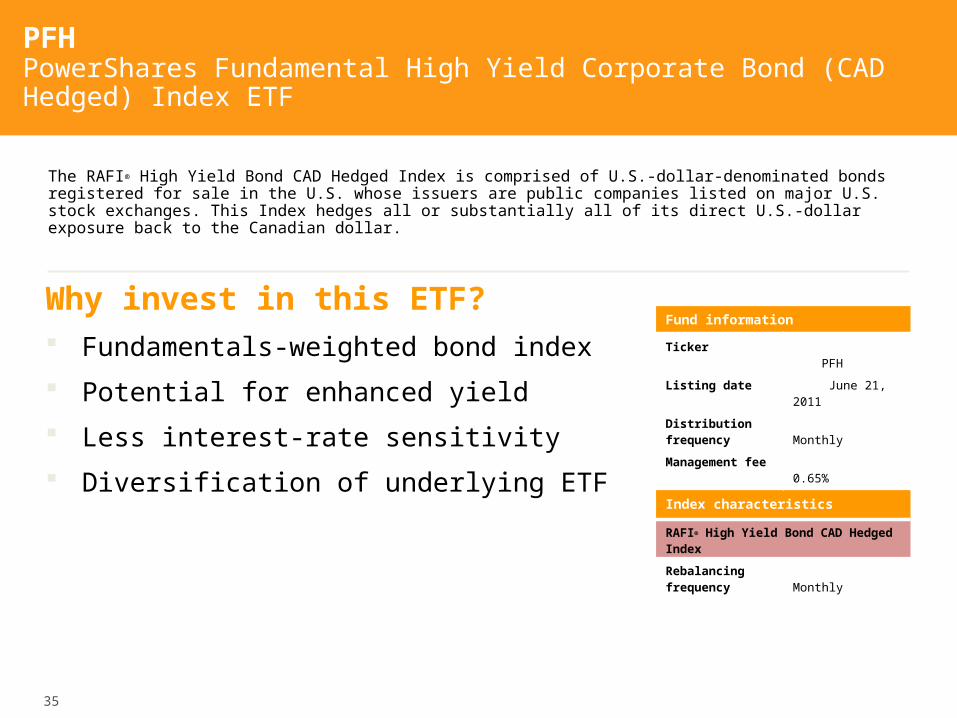
PFH PowerShares Fundamental High Yield Corporate Bond (CAD Hedged) Index ETF
Why invest in this ETF? Fundamentals-weighted bond index
Potential for enhanced yield
Less interest-rate sensitivity
Diversification of underlying ETF
The RAFI® High Yield Bond CAD Hedged Index is comprised of U.S.-dollar-denominated bonds registered for sale in the U.S. whose issuers are public companies listed on major U.S. stock exchanges. This Index hedges all or substantially all of its direct U.S.-dollar exposure back to the Canadian dollar.
Fund information
Ticker PFH
Listing date June 21, 2011
Distribution frequency
Monthly
Management fee
0.65%
Index characteristics
RAFI® High Yield Bond CAD Hedged Index
Rebalancing frequency
Monthly
36
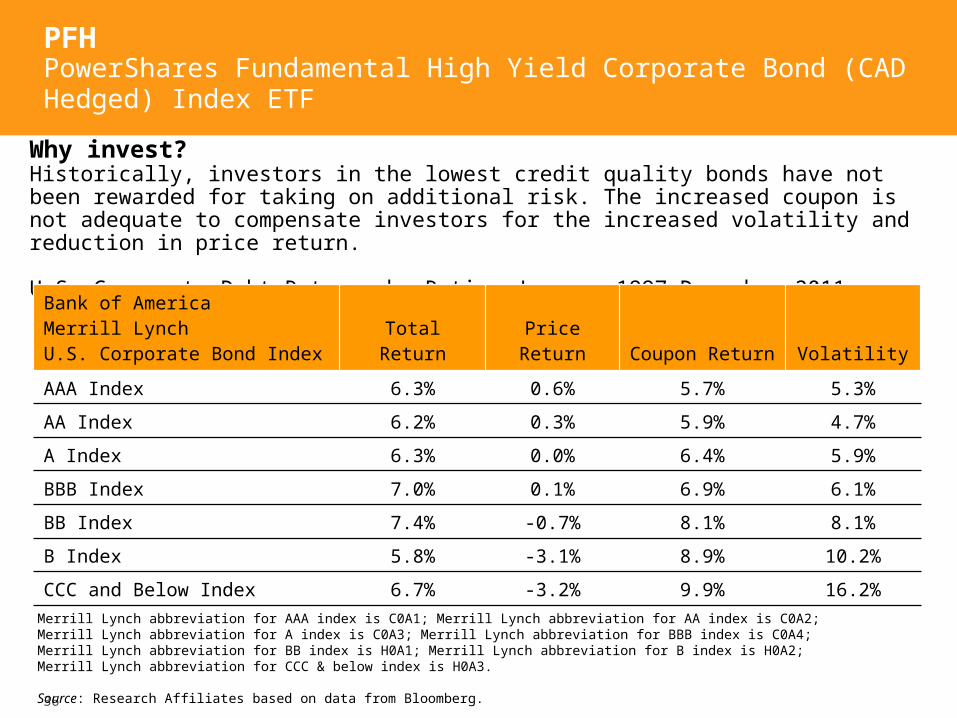
Merrill Lynch abbreviation for AAA index is C0A1; Merrill Lynch abbreviation for AA index is C0A2; Merrill Lynch abbreviation for A index is C0A3; Merrill Lynch abbreviation for BBB index is C0A4; Merrill Lynch abbreviation for BB index is H0A1; Merrill Lynch abbreviation for B index is H0A2; Merrill Lynch abbreviation for CCC & below index is H0A3.
Source: Research Affiliates based on data from Bloomberg.
PFHPowerShares Fundamental High Yield Corporate Bond (CAD Hedged) Index ETF
Why invest?Historically, investors in the lowest credit quality bonds have not been rewarded for taking on additional risk. The increased coupon is not adequate to compensate investors for the increased volatility and reduction in price return.
U.S. Corporate Debt Returns by Rating January 1997–December 2011
Bank of America Merrill LynchU.S. Corporate Bond Index Total Return Price Return Coupon Return Volatility
AAA Index 6.3% 0.6% 5.7% 5.3%
AA Index 6.2% 0.3% 5.9% 4.7%
A Index 6.3% 0.0% 6.4% 5.9%
BBB Index 7.0% 0.1% 6.9% 6.1%
BB Index 7.4% -0.7% 8.1% 8.1%
B Index 5.8% -3.1% 8.9% 10.2%
CCC and Below Index 6.7% -3.2% 9.9% 16.2%
37
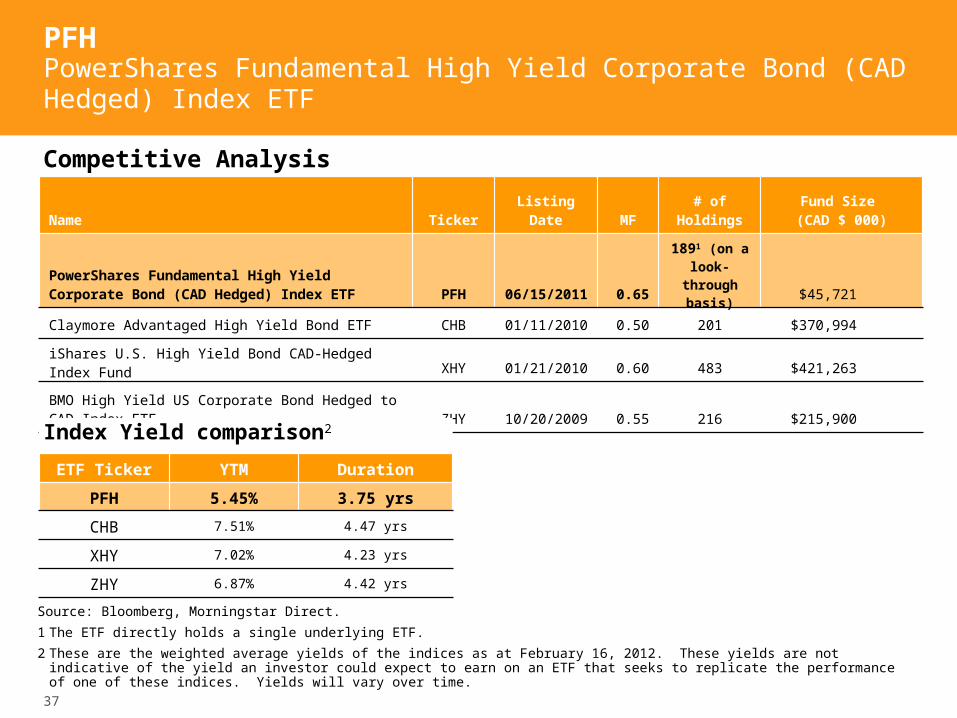
PFHPowerShares Fundamental High Yield Corporate Bond (CAD Hedged) Index ETF
Source: Bloomberg, Morningstar Direct.
1 The ETF directly holds a single underlying ETF.
2 These are the weighted average yields of the indices as at February 16, 2012. These yields are not indicative of the yield an investor could expect to earn on an ETF that seeks to replicate the performance of one of these indices. Yields will vary over time.
Competitive Analysis
Name Ticker Listing Date MF# of
HoldingsFund Size
(CAD $ 000)
PowerShares Fundamental High Yield Corporate Bond (CAD Hedged) Index ETF PFH 06/15/2011 0.65
1891 (on a look-through
basis) $45,721
Claymore Advantaged High Yield Bond ETF CHB 01/11/2010 0.50 201 $370,994
iShares U.S. High Yield Bond CAD-Hedged Index Fund XHY 01/21/2010 0.60 483 $421,263
BMO High Yield US Corporate Bond Hedged to CAD Index ETF ZHY 10/20/2009 0.55 216 $215,900
ETF Ticker YTM Duration
PFH 5.45% 3.75 yrs
CHB 7.51% 4.47 yrs
XHY 7.02% 4.23 yrs
ZHY 6.87% 4.42 yrs
Index Yield comparison2
38
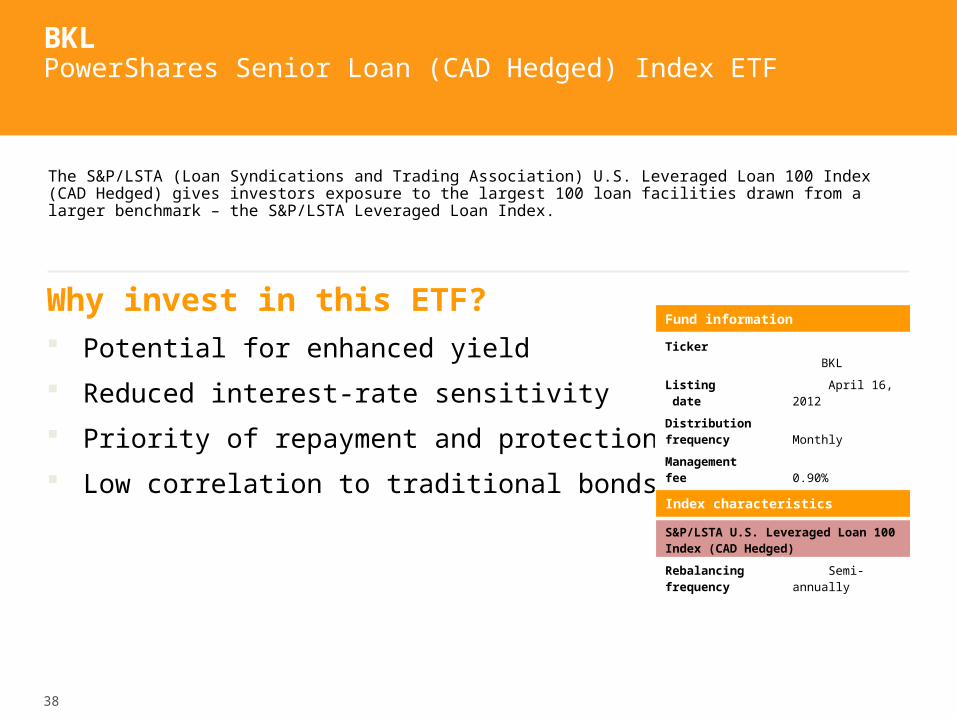
BKL PowerShares Senior Loan (CAD Hedged) Index ETF
Why invest in this ETF? Potential for enhanced yield
Reduced interest-rate sensitivity
Priority of repayment and protection
Low correlation to traditional bonds
The S&P/LSTA (Loan Syndications and Trading Association) U.S. Leveraged Loan 100 Index (CAD Hedged) gives investors exposure to the largest 100 loan facilities drawn from a larger benchmark – the S&P/LSTA Leveraged Loan Index.
Fund information
Ticker BKL
Listing date
April 16, 2012
Distributionfrequency
Monthly
Management fee
0.90%
Index characteristics
S&P/LSTA U.S. Leveraged Loan 100 Index (CAD Hedged)
Rebalancing frequency
Semi-annually
39
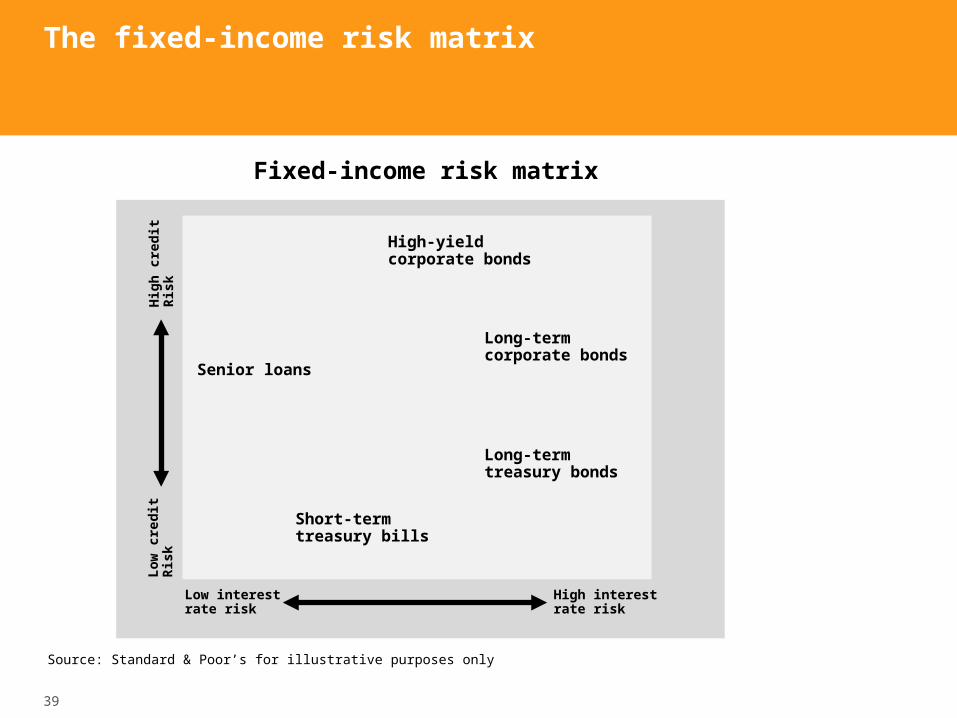
The fixed-income risk matrix
Source: Standard & Poor’s for illustrative purposes only
Fixed-income risk matrixH
igh
cre
dit
R
isk
Low
cre
dit
R
isk
High-yieldcorporate bonds
Long-termcorporate bonds
Long-termtreasury bonds
Short-termtreasury bills
Senior loans
Low interestrate risk
High interestrate risk
40
Commissions, management fees and expenses may all be associated with investments in exchange-traded funds. Exchange-traded funds are not guaranteed, their values change frequently and past performance may not be repeated. Please read the prospectus before investing. Copies are available from Invesco Canada at powershares.ca.
There are risks involved with investing in ETFs, including the risk of error in replicating the underlying Index. Please read the prospectus for a complete description of risks relevant to the ETF. Ordinary brokerage commissions apply to purchases and sales of the ETF.
Each PowerShares ETF seeks to replicate the performance of the applicable Index, before fees and expenses, and is not actively managed. This means that the Sub-advisor will not attempt to take defensive positions in declining markets but rather continue to provide exposure to each of the securities in the Index regardless of whether the financial condition of one or more issuers of securities in the Index deteriorates.
This piece was produced by Invesco Canada.
Invesco and all associated trademarks are trademarks of Invesco Holding Company Limited, used under licence. PowerShares® is a registered trademark of Invesco PowerShares Capital Management LLC (Invesco PowerShares).
DEX Investment Grade 1-5 Year Laddered Corporate Bond Index and DEX Ultra DLUX Long Government Bond Index are trademarks of PC-BOND. These marks have been sublicensed for use for certain purposes to Invesco Trimark Ltd. by PC-Bond, a business unit of TSX Inc. PowerShares 1-5 Year Laddered Investment Grade Corporate Bond Index ETF and PowerShares Ultra DLUX Long Term Government Bond Index ETF (the “Products”) are not sponsored, endorsed, sold or promoted by PC-BOND, its affiliates (including TSX Group Inc.) and third party data suppliers (collectively, “PC-Bond Group”). PC-Bond Group make no representation, warranty, or condition regarding the advisability of investing in the Products
Standard & Poor’s® and S&P® are registered trademarks of Standard & Poor’s Financial Services LLC (“S&P”) and “TSX” is a trademark of Toronto Stock Exchange. These trademarks have been licensed for use by Invesco Canada Ltd. The Funds are not sponsored, endorsed, sold or promoted by S&P or Toronto Stock Exchange, and S&P and Toronto Stock Exchange make no representation, warranty or condition regarding the advisability of buying, selling or holding units/shares in the Funds.
Important information
© Invesco Canada Ltd., 2012
41
FTSE® is a trade mark jointly owned by the London Stock Exchange Plc and The Financial Times Limited and is used by FTSE International Limited under licence. The FTSE RAFI® Index Series is calculated by FTSE International Limited (“FTSE”) in conjunction with Research Affiliates LLC (“RA”). Neither FTSE nor RA sponsor, endorse or promote this product and are not in any way connected to it and do not accept any liability in relation to its issue, operation and trading.
Fundamental Index®” and/or “Research Affiliates Fundamental Index®” and/or “RAFI” and/or all other RA trademarks, trade names, patented and patent-pending concepts are the exclusive property of Research Affiliates, LLC.
PowerShares Canadian Dividend Index ETF and PowerShares Canadian Preferred Share Index ETF are not in any way sponsored, endorsed, sold or promoted by Mergent, Inc. (Indxis) and Indxis does not make any warranty or representation whatsoever, expressly or impliedly, either as to the results to be obtained from the use of the Indxis Select Canadian Dividend Index or the Indxis Select Canadian Preferred Share Index (the “Indexes”) and/or the figure at which the said Indexes stand at any particular time on any particular day or otherwise. The Indexes are compiled and calculated by Indxis. Indxis shall not be liable (whether in negligence or otherwise) to any person for any error in the Indexes and Indxis shall not be under any obligation to advise any person of any error therein. The Indexes are the exclusive property of Indxis, Inc.
Nasdaq®, Nasdaq-lOO®, Nasdaq-lOO Index®, Nasdaq-100 Index Tracking Stock® and QQQ® are registered trademarks of The Nasdaq Stock Market, Inc. (which with its affiliates is referred to as the “Corporations”) and are used under license to PowerShares Capital Management LLC., which has sub-licensed certain rights to Invesco Canada Ltd. The Product(s) have not been passed on by the Corporations as to their legality or suitability. The Product(s) are not issued, endorsed, sold, or promoted by the Corporations. THE CORPORATIONS MAKE NO WARRANTIES AND BEAR NO LIABILITY WITH RESPECT TO THE PRODUCT(S).
Important information
© Invesco Canada Ltd., 2012
Factor Driven ETFsThe search for alternative beta
Michael CookeHead of DistributionPowerShares Canada
This presentation was produced by Invesco Canada Ltd