factor affecting student`s achievement in mathematics: the
TRANSCRIPT
Education Journal 2019; 8(6): 307-319
http://www.sciencepublishinggroup.com/j/edu
doi: 10.11648/j.edu.20190806.21
ISSN: 2327-2600 (Print); ISSN: 2327-2619 (Online)
Factor Affecting Student`s Achievement in Mathematics: The Case of Agarfa Secondary School, Ethiopia
Yeshitila Mekuria1, Mamo Teketel
2, *
1Agarfa Secondary School, Agarfa, Ethiopia 2Department of Mathematics, Hawassa University, Hawassa, Ethiopia
Email address:
*Corresponding author
To cite this article: Yeshitila Mekuria, Mamo Teketel. Factor Affecting Student`s Achievement in Mathematics: The Case of Agarfa Secondary School, Ethiopia.
Education Journal. Vol. 8, No. 6, 2019, pp. 307-319. doi: 10.11648/j.edu.20190806.21
Received: October 29, 2019; Accepted: November 12, 2019; Published: November 22, 2019
Abstract: Students` academic problem in the achievement of mathematics education prevails persistently in Agarfa
secondary schools. Performance in Mathematics by students has been lower in comparative to other science subjects. This
study aimed to investigate the factors contributing to the low achievement of Mathematics by students. The study was to
determine to what extent students’ factors, parent factors, Mathematics teachers’ factors and school factors and management
factors affect students’ Mathematics achievement and to establish the strategies that can be adopted to improve students’
achievement in Mathematics. Descriptive survey research design was adopted for the study. The study was carried out on 221
students, 9 Mathematics teachers’, 5 principals and vice- principals of the school. Respondent students were selected with
random probability sampling techniques. Questionnaires’, class observation and document analysis were employed for data
collection. Data collected from the respondents were coded and entered in to the computer for analysis using SPSS version-20
for windows. The multiple linear regression result and descriptive statistics were applied for data analysis. Findings reveal that
student’ factors, students’ parent factors, Mathematics teachers’ factors, school factors and management factors were the
factors that affects students’ achievement in Mathematics. Students’, Mathematics teachers’, school administrators, parents and
District Education office expected to benefit from the findings. Therefore, it was suggested that teachers, parents, school
administrators, supervisors, communities and other stakeholders should be cooperatively more practical in this area of
improvement.
Keywords: Student Performance, Attitudes, Teacher Competence, Teaching Methods, Multiple Linear Regression
1. Introduction
In the development of science and technology,
mathematics plays a vital role. In daily life and in human
activities the knowledge of mathematics was important to
understand comprised world. But mathematics is the most
complex discipline. As its complexity more than we think,
the problem it faced also more complex than you think. As
example, from Agarfa secondary school record office; 90%
of grade 10 students scored at most C on Mathematics
performance in their EGSECE 2016-2018.
The new education and training policy applied in Ethiopia
in recent years addressed a number issue of which the
introduction of standardized students was one (MOE, 1994,
2004). Concerning this point, there seems a gap between
what ought to be and what exists in reality to bring in the
intended outcomes of all class students’ academic
achievement that could be because of different factors.
Factors of student achievement could be investigated in terms
of many factors of which some of them were student`s
activity, class size, school facilities and teacher competence
and parent involvement. Achievement in mathematics and
science education at secondary education is critical for every
student`s lifelong learning or career paths. However it is an
open fact that quite in large number of General Secondary
and Preparatory School of Ethiopia, most female students`
performance in mathematics is poor. This poor performance
includes male students. They do not have sufficient and
competence that conform to their grade level, especially in

308 Yeshitila Mekuria and Mamo Teketel: Factor Affecting Student`s Achievement in Mathematics:
The Case of Agarfa Secondary School, Ethiopia
mathematics and science subject [1].
Scholars define academic achievement differently in
different situations. Academic achievement of students is
ability of students to study and remember facts and being
able to communicate his/her knowledge orally or in written
for even an examination condition [2]. Students’ mathematics
achievement is often associated with the future economic
power and competitiveness of a country. Therefore, the desire
to understand and identify factors that may have meaningful
and consistent relationships with mathematics achievement
has been shared among national policy makers and educators
around the world [3]. Educators, trainers, and researchers
have long been interested in exploring variables contributing
effectively for quality of achievement of learners. These
variables are inside and outside the school that affect
students’ academic achievement. These factors are related to
student, parents, leaderships, teachers, school and peer [4].
Several studies and research have been done in many
countries to find out the factors that influence students’
achievement in mathematics. Among these factors, students’
interest towards mathematics is one important factor that has
been consistently found out [5-7]. Despite the
aforementioned related things mathematics education has, the
quality of teaching and learning have been one of the major
challenges and concerns of educators in different countries.
Identifying the problems and striving to the solution for it
would help to utilize limited resources including financial
and time more effectively [8]. In consideration of the above
concept, this study was attempted to explore the major
factors those were affected students’ achievement in
mathematics of Agarfa secondary school which are related to
the students’ personal factors, students’ parent factors,
mathematics teacher factors, school based factors and
management related factors.
2. Materials and Methods
2.1. Description of Study Area
The study area was Agarfa secondary school is found in
Agarfa town, Agarfa woreda; Bale zone; in Oromia region;
in South-East Ethiopia. The total population of Agarfa
woreda according to 2006 census projection is about
144,541 among this 77,525 males and 67,016 were females.
The majority of my woreda population was engaged in
agriculture. The major agricultural activities were animal
husbandry and crops farming for food and commercial
purpose. Agarfa secondary school which found in the center
of Agarfa town was the specific area of this study. The
school established in 1967.
2.2. Research Design and Target Population
To achieve the objective of the study the stratified random
sampling research approach would employee. In addition to
this the qualitative data and quantitative data would use for
this research. Concerning source of data both primary and
secondary source of data would employee.
The target population of this study would Agarfa
secondary Mathematics teachers (9 in numbers), 5 principals,
10th
class students (221 sampled students), 29 educational
experts of Agarfa woreda educational office, and one
common supervisor. This would provide useful information
for this study.
2.3. Study Variables
2.3.1. Dependent Variables
The dependent variable:- achievement of the students was
measured using students achievement of one semester mark
observed from record office. For this information on the
determinant factors of students: the researcher assessed 10th
grade first semester mathematics mark in 2019. It is
continuous variables as mark out of 100% students’ scores on
class exam was considered. The purpose of the mark was to
determine the performance of students in mathematics.
2.3.2. Independent Variable
There are many independent variables that can affect the
achievement of students. The independent variables could be
quantitative or qualitative.
2.4. Sampling Technique and Sample Size Determination
Sampling is the selection of a subset of individuals from
within a population to estimate the characteristics of whole
population. Simple random sampling is a basic probability
selection. The two main advantages of sampling are the faster
data collection and lower cost. The study was carried out
with 494 students from grade 10 of which 240 were male and
254 were female. The sample was calculated sample
determination formula [1]. A random method of selection
was one which gives each of ‘N’ (total number of population)
units in the population would be cover a calculable
probability selection. In this study, the sampling frame was
494 and from this 240 males and 254 females 10th
grade
students in 2018/2019 academic year.
Sample size determination
Sample size from the study population was determined
using a simplified formula proportion. This formula is used
to calculate sample size from the target population and for
each stratum proportional allocation rule was used to obtain
better precision.
Target population N = N10 stratum size (known from
frame) and with the objective that to determine n10 with
stratum. From the basis of confidence interval approach the
formula would determine sample size of this study.
That is n =�
���(�)
Where n is sample size
N is the population size or sample frame = 494
Error (e) is margin of error at 95% confidence level. In this
case margin of error equal to 5%
That means e = 5% = 0.05
Then n10 =�
���×( . �) =
�
���×( . ��) = 221.029 ≅ 221
The selection of number of Mathematics teachers,
supervisors, directors (principals) and educational experts
Education Journal 2019; 8(6): 307-319 309
could apply availability (purposive) sampling technique for
secondary school. That means 9 Mathematics teachers, 5
principals or directors, 29 educational experts and one
supervisor were important for the research and would
employee that these individuals provide information to
address the research questions.
2.5. Source of Data
Source of data is divided into primary source data and
secondary source of data.
2.5.1. Primary Sources of Data
Primary source of data would obtain from 2018/2019, 10th
grade sampled students and Mathematics teachers`, students
parents`, school directors, educational experts and
supervisors.
2.5.2. Secondary Sources of Data
The secondary source of data was achievement of the
students would be observed from record office. To gather
further information on the determinant factors of students:
the researcher assessed first semester mathematics mark in
2019. It is continuous variables as mark out of 100%
students’ scores on class exam was considered. In conducting
the research, different data gathering instruments should use
to collect relevant information. These were questionnaire,
document review and formal observation. The detail of each
of these is presented as follows.
2.6. Method of Data Collection (Instruments)
2.6.1. Document Review (Analysis)
The study focuses on students’ achievement of
mathematics. Achievement of the students would be observed
from record office. To gather further information on the
determinant factors of students: the researcher assessed first
semester mathematics mark in 2019. It is continuous
variables as mark out of 100% students’ scores on class exam
was considered.
2.6.2. Questionnaire
This tool was helping the researcher to get perceptions
(opinions) of the students, teachers`, directors, supervisor and
woreda educational office about the factors that influence
mathematical achievement and it was the major tool to
collect the data. The items adapted from TIMSS based on
observation readings and the comment of advisor. The
instrument was consisting of two sections (in which the first
section contains five parts and the second section contains
one). The first part consist of teacher related factors, school
related, parents related, management related, and student
related factors. The items were measure using five point
Likert Scales; “Strongly agree, Agree, Disagree, Strongly
Disagree and undecided. For all items of sections, the
respondents mark their responses in related columns on the
charts. Finally in the second section of the questionnaires
have consisted of an open ended question to allow the
respondents give their intention up on the issues.
2.6.3. Formal Observation
Observation was an important tool that can be employed in
descriptive research and other qualitative research types for
gathering genuine and pertinent data in the actual setting
cited [8]. Hence, in this research, formal observation should
employee to cross check the information secured through
other data gathering tools regarding the teachers’ initiatives
to provide assistance to students and students’ class
participation.
2.7. Method of Data Analysis
The data gathered through different instrument were
analyzed using different methods based on the specific nature
of the data. The descriptive statistics were to describe
characteristics of simple based on the demographic survey.
Data were analyzed using SPSS version 20 computer
program. The descriptive and inferential statistics values such
frequency, percentage, mean and regression analysis were
computed to show the relationship the independent variable
and dependent variable. Item of questionnaire were prepared
in the five major indicators of each factor were selected and
presented to the respondents rated on five Likert- type rating
scale from 5 = strongly agree, 4= agree, 3= undecided,
2=disagree and 1= strongly disagree. Also qualitative data
gathered through questionnaire, document review and
observation was embedded to support quantitative
explanation in the discussion section.
2.8. Methodological Norms
2.8.1. Validity as Instrument
Validity defined as the degree to which results obtained
from the analysis of the data actually represent the
phenomenon under the study [9]. Validity checks if the
research instrument are doing what they were intended to do.
That is questionnaires were submitted to advisor, co-advisor
and mathematics department. The experts scrutinized the
detail of these instruments and give their opinion in view of
reviewing pilot study. Pilot study helped to make clarification
and improved the content for use in the instrument that was
administered for study.
2.8.2. Reliability
Reliability is an indication of consistency between two
scores of the same instrument over time [10]. It signifies the
issue of consistence measure, which is the ability of a
measurement instrument to measure the same thing each time
used. The process of developing and validating an instrument
is in large part focused in reducing error in the measurement
process. There are different means estimating the reliability
of any measure. The value of Cronbach`s Alpha is used to
determined the consistence of measurement. The reliability
coefficients (Cronbach`s Alpha) range from 0.00 to 1.00 with
higher coefficient of higher level of reliability. Therefore the
researcher has obtained reliability coefficient which is equal
to 0.751 for questionnaire, which indicate the reliability of
research instruments. It is done by SPSS software.
310 Yeshitila Mekuria and Mamo Teketel: Factor Affecting Student`s Achievement in Mathematics:
The Case of Agarfa Secondary School, Ethiopia
2.9. Multiple Linear Regressions
Multiple linear regression models were a statistical tool
that allows us to examine how multiple independent variables
are related to a dependent variable. Regression model use
when dependent (or study) variable depends on more than
one independent (explanatory) variables; called multiple
linear regression model. This model generalizes the simple
linear regression in two ways. It allows the mean function
E(y) to depend or relate more than one independent variable
and to have shapes other than straight lines, although it does
not allow for arbitrary shapes.
Let Y denotes the dependent variable (achievement) that is
linearly related to k independent variables; Multiples linear
regression models were a statistical tool that allows us to
examine how multiple independent variables are related to a
dependent variable.
x1, x2…xk through the parameter �1, �2, …, �k. The model is Y = β + β�x� + β�x� + ⋯ + β�x� + εis
called a Multiple Linear Regression Model with k –
independent variables.
Where the parameters β� , j = 0, 1, 2... k, are called the
regression coefficients. This model describes a hyper plane in
the k – dimensional space of the independent variablesx�. The
parameter β�represents the expected change in the dependent
variable Y per unit change in x� when all of the remaining
independent variables x� ( i ≠ j) are held constant. For this
reason the parametersβ�, j = 1, 2…k, are often called partial
regression coefficients and ε is called the error term or
residuals. Multiple Linear Regression Models are often used
as empirical models or approximating functions. That is, the
true functional relationship between Y and x�, x�, … , x� is the
unknown, but over certain ranges of the independent
variables the linear regression model is an adequate
approximation to the true unknown function.
Assumptions for Multiple Linear Regression Model:
For any specific value of the independent variable, the
value of the dependent variable was normally distributed.
This is called the normality assumption. The variance
(standard deviation) for the dependent variable was the same
for each value of the independent variable. This is called the
equal variance assumption. There was a linear relationship
between the dependent variable and the independent
variables. This is called the linearity assumption. The
independent variables are not correlated. This is called the
non-multi co-linearity assumption. The value for the
dependent variable was independent. This is called the
independence assumption; assumptions about the error term
(ε). To use regression analysis properly there are a number of
criteria about the error term in the model that we must be
able to assume reasonably that they are true. If one can’t
believe these assumptions are reasonable in the model, the
results may be biased or no longer have minimum variance.
3. Results and Discussions
On this section the set of data collected through different
methods stated in chapter three was described without going
beyond the data. The collected data were organized and
analyzed using both qualitative and quantitative methods.
The Statistical Package for Social Sciences (SPSS) was used
to tabulate the results from which the analysis was done.
Objectives (1) to (2) generated quantitative data were
analyzed and measured using descriptive statistics. The open-
ended question yielded qualitative data were descriptively
analyzed and presented using specific themes. Generally, the
data obtained were presented using frequency distribution
tables and percentages.
3.1. Student`s Demographic Characteristics
The general characteristics of the respondents or student`s
demographic characteristics were presented below. Academic
achievement could also be affected by parent education level,
demographic condition, family encouragement, and family
occupation (socioeconomic status). Analysis of each item
presented in the table given below.
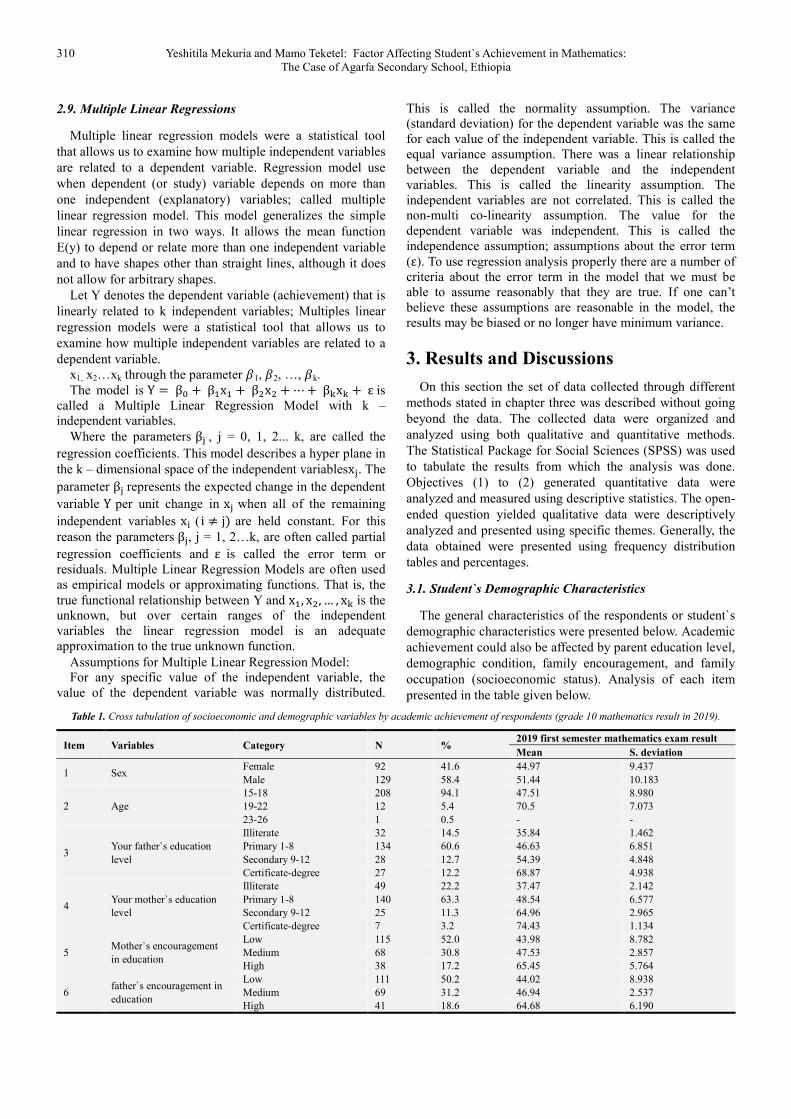
Table 1. Cross tabulation of socioeconomic and demographic variables by academic achievement of respondents (grade 10 mathematics result in 2019).
Item Variables Category N % 2019 first semester mathematics exam result
Mean S. deviation
1 Sex Female 92 41.6 44.97 9.437
Male 129 58.4 51.44 10.183
2 Age
15-18 208 94.1 47.51 8.980
19-22 12 5.4 70.5 7.073
23-26 1 0.5 - -
3 Your father`s education
level
Illiterate 32 14.5 35.84 1.462
Primary 1-8 134 60.6 46.63 6.851
Secondary 9-12 28 12.7 54.39 4.848
Certificate-degree 27 12.2 68.87 4.938
4 Your mother`s education
level
Illiterate 49 22.2 37.47 2.142
Primary 1-8 140 63.3 48.54 6.577
Secondary 9-12 25 11.3 64.96 2.965
Certificate-degree 7 3.2 74.43 1.134
5 Mother`s encouragement
in education
Low 115 52.0 43.98 8.782
Medium 68 30.8 47.53 2.857
High 38 17.2 65.45 5.764
6 father`s encouragement in
education
Low 111 50.2 44.02 8.938
Medium 69 31.2 46.94 2.537
High 41 18.6 64.68 6.190

Education Journal 2019; 8(6): 307-319 311
Item Variables Category N % 2019 first semester mathematics exam result
Mean S. deviation
7 Father`s occupation
Farmer 127 57.5 44.03 8.357
Merchant 47 21.3 47.21 1.382
Government employee 10 4.5 73.30 2.111
Others 37 16.7 60.35 5.282
8 Mother`s occupation
Farmer 114 51.6 43.99 8.820
Merchant 45 20.4 45.89 1.369
Government employee 16 7.2 70.88 3.828
Others 46 20.8 55.72 6.270
Item 1 of Table 1 as indicates that most of the sample
students 129 (58.4%) were males and 92 (41.6%) were
females. First semester mathematics average mark of male
and female students were 51.44 (SD =10.183) and 44.97 (SD
= 9.437) respectively. This result shows that, boy`s average
mark seemed better than females. According to Trautwein et.
al. (2009), quoted in Assefa Beyene (1991) also indicted that
Amharic and mathematics scores of students were
investigated; it was found out that girls' was relatively lower
than boys [11 – 12]. This might be because of females‟
involvement in the household chores; as a result, they do not
get time for study after school time in the household.
Similarly achievement of mathematics has been documented
with boys significantly performing than girls [13].
In the same table, item 2 shows that majority of the
respondent students 208 (94.1%) were seem to be found
between 15-18 years of age, whereas, 12 (5.4%) students
were found between19-22 years of age One student (0.5%) is
23-26 years old. From tenth grade students 15-18 years of
age shows that most of the students enrolled in the school
were belongs to the age that the Ethiopian secondary school
students. Students’ beliefs about their competence and their
expectations for success in school have been directly linked
to their levels of engagement, as well as to emotional states
that promote or interfere with their ability to be academically
successful [14].
From the above Table 1 32 (14.5%) students were illiterate
fathers` by their education level and their average mark was,
35.84 (SD=1.642). 134 (60.6%), those students whose father
complete primary education and their average score was
46.63 (SD=6.851). 28 (12.7%) students were students whose
father` have certificate up to graduate and their average score
was 27 (12.2%). These indicate that students having father`s
who are certificate up to graduated achieve greater than
others. Depend on parents` education level students can
achieve any subject more. Several studies indicate that family
members, father, mother elder support for in the academic
study is crucial factors affecting student’s mathematics
achievement [15].
In addition to the above 49 (22.2%) were students whose
mothers` are illiterate and their average mark was 37.47
(SD=2.142). From the same item 140 (63.3%), those students
have, mother`s education level is elementary 1-8 and their
average score is 48.54 (SD=6.577). 25 (11.3%) of students
were whose mothers` are secondary and their average score
was 64.96 (SD=2.965). From item 4, 7 (3.2%) of mothers`
were certificate up to graduate by their education level and
their average mark was 74.43 (1.134). Even, the average
score of students whose their graduated from higher
education have variation; they were achieve greater than
others. According to Agabrian M., J. (2006), observed that
education level of present but linkage to poor academic
performance of their children [16]. A study conducted by
David M. N (2014), showed that illiterate parents were
unable to assist their children with home work. The
importance of parental involvement in their children
academic success is unquestionable assumption [17].
Based on Table 1 of item 5, 115 (52%) of fathers` were
encourage their students (low) and students` average mark
43.98 (SD=8.782). From similar item 68 (30.8%) of father`s
were encourage their students`(medium) and students`
average score 47.53 (SD=2.857). 38 (17.2%) of fathers` were
encourage their students and students` average mark 65.45
(SD=5.764). Item 6 of similar table shows that 115 (50.2%)
of mothers` were encourage their students (low) and
students` average mark 44.02 (SD=8.938). From similar item
69 (31.2%) of mother`s were encourage their
students`(medium) and students` average score 46.94
(SD=2.537). From item 6, 41 (18.6%) of mothers` were
encourage their students and students` average mark 64.68
(SD=6.190). This is an indication that despite the fact that
some parents may have attained education, still they do not
fully engage themselves in assisting their students to do their
school assignment. It is consistent with Ogeye, H. (2007),
family and community involvement frequently means
helping reach goal defined by the schools (administrators and
teachers) that reflect school values and priorities” [18].
From Table 1 above 127 (57.5%) are students with their
fathers` occupation is farmer and their average score was
44.03 (SD=8.357). On the same item 47 (21.3%) are
students` with their fathers` occupation is merchant and their
average score of students was 47.21 (SD =1.382). In addition
to this 10 (4.5%) are students having fathers` working is
government employee and their average score was 73.30
(SD=2.111). From the above table 37 (16.7%) are students`
having fathers working other`s field and their average mark
60.35 (SD=5.282). These results shows that students who
have got fathers` were government employee have the
opportunity to achieve a good result. From item 8 above 114
(51.6%) were students with their mothers` occupation is
farmer and their average score was 43.99 (SD=8.820). Low
income of parent`s link to students` poor academic
achievement. It is also observed that the economically
disadvantage parents are less able to afford the cost of

312 Yeshitila Mekuria and Mamo Teketel: Factor Affecting Student`s Achievement in Mathematics:
The Case of Agarfa Secondary School, Ethiopia
education of their children at higher levels and consequently
they do not work at their full potential [19].
On the same item 45 (20.4%) were students` with their
mothers` occupation is merchant and their average score of
students was 45.89 (SD =1.369). In addition to this 16 (7.2%)
are students having mothers` working is government employee
and their average score was 70.88 (SD=3.828). From the same
table 46 (20.8%) are students` having mothers working other`s
field and their average mark 55.72 (SD=6.270). This result
shows that students who have got mothers` were government
employee have the opportunity to achieve a good result than
others. One of the disadvantages of the Ethiopian girls face in
education is due to the low income of their families. According
to Tassew Woldehanna, Jones, N. and B. Tefera (2006) cited
in Rouse, C. E and Barrow, L. (2006) explained that girls who
come from economically advantaged families are more likely
to enter and remain in schools than are girls from
disadvantaged families [20-21].
3.2. Inferential Statistics
This section presents the regression analysis for the
predictive power of independent variables (students’ factors,
parents` factors, Mathematics teachers’ factors, school
factors, directors` factors and educational expert factors) on
mathematics achievement. To identify more predictor of the
independent variables on mathematics achievement multiple
linear regressions was used and the result analyzed. The
Relationship between students’ Mathematics Achievement
and different factors could be explained by the combined
effect of the independent variables explored using multiple
linear regression analysis.
Table 2. Statistics of the most significant predictors in Agarfa secondary School.
Model
Un standardized
Coefficients
Standardized
Coefficients T Sig.
B Std.
Error Beta
1
Constant 23.491 2.372 9.902 .000
X1 Sex -16.657 .966 -.812 -17.252 .000
X2 Father education level 3.586 .700 .305 5.124 .000
X3 Mother education level 5.513 .698 .455 7.895 .000
X4 How do you rate your father`s encourage in education? 3.424 .391 .256 8.763 .000
X5 Students` do class work and home work Properly .614 .305 .053 2.013 .045
X6 I regularly attend mathematics class .776 .219 .081 3.542 .000
X7 My English language skills affects me on in understanding mathematics .598 .202 .069 2.963 .003
X8 I attend tutorial and additional class -.639 .229 -.065 -2.783 .006
X9 Computer and computer software used as teaching aids to support mathematics -.430 .205 -.049 -2.093 .038
X10 I take discussion with my friend on solving difficult problem .996 .320 .087 3.111 .002
X11 mathematics teacher participate students in Class -.402 .193 -.048 -2.081 .039
X12 I have difficulty in relating new concepts to those previously learnt .900 .290 .088 3.106 .002
X13 There is pedagogical center for Mathematics instruction in our school. .396 .195 .486 2.028 .044
X14 Parents do not increase Parental follow up to their student’s in teaching/learning process .430 .200 .051 2.151 .033
X15 School principal (Managements`) do not adjust relevant library materials .452 .210 .051 2.154 .009
X16 I use mathematics reference books .650 .245 .061 2.655 .032
X17 Father occupation 3.745 .496 .337 7.554 .000
X18. Mother occupation 2.940 .431 .286 6.816 .000
a. Dependent Variable: Achievement
As the assumption of multiple linear regression model`s
was satisfied, the researcher used the model to analyze the
data. After running SPSS software the achievement of
students in mathematics in Agarfa secondary school was
strongly affected by 18 independent variables among 35
variables entered in to regression. By looking at the co-
linearity statistics in the Coefficientsa box Table 2 above, the
identified independent variable was: gender difference (sex)
is significant to p-value .000 is less than statistically
significant level p=0.05. Therefore, there was relationship
between academic achievement and sex. By the case gender
difference their academic achievement decrease by 16.657
points. According to Trautwein, U., & Ludtke, O. (2009),
quoted in Assefa Beyene (1991), also indicted that Amharic
and mathematics scores of pupils were investigated; it was
found out that girls' was relatively lower than boys [11-12].
Similarly achievement of mathematics has been documented
with boys significantly performing than girls [13]. Father`s
education level and mother`s education level were significant
to p-value 0.000 is less than statistically significant level
p=0.05. This shows that students from educated father and
educated mother achieved high mark. Even, the average
score of students whom their graduated from higher
education have variation; they were achieve greater than
others. The achievement of students increased 3.586 marks as
the level education fathers` increase and the performance of
students increased 5.513 marks as the level education of
mothers` increase. According to Agabrian M., J. (2006),
observed that education level of present but linkage to poor
academic performance of their children [16]. A study
conducted by David M. N (2014), showed that illiterate
parents were unable to assist their children with home work.
The importance of parental involvement in their children
academic success is unquestionable assumption [17].
Fathers` encouragement on mathematics education was p-
value =0.000. From the result of this analysis it could be
Education Journal 2019; 8(6): 307-319 313
concluded that fathers` encouragement to ward mathematics
education statistically highly significant as p-value 0.000 is
less than statistically significant level p = 0.05. Therefore,
there was statistically significant relation between Agarfa
secondary students on academic achievement in mathematics
and fathers` encouragement. From this we could decided that
the achievement of students increased 3.424 by their father`s
encouragement. According to Hyde, K. (1993), parental
involvement is ‘the parents’ or caregivers’ investment in the
education of their children [22]. Parental involvement is
parental intervention in their children’s education in order to
be able to obtain information about their children’s academic
growth. Students activity on home work and class work is
significant to p-value 0.045, β =.614 is less than significantly
level of p=0.05. Therefore, there is statistically significant
relation between student`s academic achievement in
mathematics and students activity on doing class work, home
work and other activity. That means the score of students
increased by 0.614 in each case of doing class work and
home work. According to Wakesa, W. P (2013), homework
and assignment have large consistent positive effect on
students` achievement improvement [10]. On the other hand
homework serves as two fold purpose. First, it is formative
assessment tool that provides teachers with feedback that
allow them to adjust their instruction and provides learners
with a means improving their learning. Secondly, homework
is a type of summative assessment tool that is for learner
grading. Similar to this teachers use homework to maximize
learners learning [23-24].
Regularly attending mathematics class on achievement of
students is significant as p–value 0.043 is less than
statistically significant level p = 0.05. Therefore, there is
statistically significant relation between students academic
achievement in mathematics and attend mathematics period.
We can decide that the mark of student`s increased by 0.776
by each attending mathematics class. English language skill
affects students` on understanding mathematics significant P-
value 0.003, β=.598 is less than statistically significant level
p = 0.05. Therefore, there is statistically significant relation
between language skills of students and understanding
teacher`s lesson or word problems. From their language skills
the achievement students increased by 0.598 marks. Finding
show that students` personal background knowledge affects
their achievement. Their competence and their expectation
for success in school have been directly linked to their levels
of engagement, as well as to emotional states that promote or
interfere with ability to be academically successful.
Attitudinal factors in Mathematics are highly important in
Mathematics education, because these variables are amenable
to change by educational interventions [14].
Students daily attending tutorial class and additional class
enable to do better in examinations significant p-value 0.006,
is less than statistically significant level p =0.05. Therefore,
there is statistically significant relation between students`
academic achievement in mathematics and attending tutorial
class and additional class. If students were lose attending
tutorial class, then the score of students should decreased by
0.639 points. According Mikk, J. (2007), providing tutoring
given to students’ necessary support to help them catch up
and learn the necessary study skills required to learn [25].
Computer and computer software used as teaching aids to
support mathematics are relevant to mathematics instruction
is significant to p–value 0.038, is less than statistically
significant level p-value = 0.05. That is statistically
significant relation between student academic achievement
and computer and computer software. If students were not
used computer and computer software then their mark would
decreased by 0.430. Physical environment in which the
formal teaching learning occur ranges relatively from modern
and well equipped to open air gathering place [26]. Thus the
school infrastructure includes the class rooms, office, toilet
rooms, water supply, electricity services, technology services,
computer laboratory, science laboratory, library, staff,
lounges, attractive green area, swimming pool etc., showed
that a positive relationship exists between availability of
facilities and academic performances.
I take discussion with my friend on solving difficult
problem is significant to p-value = 0.002 is less than
statistically significant level p = 0.05. Therefore there is
statistically significant relation between academic
achievement of students and discussion with friends. From
this, as the discussion of students were increase, their score
of mathematics were increased by 0.996. According to
UNICEF (2005), clearly states that home work can have both
positive and negative effects [27]. It is reported that the
positive effective of home work included “improved attitude
toward school; better study habits and skills and learning was
encouraged during leisure time”[27]. According to Cooper,
H. (2009), has shown that the positive effects of home work.
Mathematics teacher participate students in class is
significant to p-value = 0.039 is less than statistically
significant level p=0.05 [28]. Therefore there is statistically
significant relation between academic achievement of
students and the participation of students in class. That means
if the participation of students decreased in the class, then
their mathematics result decreased by 0.402. The role of
Mathematics teachers as Mathematics specialist is classroom
director and curriculum implementer. Therefore a teacher has
a role of coach, acting as mentor, assistant collaborator who
with blend of guides and instructs. Teacher`s beliefs, about
Mathematics teacher play a major role in shaping their
instructional practice and consequently influence their pupils`
attitudes, interests, and achievement [29].
Students have difficulty in relating new mathematical
concepts to those previously learnt is significant to p-value
= 0.002 is less than statistically significant to p=0.05.
Therefore there is statistically significant relation between
students` academic achievement and relating new
mathematical concepts to those previously learnt. This
means that if students relate new concept to old concept
their mark increased by 0.900. Students’ beliefs towards
mathematics influences the efforts they put in
understanding and practicing mathematical concepts and
skills. According to Kaahwaa J. (2012), students’ beliefs

314 Yeshitila Mekuria and Mamo Teketel: Factor Affecting Student`s Achievement in Mathematics:
The Case of Agarfa Secondary School, Ethiopia
about their competence and their expectations for success in
school have been directly linked to their levels of
engagement, as well as to emotional states that promote or
interfere with their ability to be academically successful
[14]. Pedagogical center for Mathematics in our school is
significant to p-value = 0.044 is less than statistically
significant to p=0.05. Therefore pedagogical center for
mathematics lesson and academic achievement of students
are highly related. That means, their achievement was
increased by 0.396. School facilities include water supply,
latrines (male and female toilet) clinical laboratory, library,
pedagogical center, and other educational laboratory. The
facilities are required to be proportion to the number of
teachers and students in the school for the provision of
quality education in school.
Parental follow up of their student’s in teaching/learning
process is significant to p-value =0.033 is less than
statistically significant to p=0.05. Therefore there is
significantly significant relation between Parental follow up
of their student’s in teaching/learning process. If parents
were follow their students, then the mark of students should
increased by 0.430. Analysis of different researcher showed
that there is considerable positive association between
assistance with parental follow up and student`s
achievement, regardless of the source of assistance.
Indicating parents` inability to help with student’s activity
is thus one positive explanatory factor behind low
achievement of students [30]. School principal
(Managements`) adjust relevant library materials to
improve their understanding mathematics is significant to
p-value =0.032 is less than statistically significant level
p=0.05. That means, the score of students were increased by
0.452. Similar to this mathematics reference book from
library is significant to p=0.009 is less than statistically
significant to p=0.05. This shows that the relation between
students academic achievement and reference book to
improve their understanding mathematics. That means the
achievement of students increased by 0.650.
Father`s occupation and mother`s occupation are
significant to p=.000 is less than statistically significant to
p=0.05. This shows that academic achievement is affected by
parent`s occupation. Depend on parents` education level
students can achieve any subject more. That means with the
case of father`s occupation the mark of students` increased
by 3.745 points and with the case of mother`s occupation the
mark of students increased by 2.940. As the income of family
increased, the achievement of students would increase.
Several studies indicate that family members, father, mother
elder support for in the academic study is crucial factors
affecting students` mathematics achievement [15].
3.3. Class Observation
3.3.1. Number of Students Per-class
Class observation was included all Mathematics teachers
and 9th
grade, 10th
grade, 11th
grade and 12th
grade students.
Figure 1. Number of students per class including male and female students.
From 221 sampled students, 129 were males and 92 were
female students of grade 10. Sampling was related with the
selection of a subset of individuals from within a population
to estimate the characteristics of whole population. The two
main advantages of sampling are the faster data collection
and lower cost. Each observation measures one or more
properties of observable subjects distinguished as
independent individuals. In addition to this each class were
visited during class observation. Depend on the class
observation average number of students per class were 55,
47, 43, and 27 for grades 9, 10, 11 and 12 class respectively.
Since G9 means grade nine, G10 means grade ten, G11
means grade eleven and G12 means grade twelve. Class
room environment is conducive to a place where everybody
feels comfortable and at ease. It is a place where mutual
respect in a friendly and non-threatening atmosphere. The
perception of class room environment is critical factor in
determining students’ action such as motivation achievement
and satisfaction [31].
Education Journal 2019; 8(6): 307-319 315
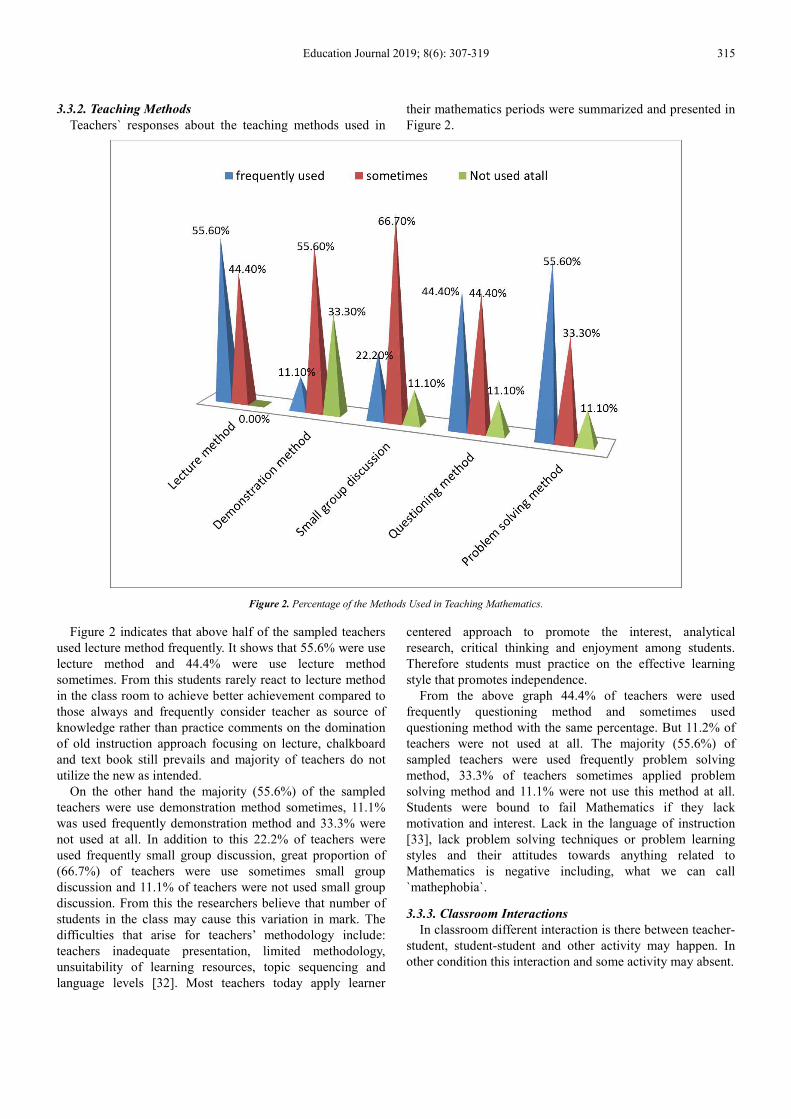
3.3.2. Teaching Methods
Teachers` responses about the teaching methods used in
their mathematics periods were summarized and presented in
Figure 2.
Figure 2. Percentage of the Methods Used in Teaching Mathematics.
Figure 2 indicates that above half of the sampled teachers
used lecture method frequently. It shows that 55.6% were use
lecture method and 44.4% were use lecture method
sometimes. From this students rarely react to lecture method
in the class room to achieve better achievement compared to
those always and frequently consider teacher as source of
knowledge rather than practice comments on the domination
of old instruction approach focusing on lecture, chalkboard
and text book still prevails and majority of teachers do not
utilize the new as intended.
On the other hand the majority (55.6%) of the sampled
teachers were use demonstration method sometimes, 11.1%
was used frequently demonstration method and 33.3% were
not used at all. In addition to this 22.2% of teachers were
used frequently small group discussion, great proportion of
(66.7%) of teachers were use sometimes small group
discussion and 11.1% of teachers were not used small group
discussion. From this the researchers believe that number of
students in the class may cause this variation in mark. The
difficulties that arise for teachers’ methodology include:
teachers inadequate presentation, limited methodology,
unsuitability of learning resources, topic sequencing and
language levels [32]. Most teachers today apply learner
centered approach to promote the interest, analytical
research, critical thinking and enjoyment among students.
Therefore students must practice on the effective learning
style that promotes independence.
From the above graph 44.4% of teachers were used
frequently questioning method and sometimes used
questioning method with the same percentage. But 11.2% of
teachers were not used at all. The majority (55.6%) of
sampled teachers were used frequently problem solving
method, 33.3% of teachers sometimes applied problem
solving method and 11.1% were not use this method at all.
Students were bound to fail Mathematics if they lack
motivation and interest. Lack in the language of instruction
[33], lack problem solving techniques or problem learning
styles and their attitudes towards anything related to
Mathematics is negative including, what we can call
`mathephobia`.
3.3.3. Classroom Interactions
In classroom different interaction is there between teacher-
student, student-student and other activity may happen. In
other condition this interaction and some activity may absent.

316 Yeshitila Mekuria and Mamo Teketel: Factor Affecting Student`s Achievement in Mathematics:
The Case of Agarfa Secondary School, Ethiopia
Figure 3. Percentage of classroom interactions presented in (%).
As indicated in Figure 3, 41% of teacher-student
interaction was present in Mathematics class from total sector
of interaction and 27% of student-student interactions were
present from total sector of interaction. But from total
interaction 14% of varieties of learning activities were
present in Mathematics class, 14% of teacher reinforcement
students` attempts and 5% of student asking and answering
question were present. This shows that variety of learning
activities, teacher reinforcement students` attempts and
student asking and answering question were not sufficient.
The role of Mathematics teachers as Mathematics specialist
is classroom director and curriculum implementer. Therefore
a teacher has a role of coach, acting as mentor, assistant
collaborator who with blend of guides and instructs.
Teacher`s beliefs, about Mathematics teacher play a major
role in shaping their instructional practice and consequently
influence their pupils` attitudes, interests, and achievement
[33].
3.3.4. Classroom Atmosphere (School Facilities)
Class room atmosphere is one important activity for
Mathematics class. In addition their relation is decisive
factor.
Figure 4. Percentage of classroom atmosphere.
From class observation indicates that there is a lot of passive atmosphere (88.9%) and 11.1% of class atmosphere

Education Journal 2019; 8(6): 307-319 317
was little passive. However, very little friendly encouraging
was observed (77.8%) and 22.2% of class atmosphere was lot
of friendly encouraging. In addition to that, there was no
unfriendly relationship among the pupils. The majority of
observed relation (77.8%) was friendly among pupil to pupil.
On the contrary to this 88.9% of class observation was not
show unfriendly chrism. There are four areas of well-being
dimensional phenomenon of student’s conceptualization as
school condition, social relationships, and means for self-
fulfillment and health status, which affects both their
behavior and their examination results in school. In addition
to this 66.7% of class observation was not noisy with chorus
answer. But there was little noisy chorus answer (22.2%) and
11.1% lot of noisy chorus. The perception of class room
environment is critical factor in determining students’ action
such as motivation achievement and satisfaction [31].
3.3.5. Feedback Provision (Teacher Competence) Presented Below
Figure 5. Feedback Provision (teacher competence) presented.
Figure 5 indicates that 22.2% of the teachers were
regularly done moving round the class to help individual
students. But 77.8%of teachers moved round the class
helping individual students not done at all. This implies that
teachers carried out above listed activities enhance students
learning outcomes. In addition teachers actively monitor their
learners` understanding during class work, by moving from
desk to desk, guide difficulties and select appropriate learner
work for whole class review and discuss. In the lessons
88.9% was not regularly done of homework given at the end
of the lesson and 11.1% of teachers were not done at all
homework given at the end of the lesson. More than 66% of
the cases teachers did not regularly done marking students
‘assignments’. Whereas 22.2% of teacher`s were not done at
all marking students ‘assignments’. In addition to this more
than 77% of teachers were not regularly done making
correction of specific assignments. More than 22% of
teachers were not done at all making correction of specific
assignments. Different researcher showed that there is
considerable positive association assistance with
homework/class work, assessment and students achievement.
According to Wakesa, W. P. (2013), homework and
assignment have large consistent positive effect on students`
achievement improvement [10].
4. Conclusions
Based on the results and discussion, the following
conclusions were drawn. Teaching methodology utilized by
Mathematics teacher has significant effect on the
achievement of students. This means lack of appropriate
teaching methods, lack of tutorial class and passive learning
methods affect the performance of students. Besides to this,
school contexts and facilities were also significantly affecting
the performance of students. It revealed to influence students’
mathematics learning greatly. Adequate availability of school
facilities, instructional materials and quality teachers of
mathematics has more impact on students’ achievement on
mathematics by providing instructional materials. Parents’
related factors were shown as one of mostly affecting
students’ academic achievement. Family occupation or socio-
economic status of parents, level of education of parents,
parent-student interaction were case of lower academic
performance. Thus, potential stakeholders should pay

318 Yeshitila Mekuria and Mamo Teketel: Factor Affecting Student`s Achievement in Mathematics:
The Case of Agarfa Secondary School, Ethiopia
attention on the significant factors identified on the current
study.
References
[1] Zeytu G. and Engida M. (2017). Assessing the Influence of Attitude Towards Mathematics on Achievement of Grade 10 and Grade 12 Female Students in comparison with their Male Counter parts: Wolkite, Ethiopia. International Journal of Secondary Education; 5 (5): 56-59.
[2] Seleshie (2016), Determinants of Students Academic Achievement towards to Mathematics Study in Yem Special Woreda Preparatory School, Yem Ethiopia. Hawassa University.
[3] Kupari & Kari Nissinen (2013). Background factors behind mathematics achievement in Finnish education context: Explanatory models based on TIMSS 1999 and TIMSS data Pekka Finnish Institute for Educational Research University of Jyväskylä, Finland.
[4] Crosnoe, R., Johnson, M. K., and Elder, G. H. 2004. School size and the inter personal side of education: An examination of race/Ethnicity and organizational context. Social Science quarterly, 85, 5, 1259-1274.
[5] Genene Bekele. (2014). Attitude Toward and Achievement of Natural Science and Mathematics Stream of Female Students in College of Teachers’ Education in Oromi Region. Addis Ababa University.
[6] Getachew Bekele. (2015). Anxiety, Attitude toward Mathematics and Mathematics Achievement Tenth Grade Students at Government and Private Schools in KolfeKeranio Sub City of Addis Ababa. Addis Ababa University.
[7] MulugetaAtnafu. (2010) – Relation between Tenth Grade Students’ Attitude and Components of Attitude in Algebra with Algebra Achievement of Addis Abeba Secondary Schools, Ethiopia.
[8] Lubienski, S. T. and Gutiérrez, R. (2008). Bridging the gaps in perspectives on equity in Education Journal for Research in Mathematics Education, 39, 365–371.
[9] Bedada Mergo, (2002). Factors Attributing to the Mismatch between the Intended actually.
[10] Wakesa, W. P. (2013). An assessment of Factors Affecting Students` Performance in Secondary Schools in Kakamega country, Kenya. Msc. Thesis in education in Kenya University.
[11] Trautwein, U., and Ludtke, O. (2009). Predicting home work motivation and home work effort in six School subjects: The role of person and family characteristics, class room factors, and School track. Learning and Instruction, 19 243.
[12] Assefa Beyene (1991. Female participation and achievement in rural primary schools in Ethiopia: Executive summary report. Addis Ababa: ICDR, MoE.
[13] Yenenesh Tadesse, (2007). Determinants of Female Enrollment and Achievement in Primary Education in Kombolcha Wereda, Eastern Hararghe Zone, Oromia Region. An M.Sc Thesis Presented to the School of Graduate Studies of Alemaya University. 24p.
[14] Kaahwaa J. (2012). The experience Uganda females in
Mathematics performance and academic hardiness High school students. International Journal of Educational success. 1 (1), 33-37.
[15] Akey, T. M. (2006). School Context, Student Attitudes and behavior, and Academic Achievement: An Exploratory Analysis. ALPHINE C. LANGAT APRIL, 2015.
[16] Agabrian M., J. (2006). Relationship between school and family: The adolescence perspective Forum Qualitative Social Research 8 (1) Art 20.
[17] David M. N (2014). Determinants of poor academic performance of secondary school students In Tanzania in rural development of sokoine University of agriculture horogoro, Tanzania.
[18] Ogeye, H. (2007). Parental participation in pupils` homework in Kenya: In search of an inclusive Policy, Nairobi: Act Press.
[19] Jordan, C., Orozco, E. and Averett, A. (2001) Emerging Issues in School, Family, & Community Connections: Annual Synthesis. Austin, TX.
[20] Rouse, C. E and Barrow, L. (2006). United States elementary and secondary schools. Equalizing Opportunity or replicating the status quo? Journal of the Future of Children. 16 (2): 99-123.
[21] Tassew Woldehanna, Jones, N. & B. Tefera (2006). The invisibility of children's paid and unpaid labour: implications for Ethiopia's national poverty reduction policy. A paper presented at the XVI ISA World Congress of Sociology held in Durban, 23-29 July 2006, pp. 16-17.
[22] Hyde, K. (1993). Women’s Education in Developing Countries: Barriers, benefits, policies, U.S.A: The Johns’ Hopkins University Press.
[23] La Rocque, M., Kleiman, I. and Darling, S. M. (2011) ‘Parental involvement: the missing link in school achievement’, Preventing School Failure: Alternative Education for Children and Youth, 55 (3), pp 115-122.
[24] Lan M., and Li, M (2007). The Relationship between Class room Practice related to Homework And Students Performance in Mathematics in TIMSS 2003. In P. Wagemaker (Ed). The Second IEA International Research Conference. Champman & Hall.
[25] Mikk, J. (2007). Students home work and TIMSS 2003 Mathematics results.
[26] Charles and Oquinn (2001). A Causal Model of School Factors as Determinant of Achievement in Osun State Primary Schools. M.ED. Project submitted to Teacher Education in Faculty Education, University of Ibadan.
[27] UNICEF (2005). Determine Quality in Education A Paper Presented by UNICEF at a Meeting the International Working Group on Education Florence, Italy, June 2000 UNICEF.
[28] Cooper, H. (2009). The Battle over Homework: Common Ground for Administrators, Teachers, and Parents, 2nd Edition.
[29] Brahier, D. (2000). Teaching Secondary and Middle School Mathematics. Boston: Allyn.
[30] Nicolaidou, M. &Philippou, G. (2003). Attitudes towards mathematics, self-efficiency and achievement in problem solving”. In: M. A. Mariotti (Ed), European.

Education Journal 2019; 8(6): 307-319 319
[31] Jemila E. H. (2009). Parents Socioeconomic Status and Children Academic Performance Journal for Research in Mathematics Education, 39, 365–371.
[32] Tish Holubph. D. and Robert G. Harrington Ph.D. (2006). Taking sides issues in class Room management, United state of America.
[33] Nyongesa, C (2004, August). Difficulties and issues in teaching and learning Mathematics. Paper presented at a SMASSE District INSET Seminar, Bungoma High School.