fact sheet 2015-3030, water quality in the cambridge .../media/files/waterdepartment/water… ·...
TRANSCRIPT
U.S. Department of the InteriorU.S. Geological Survey
Fact Sheet 2015–3030 April 2015
Prepared in cooperation with the Cambridge, Massachusetts, Water Department
Water Quality in the Cambridge, Massachusetts, Drinking-Water Source Area, 2005–8
Printed on recycled paper
are available to the public through the USGS New England Water Science Center’s Web page (http://ma.water.usgs.gov) and in published reports (for example, Smith, 2005). From 2004 through 2008, the USGS and CWD characterized water quality during base-flow (conditions generally representing only groundwater discharge) and storm-runoff conditions in four tributaries to the Cambridge and Stony Brook Reservoirs and in the main stem of Stony Brook, the primary source of inflow to the Stony Brook Reservoir (Smith, 2013). Currently (2015), the USGS, in cooperation with the CWD, operates water-quality monitoring stations on every major tributary and on the three reservoirs in the drinking-water source area.
The City of Cambridge Drinking-Water Supply SystemThe CWD supplies approximately 15 million gallons per
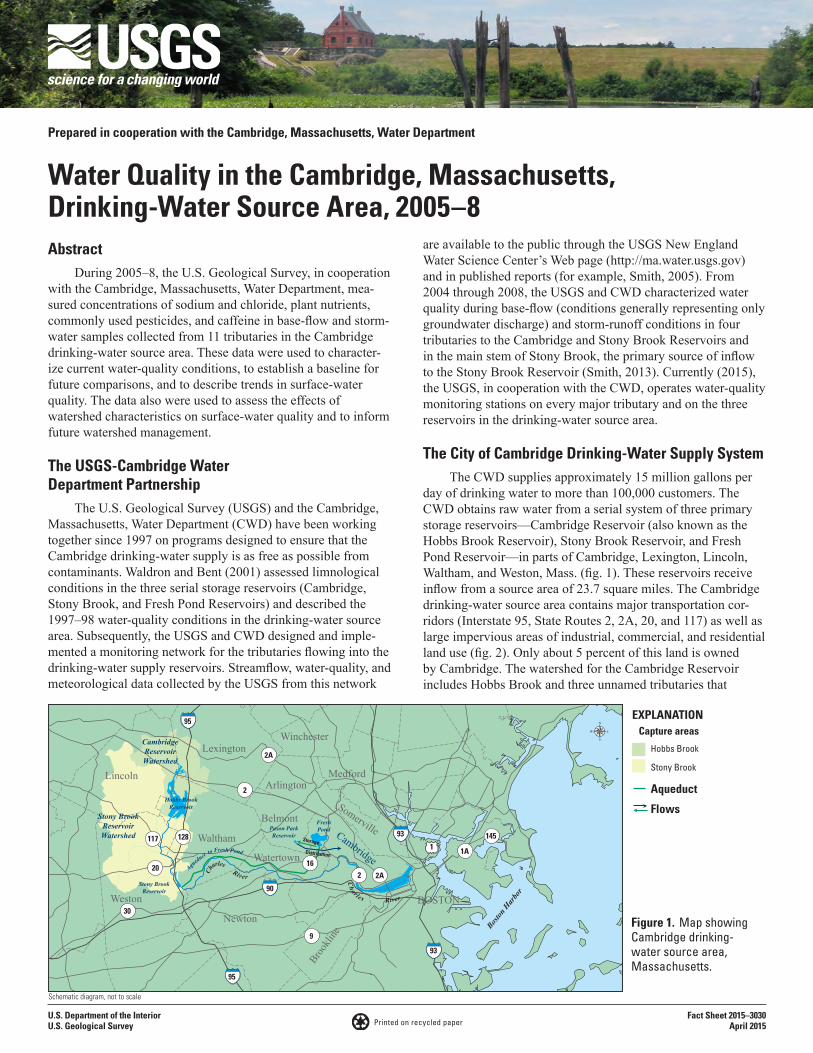
day of drinking water to more than 100,000 customers. The CWD obtains raw water from a serial system of three primary storage reservoirs—Cambridge Reservoir (also known as the Hobbs Brook Reservoir), Stony Brook Reservoir, and Fresh Pond Reservoir—in parts of Cambridge, Lexington, Lincoln, Waltham, and Weston, Mass. (fig. 1). These reservoirs receive inflow from a source area of 23.7 square miles. The Cambridge drinking-water source area contains major transportation cor-ridors (Interstate 95, State Routes 2, 2A, 20, and 117) as well as large impervious areas of industrial, commercial, and residential land use (fig. 2). Only about 5 percent of this land is owned by Cambridge. The watershed for the Cambridge Reservoir includes Hobbs Brook and three unnamed tributaries that
AbstractDuring 2005–8, the U.S. Geological Survey, in cooperation
with the Cambridge, Massachusetts, Water Department, mea-sured concentrations of sodium and chloride, plant nutrients, commonly used pesticides, and caffeine in base-flow and storm-water samples collected from 11 tributaries in the Cambridge drinking-water source area. These data were used to character-ize current water-quality conditions, to establish a baseline for future comparisons, and to describe trends in surface-water quality. The data also were used to assess the effects of watershed characteristics on surface-water quality and to inform future watershed management.
The USGS-Cambridge Water Department Partnership
The U.S. Geological Survey (USGS) and the Cambridge, Massachusetts, Water Department (CWD) have been working together since 1997 on programs designed to ensure that the Cambridge drinking-water supply is as free as possible from contaminants. Waldron and Bent (2001) assessed limnological conditions in the three serial storage reservoirs (Cambridge, Stony Brook, and Fresh Pond Reservoirs) and described the 1997–98 water-quality conditions in the drinking-water source area. Subsequently, the USGS and CWD designed and imple-mented a monitoring network for the tributaries flowing into the drinking-water supply reservoirs. Streamflow, water-quality, and meteorological data collected by the USGS from this network
Hobbs Brook
Stony Brook
Capture areasEXPLANATION
Aqueduct
Flows
Boston
Har
bor
Schematic diagram, not to scale
128
2
2A
2A
93
90
95
95
1A
1451
9
20 16
30
117
93
2
Cambridge
Brook
line
BOSTON
Newton
Waltham
Lincoln
LexingtonWinchester
Weston
Somerville
MedfordArlington
Belmont
Watertown
CambridgeReservoirWatershed
Stony BrookReservoirWatershed
Pason ParkReservoir
FreshPond
Ch
arles River Charl es River
Aqueduct t
o Fresh Pond
Hobbs BrookReservoir
Stony BrookReservoir
Storage
Distribution
Figure 1. Map showing Cambridge drinking-water source area, Massachusetts.

2
EXPLANATION
Impervious
Water body
Stations
0 1 2 MILES
0 1 2 KILOMETERS
Base from U.S. Geological Survey, Massachusetts Office of Geographic Information, Cambridge Water Department, Harvard Design and Mapping, and Boston Edison digital data, April 1998
Subbasin boundary
Concentration scale, in milligrams per liter (log interval used)
Sodi
um
CambridgeReservoir
Stony BrookReservoir
80
200
500
800
40
44
110
275
440
22
Chlo
ride
71°14'71°16'71°18'71°20'
42°26'
42°24'
42°22'
Figure 2. Median concentrations of chloride in water samples collected during base flow from tributaries in the Cambridge, Massachusetts, drinking-water supply area, eastern Massachusetts, 2005–8.

discharge directly into the reservoir. Water is discharged from the southern end of the Cambridge Reservoir into Hobbs Brook, which joins Stony Brook about 1.6 miles downstream from the reservoir. Stony Brook flows southward from the confluence with Hobb Brook for about a mile and discharges to the Stony Brook Reservoir. Additional water enters both reservoirs from tributaries and roadway and parking-lot storm drains. Water from Stony Brook Reservoir is piped through an aqueduct by the CWD directly to Fresh Pond Reservoir, where it is stored prior to treatment. Overflow and controlled discharges from the Stony Brook Reservoir flow into the Charles River in Waltham.
Measurements of Source-Area Water Quality, 2005–8
Concentrations of Sodium and Chloride Highest in Tributary Subbasins Containing Large Impervious Areas
High concentrations of sodium and chloride are of special concern in the Cambridge drinking-water source area because they are not readily removed by conventional treatment pro-cesses. High concentrations of chloride can affect the taste of finished drinking water, and high concentrations of sodium contribute to hypertension in susceptible individuals. Although these elements are common in precipitation (generally less than 1 milligram per liter (mg/L); National Atmospheric Deposition Program, 2008); minerals and soils in the environment (Smith, 2005); and in septic effluent, industrial wastes, and wastewater, they also are major constituents of road salt and other deicing compounds used within the drinking-water source area. Deicing compounds readily dissolve, and associated ions are transported to nearby streams by surface runoff and groundwater discharge. The contribution of deicing compounds is great because of the large amount of impervious area and numerous roadways in the drinking-water source area (fig. 2).
Concentrations of dissolved chloride and sodium in sam-ples collected from the tributaries throughout the drinking-water source area varied widely, particularly in the small subbasins where the effects of stormwater runoff and land development are greater (fig. 2). Tributary concentrations of these elements tended to increase during the summer, when streamflow is low, and decrease during higher base-flow conditions and storm-flows, indicating that groundwater is an important source of chloride and sodium. The higher concentrations of chloride and sodium in base flow often were greater than the U.S. Environmental Protection Agency (EPA) 250-mg/L secondary drinking-water-regulation (SDWR) standard for chloride (U.S. Environmental Protection Agency, 2009) and the Massachusetts Department of Environmental Protection (MassDEP) 20-mg/L drinking-water guideline for sodium (Massachusetts Depart-ment of Environmental Protection, 2009). Median concentra-tions of chloride in samples collected during base flow in five tributaries along the Interstate 95 corridor exceeded the EPA SDWR standards (fig. 2). Concentrations of sodium in water samples collected throughout the drinking-water supply area, as well as from the raw-water intake at the Fresh Pond Reservoir, routinely exceeded the MassDEP drinking-water guideline. Concentrations of chloride and sodium increased with the road density in each tributary subbasin. During 2005–8, the esti-mated annual mean loads of sodium and chloride to the Stony Brook Reservoir were about 2,600 metric tons (t) and 4,800 t,
respectively. In a typical year, about half of the water—and thus half the sodium chloride—entering the Stony Brook Reservoir is diverted to Fresh Pond Reservoir, where it is processed as drinking water.
Concentrations of Nutrients Often Exceed Reference Values
Nutrients such as nitrogen and phosphorus are essential to the health and diversity of aquatic organisms. Biological and chemical processes can mobilize nutrients to or from the soil, reservoir sediments, water column, atmosphere, and organisms. Algae and aquatic plants take up chemical forms of each nutri-ent in accordance with their nutritional requirements. Generally, the nutrient that is in shortest supply relative to the nutritional needs of the plants will be the one that limits overall growth. Waldron and Bent (2001) determined that phosphorus was the limiting nutrient on plant growth in the Cambridge drinking-water reservoirs; thus, any increases in phosphorus would be expected to result in potentially excessive increases in plant growth, a process known as eutrophication. Eutrophication can lead to excessive amounts of plant biomass, which in turn can lead to reductions in dissolved oxygen concentrations, releases of trace metals from sediment, and unwanted effects on other aquatic life.
Common sources of phosphorus include weathered rocks and soils, fertilizers, and domestic (septic-system) and munici-pal (sewer-line) wastewater. Phosphorus is somewhat insoluble and tends to be associated with sediment and plant matter. Erosion of local soils and even washoff of winter-maintenance sands from roads and parking lots can increase phosphorus con-centrations in receiving waters. Common sources of nitrogen are precipitation, emissions from automobiles, degradation of natural organic matter, fertilizers, and domestic and municipal wastewater. Measured concentrations of total nitrogen and total phosphorus in water samples collected from subbasins in the drinking-water supply area ranged from 0.42 to 5.13 and from 0.006 to 0.80 mg/L, respectively (fig. 3). Median concentrations for total nitrogen and total phosphorus were about 1.5 mg/L and 0.03 mg/L, respectively.
Concentrations of total nitrogen and total phosphorus generally exceeded the proposed reference concentrations of 0.57 mg/L and 0.024 mg/L, respectively, for Level 3, Ecoregion 59 (U.S. Environmental Protection Agency, 2000). These refer-ence values, which represent the 25th percentile of all nutrient data for Ecoregion 59, are intended to protect streams and rivers from the adverse effects of nutrient enrichment and eutrophica-tion. Concentrations of total nitrogen exceeded this reference concentration in 94 percent of all water samples collected from the five monitoring stations during base-flow and storm con-ditions and in 100 percent of all samples collected from the raw-water intake at the Fresh Pond Reservoir. Concentrations of total phosphorus exceeded this reference concentration in 56 percent of all water samples. With few exceptions, concentra-tions of total phosphorus in all composite stormflow samples exceeded the reference value (fig. 3). Generally, concentra-tions of total phosphorus in samples collected during base-flow conditions were near or below the reference concentration. Concentrations of total phosphorus were similar among the four tributaries despite differences in land use.
3

4
01104415
Conc
entra
tion,
in m
illig
ram
s pe
r lite
r
0.001
0.01
0.1
1.0
01104433
Conc
entra
tion,
in m
illig
ram
s pe
r lite
r
0.001
0.01
0.1
1.0
01104455
Conc
entra
tion,
in m
illig
ram
s pe
r lite
r
0.001
0.01
0.1
1.0
Conc
entra
tion,
in m
illig
ram
s pe
r lite
r
0.001
0.01
0.1
1.0
Conc
entra
tion,
in m
illig
ram
s pe
r lite
r
0.001
0.01
0.1
1.0
EXPLANATION
Impervious
Water body
01104415
0 1 2 MILES
0 1 2 KILOMETERS
Base from U.S. Geological Survey, Massachusetts Office of Geographic Information, Cambridge Water Department, Harvard Design and Mapping, and Boston Edison digital data, April 1998
Subbasin boundary
Subbasins
Hobbs Brook Subbasin
Stony Brook Reservoir Subbasin
U.S. Geological Survey station and number
CambridgeReservoir
Stony BrookReservoir
Range
Base flow Stormflow
Base flow Stormflow
Base flow Stormflow
Base flow Stormflow
Base flow Stormflow
01104475
01104475
01104460
01104415
01104433
01104455
01104460
Figure 3. Distribution and median concentrations of total phosphorus in base-flow and stormflow samples from five U.S. Geological Survey stations in the drinking-water source area for Cambridge, Massachusetts, 2005–8.
Discharge measurement at U.S. Geological Survey streamgage (01104415) near Lexington, Mass.
Pesticides were detected at trace levels throughout the drinking-water source area
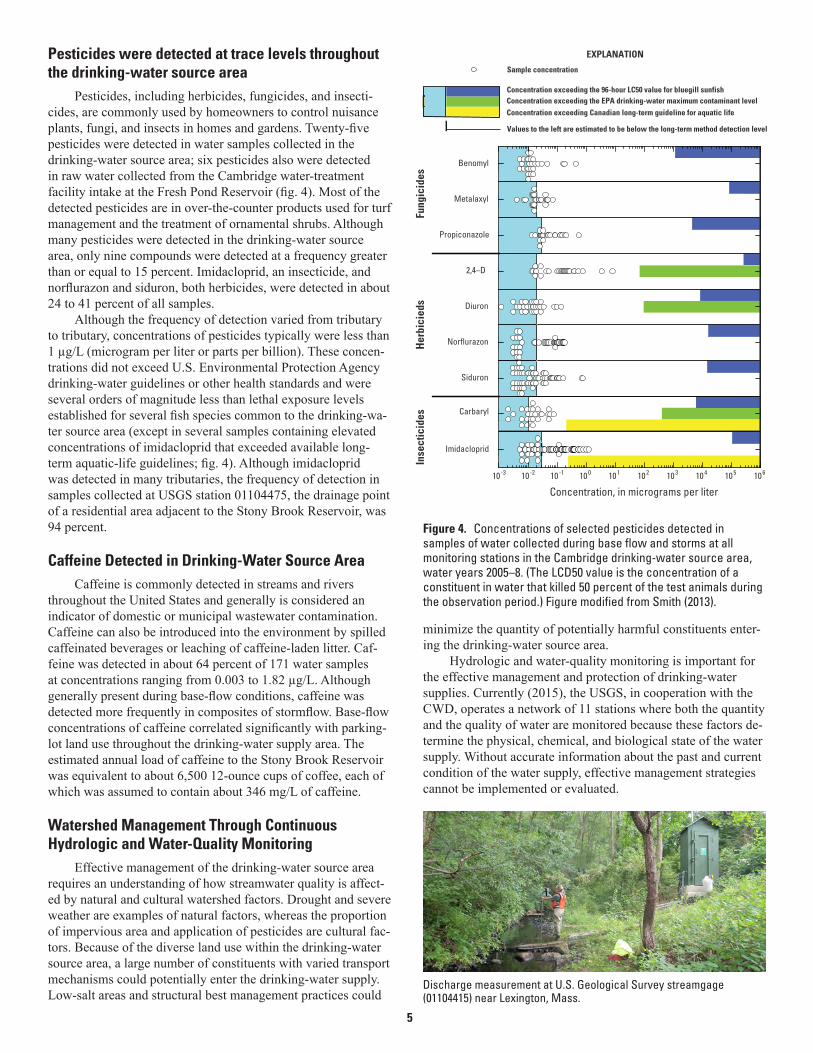
Pesticides, including herbicides, fungicides, and insecti-cides, are commonly used by homeowners to control nuisance plants, fungi, and insects in homes and gardens. Twenty-five pesticides were detected in water samples collected in the drinking-water source area; six pesticides also were detected in raw water collected from the Cambridge water-treatment facility intake at the Fresh Pond Reservoir (fig. 4). Most of the detected pesticides are in over-the-counter products used for turf management and the treatment of ornamental shrubs. Although many pesticides were detected in the drinking-water source area, only nine compounds were detected at a frequency greater than or equal to 15 percent. Imidacloprid, an insecticide, and norflurazon and siduron, both herbicides, were detected in about 24 to 41 percent of all samples.
Although the frequency of detection varied from tributary to tributary, concentrations of pesticides typically were less than 1 µg/L (microgram per liter or parts per billion). These concen-trations did not exceed U.S. Environmental Protection Agency drinking-water guidelines or other health standards and were several orders of magnitude less than lethal exposure levels established for several fish species common to the drinking-wa-ter source area (except in several samples containing elevated concentrations of imidacloprid that exceeded available long-term aquatic-life guidelines; fig. 4). Although imidacloprid was detected in many tributaries, the frequency of detection in samples collected at USGS station 01104475, the drainage point of a residential area adjacent to the Stony Brook Reservoir, was 94 percent.
Caffeine Detected in Drinking-Water Source AreaCaffeine is commonly detected in streams and rivers
throughout the United States and generally is considered an indicator of domestic or municipal wastewater contamination. Caffeine can also be introduced into the environment by spilled caffeinated beverages or leaching of caffeine-laden litter. Caf-feine was detected in about 64 percent of 171 water samples at concentrations ranging from 0.003 to 1.82 µg/L. Although generally present during base-flow conditions, caffeine was detected more frequently in composites of stormflow. Base-flow concentrations of caffeine correlated significantly with parking-lot land use throughout the drinking-water supply area. The estimated annual load of caffeine to the Stony Brook Reservoir was equivalent to about 6,500 12-ounce cups of coffee, each of which was assumed to contain about 346 mg/L of caffeine.
Watershed Management Through Continuous Hydrologic and Water-Quality Monitoring
Effective management of the drinking-water source area requires an understanding of how streamwater quality is affect-ed by natural and cultural watershed factors. Drought and severe weather are examples of natural factors, whereas the proportion of impervious area and application of pesticides are cultural fac-tors. Because of the diverse land use within the drinking-water source area, a large number of constituents with varied transport mechanisms could potentially enter the drinking-water supply. Low-salt areas and structural best management practices could
minimize the quantity of potentially harmful constituents enter-ing the drinking-water source area.
Hydrologic and water-quality monitoring is important for the effective management and protection of drinking-water supplies. Currently (2015), the USGS, in cooperation with the CWD, operates a network of 11 stations where both the quantity and the quality of water are monitored because these factors de-termine the physical, chemical, and biological state of the water supply. Without accurate information about the past and current condition of the water supply, effective management strategies cannot be implemented or evaluated.
5
Benomyl
Metalaxyl
Propiconazole
2,4–D
Diuron
Norflurazon
Siduron
Imidacloprid
Carbaryl
Concentration, in micrograms per liter
Fung
icid
es
10-3 10-2 10-1 100 101 102 103 104 105 106
Sample concentration
EXPLANATION
Values to the left are estimated to be below the long-term method detection level
Concentration exceeding the EPA drinking-water maximum contaminant level Concentration exceeding Canadian long-term guideline for aquatic life
Concentration exceeding the 96-hour LC50 value for bluegill sunfish
Her
bici
eds
Inse
ctic
ides
Figure 4. Concentrations of selected pesticides detected in samples of water collected during base flow and storms at all monitoring stations in the Cambridge drinking-water source area, water years 2005–8. (The LCD50 value is the concentration of a constituent in water that killed 50 percent of the test animals during the observation period.) Figure modified from Smith (2013).

References Cited
Massachusetts Department of Environmental Protection, 2009, Standards and guidelines for contaminants in Massachusetts drinking waters: Mas-sachusetts Department of Environmental Protection, Office of Research and Standards, accessed February 16, 2010, at http://www.mass.gov/dep/water/dwstand.pdf.
National Atmospheric Deposition Program, 2008, NADP/NTN moni-toring location MA13—2006 annual & seasonal data summary for Site MA13: National Atmospheric Deposition Program database, accessed August 26, 2007, at http://nadp.sws.uiuc.edu/sites/siteinfo.asp?net=NTN&id=MA13.
Smith, K.P., 2005, Hydrologic, water-quality, bed-sediment, soil-chemistry, and statistical summaries of data for the Cambridge, Massachusetts, drinking-water source area, water year 2004: U.S. Geological Survey Open-File Report 2005–1383, 110 p.
Smith, K.P., 2013, Water-quality conditions, and constituent loads and yields in the Cambridge drinking-water source area, Massachusetts, water years 2005–07: U.S. Geological Survey Scientific Investigations Report 2013–5039, 73 p., http://pubs.usgs.gov/sir/2013/5039/.
U.S. Environmental Protection Agency, 2000, Ambient water quality crite-ria recommendations—Information supporting the development of state and tribal nutrient criteria—Rivers and streams in nutrient ecoregion XIV: Washington, D.C., U.S. Environmental Protection Agency, Office of Water, December 2000, EPA 822–B–00–022 [variously paginated].
U.S. Environmental Protection Agency, 2009, Drinking water contaminants, accessed September 24, 2013, at http://water.epa.gov/drink/contaminants/.
Waldron, M.C., and Bent, G.C., 2001, Factors affecting reservoir and stream-water quality in the Cambridge, Massachusetts, drinking-water source area and implications for source-water protection: U.S. Geologi-cal Survey Water-Resources Investigations Report 00–4262, 89 p.
by Kirk P. Smith and Marcus C. Waldron
6
Weir at U.S. Geological Survey streamgage (01104475) near Weston, Mass.
Outlet pond below Stony Brook Reservoir, U.S. Geological Survey streamgage (01104480) near Waltham, Mass.
Director, New England Water Science Center U.S. Geological Survey 10 Bearfoot Road, Northborough, MA 01532 For more information visit: http://ma.water.usgs.gov email [email protected] or call (508) 490-5000
ISSN 2327-6916 (print)ISSN 2327-6932 (online)http://dx.doi.org/10.3133/fs20153030