facing the plastic bottleneck: rethinking recycling · pdf filefacing the plastic bottleneck:...
TRANSCRIPT
Team#: 2035 1
Facing the Plastic Bottleneck: Rethinking Recycling
Team#: 2035
Executive Summary
This report covers various aspects of recycling in the United States which were considered to construct models predicting future production of waste. Then, appropriate local and national recycling strategies were developed in response. In order to gain a frame of reference for the current and future state of solid waste generation and treatment, trends pertaining to the use and disposal of plastics were analyzed to project plastic waste for the next decade. By extrapolating per capita plastic waste data, a logistic function was fitted to suggest that the annual per capita value is headed to stabilize at 94.97 thousand tons. With this determined function as well as census projections of population growth, an overall 341.15 million tons of nonrecycled plastic waste was estimated to be added into landfills from now through 2023. We considered recycling options to help prevent this build-up, including drop-off points, curbside pickup, and curbside pickup with a fee charged for the amount of trash the household produces. These were combined into a model which calculates the weight of material recycled, and compares this value with the city’s recycling budget. Our model seeks to maximize the weight of material that ends up being recycled each year given a firm budget. We analyzed the desirability of recycling to consumers based on the amount of time or time equivalent each method would cost a user to recycle. In general, we found that curbside recycling is always preferable to drop-off recycling if it is possible to do so under the allotted budget. In addition, curbside recycling with an imposed tax upon all nonrecycled items is superior to curbside recycling, ignoring social factors such as public opinion. The model indicates that Fargo would recycle 30,786,160 pounds a year if it implemented curbside recycling. This would require 10 recycling facilities to process, and cost $2.68 million a year to operate. If this exceeded Fargo’s budget, it would be forced to use drop-off stations instead. Similarly, Price would require a budget of $268,000 to use curbside recycling, and Wichita would require $10,988,000. Next, using an agent-based modeling system, we analyzed the peer effects that governed the diffusion of recycling in Fargo, Price, and Wichita. We determined that municipal policy should aim to encourage 40%, 55%, and 40% of the population, respectively, to initially recycle in order to maximize the benefits from peer efects. The specific results for the three cities in question were then generalized into basic guidelines that could applied across the United States as a whole, based upon the relationship between the amount of material to be recycled and the money available as well as the public attitude.

Team#: 2035 2
Table of Contents
Introduction ........................................................................ Page 3
Part 1: Predicting Plastic in the Landfills......................... Page 3
Part 2: Local Recycling Method ........................................ Page 7
Part 3: National Recycling Method .................................. Page 17
Strengths and Weaknesses ................................................ Page 18
Future Work ........................................................................ Page 19
References ............................................................................ Page 19
Team#: 2035 3
1. Introduction
Since the beginning of modern societies, one of the principle and most foreboding enemies that communities have had to conquer is the disposal of their waste products. For thousands of years, the only method for accomplishing this was the development of landfills where waste could be dumped and abandoned. However, with the turn of the twentieth century came the technological advances necessary to take some of these waste products and remake them into other useful products. This process of recycling, while helpful for its environmental benefits, is expensive and difficult to implement logistically and in terms of influencing the practices of people who are already established in their waste disposal methods. However, with the ever increasing population that the world faces, as well as a consumption-oriented society that dominates especially in western countries, it is becoming increasingly important that communities implement effective recycling processes. Plastic products in particular present a huge obstacle since, left to degrade in landfills, they stay intact for tens of thousands of years. In conjunction with these challenges we set out to model the amount of plastic waste that ends up in landfills in the United States over time as well as the rate of plastic waste over time to predict the amount of plastic waste that will be present in landfills in 2023. Beyond that we set out to create a model that determines which recycling program is most beneficial for Fargo, North Dakota; Price, Utah; and Wichita, Kansas and then applied this model to the country as a whole to determine which practices might be appropriate for townships and states in general based upon their characteristics.
2. Part 1: Predicting Plastic in Landfills 2.1 Analysis of the Problem To estimate the amount of plastic that ends up in landfills, we considered the problem from the point of view of the municipal waste facilities and, based on our assumptions, scaled this general data to per capita usage of citizens. By extrapolating past data provided, it is possible to develop equations that will predict the future disposal of plastics. Since the data indicates that plastic waste production has roughly leveled off recently, with similar trends in both general and per capita, we separated the model into two factors, plastic waste per capita, and population. 2.2 Assumptions
● Historical data on recycling can be extrapolated for projecting future statistics. The general population’s recycling behavior, in conjunction with lack of

Team#: 2035 4
economic growth, is not likely to change significantly enough within the next decade to influence per capita waste to deviate from extrapolated trends.
● The majority of municipal solid waste (MSW), an estimated 55-65%, is from the residential sector, as opposed to commercial and institutional sources [1]. Therefore, assume plastic waste is also generated primarily in general residential use. In that case, a determination of per capita plastic waste can be used in conjunction with population to describe overall waste generation.
● The degradation of plastics in landfills takes place over such a long time scale that for the purposes of the time scales considered in our model they can be considered inert, and therefore only the addition of more plastic products, not the disappearance of old products, needs to be considered.
2.3 Design of the Model Comprehensive municipal solid waste (MSW) data was obtained from the EPA. All available data on overall plastic waste, in thousands of tons, was scaled by historical population estimates to produce data on per capita plastic waste (Table 1).
Table 1
Year Municipal Plastic Waste (Thousands of Tons) [2]
United States Population (Millions) [3]
Per-Capita Plastic Waste (Thousands of Tons)
1960 390 180.67 2.16
1970 2900 205.05 14.14
1980 6810 227.22 29.97
1990 16760 249.62 67.14
2000 24050 282.16 85.24
2005 27470 295.52 92.95
2007 28630 301.23 95.04
2008 27930 304.09 91.85
2009 27690 306.77 90.26
2010 28490 309.33 92.10
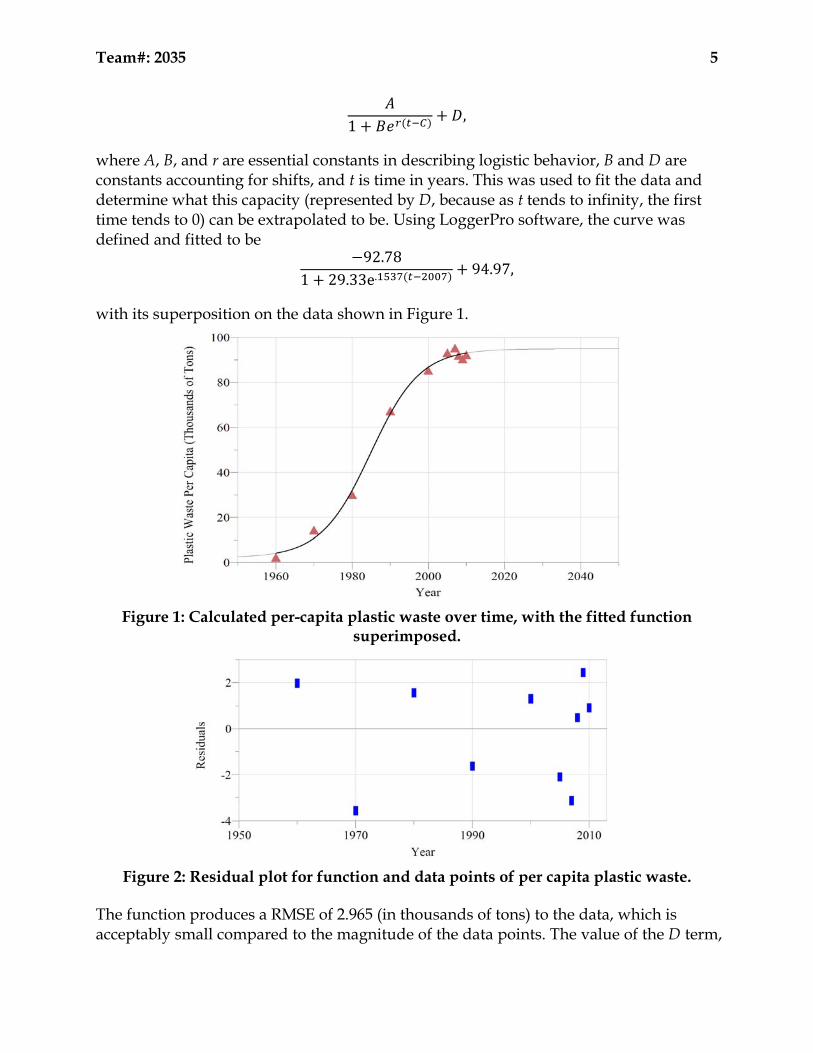
The data seems to indicate that the per-capita plastic waste is tending to some constant capacity. A logistic function was used with the form
Team#: 2035 5
1,
where A, B, and r are essential constants in describing logistic behavior, B and D are constants accounting for shifts, and t is time in years. This was used to fit the data and determine what this capacity (represented by D, because as t tends to infinity, the first time tends to 0) can be extrapolated to be. Using LoggerPro software, the curve was defined and fitted to be
92.781 29.33e.
94.97,
with its superposition on the data shown in Figure 1.
Figure 1: Calculated per-capita plastic waste over time, with the fitted function
superimposed.
Figure 2: Residual plot for function and data points of per capita plastic waste.
The function produces a RMSE of 2.965 (in thousands of tons) to the data, which is acceptably small compared to the magnitude of the data points. The value of the D term,

Team#: 2035 6
94.97 thousand tons per capita, establishes the approximately constant capacity of per capita plastic waste that is projected to be approached as time goes on. With this projection, the production rate of plastic waste over time can be estimated by using per capita value and population for each year. In order to predict the collective amount of plastic added to landfills in the United States starting from now through 2023, the population data for this period of time was found. Population projections have indicated somewhat linear growth, with an average increase of 2.49 million per year starting from 2010, based on overall projected growth from then to 2025 [11]. Because we have reports of population through 2012, the average increase is used to estimate population through 2023. The set of population data P for calculating the total amount of plastic waste, from 2009 through 2023, is given in Table 2. These figures in conjunction with the projected per capita waste will then produce the estimate for overall plastic waste in landfills ten years from now.
Table 2
Year Population (Millions)
Year Population (Millions)
2012 313.85 2018 328.79
2013 316.34 2019 331.28
2014 318.83 2020 333.77
2015 321.32 2021 336.26
2016 323.81 2022 338.75
2017 326.30 2023 341.24
Taking each component into consideration, the following expression produces our prediction for landfill plastic waste generated in millions of tons from now through 2023, with P denoting population and W denoting the per capita waste function:
∗
This summation results in a value of 341.15 million tons of plastic waste added into landfills in the United States, over the course of the next decade. The sheer magnitude of the amount of plastic waste, which has never comprised of more than 20% of total nonrecycled trash, motivates the restructuring and rethinking of recycling systems [2]. To put the size of this trash into perspective, the remaining landfill capacity for the

Team#: 2035 7
entire state of North Carolina is estimated to be only 157 million tons of waste, which is less than half of the weight of plastic waste to be produced in the United States in the coming decade. 2.4 Justification and Testing of the Model This model relies on the assumption that previous trends in waste generation are a good indicator for the future. This is reasonable because trends have been fairly consistent for decades now, and even if technology changed radically, it would take an extended period of time to become integrated into our waste management system. The use of population makes sense because there are so many plastic products we consider “essential,” and thus the waste from these per person can be considered on a per capita basis. As waste production data continues to be reported each year, the model can be tested for accuracy in assuming approaching a carrying capacity as plastic waste, population, and thus per-capita plastic waste figures are collected. By extrapolating projections for each of the components in calculating overall plastic waste, new data points for these factors in years to come will allow adjustments of functions and thus test the model for stability by comparing the resulting estimate year after year.
3. Part 2: Local Recycling Method
3.1 Analysis of the Problem Given the massive amount of plastic waste alone projected to be produced within the next decade, overall trash and recycling trends and processes must be analyzed and new methods proposed. Local-scale programs and adjustments are necessary to cause changes in recycling behavior, and thus possible implementations were considered for three demographically different cities: Fargo, North Dakota; Price, Utah; and Wichita, Kansas. Initially we assume that the city has an allotted amount of money to spend on its recycling program and spends precisely this amount. The goal is now to maximize the amount of recyclable goods processed. This is a realistic assumption to make because many municipalities set aside a quanta of money and spend all of this money on its allotted purpose desiring the most good for their expense— in this case being the amount of recyclable items recycled. In order to determine which recycling method is preferable for each city it is necessary to incorporate factors that characterize the attitudes of the township as well as the structural plausibility of each approach. Additionally, the method that will produce the most desirable effects depends on whether the citizens are personally committed to

Team#: 2035 8
recycling or resistant to going out of their way to participate in such a program. The three different recycling programs that we considered are drop-off locations for pre-sorted materials, single-stream curbside pickup, and single-stream curbside pick-up where consumers are charged based on amount of trash they produce. 3.2 Assumptions
Each city is on a fixed budget that they cannot exceed. If a certain recycling plan exceeds the budget, the city must use a cheaper option. This is reasonable, as it describes the actual functioning of real budgets.
Every recycling plant is identical, costing the same to operate and processing the same amount of waste. We justify this assumption because despite that there naturally exists some variation between different plants, the variation is both marginal and balanced—there are as many plants smaller than average as there are larger than average.
Cars in the city travel 35 mph on average over the duration of their trip—this is the lawful speed-limit within city limits.
On average, each person who recycles will recycle the same amount (401.5 pounds per year), and the city is based on a curbside recycling program. This figure is taken from real data with these parameters.
3.3 Design of the Model Using the assumption that the city has a set budget for recycling, the goal would be to use this money as effectively as possible to maximize the weight of waste recycled. Obviously, curbside recycling with a tax on garbage would most encourage people to recycle—it requires minimal effort from the consumer and penalizes them for not participating in the program. It also generates additional revenue for the city, which makes it strictly better than curbside recycling, as it is both more convenient for the resident, which means more items will be recycled, and more economic for the municipality as they gain revenue from the tax collected. The cost to the city is the same as single-stream curbside without fee except the cost is decreased by the fee for every can of garbage collected. While there is an additional cost in terms of oversight of record keeping and billing for the fee, this is insignificant compared to the amount of money the tax would bring in. In general, to the government it is in their best interest to impose as large of a fee as they can create legislation for, but the actual fee is irrelevant in the decision making process since the volume between single-stream curbside with and without the fee is identical, so obviously any fee decreases the cost. However, a fee would be difficult to pass, since citizens and policymakers would oppose it. If a fee can be instilled, this is clearly the optimal solution. However, where this is not feasible we provide an alternate model. To find the amount that each person will recycle on average, a time cost must be

Team#: 2035 9
calculated based on the additional effort the person must expend to recycle rather than use traditional garbage. For drop-off of pre-sorted recyclables:
.
For curbside pickup: .
For curbside pickup with a tax: ,
where Tsort is the time for a person to personally sort his or her recyclables (~10 minutes), <d> is the average distance to the nearest recycling center, and <v> is the average car speed in the city, 35 miles per hour (by law). w is the perceived extra “cost” to recycle: having to set up a bin in the house and walk over every time something needs recycling, estimated as 40(1-percentWilling/2) with percent willing as a decimal under the condition that curbside recycling is available. tax is a converted cost (benefit) from avoiding the fee for garbage disposal. This is found by dividing the fee per bin of trash by the minimum wage to get hours, and then converting into minutes:
2
3,
Where A is the area of the region under consideration and n the number of recycling facilities. Explanation: We make the assumption that all recycling facilities are responsible for the same portion of the population. To find the region which a recycling facility is responsible for we then divide the total area of the region by the number of facilities: a = A/n. We also assume that the region each facility is responsible for is the shape of a circle with the facility located at the center. Clearly this is an unrealistic assumption for virtually all cities as it is impossible to create their geographical shapes by the placement of multiple nonoverlapping circles. However, it serves as a reasonable and helpful approximation to find the average distance between a citizen and their nearest recycling center. It is a well-known result (derivable by using annular regions and calculus) that the average distance to the center of a circle is 2r/3, where r is the radius of the circle . Since the region is circular, we may find its radius by the formula a = r2,
which implies r = . Substituting this into the expression for the average distance to the
center of a circle and substituting a = A/n into the equation for r we find . Based on these time costs, an individual will recycle a total of
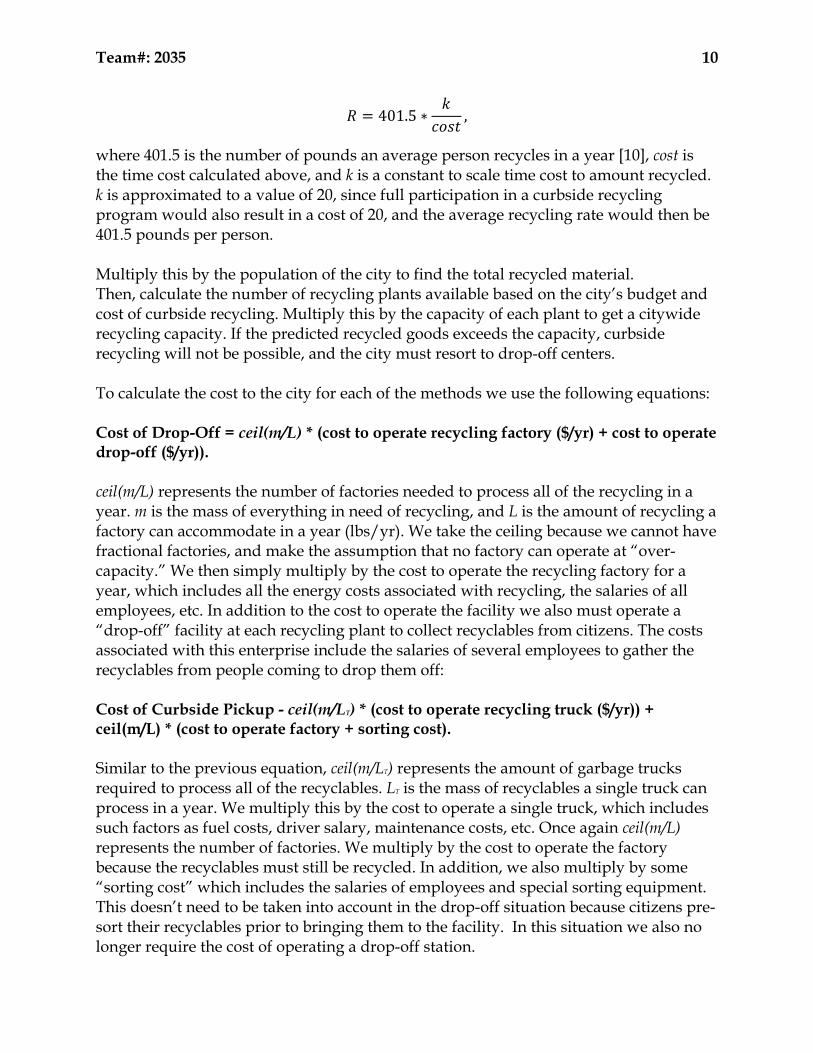
Team#: 2035 10
401.5 ∗ ,
where 401.5 is the number of pounds an average person recycles in a year [10], cost is the time cost calculated above, and k is a constant to scale time cost to amount recycled. k is approximated to a value of 20, since full participation in a curbside recycling program would also result in a cost of 20, and the average recycling rate would then be 401.5 pounds per person. Multiply this by the population of the city to find the total recycled material. Then, calculate the number of recycling plants available based on the city’s budget and cost of curbside recycling. Multiply this by the capacity of each plant to get a citywide recycling capacity. If the predicted recycled goods exceeds the capacity, curbside recycling will not be possible, and the city must resort to drop-off centers. To calculate the cost to the city for each of the methods we use the following equations: Cost of Drop-Off = ceil(m/L) * (cost to operate recycling factory ($/yr) + cost to operate drop-off ($/yr)). ceil(m/L) represents the number of factories needed to process all of the recycling in a year. m is the mass of everything in need of recycling, and L is the amount of recycling a factory can accommodate in a year (lbs/yr). We take the ceiling because we cannot have fractional factories, and make the assumption that no factory can operate at “over-capacity.” We then simply multiply by the cost to operate the recycling factory for a year, which includes all the energy costs associated with recycling, the salaries of all employees, etc. In addition to the cost to operate the facility we also must operate a “drop-off” facility at each recycling plant to collect recyclables from citizens. The costs associated with this enterprise include the salaries of several employees to gather the recyclables from people coming to drop them off: Cost of Curbside Pickup - ceil(m/LT) * (cost to operate recycling truck ($/yr)) + ceil(m/L) * (cost to operate factory + sorting cost). Similar to the previous equation, ceil(m/LT) represents the amount of garbage trucks required to process all of the recyclables. LT is the mass of recyclables a single truck can process in a year. We multiply this by the cost to operate a single truck, which includes such factors as fuel costs, driver salary, maintenance costs, etc. Once again ceil(m/L) represents the number of factories. We multiply by the cost to operate the factory because the recyclables must still be recycled. In addition, we also multiply by some “sorting cost” which includes the salaries of employees and special sorting equipment. This doesn’t need to be taken into account in the drop-off situation because citizens pre-sort their recyclables prior to bringing them to the facility. In this situation we also no longer require the cost of operating a drop-off station.
Team#: 2035 11
To find the cost of curbside pickup with an imposed tax we simply subtract away the money collected from the tax from the cost. We do not further consider this case here, however, for reasons given above describing the equivalence/reducability of the methods of curbside pickup and curbside pickup with a tax. Other constants and values used:
1.1 lb of waste recycled per person per day [10]. A small recycling plant processes about 4.5 tons of material a day. This plant
would cost roughly $268,000 to operate per year [12]. Percentage of residents indicating that they are willing to recycle [5]:
o Fargo: 60%, o Price: 54%, o Wichita: 85%.
Fargo: Population —107,349; Area—98.16 km² [4]. Wichita: Population —384,445; Area—359.7 km² [4]. Price: Population—8,682; Area—10.88 km² [4].
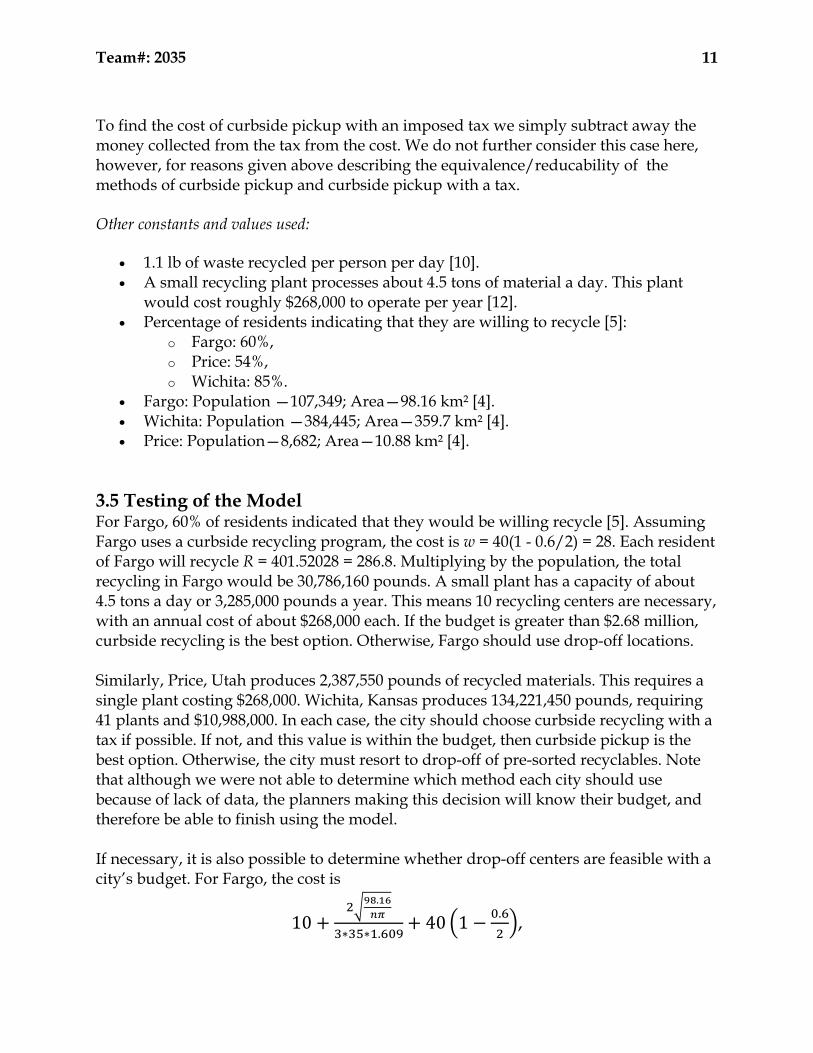
3.5 Testing of the Model For Fargo, 60% of residents indicated that they would be willing recycle [5]. Assuming Fargo uses a curbside recycling program, the cost is w = 40(1 - 0.6/2) = 28. Each resident of Fargo will recycle R = 401.52028 = 286.8. Multiplying by the population, the total recycling in Fargo would be 30,786,160 pounds. A small plant has a capacity of about 4.5 tons a day or 3,285,000 pounds a year. This means 10 recycling centers are necessary, with an annual cost of about $268,000 each. If the budget is greater than $2.68 million, curbside recycling is the best option. Otherwise, Fargo should use drop-off locations. Similarly, Price, Utah produces 2,387,550 pounds of recycled materials. This requires a single plant costing $268,000. Wichita, Kansas produces 134,221,450 pounds, requiring 41 plants and $10,988,000. In each case, the city should choose curbside recycling with a tax if possible. If not, and this value is within the budget, then curbside pickup is the best option. Otherwise, the city must resort to drop-off of pre-sorted recyclables. Note that although we were not able to determine which method each city should use because of lack of data, the planners making this decision will know their budget, and therefore be able to finish using the model. If necessary, it is also possible to determine whether drop-off centers are feasible with a city’s budget. For Fargo, the cost is
10.
∗ ∗ .40 1
. ,

Team#: 2035 12
taking care to convert from miles per hour to kilometers per hour. Then, the residents of Fargo will recycle
862012470/ 382 98.16 ∗ ∗
3 ∗ 35 ∗ 1.609
pounds. This must be less than 3285000*budget/totalfacilitycosts. 3.6 Plastic and Peer Effects: Improving Local Scale Strategy 3.6.1 Setting up the Model Peer effects are omnipresent in today’s society and play a critical sociological role in decision making. For example, a standing ovation is often initiated after audience members who are standing encourage those next to them to do so as well. Likewise, it is unusual for an audience member to “boo” loudly while her neighbors are cheering. In this section, we will apply the same concept to outline a method of marketing and public policy to encourage recycling in communities of various shapes and sizes. The fundamental assumption in this model is that an individual’s propensity to recycle is determined by whether his/her neighbors are recycling. Analysis of peer effects in an environmental practice is justified and has been used before in both reducing energy usage [7] and in reviewing solar power adoption [8]. To visualize and quantify peer effects, we developed a cellular automata model using the agent-based modeling language NetLogo. Each cell was given the following rules:
Rule Visual Change in the Program
Rationale
If half or more of the Moore neighbors of a cell are recycling, then the cell that is not recycling will recycle.
Color of cell changes from light brown to dark green
Strong peer effects from neighbors coerce the cell into doing something generally seen as good for the environment.
If less than 2 of the Moore neighborhood recycle, than a cell that is recycling will cease to recycle.
Color of cell changes from dark green to light brown
It will require stronger peer effects to coerce the cell into doing something generally seen as bad for the environment.
Each of the cells, which symbolize an individual person within the community, was overlaid across a map of each city. An example for Wichita, Kansas, is below. After this setup was completed, the program was initialized using a “seeding-density,” which is

Team#: 2035 13
the proportion of cells in the system at time 0 that were recycling. The program was run until the aggregate recycling frequencies reached a steady state, which usually required 60–100 iterations.
Above: On the left is a map taken from the internet [9] of Wichita with the regions of the city colored in yellow. The image file was imported into NetLogo and then patches overlaid over
the yellow region as shown to the right. Use of the program facilitated two results. First, we were able to visualize the dynamics of the network, specifically noting how clusters of recycling communities emerge. Second, in analysis of the data collected from the model, we determined optimal seeding densities that would allow for the maximum steady-state recycling levels in the community. Both results together would shape government policy towards the promotion of recycling. 3.6.2 Assumptions: Several assumptions were used to simplify the model and limit computational stress:
1. We assumed all cities have a uniform population distribution. This assumption is reasonable because city residents are more motile. We can expect that plastic products are commonly used everywhere in the city.
2. For larger communities, specifically Wichita and Fargo, we were unable to run a simulation with one cell in the automata for every single person, as doing so would place too much computational tax on the computer. Instead, we made the assumption that peer effects are preserved when we scale down to a population a fraction in size, and continued with our analysis.
3. We assumed that in the general population, the initial seeding of recyclers is random across the population, as socioeconomic status and ethnicity rather than an individual’s desire to recycle are stronger determinants of home location.
4. Peer effects are the sole determinant of whether an individual recycles.
Team#: 2035 14
3.6.3 Results
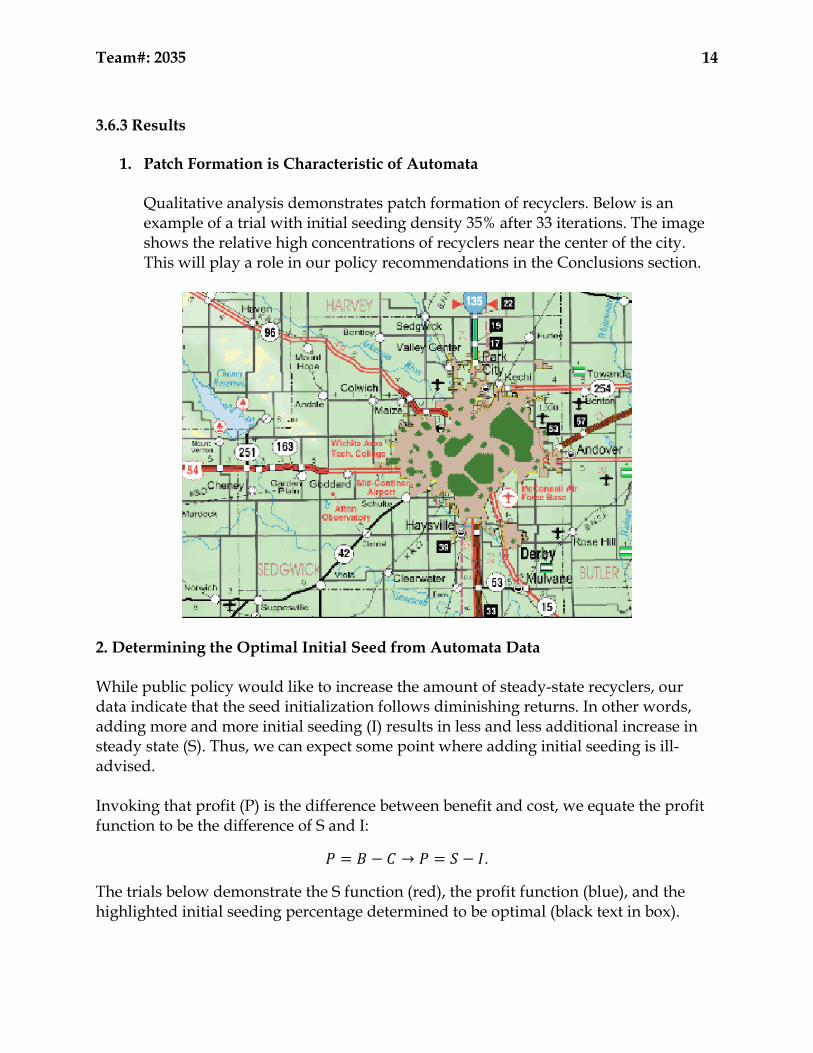
1. Patch Formation is Characteristic of Automata Qualitative analysis demonstrates patch formation of recyclers. Below is an example of a trial with initial seeding density 35% after 33 iterations. The image shows the relative high concentrations of recyclers near the center of the city. This will play a role in our policy recommendations in the Conclusions section.
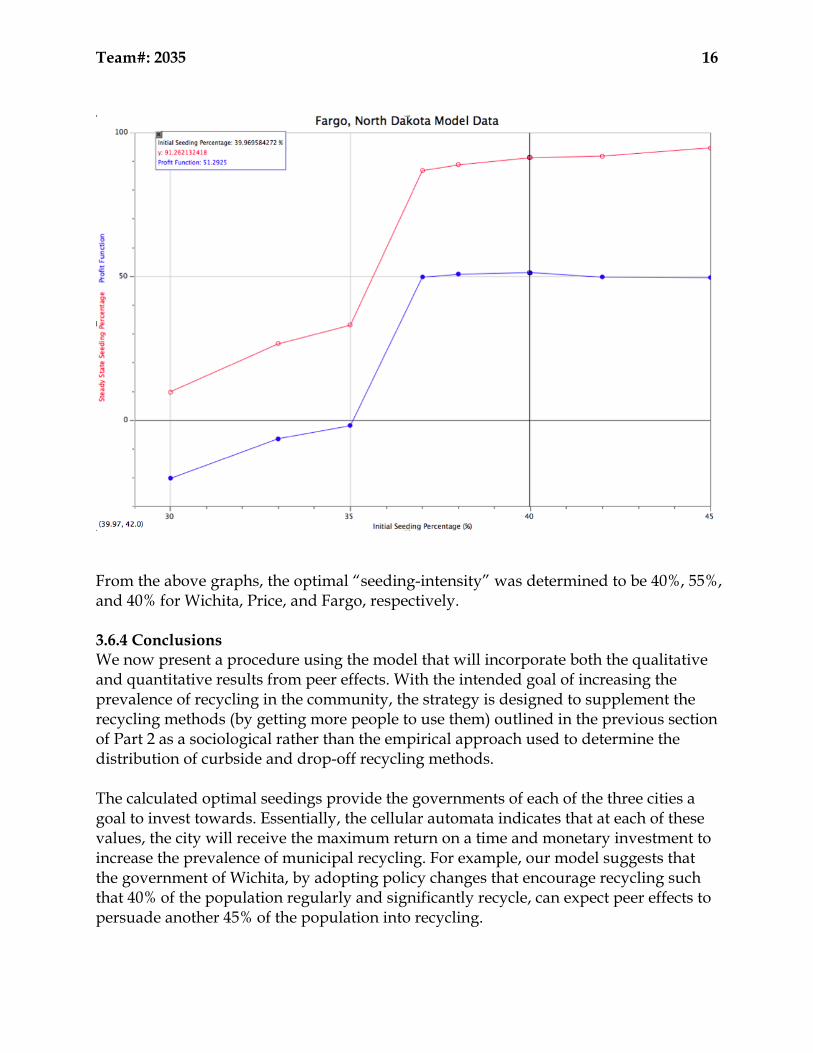
2. Determining the Optimal Initial Seed from Automata Data While public policy would like to increase the amount of steady-state recyclers, our data indicate that the seed initialization follows diminishing returns. In other words, adding more and more initial seeding (I) results in less and less additional increase in steady state (S). Thus, we can expect some point where adding initial seeding is ill-advised. Invoking that profit (P) is the difference between benefit and cost, we equate the profit function to be the difference of S and I:
→ .
The trials below demonstrate the S function (red), the profit function (blue), and the highlighted initial seeding percentage determined to be optimal (black text in box).

Team#: 2035 15
Team#: 2035 16
From the above graphs, the optimal “seeding-intensity” was determined to be 40%, 55%, and 40% for Wichita, Price, and Fargo, respectively. 3.6.4 Conclusions We now present a procedure using the model that will incorporate both the qualitative and quantitative results from peer effects. With the intended goal of increasing the prevalence of recycling in the community, the strategy is designed to supplement the recycling methods (by getting more people to use them) outlined in the previous section of Part 2 as a sociological rather than the empirical approach used to determine the distribution of curbside and drop-off recycling methods. The calculated optimal seedings provide the governments of each of the three cities a goal to invest towards. Essentially, the cellular automata indicates that at each of these values, the city will receive the maximum return on a time and monetary investment to increase the prevalence of municipal recycling. For example, our model suggests that the government of Wichita, by adopting policy changes that encourage recycling such that 40% of the population regularly and significantly recycle, can expect peer effects to persuade another 45% of the population into recycling.
Team#: 2035 17
This model thus presents a methodology to provide incentives to the population in order to ensure that additional recycling infrastructure is actually used by the public. For instance, a public opinion poll can have a question with policy changes of varying degree, and whichever policy change on the poll encourages the correct threshold percentage to adopt regular recycling can be implemented. Examples of these policy changes include tax cuts for the recycling, increase in the money award for recycling a plastic bottle, and more advertisements and public service announcements advocating for recycling. In addition to the aforementioned policy changes, the model suggests that the strengthening of peer effects improves the steady-state number of recyclers. The formation of the clusters (in the Results section) of recyclers means that many pro-recycling individuals will be subjected to pro-recycling peer effects. Ideally, we would rather have non-recyclers experience these peer effects so more will become recyclers. Thus, a local-scale approach should include, for example, placing recycling drop stations in regions without many recyclers and focusing public information programs on recycling in those areas. In conclusion, the use of a cellular automata provides a unique and essential insight into the sociology of recycling. Use of NetLogo allows us to visualize the emergent properties of thousands of individual decisions and mimic city layouts by importing map images into the program. However, the program was computationally intensive, and as a result, several of the previously mentioned assumptions and approximations were required. Thus, while the program performs well for small populations, such as that of Price, Utah, larger automata are difficult to compute using the model. The model also fails to take into account other influences, such as income, that affect whether recycling will be taken into account.
4. Part 3: National Recycling Method
Based on the model that we constructed on a local level and tested on specific cities, we have the following general national recycling guidelines to recommend:
● Recycling facilities can be created on a scale such that you can serve more than a single municipality [21]. Such facilities could serve perhaps as big as entire counties. This would allow the cost of building the facility to be spread between more cities and make recycling even more economically feasible.
● The size of modern recycling facilities is so large that they can easily accommodate the load from modest-sized cities. In situations such as these it is ideal to provide a curbside recycling service (and, as stated above, if a tax can be enacted for residents who don’t recycle, this is a clearly superior solution if seeking to maximize the amount of recyclables being recycled compared to cost) .
● For cities when the amount of recycling that can be collected by curbside practices exceeds the amount that can be processed the method should
Team#: 2035 18
temporarily be switched to drop-off point collection until more facilities can be built to process, and then the method should be switched back to curbside in order to recycle the most amount of materials and meet environmental goals.
● In cities where the percentage of people who are willing to recycle is smaller it is more important to provide curbside service so that materials get recycled.
● Recycling programs are easier to implement in cities which have the budget funds to support them. In light of the recession, it makes more sense to focus on those cities who have a sizable budget and create successful programs than try to target all cities even those who cannot afford processing centers, etc.
5. Strengths and Weaknesses
5.1 Strengths ● A strength of our plastic waste projection model is the strong fit of the logistic
function to the calculated data. Given future changes and fluctuations in data, the overall model should prove to be stable but still adjustable, as the existing data points all fit well to the curve while the function itself can be refitted easily.
● A strength of our model is that is it scales nicely to cities of all different populations and all different budget sizes.
● A strength of our model is that it could easily be adapted to include other methods of recycling and changes to current methods of recycling, including adjusting the efficiencies of plants, amount of waste produced, etc.
● Another strength of our model is that it incorporates peer-pressure effects within the community and the spread of ideas regarding recycling between households.
5.2 Weaknesses ● A weakness of the projection model is its lack of consideration of recycling
behavior changes. Though this was assumed to be negligible given the time span initially, an improvement on the model would be to consider the possibility of decreasing per-capita non-recycled waste and its effect on overall waste.
● A weakness of our model for local recycling methods is that it requires very specific and in depth information about a city in order to provide useful results. Collection such information for towns for which it does not already exist could be costly and take a long time.
● A weakness of our model is that it depends on very general data, for example, the amount of recyclables the average American produces a day. While the use of these values makes the model appropriate to apply to a variety of cities, it also means that the results that it returns for any one particular city are marginally less useful. However, this can be rectified when the model is applied in real life because more specific values might be avaliable for the city in question.
Team#: 2035 19
6. Future Work
It would be desirable to be able to offer a solution which maximizes a ratio similar to massofrecycledmaterial/cost. (We take the root of the mass of all recycled material
because it is less important than cost to most cities and policy makers. In addition, this function has the property of making the mass of recycled material become less significant as it increases with respect to the increase in cost—a naturally desired effect.) This is useful simply because a city may wish to be aware of some more desirable solution to recycling even if it exceeds their current budget or leaves a surplus if the ratio of recycled material to cost is maximized. Under our current model we have equations describing both of these values; however, our equations are coupled—that is, our equation for the mass of recycled materials depends upon n, the number of recycling facilities, and the cost of recycling also depends upon n in addition to the mass. Thus, it would be difficult or impossible to obtain an analytic solution to the stated problem, and numerical estimation methods may have to be used instead, using the fact that must be an integer. Our model does not account for multiple practices simultaneously being in place. How does the situation change if we allow residents in certain regions to use curbside recycling, while other, less strategically placed residents are required to drop off their recyclables at a facility personally? Along the same line of thought, if residents living in inopportune areas were to have access to some large collection bin for recyclables which was collected on a weekly basis by the recycling facility, interest in recycling could be boosted with a minimal increase in spending. Cost to residents is decreased majorly while cost to the city is increased marginally.
7. References
1. http://www.epa.gov/osw/nonhaz/municipal/pubs/msw_2010_rev_factsheet.pdf
2. http://www.epa.gov/osw/nonhaz/municipal/pubs/2010_MSW_Tables_and_Figures_508.pdf
3. http://www.multpl.com/united-states-population/
4. www.google.com/publicdata
5. http://www.wday.com/event/article/id/65597/
6. http://www.sunad.com/index.php?tier=1&article_id=18622
7. http://e360.yale.edu/feature/using_peer_pressure_as_a_tool__to_promote_greener_choices/2141/
8. http://www.cepr.org/meets/wkcn/6/6696/papers/BollingerGillingham_PeerEffectsSolar.pdf

Team#: 2035 20
9. Kansas 2005–2006 Official Transportation Map (http://www.ksdot.org/maps.asp)
10. http://www.kansas.com/2012/07/16/2409950/proposed-wichita-city-budget-includes.html
11. http://www.census.gov/prod/2/pop/p25/p25-1131.pdf 12. http://www.dep.state.pa.us/dep/deputate/airwaste/wm/recycle/document/
MRF_Susquehanna.pdf