facilities management - northwestern university...key performance indicators 2 slide # kpi...
TRANSCRIPT

Facilities Management
FM Key Performance Indicators
April 20, 2017
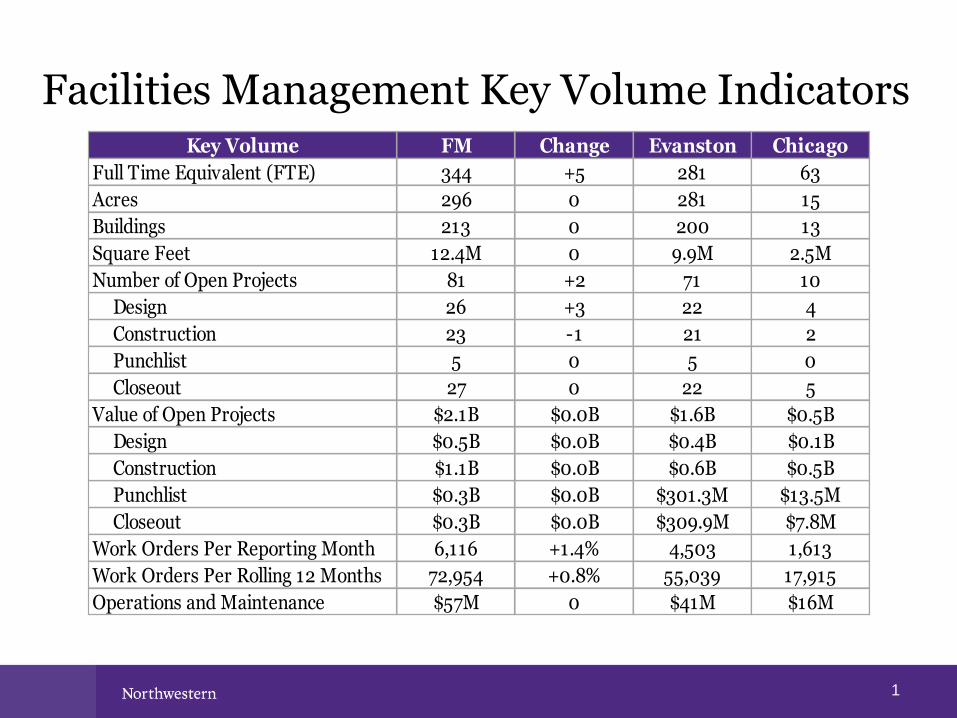
Facilities Management Key Volume Indicators
1
Key Volume FM Change Evanston Chicago
Full Time Equivalent (FTE) 344 +5 281 63
Acres 296 0 281 15
Buildings 213 0 200 13
Square Feet 12.4M 0 9.9M 2.5M
Number of Open Projects 81 +2 71 10
Design 26 +3 22 4
Construction 23 -1 21 2
Punchlist 5 0 5 0
Closeout 27 0 22 5
Value of Open Projects $2.1B $0.0B $1.6B $0.5B
Design $0.5B $0.0B $0.4B $0.1B
Construction $1.1B $0.0B $0.6B $0.5B
Punchlist $0.3B $0.0B $301.3M $13.5M
Closeout $0.3B $0.0B $309.9M $7.8M
Work Orders Per Reporting Month 6,116 +1.4% 4,503 1,613
Work Orders Per Rolling 12 Months 72,954 +0.8% 55,039 17,915
Operations and Maintenance $57M 0 $41M $16M

Key Performance Indicators
2
Slide # KPI Description Annual Goal Mar-17 Goal Actual Trend
3 SD1. Service Request Closure 85% 85% 78% -3%
4 SD2. Preventative Maintenance Closure 95% 95% 94% 3%
5 SD3. Rework <10% <10% 6% -6%
6 SD4. Proactivity: FM-Identified Work Orders 25% 25% 32% 0%
7 LO1. Common Space Program 5% 0.5% 1.3% 0.6%
8 LO2. Facilities Connect Implementation 100% 13% 13% 5%
9 LO3. Engagement: Sustainability Outreach 12% 1% -2% -1%
10 CE1. Energy Use Intensity (kBtu/SF) -5% -5% -1.0% 4%
11 CE2. Recordable Injury Incident Rate 5.60 6.18 3.98 -0.16
12 CE3. Injury-Related Lost Workday Rate 2.70 2.70 1.99 -0.38
13 CE4. Waste Diversion Rate 38% 38% 39% 7%
14 CE5. Overtime 10% 15% 12% 0%
15 CE6. Minority, Female and Local Business Enterprise Use 15% 15% 0% -13%
16 CE7. Evanston Resident Employment 5% 5% 2% 0%
17 F1. Capital Project Cash Flow Execution +/-2% +/-2% -7% 0%
18 F2. Operating Budget Execution +/-1% +/-1% -1% 0%
19 F3. Utility Commodity Budget Execution +/-5% +/-5% -1% 0%
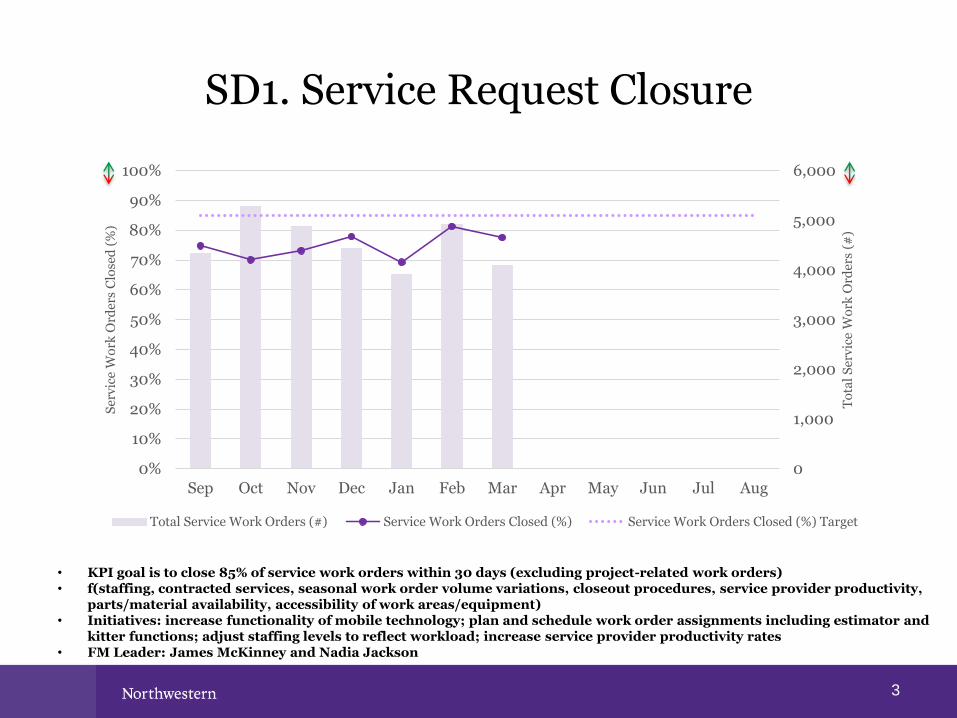
SD1. Service Request Closure
3
• KPI goal is to close 85% of service work orders within 30 days (excluding project-related work orders)• f(staffing, contracted services, seasonal work order volume variations, closeout procedures, service provider productivity,
parts/material availability, accessibility of work areas/equipment)• Initiatives: increase functionality of mobile technology; plan and schedule work order assignments including estimator and
kitter functions; adjust staffing levels to reflect workload; increase service provider productivity rates• FM Leader: James McKinney and Nadia Jackson
0
1,000
2,000
3,000
4,000
5,000
6,000
0%
10%
20%
30%
40%
50%
60%
70%
80%
90%
100%
Sep Oct Nov Dec Jan Feb Mar Apr May Jun Jul Aug
To
tal
Ser
vic
e W
ork
Ord
ers
(#)
Ser
vic
e W
ork
Ord
ers
Clo
sed
(%
)
Total Service Work Orders (#) Service Work Orders Closed (%) Service Work Orders Closed (%) Target
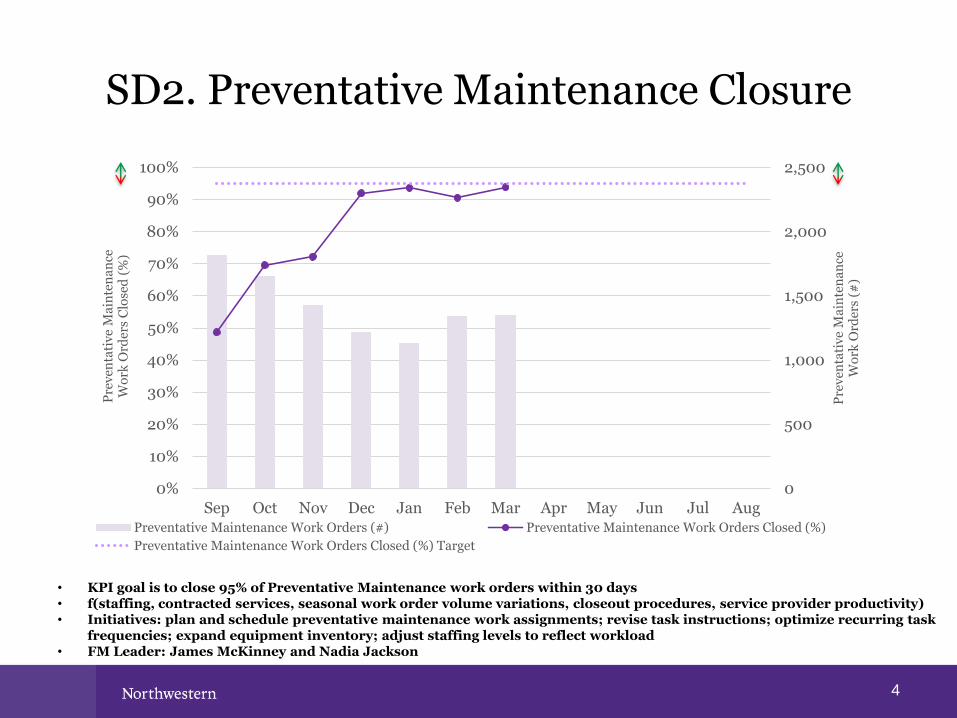
SD2. Preventative Maintenance Closure
4
0
500
1,000
1,500
2,000
2,500
0%
10%
20%
30%
40%
50%
60%
70%
80%
90%
100%
Sep Oct Nov Dec Jan Feb Mar Apr May Jun Jul Aug
Pre
ven
tati
ve
Ma
inte
na
nce
W
ork
Ord
ers
(#)
Pre
ven
tati
ve
Ma
inte
na
nce
W
ork
Ord
ers
Clo
sed
(%
)
Preventative Maintenance Work Orders (#) Preventative Maintenance Work Orders Closed (%)
Preventative Maintenance Work Orders Closed (%) Target
• KPI goal is to close 95% of Preventative Maintenance work orders within 30 days• f(staffing, contracted services, seasonal work order volume variations, closeout procedures, service provider productivity)• Initiatives: plan and schedule preventative maintenance work assignments; revise task instructions; optimize recurring task
frequencies; expand equipment inventory; adjust staffing levels to reflect workload• FM Leader: James McKinney and Nadia Jackson
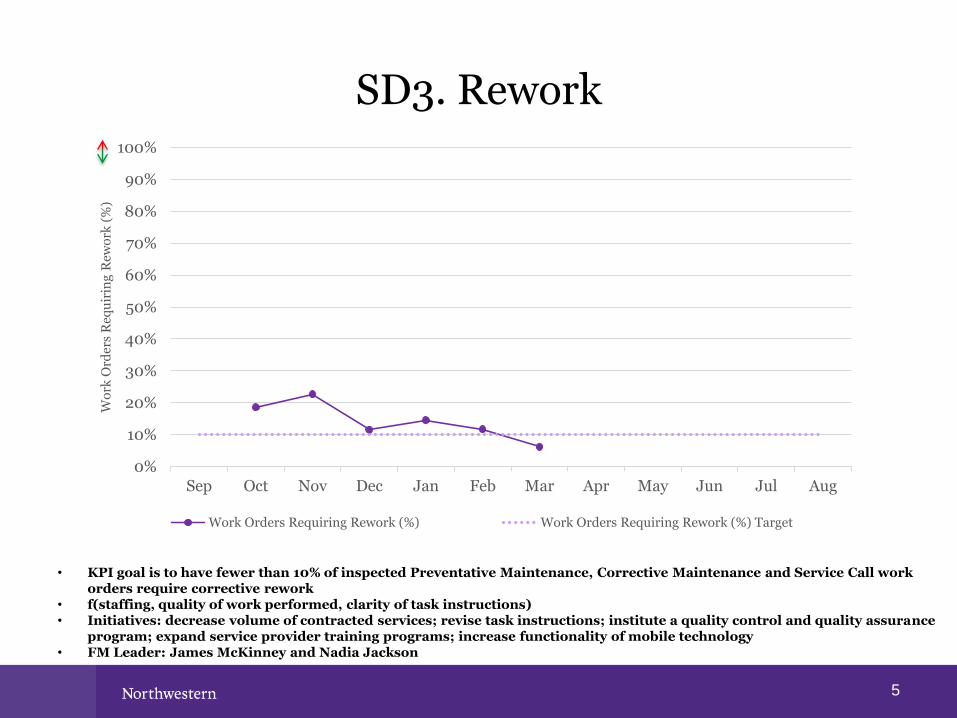
SD3. Rework
5
• KPI goal is to have fewer than 10% of inspected Preventative Maintenance, Corrective Maintenance and Service Call work orders require corrective rework
• f(staffing, quality of work performed, clarity of task instructions)• Initiatives: decrease volume of contracted services; revise task instructions; institute a quality control and quality assurance
program; expand service provider training programs; increase functionality of mobile technology• FM Leader: James McKinney and Nadia Jackson
0%
10%
20%
30%
40%
50%
60%
70%
80%
90%
100%
Sep Oct Nov Dec Jan Feb Mar Apr May Jun Jul Aug
Wo
rk O
rder
s R
equ
irin
g R
ewo
rk (
%)
Work Orders Requiring Rework (%) Work Orders Requiring Rework (%) Target
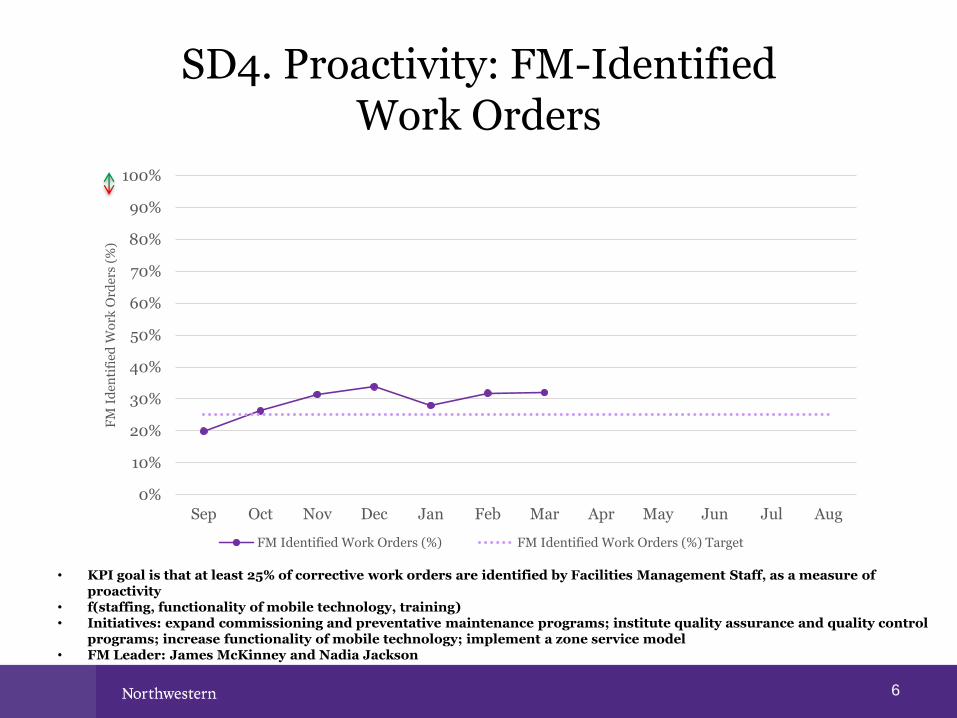
SD4. Proactivity: FM-Identified Work Orders
6
• KPI goal is that at least 25% of corrective work orders are identified by Facilities Management Staff, as a measure of proactivity
• f(staffing, functionality of mobile technology, training)• Initiatives: expand commissioning and preventative maintenance programs; institute quality assurance and quality control
programs; increase functionality of mobile technology; implement a zone service model• FM Leader: James McKinney and Nadia Jackson
0%
10%
20%
30%
40%
50%
60%
70%
80%
90%
100%
Sep Oct Nov Dec Jan Feb Mar Apr May Jun Jul Aug
FM
Id
enti
fied
Wo
rk O
rder
s (%
)
FM Identified Work Orders (%) FM Identified Work Orders (%) Target
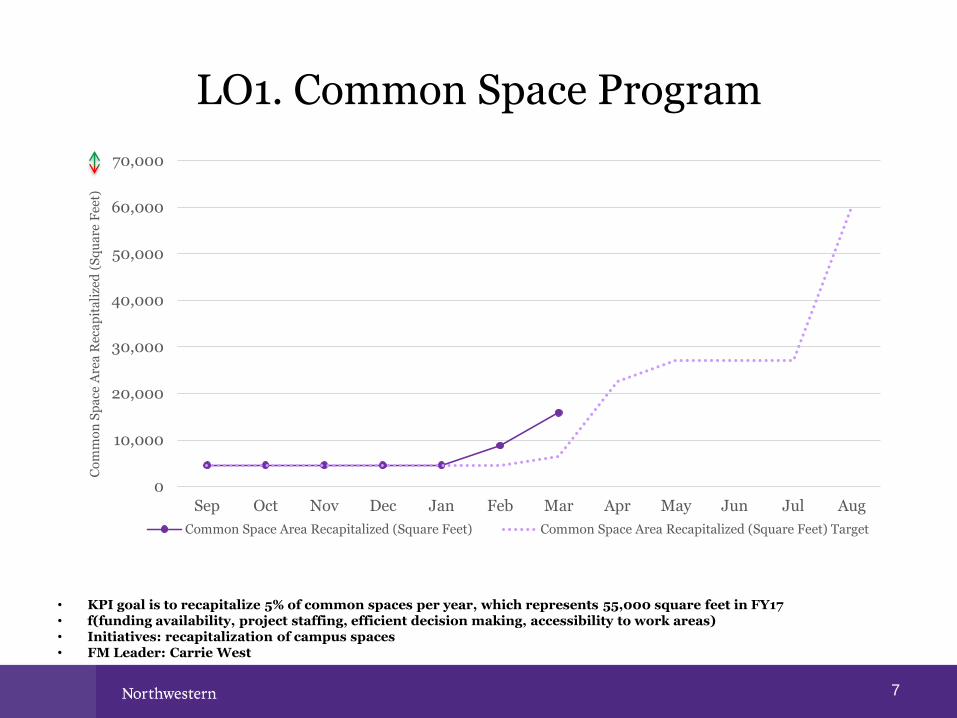
LO1. Common Space Program
7
Sep Oct Nov Dec Jan Feb Mar Apr May Jun Jul Aug0
10,000
20,000
30,000
40,000
50,000
60,000
70,000
Common Space Area Recapitalized (Square Feet) Common Space Area Recapitalized (Square Feet) Target
• KPI goal is to recapitalize 5% of common spaces per year, which represents 55,000 square feet in FY17• f(funding availability, project staffing, efficient decision making, accessibility to work areas) • Initiatives: recapitalization of campus spaces• FM Leader: Carrie West
Co
mm
on
Sp
ace
Are
a R
eca
pit
ali
zed
(S
qu
are
Fee
t)

LO2. Facilities Connect Implementation
8
0%
10%
20%
30%
40%
50%
60%
70%
80%
90%
100%S
ep-1
6
Oct
-16
No
v-1
6
Dec
-16
Ja
n-1
7
Feb
-17
Ma
r-17
Ap
r-17
Ma
y-1
7
Ju
n-1
7
Ju
l-17
Au
g-1
7
Sep
-17
Oct
-17
No
v-1
7
Dec
-17
Ja
n-1
8
Feb
-18
Ma
r-18
Ap
r-18
Ma
y-1
8
Ju
n-1
8
Ju
l-18
Au
g-1
8
Sep
-18
Oct
-18
No
v-1
8
Dec
-18
Imp
lem
enta
tio
n C
om
ple
tio
n (
%)
Implementation Completion (%) Implementation Completion (%) Target
• KPI goal is to complete 100% of project milestones • f(stakeholder engagement, staffing, business process, IT capabilities, communication, effective decision making)• Initiatives: implement new integrated workplace management software; develop and implement process improvement;
utilize effective project management methodology • FM Leader: Liz Schaps
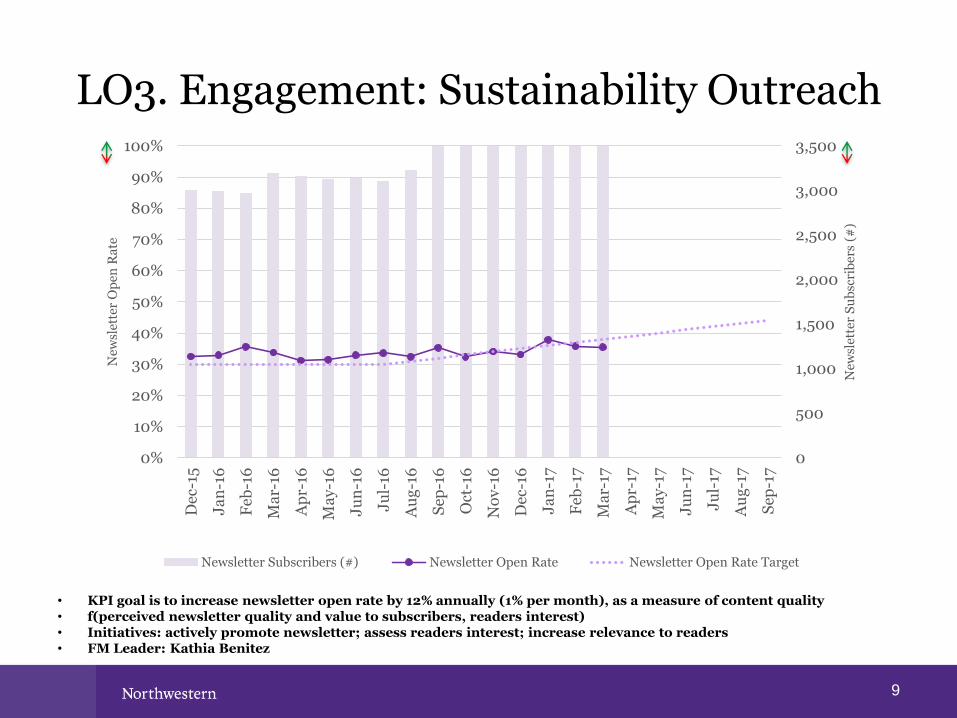
LO3. Engagement: Sustainability Outreach
9
• KPI goal is to increase newsletter open rate by 12% annually (1% per month), as a measure of content quality • f(perceived newsletter quality and value to subscribers, readers interest)• Initiatives: actively promote newsletter; assess readers interest; increase relevance to readers• FM Leader: Kathia Benitez
0
500
1,000
1,500
2,000
2,500
3,000
3,500
0%
10%
20%
30%
40%
50%
60%
70%
80%
90%
100%
Dec
-15
Ja
n-1
6
Feb
-16
Ma
r-16
Ap
r-16
Ma
y-1
6
Ju
n-1
6
Ju
l-16
Au
g-1
6
Sep
-16
Oct
-16
No
v-1
6
Dec
-16
Ja
n-1
7
Feb
-17
Ma
r-17
Ap
r-17
Ma
y-1
7
Ju
n-1
7
Ju
l-17
Au
g-1
7
Sep
-17
New
slet
ter
Su
bsc
rib
ers
(#)
New
slet
ter
Op
en R
ate
Newsletter Subscribers (#) Newsletter Open Rate Newsletter Open Rate Target
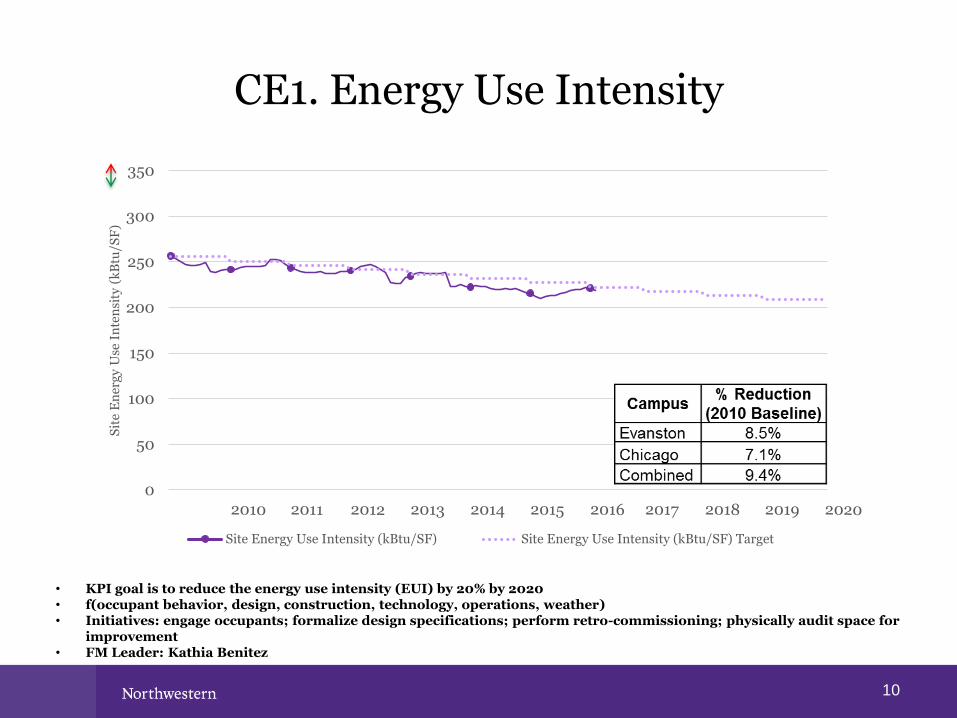
CE1. Energy Use Intensity
10
• KPI goal is to reduce the energy use intensity (EUI) by 20% by 2020 • f(occupant behavior, design, construction, technology, operations, weather)• Initiatives: engage occupants; formalize design specifications; perform retro-commissioning; physically audit space for
improvement• FM Leader: Kathia Benitez
0
50
100
150
200
250
300
350
Sit
e E
ner
gy
Use
In
ten
sity
(k
Btu
/SF
)
Site Energy Use Intensity (kBtu/SF) Site Energy Use Intensity (kBtu/SF) Target
CE2. Recordable Injury Incident Rate
11
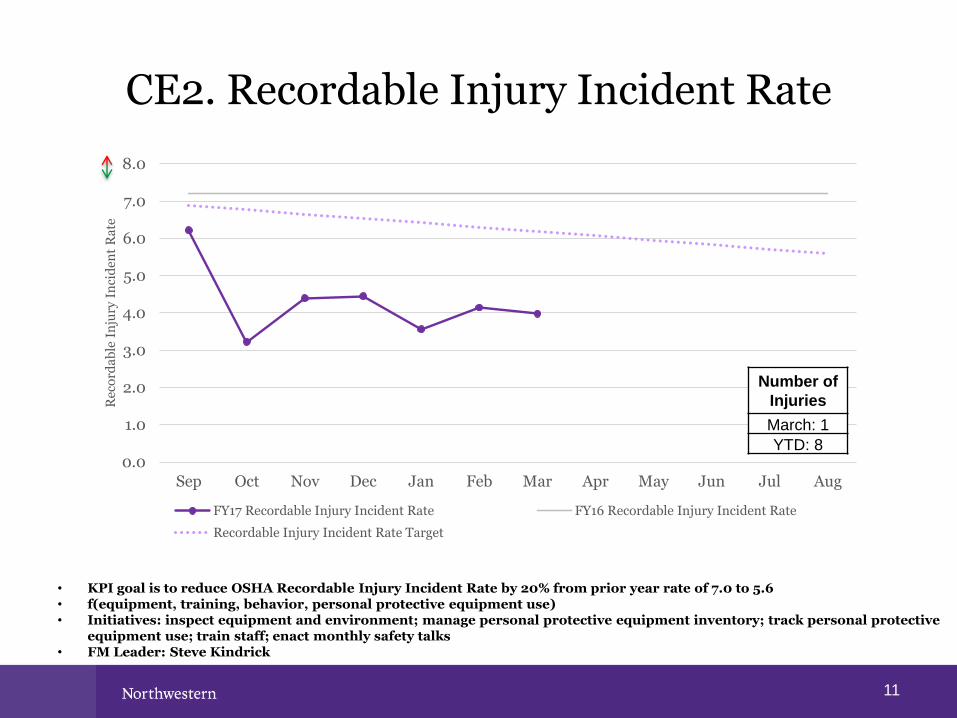
• KPI goal is to reduce OSHA Recordable Injury Incident Rate by 20% from prior year rate of 7.0 to 5.6• f(equipment, training, behavior, personal protective equipment use)• Initiatives: inspect equipment and environment; manage personal protective equipment inventory; track personal protective
equipment use; train staff; enact monthly safety talks • FM Leader: Steve Kindrick
0.0
1.0
2.0
3.0
4.0
5.0
6.0
7.0
8.0
Sep Oct Nov Dec Jan Feb Mar Apr May Jun Jul Aug
Rec
ord
ab
le I
nju
ry I
nci
den
t R
ate
FY17 Recordable Injury Incident Rate FY16 Recordable Injury Incident Rate
Recordable Injury Incident Rate Target
Number of
Injuries
March: 1
YTD: 8
CE3. Injury-Related Lost Workday Rate
12
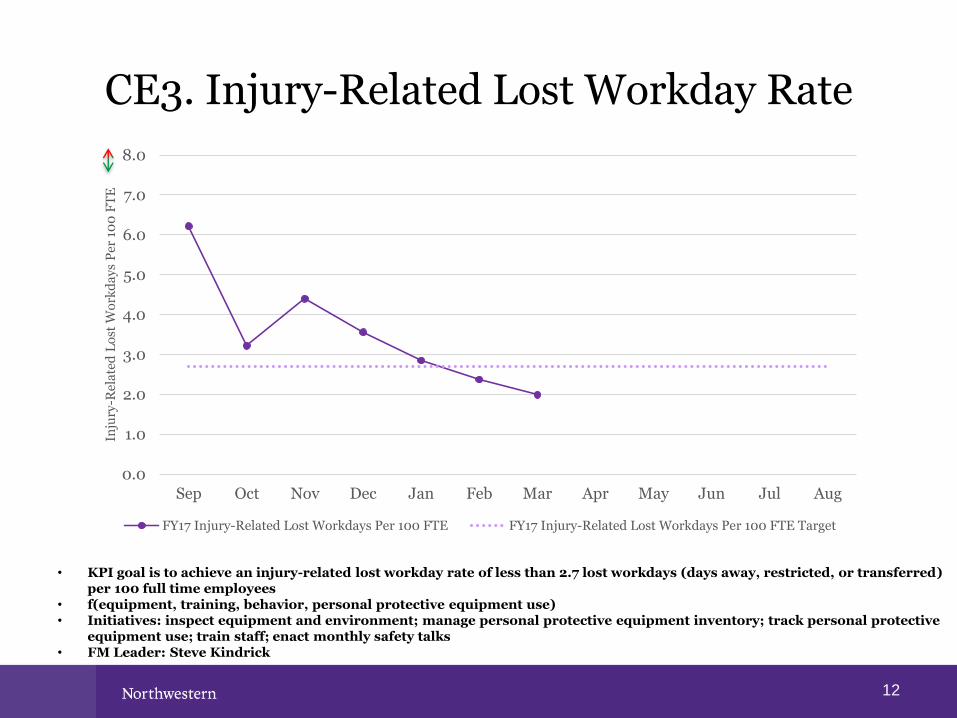
• KPI goal is to achieve an injury-related lost workday rate of less than 2.7 lost workdays (days away, restricted, or transferred) per 100 full time employees
• f(equipment, training, behavior, personal protective equipment use)• Initiatives: inspect equipment and environment; manage personal protective equipment inventory; track personal protective
equipment use; train staff; enact monthly safety talks • FM Leader: Steve Kindrick
0.0
1.0
2.0
3.0
4.0
5.0
6.0
7.0
8.0
Sep Oct Nov Dec Jan Feb Mar Apr May Jun Jul Aug
Inju
ry-R
ela
ted
Lo
st W
ork
da
ys
Per
10
0 F
TE
FY17 Injury-Related Lost Workdays Per 100 FTE FY17 Injury-Related Lost Workdays Per 100 FTE Target
CE4. Waste Diversion Rate
13
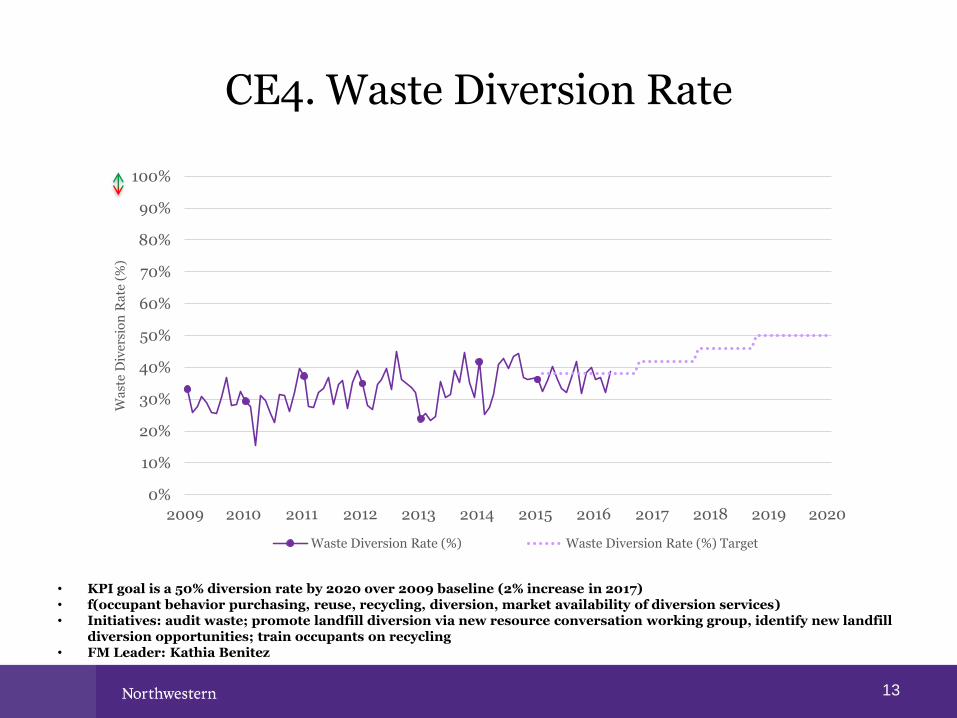
• KPI goal is a 50% diversion rate by 2020 over 2009 baseline (2% increase in 2017)• f(occupant behavior purchasing, reuse, recycling, diversion, market availability of diversion services)• Initiatives: audit waste; promote landfill diversion via new resource conversation working group, identify new landfill
diversion opportunities; train occupants on recycling • FM Leader: Kathia Benitez
0%
10%
20%
30%
40%
50%
60%
70%
80%
90%
100%
Wa
ste
Div
ersi
on
Ra
te (
%)
Waste Diversion Rate (%) Waste Diversion Rate (%) Target
CE5. Overtime
14
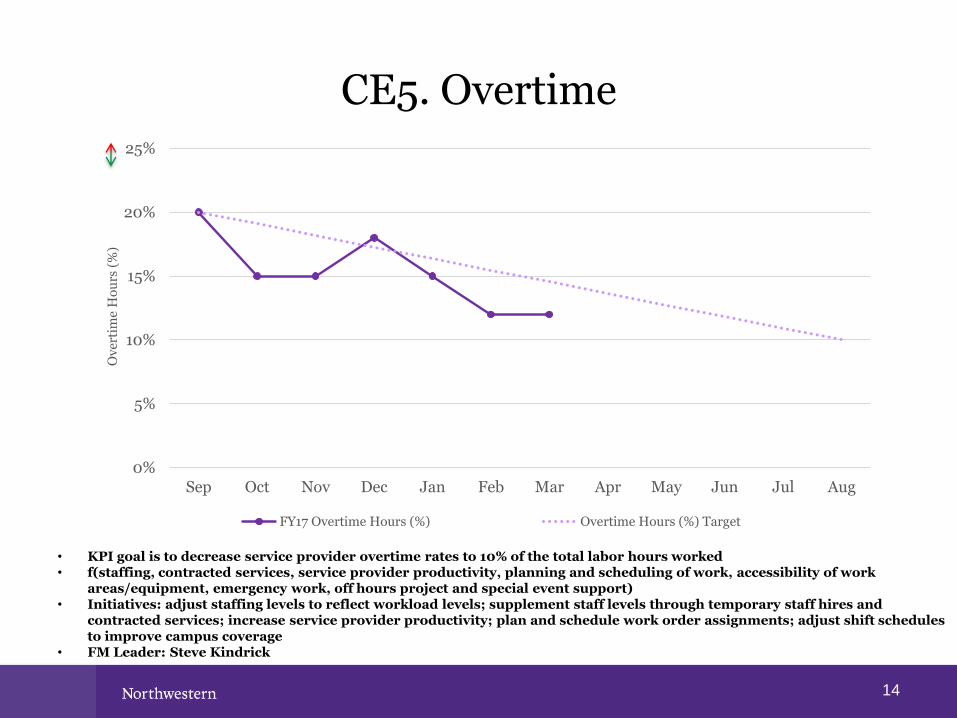
• KPI goal is to decrease service provider overtime rates to 10% of the total labor hours worked• f(staffing, contracted services, service provider productivity, planning and scheduling of work, accessibility of work
areas/equipment, emergency work, off hours project and special event support)• Initiatives: adjust staffing levels to reflect workload levels; supplement staff levels through temporary staff hires and
contracted services; increase service provider productivity; plan and schedule work order assignments; adjust shift schedulesto improve campus coverage
• FM Leader: Steve Kindrick
0%
5%
10%
15%
20%
25%
Sep Oct Nov Dec Jan Feb Mar Apr May Jun Jul Aug
Ov
erti
me
Ho
urs
(%
)
FY17 Overtime Hours (%) Overtime Hours (%) Target
CE6. Minority, Female and Local Business Enterprise Use
15
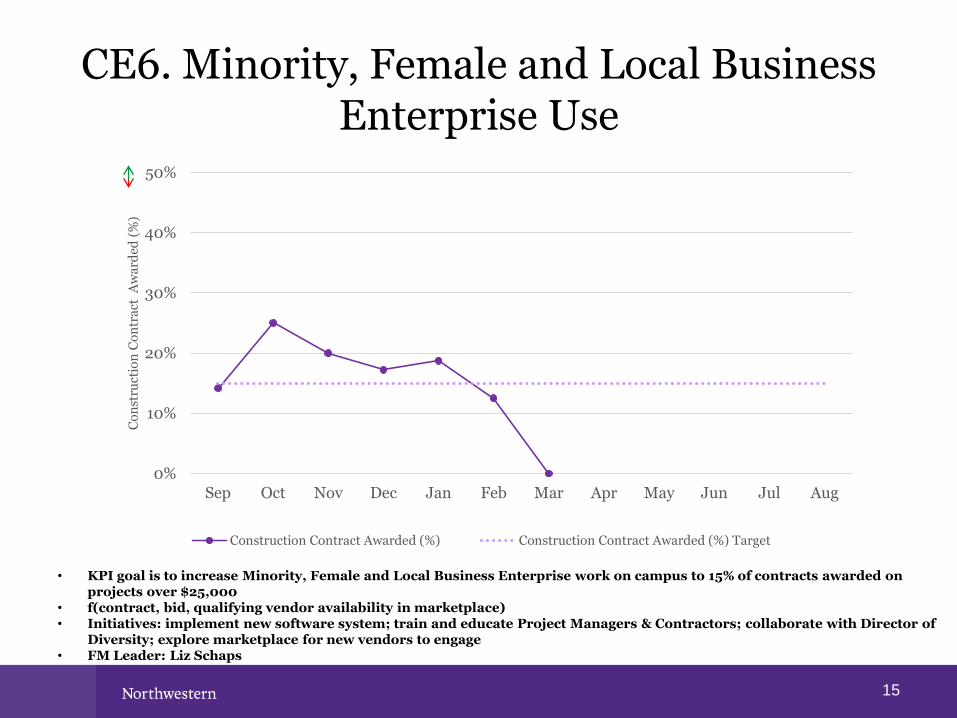
• KPI goal is to increase Minority, Female and Local Business Enterprise work on campus to 15% of contracts awarded on projects over $25,000
• f(contract, bid, qualifying vendor availability in marketplace)• Initiatives: implement new software system; train and educate Project Managers & Contractors; collaborate with Director of
Diversity; explore marketplace for new vendors to engage• FM Leader: Liz Schaps
0%
10%
20%
30%
40%
50%
Sep Oct Nov Dec Jan Feb Mar Apr May Jun Jul Aug
Co
nst
ruct
ion
Co
ntr
act
Aw
ard
ed (
%)
Construction Contract Awarded (%) Construction Contract Awarded (%) Target

CE7. Evanston Resident Employment
16
0%
3%
5%
8%
10%
13%
15%
Sep Oct Nov Dec Jan Feb Mar Apr May Jun Jul Aug
Ev
an
sto
n
Res
iden
t L
ab
or
Ho
urs
(%
)
Evanston Resident Labor Hours (%) Evanston Resident Labor Hours (%) Target
• KPI goal is 5% of total construction labor hours on qualifying campus projects greater than $1,000,000• f(project qualification, labor market, demand for labor hours, City of Evanston partnership, qualifying Contractor
participation)• Initiatives: implement new software system; train and educate Project Managers & Contractors; collaborate with Director of
Diversity• FM Leader: Liz Schaps

F1. Capital Project Cash Flow Execution
17
$0
$100
$200
$300
$400
$500
$600
$700
Sep Oct Nov Dec Jan Feb Mar Apr May Jun Jul Aug
FY
17 C
um
ula
tiv
e C
ash
Flo
w (
Mil
lio
ns)
FY17 Cumulative Cash Flow FY17 Projected Cash Flow Plan
• KPI goal is to spend capital at a rate of +/-2% of committed capital cash flow plan• f(timely contractor invoicing, unforeseen project conditions, accurate budgeting, scope changes, weather, institutional
prioritization, accessibility to work areas/equipment)• Initiatives: develop and implement process improvement; improve accuracy of cash flow plan; drive timely contractor
invoicing; improve reporting; establish and execute project manager cash flow plan• FM Leader: Liz Schaps
F2. Operating Budget Execution
18
$0
$10
$20
$30
$40
$50
$60
Sep Oct Nov Dec Jan Feb Mar Apr May Jun Jul Aug
FY
17 C
um
ula
tiv
e O
per
ati
ng
Bu
dg
et (
Mil
lio
ns)
FY17 Cumulative Operating Budget FY17 Operating Budget
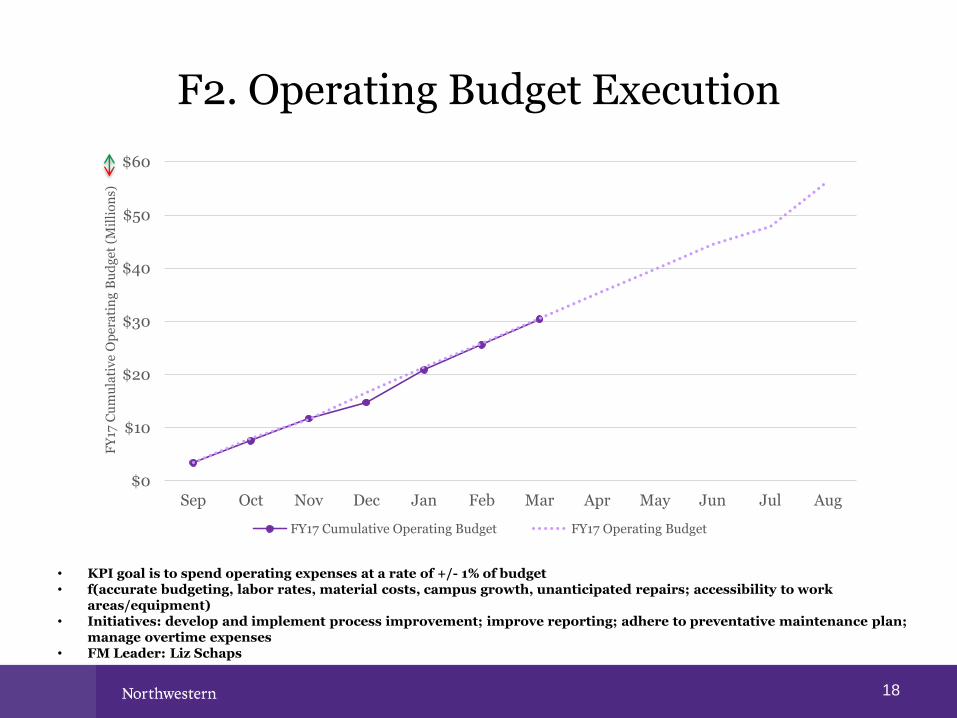
• KPI goal is to spend operating expenses at a rate of +/- 1% of budget • f(accurate budgeting, labor rates, material costs, campus growth, unanticipated repairs; accessibility to work
areas/equipment)• Initiatives: develop and implement process improvement; improve reporting; adhere to preventative maintenance plan;
manage overtime expenses• FM Leader: Liz Schaps

F3. Utility Commodity Budget Execution
19
$0
$5
$10
$15
$20
$25
$30
$35
$40
Sep Oct Nov Dec Jan Feb Mar Apr May Jun Jul Aug
FY
17 C
um
ula
tiv
e U
tili
ty C
om
mo
dit
yB
ud
get
(M
illi
on
s)
FY17 Cumulative Utility Commodity Budget FY17 Utility Commodity Budget
• KPI goal is to manage utility commodity expenses at a rate of +/- 5% of budget • f(accurate budgeting, utility commodity costs, campus growth, usage)• Initiatives: adhere to sourcing strategy; improve reporting• FM Leader: Liz Schaps